Modelling Long-Term Durability Performance of Cementitious ...

THESIS FOR THE DEGREE OF DOCTOR OF PHILOSOPHY
Durability of Cementitious Materials in Long-Term Contact with Water
AREZOU BABAAHMADI
Department of Civil and Environmental Engineering
CHALMERS UNIVERSITY OF TECHNOLOGY
Gothenburg, Sweden 2015

Durability of Cementitious Materials in Long-Term Contact with Water
ISBN 978-91-7597-155-1
© AREZOU BABAAHMADI
Doktorsavahandlingar vid Chalmers tekniska högskola
Ny serie nr 3836
ISSN 0346-718X
Department of Civil and Environmental Engineering
Chalmers University of Technology
SE-412 96 Gothenburg, Sweden
Telephone: + 46 (0)31-772 1000
Cover:
The Calcium Leaching Process: Decalcification of Cementitious Materials
Printed at Chalmers Reproservice AB
Gothenburg, Sweden 2015

TO THE MAN WHO WAS NOT ONLY MY FATHER, BUT A SYMBOL OF STABILITY THROUGH MY LIFE
AND TO THE WOMAN WHO WAS NOT ONLY MY MOTHER, BUT A TRUE ROLE MODEL OF PATIENCE AND UNCONDITIONAL LOVE
TO THEM I OWE MY HAPPINESS


I
ABSTRACT
Nuclear electricity is considered to be an alternative energy production solution for the
power industry in many countries. To ensure the sustainability of this energy solution, the
disposal of the produced waste is one of the biggest issues facing nuclear electricity
industries. Deep geological disposal of waste with multi-layered engineered barriers has
been shown to be one of the safest solutions. However, degradation induced in barrier
material by long-term contact with water during the required operational life time of the
repository should be accounted for in safety assessments. Cementitious materials are
considered to be one of the most efficient alternative barrier materials, providing high pH
buffering capacity, good mechanical properties and low diffusivity. The major degradation
scenario to consider for these barriers is the dissolution of calcium-containing phases and
the eventual leaching of calcium. Decalcification occurs due to the low concentration of
calcium ions in the groundwater that comes in long-term contact with the barriers. To
facilitate long-term durability predictions, acceleration methods that enhance the calcium
leaching process from cementitious materials are needed. However, experimental studies of
the natural leaching process under long-term degradation are hampered by the tedious and
complicated process of manufacturing large enough decalcified specimens with a
composition and pore structure that corresponds to that of concrete leached under natural
leaching conditions. In this study, a new acceleration test method for cementitious
specimens of flexible size is developed. The electrochemical migration method facilitating
both the dissolution and transport of calcium ions provides a higher acceleration rate than
other available methods. With application of a current density of 125-130 A/m2 for 53 days
a depletion depth of 75 mm is obtained. The dissolution front, comparable to a natural
leaching process, corresponds to the complete leaching of Portlandite, with a certain degree
of phase changes in calcium silicate hydrates. The changes in the pore structure, adsorption,
ionic diffusion, mechanical strength, elastic modulus, permeability and frost resistance of
Ca-depleted concrete, mortar and paste specimens are demonstrated. The results indicate
that a considerable increase in pore volume and specific surface area can be expected due to
the complete leaching of the Portlandite. This coincides with up to 70% decrease in
mechanical strength, more than 40% decrease in elastic modulus and a significant increase
in the adsorption capacity and ionic diffusion rates of the leached specimens.

II

III
CONTENTS
ABSTRACT I
1 INTRODUCTION 1
1.1 Nuclear power and waste management 1
1.2 Cementitious barriers 3
1.3 SKB 4
1.4 Initiation of the project: goals and limitations 6
2 DEGRADATION OF CEMENTITIOUS BARRIERS 9
2.1 Cement and cement hydration 9
2.2 Degradation scenarios 11
2.2.1 Chloride ingress 11
2.2.2 Carbonation 12
2.2.3 Sulfate attack 13
2.2.4 Leaching of calcium 13
2.3 Experimental simulation of decalcification process 14
2.3.1 Accelerated calcium leaching test methods 16
2.3.2 Reported properties of decalcified cementitious materials 19
2.3.3 Complications and gaps in knowledge 20
3 METHODS AND EXPERIMENTAL DETAILS 21
3.1 Specimen preparation 21
3.2 Electrochemical acceleration method 23
3.2.1 Set-up design 24

IV
3.2.2 Experimental time 31
3.2.3 Calcium migration rate 32
3.3 Characterization methods 34
3.3.1 Chemical and mineralogical analysis 35
3.3.2 Analysis of physical properties 37
3.3.3 Assessment of transport properties 38
3.3.4 Measurement of mechanical properties 40
3.4 Reference leaching test methods 42
3.4.1 Natural immersion test 42
3.4.2 Flash column test 42
3.4.3 pH stat test 43
3.4.4 Application of concentrated ammonium nitrate solution 44
4 RESULTS AND DISCUSSIONS 47
4.1 Chemical and mineralogical properties of leached specimens 48
4.2 Physical properties of leached specimens 51
4.2.1 Pore structure and specific surface area 51
4.2.2 Freezable water 55
4.3 Transport properties of leached specimens 57
4.3.1 Adsorption and diffusion 57
4.3.2 Gas permeability and capillary water absorption 60
4.4 Mechanical properties of leached specimens 61
4.5 Comparability of leached specimens with degraded specimens leached with
reference leaching methods 64
5 CONCLUSIONS 69

V
6 FUTURE WORK 73
7 APPENDIX: RECOMMENDED MANUAL FOR ELECTROCHEMICAL
MIGRATION TEST METHOD 75
7.1 Scope 75
7.2 Apparatus 75
7.3 Test preparation 76
7.4 Test procedure 77
7.5 Recharging reagents 79
8 BIBLIOGRAPHY 81

VI

VII
Acknowledgments
I would like to express my appreciation to my supervisors; Professor Tang Luping and
Associate Professor Zareen Abbas, for believing in me and for providing me with their
experience and answering my endless flow of questions.
My sincerest gratitude goes to the late Professor Gunnar Gustafson who introduced me to
this project. May he rest in peace and his memory remain with us.
I also wish to thank Dr. Per Mårtensson at SKB and Dr. Peter Cronstrand for their
constructive comments and suggestions during this work.
I am very grateful to Marek Machowski who always supported me in the lab no matter
how busy he was. I am also very thankful to Dr. Helen Johnsson, for all constructive help
and advices she gave me. I would also like to thank Dr. Paula Wahlgren, head of the
division at Building Technology. I would like to express my gratitude to her specifically
for the confidence she gave me in my journey to learn Swedish. My gratitude goes to my
colleagues and friends Emma Qingnan Zhang, Vahid Nik and Nelson Silva. This journey
would have been impossible without all the great moments I shared with them. All my co-
workers and colleagues at the Division of Building Technology are also greatly appreciated
for their friendship and all their support.
Special thanks extend to Doctor Katja Fridh at Lund institute of Technology, for her help
in frost experiment, Doctor Liu Wei and Liu Jun at Shenzhen University for their help in
pore structure measurement.
I am grateful to Mehdi Arjmand not only for the happiness he is in my life, but for the
inspiration he is to every PhD student. And last but not least, I would like to thank my
parents and my brother for all their love and support during these years of being far from
home and my grandmother whose prayers I have always felt with me.
AREZOU BABAAHMADI
Gothenburg, February 2015

VIII

IX
ABBREVIATIONS AND NOTATIONS
BET Brunauer-Emmett-Teller
BJH Barrett-Joyner-Halenda
C CaO
C2S Dicalcium Silicate
C3A Tricalcium Aluminate
C3S Tricalcium Silicate
C4AF Tetracalcium Aluminoferrite
CH Portlandite
CSH Calcium silicate hydrates
DSC Differential Scanning Calorimetric
EDAX Energy dispersive X-Ray spectroscopy
EDX Energy Dispersive X-ray
Ettringite Calcium Trisulphato Aluminate Hydrate
HCP hydrated cement paste
IC Ion Chromatography
LA-ICP-MS Laser Ablation-Inductive Coupled Plasma-Mass Spectrometry
NMR Nuclear Magnetic Resonance spectroscopy
S SiO2
SEM Scanning Electron Microscopy
SFL The final repository for long-lived radioactive waste
SFR The final repository for short- lived radioactive waste
SKB The Swedish nuclear fuel and waste management company
TGA Thermogravimetric Analysis
XRD X-Ray Diffraction

X
XRF X-Ray Fluorescence spectroscopy
LVDT Linear Variable Differential Transformers
A Cross-sectional area
c concentartion
D Diffusion coefficient
F Faraday number (C/mol)
I Current (A)
i van 't Hoff factor
L Exposed thickness
m Mass of substance (g)
M Molar weight of substance (g/mol)
M Molarity
n number of dissociated ions
R Gas constant (J K-1 mol-1)
S Surface area in contact with leachate
T Absolute Temperature
t time (seconds)
u ion mobility
V Sample volume
z Valance number of the charged substance
α degree of dissolution
∆Q increase in the specific ions
υm velocity of the charged substance
φ Porosity
Ψ Electrical potential

XI
PREFACE
The project entitled “Ageing of Cementitious Materials for Storage of Nuclear Waste” was
founded by Swedish Nuclear Fuel and Waste Management Company (SKB) and began in
August 2010. This work has been carried out at the division of Building Technology,
Department of Civil and Environmental Engineering, Chalmers University of Technology.
This thesis is based on the following publications, which are referred to in the text by
Roman numerals and are attached to this thesis.
PAPER I. A. Babaahmadi, L. Tang, Z. Abbas, Electrochemical Migration Technique to
Accelerate Ageing of Cementitious Materials, in: EPJ Web of Conferences, EDP
Sciences, 2013, pp. 04002. doi: 10.1051/epjconf/20135604002.
PAPER II. A. Babaahmadi, L. Tang, Z. Abbas, T. Zack, P. Mårtensson, Development of an
Electro-Chemical Accelerated Ageing Method for Leaching of Calcium from
Cementitious Materials, Materials and Structures, (2015). doi: 10.1617/s11527-
015-0531-8.
PAPER III. A. Babaahmadi, L. Tang, Z. Abbas, Ageing Process of Cementitious Materials: Ion
Transport and Diffusion Coefficient, in: 3rd International Conference on Concrete
Repair, Rehabilitation and Retrofitting, ICCRRR, Cape Town, South Africa, 2012,
pp. 369-374. ISBN/ISSN: 978-041589952-9.
PAPER IV. A. Babaahmadi, L. Tang and Z. Abbas, Mineralogical, Physical and Chemical
Characterization of Cementitious Materials Subjected to Accelerated
Decalcification by an Electro-Chemical Method. The Nordic Concrete Federation.
1/2014. Publication No. 49. pp. 181-198.
PAPER V. A. Babaahmadi, L. Tang, Z. Abbas and P. Mårtensson, Physical and Mechanical
Properties of Cementitious Specimens Exposed to an Electrochemical Derived
Accelerated Leaching of Calcium. Submitted to International Journal of Concrete
Structures and Materials, (2014).

XII
PAPER VI. A. Babaahmadi, L. Tang, Z. Abbas and P. Mårtensson, Long-Term Changes in
Physical, Mechanical and Transport Properties of Cementitious Materials Utilized
in Nuclear waste Repositories. Submitted to Materials and Structures, (2015).
OTHER RELEVANT PUBLICATIONS BY AUTHOR
i. A. Babaahmadi, L. Tang and Z, Abbas, Physical and Chemical Properties of
Cementitious Materials Undergoing Accelerated Decalcification, in: 13th
International Conference on Durability of Building Materials and Components, Sao
Paulo, Brazil, September 2014.
ii. A. Babaahmadi, L. Tang and Z, Abbas, Chloride Penetration Resistance of Calcium
Depleted Concrete Specimens, in: 22nd Nordic Concrete Research Symposium,
Reykjavik, Iceland, August 2014, p. 487-490.
iii. A. Babaahmadi, L. Tang and Z, Abbas, Properties of Calcium Depleted Hydrated
Cement Paste: Mineralogical Characterization and Cesium Adsorption, in: 2nd
International Symposium on Cement Based Materials for Nuclear Waste, Avignon,
France, June 2014.
iv. A. Babaahmadi, L. Tang and Z. Abbas, a Study of the Accelerated Ageing Process
of Cementitious Materials, in: Advances in Construction Materials through Science
and Engineering, Hong Kong, September 2011. RILEM PRO 79 pp. 93.
v. A. Babaahmadi, L. Tang, Z. Abbas and G. Gustafson, Ageing of Cementitious
Materials for Storage of Nuclear Waste, in: 21st Nordic Concrete Research
Symposium, Hameelinna, Finland, 2011. Publication No. 43 pp. 429-432.
vi. P. Cronstrand, A. Babaahmadi, L. Tang and Z. Abbas, Electrochemical Leaching of
Cementitious Materials: an Experimental and Theoretical Study, in: 1st
International Symposium on Cement-Based Materials for Nuclear Wastes, 2011.
Session 3 (Paper No. O344) pp. 15.
1
1 Introduction
This chapter provides a background knowledge regarding the importance of the nuclear
power industry in many countries as an alternative energy production solution.
Consequently, the problems facing the authorities of these countries in managing the
disposal of nuclear waste in a sustainable manner are addressed. Accordingly, the
assessment of long term functionality of cementitious materials as efficient alternative
barriers for nuclear waste repositories is distinguished. Hence, initiation of this research
project as a collaboration with the Swedish Nuclear Fuel and Waste Management Company
(SKB) to gain a better understanding of the longevity of cementitious barriers is also
addressed.
1.1 Nuclear power and waste management
Nuclear power is an important energy production solution for the power industry in many
countries. Interest in nuclear power has been revived as a result of concerns about fossil
fuel prices, the security of energy supplies and global climate change. According to key
world energy statistics provided by the International Energy Agency (IEAE), the top 10
countries with a considerable share of nuclear electricity in their total electricity production
are France, Ukraine, Sweden, Korea, United kingdom, the United states, the Russian
Federation, Germany, Canada and the People’s Republic of China with a share of up to
76% of nuclear electricity in their total domestic electricity production. The IEA
assessments show that about 5.7% of the world’s energy and 13% of the world’s electricity
were provided through nuclear power stations in 2012. As reported by Adamantiadesa and
Kessides [1], nuclear energy is now a key element in the European Union's climate-change
policy. Finland's parliament voted in 2002 to approve building a fifth nuclear power plant,
Italy has plans to resume building nuclear plants within five years and Sweden announced
plans to overturn a near 30-year ban on new nuclear plant construction. Debates on
construction of new nuclear facilities are underway in Germany, Belgium, the Netherlands
and Hungary. The demand for nuclear electricity in Asia has also been growing

2
significantly. A number of countries in East and South Asia: China, Japan, South Korea
and India are also planning and building new reactors [1].
Although nuclear electricity is judged as a relatively sustainable energy with a low carbon
foot print, the hazards of nuclear power revolve around several basic concerns. The
possibility of a nuclear accident is one of the major obvious concerns. However, the
developments in safety assessments and the debates regarding legislation can ensure
improvements in minimizing production risks. On the other hand, a bigger issue facing the
nuclear power industries is the post production phase, such as waste management, which is
more complicated as the time scales to deal with are extremely large. As a consequence, a
major concern is the lack of comprehensive understanding of permanent and safe disposal
of nuclear waste which has been one of the more challenging problems for the nuclear
industry [1].
The disposal of radioactive waste is based on the radioactivity level and the life time of the
waste. There are four classes of radioactivity for the waste; very low, low, intermediate and
high level. Very low level waste is short-lived waste and surface disposal is an option for
storing this waste. Low level waste is considered hazardous for few centuries and can be
disposed in near-surface disposal facilities with consideration of engineered multi-barriers,
depending on the half-life of the waste. The chosen barrier types are: clay, bentonite,
quartz sand, graphite, cementitious materials and concrete.
The intermediate and high levels of waste present a hazard for hundreds of thousands of
years, and therefore, disposal in a stable geological environment is essential. Such
timescales are termed geological because they are characteristic of geological changes of
the Earth. In these time durations uncertainties in the risks with near-surface disposal, even
if equipped with engineered multi-barriers are very high. Therefore, geological disposal is
the only acceptable option [2].
Wet disposal is an option for geological disposal in which the repository is located at a
depth of up to 500 m, where eventual water ingress and saturation is inevitable. Various
types of host rock are being considered including hard rock (e.g. granite which is being
considered in Sweden) and soft rock (e.g. clay in Belgium and France). Considering the
direct contact of the facility with water, the role of the engineered barriers in disposal and

3
storage systems is to ensure the containment of radionuclides and to prevent leachates to
the groundwater. However, considering very long-term perspectives in safety prediction,
changes in the sealing properties of barriers in direct contact with water is of great
importance in the safety analysis.
1.2 Cementitious barriers
Cementitious materials as suitable physical barriers, are efficient chemical binders for
waste species and are extensively used in the construction of radioactive waste repositories
[3, 4]. These materials which have a high pH buffering capacity, good mechanical
properties and low diffusivity are considered as suitable alternative engineered barriers for
repositories. The high pH of the pore solution can neutralize the acidity of waste waters
and also promote the precipitation of metals. Moreover, because the solubility of
carbonates like calcite is lower in high pH levels, the encapsulation of 14C (a radioactive
isotope of carbon) can be promoted. However, as mentioned in the previous section, one
possible complication is the requirement for long-term service life predictions, which
necessitate an accurate demonstration of the changes in functionality of these materials
caused by long-term degradations. One of the major promoting factors in degradation
scenarios of the barriers is the long-term contact between the barrier materials and the
surrounding groundwater [5, 6]. The groundwater surrounding the cementitious barriers in
repositories has a different pH and ionic concentrations in comparison with the pore
solution of the cementitious materials. The concentration differences will cause ion
exchange and interaction and re-depositions of these ions, which will result in the
dissolution or precipitation of minerals, and, consequently an alteration in the
microstructure and composition of the cementitious materials.
Several researchers have reported investigations into durability analyses of cementitious
barriers utilized in repositories of nuclear waste with long-term contact with water [3-42].
However, lengthy perspectives in predictions encounter high uncertainties such as dealing
with very complicated and coupled processes that influence the performance of the
barriers. Moreover, current knowledge and experimental data about the performance of this
construction material does not cover more than a service life of up to 200 years, which is
considerably lower than the expected service life for the repositories. This means that there

4
is not yet sufficient knowledge to demonstrate the effectiveness of these engineered
barriers [43], and more assessments are necessary in order to improve the understanding of
the long-term performance of such a material.
1.3 SKB
The Swedish Nuclear Fuel and Waste Management Company (SKB), was formed in the
1970s as a partnership between nuclear power companies in Sweden. The organization is
tasked to manage the disposal of radioactive waste according to safety regulations from the
point that the waste leaves the nuclear power plants.
The current facilities in Sweden include:
• The intermediate storage facility for nuclear fuel (Clab) situated near Oskarshamn
• The final repository for short-lived radioactive waste (SFR) located in Forsmark.
Currently, there are also plans for an extension of SFR and to build a new repository for
long-lived radioactive waste (SFL) and a repository for spent nuclear fuel. Spent nuclear
fuel, which is considered as long-lived waste, will be deposited in a spent fuel repository.
The design of the final repository requires engineered barriers to meet the level of
radioactivity of the waste. The current repository for radioactive waste, SFR, consists of
several sections with respect to the radioactivity level of the waste, Figure 1-1. These
include the Silo (intermediate waste), BMA (intermediate waste), 1BTF and 2BTF
(dewatered ion exchange resins) and BLA (low level waste). The facility is a hard rock
system located 60 meters beneath the sea. The silo for the most reactive part of the waste is
designed with multi-layers of engineered barriers. The waste container is considered to be
the first barrier which is embedded in concrete. The reinforced concrete walls provide
additional barriers. Furthermore, between the concrete walls and the outer barrier layer of
rock, a bentonite layer is engineered providing higher safety. The BMA vault, Figure 1-2,
has been designed using rock as the loadbearing parts and in situ casted reinforced concrete
is used as the slab and flooring and the walls and the whole structure is constructed on a
base of shot rock leveled with gravel. The 1BTF and 2BTF are concrete tank repositories
and the BLA vault has a concrete floor and rock walls.

5
As noted, an extensive amount of concrete is utilized in the construction of the repositories
in Sweden. Consequently, safety assessments require predictions regarding the long-term
functionality of cementitious barriers in retaining hazardous radionuclides. This motivates
the vast amount of research on this topic initiated by this organization.
Figure 1-1. Different parts of SFR. The section in blue color is SFR 3 which is planned to be built by 2025
Figure 1-2. The BMA vault: concrete is a major construction material

6
1.4 Initiation of the project: goals and limitations
In order to broaden the knowledge and understanding of the long-term degradation of
cementitious materials as well as to provide databases that account for the changes in the
chemical, physical, mechanical and transport properties of the cementitious materials after
degradation, a project called “Ageing of cementitious materials for storage of nuclear
waste” was initiated and funded by SKB. The major intention was to provide accurate
databases for further numerical simulation of the degradation process. The project was
defined as a PhD project performed at Chalmers University of Technology, Department of
Civil and Environmental Engineering, Division of Building Technology. The primary
objectives were to investigate the chemical, physical, mechanical and transport properties
of the aged cementitious materials undergoing calcium leaching as the major deterioration
factor affecting the cementitious concrete barriers in nuclear waste repositories. The
specific goals included in the project description are as follows:
• Laboratory investigation of various aging tests in order to find suitable regimes for
manufacturing the aged cementitious materials without significantly distorting the
properties of the material from the natural aging processes.
• Development of a proper leaching test method to produce aged specimens of
flexible size and comparable to naturally leached specimens, to be used in further
tests.
• Laboratory investigation of physical and chemical properties of “young” and aged
cementitious materials, including mechanical properties, transport properties
(diffusivity), binding (adsorption) capacities, surface complexation (charge)
behaviors, and chemical and mineralogical stabilities as well as frost resistance.
The predictions should have a perspective of 100,000 years as the service life.
• Synthesis and analysis of the test and modeling results with the intention of
establishing a mechanism-based (chemo-mechanical-coupled) model for longevity
prediction of concrete for storage of nuclear waste.

7
It should be noted that chemical degradations and changes in the mechanical characteristics
of steel bars in reinforced concrete are beyond the goals of this project. The effect of water
cement ratio, mix proportions as well as the utilization of supplementary cementitious
materials on durability, are considered as possible future investigations and are not dealt
with in this work. It should be noted that the cementitious materials studied in this project
were limited to those actually used in repository of nuclear waste in Sweden, SFR.

8

9
2 Degradation of Cementitious Barriers
This chapter presents a general knowledge about properties of cement and hydrated cement.
A background about durability of cementitious materials and the most important
degradation scenarios interfering with long-term functionality of these materials is also
presented. Leaching of calcium as a major durability issue is addressed, and test methods
for simulating this phenomenon are introduced. Major gaps of knowledge in current
understanding concerning changes in properties of cementitious materials are also pointed
out.
2.1 Cement and cement hydration
Cement is an essential part of concrete. It hardens after mixing with water through several
chemical reactions, and functions as a binder. More than 95% of the cement which is used
around the world is Portland cement [43]. The main constituents of Portland cement are
calcium oxide (CaO) and silicon dioxide (SiO2), both of which exist in the Earth’s crust as
calcium carbonate and sand. Portland cement powder has a grain size between 2 and 80
µm, it is grey in color and has a relative density of about 3.14 g/cm3. The chemical
composition of cement consists of Tricalcium Silicate (C3S), Dicalcium Silicate (C2S),
Tricalcium Aluminate (C3A) and Tetracalcium Aluminoferrite (C4AF), which are known
as the four phases of cement. Gypsum is also added to ground clinker in order to regulate
the reactivity of the aluminate phases. The Bogue Equation [44] is used to calculate the
compound composition of cement . After mixing cement with water, hydration starts. The
rate of hardening is very significant after about 2-4 hours and strength is obtained very
rapidly after a few days. However, after this time, hardening continues at a decreasing rate
for at least a few months. It should be noted that hydration reactions never end, and in
order to show the level of reactions, the hydration degree is used as an indicator. The
hydration of two phases of cement, C3S and C2S, significantly contribute to most of the
engineering properties of hydrated cement paste (HCP), like strength and stiffness. The
hydration reactions are presented in Equations (2.1) and (2.2) below:

10
CHHSCHSC 3362 233 +→+ (2.1)
CHHSCHSC +→+ 342 232 (2.2)
where C is CaO, S is SiO2, H is H2O, CH is Ca(OH)2 and CSH is the Calcium Silicate
Hydrate.
The aluminate ions in Tricalcium Aluminate (C3A) and Tetracalcium Aluminoferrite
(C4AF) also react with calcium and sulphate ions to form Calcium Trisulphato Aluminate
Hydrate (Ettringite). According to Powers [45] as hydration reactions proceed, more and
more anhydrous material is converted into hydrates. This leads to an overall decrease in
porosity since the molar volume of hydrates is much larger than that of the anhydrous
phases, and the remaining porosity is referred to as capillary porosity.
A major hydration product as stated in Equations (2.1) and (2.2) is Calcium Silicate
Hydrate known as CSH gel. The CSH part of HCP is the main phase that contributes to
strength properties. The mineralogical structure of the CSH gel is very complex and it is
reported to be amorphous to slightly crystalline [46]. It has been shown that CSH has a
layered crystal structure similar to tobermorite or jennite, with a layer thickness in the
nanometre range [47-49]. The average Ca/Si-ratio is around 1.7 with reported fluctuations
between 0.6 and 2 [50]. The CSH layers bear a mixture of Si OH and Si O-
groups. The proportion of O groups increases as the Ca/Si ratio and the pH increase [50].
Thus, the CSH layers are negatively charged particles, although because of the high
concentration of calcium ions a charge reversal may occur [50]. However, the structure of
the CSH gel accommodates available adsorption sites and high specific surface area, which
has a direct influence on the diffusion/adsorption properties of cementitious materials [51].
The CH known as Portlandite is the main crystalline part of the HCP. It provides alkaline
characteristics (pH: 12.5-13) which have a great influence on the durability of cementitious
materials. Figure 2-1, illustrates the main constituents of HCP after a few weeks of
hydration. As illustrated in this figure, the hydrated cement matrix contains water-filled
gaps which are known as pores. The volume of the pore structures depends on the water
cement ratio. The magnitude of the pore volume has a direct influence on the strength as
well as the transport properties of the cementitious materials. There are two types of pores

11
in the HCP system: capillary pores and gel pores. The usual pore size categorization is
interlayer pores (2nm), gel pores (2-10 nm) and capillary pores (10 nm-5 µm) [46]. There
are also air voids in the system with sizes ranging on the scale of 5 µm-5 mm.
Figure 2-1. The main constituents of HCP after a few weeks of hydration
2.2 Degradation scenarios
The interactions between the cementitious materials and the surrounding environment
encounter changes in these materials. The exchange of ions between the environment and
the hydrated cement paste, and the interaction and re-deposition of these ions would cause
alterations to the properties of cementitious materials. Moreover, changes in surrounding
climate conditions (high temperature gradients and freeze-thaw) are other important factors
that can influence the durability of cementitious materials.
2.2.1 Chloride ingress
One well-known scenario concerning the service life of specifically reinforced concrete
structures is chloride ingress. The exposure of cementitious materials to chloride ions will
water Unhydrated part ofthe cement grain
Portlandite CSH

12
cause a reaction with aluminate phases in the paste and the formation of Friedel’s salt
(3Cao.Al2O3.CaCl2.10H2O) [52-55]. The production of other solid phases such as Kuzel’s
salt (Chloro-sulfate AFm) [56] and calcium oxychlorides [52] has also been reported in the
literature. The production of these solid phases might cause expansion and cracking, but
these new solid phases are not readily produced after the penetration of chloride ions. The
interaction of chlorides and the HCP matrix is not necessarily a chemical interaction that
leads to the formation of new solid phases as soon as the exposures are taking place. That
is because the early exposure interactions in the pore solution of cementitious materials are
affected by binding phenomena [57, 58]. The overall amount of chlorides that react with
the materials in early chloride exposure has also been taken into consideration in the
investigation by Tang and Nilsson [59].
Moreover, it has been reported that the chloride concentration of the groundwater around
repositories is too low to form Friedel’s salt (<0.1 M [60]). This indicates that formation of
Friedel’s salt is not considered as a leading degradation scenario when dealing with safety
assessments of cementitious barriers.
A chloride intrusion may indirectly influence the concrete barriers due to initiating steel
corrosion in reinforcements. Corrosion products are expansive and will lead to eventual
cracking and distortions. The major effect of the presence of chlorides is the destruction of
the protective passive layer on the steel reinforcement surface causing the initiation of
corrosion [61]. The corrosion products contribute to stress around the rebar, and
consequently damage the concrete cover.
2.2.2 Carbonation
Another well-known source of degradation in cementitious systems is carbonation. If
gaseous carbon dioxide penetrates in to the HCP matrix it will cause the production of
HCO3- and CO3
2- which will react with dissolved calcium, and this reaction will lead to the
precipitation of CaCO3 (Calcite). Although the production of calcite causes a reduction of
material porosity and increases the retention of the HCP constituents [29], the consumption
of Portlandite causes a pH drop in the system. The pH drop can affect the protective
passive layer of the reinforced steel. This will initiate steel corrosion. Moreover,
carbonation might also cause changes in the solubility of the HCP constituents [29, 62].

13
2.2.3 Sulfate attack
Sulfate attack is another degradation problem. The reaction of sulfate ions with the HCP
phases leads to the production of:
• Gypsum (CaSO4.2H2O),
• Ettringite ([Ca3Al(OH)6⋅12H2O]2⋅(SO4)3⋅2H2O) and
• Thaumasite (Ca3[Si(OH)6⋅12H2O]⋅(CO3)⋅SO4).
These products can cause expansion, spalling and severe degradation [63-65]. The source
of sulfate ions is usually the groundwater surrounding the cementitious barriers, and since
the pH level is commonly near neutral in these environments, the sulfate ingress will be
accompanied by leaching [4]. This emphasizes the importance of coupling the effect of
sulfate attack with leaching phenomena when dealing with safety assessments.
2.2.4 Leaching of calcium
Another factor behind major deterioration in the long-term service life of cementitious
barriers in a nuclear waste repository is the leaching of calcium [5, 6]. The low calcium
content of the water in the surrounding environment causes a concentration gradient which
leads to dissolution and eventually the leaching of the calcium from the hydrated cement
matrix. It has been mentioned earlier that CSH and CH parts of the HCP system contribute
to strength and durability properties, and therefore, decalcification affects the chemical and
mechanical properties of the cementitious materials. The dissolution of the CH part of HCP
encounters extreme changes in the pore structure which leads to changes in transport
regimes and strength properties [12, 17, 22, 27, 36]. The induced calcium depletion will
also lead to changes in the surface charges of CSH and eventually the surface area, which
will have an extensive effect on the adsorption properties of the cementitious systems [17].
The coupled chemical/physical and mechanical changes might induce changes in freeze-
thaw properties as well. It should be noted that this degradation process is relatively slow,
but will be magnified from the service-life perspective of nuclear waste repositories.
Figure 2-2 briefly illustrates the influencing degradation factors and the consequent
encountered degradations.

14
Figure 2-2. Degradation of cementitious materials
Of all the major degradation scenarios for cementitious materials, calcium leaching is often
stated as the major degradation scenario of cementitious materials in long-term contact
with water [5, 6]. Moreover, the other degradation processes, such as chloride and sulfate
ingress as well as carbonation, are extensively affected and coupled with the leaching
phenomena. This motivates the importance of considering the coupled effect of leaching
on other degradation processes while drawing conclusions in safety assessments.
2.3 Experimental simulation of decalcification process
As explained in the previous section, a major process that causes the degradation of
cementitious materials in long-term contact with water is the decalcification of the
hydrated cement system. It has been shown in several studies that the calcium leaching
process is governed by a coupled dissolution/diffusion process [66]. By definition,
leaching is the removal of a soluble phase, in the form of a solution, from an insoluble
permeable solid.
The kinetics of an ionic diffusion process are presented in a simplified way in Equation
(2.3) [8].
t
txc
x
txctxD
t
txctx s
∂
∂−
∂
∂=
∂
∂ ),(),(),(
),(),( 2
2
φ (2.3)
15
where, c(x,t) is the Ca2+ concentration in the liquid phase, cs(x,t) is the content of Ca2+ in
the solid phase, ϕ(x,t) is porosity and D(x,t) is the diffusion coefficient.
Although this equation is rather simplified (the influence of phenomena such as chemical
activity, electrical coupling and convection is neglected), it indicates that a major factor in
a diffusive transport process is the concentration gradients. Due to a low concentration of
calcium ions in the water, the dissolution of calcium hydroxides followed by the diffusive
transport of calcium ions, or leaching of calcium, occurs. The loss of calcium leads to the
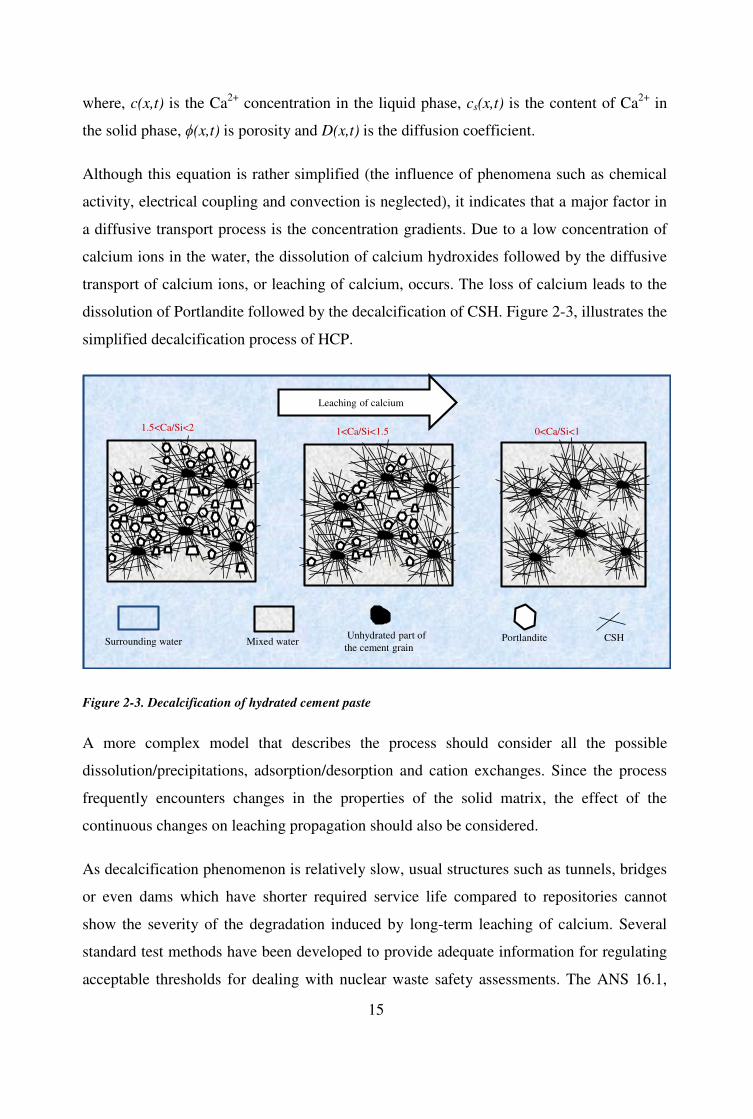
dissolution of Portlandite followed by the decalcification of CSH. Figure 2-3, illustrates the
simplified decalcification process of HCP.
Figure 2-3. Decalcification of hydrated cement paste
A more complex model that describes the process should consider all the possible
dissolution/precipitations, adsorption/desorption and cation exchanges. Since the process
frequently encounters changes in the properties of the solid matrix, the effect of the
continuous changes on leaching propagation should also be considered.
As decalcification phenomenon is relatively slow, usual structures such as tunnels, bridges
or even dams which have shorter required service life compared to repositories cannot
show the severity of the degradation induced by long-term leaching of calcium. Several
standard test methods have been developed to provide adequate information for regulating
acceptable thresholds for dealing with nuclear waste safety assessments. The ANS 16.1,
Mixed waterUnhydrated part of
the cement grain Portlandite CSH Surrounding water
1.5<Ca/Si<2 0<Ca/Si<11<Ca/Si<1.5
Leaching of calcium

16
ASTM C1308 [67, 68] as well as parallel batch extraction test, up-flow percolation column
and tank leaching tests [69] are some examples. The test methods are either kinetic-based
to measure specific diffusion coefficients or equilibrium-based to account for the
characteristics of the barrier and surrounding environment in equilibrium [4]. The batch
reaction test is based on the application of acidic or basic solutions on solid materials with
reduced particle size. The percolation column utilizes the effect of an advective flow and
the tank leaching test is an immersion test with frequent exchanges of the leaching solution
[4]. Several other improvised versions of these test methods have been reported in
literature, which simply induce the leaching process through the immersion of solid
cementitious materials in leaching solutions. [7, 11, 13, 21, 22, 26, 27, 30, 31, 37, 42, 70-
72]. The reduced solid particle size and also the chemical properties of the leaching
solutions (pH and ionic concentration) introduce acceleration rates in the leaching process
in some of the proposed test methods. Since this is a matter of a very slow process, more
accelerated leaching test methods with high acceleration factors have been developed in
order to draw conclusions about long-term predictions and in order to avoid extrapolating
short term data sets. These methods either utilize electrical field [11, 13, 70, 73] or
aggressive leaching solutions [26, 37, 74] to change the kinetics of the process.
2.3.1 Accelerated calcium leaching test methods
2.3.1.1 Electrical acceleration
A well-known acceleration method is electrical migration. There are a few studies in the
literature based on the migration concept [11, 13, 70, 73]. According to the definition of
migration, it is possible to move charged substances with the application of an electrical
field. The charged substances move under the gradient of the electrical field in a certain
direction according to their valance state. The average velocity of the movement is defined
according to Equation 2.4.
xum
∂
∂⋅=
ψυ (2.4)
Where, mυ is the velocity of the charged substance and u is the ion mobility.
According to the Einstein relation, ion mobility can be defined as Equation (2.5).

17
TR
FzDu
⋅
⋅⋅= (2.5)
where, D is the diffusion coefficient, z is the valance number of the charged substance, F is
the Faraday number equal to 96485 C/mol, R is the gas constant and T is the temperature.
The actual movement of ionic species can be described by the Nernst-Plank Equation:
xRT
FzDc
x
cDJ i
iii
ii∂
Ψ∂⋅−
∂
∂−= (2.6)
where J is the flux of ions, D denotes the diffusion coefficient, c is the molar
concentration, R is the gas constant, T is the absolute temperature, x is the distance, z is the
valence of ions, F is the Faraday constant, and Ψ is the electrical potential including both
the so-called counter electrical potential caused by different mobilities between anions and
cations and the imposed external electrical potential across the anode and the cathode. The
subscript i represents a specific type of ions. On the right side of Equation (2.6), the first
term describes diffusion, while the second term describes the migration process. Equation
(2.6) has been used by Tang [75] in the development of the rapid chloride migration test
which was adopted as the Nordic standard NT BUILD 492 [76].
Under a certain gradient of external electrical potential, the migration current is the sum of
ions moving in the pore solution that is shown in Equation (2.7):
∑∑
∂
Ψ∂⋅−
∂
∂−==
j
j
jj
j
jj
j
jjxRT
FzDc
x
cDzAFJzAFI (2.7)
where I is the migration current and A is the cross-sectional area of the specimen. The
subscript j denotes various types of ions. Combining Equations (2.6) and (2.7), one can
obtain Equation (2.8):
∑
∑
+
∂
∂
+∂
∂−=
j
jjj
j
j
jjiii
iii
czD
AF
I
x
czDczD
x
cDJ
2 (2.8)

18
A more detailed description of the electrochemical migration theory has been presented by
Cronstrand et al. [77].
There are very few reported migration-governed accelerated leaching test methods in the
literature. The methods entail the utilization of an electrical cell, in which the cementitious
specimen is a porous barrier through which ions can migrate due to induced electrical
gradients. In a study performed by Saito et al. [11], a disc of a mortar sample with a
diameter of 50 mm and a thickness of 10 mm was placed between two glass vessels
containing water as the electrolyte. A constant potential of 25 V was applied during the
experimental time and carbon electrodes were used as the cathode and the anode. Ryu et al.
[13], had utilized titanium mesh as the electrode and water is the electrolyte. The electrical
cell was designed in such a way that catholyte and anolyte solutions were in contact, as the
specimen with an embedded electrode (anode) was immersed in water in a container. The
cathode was also placed at the bottom of the container. A low current density of 10 A/m2
was applied because of the low dissolution rate of calcium ions.
2.3.1.2 Application of ammonium nitrate
Another category of accelerated leaching is the application of aggressive solutions. A well-
known chemical acceleration method presented in the literature is the immersion of
samples in a concentrated ammonium nitrate solution [26, 37, 74]. As reported by
Heukamp et al. [26] as well as Carde [37], the application of ammonium nitrate solution
favors the dissolution of calcium hydrates because of the formation of highly soluble
Ca(NO3)2 along with the consumption of the OH- ions in calcium hydroxides. However, it
should be noted that due to the low concentration of calcium ions in pore solution,
Ca(NO3)2 can only exist as ions of Ca2+ and NO3- and precipitations of this product will not
exist. This indicates that the presence of nitrate ions in the pore solutions is major the
factors facilitating the dissolution of calcium hydroxides.
In this method, cylindrical paste specimens with the size of Ø11.5×60 mm were immersed
in an oscillating box containing 6 M ammonium nitrate solution. In order to reach a quasi-
steady state, 45 days of experimental time was required, and during this time the
propagation of the dissolution front was 2mm/����. Other test set-ups utilizing specimens
of different sizes with different experimental durations have also been reported in the

19
literature. Nguyen et al. [18] have reported on the application of specimens of the size
Ø32×100 mm and Ø110×220 with an experimental time of up to 547 days. Choi and Yung
[35] have used cylindrical concrete samples of the size Ø100×100 mm and an experimental
time of up to 365 days.
2.3.2 Reported properties of decalcified cementitious materials
The test methods and standards noted in previous sections were developed to account for
the properties of calcium-leached cementitious materials. A study by Adenot [42] has
demonstrated that the degraded material has a layered system which consists of different
zones separated by precipitation/dissolution fronts and progressive decalcification of CSH.
The secondary precipitation of Ettringite and AFm (Alumina Ferric Oxide Monosulfate)
and calcite has also been reported [31].
It is also reported that leaching front is characterized by continuous decalcification of the
CSH phase with a gradient of Ca/Si-ratio between the sound and leached zone. This causes
silicate polymerization and as a result several adsorption sites become available on the
CSH surface. The presence of these sites could cause the incorporation of dissolved iron or
aluminum in the CSH matrix [30, 31].
It is also demonstrated that the changes in pore structure are attributed to the leaching of
Portlandite. In addition, it is shown that for larger initial Portlandite content, the magnitude
of the changes in pore volume is also larger [27]. It has also been reported that the induced
increase in porosity caused by the degradation of the CSH gel is very low and can be
neglected [22, 27, 36]. Moreover, several investigations have demonstrated the effect of
changes in pore volume on strength properties [12, 18, 35, 36]. Although the results of
these studies showed considerable deviations, all of the investigations indicated that lower
mechanical strength is a result of larger pore volume. In addition, changes in the surface
charges of the CSH gel due to silicate polymerizations, causing changes in adsorption
properties are reported as well [17]. More available adsorption sites mean a higher
available specific surface area as well.

20
2.3.3 Complications and gaps in knowledge
As noted in previous sections, there are a vast number of test methods that are reported in
the literature to experimentally simulate the calcium leaching process. One complication is
that test methods that approximate natural leaching conditions are very time consuming
because the leaching process is very slow. Moreover, even if using acceleration to facilitate
the process, an accelerated leaching test might not properly simulate the process. In
addition, the available accelerating laboratory test methods use relatively small sample
sizes to reach higher acceleration rates. This indicates that accurate further testing of
properties such as transport, frost or mechanical strength, is not possible. Also, because
leaching is a dissolution/diffusion governed process, high acceleration rates can be
achieved if both dissolution and diffusion phenomena are accelerated. However, the
electrical acceleration methods can only accelerate the ionic transport process by
introducing migration instead of diffusion, but the kinetics of the dissolution process will
not be changed. On the other hand, chemical acceleration with leaching solutions, such as
high concentrations of ammonium nitrate, accelerates the dissolution process while the ion
transport remains slow and diffusion-governed.
It should be noted that a proper acceleration method should not create an over-estimation in
the simulation of a natural process. Nevertheless, the proposed electrical leaching test
methods cause degradation due to the production of H+ ions close to the anode. The acidic
characteristic of this ion cause unrealistic degradation in the specimens. As reported by
Saito et al. [11], a Ca/Si-ratio of zero can be obtained after less than 500 days of leaching
with an electrically accelerated test method. This indicates that severe degradation will be
obtained in less than 2 years, which is an extreme over-estimation. In addition, the
application of a highly concentrated ammonium nitrate might cause inhomogeneous
accelerated leaching due to excessive degradation on the surface of specimens in direct
contact with the aggressive solution.
Consequently, a test method accelerating decalcification for specimens of flexible size that
speeds up both the dissolution and diffusion processes with the least amount of over-
estimation is needed to better demonstrate the circumstances of decalcification. The
produced electrochemically aged specimens should be thoroughly characterized to enable a
comparison with naturally aged specimens.

21
3 Methods and Experimental Details
In order to attain the goals within the scope of this project as well as considering the
importance of an efficient test method for calcium leaching as demonstrated in the
previous chapter, the experimental approach in this project was prioritized as follows:
I. Development of an accelerated leaching test method for cementitious specimens of
flexible size.
II. Demonstration of the comparability of the produced aged specimens with leached
samples produced through reference leaching test methods proposed in the
literature.
III. Investigation of the changes of the properties of the age specimens caused by
leaching. The considered properties are: transport properties, diffusion/adsorption,
mechanical strength, frost resistance as well as physical properties such as
permeability and pore structure changes.
This chapter presents all the experimental approaches and the details of the performed test
methods to achieve the above-mentioned goals. The chapter starts by presenting the
preparation procedures for all the cementitious specimens used in the test methods. Then,
the electrochemical migration test method as the main focus of the project is presented.
Thereafter, the set-up designs of all the performed reference leaching test methods
formulated according to literature propositions are demonstrated. Details of instrumental
analyses and characterization of leached specimens are also presented.
3.1 Specimen preparation
The paste specimens were cast from a mixture of Swedish structural Portland cement for
civil engineering (CEM I 42.5N SR3/MH/LA) and deionized water at a water-cement ratio
(W/C-ratio) of 0.5. The chemical composition of the cement is listed in Table 3-1. Fresh
cement paste was cast in acrylic cylinders with an internal diameter of 50 mm and a length
of 250 mm. The ends of the cylinders were sealed with silicone rubber stops. The cylinders
containing fresh paste were rotated longitudinally at a rate of 12-14 rpm for the first 18-24

22
hours of hydration in order to produce specimens with a homogeneous composition and
structure. Afterwards, the rubber stops were removed and the ends of the cylinders were
sealed with plastic tape. The specimens were stored for over 6 months in a tight plastic box,
and then cut into cylinders with the size of Ø50×75 mm for use as specimens in the
experiments. In order to prevent carbonation, saturated lime water was used at the bottom
of the plastic box as an absorbent for carbon dioxide during the storage of specimens. To
further ensure that the specimens used in the leaching experiments were not carbonated, the
paste portions about 10-20 mm from the ends of the cylinders were cut off prior to
specimen cutting. The initial calcium and silica content in hydrated cement is calculated
and presented in Table 3-2.
Table 3-1. Chemical composition of Swedish CEM I 42.5N SR3/MH/LA.
Chemical formulation CaO SiO2 Al2O3 Fe2O3 MgO Na2O K2O SO3 Cl
Percentage 64 22.2 3.6 4.4 0.94 0.07 0.72 2.2 0.01
Table 3-2. Initial calcium and silica contents in a cement paste specimen (Considering C3S2H3 as the
composition of CSH)
Total Component mole/gr paste Ca/Si (in mole)
Calcium content
CSH 0.0044
3.1
CH 0.003
Other hydrates 0.0018
Total 0.0092
Silica content CSH 0.003
The mortar specimens at a W/C-ratio of 0.5 and a cement:sand-ratio of 1:2, were cast from
mixtures of Swedish structural Portland cement for civil engineering (Table 3-1), deionized
water and natural sand with a maximum particle size of 1 mm. A casting procedure similar
to the one for paste specimens was followed.

23
The concrete specimens were cast from mixtures of Swedish structural Portland cement for
civil engineering (Table 3-1), natural sand and crushed coarse aggregate with a maximum
size of 16 mm. The specimens were cast in cylinders in two different dimensions of
Ø100×200 mm and Ø50×250 mm with two different W/C-ratios (in line with the properties
of the concrete used in, SFR, in Sweden [33, 78]), Table 3-3. The slump of fresh concrete
prior to casting was 25 mm for the concrete with W/C=0.48 and 35 mm for W/C=0.62. The
specimens were cast in cylinders in two different dimensions of Ø100×200 mm and
Ø50×250 mm. 24 hours after casting, the specimens were demolded and cured in the
saturated lime water for more than 3 months in a moist plastic box and then cut to cylinders
with the dimensions of Ø50×75 and Ø100×50 mm to be used in the leaching experiments.
Table 3-3. Properties of concrete used in SFR repository located in Forsmark, Sweden.
Properties Silo1 BMA2
Cement type Swedish structural cement Swedish structural cement
W/C 0.48 0.62
Cement content (kg/m3) 350 300
Aggregate volume fraction3 0.7 0.7
1 Based on Emborg et al. [33], however with a symmetrical deviation of 48±5 MPa in compressive strength instead of 43-58 MPa with a mean 48 MPa. 2 BMA: rock vault for intermediate level radioactive waste. The data has been estimated based on the previous Swedish concrete class K30. 3 Estimated based on the general mix design of concrete mix proportion, which is in line with Höglund [78] for the
concrete in silo.
3.2 Electrochemical acceleration method
As mentioned in the previous chapter, although some important conclusions have been
drawn in several studies reported in the literature regarding the chemical properties of Ca-
depleted materials, in particular, the test methods available in the literature have been
limited to the use of crushed materials or small solid samples. This has limited the
possibilities to properly study the mechanical and physical properties of cementitious
materials, e.g. compressive strength and diffusivity, which require the use of larger

24
samples. In addition, not many studies reported in the literature cover the implications of
concrete specimens of proper size but instead paste specimens or powder samples have
been used. Moreover, the proposed acceleration methods in previous studies did not
accelerate both processes (dissolution/diffusion) governing the leaching phenomenon,
which, consequently limits the obtained rates of acceleration. Further, as also noted in
Section 2.3.3, the methods in previous studies have not entirely simulated the natural
situation because of the introduction of some over-estimations and undesired degradation
scenarios. For this reason, an efficient accelerated leaching method for the decalcification
of cementitious materials of the proper size, is developed in this project. The
electrochemical migration method:
• enables acceleration of both dissolution and diffusion processes governing the
leaching phenomenon and consequently a high leaching rate of calcium,
• allows application of specimens of flexible sizes,
• enables homogeneous leaching of calcium, and
• prohibits degradations caused by extensive over estimated decalcification.
The initial set-up design of the method was regulated according to literature
recommendations. However, the initial design was gradually refined in order to achieve the
most efficient combination of adjustable settings that enabled the leaching of calcium
without causing unexpected damage to the specimens. The adjustment of several set-up
parameters was based on the results and observed outcomes from a series of experimental
trials. A complete demonstration of the gradual refinement of the method development
process can be found in a licentiate thesis by Babaahmadi [79]. Paper I, presents some
concluding remarks based on a pre-developed version of the method. The results presented
in Papers II, IV, V and VI, are based on the finalized set-up design of the method. A step-
by-step experimental procedure for an electrochemical acceleration method is presented in
Appendix.
3.2.1 Set-up design
The set-up design of the electrochemical migration method was based on the rapid chloride
migration method developed by Tang [75], Figure 3-1. However, this method was re-
adjusted, thus enabling accelerated leaching of calcium from cementitious specimens. The

25
design included utilizing a cementitious specimen which was placed between two
electrolyte solutions (electrical cells) as a porous medium for ion migration. The sealant
was asphalt tape which is 2-3 times longer in height than the specimen’s, and provided an
empty volume of about 250 ml used as the anolyte container. A plastic box with the
capacity of 30 liters was used as the catholyte container. The cathode was made of stainless
steel and was mounted on a plastic support in a similar way as described in NT BUILD
492 [76]. The anode was produced using a titanium mesh and was equipped with a plastic
spacer that prevented direct contact with the specimen.
Figure 3-1. Set-up design for electrochemical migration method
3.2.1.1 Anolyte/Catholyte solutions
The electrolyte solutions were selected in a way to minimize the undesired destructive
scenarios which exist in some other proposed acceleration methods and also to accelerate
dissolution processes. It was noted in the previous chapter that the application of
ammonium nitrate to accelerate the dissolution of calcium-containing phases has been
reported in literature [26, 38]. However, although the dissolution of calcium is enhanced
according to these studies, the transport of nitrate ions into the pore solution as well as the
Asphalt tape as sealant
LiOH as anolyticsolution
dU, V DC
+
ammonium nitrate as catholytic solution
-
Specimen
Cathode (stainless steel)Plastic supportPlastic box
Anode (titanium mesh)
Plastic space
Silicon rubber

26
leaching of calcium is still very slow due to the slow diffusion process. On the other hand,
with the application of an electrical gradient, a homogeneous transport process of nitrate
ions as well as higher leaching rates of calcium can be achieved. Consequently, an
ammonium nitrate solution was used as the catholyte solution in the electrochemical
migration method to obtain the combined effects of both chemical and electrical
acceleration. Moreover, as mentioned in the previous chapter, the applied high
concentration of this solution (6 M), results in an overestimated concentration gradients,
which might cause magnified decalcification in the surface of exposed specimens. To
prevent such degradations, a concentration close to the ionic concentration in the pore
solution of the specimen was selected in this study. Assuming that the pH level in the pore
solution is approximately 13.5, a concentration of 0.3 M was chosen.
Also, as stated in the previous section, a major problem with electrical acceleration is the
induced H+ ions produced at the anode. The acidic characteristics of these ions results in
severe magnified degradations (Saito et al. [11] have reported that a Ca/Si-ratio = 0 can be
achieved in less than 2 years of experimental time). To avoid this phenomenon, a lithium
hydroxide solution was chosen as the anolyte solution in the electrochemical migration
method, because the hydroxide ions will neutralize the produced H+ ions. Also, since Li+
ions are not present in the pore solution of the cementitious specimens, these will not
interfere with leaching of the existing ions in pore solution. Moreover, Li+ ions with a
crystallographic radius of 0.07 nm have a high surface charge density, and therefore they
are strongly hydrated in water and acquire a large size [80]. Therefore, the thick water
layer around Li+ in a solution will reduce the tendency for diffusion or migration of Li+
ions.
To use nitrate as the negative ions and to reduce the amount of free OH- ions in the
catholyte solution, ammonium nitrate was added to the catholyte. In the catholyte,
ammonium was in equilibrium with ammonia, Equation (3.1), and the pH level was below
9, which means that the H+ will neutralize the OH- formed at the cathode.
+++↔ HaqNHNH )(34 (3.1)
As the amount of free OH- ions were reduced in line with the process described above, the
nitrate ions became the dominant negative ions for migrating into the specimen, and this

27
facilitated the dissolution of the Portlandite and kept the specimen under a low resistivity
for a longer experimental time, as shown in Trial 3 in Figure 3-2. The figure illustrates that
with the application of ammonium nitrate, the resistances decrease in time while when
using only deionized water as the catholyte, the leaching stops after about 150 hours. A
plausible explanation for this behavior is that when the initial alkaline ions K+ and Na+ in
the pore solution leach out, there should be an agent that favors the dissolution of
Portlandite so that the leaching can be followed by calcium migration. However, when
using deionized water as catholyte solution, low availability of calcium ions (due to low
solubility of Portlandie) after a certain time of leaching cause high resistances. On the
other hand, when utilizing ammonium nitrate, since the nitrate ions enhance dissolution of
Portlandie, dissolved calcium ions would be available for continuation of the leaching
process. Consequently, with application of ammonium nitrate solution as catholyte, the
resistance inside the specimen will not increase.
3.2.1.2 Current or potential range applied to the specimen
In order to avoid any temperature-induced mechanical destruction of the specimen, the
current applied to the specimen was controlled and kept constant to prevent any significant
elevation in temperature caused by the Joule Effect. The application of a constant current
also enabled accounting for the exact amount of electrical charge (Coulombs) through the
specimen.
As mentioned in the previous chapter, low current densities are reported to be utilized in
the electrical acceleration methods proposed in the literature (10 A/m2 as reported by Ryu
et al. [13] and 36 mA/m2 as reported by Castellote et al. [73]). This is due to the low
dissolution rates of the calcium-containing phases which lead to high resistances.
However, by applying ammonium nitrate to increase the dissolution kinetics, it is possible
to use higher current densities without any temperature-induced degradation in the
specimen. Here, a current density of 125-130 A/m2paste is proposed in the electrochemical
migration test method. According to the pilot scale experiments, the temperature fluctuates
in the range of 20-30 °C, which would not cause any temperature-induced cracking.

28
Figure 3-2. Ohmic resistance across the specimens with application of water or ammonium nitrate as
catholyte solution
3.2.1.3 Specimen’s sealing conditions
The curved surface of the specimen was sealed to enable leaching only in the longitudinal
direction. A homogenized electrical gradient can be expected in the axial direction if the
curved surface is completely sealed. Asphalt tape was utilized as the sealant material, and
it also provided adequate elastic flexibility. As for dealing with high concentration
gradients in the electrochemical cell, osmotic pressures might cause mechanical
destructions, however, the application of an elastic sealant will prevent unrealistic
degradation. Alternatively, silicon rubber can be utilized as an electrical-resisting sealing
material. However, this product is rather expensive and not elastic enough.
The simulation of axial gradients, similar to the ones in natural leaching, was conducted in
the electrochemical migration test by sealing only half of the curved surface of the
specimen. Figure 3-3 and Figure 3-4 illustrate the changes in the simulated electrical
gradient through the specimen when the sealing conditions were changed.
0
100
200
300
400
500
600
700
800
900
1000
0 200 400 600
Res
ista
nce
[O
hm
]
Time [h]
Demineralized water as catholyte
NH4NO3 as catholyte

29
Figure 3-3. Electrical current inside the specimen sealing whole curved surface area of the specimen
Figure 3-4. Electrical current inside the specimen sealing almost half of specimen’s curved surface area
The results of such a test are presented in Paper I. Also the visual characteristics of the
leached specimen when only half of the curved surface is sealed are presented in Figure
3-5. As can be seen in this figure, the changes in cross sections of the specimen are

30
illustrated as a function of time (the specimen was turned half way in to the experimental
time to obtain a more homogenize leaching effect). As illustrated, leaching is not
homogenized in the specimens due to the uneven distribution of electrical field.
Figure 3-5. The observable changes inside the specimen in the course of the acceleration test
Considering these results, in order to completely control the leaching phenomenon in order
to draw conclusions about the post-leaching characteristics of the specimens, a
homogenized electrical gradient (sealing the whole curved surface) is recommended to be
utilized in the final set-up design of the electrochemical migration method. It should be
noted that, all of the results presented in this study (except the results in Paper I) are
obtained using a completely sealed specimen.
3.2.1.4 Recharging reagents
In order to compensate for the consumed ions (OH- and Li+ ions from LiOH in the anolyte
solution as well as H+ and NO3- ions from ammonium nitrate in the catholyte solution), the
solutions were frequently recharged. The quantities of the salts required for recharging
were calculated according to Faraday’s law of electrolysis as given in Equation (3.2).
)(M
mzFtI ⋅⋅=⋅
(3.2)

31
where, I is the current (A), t is the time (seconds), F is the Faraday number = 96485 C/mol,
M is the molecular mass of substance (g/mol), m is the mass of substance (g) and z is the
valance number of ions. Depending on the current intensity, different amounts of
recharging reagents were used. The test method manual presented in Appendix also
illustrates the calculation procedure to account for the needed regent amounts.
3.2.1.5 Specimen size
Cementitious specimens of sizes Ø50×75 and Ø100×50 mm were implemented in the
electrochemical migration test. However, considering the homogeneous axial distribution
of the electrical gradient utilized in this study, specimens of various sizes can be
implemented. It should be noted that for specimens of different sizes, different magnitudes
of current are needed to reach a similar current density. An important parameter to consider
regarding mortar or concrete specimens is that only the paste fraction of the specimen is the
current carrier (the ions only move in the pore solution of the paste). A detailed description
of the calculation for the needed current necessary to reach the proposed current density is
presented in Appendix. In the event of very high resistances due to a specific specimen
size, lower current densities are recommended to prevent thermal cracking. If a lower
current density is used, the required leaching time period must be extended to reach a given
leaching state.
3.2.2 Experimental time
An important leaching level is considered to be the complete leaching of Portlandite as one
of the major hydrated phases of HCP. Therefore, complete leaching of Portlandite which
can also be calculated according to Portlandite content in the specimen (Table 3-2) was
selected as the reference leaching level in this study. The accumulated leached calcium in
the catholyte solution was frequently measured to account for the required experimental
time to reach the leaching state of interest. As presented in Table 3-2, approximately 0.003
Moles of Portlandite exist in 1 gram of hydrated cement paste. As illustrated in Figure 3-6,
with the application of a current density of 125-130 A/m2, approximately 53 days of
experimental time is needed to leach out this amount of Portlandite. However, lower
current densities require longer leaching periods to obtain a similar leaching level. It should
be noted that depending on the W/C-ratio the Portlandite content varies in the specimens. In
this study the concrete specimens have the same volume of aggregate, implying the same

32
volume of CSH + Portlandite + capillary pores. Which means with a higher W/C- ratio, the
capillary pore volume is larger, implying the CSH + Portlandite volume is smaller.
Accordingly under the same degree of hydration, Portlandite in the concrete with higher
W/C-ratio is less. As a consequence the experimental time for concrete specimens with
W/C-ratio of 0.62 to reach to complete leaching of Portlandite should be shorter than that
of specimens with W/C-ratio of 0.48. However, the prolongation of experimental time after
leaching of Portlandite only affects the phase changes in CSH gel and as it was concluded
by Carde et al. the changes in CSH phases due to leaching is not affecting the mechanical
properties [36].
Figure 3-6. Leached calcium per gram of HCP against leaching time. The applied current density was
125-130 A/m2.
3.2.3 Calcium migration rate
The transport or transference number is the fraction of the total current carried by given
type of ions, Equation (3.3), where, I+ is the current carried by a given type of ion, I is the
total applied current, M is the number of moles of the given ions which are transferred, Z+
is the valance number and t is the time. It should be noted that variations in the mobility
and availability of the given ion in the system would cause different transport numbers.
tI
FZM
I
It
⋅
⋅⋅== ++
+ (3.3)

33
Figure 3-7 illustrates the amount of leached calcium against the total applied electrical
current for a specimen with the size of Ø50×75 mm. Considering 1 mole of leached
calcium and 106 Coulombs of total applied electrical charge, the calculated transport
number is 0.2 according to Equation (3.3).
Figure 3-7. Moles of leached calcium against applied electrical current for a specimen with the size
Ø50×75 mm.
Moreover, Figure 3-8 illustrates the changes in the rate of calcium leaching. The equivalent
charge carried by leached calcium ions has been plotted against the total applied electrical
charge per gram of cement paste. The tangent to the curve represents the transport number.
As can be seen, the transport number is higher in Zone 1, it reduces for a short while and
then increases again, while a gradual decrease can be seen in Zone 3. A plausible
explanation for this behavior is that in the first few hours of the experiment the current was
carried by the available calcium ions. However, after these ions have been transported with
the applied current, additional dissolution of calcium-containing phases is needed. As
ammonium nitrate was utilized in the catholyte solution, considering the migration of
nitrates into the specimen, the considerably higher solubility of calcium nitrate will cause
an increase in the ionic concentration of calcium in the pore solution (Zone 3), thus the
migration of calcium will propagate. As the leaching propagates, the available
concentration of the calcium ions decreases as well, which leads to a gradual decrease in
the transport number of these ions in Zone 3.

34
It should be noted that the transport number of calcium ions (slope of the curve in Figure
3-8), in Zone 1 and 2 is obtained only based on 2 measured points. This might cause some
uncertainty in absolute values for the transport number. However, the decrease in rate of
calcium migration in Zone 2 and the following increase in the rate in Zone 3 was shown to
be repeatable in comparable sets of experiments.
Figure 3-8. Frequent changes in the rate of calcium migration represent the changes in the calcium
transport number
3.3 Characterization methods
Several instrumental analyses as well as experimental investigations of properties were
carried out to account for the changes in chemical, mineralogical, physical, mechanical and
y = 0,9047x - 1300,4 y = 0,1371x + 9310,6
y = 0,3447x + 1031,3
y = 0,1229x + 60526
y = 0,2054x + 29695
1
10
100
1000
0,001 0,01 0,1 1 10
Ca
2+
ion
seq
uiv
ale
nt
carr
ied
charg
e
(×1
03C
ou
lom
bs)
Applied electrical charge (×106Coulombs)
Zone 1: leaching of availblecalcium ions
Zone 3: Migration ofNitrate ions in to poresolution caused highersolubility for calcium ions
Zone 2: low calcium content in the pore solution caused lower transport number for calcium ions

35
transport properties of the aged specimens. The experimental details of the laboratory
analysis are explained in this section.
3.3.1 Chemical and mineralogical analysis
3.3.1.1 IC and potentiometric titration
To quantify the content of charged substances in the catholyte solution, Ion
Chromatography (IC) was utilized using an IONEX (ICS 900) Ion Chromatograph. IC
allows the ions of interest to be detected through conductivity or UV/visible light
absorbance. The samples were injected into the instrument with an auto-sampler. In
addition, the gradual change in the calcium concentration in the catholyte solution was
analyzed with potentiometric titration on a Metrohm Titrator 702 SM Titrino, using a
calcium-selective electrode and a 0.1 N EDTA solution as the titrant.
3.3.1.2 XRD
Characterization of the crystalline phases in the solid samples was performed with X-Ray
Diffraction (XRD). A Siemens D5000 (CuKα = 1.5418 Å) X-Ray diffractometer equipped
with a Gobel mirror was used. The measurements were carried out by using 0.050˚ per step
and at a time step of 2 s. Powder sample was prepared by crushing and grinding the solid
sample in a mortar while immersed in ethanol, and vacuum dried after grinding. For each
analysis, 0.5 grams of the powder placed on a thin-walled glass sample holder was used.
The results were calibrated using 0.05 wt.% of Si powder as the internal standard.
3.3.1.3 LA-ICP-MS
Line scans quantifying the axial (longitudinal) changes in Ca/Si ratios of solid samples
were performed using Laser Ablation-Inductive Coupled Plasma-Mass Spectrometry (LA-
ICP-MS). Laser Ablation analysis was performed using a New Wave NWR213 instrument
coupled to an Agilent 7500a quadrupole ICP-MS (upgraded with a shield torch and a
second rotary vacuum pump). A 30-micron laser spot size, with a beam energy density of 6
J/cm2 and a repetition rate of 10 Hz was used in line scan mode (scan speed 100 µm/sec).
Each analysis included background measurements for 30 seconds, before switching on the
laser.

36
3.3.1.4 SEM/EDX
The surface topography and elemental composition of the solid samples were analyzed
with Scanning Electron Microscopy (SEM). A FEI Quanta ESEM 200 equipped with a
field emission gun and an Oxford Inca EDX system was used to perform the analysis.
Thin cubes of the solid sample of about 20×10 mm with a thickness of 10 mm were used.
The samples were vacuum dried prior to analysis. It should be noted that in order to
prevent the samples from carbonation they were neither polished nor coated which may
cause charging effects in the results as well as uncertainties due to the uneven surface of
the sample. The EDX (Energy Dispersive X-ray) analysis were performed in high vacuum
mode and at a working distance of 12 mm.
3.3.1.5 XRF
X-Ray Fluorescence (XRF) analysis were performed to quantify the elemental composition
of the samples. The analysis were carried out using an X-ray Fluorescence sequential
spectrometer (PANalytical, AXIOS) by dispersion of wavelength (WDXRF) with a Rh
tube and three detectors.
3.3.1.6 TGA/DSC
Thermogravimetric (TGA) and Differential Scanning Calorimetric (DSC) analysis indicate
the changes in mass and heat of reaction as a function of temperature. Unalike TGA/DSC
spectrums represent different materials. Consequently changes in hydrated phases of
cementious materials, specifically Portlandite can be detected. The analysis were performed
with a Netzsch STA 409 PC/PG. The samples were placed in a crucible and heated in pure
nitrogen (inlet flow rate of 20 ml/min) to a set temperature of 900°C. The heating rate was
a linear ramp of 10°C/min.
3.3.1.7 NMR analysis
Nuclear Magnetic Resonance spectroscopy (NMR) was used in this study to assess the
changes in physical and chemical properties of atoms or the molecules in which they are
contained and to obtain information about the structure of molecules. This technique
exploits the magnetic properties of certain atomic nuclei with respect to nuclear magnetic
resonance. Changes in the structure of silicates were considered which represents changes
in the structure of CSH gel. NMR spectroscopies in this study were performed on a Varian

37
Inova-600 operating at 14.7 T and equipped with a 3.2 mm solid-state probe.
Measurements were conducted at 299 K with a MAS spinning rate of 15 kHz.
3.3.2 Analysis of physical properties
3.3.2.1 Pore structure and specific surface area
The pore size distribution was studied with Mercury Intrusion Porosimetry (MIP), using
Micrometrics Auto pore 9500 with a 5 ml penetrometer. In this method, the volume
intrusion of mercury into specimen pores is measured to determine pore size distribution.
The relation between pore sizes and the applied pressure is presented in Equation (3.4):
rp
θγ cos2= (3.4)
where p is the absolute applied pressure, γ is the mercury surface tension, θ is the contact
angle and r is the pore radius. It should be noted that in this method the pores are assumed
to be cylindrical. Moreover, the Brunauer-Emmett-Teller (BET) specific surface area and
Barrett-Joyner-Halenda (BJH) pore size distribution was measured with N2 adsorption with
a Micrometrics TriStar 3000. BET analysis provides specific surface area assessments of
materials by nitrogen multi-layer adsorption which is measured as a function of relative
pressure. The technique encompasses external area and pore area evaluations to determine
the total specific surface area in m2/g. Also, by employing BJH analysis, pore size
distribution, independent of external area due to particle size of the sample can be
characterized.
3.3.2.2 Freezable water
The changes in freeze-thaw regimes due to decalcification, were accounted for with
scanning colorimetric measurements. A Calvet-type scanning calorimeter (SETARAM)
was used. The calorimeter was calibrated and operated to work between about 20 °C and
about -130 °C. The temperature scanning of a freezing and melting cycle started at 20 °C
and went down to -80 °C and then went back to 20 °C again. The cooling and heating rate
were set to be 0.1 °C per minute. The cement paste/mortar samples were dried at +50 °C
and then vacuum saturated. The visible water on the surface of cylinders was wiped off and
the samples were assumed to be saturated surface dry when placed in the calorimeter. The
mass of each vacuum saturated sample was determined before and after calorimetric

38
measurements. The mass difference was less than about 0.1%. After calorimetric
measurements, the samples were subjected to oven drying at 105 °C until constant dry
weights could be determined.
3.3.3 Assessment of transport properties
3.3.3.1 Diffusion cell tests
Conventionally, the diffusivity of ions in a porous material is measured using a natural
diffusion cell test at a certain gradient of concentration [16]. In the set-up of the natural
diffusion cell test, as presented in Figure 3-9 two solution containers (cells) were separated
by a 10 mm thick slice of a paste specimen. The cell filled with a solution containing the
specific ions of interest is called the upstream solution and the other cell, which is free of
those ions (usually filled with deionized water), is called the downstream cell. The
diffusion of the ions of interest would take place from the upstream cell to the downstream
cell, through the specimen, due to the concentration gradient between the cells. In order to
study the effect of ionic charge and solution concentration on the transport properties of
chloride, sodium, lithium and calcium ions, 6 different solutions containing these ions were
used:
• 5 g, 10 g and 20 g NaCl per liter
• 10 and 20 g LiCl per liter
• 10 g LiNO3 per liter
In this study, 18 sets of diffusion cells were used, with three sets per each solution.
Monitoring the concentration changes in the downstream cell, and using Flick’s first law,
the steady state diffusion coefficient can be calculated according to Equation (3.5) [81].
)( 21 CC
L
tA
QVD statesteady
−×
∆⋅
∆⋅=− (3.5)
where V is the volume of the downstream cell (m3), ∆Q is the increase in the specific ions
in the downstream cell (kg/m3), ∆t is the time interval (s), A is the exposed specimen
surface area (m2), L is the exposed slice thickness (m), 1C is the concentration of the

39
specific ions in the upstream solution (kg/m3) and 2C is the average concentration of the
specific ions in the upstream solution (kg/m3).
Figure 3-9. Diffusion cell test set-up design: front view (a) and side view (b)
Using the QCl–t curve the “time-lag”, which is the duration until a significant linear
relationship is observed from the QCl–t curve could be specified. The non-steady state
diffusion coefficient was calculated using Equation (3.6) [81]:
n
statesteadynont
LD
×=−− 6
2
(3.6)
where L is the thickness of the specimen (m) and t is the time-lag (s).
3.3.3.2 Diffusion-Adsorption test
In order to compare the diffusion properties of reference and calcium-depleted specimens,
the diffusion cell test was performed by utilizing solutions of LiCl, NaCl and CsCl with 2
different concentrations of 0.05 and 0.5 M. Moreover, to analyze the changes in adsorption
properties, the reference and the calcium-leached paste specimens were hand crushed and
powdered in a mortar and mixed with a CsCl solution in separate plastic tubes in a glove

40
box filled with nitrogen gas in order to prevent the samples from carbonation. The Cs
concentration in the solutions was determined with ion chromatography.
3.3.3.3 Gas permeability and capillary water absorption
The gas permeability and capillary water absorption tests were performed according to the
state of the art report of RILEM Technical Committee 189-NEC [82] and the
recommendations by Kollek [83]. The measurements were performed on concrete
specimens of Ø100×50 mm. The specimens were preconditioned for two weeks according
to the recommended procedures stated in the RILEM technical report 189-NEC [82] and
the recommendations by Kollek [83] prior to the measurements. Two specimens,
representative for each W/C-ratio and each degradation state, were tested to ensure
repeatability of the results.
3.3.4 Measurement of mechanical properties
3.3.4.1 Tensile and compressive strength
The tensile strength of the leached and reference concrete specimens of Ø100×50 mm was
measured using the splitting test on a Toni-Technik compression testing machine with a
maximum capacity of 100 kN. The test procedure was in accordance with the American
standard ASTM C49 [84]. The compressive strength of concrete, mortar and paste
specimens of Ø50×75 mm was measured with the same compression testing machine and
according to the ASTM C39 standard [85].
3.3.4.2 Elastic modulus
The elastic modulus of the concrete specimens of Ø50×75 mm was obtained as the slope of
stress-strain curves recorded by means of an ALPHA compression testing machine, Figure
3-10. The load cell had a maximum capacity of 50 kN and was loaded with a mechanical
press. The vertical strain was measured using a calibrated Linear Variable Differential
Transformers (LVDT) sensor. The end surfaces of each specimen, perpendicular to the
longitudinal axis of the specimen, were cut with a diamond saw and polished in order to
create a smooth surface. Concrete specimens of Ø50×75 mm were placed between two
platens and positioned under the load cells. 4 LVDT sensors were used to measure the
displacement of the bottom platen and three more sensors were employed to measure the
displacement of the upper platen. The sensors were connected to a data-log system to

41
record the gradient of strain as a function of stress. The calcium-depleted specimens were
kept in 100% RH prior to test in order to avoid any drying cracks.
Figure 3-10. Elastic modulus measurements set-up design
3.3.4.3 Resonant frequency test (fundamental longitudinal frequency)
An impact resonant apparatus was used to measure the fundamental longitudinal frequency
of concrete, mortar and paste specimens of Ø50×75 mm. One end of the horizontally
placed concrete cylinder was vibrated with an impactor, and the other end was connected
to an accelerometer. The accelerometer was connected to an amplifier, and the set-up was
connected to a wave-form analyzer. The wave-form analyzer should have a sampling rate
of at least 20 kHz and should record at least 1024 points of the wave form. By utilizing the
fact that the elastic modulus is proportional to the square root of the resonant frequency,
the elastic modulus of each specimen can be calculated according to the American standard
ASTM C215 [86].
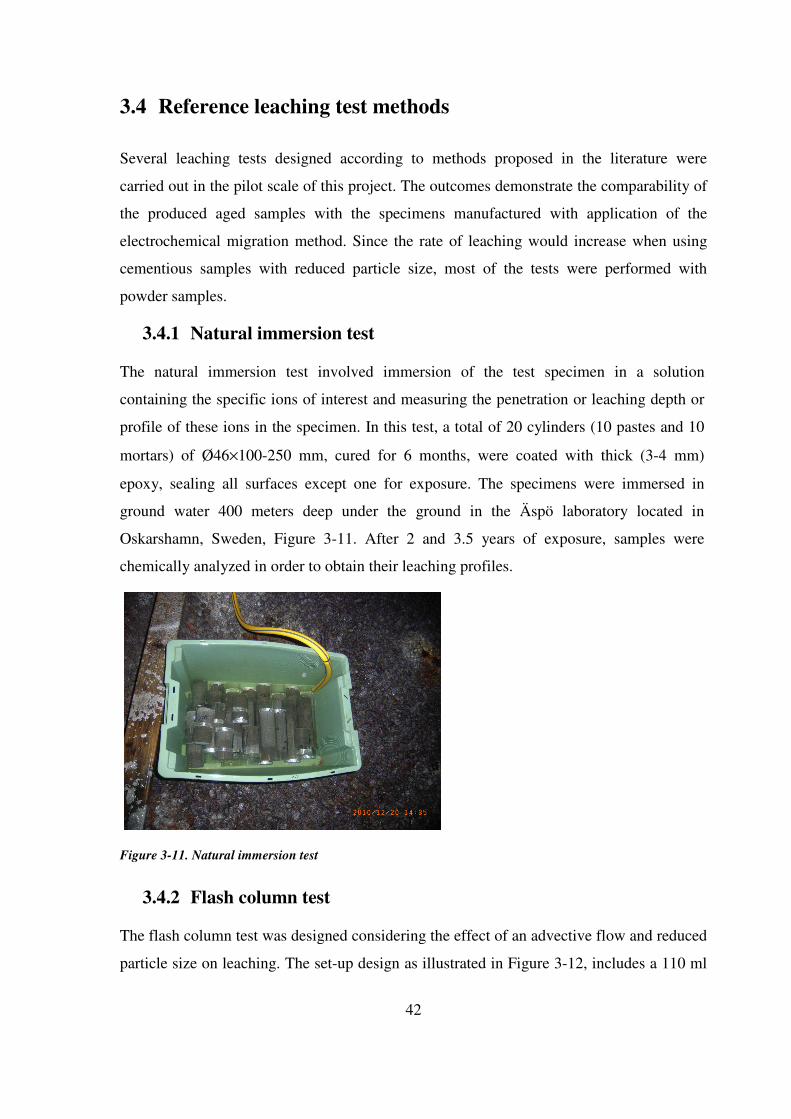
42
3.4 Reference leaching test methods
Several leaching tests designed according to methods proposed in the literature were
carried out in the pilot scale of this project. The outcomes demonstrate the comparability of
the produced aged samples with the specimens manufactured with application of the
electrochemical migration method. Since the rate of leaching would increase when using
cementious samples with reduced particle size, most of the tests were performed with
powder samples.
3.4.1 Natural immersion test
The natural immersion test involved immersion of the test specimen in a solution
containing the specific ions of interest and measuring the penetration or leaching depth or
profile of these ions in the specimen. In this test, a total of 20 cylinders (10 pastes and 10
mortars) of Ø46×100-250 mm, cured for 6 months, were coated with thick (3-4 mm)
epoxy, sealing all surfaces except one for exposure. The specimens were immersed in
ground water 400 meters deep under the ground in the Äspö laboratory located in
Oskarshamn, Sweden, Figure 3-11. After 2 and 3.5 years of exposure, samples were
chemically analyzed in order to obtain their leaching profiles.
Figure 3-11. Natural immersion test
3.4.2 Flash column test
The flash column test was designed considering the effect of an advective flow and reduced
particle size on leaching. The set-up design as illustrated in Figure 3-12, includes a 110 ml

43
glass chromatography column with a fritted disc equipped with a PTFE plug to control the
flow rate. A powder sample of about 0.1 mm (0.075-0.125) was filled into the column on
the fritted disc and subjected to upward water flow with a flow rate of less than 2.5 ml/s.
The column was connected to a reservoir with the capacity of 5 liters through PVC tubes
from both sides. Demineralized water was used as the circulating solution in the system.
The pH value of the solution was manually monitored. When the pH value in the
circulating solution was around 12, the entire solution in the reservoir was refreshed. The
experiment was continued until the pH value in the solution became constantly low (about
8). A similar set-up design can be found in a study presented by Pfingsten and Shiotsuki
[15].
Figure 3-12. Flash column test set-up design
3.4.3 pH stat test
The pH stat test was designed enabling accelerated leaching of calcium which was obtained
as of using reduced particle size and lower pH level [7] of the leaching solution than that of
in pore solution. In this method, a constant pH level lower than that of the natural situation
was applied to powdered samples through frequent acidification. The added volume of acid
and the changes in temperature for an experiment aiming for pH=8, is presented in Figure
3-13. A powder size of about 0.1 mm (0.075-0.125) was used in this test. In order to
prepare the powder, thin slices were cut from a cylindrical specimen after more than 6
Outflow
Inflow
Filter
Flash column with suspended sample
Pump with adjustable flow rate
Reservoir
Sampling hole

44
months of moist curing. The slices were crushed and ground under wet conditions in order
to reduce the risk of carbonation. 12 grams of the produced powder was mixed with 50 ml
of Milli-Q water and 6.5 ml of concentrated Nitric acid (67% chemical quality) which was
added to the mix to reach the initial pH of 8.
The automated potentiometric titration method using a Metrohm 836 Titrando titrator was
employed to perform the test. The titrator was equipped with a magnetic stirrer as well as
two dosimeters. The pH electrode with a built in thermometer was used to monitor the pH
value in the solution. The electrode was calibrated with standard buffer solutions before
use. The titration procedure was controlled with TIAMO software. Nitric acid of 3.7 M was
used to maintain the natural pH value of 8. The experiment duration was set to 24 hours
because stable equilibrium was observed under this time period. After termination of the
experiment, the solid part was separated from the liquid through vacuum filtration. The
sample was vacuum dried to be further characterized.
Figure 3-13. Temperature change and the added amount of acid as a of function of time in pH stat test for pH
level 8.
3.4.4 Application of concentrated ammonium nitrate solution
It was mentioned in Chapter 2 that one of the leading chemical acceleration methods in the
literature is the application of concentrated ammonium nitrate solution [26, 37]. It was
noted that to obtain a high acceleration rate specimens of small sizes were used which
0
5
10
15
20
25
30
35
40
45
0 20 40 60 80 100
pH le
vel,
Vol
ume
of a
dded
aci
d (m
l), T
empe
ratu
re (
˚C)
Experimental time (seconds)
×103
Mesured pH
Volume of added Acid
Temperature
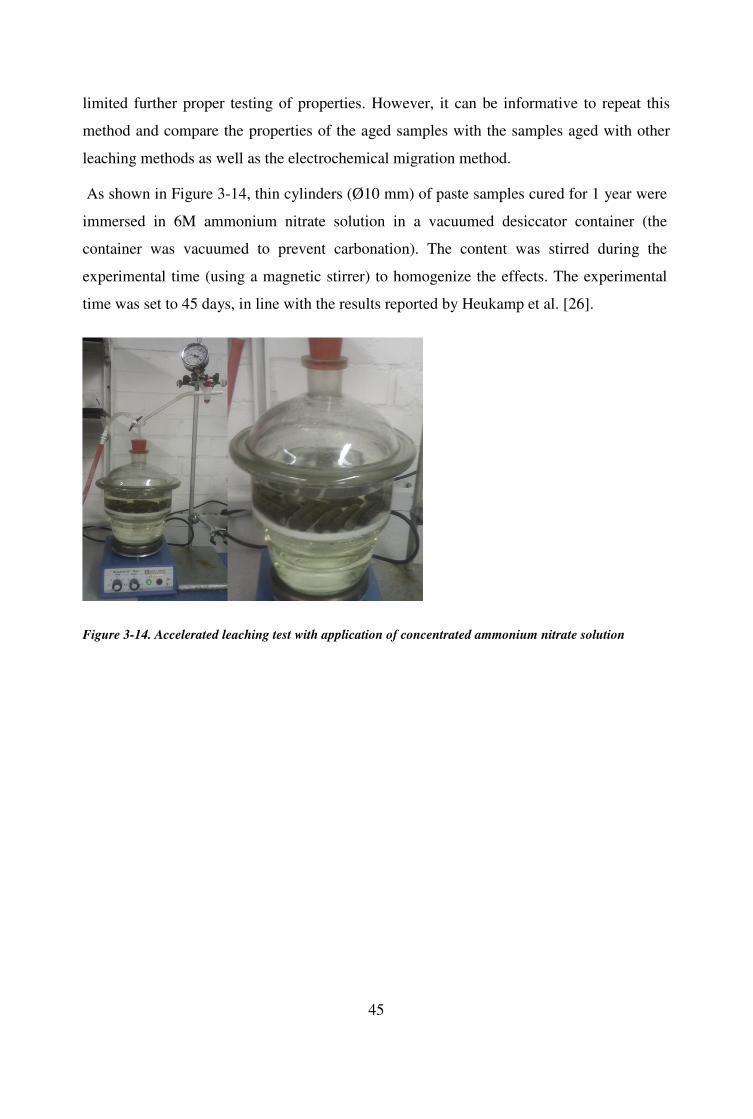
45
limited further proper testing of properties. However, it can be informative to repeat this
method and compare the properties of the aged samples with the samples aged with other
leaching methods as well as the electrochemical migration method.
As shown in Figure 3-14, thin cylinders (Ø10 mm) of paste samples cured for 1 year were
immersed in 6M ammonium nitrate solution in a vacuumed desiccator container (the
container was vacuumed to prevent carbonation). The content was stirred during the
experimental time (using a magnetic stirrer) to homogenize the effects. The experimental
time was set to 45 days, in line with the results reported by Heukamp et al. [26].
Figure 3-14. Accelerated leaching test with application of concentrated ammonium nitrate solution

46

47
4 Results and Discussions
The outcomes of this project are presented in the following. The results are categorized
with regard to the major goal of this study which is to study the various properties of
decalcified cementitious materials. It was noted in the previous chapter that in order to
reach this goal an important part of the study was to develop a test method to produce
decalcified cementitious specimens of flexible size.
The set-up design of the method was presented in the previous chapter and it was noted that
the method is applicable for samples of variable size. The efficiency of the method in
calcium migration was demonstrated and the novelty of the method accelerating both
dissolution and diffusion processes involved in decalcification of cementitious materials
was discussed. In this chapter, the results of through characterization of leached specimens
with respect to instrumental analysis results are presented. Also, the changes in chemical,
mineralogical, physical, transport and mechanical properties of calcium leached specimens
produced with application of electrochemical migration method are discussed. The
characteristics of decalcified specimens produced with application of the electrochemical
migration method and the reference methods, are compared. The comparability of the
leached specimens is an indication of credibility of the electrochemical migration method.
Specifically the similarity with natural immersion test is of high importance. However, it
should be mentioned that detailed characterization of specimens leached with reference
accelerated leaching test methods is out of the scope of this study. As it was noted in
Chapter 2, these methods do not enable the leaching of specimens of flexible size and
consequently are not comparable with electrochemical migration method in this regard.
The chemical and physical characterization results can be found in Paper II and partially in
in Paper IV, V and VI. The results regarding changes in mechanical properties are
presented in Paper IV, V and VI. The changes in transport properties are presented in paper
VI and partially III and IV. Discussions regarding characteristics of specimens degraded
with natural immersion can be found in Paper V and VI.

48
4.1 Chemical and mineralogical properties of leached specimens
The LA-ICP-MS results, presenting the electrochemical migration induced longitudinal
changes in the Ca/Si-ratio of paste specimens as a function of leaching duration are
illustrated in Figure 4-1. As can be seen, the reference specimen had a relatively
homogeneous distribution of Ca/Si-ratio, which decreased with the propagation of the
leaching front from the cathodic side towards the anodic side. The longitudinal function of
changes in the Ca/Si-ratio propagated towards a relatively homogeneous leaching state in
time, which is the complete leaching of Portlandite. It should be noted that leaching of
Portlandite is also accompanied by phase changes in CSH gel.
The reference lines presenting the Ca/Si-ratio of the Portlandite leaching state as well as the
Ca/Si-ratio of CSH were calculated according to Table 3-2, as shown in the previous
chapter. As can be seen, after approximately 53 days of experimental time (1×10⁶
Coulombs), a Ca/Si-ratio close to complete leaching of Portlandite was obtained. As
mentioned in the previous chapter, 53 days of leaching is the proposed experimental time
for the electrochemical migration method. This means that in upcoming results and
discussions, the leaching state representing degraded specimens by utilizing the
electrochemical migration method corresponds to approximate leaching of Portlandite. In
addition, based on XRF analysis, the longitudinal changes in the Ca/Si-ratio of the
degraded specimen leached for 53 days are presented in Table 4-1. The results are
relatively comparable with the results from the ICP-MS analysis as shown in Figure 4-1.
The results also indicate that a depletion depth of 75 mm can be expected with the
application of the electrochemical migration method after 53 days of experimental time.
Considering the leaching experiments reported in the literature, Haga [27] have shown that
a depletion depth of maximum of 1.25 mm can be expected after 100 days of a natural
immersion test. In a similar experimental approach, Faucon [31] have shown that up to 60
days of natural leaching leads to 0.7 mm of dissolved thickness in exposed specimens. Also
according to investigations by Trägårdh and Lagerblad [9, 23] a leaching depth equal to 5-
10 mm can be expected after up to 100 years. Moreover, considering the results presented
by Carde and Francois [37], with the application of concentrated ammonium nitrate
solution a degraded thickness of 8 mm can be expected after 36 days of leaching.
Comparing these results with the depletion depths of 75 mm for the specimens leached with

49
the electrochemical migration method presented in this study, it is stablished that a
considerable acceleration rate can be obtained using the electrochemical migration method.
The changes in the Ca/Si-ratio indicate possible changes in the calcium-containing phases
in HCP. XRD analysis results presented in Figure 4-2, illustrate the crystallographic
changes caused by leaching. As can be seen, the most apparent change is that the
Portlandite peaks had disappeared in leached samples.
Figure 4-1. Longitudinal LA-ICP-MS results (considering 250 mA of constant current for a paste
specimen of Ø50×75 mm)

50
Table 4-1. XRF analysis results (The aged paste sample had been leached for 53 days.)
% weight SiO2 Al2O3 Fe2O3 MnO MgO CaO K2O SO3 Ca/Si
Reference 16.8 2.8 3.6 0.2 0.6 49.5 0.5 1.1 3
Ag
ed s
am
ple
(D
ista
nce
fr
om
an
od
ic s
ide)
0-15 17.2 2.9 3.6 0.2 0.6 37.4 0.0 0.9 2.2
15-30 19.2 3.3 4.0 0.2 0.6 40.6 0.0 0.6 2.1
30-45 20.9 3.5 4.3 0.2 0.8 36.9 0.0 1.2 1.8
45-60 21.4 3.7 4.4 0.3 0.7 33.6 0.0 0.6 1.6
60-75 20.2 3.4 4.2 0.2 0.8 27.2 0.0 0.8 1.4
Figure 4-2. XRD analysis results comparing the un-leached reference and the leached sample. (The aged
paste sample had been leached for 53 days.)
10 20 30 40 50 60 70
CHCH
CH
ET ET
ET
600
300
150
450
Reference cement paste
CSH
Calcium leached sample
CH:Portlandite ET:Ettringite
CSH
10 20 30 40 50 60 70
150
Si
Si: silicon powder aded to the sample
Si
SiCH

51
To account for the credibility of XRD results, TGA analysis were conducted and the
results are shown in Figure 4-3. As can be seen, the reference sample exhibits a mass
change at approximately 400°C, which is the assigned peak to Portlandite [87]. However,
thermogravimetric changes in the leached sample do not show any Portlandite peak. The
preferential leaching of Portlandite, as stated in Chapter 2, has also been reported in the
available leaching assessments in the literature [27, 42, 88].
Figure 4-3. TGA analysis comparing changes in temperature-induced mass changes in cement paste
samples due to leaching. (The aged paste sample had been leached for 53 days.)
In addition, Figure 4-4 illustrates comparable thermogravimetric outcomes for leached
mortar and concrete samples. This indicates that leaching of Portlandite with the
application of the electrochemical migration method was not affected by the addition of
aggregates in the cementitious specimens.
4.2 Physical properties of leached specimens
4.2.1 Pore structure and specific surface area
The visual changes in the pore structure of leached paste specimens are illustrated in Figure
4-5. It can clearly be seen that the degraded samples are considerably more porous than the
reference samples. Moreover, the Portlandite crystals can be found in the reference samples
while crystalline phases cannot be seen in the images representing leached samples.
A more detailed assessment of the changes in pore structure and the distribution of pore
sizes are presented in Figure 4-6 with regard to mercury intrusion and N2 adsorption
analysis. As can be seen, the mercury intrusion results indicate changes in the larger pores
(capillary pores) and the N2 adsorption results show changes even in gel pores. The results
indicate a considerable increase in pore volume due to leaching. As shown, a major
0
0,1
0,2
0,3
0,4
60
70
80
90
100
0 200 400 600 800 1000
We
igh
t %
Temp
Der
iva
tiv
e W
eig
ht
(%/°
C)
Portlandite
0
0,1
0,2
0,3
0,4
60
70
80
90
100
0 200 400 600 800 1000
We
igh
t %
Temp
Der
iva
tiv
e W
eig
ht
(%/°
C)
Reference cement paste Leached with Electrochemical migration

52
increase in capillary pores happens for pores of size approximately 200 nm. This has also
been shown by Haga (2005).
Figure 4-4. TGA analysis comparing changes in temperature-induced mass changes in concrete and
mortar samples due to leaching. (The aged samples had been leached for 53 days.)
Figure 4-5. SEM images from reference and leached paste samples. (The aged paste sample had been
leached for 53 days.)
0,00
0,01
0,02
95
96
97
98
99
100
0 200 400 600 800 1000
Ma
ss %
Temperature
Der
iva
tiv
e W
eig
ht
%/°
C
0,00
0,01
0,02
0,03
0,04
90
92
94
96
98
100
0 200 400 600 800 1000
Ma
ss %
Temperature
Der
iva
tiv
e W
eig
ht
%/°
C
0,00
0,01
0,02
95
96
97
98
99
100
0 200 400 600 800 1000
Ma
ss %
Temperature
Dei
va
tiv
e W
eig
ht
%/°
C
0,00
0,01
0,02
0,03
0,04
90
92
94
96
98
100
0 200 400 600 800 1000
Ma
ss %
Temperature
Der
iva
tiv
e W
eig
ht
%/°
C
Reference Concrete Leached Concrete
Reference Mortar Leached Mortar

53
Another important point is the 50 nm pores. The results reported by Haga (2005) indicate a
lower pore volume in this pore size for the leached sample than in the reference material.
However, Figure 4-6 indicates relatively similar pore volume for this pore size before and
after aging with electrochemical migration method. The results presented in Figure 4-7 can
clarify this difference. The figure shows that the pore volume assigned to this pore size in
the samples leached for 25 or 35 days is actually lower than the reference, which is
comparable to the results presented by Haga (2005). since a decrease in pore volume can
be due to precipitation, the results indicate that the probable leaching-induced
precipitations also occur when using the electrochemical migration method, however, with
longer leaching time these precipitations are also leached out.
Figure 4-6. Pore size distribution results: mercury intrusion and N2 adsorption analysis. (The aged paste
sample had been leached for 53 days.)
Moreover, the N2 adsorption results, Figure 4-6, indicate a considerable increase in gel
pores. Although the contribution of the changes in pore volume of the gel pores is
considered to be negligible in total pore volume increase [27, 36], a greater gel pore volume
0
0,05
0,1
0,15
0,2
0,25
0,3
0,35
1 100 10000 1000000Log
Dif
fere
nti
al
Pore
Volu
me
(ml/
g)
Pore size (nm)
Reference
Leached
00,050,1
0,150,2
0,250,3
0,350,4
0,450,5
1 100 10000 1000000
Cu
mu
lati
ve
Pore
Vo
lum
e (m
l/g)
Pore size (nm)
Reference
Leached
0
0,05
0,1
0,15
0,2
0,25
0,3
0,35
1 10 100 1000Log
dif
fere
nti
al
Po
re V
olu
me
(ml/
g)
Pore Size (nm)
Reference
Leached
0
0,05
0,1
0,15
0,2
0,25
0,3
1 100
Cu
mu
lati
ve
Pore
Vo
lum
e (m
l/g)
Pore Size (nm)
Reference
Leached
Mer
cury
In
tru
sion
N2
ad
sorp
tion
54
indicates changes in other parameters such as specific surface area. BET analysis results
indicate that leaching causes an increase of approximately 80% in specific surface area of
cementitious materials. This is in agreement with the results presented by Chen et al. [89]
indicating that a near doubling of specific surface area is expected due to decalcification of
cementitious materials with changes in Ca/Si-ratio from 3 down to 1.1. It should be noted
that the deviations in measured specific surface area by BET is a known disturbing
phenomena as reported in literature [51], specifically due to the effect of the drying
condition of sample prior to the analysis. However, this matter should not influence the
conclusions in this study as all sets of measurements were carried out under the same
conditions and showed similar specific surface areas for degraded specimens with both
electrochemical and natural leaching methods with values higher than that of reference
sample.
A plausible explanation for the increase in specific surface area is the changes in
characteristics of the scale of gel pores due to silicate polymerizations in the CSH gel. It
has been reported in the literature that due to leaching, the Ca/Si-ratio of CSH gel gradually
decreases and iron or aluminum ions dissolved from Ettringite and AFm phases can
incorporate into the CSH [30, 31, 42, 88]. As also stated in Chapter 2, a higher specific
surface area in the CSH gel indicates the presence of available adsorption sites for other
ions, such as aluminum and iron.
The NMR results are presented in Figure 4-8 illustrating the changes in the structure of 29Si, thus representing the changes in the structure of CSH gel. As shown Q2 peaks are
increasing due to leaching. This indicates a higher degree of polymerization of silicates as
Q2 represents a longer chain structure. The Q1 and Q2 peaks are located according to a
study by Rawal et al. [90]. Silicate polymerization as a phenomenon caused by
decalcification has been reported in literature as an outcome of decalcification of
cementitious materials [89, 91].
Changes in gel pore volumes, specific surface area and structure of silicates are all
indicating that the leaching of Portlandite is accompanied by decalcification of CSH gel. As
mentioned previously, this phenomenon is noted in literature by Adenot and Buil [42].

55
Figure 4-7. Pore size distribution results: mercury intrusion analyses. (The aged paste sample had been
leached for 25 and 35 days.)
Figure 4-8. NMR results: the changes in structure of 29Si after leaching
4.2.2 Freezable water
Table 4-2, presents the colorimetric results which indicate changes in the freezing ability of
the water content in specimens subjected to leaching. Colorimetri analysis are reported in
the literature to account for freezable water in porous cementitious materials as an
indication of pore size distribution [92-94]. A larger portion of freezable water indicates a
larger pore system, because the water in gel pores requires very low temperatures to freeze.
0
0,05
0,1
0,15
0,2
0,25
0,3
0,35
1 100 10000 1000000
Lo
g d
iffe
ren
tia
l p
ore
vo
lum
e (m
l/g
)
Pore size (nm)
Reference
Leached for 25 days
Leached for 35 days
-110-100-90-80-70-60
ppm
Reference
ElectrochemicallyLeached
Q1 Q2

56
The results presented in Table 4-2 include the thawing energy obtained from colorimetric
results, the freezable water calculated according to the thawing energy and heat of fusion of
water as well as maximum possible heat calculated according to the total water content of
specimens and heat of fusion of water. Also four parameters: A, B, C and J1/J2 are defined
in that table. Parameter A, B and C are the total, frozen and un-frozen water content in the
specimens normalized with regard to the dry weight of the specimens. The J1/J2 parameter
is the ratio of thawing heat to maximum heat, which is an indication of the freezing ability
of water. As can be seen in Table 4-2, higher B values for leached specimens show that
more water was frozen in leached specimens, which is due to higher capillary pore volume
in these specimens (Figure 4-6). Also the higher C values indicate more unfrozen water
exists in leached specimens, which is also due to the larger gel pore volume (Figure 4-6),
considering that the un-frozen water is the water in gel pores. However the increase rate of
B as shown is higher than C values indicating that leaching-induced changes in capillary
pores are more than in gel pores.
Table 4-2. Changes in freezing properties due to leaching
Material Dry weight
Total water
Thawing (J1)
Freezable water*
Max heat (J2)*
A=Total water/dry weight
B=frozen water/dry weight
C=un-frozen water/dry weight
Freezability (J1/J2)
Reference paste 17,13 5,62 841 2,52 1880 0,32 0,15 0,18 0,45
Leached paste 1 8,86 3,62 584 1,75 1209 0,4 0,20 0,21 0,48
Leaced paste 2 10,43 5,87 1216 3,64 1960 0,56 0,35 0,21 0,62
Reference mortar 18,11 2,05 371 1,11 684 0,11 0,06 0,05 0,54
Leached mortar 19,28 2,95 574 1,72 988 0,15 0,09 0,06 0,58
*Freezable water= J1/heat of fusion of water
*Max heat = water content*heat of fusion of water (334 J/g)
Accordingly the J1/J2-ratio indicates higher freezing ability in leached specimens. It should
be noted that there is a considerable deviation in the results comparing leached sample 1
and 2, which requires further investigations to draw concrete conclusions regarding the
quantified rate of changes.

57
4.3 Transport properties of leached specimens
4.3.1 Adsorption and diffusion
The results of the adsorption test are illustrated in Figure 4-9, and indicate that the free
concentrations of cesium ions in the mixtures containing the leached cement paste were
considerably lower than the mixtures that contained the reference samples. This implies
that the aged cementitious materials have a greater binding potential, which is in agreement
with the findings previously reported by Ochs et.al [17]. A plausible explanation for the
enhanced adsorption of Cs+ ions in the aged samples is that when almost all alkali ions and
a large portion of the Ca2+ ions have been removed during the leaching process, a large
number of negatively charged adsorption sites of silicates are made available for Cs+ ions.
On the other hand, in the case of pristine materials, the available adsorption sites for Cs+
ions are fewer because a large portion of these sites have already been occupied by Ca2+,
Na+ or K+ ions. This is also in agreement with the measured higher specific surface area of
the aged samples, as presented in Figure 4-8.
Figure 4-9. Adsorption test results
The effect of leaching on the transport properties of cementitious materials is not only due
to changes in adsorption properties, but also due to changes in the ionic diffusion and pore
structure of cementitious specimens [40]. The diffusion cell test results demonstrating the
combined effect of changes in pore volume, diffusion and adsorption on ionic transport
properties are presented in Figure 4-10. In this figure, the accumulated concentration of
0
1
2
3
4
5
6
7
8
Start 2 weeks 6 weeks
Co
nce
ntr
ati
on
of
free
Ces
ium
io
ns
(pp
m)
0.3 ppm, Aged 0.3 ppm, REF
1 ppm, Aged 1 ppm, REF
5 ppm, Aged 5 ppm, REF

58
diffused ions has been plotted as a function of time. As shown in the figure, the diffusion
rates were higher for all the ions in the aged specimens than in the reference material.
Owing to the fact that the aged specimens have a higher porosity, as demonstrated in
previous sections, a higher diffusion rate can reasonably be expected. Also shown in Figure
4-10 (a), is that the diffusion rate of Cs+ ions in an aged sample is similar to that of the Na+
ions in a comparable sample. However, this is in contradiction to the diffusion rate in a
pure salt solution in which the diffusion coefficient of Cs+ ions is higher than that of the
Na+ ions (for a concentration of ~ 4 mol/dm3, diffusion coefficients of 0.941 and 1.660 m2/s
are reported for NaCl and CsCl solutions respectively [95]). This may be explained by the
enhanced adsorption of Cs+ ions on the surfaces of the aged specimens, which has been
demonstrated to be caused by less competition between Cs+ and other ions for occupying
the free negative sites [17]. Furthermore, considering the higher degree of hydration of the
Na+ ions compared with Cs+ ions [80], the binding potential for Na+ ions can be expected to
be weaker. This implies that although free negative sites are available after the degradation
of cementitious materials, a strong ionic binding potential is needed to fill these sites and
this potential is higher for cesium ions than for sodium ions. As a result, the greater
adsorption potential of Cs+ ions decreases the diffusivity of these ions in degraded samples.
In contrast, plot (b) in Figure 4-10, shows that the rate of diffusion for Cs+ ions was
relatively higher than the rate of diffusion for Na+ ions in 0.5 M solutions. The
discrepancies between 0.05 and 0.5 M solutions can be explained according to the effect of
ionic concentration on binding. In a 0.05 M solution, the diffusion of Cs+ ions decreases in
comparison with a pure ionic solution and becomes nearly equal to the diffusion of Na+
ions due to the stronger adsorption at the negatively charged surfaces, plot (a). However, in
a 0.5 M solution, ionic diffusion overcomes these adsorption effects due to higher
concentration gradients and as a result the diffusion of Cs+ ions will not be affected by the
adsorption effect, plot (b).Similarly, the difference between the diffusion rates of Cl- ions in
a CsCl solution and a NaCl solution will be lower in 0.05 M solutions, plot (c), than in 0.5
M solutions, plot (d). This indicates that if the diffusion coefficient of Cs+ ions is reduced
owing to the adsorption effect, the diffusion coefficient of Cl- ions will also be affected.
This is because the diffusion of cations and anions is highly coupled to maintain the
electro-neutrality of the system. Therefore, a lower rate of Cs+ ions will cause a decrease in
the diffusion of chloride ions as well.

59
Figure 4-10. Diffusion cell test results: changes in ionic transport properties due to leaching
As presented in Figure 4-11 and paper III, it should be noted that, the changes in ionic
concentration in the solution affect the ionic diffusion coefficients. It is shown in the figure
that the diffusion coefficient of cations and anions differed by approximately an order of
magnitude. Moreover, the diffusion coefficient value decreased (in most of cases) due to an
increase in the ionic concentration of the upstream cell, which is logical, due to the friction
effects between ions.
0
0,5
1
1,5
2
2,5
1 10 100
mM
Dow
nst
ream
Time (days)
Plot (a): Cations, 0.05 M solution
CsCl, Aged
NaCl, Aged
CsCl, REF
NaCl, REF
0
5
10
15
20
25
30
35
40
45
50
1 10 100
mM
dow
nst
ream
Time (days)
Plot (b): Cations, 0.5 M solutions
CsCl, Aged
NaCl, Aged
CsCl, Ref
NaCl, Ref
0
1
2
3
4
5
6
7
8
9
1 10 100
mM
dow
nst
ream
Time (days)
Plot (c): Chloride, 0.05 M solutions
CsCl, Aged
NaCl, Aged
CsCl, Ref
NaCl, Ref
0
10
20
30
40
50
60
70
80
90
1 10 100
mM
dow
nst
ream
Time (days)
Plot (d): Chloride, 0.5M solutions
CsCl, Aged
NaCl, Aged
CsCl, REf
NaCl, Ref

60
Figure 4-11. The effect of ionic concentration of upstream cell on ionic diffusion coefficient
4.3.2 Gas permeability and capillary water absorption
The capillary water absorption results representing the changes in the pore structures of the
specimens are presented in Figure 4-12. As shown in the figure, capillary water absorption
increased in the calcium-depleted specimens compared with the pristine material to a large
extent. Considering the presented results, it can be inferred that the capillary water
absorption in 24 hours increased by a factor of 4 and 2 for calcium-depleted specimens with
W/C-ratios of 0.48 and 0.62, respectively. In addition, the difference in capillary water
absorption between the aged specimens with different water cement ratios is relatively less
than that of between reference specimens. A plausible explanation is that after leaching the
pore structure becomes comparable in decalcified specimens no matter which initial W/C-
ratios they had (it should be noted that according to Table 3-3 the paste volume is the same
for specimens with different W/C-ratios). The change in the gas permeability coefficient,
which is another representative parameter for the pore volume of cementitious materials, is
presented in Figure 4-13. It is seen that the gas permeability in the calcium-depleted
specimens was more than 10 times higher than that in the pristine material. This can also be
explained by the larger pore volume in the specimens after decalcification.
0,0
0,5
1,0
1,5
2,0
2,5
0 0,2 0,4 0,6
Sta
dy
-sta
te-d
iffu
sion
Co
effi
cien
t (×
10
-12 m
2/s
)
Upstream solution concentartion (Molar)
Cl in LiCl
Cl in NaCl
Li in LiCl
Na in NaCl

61
Figure 4-12. Capillary water absorption in square root of time for concrete specimens with W/C-ratios of
0.48 and 0.62 before and after leaching
Figure 4-13. Gas permeability coefficient K as a function of applied absolute gas pressure P for concrete
specimens with W/C-ratios of 0.48 and 0.62 before and after leaching
4.4 Mechanical properties of leached specimens
The mechanical properties of the concrete specimens are presented in Table 4-3. As can be
seen, the average tensile strength for the specimens with a W/C-ratio of 0.48 has been
reduced by up to approximately 70% due to calcium depletion, whereas the reduction in
tensile strength for the specimen with a W/C-ratio of 0.62 was about 55%. Interestingly,
the strength of the Ca-depleted specimens is very similar regardless of the W/C-ratios of
the original specimens. Interestingly the strength reduction factors are comparable to
0
1000
2000
3000
4000
5000
6000
7000
0 50 100 150 200 250 300 350 400 450
Wa
ter
ad
sorp
tio
n p
er u
nit
are
a
(g/m
2)
√t (√seconds)
W/C=0.48 REF
W/C=0.62 REF
W/C=0.48 Aged
W/C=0.62 Aged
1E-18
1E-17
1E-16
1E-15
0,12 0,17 0,22 0,27
K (
m2)
P (MPa)
W/C=0.48 REF
W/C=0.62 REF
W/C=0.48 Aged
W/C=0.62 Aged

62
capillary water absorption increased factors. However, it should be noted that the
repeatability of such similar factors should be further investigated to draw more concrete
conclusions. The changes in the compressive strength of the mortar and paste specimens
are also presented in Table 4-4. As can be seen, a relatively similar residual strength level
is reached for paste and mortar specimens after leaching. The lower residual strength level
in mortar and paste specimens compared to concrete specimens is due to larger paste
portion in these specimens which is affected by leaching phenomenon.
Table 4-3. Average tensile and compressive strengths of concrete specimens
Tensile strength (MPa) Compressive strength (MPa)
Ref Aged % decrease Ref Aged % decrease
W/C=0.48 10.2 ± 0.1 2.8± 0.1 72 43± 0.3 12.7± 0.1 70
W/C=0.62 5.5± 0.5 2.5± 0.1 55 30± 0.1 12.7± 0.1 58
Table 4-4. Average compressive strength results for mortar and paste specimens
Compressive Strength (MPa)
W/C Ref Aged % decrease
Mortar 0.5 38.8± 0.3 9.9± 0.3 74
Paste 0.5 21.6± 0.2 9.5± 0.1 56
The presented outcomes are in good agreement with the conclusions presented by Carde et
al. (1996). In their study, they showed that the loss of strength due to the complete removal
of Portlandite can be up to 70%. It has also been shown that the main contribution to the
changes in strength properties is due to the leaching of Portlandite, and that the effect of
CSH degradation is negligible [12, 36, 37]. An increase of up to 50 % in total pore volume
of leached paste samples was demonstrated in the previous section, which clearly justifies
the changes in strength properties. This indicates that when leaching propagates towards an
approximate complete leaching of Portlandite, because of similar obtained pore structures,
comparable strength properties can be expected in samples with different initial W/C-
ratios.

63
Further, the Elastic modulus of the specimens, obtained as the slope of the stress-strain
curves, is presented in Figure 4-14. As shown in the figure, the elastic modulus was
reduced by up to 40% in both concrete specimens due to leaching.
Figure 4-14. Stress-strain curves
To confirm these results, the obtained elastic modulus in terms of fundamental longitudinal
frequency is also presented in Table 4-5. The results demonstrate that the reduction factor
of elastic modulus due to leaching is comparable between all the cementitious materials,
despite their initial W/C-ratios.
Table 4-5. Resonant frequency and calculated E-modulus of the reference and aged specimens
F (kHz) E (GPa) Decrease%
Co
ncr
ete
Ref Aged Ref Aged
W/C=0.48 27.4 21.6 46.5 24.1 48
W/C=0.62 29.3 22.1 46.5 24.6 47
Mortar W/C=0.5 25.7 17.6 30.4 15.18 50
Paste W/C=0.5 17.6 13.2 11.4 6.24 45
05
1015202530
0 0.1 0.2 0.3 0.4 0.5 0.6S
tres
s (M
Pa
)Strain (%)
Aged, W/C=0.62
05
1015202530
0 0.1 0.2 0.3 0.4 0.5 0.6
Str
ess
(MP
a)
Strain (%)
Aged, W/C=0.48
����~30 ��
05
1015202530
0 0.2 0.4 0.6
Str
ess
(MP
a)
Strain (%)
REF, W/C=0.62
����*~ 50 ��
0
5
10
15
20
25
30
0 0.1 0.2 0.3 0.4 0.5 0.6
Str
ess
(MP
a)
Strain (%)
REF, W/C=0.48

64
4.5 Comparability of leached specimens with degraded
specimens leached with reference leaching methods
Figure 4-15 shows the longitudinal ICP-MS line scans that illustrate the changes in the
Ca/Si-ratio for the specimens leached with the natural immersion test. The scanned lines as
well as the leaching fronts are also illustrated in Figure 4-16. The results represent 2 and
3.5 years of leaching time. A comparison of Figure 4-15 with Figure 4-1 shows that the
shape of the leaching front is comparable in the specimens leached with both natural
immersion and electrochemical migration method.
As shown in Figure 4-16, the Ca/Si-ratio representative curve has been categorized into 4
zones. In Zones 1 and 2, the Ca/Si-ratio shows that the Portlandite has been leached.
However, in Zone 2 there is a gradient in the Ca/Si-ratio for the specimen leached for 2
years, and the Ca/Si-ratio increased in Zone 3. This indicates that the leaching front, after 2
years of leaching, is approximately up to Zone 2 (=6 mm) which propagates to 11 mm after
3.5 year.
Figure 4-15. LA-ICP-MS analysis of specimens leached with the natural immersion test
1
1,5
2
2,5
3
3,5
0 1 2 3 4 5 6 7 8 9 10 11 12 13 14 15
Ca/S
i
length (mm)
Zone 3 Zone 4
1
1,5
2
2,5
3
3,5
0 1 2 3 4 5 6 7 8 9 10 11 12 13 14 15
Ca
/Si
length (mm)
Zone 1 Zone 2
2 y
ears
of
lea
chin
g3.5
yea
rsof
leach
ing
Ca/Si Ref
Ca/Si CSH
Ca/Si CH leached *
*Ca/Si CH leached: Ca/Si ratio corresponding to Ca/Si CSH + other hydrates after leaching of portlandite
Ca/Si Ref
Ca/Si CSH
Ca/Si CH leached *

65
Figure 4-16. Visual leaching front and ICP-MS scan lines for specimens leached with the natural
immersion test
The demonstration of the preferential leaching of Portlandite in the specimens with a
leaching front of 6 and 10 mm after 2 and 3.5 years of leaching, respectively, is presented
in Figure 4-17. The temperature-induced mass changes did not indicate any Portlandite
peak in the leached samples.
Figure 4-17. Thermogravimetric analysis of samples leached for 2 and 3.5 years with the natural
immersion test compared with un-leached reference material.
0
0,1
0,2
0,3
0,4
60
70
80
90
100
0 200 400 600 800 1000
Wei
gh
t %
Temp
Der
iva
tive
Wei
gh
t (%
/°C
)Portlandite
0
0,1
0,2
0,3
0,4
60
70
80
90
100
0 200 400 600 800 1000
Wei
gh
t %
Temp
Der
iva
tiv
e W
eig
ht
%/°
C
0
0,1
0,2
0,3
0,4
60
70
80
90
100
0 200 400 600 800 1000
Wei
gh
t %
Temp
Der
iva
tiv
e W
eigh
t %
/°C
Reference cement paste
Natural leaching for 2 years Natural leaching for 3.5 years

66
The results concerning the preferential leaching of Portlandite in samples leached with
other reference accelerated leaching methods are presented in Figure 4-18. As can be seen,
all methods are enabling the preferential leaching of Portlandite. However, it should be
noted that as the leaching level is different in these samples, no other conclusion rather than
comparability in preferential leaching of Portlandite concerning the leaching function of
these methods is made.
.
Figure 4-18. XRD results for decalcified cement paste samples leached with proposed accelerated leaching
methods in literature and electrochemical migration method.
Moreover, as mentioned the progression of degradation in CSH gel is determined with
respect to NMR results for 29Si, representing changes in the structure of calcium silicate
hydrates after. The sample for analysis of the changes in naturally leached specimens were
taken from outer most 2 mm of the leaching front and the case of electrochemically leached
specimens the sample represents the obtained 75 mm depletion front after 53 days of
leaching. As shown in Figure 4-19, the Q1 peaks are decreasing for both leached samples
while the increase in the intensity of Q2 peaks indicates polymerization of silicates (longer
chains [91]). This demonstrates the comparability of decalcified specimens leached with
both electrochemical and natural methods, in terms of changes in the structure of CSH gel.
Untreated cement paste
pH stat 8
Column test
Electrocheical migartion
Application of NH4NO3
CH
CH
CH
CH
CH

67
Figure 4-19. NMR results: the changes in structure of 29Si after leaching
Moreover, results from BET analysis (for similar samples as for NMR analysis), indicated a
significantly higher specific surface area in leached specimens degraded with both electro-
chemical migration and natural leaching methods. According to several sets of
experimental results the specific surface area was approximately 50, 90 and 85 m2/g for
reference, electrochemically leached and naturally leached samples, respectively.
Accordingly the comparability of leached specimens with both methods in terms of
changes in specific surface area is demonstrated.
-110-100-90-80-70-60
ppm
Reference
ElectrochemicallyLeached
3,5 yearsNatural leaching
Q1 Q2

68

69
5 Conclusions
The effect of decalcification on the properties of cementitious materials was investigated.
The aim was to provide experimental databases to improve predictions regarding the
functionality of cementitious barriers in nuclear waste repositories. To fulfill the lack of a
sufficient accelerating test method to produce degraded cementitious specimens of flexible
size, the electrochemical migration method was developed. The manufactured decalcified
specimens were characterized with respect to chemical, mineralogical, physical, transport
and mechanical properties. The comparability of properties with the characteristics of
specimens produced with natural immersion was investigated and further possibilities for
continued research are accounted for. The concluding remarks are presented below.
I. Electrochemical migration test method
The electrochemical migration method as a test method that accelerates the decalcification
of cementitious materials was developed and a recommended test procedure was proposed
in this study. The acceleration was obtained as a result of higher dissolution rate of calcium
hydroxides, by application of ammonium nitrate, as well as faster transport of calcium ions,
by an external electrical field. The specific conclusions regarding this method are as
follows:
• With the application of the electro-chemical migration method the ageing of
cementitious materials is driven by the migration function at an ageing rate far
higher than that of the natural leaching rate.
• Calcium transport has an average transport number of 0.2, indicating that calcium
ions are available in the pore solution during the leaching period and at least 20% of
the applied charge is carried by these ions.
• The method can enable leaching of specimens of flexible sizes, and the addition of
aggregates does not interfere with the leaching process.
• Leaching level can be predicted by monitoring the leached calcium content in
catholyte solution.
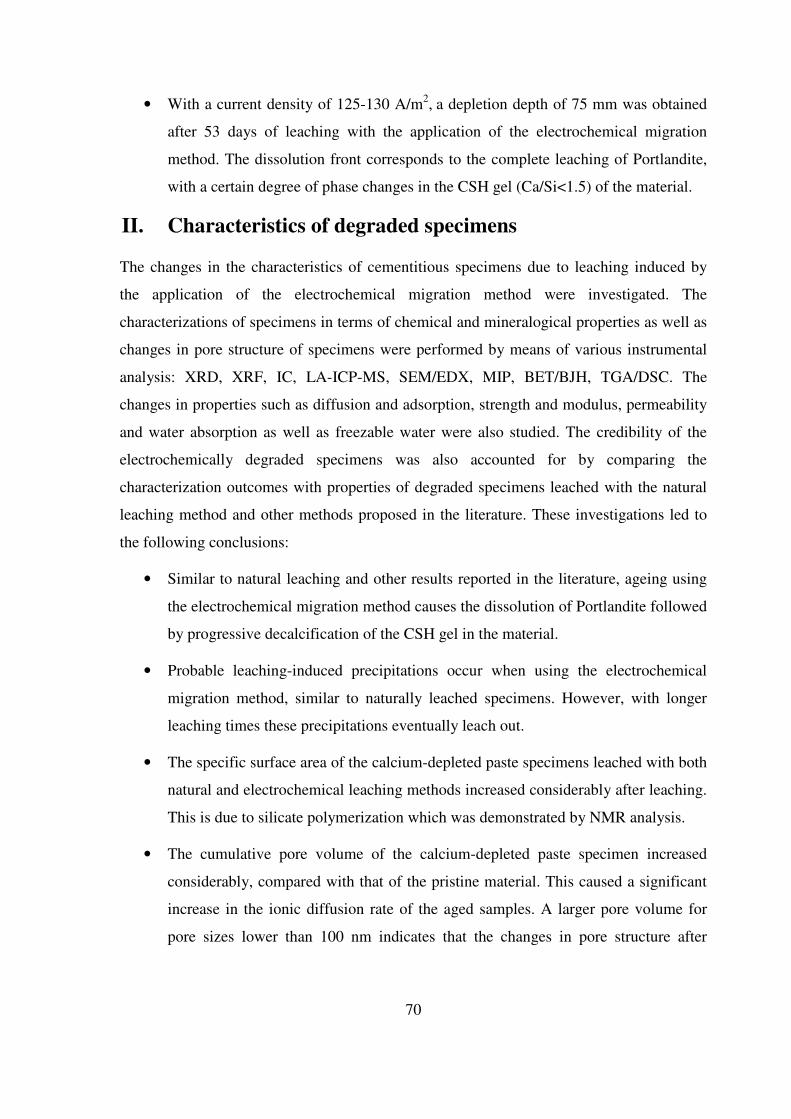
70
• With a current density of 125-130 A/m2, a depletion depth of 75 mm was obtained
after 53 days of leaching with the application of the electrochemical migration
method. The dissolution front corresponds to the complete leaching of Portlandite,
with a certain degree of phase changes in the CSH gel (Ca/Si<1.5) of the material.
II. Characteristics of degraded specimens
The changes in the characteristics of cementitious specimens due to leaching induced by
the application of the electrochemical migration method were investigated. The
characterizations of specimens in terms of chemical and mineralogical properties as well as
changes in pore structure of specimens were performed by means of various instrumental
analysis: XRD, XRF, IC, LA-ICP-MS, SEM/EDX, MIP, BET/BJH, TGA/DSC. The
changes in properties such as diffusion and adsorption, strength and modulus, permeability
and water absorption as well as freezable water were also studied. The credibility of the
electrochemically degraded specimens was also accounted for by comparing the
characterization outcomes with properties of degraded specimens leached with the natural
leaching method and other methods proposed in the literature. These investigations led to
the following conclusions:
• Similar to natural leaching and other results reported in the literature, ageing using
the electrochemical migration method causes the dissolution of Portlandite followed
by progressive decalcification of the CSH gel in the material.
• Probable leaching-induced precipitations occur when using the electrochemical
migration method, similar to naturally leached specimens. However, with longer
leaching times these precipitations eventually leach out.
• The specific surface area of the calcium-depleted paste specimens leached with both
natural and electrochemical leaching methods increased considerably after leaching.
This is due to silicate polymerization which was demonstrated by NMR analysis.
• The cumulative pore volume of the calcium-depleted paste specimen increased
considerably, compared with that of the pristine material. This caused a significant
increase in the ionic diffusion rate of the aged samples. A larger pore volume for
pore sizes lower than 100 nm indicates that the changes in pore structure after

71
degradation occur not only in the larger pores but also in the gel pores of the
material.
• The aged cementitious samples exhibited a higher binding potential for Cs+ ions. As
almost all the alkali ions and a large portion of the Ca2+ ions had been leached from
the sample, a large number of negatively charged adsorption sites were created for
Cs+ ions.
• The combined effect of binding potential, porosity and ionic diffusion should be
considered when assessing the transport properties of ions.
• Leaching of Portlandite causes considerable changes in the physical and mechanical
properties of concrete specimens, primarily due to an increase in pore volume. This
would cause up to a 70% decrease in the mechanical strength and 40% decrease in
the elastic modulus of the material.
• The larger pore volume that occurs after calcium depletion in concrete specimens
causes more than 10 times higher gas permeability and at least a 3 times higher
chloride migration rate.
• The properties of the concrete specimens after complete leaching of Portlandite
were found to be similar no matter which initial water cement ratios the specimens
had. This is, to a great extent, due to similar pore structures in the concrete
specimens after leaching.
• Leaching seems to increase the freezing ability of pore water in cementitious
materials. This could be due to the larger pore structure that occurs after leaching.
• The leaching front with the application of the electrical migration method was
similar to the leaching front in specimens leached with the natural immersion test in
terms of shape, preferential leaching of Portlandite and polymerization of silicates.

72

73
6 Future Work
The outcomes of this project can be further utilized to pinpoint the most important factors
to be considered in long-term predictions of the degradation caused by calcium leaching.
These outcomes and further detailed investigations can be used as databases for modeling
the leaching process of cementitious materials in long-term perspectives.
The electrochemical migration method has proven to be a very effective method for
producing samples of flexible size with a high leaching rate, however, similar to any other
acceleration method, further investigations are needed to confirm the comparability of the
produced degraded samples with naturally leached materials. Moreover, the ageing
function of the method and the acceleration rate are important parameters to be clarified.
Quantitative adsorption and diffusion tests for cementitious materials with better precision
are needed in order to supply accurate databases for service life modeling. Nevertheless,
producing aged specimens by the electrochemical acceleration method and simulating the
adsorption and diffusion process in several leaching levels are necessary steps before any
numerical modeling.
Further studies of degradation of CSH gel after complete leaching of Portlandite are needed
in order to predict the entire service life of repositories of nuclear waste.

74

75
7 Appendix: Recommended manual for
electrochemical migration test method
7.1 Scope
This manual demonstrates a step by step experimental procedure for applying the electro-
chemical migration method in order to produce calcium leached cylindrical cementitious
specimens of flexible sizes.
7.2 Apparatus
7.2.1.1 Sealants
7.2.1.1.1 Asphalt tape:
An asphalt tape (type BITUTHENE ) or a similar product providing elasticity should be
used to seal the curved surface of specimen. 200 mm width for the elastic tape is
recommended.
7.2.1.1.2 Plexiglas
A plexiglas tube with an outer diameter size similar to the specimen’s diameter is required.
7.2.1.1.3 Clamper
Stainless still clamper should be used
7.2.1.2 Electrodes
7.2.1.2.1 Anode
0.5 mm thick Titanium mesh, equipped with a plastic spacer
7.2.1.2.2 Cathode/plastic support
0.5 mm thick stainless steel plate and a plastic support prepared according to NT BUILD
492 [76]
7.2.1.3 Power supply
Capable of supplying a voltage of 100 V and a constant current of up to 1-2 A

76
7.2.1.4 Reservoirs
7.2.1.4.1 Catholyte reservoir
Plastic box with a capacity of at least 20 liters
7.2.1.5 REAGENTS
7.2.1.5.1 Anolyte
2 M Lithium Hydroxide
7.2.1.5.2 Catholyte
0.3 M ammonium nitrate
7.3 Test preparation
125-130 A/m2paste of current density should be applied to the specimen to reach to an
efficient leaching rate without inducing thermal damages.
Considering a paste specimen of size Ø50×75 mm as an example, with application of such
a current density, a current of 250 mA and a maximum potential of 100 volts is expected
which corresponds to 25 W of electrical power.
In order to calculate the needed current and expected potential and applied power:
1) Calculate the cross-sectional area of the specimen, A (m2)
2) Consider the volume percentage of the paste in the specimen, %VP
3) Calculate the cross-sectional area of the paste content: ×% � = �
4) Calculate the needed current: �() = � × 127
5) Start the test and read the potential on power supply
6) Calculate the power: � = × �
7) If P > 25 W decrease the current density by 75% and register the potential and
recalculate the power. Continue until the calculated power does not exceed 25 W.

77
7.4 Test procedure
1) Seal the cylindrical cementitious specimen with the asphalt tape and then tighten it
by the clampers.
2) The asphalt tape used to seal the curved surface of the specimen should be extruded
to provide an empty volume of about 200-300 ml to be used as the anolyte
reservoir, Figure 7-1.
3) In case of utilizing a specimen with a diameter larger than 50 mm it is
recommended to place a Plexiglas tube on top of the specimen according to Figure
7-2. The asphalt tape should be used to assemble them together while also sealing
the specimens curved surface and sealant should be tightened with the clampers.
4) Fill up to one third of the anolyte reservoir with a 2 M LiOH solution.
5) Place aside the assembled set-up for 5-10 minutes to check possibility of leakage.
In case of leakage, tight the clampers and wait for mere 10-15 minutes to make sure
there is no more leakage.
6) Fill the catholyte reservoir with 10 liters of 0.3 M ammonium nitrate solution.
7) Place the plastic support/cathode set-up inside the catholyte reservoir and place the
specimen on the plastic support according to Figure 7-3.
8) Insert the anode in to the anolyte reservoir.
9) Connect the anode to + pole and the cathode to the – pole of the power supply.
10) Adjust the current to the calculated required current (according to previous section)
and set it to constant.
11) If the initial potential is much higher than the calculated values, reduce the current
slowly to maintain a power lower than 25 W.
12) The regents should be recharged according to section 7.5.
13) The accumulated calcium content in the catholyte solution should be measured
frequently to account for the desired leaching state. For a current density of 125-
130 A/m2paste, approximately 53 days of experimental time is needed to reach to
complete leaching of Portlandite.

78
14) When the experimental time (the desired leaching state) is reached, the experiment
should be stopped and the specimens should be disassembled and sealed with a
thick parafilm.
Figure 7-1. sealant: asphalt tape.
Figure 7-2. sealing method for specimens of diameter larger than 50 mm.
Figure 7-3. location of the specimen and the set-up design for anode and cathod
dU, V DC
+-
Cathode (stainless steel)Plastic supportPlastic box
Plastic support for the anode
Anode
Specimen

79
7.5 Recharging reagents
Calculate the required quantities of the salts for every 24 hours of recharging according to:
Im
Im
LiOH
NONH
⋅=
⋅=
22
7134
where,
m: mass of substance (grams)
I: Applied Current (A)
The calculated amounts can be rounded up to a value that can be measured with precision
of 1 gram.

80

81
8 Bibliography
[1] A. Adamantiades, I. Kessides, Nuclear power for sustainable development: Current status and future prospects, Energy Policy, 37 (2009) 5149-5166.
[2] M.I. Ojovan, W.E. Lee, 20 - Nuclear Waste Disposal, in: M.I.O.E. Lee (Ed.) An Introduction to Nuclear Waste Immobilisation (Second Edition), Elsevier, Oxford, 2014, pp. 321-335.
[3] M. Atkins, F.P. Glasser, Application of portland cement-based materials to radioactive waste immobilization, Waste Management, 12 (1992) 105-131.
[4] C. Langton, D. Kosson, review of mechanistic understanding and modeling and uncertainty analysis methods for predicting cementitious barriers performance, 2009.
[5] U.R. Berner, Evolution of pore water chemistry during degradation of cement in a radioactive waste repository environment, Waste Management, 12 (1992) 201-219.
[6] E.J. Reardon, Problems and approaches to the prediction of the chemical composition in cement/water systems, Waste Management, 12 (1992) 221-239.
[7] E. Revertegat, C. Richet, P. Gégout, Effect of pH on the durability of cement pastes, Cement and Concrete Research, 22 (1992) 259-272.
[8] K. Yokozeki, K. Watanabe, N. Sakata, N. Otsuki, Modeling of leaching from cementitious materials used in underground environment, Applied Clay Science, 26 (2004) 293-308.
[9] J. Trägårdh, B. Lagerblad, Leaching of 90-year old concrete in contact with stagnant water, SKB Technical Report TR 98-11, Swedish Nuclear fuel and Waste management, 1998.
[10] A. Sellier, L. Buffo-Lacarrière, M.E. Gonnouni, X. Bourbon, Behavior of HPC nuclear waste disposal structures in leaching environment, Nuclear Engineering and Design, 241 (2011) 402-414.
[11] H. Saito, S. Nakane, S. Ikari, A. Fujiwara, Preliminary experimental study on the deterioration of cementitious materials by an acceleration method, Nuclear Engineering and Design, 138 (1992) 151-155.
[12] H. Saito, A. Deguchi, Leaching tests on different mortars using accelerated electrochemical method, Cement and Concrete Research, 30 (2000) 1815-1825.
[13] J.-S. Ryu, N. Otsuki, H. Minagawa, Long-term forecast of Ca leaching from mortar and associated degeneration, Cement and Concrete Research, 32 (2002) 1539-1544.
[14] J. Pommersheim, J. Clifton, Prediction of concrete service-life, Materials and Structures, 18 (1985) 21-30.
[15] W. Pfingsten, M. Shiotsuki, Modeling a Cement Degradation Experiment by a Hydraulic Transport and Chemical Equilibrium Coupled Code, Mat. Res. Soc. Symp, 1996.

82
[16] C.L. Page, Ø. Vennesland, Pore solution composition and chloride binding capacity of silica-fume cement pastes, Mat. Constr., 16 (1983) 19-25.
[17] M. Ochs, I. Pointeau, E. Giffaut, Caesium sorption by hydrated cement as a function of degradation state: Experiments and modelling, Waste Management, 26 (2006) 725-732.
[18] V.H. Nguyen, H. Colina, J.M. Torrenti, C. Boulay, B. Nedjar, Chemo-mechanical coupling behaviour of leached concrete: Part I: Experimental results, Nuclear Engineering and Design, 237 (2007) 2083-2089.
[19] H.S.a.S. Nakane, Comparison between Diffusion Test and Electromechanical Acceleration Test for Leaching Degradation of Cement Hydration Products, Materials Journal, 96 (1999) 208-212.
[20] N. Marinoni, A. Pavese, M. Voltolini, M. Merlini, Long-term leaching test in concretes: An X-ray powder diffraction study, Cement and Concrete Composites, 30 (2008) 700-705.
[21] Y. Maltais, E. Samson, J. Marchand, Predicting the durability of Portland cement systems in aggressive environments—Laboratory validation, Cement and Concrete Research, 34 (2004) 1579-1589.
[22] M. Mainguy, C. Tognazzi, J.-M. Torrenti, F. Adenot, Modelling of leaching in pure cement paste and mortar, Cement and Concrete Research, 30 (2000) 83-90.
[23] B. Lagerblad, Leaching Performance of Concrete Based on Studies of Sample from Old Concrete Constructions SKB Technical Report TR-01-27, Swedish Nuclear Fuel and Waste Management 2001.
[24] L.-O. Höglund, Project SAFE: Modeling of long-term concrete degradation processes in the Swedish SFR repository, SKB Report, Svensk Kärnbränslehantering AB, 2001.
[25] M. Hinsenveld, A Shrinkage Core Model as a Fundamental Representation of Leaching Mechanism in Cement Stablized Waste, Department of Civil and Environmental Engineering, University of Cincinnati, Cincinnati, OH, 1992.
[26] F.H. Heukamp, F.J. Ulm, J.T. Germaine, Mechanical properties of calcium-leached cement pastes: Triaxial stress states and the influence of the pore pressures, Cement and Concrete Research, 31 (2001) 767-774.
[27] K. Haga, S. Sutou, M. Hironaga, S. Tanaka, S. Nagasaki, Effects of porosity on leaching of Ca from hardened ordinary Portland cement paste, Cement and Concrete Research, 35 (2005) 1764-1775.
[28] A. Gordon, Safety analysis SFR 1, Long-term safety SKB Rapport R-08-130, December 2008.
[29] C. Gervais, A.C. Garrabrants, F. Sanchez, R. Barna, P. Moszkowicz, D.S. Kosson, The effects of carbonation and drying during intermittent leaching on the release of inorganic constituents from a cement-based matrix, Cement and Concrete Research, 34 (2004) 119-131.
[30] P. Faucon, P. Le Bescop, F. Adenot, P. Bonville, J.F. Jacquinot, F. Pineau, B. Felix, Leaching of cement: Study of the surface layer, Cement and Concrete Research, 26 (1996) 1707-1715.

83
[31] P. Faucon, F. Adenot, J.F. Jacquinot, J.C. Petit, R. Cabrillac, M. Jorda, Long-term behaviour of cement pastes used for nuclear waste disposal: review of physico-chemical mechanisms of water degradation, Cement and Concrete Research, 28 (1998) 847-857.
[32] G. Fagerlund, Predicting the service life of concrete structures, Engineering Foundation Conference on Characterization and Performance Prediction of Cement and ConcreteUnited Engineering Trustees, Inc., New York, 1983.
[33] M. Emborg, J.E. Jonasson, S. Knutsson, Long-term stability due to freezing and thawing of concrete and bentonite at the disposal of low and intermediate level nuclear waste in SFR 1 (in Swedish), SKB Technical Report R-07-60, Swedish Nuclear and Waste Management Company 2007.
[34] J. Clifton, Predicting the remaining service life of concrete, U.S. Department of Commerce, National Institute of Standards and Technology, Gaithersburg, USA, 1991.
[35] Y.S. Choi, E.I. Yang, Effect of calcium leaching on the pore structure, strength, and chloride penetration resistance in concrete specimens, Nuclear Engineering and Design, 259 (2013) 126-136.
[36] C. Carde, R. François, J.-M. Torrenti, Leaching of both calcium hydroxide and C-S-H from cement paste: Modeling the mechanical behavior, Cement and Concrete Research, 26 (1996) 1257-1268.
[37] C. Carde, R. François, Effect of the leaching of calcium hydroxide from cement paste on mechanical and physical properties, Cement and Concrete Research, 27 (1997) 539-550.
[38] C. Carde, G. Escadeillas, R. François, Use of ammonium nitrate solution to simulate and accelerate the leaching of cement pastes due to deionized water, Magazine of Concrete Research, 49 (1997) 295-301.
[39] C. Alonso, M. Castellote, I. Llorente, C. Andrade, Ground water leaching resistance of high and ultra high performance concretes in relation to the testing convection regime, Cement and Concrete Research, 36 (2006) 1583-1594.
[40] Y. Albinsson, K. Andersson, S. Börjesson, B. Allard, Diffusion of radionuclides in concrete and concrete-bentonite systems, Journal of Contaminant Hydrology, 21 (1996) 189-200.
[41] K.N.V. Adinarayana, P. Sasidhar, V. Balasubramaniyan, Modelling of calcium leaching and its influence on radionuclide migration across the concrete engineered barrier in a NSDF, Journal of Environmental Radioactivity, 124 (2013) 93-100.
[42] F. Adenot, M. Buil, Modelling of the corrosion of the cement paste by deionized water, Cement and Concrete Research, 22 (1992) 489-496.
[43] P. Domone, J. Illistone, Construction Materials, Their Nature and Behaviour, 4th. ed.2010.
[44] R.H. Bogue, Chemistry of Portland Cement Van Nostrand Reinhold, New York, 1995.
[45] T.C. Powers, Structure and Physical Properties of Hardened Portland Cement Paste, Journal of the American Ceramic Society, 41 (1958) 1-6.
[46] H.F.W. Taylor, cement chemistry, 1997.
[47] H.F.W. Taylor, Proposed structure for calcium silicate hydrate gel, Journal of the American Ceramic Society, 69 (1986) 464-467.

84
[48] E. Henderson, J.E. Bailey, Sheet-like structure of calcium silicate hydrates, Journal of Materials Science, 23 (1988) 501-508.
[49] I.G. Richardson, G.W. Groves, Models for the composition and structure of calcium silicate hydrate (CSH) gel in hardened tricalcium silicate pastes, Cement and Concrete Research, 22 (1992) 1001-1010.
[50] H. Van Damme, R.J.M. Pellenq, F.J. Ulm, Chapter 14.3 - Cement Hydrates, in: B. Faïza, L. Gerhard (Eds.) Developments in Clay Science, Elsevier2013, pp. 801-817.
[51] J.J. Thomas, H.M. Jennings, A.J. Allen, the surface area of hardened cement paste as measured by various techniques, Concrete Science and Engineering, 1 (1999) 45 - 64.
[52] P. Brown, J. Bothe Jr, The system CaO-Al2O3-CaCl2-H2O at 23±2 °C and the mechanisms of chloride binding in concrete, Cement and Concrete Research, 34 (2004) 1549-1553.
[53] P.W. Brown, S. Badger, The distributions of bound sulfates and chlorides in concrete subjected to mixed NaCl, MgSO4, Na2SO4 attack, Cement and Concrete Research, 30 (2000) 1535-1542.
[54] F. Barberon, V. Baroghel-Bouny, H. Zanni, B. Bresson, J.-B. d'Espinose de la Caillerie, L. Malosse, Z. Gan, Interactions between chloride and cement-paste materials, Magnetic Resonance Imaging, 23 (2005) 267-272.
[55] E.P. Nielsen, D. Herfort, M.R. Geiker, Binding of chloride and alkalis in Portland cement systems, Cement and Concrete Research, 35 (2005) 117-123.
[56] F.P. Glasser, A. Kindness, S.A. Stronach, Stability and solubility relationships in AFm phases: Part I. Chloride, sulfate and hydroxide, Cement and Concrete Research, 29 (1999) 861-866.
[57] P. Henocq, E. Samson, J. Marchand, Portlandite content and ionic transport properties of hydrated C3S pastes, Cement and Concrete Research, 42 (2012) 321-326.
[58] J.J. Beaudoin, V.S. Ramachandran, R.F. Feldman, Interaction of chloride and C�S�H, Cement and Concrete Research, 20 (1990) 875-883.
[59] L. Tang, L.-O. Nilsson, Chloride binding capacity and binding isotherms of OPC pastes and mortars, Cement and Concrete Research, 23 (1993) 247-253.
[60] O. L, Höglund, A.Bengston, Progress Report SFR 91-06, Some Chemical and Physical Progress Related to The Long-Term Performance of The SFR repository, KEMAKTA Consultants Co. Stockholm, October 1991.
[61] B.B. Hope, J.A. Page, J.S. Poland, The determination of the chloride content of concrete, Cement and Concrete Research, 15 (1985) 863-870.
[62] A.C. Garrabrants, F. Sanchez, D.S. Kosson, Changes in constituent equilibrium leaching and pore water characteristics of a Portland cement mortar as a result of carbonation, Waste Management, 24 (2004) 19-36.
[63] M.D. Cohen, Theories of expansion in sulfoaluminate - type expansive cements: Schools of thought, Cement and Concrete Research, 13 (1983) 809-818.
[64] P.K. Mehta, Mechanism of sulfate attack on portland cement concrete - Another look, Cement and Concrete Research, 13 (1983) 401-406.

85
[65] I. Odler, M. Gasser, Mechanism of sulfate expansion in hydrated Portland cement, Journal of the American Ceramic Society, 71 (1988) 1015-1020.
[66] M. Hinsenveld, A Shrinkage Core Model as a Fundamental Representation of Leaching Mechanism in Cement Stablized Waste, Doctoral Thesis, Department of Civil and Environmental Engineering, University of Cincinnati, Cincinnati, OH, 1992.
[67] ASTM C1308-95: Standard Test Method for Accelerated Leach Test for Diffusive Releases from Solidified Waste and a Computer Program to Model Diffusive, Fractional Leaching from Cylindrical Waste Forms, (2001).
[68] ANSI/ANS-16.1: Measurement of the Leachability of Solidified Low-Level Radioactive Wastes by a Short-Term Test Procedure.
[69] ISO/TS 21268-2:2007: Leaching procedures for subsequent chemical and ecotoxicological testing of soil and soil materials
[70] F.H. Wittmann, Corrosion of Cement-Based Materials under the Influence of an Electric Field, Materials Science Forum, 247 (1997) 107-126.
[71] G. Gustafson, Hagström, M. and Abbas, Z, Beständighet av cementinjektering, FOU.Väst Underhall av berganläggningar, Avd.f.geology och geoteknik, Chalmers teckniska högskola., 2008.
[72] O. Peyronnard, M. Benzaazoua, D. Blanc, P. Moszkowicz, Study of mineralogy and leaching behavior of stabilized/solidified sludge using differential acid neutralization analysis: Part I: Experimental study, Cement and Concrete Research, 39 (2009) 600-609.
[73] M. Castellote, I. Llorente, C. Andrade, C. Alonso, Accelerated leaching of ultra high performance concretes by application of electrical fields to simulate their natural degradation, Materials and Structures, 36 (2003) 81-90.
[74] F.-J. Ulm, E. Lemarchand, F.H. Heukamp, Elements of chemomechanics of calcium leaching of cement-based materials at different scales, Engineering Fracture Mechanics, 70 (2003) 871-889.
[75] L. Tang, Electrically accelerated methods for determining chloride diffusivity in concrete - Current development, Magazine of Concrete Research, 48 (1996) 173-179.
[76] NT BUILD 492, Concrete, Mortar and Cement-based Repair Materials: Chloride Migration Coefficient from Non-steady-state Migration Experiments, , 1999.
[77] P. Cronstrand, A. Babaahmadi, L. Tang, Z. Abbas, Electrochemical leaching of cementitious materials: an experimental and theoretical study, 1st International Symposium on Cement-Based Materials for Nuclear Wastes, NUWCEM 2011.
[78] L.O. Höglund, Modelling of long-term concrete degradation processes in the Swedish SFR repository, SKB Technical Report R-01-08, Swedish Nuclear Fuel and Waste Management Company, 2001.
[79] A. Babaahmadi, Developement of a method for accelerated ageing of cementitious materials used in repositories of nuclear waste, ISSN 1652-9146, Civil and Environmental Engineering, Chalmers University of Technology, 2013.
[80] Z. Abbas, E. Ahlberg, S. Nordholm, Monte Carlo Simulations of Salt Solutions: Exploring the Validity of Primitive Models, The Journal of Physical Chemistry B, 113 (2009) 5905-5916.

86
[81] J. Crank, The mathematics of diffusion, Oxford science publications1916.
[82] R. Torrent, Non-Destructive Evaluation of the Penetrability and Thickness of the Concrete Cover - State-of-the-Art Report of RILEM Technical Committee 189-NEC, 2007.
[83] J.J. Kollek, The determination of the permeability of concrete to oxygen by the Cembureau method—a recommendation, Materials and Structures, 22 (1989) 225-230.
[84] ASTM C496/C496M-11, Standard Test Method for Splitting Tensile Strength of Cylindrical Concrete Specimens.
[85] ASTM C39/C39M-14a, Standard Test Method for Compressive Strength of Cylindrical Concrete Specimens.
[86] ASTM C215-08, Standard Test Method for Fundamental Transverse, Longitudinal, and Torsional Resonant Frequencies of Concrete Specimens.
[87] Q. Zhang, G. Ye, Dehydration kinetics of Portland cement paste at high temperature, J Therm Anal Calorim, 110 (2012) 153-158.
[88] P. Faucon, F. Adenot, M. Jorda, R. Cabrillac, Behaviour of crystallised phases of Portland cement upon water attack, Materials and Structures, 30 (1997) 480-485.
[89] J.J. Chen, J.J. Thomas, H.M. Jennings, Decalcification shrinkage of cement paste, Cement and Concrete Research, 36 (2006) 801-809.
[90] A. Rawal, B.J. Smith, G.L. Athens, C.L. Edwards, L. Roberts, V. Gupta, B.F. Chmelka, Molecular silicate and aluminate species in anhydrous and hydrated cements, Journal of the American Chemical Society, 132 (2010) 7321-7337.
[91] K. Haga, M. Shibata, M. Hironaga, S. Tanaka, S. Nagasaki, Silicate Anion Structural Change in Calcium Silicate Hydrate Gel on Dissolution of Hydrated Cement, Journal of NUCLEAR SCIENCE and TECHNOLOGY, 39 (2002) 540-547.
[92] G. Fagerlund, Determination of pore-size distribution from freezing-point depression, Matériaux et Constructions, 6 (1973) 215-225.
[93] B. Johannesson, Dimensional and ice content changes of hardened concrete at different freezing and thawing temperatures, Cement and Concrete Composites, 32 (2010) 73-83.
[94] D.H. Bager, E.J. Sellevold, Ice formation in hardened cement paste, part III - Slow resaturation of room temperature cured pastes, Cement and Concrete Research, 17 (1987) 1-11.
[95] B.M. Braun, H. Weingaertner, Accurate self-diffusion coefficients of lithium(1+), sodium(1+), and cesium(1+) ions in aqueous alkali metal halide solutions from NMR spin-echo experiments, The Journal of Physical Chemistry, 92 (1988) 1342-1346.