
Durability Evaluation of the Effects of Hydro-processed ...
56
UNCLASSIFIED i PREFACE Registration No. -Technical Report- U.S. Army Tank Automotive Research, Development, and Engineering Center Detroit Arsenal Warren, Michigan 48397-5000 DISTRIBUTION STATEMENT A : Approved for public release; distribution is unlimited. Disclaimer: Reference herein to any specific commercial company, product, process, or service by trade name, trademark, manufacturer, or otherwise, does not necessarily constitute or imply its endorsement, recommendation, or favoring by the United States Government or the Department of the Army (DoA). The opinions of the authors expressed herein do not necessarily state or reflect those of the United States Government or the DoA, and shall not be used for advertising or product endorsement purposes. Durability Evaluation of the Effects of Hydro-processed Renewable Jet (HRJ) blended at 50% with petroleum JP-8 on a Navistar Maxxforce D10 9.3L Engine May 2012 UNCLASSIFIED UNCLASSIFIED
Transcript of Durability Evaluation of the Effects of Hydro-processed ...
UNCLASSIFIED
i
PREFACE
Registration No.
-Technical Report-
U.S. Army Tank Automotive Research,Development, and Engineering CenterDetroit ArsenalWarren, Michigan 48397-5000
DISTRIBUTION STATEMENT A: Approved for public release; distribution is unlimited.
Disclaimer: Reference herein to any specific commercial company, product, process, or service by trade name, trademark, manufacturer, or otherwise, does not necessarily constitute or imply its
endorsement, recommendation, or favoring by the United States Government or the Department of the Army (DoA). The opinions of the authors expressed herein do not necessarily state or reflect those of
the United States Government or the DoA, and shall not be used for advertising or product endorsement purposes.
Durability Evaluation of the Effects of Hydro-processed Renewable Jet (HRJ) blended at 50% with petroleum JP-8
on a Navistar Maxxforce D10 9.3L Engine
May 2012
UNCLASSIFIED
UNCLASSIFIED

Report Documentation Page Form ApprovedOMB No. 0704-0188
Public reporting burden for the collection of information is estimated to average 1 hour per response, including the time for reviewing instructions, searching existing data sources, gathering andmaintaining the data needed, and completing and reviewing the collection of information. Send comments regarding this burden estimate or any other aspect of this collection of information,including suggestions for reducing this burden, to Washington Headquarters Services, Directorate for Information Operations and Reports, 1215 Jefferson Davis Highway, Suite 1204, ArlingtonVA 22202-4302. Respondents should be aware that notwithstanding any other provision of law, no person shall be subject to a penalty for failing to comply with a collection of information if itdoes not display a currently valid OMB control number.
1. REPORT DATE 10 MAY 2012
2. REPORT TYPE Technical Report
3. DATES COVERED 01-04-2011 to 01-03-2012
4. TITLE AND SUBTITLE Durability Evaluation of the Effects of Hydro-processed Renewable Jet(HRJ) blended at 50% with petroleum JP-8 on a Navistar Maxxforce D109.3L Engine
5a. CONTRACT NUMBER
5b. GRANT NUMBER
5c. PROGRAM ELEMENT NUMBER
6. AUTHOR(S) Andrew Jackman; Nichole Hubble; Eric Sattler
5d. PROJECT NUMBER
5e. TASK NUMBER
5f. WORK UNIT NUMBER
7. PERFORMING ORGANIZATION NAME(S) AND ADDRESS(ES) Ground Vehicle Power and Mobility GVPM TARDEC,Detroit ArmyGarrison - Michigan,6501 E. Eleven Mile Rd.,Warren,Mi,48397-5000
8. PERFORMING ORGANIZATIONREPORT NUMBER #23573
9. SPONSORING/MONITORING AGENCY NAME(S) AND ADDRESS(ES) TARDEC National Automotive Center, TARDEC Fuels and LubricantsTechnology, 6501 East Eleven Mile Rd, Warren, Mi, 48397-5000
10. SPONSOR/MONITOR’S ACRONYM(S) TARDEC
11. SPONSOR/MONITOR’S REPORT NUMBER(S) #23573
12. DISTRIBUTION/AVAILABILITY STATEMENT Approved for public release; distribution unlimited
13. SUPPLEMENTARY NOTES
14. ABSTRACT Two Navistar 9.3L diesel engines were tested to a modified version of the NATO 400-hr test. Testmodifications included using non-standard fuels (JP-8 and a JP-8/HRJ fuel blend) and elevated testingtemperatures. Engine #1 was endurance tested on JP-8 fuel while engine #2 was endurance tested onJP-8/HRJ fuel blend. Both engines completed the 400 hour endurance schedule successfully. In addition,the data for both engines shows that there is a small decrease in engine power output from JP-8 toJP-8/HRJ blended fuel proportionate with decreasing fuel volumetric energy.
15. SUBJECT TERMS
16. SECURITY CLASSIFICATION OF: 17. LIMITATION OF ABSTRACT
Public Release
18. NUMBEROF PAGES
57
19a. NAME OFRESPONSIBLE PERSON
a. REPORT unclassified
b. ABSTRACT unclassified
c. THIS PAGE unclassified
Standard Form 298 (Rev. 8-98) Prescribed by ANSI Std Z39-18

UNCLASSIFIED
ii
The alternative fuels tests were conducted by the U.S. Army’s Tank Automotive Research, Development and Engineering Center (TARDEC), Ground Vehicle Power & Mobility (GVPM) team, utilizing a test cell in building 212. The test was started in April 2011 and was completed in March 2012. The purpose of the test was to compare the performance and 400 hour durability of an engine using a synthetic fuel blend (HRJ and JP-8) to that fueled by the standard military fuel, JP-8.
UNCLASSIFIED
iii
REPORT DOCUMENTATION PAGE Form Approved
OMB No. 0704-0188 Public reporting burden for this collection of information is estimated to average 1 hour per response, including the time for reviewing instructions, searching existing data sources, gathering and maintaining the data needed, and completing and reviewing this collection of information. Send comments regarding this burden estimate or any other aspect of this collection of information, including suggestions for reducing this burden to Department of Defense, Washington Headquarters Services, Directorate for Information Operations and Reports (0704-0188), 1215 Jefferson Davis Highway, Suite 1204, Arlington, VA 22202-4302. Respondents should be aware that notwithstanding any other provision of law, no person shall be subject to any penalty for failing to comply with a collection of information if it does not display a currently valid OMB control number. PLEASE DO NOT RETURN YOUR FORM TO THE ABOVE ADDRESS. 1. REPORT DATE (DD-MM-YYYY) 10 May 2012
2. REPORT TYPE Final Technical Report
3. DATES COVERED (From - To) April 2011-March 2012
4. TITLE AND SUBTITLE:
Durability Evaluation of the Effects of Hydro-processed Renewable Jet (HRJ) blended at 50% with petroleum JP-8 on a Navistar Maxxforce D10 9.3L Engine
5a. CONTRACT NUMBER
5b. GRANT NUMBER 5c. PROGRAM ELEMENT NUMBER
6. AUTHOR(S) Andrew Jackman / Nichole Hubble / Eric Sattler
5d. PROJECT NUMBER 5e. TASK NUMBER 5f. WORK UNIT NUMBER
7. PERFORMING ORGANIZATION NAME(S) AND ADDRESS(ES) Ground Vehicle Power and Mobility GVPM TARDEC Detroit Army Garrison - Michigan 6501 E. Eleven Mile Rd. Warren, MI 48397-5000
8. PERFORMING ORGANIZATION REPORT NUMBER 23573
9. SPONSORING / MONITORING AGENCY NAME(S) AND ADDRESS(ES) 10. SPONSOR/MONITOR’S ACRONYM(S) TARDEC National Automotive Center TARDEC Fuels and Lubricants Technology 6501 E. Eleven Mile Rd. 11. SPONSOR/MONITOR’S REPORT Warren, MI 48397-5000 NUMBER(S)
23573 12. DISTRIBUTION / AVAILABILITY STATEMENT DISTRIBUTION STATEMENT A. Approved for public release. Distribution is unlimited.
13. SUPPLEMENTARY NOTES 14. ABSTRACT Two Navistar 9.3L diesel engines were tested to a modified version of the NATO 400-hr test. Test modifications included using non-standard fuels (JP-8 and a JP-8/HRJ fuel blend) and elevated testing temperatures. Engine #1 was endurance tested on JP-8 fuel while engine #2 was endurance tested on JP-8/HRJ fuel blend. Both engines completed the 400 hour endurance schedule successfully. In addition, the data for both engines shows that there is a small decrease in engine power output from JP-8 to JP-8/HRJ blended fuel proportionate with decreasing fuel volumetric energy.
15. SUBJECT TERMS
16. SECURITY CLASSIFICATION OF:
17. LIMITATION OF ABSTRACT
18. NUMBER OF PAGES
19a. NAME OF RESPONSIBLE PERSON a. REPORT
UNCLASSIFIED b. ABSTRACT UNCLASSIFIED
c. THIS PAGE UNCLASSIFIED
19b. TELEPHONE NUMBER (include area code) Standard Form 298 (Rev. 8-98)
Prescribed by ANSI Std. Z39.18

UNCLASSIFIED
iv
TABLE OF CONTENTS 1.0 Introduction/Background………………………………………………………….1 2.0 Objective.………………………………………………………………………….1-2 3.0 Conclusions.………………….……………………………………………………2 4.0 Engine Specifications……………………………………………………………..3 5.0 Lubricating Oil……………………………………………………………………3 6.0 Fuels………………………………………………………………………………4 7.0 Test Equipment…………………………………………………………………...4
Figures 1 – 4 ………………..………...………………………………………4-6 8.0 Test Procedure……………………………………………………………………6 9.0 Discussion………………………………………………………………………...6 9.1 Performance Evaluation – Eng #1………………………………………..6-9
Figures 5 –12 ..………...………………………………………9-13 Tables 1 – 2 ...………...………………………………………13-14
9.2 Performance Evaluation – Eng #2………………………………………..14-16
Figures 13 –20………...………………………………………17-20 Tables 3 –4. ...………...………………………………………21
10.0 Oil Analysis ……………………………………………………………………..22 11.0 Engine Teardown Eng #1 and #2………………………………………………...22
Figures 21 – 22 .……………..………...………………………………………22-23 12.0 Pump and Fuel Injector Analysis ..… ………….………………………………..23
UNCLASSIFIED
v
Appendices A1. Test Plan…………………………………………………………………….. A1 - 2 A2. Instrumentation List ……………………….……………………………….. A2 - 11 A3. Eng #1 & #2 Sample Data……………..…………………………………… A3 – 1 A4. Fuel and Oil Analysis ……………………………………………………… A4 – 1

UNCLASSIFIED
1
1.0 INTRODUCTION / BACKGROUND To comply with US Army Regulation 70-12, Fuels and Lubricants Standardization Policy for Equipment Design, Operation and Logistic Support, the US Army TARDEC’s GVPM group, Fuels and Lubricants Technology Team, and National Automotive Center (NAC) have cooperated to test and evaluate synthetic (non-petroleum crude) based fuel usage in diesel engines. Ultimately, results from this testing, along with other evaluations, will be used to determine the suitability of blending synthetically derived kerosene with petroleum kerosene fuels such as Jet-A and Jet Propellant-8 (JP-8). Previous diesel engine testing performed at TARDEC was with a blend of Fischer-Tropsch (FT) derived Synthetic Paraffinic Kerosene (SPK) and petroleum JP-8. The testing described in this report was also conducted with an SPK and JP-8 blend; however, this SPK was derived from a different manufacturing process that hydro-processes esters and fatty acids produced from plant oils and animal fats. This SPK is now known as Hydro-processed Esters and Fatty Acids (HEFA) SPK, and initially was called Hydro-processed Renewable Jet (HRJ). The HRJ fuel being tested will be delivered for testing as a prescription 50/50 blend (vol.) of HEFA SPK and JP-8 meeting the military specification for JP-8 (MIL-DTL-83133H). For the remainder of this document it will be referred to as “HRJP-8.”
The tests contained within this report will be used to assess the effect of the HRJP-8 fuel on engine performance and durability as compared to JP-8. This evaluation requires that two similar engines of make and model be tested, one on JP-8 and the other on the blended fuel. The engines were subjected to the 400 hour NATO (AEP-5) test procedure at elevated temperatures for both the JP-8 and HRJP-8 fuels. 2.0 OBJECTIVE
The purpose of this testing is to quantitatively measure any changes in engine performance, durability or operating characteristic as compared to 100% JP-8 and to also better understand the overall durability of the subject engine. The subject engine for this test is a Navistar Inc. MAXXFORCE D10/9.3L I-6 used to power the Navistar Mine Resistant Ambush Protected (MRAP) military vehicle. The test procedure and cycle is a modified version of the NATO Document AEP-5 Ver. 3 (aka NATO 400 Hour Durability). Modifications to this procedure are primarily increases to the operating temperatures of the engine coolant, combustion air and fuel supply to extremes observed during actual vehicle usage called Desert Operating Conditions (DOC). The focus will be on the engine’s entire fuel system. This consists of the fuel delivery system (lines, filter and low pressure pump), seals and fuel injectors (hydraulically-actuated unit type). Strict adherence to the pass/fail criteria of the NATO AEP-5 will not be followed since
UNCLASSIFIED
2
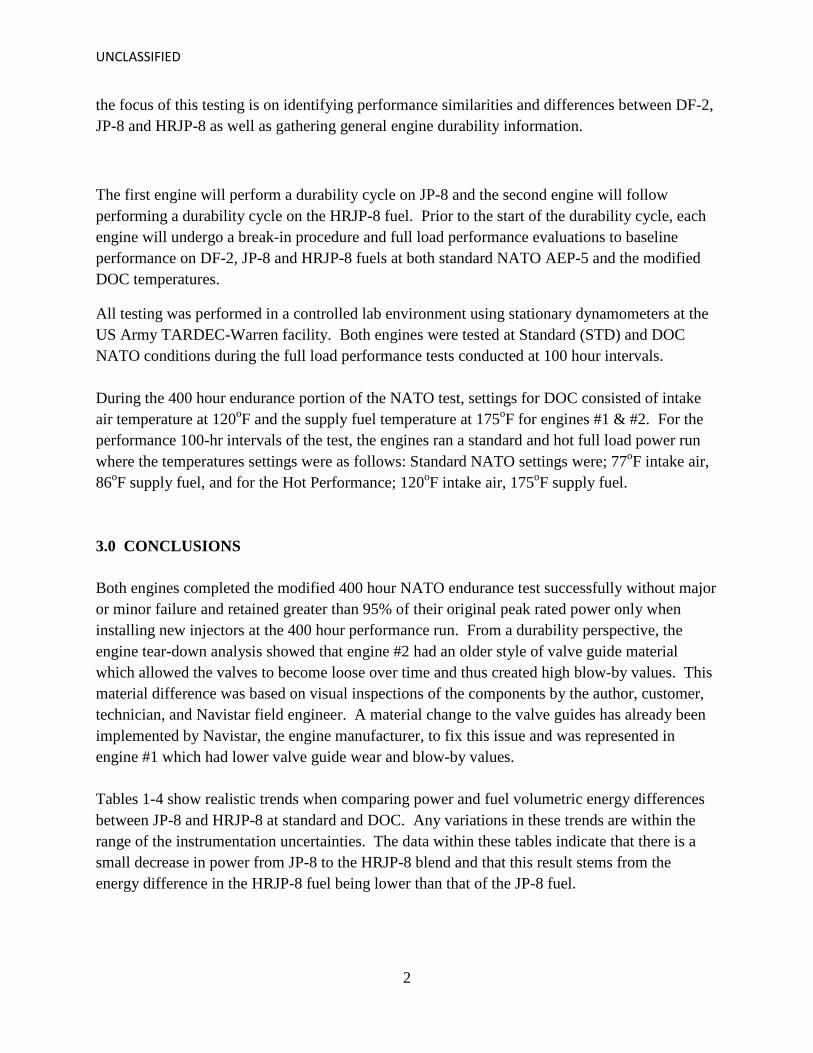
the focus of this testing is on identifying performance similarities and differences between DF-2, JP-8 and HRJP-8 as well as gathering general engine durability information.
The first engine will perform a durability cycle on JP-8 and the second engine will follow performing a durability cycle on the HRJP-8 fuel. Prior to the start of the durability cycle, each engine will undergo a break-in procedure and full load performance evaluations to baseline performance on DF-2, JP-8 and HRJP-8 fuels at both standard NATO AEP-5 and the modified DOC temperatures.
All testing was performed in a controlled lab environment using stationary dynamometers at the US Army TARDEC-Warren facility. Both engines were tested at Standard (STD) and DOC NATO conditions during the full load performance tests conducted at 100 hour intervals. During the 400 hour endurance portion of the NATO test, settings for DOC consisted of intake air temperature at 120oF and the supply fuel temperature at 175oF for engines #1 & #2. For the performance 100-hr intervals of the test, the engines ran a standard and hot full load power run where the temperatures settings were as follows: Standard NATO settings were; 77oF intake air, 86oF supply fuel, and for the Hot Performance; 120oF intake air, 175oF supply fuel. 3.0 CONCLUSIONS Both engines completed the modified 400 hour NATO endurance test successfully without major or minor failure and retained greater than 95% of their original peak rated power only when installing new injectors at the 400 hour performance run. From a durability perspective, the engine tear-down analysis showed that engine #2 had an older style of valve guide material which allowed the valves to become loose over time and thus created high blow-by values. This material difference was based on visual inspections of the components by the author, customer, technician, and Navistar field engineer. A material change to the valve guides has already been implemented by Navistar, the engine manufacturer, to fix this issue and was represented in engine #1 which had lower valve guide wear and blow-by values. Tables 1-4 show realistic trends when comparing power and fuel volumetric energy differences between JP-8 and HRJP-8 at standard and DOC. Any variations in these trends are within the range of the instrumentation uncertainties. The data within these tables indicate that there is a small decrease in power from JP-8 to the HRJP-8 blend and that this result stems from the energy difference in the HRJP-8 fuel being lower than that of the JP-8 fuel.
UNCLASSIFIED
3
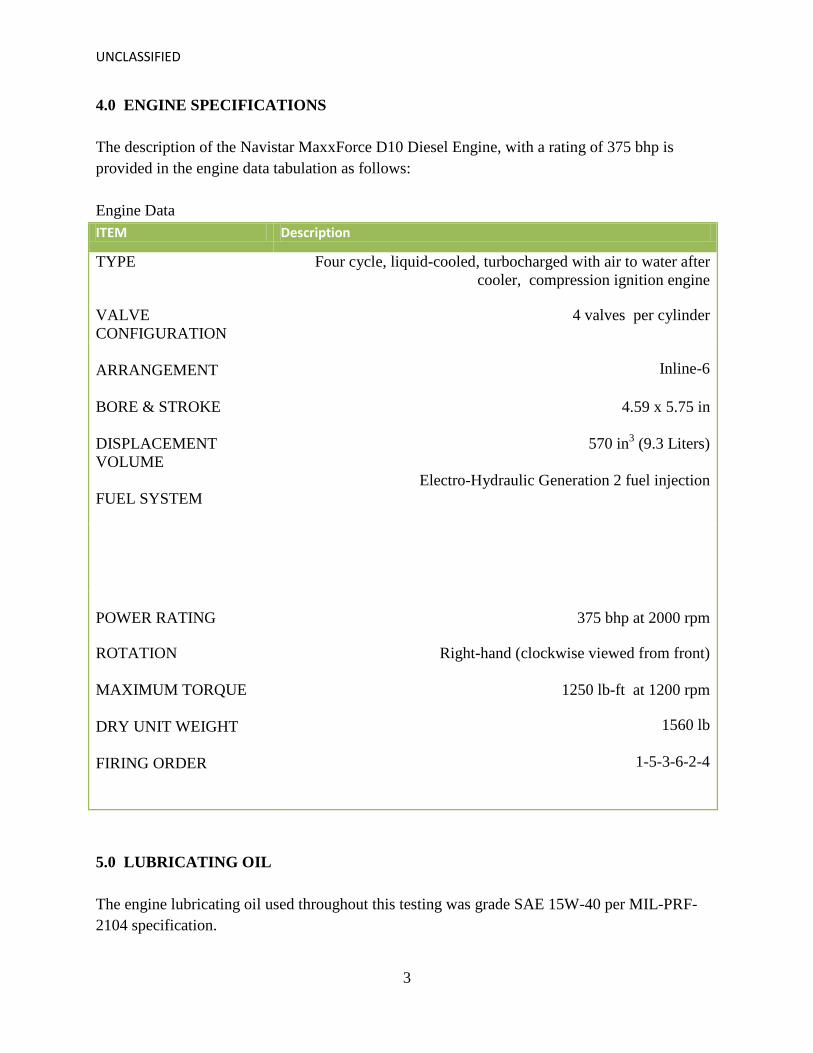
4.0 ENGINE SPECIFICATIONS The description of the Navistar MaxxForce D10 Diesel Engine, with a rating of 375 bhp is provided in the engine data tabulation as follows: Engine Data ITEM Description
TYPE Four cycle, liquid-cooled, turbocharged with air to water after cooler, compression ignition engine
VALVE CONFIGURATION
4 valves per cylinder
ARRANGEMENT
Inline-6
BORE & STROKE DISPLACEMENT VOLUME FUEL SYSTEM
4.59 x 5.75 in
570 in3 (9.3 Liters)
Electro-Hydraulic Generation 2 fuel injection
POWER RATING
375 bhp at 2000 rpm
ROTATION MAXIMUM TORQUE DRY UNIT WEIGHT FIRING ORDER
Right-hand (clockwise viewed from front)
1250 lb-ft at 1200 rpm
1560 lb
1-5-3-6-2-4
5.0 LUBRICATING OIL The engine lubricating oil used throughout this testing was grade SAE 15W-40 per MIL-PRF-2104 specification.
UNCLASSIFIED
4
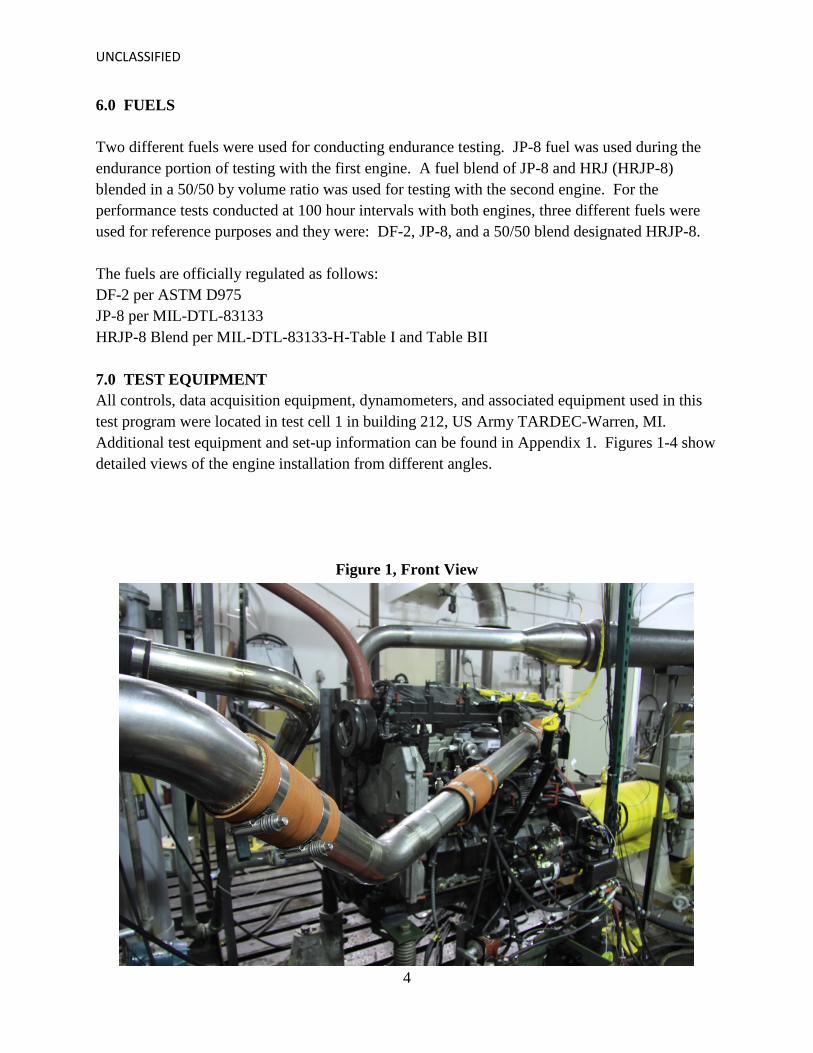
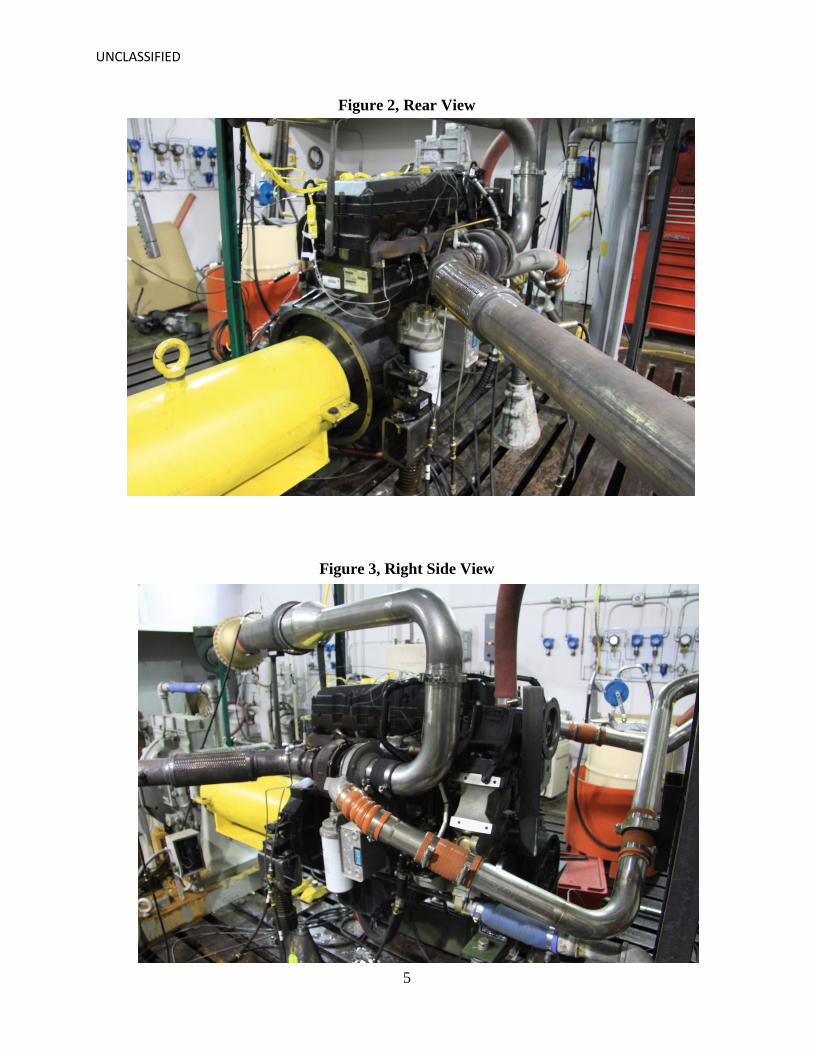
6.0 FUELS Two different fuels were used for conducting endurance testing. JP-8 fuel was used during the endurance portion of testing with the first engine. A fuel blend of JP-8 and HRJ (HRJP-8) blended in a 50/50 by volume ratio was used for testing with the second engine. For the performance tests conducted at 100 hour intervals with both engines, three different fuels were used for reference purposes and they were: DF-2, JP-8, and a 50/50 blend designated HRJP-8. The fuels are officially regulated as follows: DF-2 per ASTM D975 JP-8 per MIL-DTL-83133 HRJP-8 Blend per MIL-DTL-83133-H-Table I and Table BII 7.0 TEST EQUIPMENT All controls, data acquisition equipment, dynamometers, and associated equipment used in this test program were located in test cell 1 in building 212, US Army TARDEC-Warren, MI. Additional test equipment and set-up information can be found in Appendix 1. Figures 1-4 show detailed views of the engine installation from different angles.
Figure 1, Front View
UNCLASSIFIED
5
Figure 2, Rear View
Figure 3, Right Side View

UNCLASSIFIED
6
Figure 4, Left Side View
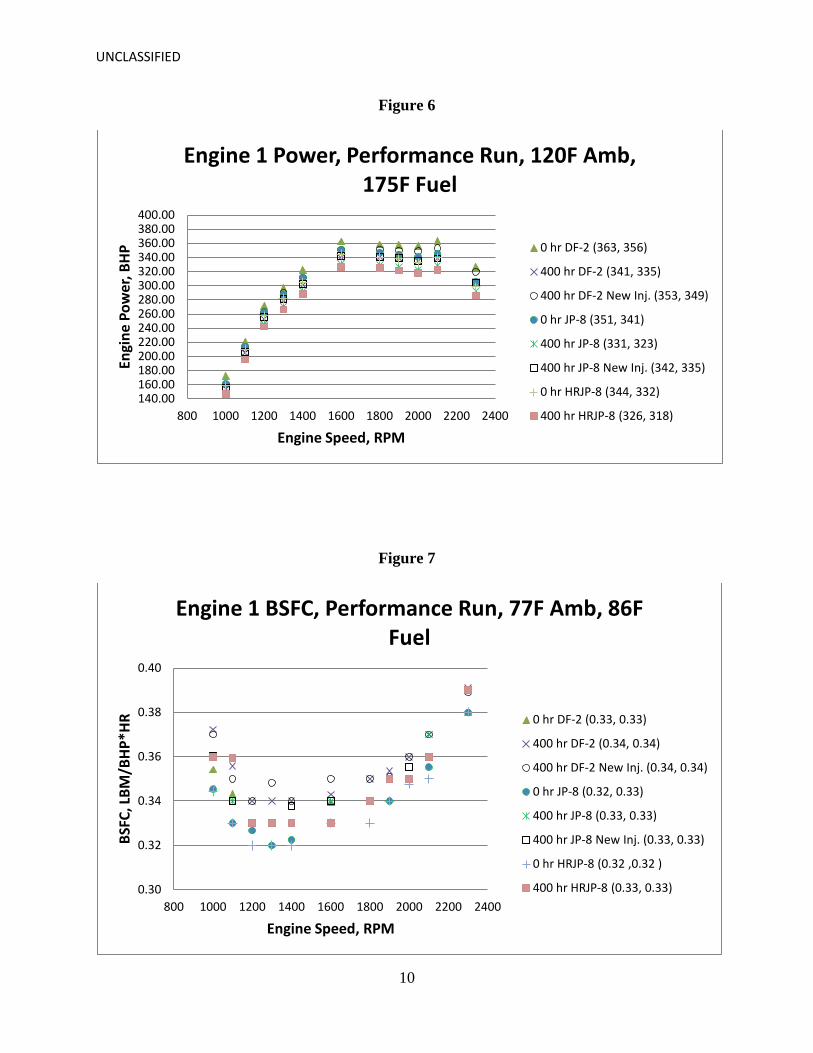
8.0 TEST PROCEDURE Test procedures for the performance and endurance segments of the tests are located in the Test Plan found in Appendix 1. All engine operating parameters and limits (with the exception of test temperatures) were set in accordance with NATO AEP-5 test conditions for the test duration as specified in the Test Plan (Appendix 1). 9.0 DISCUSSION The 375 bhp Navistar MaxxForce D10 diesel engine is a representative engine from the Army’s MRAP wheeled vehicle. 9.1 PERFORMANCE EVALUATION USING BASELINE JP-8 FUEL – ENGINE #1 All data are presented as observed without correction. Test conditions are described as follows: Prior (0 hrs) and post (400 hrs) test full load and part load data sweeps were conducted for standard fuel (86ºF) and ambient air (77ºF) conditions and elevated desert operating conditions (DOC) of 175ºF and 120ºF for fuel and ambient air, respectively. These performance runs are documented in full load power vs. engine speed graphs shown in Figures 5-6. The legends in the
UNCLASSIFIED
7
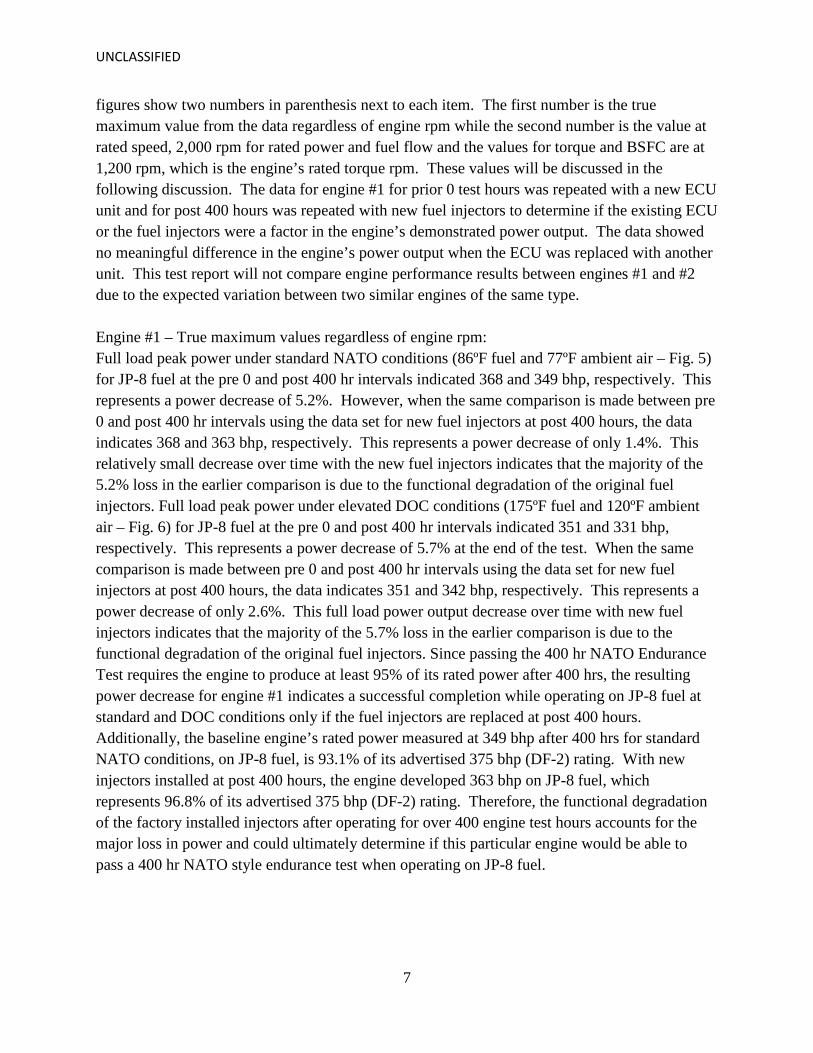
figures show two numbers in parenthesis next to each item. The first number is the true maximum value from the data regardless of engine rpm while the second number is the value at rated speed, 2,000 rpm for rated power and fuel flow and the values for torque and BSFC are at 1,200 rpm, which is the engine’s rated torque rpm. These values will be discussed in the following discussion. The data for engine #1 for prior 0 test hours was repeated with a new ECU unit and for post 400 hours was repeated with new fuel injectors to determine if the existing ECU or the fuel injectors were a factor in the engine’s demonstrated power output. The data showed no meaningful difference in the engine’s power output when the ECU was replaced with another unit. This test report will not compare engine performance results between engines #1 and #2 due to the expected variation between two similar engines of the same type. Engine #1 – True maximum values regardless of engine rpm: Full load peak power under standard NATO conditions (86ºF fuel and 77ºF ambient air – Fig. 5) for JP-8 fuel at the pre 0 and post 400 hr intervals indicated 368 and 349 bhp, respectively. This represents a power decrease of 5.2%. However, when the same comparison is made between pre 0 and post 400 hr intervals using the data set for new fuel injectors at post 400 hours, the data indicates 368 and 363 bhp, respectively. This represents a power decrease of only 1.4%. This relatively small decrease over time with the new fuel injectors indicates that the majority of the 5.2% loss in the earlier comparison is due to the functional degradation of the original fuel injectors. Full load peak power under elevated DOC conditions (175ºF fuel and 120ºF ambient air – Fig. 6) for JP-8 fuel at the pre 0 and post 400 hr intervals indicated 351 and 331 bhp, respectively. This represents a power decrease of 5.7% at the end of the test. When the same comparison is made between pre 0 and post 400 hr intervals using the data set for new fuel injectors at post 400 hours, the data indicates 351 and 342 bhp, respectively. This represents a power decrease of only 2.6%. This full load power output decrease over time with new fuel injectors indicates that the majority of the 5.7% loss in the earlier comparison is due to the functional degradation of the original fuel injectors. Since passing the 400 hr NATO Endurance Test requires the engine to produce at least 95% of its rated power after 400 hrs, the resulting power decrease for engine #1 indicates a successful completion while operating on JP-8 fuel at standard and DOC conditions only if the fuel injectors are replaced at post 400 hours. Additionally, the baseline engine’s rated power measured at 349 bhp after 400 hrs for standard NATO conditions, on JP-8 fuel, is 93.1% of its advertised 375 bhp (DF-2) rating. With new injectors installed at post 400 hours, the engine developed 363 bhp on JP-8 fuel, which represents 96.8% of its advertised 375 bhp (DF-2) rating. Therefore, the functional degradation of the factory installed injectors after operating for over 400 engine test hours accounts for the major loss in power and could ultimately determine if this particular engine would be able to pass a 400 hr NATO style endurance test when operating on JP-8 fuel.

UNCLASSIFIED
8
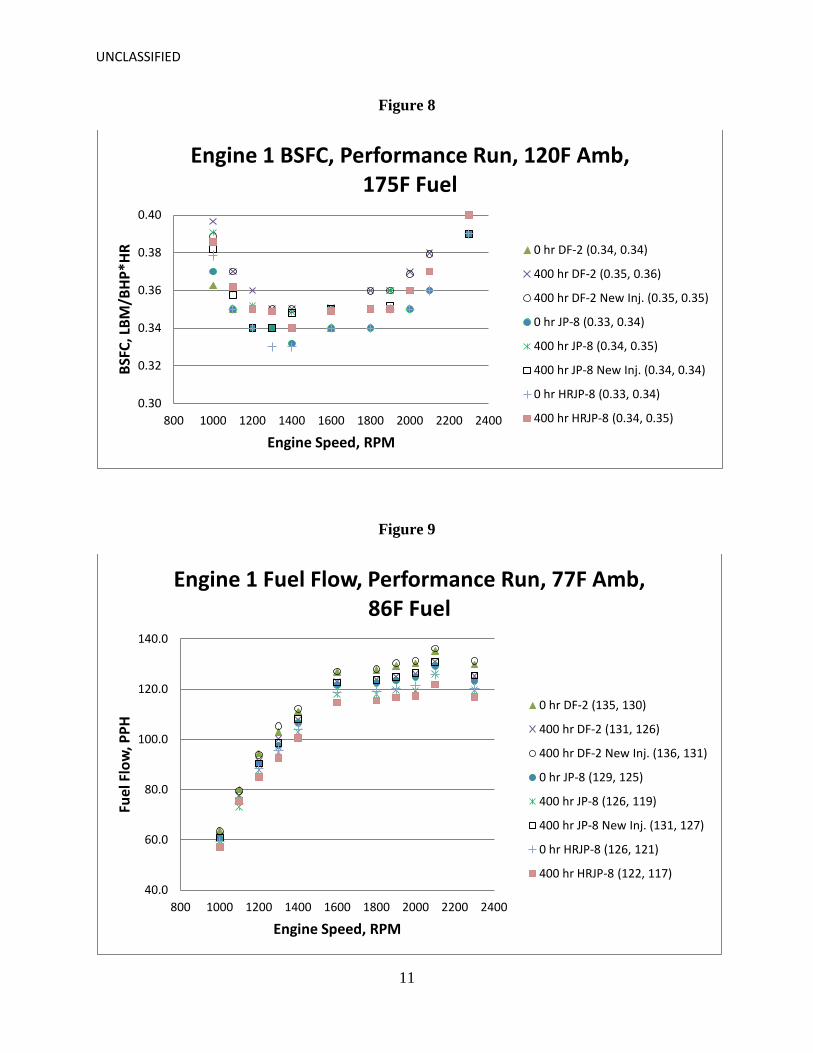
Engine #1 – Values at rated power (2,000rpm) and rated torque (1,200rpm): Full load rated power under standard NATO conditions (86ºF fuel and 77ºF ambient air – Fig. 5) for JP-8 fuel at the pre 0 and post 400 hr intervals indicated 359 and 340 bhp, respectively. This represents a power decrease of 5.3%. However, when the same comparison is made between pre 0 and post 400 hr intervals using the data set for new fuel injectors at post 400 hours, the data indicates 359 and 356 bhp, respectively. This represents a power decrease of only 0.84%. This relatively small decrease over time with the new fuel injectors indicates that the majority of the 5.3% loss in the earlier comparison is due to the functional degradation of the original fuel injectors. Full load rated power under elevated DOC conditions (175ºF fuel and 120ºF ambient air – Fig. 6) for JP-8 fuel at the pre 0 and post 400 hr intervals indicated 341 and 323 bhp, respectively. This represents a power decrease of 5.3% at the end of the test. When the same comparison is made between pre 0 and post 400 hr intervals using the data set for new fuel injectors at post 400 hours, the data indicates 341 and 335 bhp, respectively. This represents a power decrease of only 1.8%. This full load power output decrease over time with new fuel injectors indicates that the majority of the 5.3% loss in the earlier comparison is due to the functional degradation of the original fuel injectors. Since passing the 400 hr NATO Endurance Test requires the engine to produce at least 95% of its rated power after 400 hrs, the resulting power decrease for engine #1 indicates a successful completion while operating on JP-8 fuel at standard and DOC conditions only if the fuel injectors are replaced at post 400 hours. Additionally, the baseline engine’s rated power measured at 340 bhp after 400 hrs for standard NATO conditions, on JP-8 fuel, is 90.7% of its advertised 375 bhp (DF-2) rating. With new injectors installed at post 400 hours, the engine developed 356 bhp on JP-8 fuel, which represents 94.9% of its advertised 375 bhp (DF-2) rating. Therefore, the functional degradation of the factory installed injectors after operating for over 400 engine test hours accounts for the major loss in power and could ultimately determine if this particular engine would be able to pass a 400 hr NATO style endurance test when operating on JP-8 fuel. The full load BSFC values for standard NATO and elevated NATO (DOC) testing conditions are presented in Figs. 7 and 8, respectively. With the exception of some portions of a curve just crossing over another curve due to reading errors in the mass weigh beaker system, the BSFC values are representative and consistent with expected numbers for this engine operating on the fuels indicated. The full load fuel consumption rate for standard and elevated (DOC) NATO testing conditions are presented in Figs. 9 and 10, respectively. The graphs show the fuel consumption rate increasing with engine speed at the expected rate of change.

UNCLASSIFIED
9
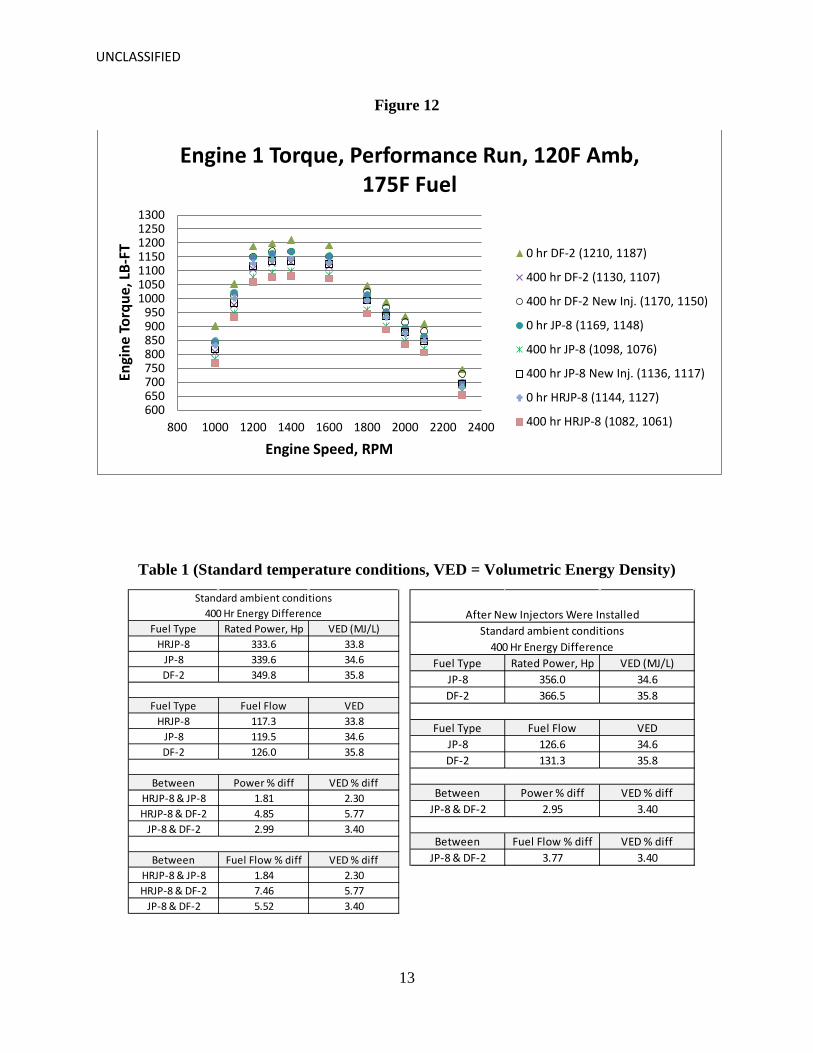
The full load engine torque for standard and elevated NATO conditions are presented in Figs. 11 and 12, respectively. These figures show torque versus speed curves which are following expected trends similar to the power curves. The charts for the energy difference at standard and elevated temperatures after 400 hours show good trends when comparing power and fuel volumetric energy differences. Tables 1 and 2 (for standard and DOC, respectively) show that the energy difference between JP-8 and the HRJP-8 fuel varied by 2.30 to 2.55 percent, but the variation is hard to quantify because the uncertainties with some of the instrumentation also vary as much as 2 to 3 percent. The power data shows to have varied by less than 2 percent, but the variation in power and energy difference between the two fuels are very small. The data does show that there is a small decrease in power from JP-8 to the HRJP-8 fuel, and this is a result from the energy difference in the blended fuel being lower than that of the JP-8 fuel.
Figure 5
140.00 160.00 180.00 200.00 220.00 240.00 260.00 280.00 300.00 320.00 340.00 360.00 380.00 400.00
800 1000 1200 1400 1600 1800 2000 2200 2400
Engi
ne P
ower
, BHP
Engine Speed, RPM
Engine 1 Power, Performance Run, 77F Amb, 86F Fuel
0 hr DF-2 (378, 372)
400 hr DF-2 (357, 350)
400 hr DF-2 New Inj. (369, 367)
0 hr JP-8 (368, 359)
400 hr JP-8 (349, 340)
400 hr JP-8 New Inj. (363, 356)
0 hr HRJP-8 (361, 351)
400 hr HRJP-8 (343, 334)
UNCLASSIFIED
10
Figure 6
Figure 7
140.00 160.00 180.00 200.00 220.00 240.00 260.00 280.00 300.00 320.00 340.00 360.00 380.00 400.00
800 1000 1200 1400 1600 1800 2000 2200 2400
Engi
ne P
ower
, BHP
Engine Speed, RPM
Engine 1 Power, Performance Run, 120F Amb, 175F Fuel
0 hr DF-2 (363, 356)
400 hr DF-2 (341, 335)
400 hr DF-2 New Inj. (353, 349)
0 hr JP-8 (351, 341)
400 hr JP-8 (331, 323)
400 hr JP-8 New Inj. (342, 335)
0 hr HRJP-8 (344, 332)
400 hr HRJP-8 (326, 318)
0.30
0.32
0.34
0.36
0.38
0.40
800 1000 1200 1400 1600 1800 2000 2200 2400
BSFC
, LBM
/BHP
*HR
Engine Speed, RPM
Engine 1 BSFC, Performance Run, 77F Amb, 86F Fuel
0 hr DF-2 (0.33, 0.33)
400 hr DF-2 (0.34, 0.34)
400 hr DF-2 New Inj. (0.34, 0.34)
0 hr JP-8 (0.32, 0.33)
400 hr JP-8 (0.33, 0.33)
400 hr JP-8 New Inj. (0.33, 0.33)
0 hr HRJP-8 (0.32 ,0.32 )
400 hr HRJP-8 (0.33, 0.33)
UNCLASSIFIED
11
Figure 8
Figure 9
0.30
0.32
0.34
0.36
0.38
0.40
800 1000 1200 1400 1600 1800 2000 2200 2400
BSFC
, LBM
/BHP
*HR
Engine Speed, RPM
Engine 1 BSFC, Performance Run, 120F Amb, 175F Fuel
0 hr DF-2 (0.34, 0.34)
400 hr DF-2 (0.35, 0.36)
400 hr DF-2 New Inj. (0.35, 0.35)
0 hr JP-8 (0.33, 0.34)
400 hr JP-8 (0.34, 0.35)
400 hr JP-8 New Inj. (0.34, 0.34)
0 hr HRJP-8 (0.33, 0.34)
400 hr HRJP-8 (0.34, 0.35)
40.0
60.0
80.0
100.0
120.0
140.0
800 1000 1200 1400 1600 1800 2000 2200 2400
Fuel
Flo
w, P
PH
Engine Speed, RPM
Engine 1 Fuel Flow, Performance Run, 77F Amb, 86F Fuel
0 hr DF-2 (135, 130)
400 hr DF-2 (131, 126)
400 hr DF-2 New Inj. (136, 131)
0 hr JP-8 (129, 125)
400 hr JP-8 (126, 119)
400 hr JP-8 New Inj. (131, 127)
0 hr HRJP-8 (126, 121)
400 hr HRJP-8 (122, 117)

UNCLASSIFIED
12
Figure 10
Figure 11
40.0
60.0
80.0
100.0
120.0
140.0
800 1000 1200 1400 1600 1800 2000 2200 2400
Fuel
Flo
w, P
PH
Engine Speed, RPM
Engine 1 Fuel Flow, Performance Run, 120F Amb, 175F Fuel
0 hr DF-2 (134, 128)
400 DF-2 (128, 122)
400 hr DF-2 New Inj. (133, 127)
0 hr JP-8 (126, 120)
400 hr JP-8 (122, 117)
400 hr JP-8 New Inj. (127, 120)
0 hr HRJP-8 (123, 117)
400 hr HRJP-8 (119, 114)
650 700 750 800 850 900 950
1000 1050 1100 1150 1200 1250 1300
800 1000 1200 1400 1600 1800 2000 2200 2400
Engi
ne To
rque
, LB-
FT
Engine Speed, RPM
Engine 1 Torque, Performance Run, 77F Amb, 86F Fuel
0 hr DF-2 (1267, 1249)
400 hr DF-2 (1190, 1171)
400 hr DF-2 New Inj. (1235, 1217)
0 hr JP-8 (1232, 1218)
400 hr JP-8 (1168, 1153)
400 hr JP-8 New Inj. (1210, 1190)
0 hr HRJP-8 (1208, 1194)
400 hr HRJP-8 (1145, 1128)
UNCLASSIFIED
13
Fuel Type Rated Power, Hp VED (MJ/L)HRJP-8 333.6 33.8
JP-8 339.6 34.6DF-2 349.8 35.8
Fuel Type Fuel Flow VEDHRJP-8 117.3 33.8
JP-8 119.5 34.6DF-2 126.0 35.8
Between Power % diff VED % diffHRJP-8 & JP-8 1.81 2.30HRJP-8 & DF-2 4.85 5.77
JP-8 & DF-2 2.99 3.40
Between Fuel Flow % diff VED % diffHRJP-8 & JP-8 1.84 2.30HRJP-8 & DF-2 7.46 5.77
JP-8 & DF-2 5.52 3.40
Standard ambient conditions400 Hr Energy Difference
Fuel Type Rated Power, Hp VED (MJ/L)JP-8 356.0 34.6DF-2 366.5 35.8
Fuel Type Fuel Flow VEDJP-8 126.6 34.6DF-2 131.3 35.8
Between Power % diff VED % diffJP-8 & DF-2 2.95 3.40
Between Fuel Flow % diff VED % diffJP-8 & DF-2 3.77 3.40
Standard ambient conditions400 Hr Energy Difference
After New Injectors Were Installed
Figure 12
Table 1 (Standard temperature conditions, VED = Volumetric Energy Density)
600 650 700 750 800 850 900 950
1000 1050 1100 1150 1200 1250 1300
800 1000 1200 1400 1600 1800 2000 2200 2400
Engi
ne To
rque
, LB-
FT
Engine Speed, RPM
Engine 1 Torque, Performance Run, 120F Amb, 175F Fuel
0 hr DF-2 (1210, 1187)
400 hr DF-2 (1130, 1107)
400 hr DF-2 New Inj. (1170, 1150)
0 hr JP-8 (1169, 1148)
400 hr JP-8 (1098, 1076)
400 hr JP-8 New Inj. (1136, 1117)
0 hr HRJP-8 (1144, 1127)
400 hr HRJP-8 (1082, 1061)
UNCLASSIFIED
14
Fuel Type Rated Power, Hp VED (MJ/L)HRJP-8 318.0 32.2
JP-8 323.1 33.1DF-2 334.7 34.3
Fuel Type Fuel Flow VEDHRJP-8 113.6 32.2
JP-8 116.8 33.1DF-2 122.4 34.3
Between Power % diff VED % diffHRJP-8 & JP-8 1.62 2.55HRJP-8 & DF-2 5.27 6.37
JP-8 & DF-2 3.60 3.72
Between Fuel Flow % diff VED % diffHRJP-8 & JP-8 2.82 2.55HRJP-8 & DF-2 7.76 6.37
JP-8 & DF-2 4.80 3.72
Elevated conditions400 Hr Energy Difference
Fuel Type Rated Power, Hp VED (MJ/L)JP-8 335.2 33.1DF-2 348.7 34.3
Fuel Type Fuel Flow VEDJP-8 120.3 33.1DF-2 127.4 34.3
Between Power % diff VED % diffJP-8 & DF-2 4.02 3.72
Between Fuel Flow % diff VED % diffJP-8 & DF-2 5.95 3.72
Elevated conditions400 Hr Energy Difference
After New Injectors Were Installed
Table 2 (Elevated temperature conditions, VED = Volumetric Energy Density)
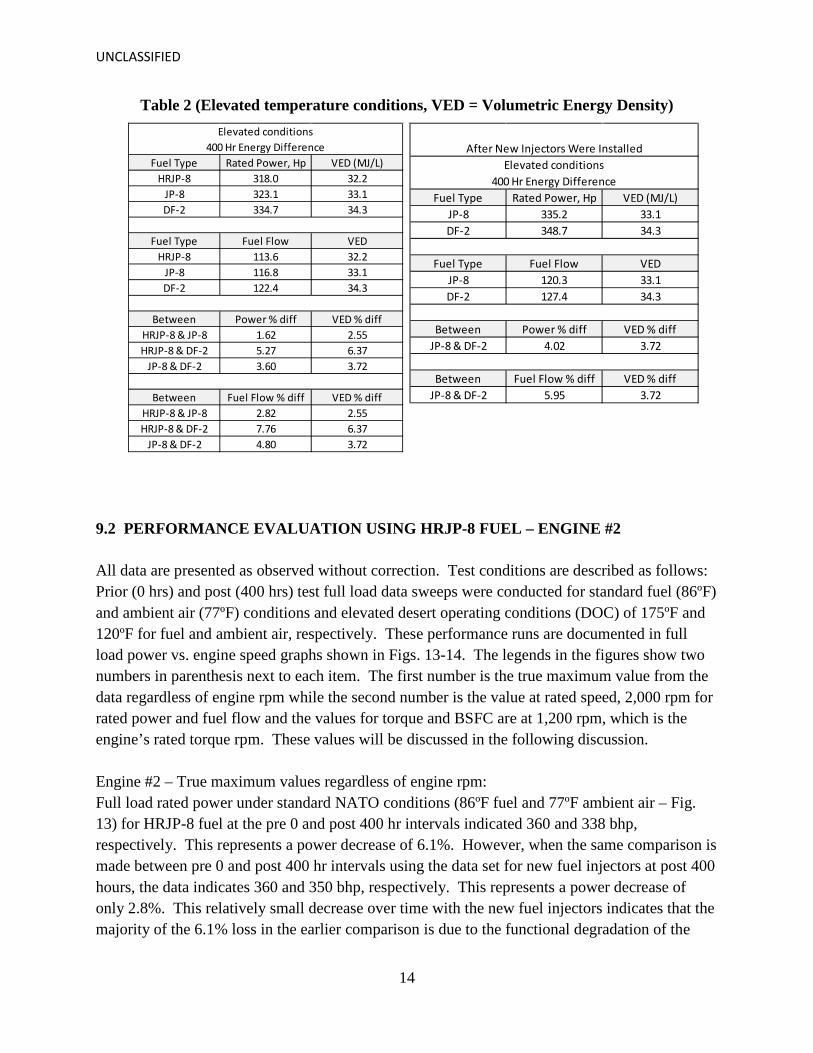
9.2 PERFORMANCE EVALUATION USING HRJP-8 FUEL – ENGINE #2 All data are presented as observed without correction. Test conditions are described as follows: Prior (0 hrs) and post (400 hrs) test full load data sweeps were conducted for standard fuel (86ºF) and ambient air (77ºF) conditions and elevated desert operating conditions (DOC) of 175ºF and 120ºF for fuel and ambient air, respectively. These performance runs are documented in full load power vs. engine speed graphs shown in Figs. 13-14. The legends in the figures show two numbers in parenthesis next to each item. The first number is the true maximum value from the data regardless of engine rpm while the second number is the value at rated speed, 2,000 rpm for rated power and fuel flow and the values for torque and BSFC are at 1,200 rpm, which is the engine’s rated torque rpm. These values will be discussed in the following discussion. Engine #2 – True maximum values regardless of engine rpm: Full load rated power under standard NATO conditions (86ºF fuel and 77ºF ambient air – Fig. 13) for HRJP-8 fuel at the pre 0 and post 400 hr intervals indicated 360 and 338 bhp, respectively. This represents a power decrease of 6.1%. However, when the same comparison is made between pre 0 and post 400 hr intervals using the data set for new fuel injectors at post 400 hours, the data indicates 360 and 350 bhp, respectively. This represents a power decrease of only 2.8%. This relatively small decrease over time with the new fuel injectors indicates that the majority of the 6.1% loss in the earlier comparison is due to the functional degradation of the
UNCLASSIFIED
15
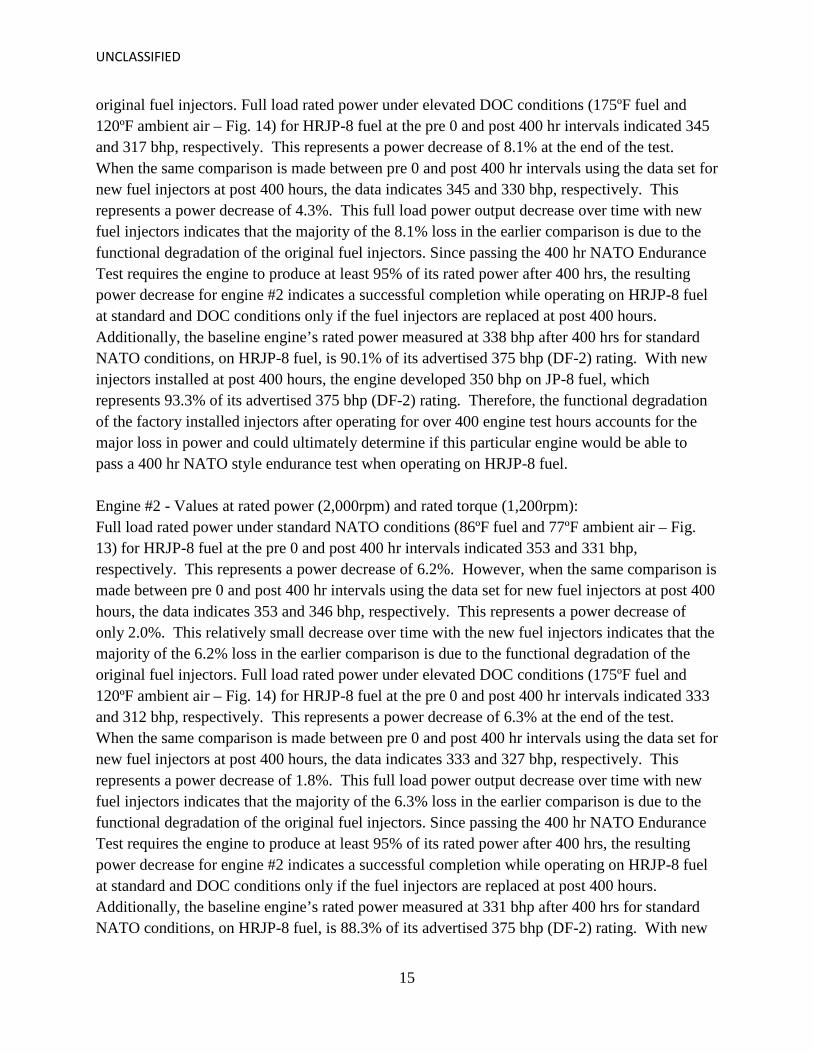
original fuel injectors. Full load rated power under elevated DOC conditions (175ºF fuel and 120ºF ambient air – Fig. 14) for HRJP-8 fuel at the pre 0 and post 400 hr intervals indicated 345 and 317 bhp, respectively. This represents a power decrease of 8.1% at the end of the test. When the same comparison is made between pre 0 and post 400 hr intervals using the data set for new fuel injectors at post 400 hours, the data indicates 345 and 330 bhp, respectively. This represents a power decrease of 4.3%. This full load power output decrease over time with new fuel injectors indicates that the majority of the 8.1% loss in the earlier comparison is due to the functional degradation of the original fuel injectors. Since passing the 400 hr NATO Endurance Test requires the engine to produce at least 95% of its rated power after 400 hrs, the resulting power decrease for engine #2 indicates a successful completion while operating on HRJP-8 fuel at standard and DOC conditions only if the fuel injectors are replaced at post 400 hours. Additionally, the baseline engine’s rated power measured at 338 bhp after 400 hrs for standard NATO conditions, on HRJP-8 fuel, is 90.1% of its advertised 375 bhp (DF-2) rating. With new injectors installed at post 400 hours, the engine developed 350 bhp on JP-8 fuel, which represents 93.3% of its advertised 375 bhp (DF-2) rating. Therefore, the functional degradation of the factory installed injectors after operating for over 400 engine test hours accounts for the major loss in power and could ultimately determine if this particular engine would be able to pass a 400 hr NATO style endurance test when operating on HRJP-8 fuel. Engine #2 - Values at rated power (2,000rpm) and rated torque (1,200rpm): Full load rated power under standard NATO conditions (86ºF fuel and 77ºF ambient air – Fig. 13) for HRJP-8 fuel at the pre 0 and post 400 hr intervals indicated 353 and 331 bhp, respectively. This represents a power decrease of 6.2%. However, when the same comparison is made between pre 0 and post 400 hr intervals using the data set for new fuel injectors at post 400 hours, the data indicates 353 and 346 bhp, respectively. This represents a power decrease of only 2.0%. This relatively small decrease over time with the new fuel injectors indicates that the majority of the 6.2% loss in the earlier comparison is due to the functional degradation of the original fuel injectors. Full load rated power under elevated DOC conditions (175ºF fuel and 120ºF ambient air – Fig. 14) for HRJP-8 fuel at the pre 0 and post 400 hr intervals indicated 333 and 312 bhp, respectively. This represents a power decrease of 6.3% at the end of the test. When the same comparison is made between pre 0 and post 400 hr intervals using the data set for new fuel injectors at post 400 hours, the data indicates 333 and 327 bhp, respectively. This represents a power decrease of 1.8%. This full load power output decrease over time with new fuel injectors indicates that the majority of the 6.3% loss in the earlier comparison is due to the functional degradation of the original fuel injectors. Since passing the 400 hr NATO Endurance Test requires the engine to produce at least 95% of its rated power after 400 hrs, the resulting power decrease for engine #2 indicates a successful completion while operating on HRJP-8 fuel at standard and DOC conditions only if the fuel injectors are replaced at post 400 hours. Additionally, the baseline engine’s rated power measured at 331 bhp after 400 hrs for standard NATO conditions, on HRJP-8 fuel, is 88.3% of its advertised 375 bhp (DF-2) rating. With new
UNCLASSIFIED
16
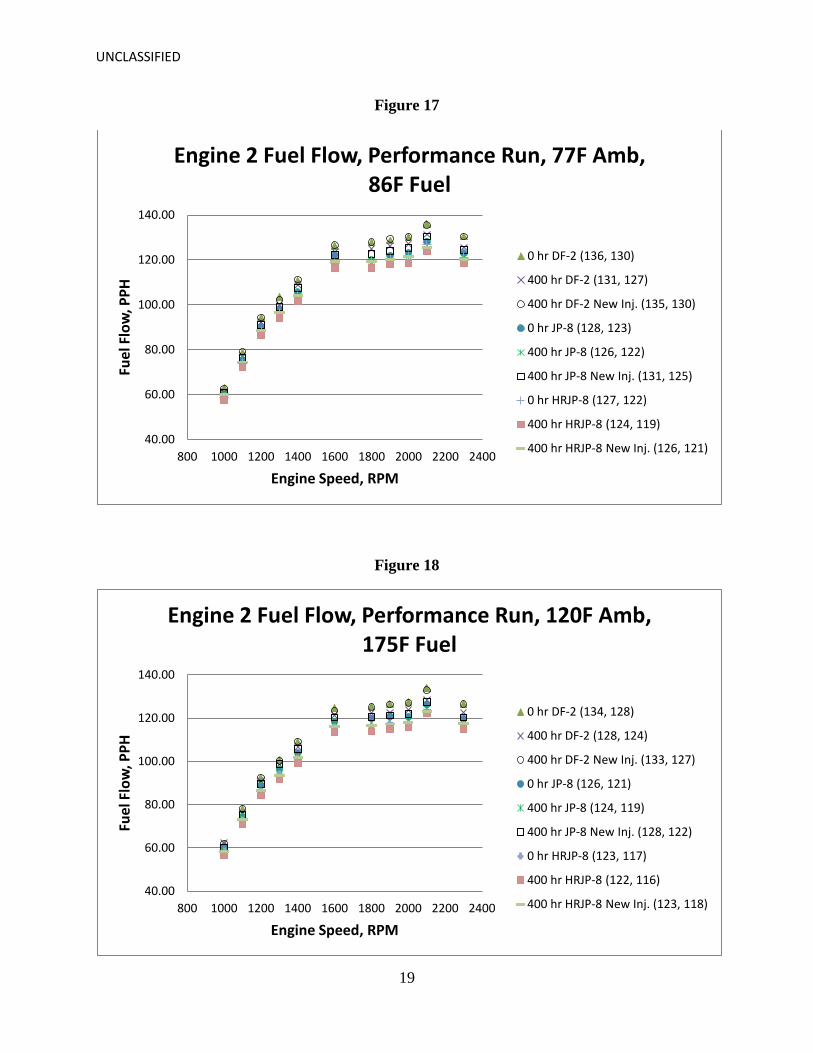
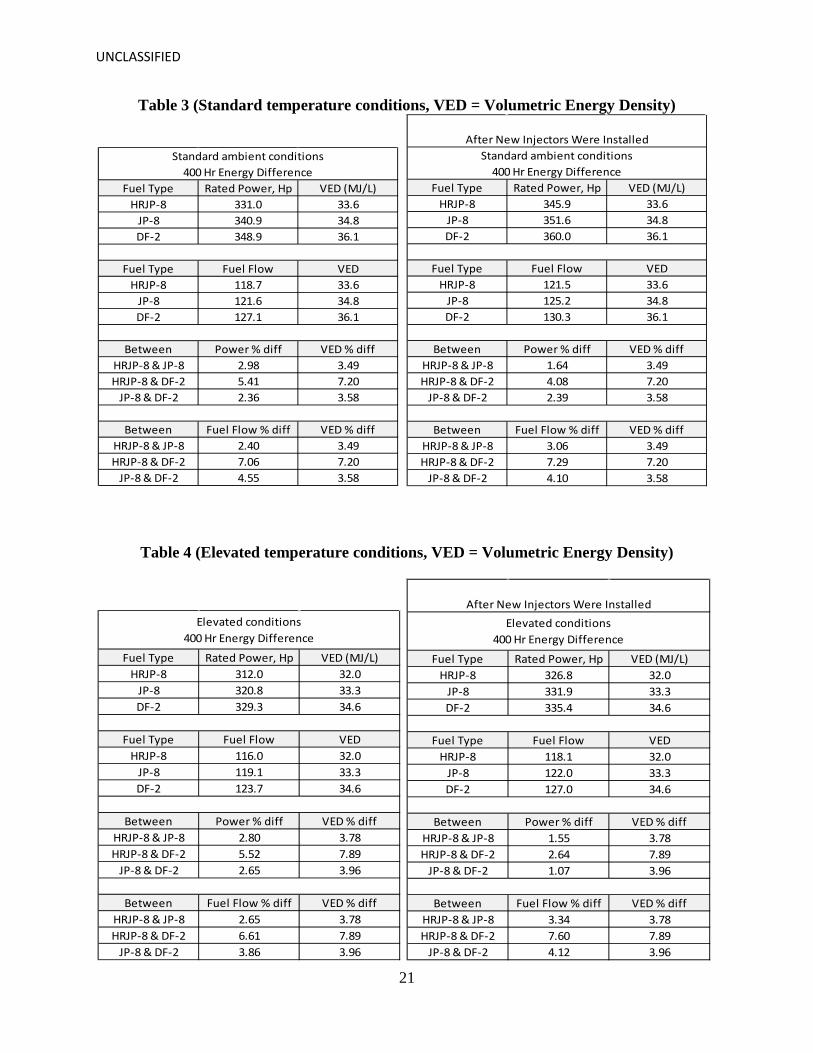
injectors installed at post 400 hours, the engine developed 346 bhp on JP-8 fuel, which represents 92.3% of its advertised 375 bhp (DF-2) rating. Therefore, the functional degradation of the factory installed injectors after operating for over 400 engine test hours accounts for the major loss in power and could ultimately determine if this particular engine would be able to pass a 400 hr NATO style endurance test when operating on HRJP-8 fuel. The full load BSFC values for standard NATO and elevated NATO (DOC) testing conditions are presented in Figs. 15 and 16, respectively. With the exception of some portions of a curve just crossing over another curve due to reading errors in the mass weigh beaker system, the BSFC values are representative and consistent with expected numbers for this engine operating on the fuels indicated. The full load fuel consumption rate for standard and elevated (DOC) NATO testing conditions are presented in Figs. 17 and 18, respectively. The graphs show the fuel consumption rate increasing with engine speed at the expected rate of change. The full load engine torque for standard and elevated NATO conditions are presented in Figs. 19 and 20, respectively. These figures show torque versus speed curves which are following expected trends similar to the power curves. The charts for the energy difference at standard and elevated temperatures after 400 hours show good trends when comparing power and fuel volumetric energy differences. Tables 3 and 4 (for standard and DOC, respectively) show that the energy difference between HRJP-8 and JP-8 fuel varied by 3.49 to 3.78 percent, but the variation is hard to quantify because the uncertainties with some of the instrumentation also vary as much as 2 to 3 percent. The power data shows to have varied by slightly less than 3 percent, but the variation in power and energy difference between the two fuels are very small. The data does show that there is a small decrease in power from JP-8 to the HRJP-8 fuel, and this is a result from the energy difference in the blended fuel being lower than that of the JP-8 fuel.

UNCLASSIFIED
17
Figure 13
Figure 14
140 160 180 200 220 240 260 280 300 320 340 360 380 400
800 1000 1200 1400 1600 1800 2000 2200 2400
Engi
ne P
ower
, BHP
Engine Speed, RPM
Engine 2 Power, Performance Run, 77F Amb, 86F Fuel
0 hr DF-2 (378, 372)
400 hr DF-2 (354, 349)
400 hr DF-2 New Inj. (364, 360)
0 hr JP-8 (364, 355)
400 hr JP-8 (348, 341)
400 hr JP-8 New Inj. (356, 352)
0 hr HRJP-8 (360, 353)
400 hr HRJP-8 (338, 331)
400 hr HRJP-8 New Inj. (350, 346)
140 160 180 200 220 240 260 280 300 320 340 360 380 400
800 1000 1200 1400 1600 1800 2000 2200 2400
Engi
ne P
ower
, BHP
Engine Speed, RPM
Engine 2 Power, Performance Run, 120F Amb, 175F Fuel
0 hr DF-2 (364, 355)
400 hr DF-2 (333, 329)
400 hr DF-2 New Inj. (337, 335)
0 hr JP-8 (350, 339)
400 hr JP-8 (327, 321)
400 hr JP-8 New Inj. (335, 332)
0 hr HRJP-8 (345, 333)
400 hr HRJP-8 (317, 312)
400 hr HRJP-8 New Inj. (330, 327)

UNCLASSIFIED
18
Figure 15
Figure 16
0.30
0.32
0.34
0.36
0.38
0.40
800 1000 1200 1400 1600 1800 2000 2200 2400
BSFC
, LBM
/BHP
*HR
Engine Speed, RPM
Engine 2 BSFC, Performance Run, 77F Amb, 86F Fuel
0 hr DF-2 (0.33, 0.33)
400 hr DF-2 (0.34, 0.35)
400 hr DF-2 New Inj. (0.34, 0.35)
0 hr JP-8 (0.32, 0.33)
400 hr JP-8 (0.34, 0.34)
400 hr JP-8 New Inj. (0.34, 0.34)
0 hr HRJP-8 (0.32, 0.32)
400 hr HRJP-8 (0.34, 0.34)
400 hr HRJP-8 New Inj. (0.33, 0.34)
0.30
0.32
0.34
0.36
0.38
0.40
0.42
0.44
800 1000 1200 1400 1600 1800 2000 2200 2400
BSFC
, LBM
/BHP
*HR
Engine Speed, RPM
Engine 2 BSFC, Performance Run, 120F Amb, 175F Fuel
0 hr DF-2 (0.34, 0.34)
400 hr DF-2 (0.36, 0.38)
400 hr DF-2 New Inj. (0.36, 0.37)
0 hr JP-8 (0.33, 0.34)
400 hr JP-8 (0.36, 0.37)
400 hr JP-8 New Inj. (0.36, 0.36)
0 hr HRJP-8 (0.33, 0.33)
400 hr HRJP-8 (0.35, 0.37)
400 hr HRJP-8 New Inj. (0.35, 0.36)
UNCLASSIFIED
19
Figure 17
Figure 18
40.00
60.00
80.00
100.00
120.00
140.00
800 1000 1200 1400 1600 1800 2000 2200 2400
Fuel
Flo
w, P
PH
Engine Speed, RPM
Engine 2 Fuel Flow, Performance Run, 77F Amb, 86F Fuel
0 hr DF-2 (136, 130)
400 hr DF-2 (131, 127)
400 hr DF-2 New Inj. (135, 130)
0 hr JP-8 (128, 123)
400 hr JP-8 (126, 122)
400 hr JP-8 New Inj. (131, 125)
0 hr HRJP-8 (127, 122)
400 hr HRJP-8 (124, 119)
400 hr HRJP-8 New Inj. (126, 121)
40.00
60.00
80.00
100.00
120.00
140.00
800 1000 1200 1400 1600 1800 2000 2200 2400
Fuel
Flo
w, P
PH
Engine Speed, RPM
Engine 2 Fuel Flow, Performance Run, 120F Amb, 175F Fuel
0 hr DF-2 (134, 128)
400 hr DF-2 (128, 124)
400 hr DF-2 New Inj. (133, 127)
0 hr JP-8 (126, 121)
400 hr JP-8 (124, 119)
400 hr JP-8 New Inj. (128, 122)
0 hr HRJP-8 (123, 117)
400 hr HRJP-8 (122, 116)
400 hr HRJP-8 New Inj. (123, 118)

UNCLASSIFIED
20
Figure 19
Figure 20
600 650 700 750 800 850 900 950
1000 1050 1100 1150 1200 1250 1300
800 1000 1200 1400 1600 1800 2000 2200 2400
Engi
ne To
rque
, LB-
FT
Engine Speed, RPM
Engine 2 Torque, Performance Run, 77F Amb, 86F Fuel
0 hr DF-2 (1271, 1255)
400 hr DF-2 (1182, 1152)
400 hr DF-2 New Inj. (1209, 1169)
0 hr JP-8 (1224, 1213)
400 hr JP-8 (1162, 1135)
400 hr JP-8 New Inj. (1186, 1165)
0 hr HRJP-8 (1214, 1203)
400 hr HRJP-8 (1133, 1110)
400 hr HRJP-8 New Inj. (1170, 1150)
600 650 700 750 800 850 900 950
1000 1050 1100 1150 1200 1250 1300
800 1000 1200 1400 1600 1800 2000 2200 2400
Engi
ne To
rque
, LB-
FT
Engine Speed, RPM
Engine 2 Torque, Performance Run, 120F Amb, 175F Fuel
0 hr DF-2 (1206, 1195)
400 hr DF-2 (1093, 1058)
400 hr DF-2 New Inj. (1126, 1096)
0 hr JP-8 (1169, 1160)
400 hr JP-8 (1067, 1026)
400 hr JP-8 New Inj. (1110, 1074)
0 hr HRJP-8 (1153, 1142)
400 hr HRJP-8 (1052, 985)
400 hr HRJP-8 New Inj. (1091, 1056)
UNCLASSIFIED
21
Fuel Type Rated Power, Hp VED (MJ/L)HRJP-8 331.0 33.6
JP-8 340.9 34.8DF-2 348.9 36.1
Fuel Type Fuel Flow VEDHRJP-8 118.7 33.6
JP-8 121.6 34.8DF-2 127.1 36.1
Between Power % diff VED % diffHRJP-8 & JP-8 2.98 3.49HRJP-8 & DF-2 5.41 7.20
JP-8 & DF-2 2.36 3.58
Between Fuel Flow % diff VED % diffHRJP-8 & JP-8 2.40 3.49HRJP-8 & DF-2 7.06 7.20
JP-8 & DF-2 4.55 3.58
Standard ambient conditions400 Hr Energy Difference
Fuel Type Rated Power, Hp VED (MJ/L)HRJP-8 345.9 33.6
JP-8 351.6 34.8DF-2 360.0 36.1
Fuel Type Fuel Flow VEDHRJP-8 121.5 33.6
JP-8 125.2 34.8DF-2 130.3 36.1
Between Power % diff VED % diffHRJP-8 & JP-8 1.64 3.49HRJP-8 & DF-2 4.08 7.20
JP-8 & DF-2 2.39 3.58
Between Fuel Flow % diff VED % diffHRJP-8 & JP-8 3.06 3.49HRJP-8 & DF-2 7.29 7.20
JP-8 & DF-2 4.10 3.58
After New Injectors Were InstalledStandard ambient conditions
400 Hr Energy Difference
Fuel Type Rated Power, Hp VED (MJ/L)HRJP-8 312.0 32.0
JP-8 320.8 33.3DF-2 329.3 34.6
Fuel Type Fuel Flow VEDHRJP-8 116.0 32.0
JP-8 119.1 33.3DF-2 123.7 34.6
Between Power % diff VED % diffHRJP-8 & JP-8 2.80 3.78HRJP-8 & DF-2 5.52 7.89
JP-8 & DF-2 2.65 3.96
Between Fuel Flow % diff VED % diffHRJP-8 & JP-8 2.65 3.78HRJP-8 & DF-2 6.61 7.89
JP-8 & DF-2 3.86 3.96
Elevated conditions400 Hr Energy Difference
Fuel Type Rated Power, Hp VED (MJ/L)HRJP-8 326.8 32.0
JP-8 331.9 33.3DF-2 335.4 34.6
Fuel Type Fuel Flow VEDHRJP-8 118.1 32.0
JP-8 122.0 33.3DF-2 127.0 34.6
Between Power % diff VED % diffHRJP-8 & JP-8 1.55 3.78HRJP-8 & DF-2 2.64 7.89
JP-8 & DF-2 1.07 3.96
Between Fuel Flow % diff VED % diffHRJP-8 & JP-8 3.34 3.78HRJP-8 & DF-2 7.60 7.89
JP-8 & DF-2 4.12 3.96
After New Injectors Were InstalledElevated conditions
400 Hr Energy Difference
Table 3 (Standard temperature conditions, VED = Volumetric Energy Density)
Table 4 (Elevated temperature conditions, VED = Volumetric Energy Density)
UNCLASSIFIED
22
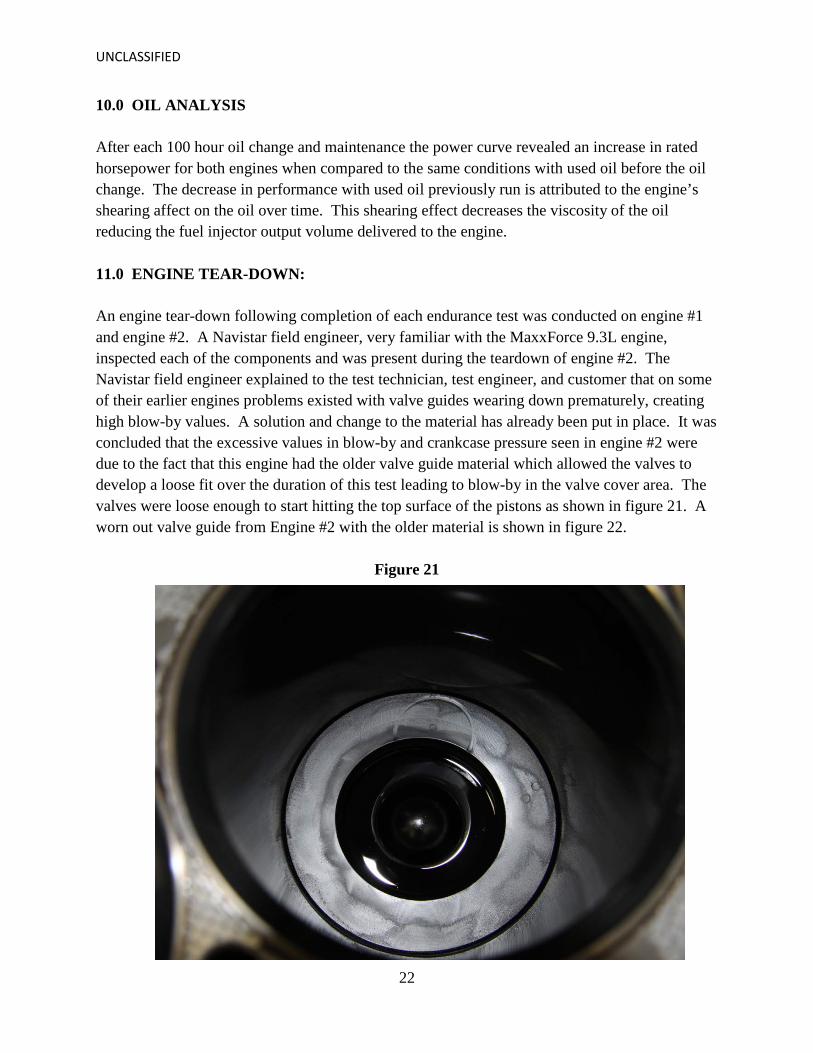
10.0 OIL ANALYSIS After each 100 hour oil change and maintenance the power curve revealed an increase in rated horsepower for both engines when compared to the same conditions with used oil before the oil change. The decrease in performance with used oil previously run is attributed to the engine’s shearing affect on the oil over time. This shearing effect decreases the viscosity of the oil reducing the fuel injector output volume delivered to the engine. 11.0 ENGINE TEAR-DOWN: An engine tear-down following completion of each endurance test was conducted on engine #1 and engine #2. A Navistar field engineer, very familiar with the MaxxForce 9.3L engine, inspected each of the components and was present during the teardown of engine #2. The Navistar field engineer explained to the test technician, test engineer, and customer that on some of their earlier engines problems existed with valve guides wearing down prematurely, creating high blow-by values. A solution and change to the material has already been put in place. It was concluded that the excessive values in blow-by and crankcase pressure seen in engine #2 were due to the fact that this engine had the older valve guide material which allowed the valves to develop a loose fit over the duration of this test leading to blow-by in the valve cover area. The valves were loose enough to start hitting the top surface of the pistons as shown in figure 21. A worn out valve guide from Engine #2 with the older material is shown in figure 22.
Figure 21

UNCLASSIFIED
23
Figure 22
12.0 PUMP AND FUEL INJECTOR ANALYSIS: After reviewing the fuel flow data, Navistar determined it was unnecessary to analyze the pump and fuel injectors since the data showed a consistent decrease in flow when comparing the fuels over the 400 hour test.

UNCLASSIFIED
A1-1
Appendix 1

UNCLASSIFIED
A1-2
Test Plan
Test Plan
Navistar MaxxForce D10 Engine Fuel Test

UNCLASSIFIED
A1-3
US ARMY TARDEC – GROUND VEHICLE POWER AND MOBILITY
TEST PLAN.v1_g
NAVISTAR MAXXFORCE D10/9.3L I-6 DIESEL ENGINE
COMPARISON TESTING OF JP-8 vs. SYNTHETIC JP-8 BLEND (HRJ)
NATO 400 HOUR DURABILITY TEST CYCLE AT DESERT OPERATING CONDITIONS
By: Matthew M. Hanselman Created: 12/20/2010, Revised: 01/31/2011
1.0 BACKGROUND In an effort to comply with US Army Regulation 70-12, Fuels and Lubricants Standardization Policy for Equipment Design, Operation and Logistic Support, the US Army TARDEC GVPM and NAC have taken the responsibility to test and evaluate synthetic (non-petroleum crude) based fuel usage in Jet and Diesel engines. Ultimately, results from this testing will be used to determine the suitability of blending synthetic derived fuels with petroleum kerosene fuels such as JET-A and Jet Propellant-8 (JP-8). Previous diesel engine testing has been performed at TARDEC with a Fischer-Tropsch (FT) synthesis manufacturing process yielding a Synthetic Paraffinic Kerosene (SPK). This testing described in this plan will also be on an SPK fuel; however, it is derived from a different manufacturing process called hydro-treatment, thus yielding Hydro-processed Renewable Jet (HRJ) fuel. The HRJ fuel being tested will be delivered for testing as a prescription 50/50 blend (vol.) meeting Military Spec. JP-8 (MIL-DTL-83133G). For the remainder of this document it will be referred to as “HRJP-8”. 2.0 OBJECTIVE The purpose of this testing is to quantitatively measure any changes in engine performance, durability or operating characteristic as compared to straight JP-8 and to also better understand the overall durability of the subject engine. The engine to be used in this testing is a Navistar Inc. MAXXFORCE D10/9.3L I-6 used to power the Navistar MRAP military vehicle. The test procedure and cycle is a modified version of the NATO Document AEP-5 Ver. 3 (aka NATO 400 Hour Durability). Modifications to this procedure are primarily increases to the operating temperatures of the engine coolant, combustion air and fuel supply to extremes seen during actual vehicle usage called Desert Operating Conditions (DOC). The focus will be on the engines entire fuel system. This consists of the fuel delivery system (lines, filter and low pressure pump), seals and fuel injectors (hydraulically-actuated unit type). Strict adherence to the pass/fail criteria of the NATO AEP-5 will not be followed since the focus of this testing is on identifying performance similarities and differences between DF-2, JP-8 and HRJP-8 as well as gathering general engine durability information. The first engine will perform a durability cycle on JP-8 and the second engine will follow performing a durability cycle on the HRJP-8. Prior to the start of the durability cycle, each engine will perform a break-in procedure and full load performance evaluations to baseline performance on DF-2, JP-8 and HRJP-8 fuels at both standard NATO AEP-5 and the modified DOC temperatures. If sufficient amounts of residual Fischer-Tropsch blended JP-8 (FTJP-8) is available in barrels from previous testing, it is possible that baseline performance testing will be accomplished. 3.0 TEST SET-UP AND GUIDELINES Navistar Engine Group (Division of Navistar Inc.) has agreed to lend TARDEC-NAC some test equipment and engine parts that aid in the set-up and testing of the two engines. These parts and equipment have been inventoried and will be return following the completion of testing. Below is a list of guidelines for installation and set-up.
1. Install the engine in test cell #1 using the best practices developed by TARDEC GVPM with the parts specified in the “GVPM Test Record Notebook”.

UNCLASSIFIED
A1-4
2. Install the test equipment, controllers, materials and instrumentation specified in the “GVPM Test Record Notebook and Navistar MAXXFORCE D10 Reference Material Notebook”.
3. Test measurements and data acquisition will be standard GVPM specification plus any additional requirements specified by the GVPM test engineer and the customer.
4. Test fire the engine on JP-8 fuel and exercise the engine, dynamometer, control equipment and instrumentation through the full operating range and verify proper function.
5. Calibration of the cell controllers to ensure the ability to quickly achieve normal and DOC bogeys. 6. Calibration of the dynamometer load cell and verify repeatable precision and accuracy. 7. Verify data acquisition is recorded at the required points and of frequency (Hz) required by the
customer. 8. Prior to the start of the cycle, each engine will run a break-in procedure recommended by
Navistar in accordance with the NATO AEP-5 procedure. 9. Engine maintenance will be performed at 100 hr intervals (see section 4.4.2 for details). 10. Engine baseline performance procedures will be done at 100 hr intervals (See section 4.2 for
more detailed information). 11. Engine oil samples will be taken at 0 hrs (after the initial performance evaluation procedure) and
at 100 hr test cycle intervals thereafter. Samples will be taken at the end of a daily 10 hr cycle while the engine is fully warmed. The 0, 100, 200, 300 and 400 hr samples will be analyzed by the TARDEC Fuels and Lubricants Dept. Oil samples will be 250 ml in size. Refer to Attachments A & B for additional information.
12. Engine oil is MIL Spec. SAE 15W-40 supplied in 2-55gal drums manufactured from the same lot. 13. Fuel samples will be taken on a need basis when new deliveries are made or tanks mixtures
change and will be analyzed by the TARDEC Fuels and Lubricants Dept. Fuel samples will be at least 1 US gal size in a metal can provided by the TARDEC Fuels and Lubricants Dept. Refer to Attachment C for further guidance.
14. Engine coolant is ethylene glycol “FLEET CHARGE” in 50/50 mixture with city water. 15. Fuel changes will be performed according to the best practices of TARDEC GVPM during the
baseline performance procedures. The following may be performed if deemed necessary to reduce blended fuel waste: Fuel lines will be disconnected as close to the engine as possible and fuel will be purged (wasted) from the supply and return lines, fuel heater and mass flow scale. The fuel filter will be removed, purged and reinstalled.
4.0 ENGINE BREAK-IN, PERFORMANCE BASELINE, NATO AEP-5 ver. 3 DURABILITY TEST PROCEDURES AND MAINTENANCE
4.1 BREAK-IN Each engine will run break-in on DF-2 fuel and operate at Normal conditions. The break-in cycle is the recommendation by Navistar Engine Group in accordance with the NATO AEP-5 procedure and is described below in Table 1A and 1B.
TABLE 1A
Time1 (min) Time2 (min) N (RPM) Load (Ft-Lbs) 0 5 800 200 5 10 800 400
10 15 800 600 15 20 1000 400 20 25 1000 600 25 30 1000 800 30 35 1400 600 35 40 1400 800 40 45 1800 800 45 50 1800 1100 50 55 2200 500 55 60 2200 700

UNCLASSIFIED
A1-5
TABLE 1B
4.2 BASELINE PERFORMANCE CHARACTERIZATION TEST Baseline performance testing will be conducted on four (4) different fuels at Normal and DOC conditions in series according to the following matrix below prior to the start of the NATO AEP-5 Durability cycle. Test points for engine speed and load are described below. The scheme for Table 2 will be repeated for each fuel in the following order, DF-2, JP-8, FTJP-8 & HRJP-8. Data acquisition shall be at least 1 Hz for 60 seconds at the end of each test point. Test point duration may need to differ from the values in Table 2 depending on the time required to stabilize.
TABLE 2
Repeat Table 2 for JP-8, FTJP-8 & HRJP-8 fuels.
Time1 (hr) Time2 (hr) N (RPM) Load (Ft-Lbs) 0 5 2000RATED FULL
Fuel Duration
(min) Conditions N (RPM) Load
DF-2 TBD
(______) Start /
Warm-up TBD
(______) TBD
(______) 6:00 Normal 2300 FULL
2100
2000 1900
1800
1600 1400 1300
1200
1100
1000
800
DOC 2300
2100
2000
1900
1800
1600 1400 1300
1200
1100
1000
800

UNCLASSIFIED
A1-6
4.3 NATO AEP-5 DURABILITY CYCLE TESTING (400 Hours) The durability cycle will begin at the completion of the baseline performance procedure. The first test engine will run on JP-8, the second will run on HRJP-8. Table 3 below describes the cycle test points and duration. The engines will be run at Desert Operating Conditions (DOC) described in Section 10.0, Table 4.
TABLE 3
Sub-Cycle Rated Speed 1 %, (rpm) Load
Sub-Cycle
Duration (hrs)
Total (hrs)
1 Idle, (800) 0% 0.5 0.5 2 100%, (2000) 100% 2.0 2.5 3 Governed, (2300) 0 (minimum) 0.5 3 4 75%, (1500) 100% 1.0 4
5 Idle, (800) … step to … 100%, (2000), repeat 11X.
0% (4min)… step to … 100% (6min), repeat 11X. 2.0 6
6 60% (1200) 100% 0.5 6.5 7 Idle, (800) 0% 0.5 7
8 Governed, (2300) 70%MEAS (_490_ Ft-Lbs) 0.5 7.5 9 Max Torque Speed, (1200) 100% 2.0 9.5
10 60%, (1200) 50% MEAS (_575_ Ft-Lbs) 0.5 10 1 Rated Speed is 2000 rpm
%MEAS % of measured load from initial performance test at corresponding engine speed.
4.4 PERFORMANCE CHARACTERIZATION TESTING AND MAINTENANCE
4.4.1 PERFORMANCE CHARACTERIZATION TESTING Performance characterization testing will occur at the end of each 100 Hr durability interval before all maintenance is performed described in Section 4.4.2. The test point and scheme is described in Table 2 of Section 4.2 at Normal and DOC conditions. Per NATO AEP-5, if the engine performance falls below 95% as compared to the baseline levels determined prior to the start of the durability test cycle, normal maintenance can be performed before re-testing. If repeat testing results still fall below 95%, the test cycle will be stopped until further review with the customer.
Immediately following the “on” cycle fuel type performance characterization testing, the “off” cycle fuel type(s) performance testing will be completed for as many types of fuel (ie. DF-2, others) that are available or at the request of the customer.
4.4.2 MAINTENANCE Normal scheduled maintenance will begin with an oil and oil filter change at initial engine installation. The oil and oil filter will be changed again following the end of the break-in procedure prior to the start of the initial full load performance characterization testing. Oil and oil filter changes will then occur at regular 100 hr durability cycle intervals following the performance characterization tests. Fuel filter changes will occur at the same time as the oil filter changes. Air filter changes will only occur if necessary to maintain a pressure delta across the filter element per NATO AEP-5 specifications. Record oil sampling in
UNCLASSIFIED
A1-7
Attachment B and also in the “GVPM Test Record Notebook”. Engine oil fill capacity is 13.0 qts. US (wet) including filter.
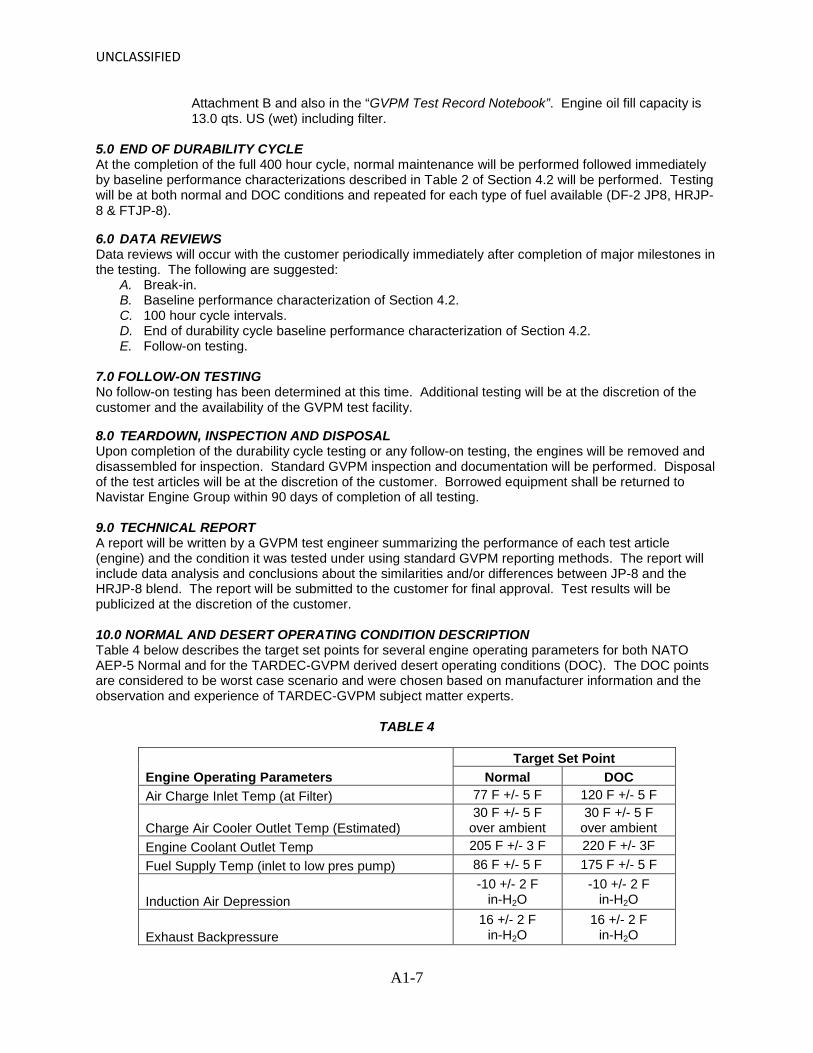
5.0 END OF DURABILITY CYCLE At the completion of the full 400 hour cycle, normal maintenance will be performed followed immediately by baseline performance characterizations described in Table 2 of Section 4.2 will be performed. Testing will be at both normal and DOC conditions and repeated for each type of fuel available (DF-2 JP8, HRJP-8 & FTJP-8).
6.0 DATA REVIEWS Data reviews will occur with the customer periodically immediately after completion of major milestones in the testing. The following are suggested:
A. Break-in. B. Baseline performance characterization of Section 4.2. C. 100 hour cycle intervals. D. End of durability cycle baseline performance characterization of Section 4.2. E. Follow-on testing.
7.0 FOLLOW-ON TESTING No follow-on testing has been determined at this time. Additional testing will be at the discretion of the customer and the availability of the GVPM test facility.
8.0 TEARDOWN, INSPECTION AND DISPOSAL Upon completion of the durability cycle testing or any follow-on testing, the engines will be removed and disassembled for inspection. Standard GVPM inspection and documentation will be performed. Disposal of the test articles will be at the discretion of the customer. Borrowed equipment shall be returned to Navistar Engine Group within 90 days of completion of all testing. 9.0 TECHNICAL REPORT A report will be written by a GVPM test engineer summarizing the performance of each test article (engine) and the condition it was tested under using standard GVPM reporting methods. The report will include data analysis and conclusions about the similarities and/or differences between JP-8 and the HRJP-8 blend. The report will be submitted to the customer for final approval. Test results will be publicized at the discretion of the customer. 10.0 NORMAL AND DESERT OPERATING CONDITION DESCRIPTION Table 4 below describes the target set points for several engine operating parameters for both NATO AEP-5 Normal and for the TARDEC-GVPM derived desert operating conditions (DOC). The DOC points are considered to be worst case scenario and were chosen based on manufacturer information and the observation and experience of TARDEC-GVPM subject matter experts.
TABLE 4
Engine Operating Parameters Target Set Point
Normal DOC Air Charge Inlet Temp (at Filter) 77 F +/- 5 F 120 F +/- 5 F
Charge Air Cooler Outlet Temp (Estimated) 30 F +/- 5 F
over ambient 30 F +/- 5 F
over ambient Engine Coolant Outlet Temp 205 F +/- 3 F 220 F +/- 3F Fuel Supply Temp (inlet to low pres pump) 86 F +/- 5 F 175 F +/- 5 F
Induction Air Depression -10 +/- 2 F
in-H2O -10 +/- 2 F
in-H2O
Exhaust Backpressure 16 +/- 2 F
in-H2O 16 +/- 2 F
in-H2O
UNCLASSIFIED
A1-8
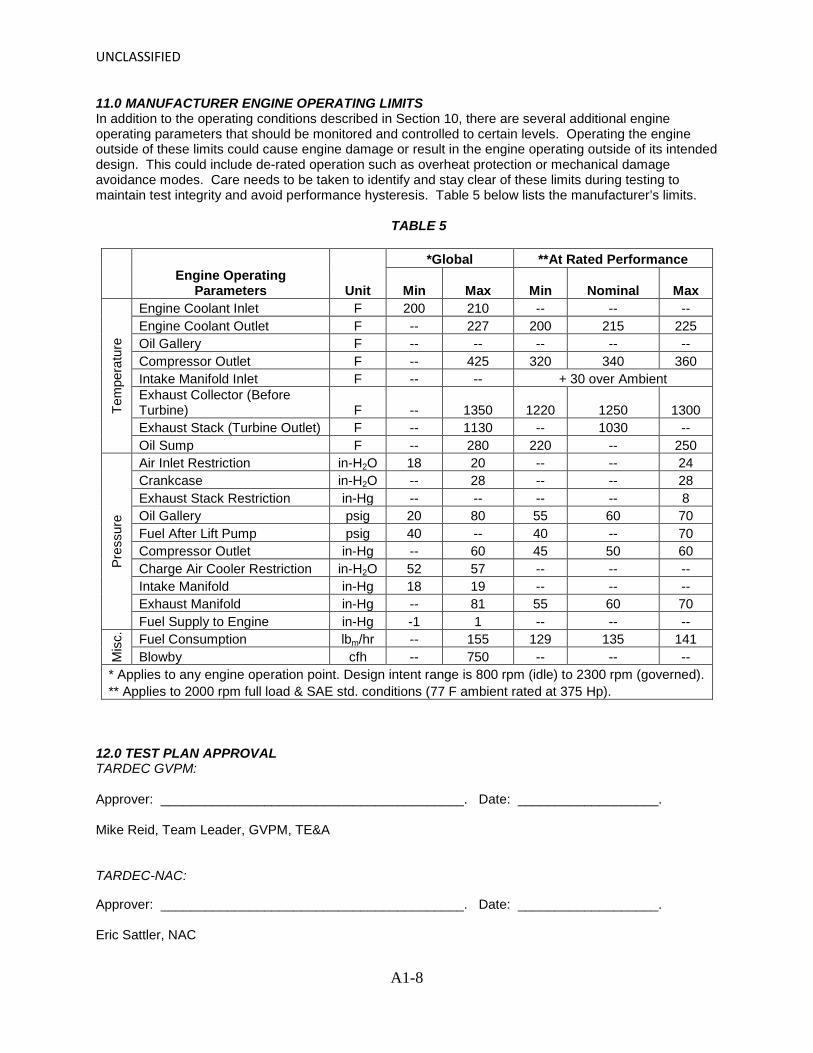
11.0 MANUFACTURER ENGINE OPERATING LIMITS In addition to the operating conditions described in Section 10, there are several additional engine operating parameters that should be monitored and controlled to certain levels. Operating the engine outside of these limits could cause engine damage or result in the engine operating outside of its intended design. This could include de-rated operation such as overheat protection or mechanical damage avoidance modes. Care needs to be taken to identify and stay clear of these limits during testing to maintain test integrity and avoid performance hysteresis. Table 5 below lists the manufacturer’s limits.
TABLE 5
*Global **At Rated Performance
Engine Operating Parameters Unit Min Max Min Nominal Max
Tem
pera
ture
Engine Coolant Inlet F 200 210 -- -- -- Engine Coolant Outlet F -- 227 200 215 225 Oil Gallery F -- -- -- -- -- Compressor Outlet F -- 425 320 340 360 Intake Manifold Inlet F -- -- + 30 over Ambient Exhaust Collector (Before Turbine) F -- 1350 1220 1250 1300 Exhaust Stack (Turbine Outlet) F -- 1130 -- 1030 -- Oil Sump F -- 280 220 -- 250
Pres
sure
Air Inlet Restriction in-H2O 18 20 -- -- 24 Crankcase in-H2O -- 28 -- -- 28 Exhaust Stack Restriction in-Hg -- -- -- -- 8 Oil Gallery psig 20 80 55 60 70 Fuel After Lift Pump psig 40 -- 40 -- 70 Compressor Outlet in-Hg -- 60 45 50 60 Charge Air Cooler Restriction in-H2O 52 57 -- -- -- Intake Manifold in-Hg 18 19 -- -- -- Exhaust Manifold in-Hg -- 81 55 60 70 Fuel Supply to Engine in-Hg -1 1 -- -- --
Mis
c.
Fuel Consumption lbm/hr -- 155 129 135 141 Blowby cfh -- 750 -- -- --
* Applies to any engine operation point. Design intent range is 800 rpm (idle) to 2300 rpm (governed). ** Applies to 2000 rpm full load & SAE std. conditions (77 F ambient rated at 375 Hp).
12.0 TEST PLAN APPROVAL TARDEC GVPM:
Approver: _________________________________________. Date: ___________________.
Mike Reid, Team Leader, GVPM, TE&A TARDEC-NAC:
Approver: _________________________________________. Date: ___________________. Eric Sattler, NAC

UNCLASSIFIED
A1-9
13.0 REVISION RECORD (revisions since approval signatures in Section 12.0)
Revision Date (MM/DD/YYYY) Brief Description of Change
Approval Initials
GVPM NAC
04 / 07 / 2011 Raised DOC Fuel Supply Temp set point from 165F to 175F (Table 4). MH
04 / 13 / 2011 Table 1A and 2, 900 rpm set point changed to 800 rpm. MH
04 / 13 / 2011 Added Table 3 Sub-cycles 8 & 10 load set points 490 & 575 Ft-lbs respectively. MH
04 / 13 / 2011 Turbo Compressor Outlet Temp increased from 375F to 425F (warning) & 450F (shutdown). MH
04 / 20 / 2011 Added engine oil fill capacity to section 4.4.2 MH
ATTACHMENT A – TEST OIL MANUFACTURING INFORMATION DATA FORM
Barrels 1 & 2 (55 GL) WT 444 CU 11.0 Record Below Initial MIL Performance 2104H Information: 9150-01-438-6079 MH Grade: 15W-40
Manufacturer Identification: SAFETY-KLEEN SYSTEMS, INC 30530 SPM4A6-09-D-0146
Date of Manufacture: MFD 09/10 TEST 08/13 Lot #: GM039/007 Qualification #: MC-3891
UNCLASSIFIED
A1-10
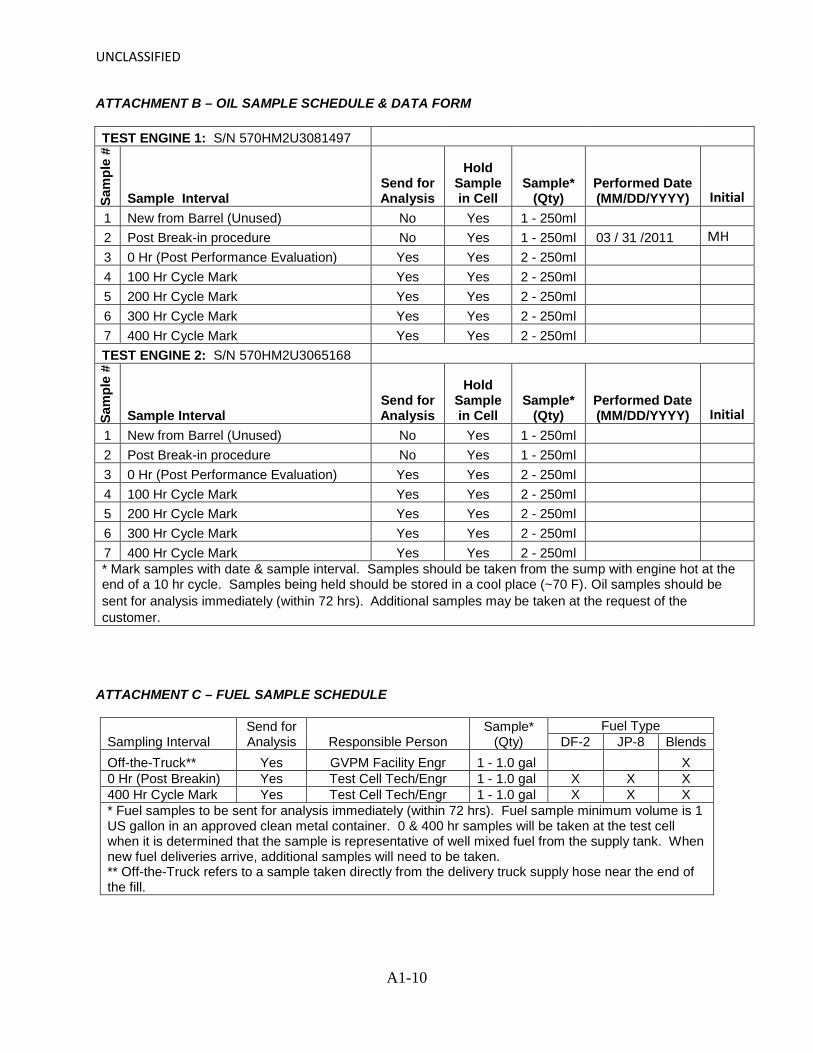
ATTACHMENT B – OIL SAMPLE SCHEDULE & DATA FORM TEST ENGINE 1: S/N 570HM2U3081497
Sam
ple
#
Sample Interval Send for Analysis
Hold Sample in Cell
Sample* (Qty)
Performed Date (MM/DD/YYYY) Initial
1 New from Barrel (Unused) No Yes 1 - 250ml
2 Post Break-in procedure No Yes 1 - 250ml 03 / 31 /2011 MH 3 0 Hr (Post Performance Evaluation) Yes Yes 2 - 250ml 4 100 Hr Cycle Mark Yes Yes 2 - 250ml 5 200 Hr Cycle Mark Yes Yes 2 - 250ml 6 300 Hr Cycle Mark Yes Yes 2 - 250ml 7 400 Hr Cycle Mark Yes Yes 2 - 250ml TEST ENGINE 2: S/N 570HM2U3065168
Sam
ple
#
Sample Interval Send for Analysis
Hold Sample in Cell
Sample* (Qty)
Performed Date (MM/DD/YYYY) Initial
1 New from Barrel (Unused) No Yes 1 - 250ml
2 Post Break-in procedure No Yes 1 - 250ml 3 0 Hr (Post Performance Evaluation) Yes Yes 2 - 250ml 4 100 Hr Cycle Mark Yes Yes 2 - 250ml 5 200 Hr Cycle Mark Yes Yes 2 - 250ml 6 300 Hr Cycle Mark Yes Yes 2 - 250ml 7 400 Hr Cycle Mark Yes Yes 2 - 250ml * Mark samples with date & sample interval. Samples should be taken from the sump with engine hot at the end of a 10 hr cycle. Samples being held should be stored in a cool place (~70 F). Oil samples should be sent for analysis immediately (within 72 hrs). Additional samples may be taken at the request of the customer.
ATTACHMENT C – FUEL SAMPLE SCHEDULE
Sampling Interval Send for Analysis Responsible Person
Sample* (Qty)
Fuel Type DF-2 JP-8 Blends
Off-the-Truck** Yes GVPM Facility Engr 1 - 1.0 gal X 0 Hr (Post Breakin) Yes Test Cell Tech/Engr 1 - 1.0 gal X X X 400 Hr Cycle Mark Yes Test Cell Tech/Engr 1 - 1.0 gal X X X * Fuel samples to be sent for analysis immediately (within 72 hrs). Fuel sample minimum volume is 1 US gallon in an approved clean metal container. 0 & 400 hr samples will be taken at the test cell when it is determined that the sample is representative of well mixed fuel from the supply tank. When new fuel deliveries arrive, additional samples will need to be taken. ** Off-the-Truck refers to a sample taken directly from the delivery truck supply hose near the end of the fill.
UNCLASSIFIED
A2 - 11
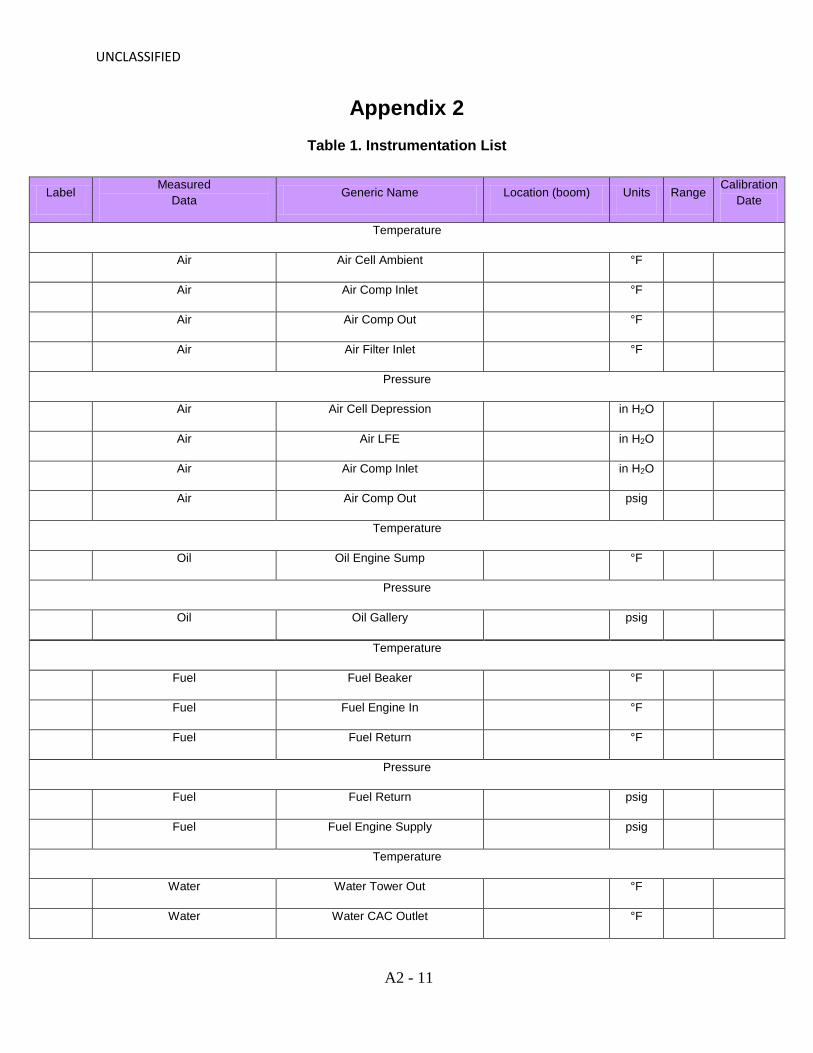
Appendix 2 Table 1. Instrumentation List
Label Measured
Data Generic Name Location (boom) Units Range
Calibration Date
Temperature
Air Air Cell Ambient °F
Air Air Comp Inlet °F
Air Air Comp Out °F
Air Air Filter Inlet °F
Pressure
Air Air Cell Depression in H2O
Air Air LFE in H2O
Air Air Comp Inlet in H2O
Air Air Comp Out psig
Temperature
Oil Oil Engine Sump °F
Pressure
Oil Oil Gallery psig
Temperature
Fuel Fuel Beaker °F
Fuel Fuel Engine In
°F
Fuel Fuel Return °F
Pressure
Fuel Fuel Return psig
Fuel Fuel Engine Supply psig
Temperature
Water Water Tower Out °F
Water Water CAC Outlet °F
UNCLASSIFIED
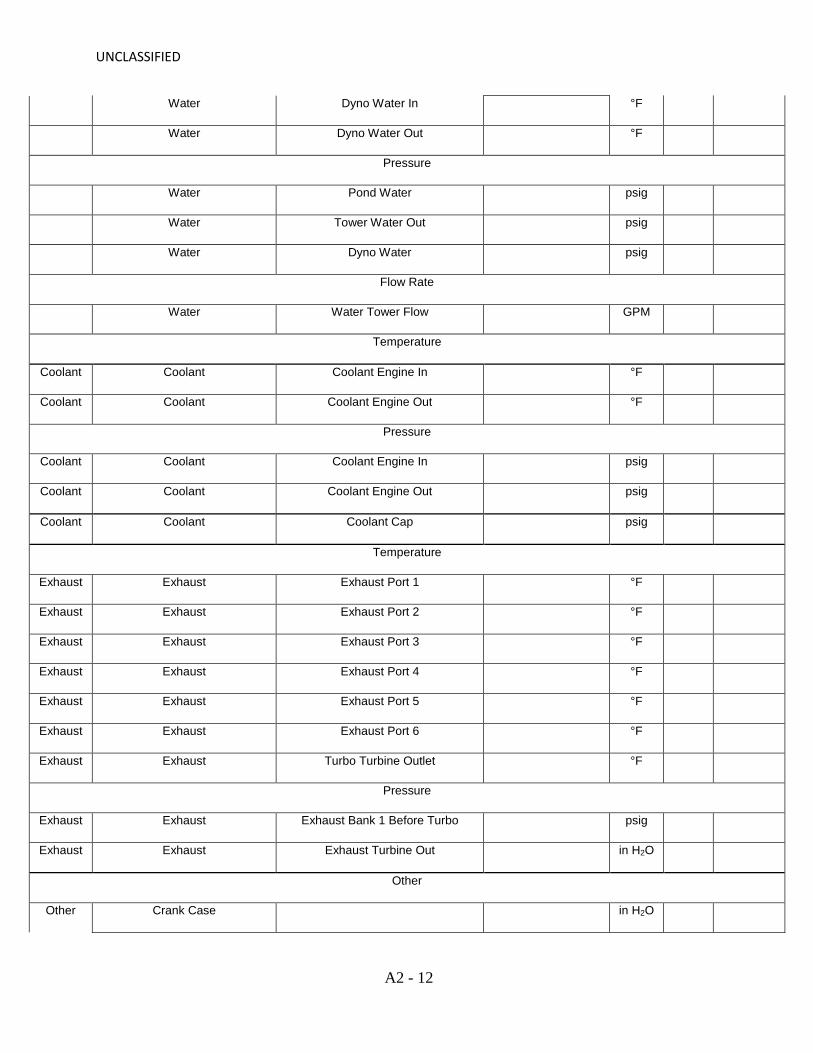
A2 - 12
Water Dyno Water In °F
Water Dyno Water Out
°F
Pressure
Water Pond Water psig
Water Tower Water Out psig
Water Dyno Water
psig
Flow Rate
Water Water Tower Flow GPM
Temperature
Coolant Coolant Coolant Engine In
°F
Coolant Coolant Coolant Engine Out
°F
Pressure
Coolant Coolant Coolant Engine In
psig
Coolant Coolant Coolant Engine Out
psig
Coolant Coolant Coolant Cap
psig
Temperature
Exhaust Exhaust Exhaust Port 1
°F
Exhaust Exhaust Exhaust Port 2
°F
Exhaust Exhaust Exhaust Port 3
°F
Exhaust Exhaust Exhaust Port 4
°F
Exhaust Exhaust Exhaust Port 5
°F
Exhaust Exhaust Exhaust Port 6
°F
Exhaust Exhaust Turbo Turbine Outlet
°F
Pressure
Exhaust Exhaust Exhaust Bank 1 Before Turbo
psig
Exhaust Exhaust Exhaust Turbine Out
in H2O
Other
Other Crank Case
in H2O
UNCLASSIFIED
A2 - 13
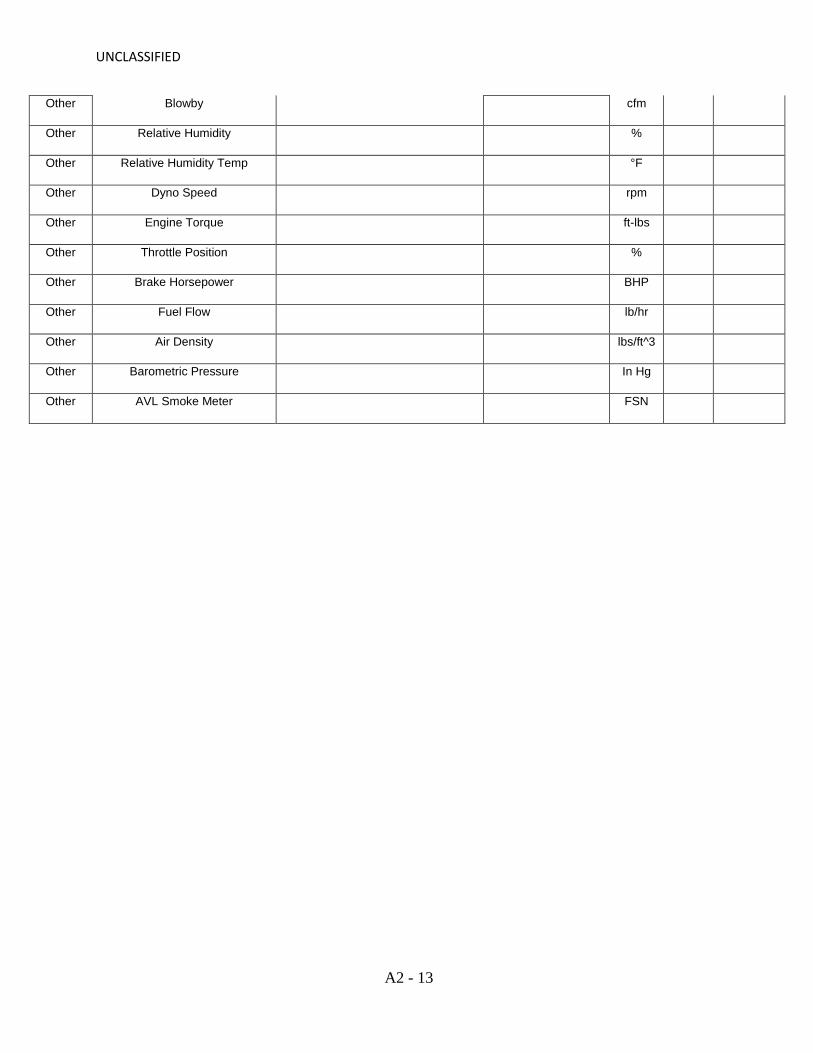
Other Blowby
cfm
Other Relative Humidity %
Other Relative Humidity Temp °F
Other Dyno Speed rpm
Other Engine Torque ft-lbs
Other Throttle Position %
Other Brake Horsepower
BHP
Other Fuel Flow
lb/hr
Other Air Density
lbs/ft^3
Other Barometric Pressure In Hg
Other AVL Smoke Meter FSN

UNCLASSIFIED
A3 - 1
Appendix 3
Engines #1 & #2 Sample Data
UNCLASSIFIED
A3 - 2
JP-8
100 H
RSEx
haus
t Po
rt 1Ex
haus
t Po
rt 2Ex
haus
t Po
rt 3Ex
haus
t Po
rt 4Ex
haus
t Po
rt 5Ex
haus
t Po
rt 6
Turbo
Tu
rbine
Ou
tlet
Air Ce
ll Am
bient
Air Fi
lter
Inlet
CAC I
nlet CA
C ou
tlet
Intak
e Ma
nifold
Coola
nt En
gine I
n
Coola
nt En
gine
Out
Oil S
ump
Temp
Fu
el Be
aker
Fuel
Engin
e In
RPM
Stand
ardDe
g FDe
g FDe
g FDe
g FDe
g FDe
g FDe
g FDe
g FDe
g FDe
g FDe
g FDe
g FDe
g FDe
g FDe
g FDe
g fDe
g F23
0010
60.60
1077
.4710
71.05
1027
.1810
60.12
1011
.6083
2.80
75.32
75.79
343.1
011
1.40
107.1
918
4.73
196.9
624
0.36
69.12
88.65
2100
1092
.2311
19.27
1108
.1310
70.68
1101
.3410
50.70
883.4
276
.1878
.5934
0.92
110.7
910
6.95
183.4
119
6.97
242.7
069
.1288
.0520
0010
74.26
1101
.9310
89.36
1046
.6410
71.33
1022
.1586
7.05
75.95
78.87
335.1
211
1.21
107.4
118
3.36
196.9
424
2.69
68.17
88.23
1900
1080
.4811
12.07
1098
.6910
61.29
1081
.2710
24.42
878.7
776
.5679
.5233
6.60
111.0
210
7.16
182.8
619
6.92
241.9
867
.2788
.1118
0010
69.05
1100
.3110
91.86
1058
.2110
73.62
1023
.0686
8.36
76.12
79.40
341.4
611
1.13
106.7
518
2.42
196.8
524
1.88
66.89
88.20
1600
1085
.5011
38.23
1132
.7611
09.92
1124
.2010
65.09
924.6
676
.9180
.6033
6.34
111.1
110
7.40
180.7
819
6.91
242.2
266
.5688
.0914
0010
40.47
1109
.7411
11.64
1091
.2810
90.14
1032
.2492
8.55
76.85
80.10
314.5
711
0.99
107.9
618
0.16
196.8
924
2.30
65.99
88.31
1300
1007
.8610
82.22
1087
.4610
72.46
1070
.6210
09.47
905.6
676
.4179
.8331
2.92
110.6
810
7.99
179.9
819
6.89
241.2
065
.8388
.1312
0010
07.99
1089
.7010
95.12
1075
.6710
72.41
1004
.0491
9.34
77.13
79.66
302.6
011
1.03
108.5
517
9.43
196.9
724
1.08
66.27
88.29
1100
1022
.6511
15.29
1122
.0310
95.03
1087
.1610
14.92
973.1
076
.2579
.8626
7.40
110.4
210
8.32
179.7
619
7.02
239.1
365
.8788
.1810
0010
42.13
1127
.7511
30.79
1100
.7910
93.63
1017
.5210
13.34
75.29
78.25
221.9
111
0.05
107.6
317
9.84
196.6
623
6.25
66.08
88.25
800
1041
.8910
68.09
1047
.5210
04.80
1022
.8396
0.49
938.1
674
.2877
.5417
6.37
112.9
410
9.00
181.0
719
6.78
232.4
566
.0188
.00DO
C23
0011
21.90
1128
.8911
17.23
1085
.3511
09.62
1073
.4087
3.05
110.6
112
0.43
403.6
615
2.03
145.6
320
6.37
219.5
326
4.37
79.92
170.9
821
0011
62.31
1181
.7511
64.36
1130
.0611
58.40
1104
.3392
8.14
110.7
911
9.44
401.9
315
1.73
145.9
320
5.38
219.5
826
6.00
79.36
171.2
120
0011
17.74
1143
.5711
32.27
1097
.8511
19.31
1066
.3189
5.44
111.3
312
1.26
400.2
715
1.76
146.4
320
5.25
219.5
326
5.54
78.64
172.5
119
0011
30.76
1160
.9111
46.16
1111
.0311
35.30
1077
.1391
0.77
111.9
612
1.54
400.8
515
1.75
146.6
020
4.75
219.3
526
4.90
77.36
172.5
018
0011
34.55
1163
.9011
50.71
1120
.7811
39.66
1087
.2291
8.82
113.0
512
0.25
400.2
615
1.87
147.0
420
4.17
219.3
326
5.05
77.05
173.2
816
0011
53.88
1201
.1411
91.80
1166
.0311
80.95
1115
.9396
7.96
113.0
012
0.43
397.0
315
1.59
147.0
820
2.57
219.5
226
5.88
76.75
173.5
014
0011
07.90
1173
.5311
72.64
1155
.3111
53.70
1085
.8297
9.07
113.9
712
0.89
374.3
615
1.68
147.7
220
1.36
219.0
426
6.04
79.26
173.4
613
0010
83.27
1161
.0911
60.07
1146
.3611
45.85
1074
.4997
1.89
115.5
212
0.92
367.7
715
1.90
148.3
220
1.72
219.4
526
4.73
79.73
173.1
712
0010
90.43
1174
.0011
73.59
1154
.0711
50.40
1070
.4498
9.43
116.6
212
0.03
358.2
315
2.01
148.2
220
0.69
219.1
726
4.48
80.57
172.6
511
0011
06.00
1208
.1012
07.65
1176
.5411
67.97
1086
.5310
57.06
116.3
212
1.50
317.6
815
2.12
148.7
020
0.99
219.3
926
1.79
80.68
171.9
710
0011
17.80
1221
.0712
15.75
1182
.0011
73.84
1083
.2911
04.78
117.3
812
1.33
272.2
015
2.13
148.3
820
1.64
218.9
925
7.71
81.56
171.6
180
011
43.27
1168
.7511
42.50
1076
.9310
96.18
1031
.4110
23.08
116.5
512
2.35
230.8
615
2.00
146.9
120
2.52
219.0
525
2.84
81.58
170.4
9
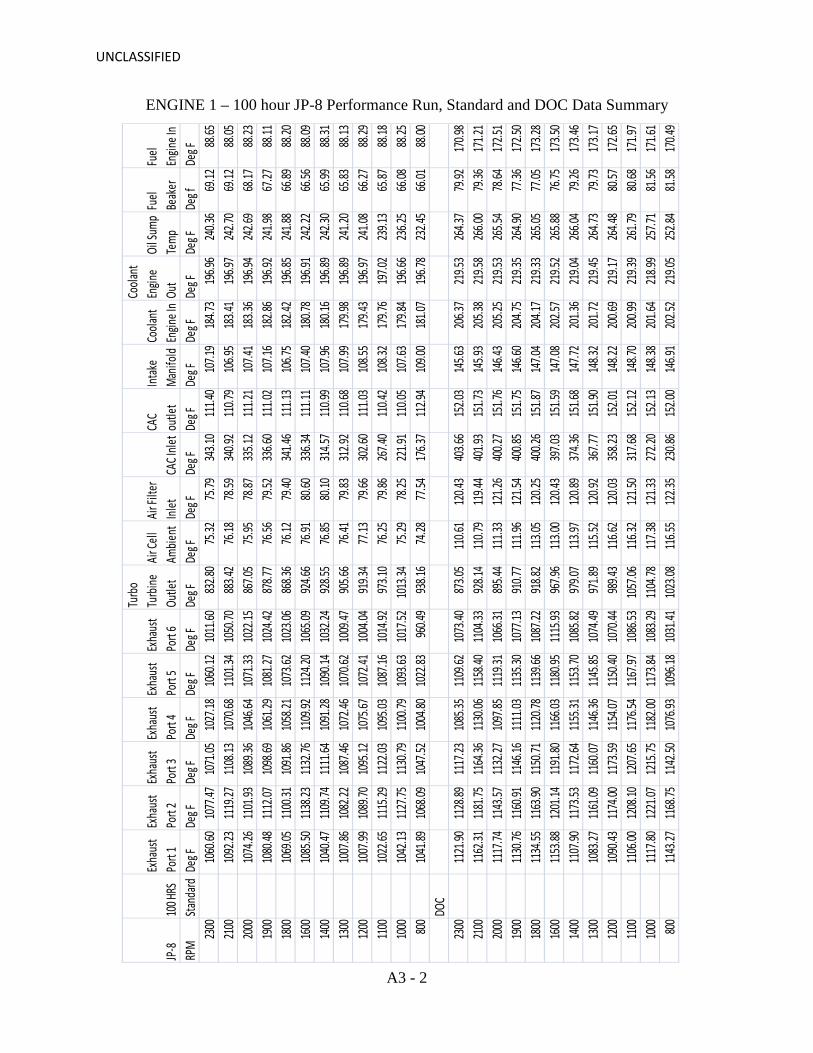
ENGINE 1 – 100 hour JP-8 Performance Run, Standard and DOC Data Summary

UNCLASSIFIED
A3 - 3
JP-8
100 H
RSAi
r LFE
Intak
e Ma
nifold
CAC
Delta
P
Exha
ust
Bank
1 B4
Tu
rbo
Exha
ust
Turb
ine
Out
Cran
kcas
e Oi
l Ga
llery
Fuel
Engin
e Su
pply
Coola
nt
Engin
e In
Coola
nt
Engin
e Ou
t Dy
no
Spee
dDy
no
Torq
ueTh
rottl
e Po
sition
Blowb
yBS
FCBH
P
Mass
Fuel
Flow
RPM
Stand
ardH2
OPs
igPs
igPs
igH2
OH2
OPs
ig Ps
igPs
igPs
igRP
MFt
Lbs
%CF
Mlb/
hp-h
rhp
lb/hr
2300
2.75
23.35
21.04
28.41
12.07
3.38
65.00
1.18
8.23
10.75
2299
.3372
4.13
99.00
-7.78
0.38
317.0
212
1.18
2100
2.64
24.67
18.90
26.31
13.20
3.37
63.00
1.22
7.70
9.99
2099
.2888
6.10
99.00
-7.33
0.36
354.2
512
7.55
2000
2.55
24.71
17.61
24.26
12.63
3.51
62.00
1.22
7.10
9.33
1999
.7091
8.25
99.03
-9.14
0.35
349.6
312
2.15
1900
2.52
25.32
16.89
23.25
12.03
3.49
61.00
1.20
7.22
9.31
1899
.9097
4.58
99.00
-9.30
0.35
352.5
212
2.05
1800
2.47
26.39
15.94
22.96
9.80
3.58
60.00
1.30
7.34
9.31
1800
.0010
33.15
99.00
-9.89
0.34
354.0
412
0.15
1600
2.33
26.78
13.87
20.02
10.06
3.22
58.00
1.30
7.59
9.36
1600
.0011
77.08
99.00
-9.36
0.33
358.6
211
9.44
1400
1.97
24.47
10.47
14.69
6.03
2.39
55.00
1.40
7.80
9.38
1400
.0211
97.42
100.0
0-7.
830.3
331
9.24
106.2
713
001.8
424
.279.3
714
.104.6
02.3
454
.001.5
07.8
89.3
813
00.28
1196
.7710
0.00
-7.71
0.34
296.3
299
.5712
001.6
722
.688.1
512
.324.0
72.0
353
.001.5
08.1
89.5
712
00.48
1184
.3210
0.00
-7.01
0.33
270.6
988
.9111
001.3
117
.696.2
07.9
53.4
91.6
051
.001.6
08.1
19.4
411
00.62
1059
.3399
.82-5.
660.3
422
1.98
74.80
1000
0.97
12.40
4.47
4.16
4.29
1.20
50.00
1.70
8.31
9.54
1000
.6788
3.30
99.72
-4.54
0.35
168.2
959
.3980
00.5
57.2
52.2
72.8
50.4
80.9
841
.001.8
08.6
09.6
980
1.00
616.5
210
0.00
-3.72
0.39
94.02
36.35
DOC
2300
2.93
23.18
20.89
25.98
5.45
3.20
60.00
1.30
8.18
10.83
2299
.1269
5.32
100.0
0-9.
580.3
930
4.44
118.7
621
002.7
724
.5918
.9923
.985.8
53.1
158
.031.3
07.4
59.9
520
99.13
855.9
310
0.00
-9.41
0.37
342.1
312
5.29
2000
2.69
24.85
17.91
22.53
3.50
3.23
57.22
1.30
6.98
9.41
1999
.4588
0.07
100.0
0-9.
550.3
633
5.05
119.1
619
002.6
125
.4717
.1021
.512.9
23.1
557
.001.3
67.0
99.4
118
99.80
937.2
310
0.00
-9.29
0.35
338.9
811
9.38
1800
2.51
25.98
16.01
20.34
2.24
3.26
56.00
1.33
7.24
9.44
1799
.9899
5.68
100.0
0-9.
730.3
534
1.19
118.1
716
002.3
326
.6013
.8018
.031.3
13.1
754
.001.4
07.5
09.4
916
00.00
1135
.1210
0.00
-9.60
0.34
345.8
311
7.60
1400
1.96
24.16
10.72
12.86
-1.10
2.28
51.13
1.53
7.74
9.52
1400
.0211
48.67
100.0
0-7.
590.3
530
6.24
105.4
913
001.7
823
.349.5
211
.89-1.
101.9
950
.001.6
17.8
39.5
613
00.17
1138
.4310
0.00
-7.02
0.34
281.8
694
.8812
001.5
721
.878.3
410
.39-1.
101.7
148
.001.7
08.1
79.8
012
00.42
1127
.9710
0.00
-6.48
0.34
257.8
388
.1011
001.2
016
.646.4
35.8
9-1.
101.2
147
.001.8
08.2
79.8
111
00.48
997.6
510
0.00
-5.16
0.35
209.0
473
.3310
000.8
711
.554.8
03.0
5-1.
100.9
044
.221.8
18.2
39.7
110
00.58
824.6
010
0.00
-4.21
0.39
157.1
061
.5880
00.4
56.9
92.7
82.3
0-1.
100.7
134
.801.9
08.3
79.7
580
1.00
577.4
010
0.00
-3.74
0.45
88.05
39.29

UNCLASSIFIED
A3 - 4
HRJ
100 H
rsEx
haus
t Po
rt 1Ex
haus
t Po
rt 2Ex
haus
t Po
rt 3Ex
haus
t Po
rt 4Ex
haus
t Po
rt 5Ex
haus
t Po
rt 6
Turbo
Tu
rbine
Ou
tlet
Air Ce
ll Am
bient
Air Fi
lter
Inlet
CAC I
nlet CA
C ou
tlet
Intak
e Ma
nifold
Coola
nt En
gine I
n
Coola
nt En
gine
Out
Oil S
ump
Temp
Fu
el Be
aker
Fuel
Engin
e In
RPM
Stand
ardDe
g FDe
g FDe
g FDe
g FDe
g FDe
g FDe
g FDe
g FDe
g FDe
g FDe
g FDe
g FDe
g FDe
g FDe
g FDe
g fDe
g F23
0010
54.16
1075
.7610
48.34
1041
.9910
55.91
1038
.0382
9.10
68.40
76.61
346.8
111
1.33
106.0
418
4.56
196.4
923
7.58
66.74
88.43
2100
1099
.1011
23.32
1101
.3210
93.03
1096
.1610
75.14
885.0
669
.9678
.4834
9.00
111.1
710
6.19
183.2
019
6.51
240.3
467
.8288
.5220
0010
72.14
1095
.1010
73.42
1066
.9510
75.67
1053
.8386
4.94
69.62
77.43
343.4
411
1.52
106.7
418
3.30
196.6
024
0.17
68.80
88.64
1900
1066
.2410
98.46
1078
.7410
73.22
1086
.6310
54.96
872.9
169
.9078
.4534
4.14
111.6
910
6.38
182.8
519
6.50
238.7
069
.1688
.6118
0010
54.70
1092
.4310
72.46
1064
.1210
76.51
1048
.0786
2.14
70.05
79.12
348.7
511
1.67
106.7
018
2.41
196.5
123
8.57
69.06
88.65
1600
1070
.9011
21.75
1105
.4311
01.95
1119
.6010
66.84
909.4
570
.6978
.7934
6.77
111.5
110
7.16
180.9
519
6.52
239.4
968
.8988
.6314
0010
25.44
1092
.6610
79.63
1081
.0311
04.03
1033
.8892
4.50
71.41
79.19
324.2
511
1.86
108.0
118
0.40
196.5
323
9.83
68.78
88.74
1300
996.1
510
64.21
1054
.1510
54.43
1074
.5910
05.69
896.1
170
.6679
.2332
3.40
111.5
010
7.84
180.2
819
6.50
239.2
468
.6288
.5112
0099
8.73
1073
.8510
60.62
1055
.8810
76.06
996.4
391
4.27
70.96
78.87
314.1
711
1.68
108.0
017
9.73
196.6
023
8.98
68.30
88.56
1100
997.8
210
89.20
1071
.6410
64.95
1082
.5310
01.04
959.8
171
.3979
.2127
8.86
111.4
310
8.41
179.9
819
6.62
236.5
168
.3688
.5010
0010
13.51
1097
.2210
74.80
1066
.5510
85.63
1004
.8599
5.73
71.45
78.62
236.3
911
2.08
109.0
918
0.39
196.4
523
3.51
68.22
88.19
800 DO
C23
0011
00.87
1116
.4510
96.44
1099
.3211
08.91
1106
.7186
9.01
115.6
612
2.19
406.6
914
9.24
142.7
120
6.63
219.5
626
2.43
74.79
178.8
121
0011
47.25
1170
.4511
49.73
1146
.6411
55.64
1141
.5193
0.03
117.1
412
4.51
405.9
014
9.37
143.4
120
5.35
219.5
026
3.82
74.74
179.0
120
0011
12.48
1132
.3411
11.48
1109
.4311
17.75
1102
.3989
2.21
118.5
312
6.02
406.7
514
9.38
143.3
820
5.44
219.5
026
3.70
74.10
179.7
419
0011
13.72
1141
.1711
17.62
1111
.5911
30.88
1107
.2990
2.38
120.6
212
7.80
406.6
814
9.34
143.6
320
5.12
219.4
526
2.79
73.45
179.3
118
0011
07.11
1141
.8211
19.79
1119
.5411
37.30
1103
.5491
0.48
121.2
112
9.12
406.4
914
9.29
143.5
520
4.50
219.4
426
2.40
72.95
178.9
716
0011
22.35
1174
.8911
55.28
1148
.2211
77.43
1119
.9195
7.24
122.2
212
9.23
405.6
414
9.30
144.1
320
3.12
219.4
826
2.79
72.74
179.5
914
0010
71.90
1142
.7511
29.11
1129
.0811
56.26
1078
.2796
9.19
121.7
812
8.99
383.6
114
9.08
144.6
720
2.58
219.4
826
2.17
72.70
179.5
213
0010
55.96
1132
.0211
15.46
1115
.4111
44.19
1069
.0696
4.02
121.5
412
7.94
376.9
314
9.42
145.2
820
2.09
219.4
226
0.91
72.93
179.4
212
0010
61.42
1140
.1811
18.49
1112
.2811
44.08
1064
.5597
5.82
123.2
912
7.88
369.9
714
9.37
145.8
220
1.45
219.2
426
0.84
73.69
179.2
411
0010
68.13
1158
.7011
30.38
1118
.8111
47.29
1063
.7610
25.78
120.9
912
3.52
330.2
414
9.53
145.6
220
1.91
219.3
525
8.45
73.45
178.5
310
0010
72.83
1163
.1011
43.51
1128
.6411
57.34
1072
.1010
79.71
120.9
712
4.18
283.8
114
7.30
143.1
820
2.00
218.9
125
4.91
74.21
178.0
5
ENGINE 2 – 100 hour HRJP-8 Performance Run, Standard and DOC Data Summary
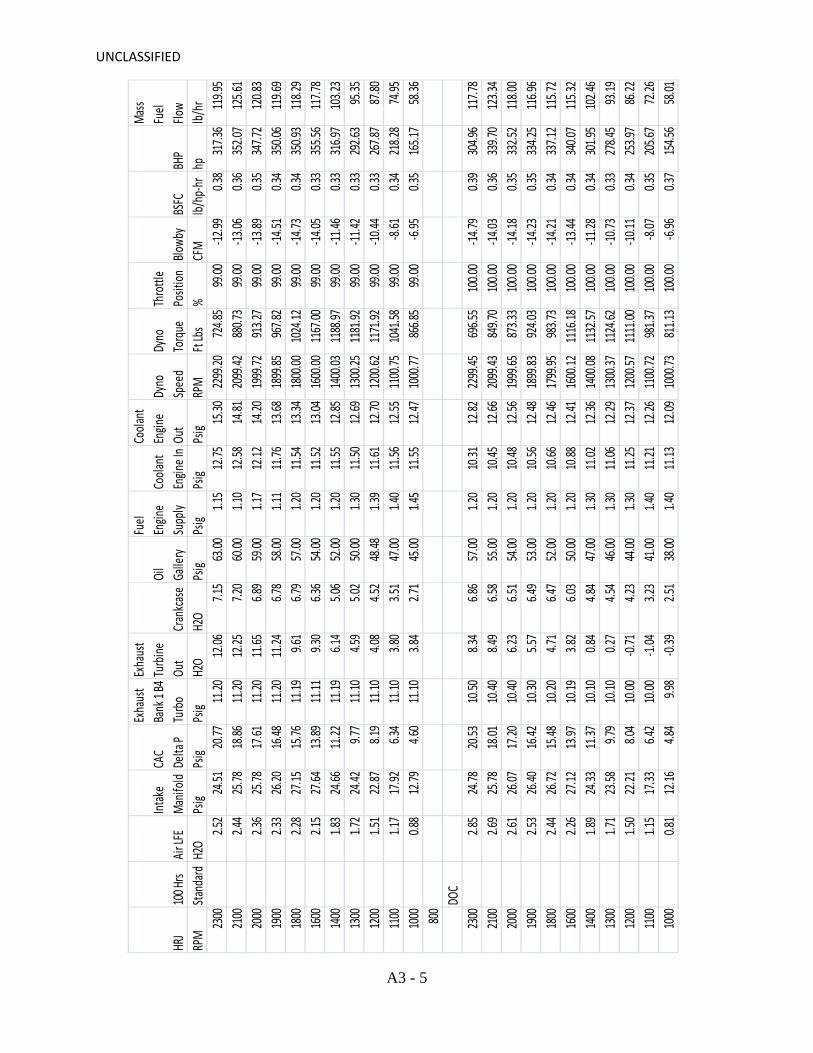
UNCLASSIFIED
A3 - 5
HRJ
100 H
rsAir
LFE
Intak
e Ma
nifold
CAC
Delta
P
Exha
ust
Bank
1 B4
Turbo
Exha
ust
Turbi
ne
Out
Crank
case
Oil
Galle
ry
Fuel
Engin
e Su
pply
Coola
nt En
gine I
n
Coola
nt En
gine
Out
Dyno
Sp
eed
Dyno
To
rque
Throt
tle
Posit
ionBlo
wby
BSFC
BHP
Mass
Fuel
Flow
RPM
Stand
ardH2
OPs
igPs
igPs
igH2
OH2
OPs
ig Ps
igPs
igPs
igRP
MFt
Lbs
%CF
Mlb/
hp-hr
hplb/
hr23
002.5
224
.5120
.7711
.2012
.067.1
563
.001.1
512
.7515
.3022
99.20
724.8
599
.00-12
.990.3
831
7.36
119.9
521
002.4
425
.7818
.8611
.2012
.257.2
060
.001.1
012
.5814
.8120
99.42
880.7
399
.00-13
.060.3
635
2.07
125.6
120
002.3
625
.7817
.6111
.2011
.656.8
959
.001.1
712
.1214
.2019
99.72
913.2
799
.00-13
.890.3
534
7.72
120.8
319
002.3
326
.2016
.4811
.2011
.246.7
858
.001.1
111
.7613
.6818
99.85
967.8
299
.00-14
.510.3
435
0.06
119.6
918
002.2
827
.1515
.7611
.199.6
16.7
957
.001.2
011
.5413
.3418
00.00
1024
.1299
.00-14
.730.3
435
0.93
118.2
916
002.1
527
.6413
.8911
.119.3
06.3
654
.001.2
011
.5213
.0416
00.00
1167
.0099
.00-14
.050.3
335
5.56
117.7
814
001.8
324
.6611
.2211
.196.1
45.0
652
.001.2
011
.5512
.8514
00.03
1188
.9799
.00-11
.460.3
331
6.97
103.2
313
001.7
224
.429.7
711
.104.5
95.0
250
.001.3
011
.5012
.6913
00.25
1181
.9299
.00-11
.420.3
329
2.63
95.35
1200
1.51
22.87
8.19
11.10
4.08
4.52
48.48
1.39
11.61
12.70
1200
.6211
71.92
99.00
-10.44
0.33
267.8
787
.8011
001.1
717
.926.3
411
.103.8
03.5
147
.001.4
011
.5612
.5511
00.75
1041
.5899
.00-8.
610.3
421
8.28
74.95
1000
0.88
12.79
4.60
11.10
3.84
2.71
45.00
1.45
11.55
12.47
1000
.7786
6.85
99.00
-6.95
0.35
165.1
758
.3680
0 DOC
2300
2.85
24.78
20.53
10.50
8.34
6.86
57.00
1.20
10.31
12.82
2299
.4569
6.55
100.0
0-14
.790.3
930
4.96
117.7
821
002.6
925
.7818
.0110
.408.4
96.5
855
.001.2
010
.4512
.6620
99.43
849.7
010
0.00
-14.03
0.36
339.7
012
3.34
2000
2.61
26.07
17.20
10.40
6.23
6.51
54.00
1.20
10.48
12.56
1999
.6587
3.33
100.0
0-14
.180.3
533
2.52
118.0
019
002.5
326
.4016
.4210
.305.5
76.4
953
.001.2
010
.5612
.4818
99.83
924.0
310
0.00
-14.23
0.35
334.2
511
6.96
1800
2.44
26.72
15.48
10.20
4.71
6.47
52.00
1.20
10.66
12.46
1799
.9598
3.73
100.0
0-14
.210.3
433
7.12
115.7
216
002.2
627
.1213
.9710
.193.8
26.0
350
.001.2
010
.8812
.4116
00.12
1116
.1810
0.00
-13.44
0.34
340.0
711
5.32
1400
1.89
24.33
11.37
10.10
0.84
4.84
47.00
1.30
11.02
12.36
1400
.0811
32.57
100.0
0-11
.280.3
430
1.95
102.4
613
001.7
123
.589.7
910
.100.2
74.5
446
.001.3
011
.0612
.2913
00.37
1124
.6210
0.00
-10.73
0.33
278.4
593
.1912
001.5
022
.218.0
410
.00-0.
714.2
344
.001.3
011
.2512
.3712
00.57
1111
.0010
0.00
-10.11
0.34
253.9
786
.2211
001.1
517
.336.4
210
.00-1.
043.2
341
.001.4
011
.2112
.2611
00.72
981.3
710
0.00
-8.07
0.35
205.6
772
.2610
000.8
112
.164.8
49.9
8-0.
392.5
138
.001.4
011
.1312
.0910
00.73
811.1
310
0.00
-6.96
0.37
154.5
658
.01
UNCLASSIFIED
A4 - 1
Appendix 4
Fuel and Oil Analysis
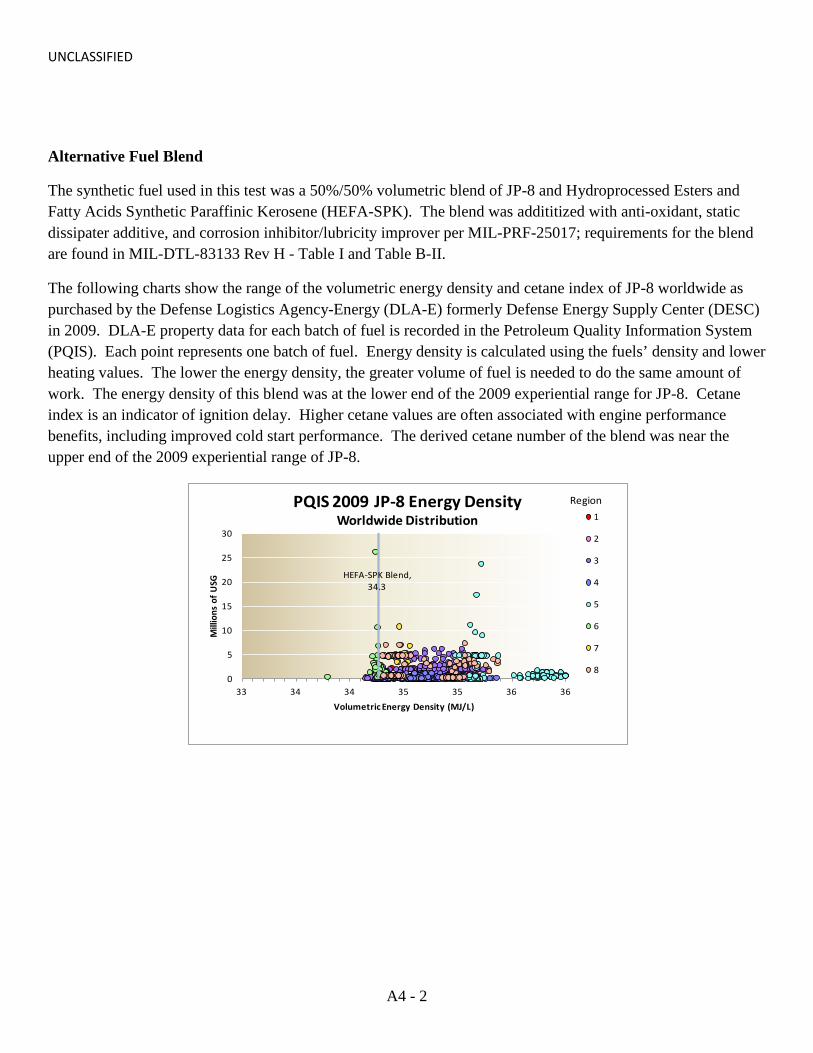
UNCLASSIFIED
A4 - 2
Alternative Fuel Blend
The synthetic fuel used in this test was a 50%/50% volumetric blend of JP-8 and Hydroprocessed Esters and Fatty Acids Synthetic Paraffinic Kerosene (HEFA-SPK). The blend was addititized with anti-oxidant, static dissipater additive, and corrosion inhibitor/lubricity improver per MIL-PRF-25017; requirements for the blend are found in MIL-DTL-83133 Rev H - Table I and Table B-II.
The following charts show the range of the volumetric energy density and cetane index of JP-8 worldwide as purchased by the Defense Logistics Agency-Energy (DLA-E) formerly Defense Energy Supply Center (DESC) in 2009. DLA-E property data for each batch of fuel is recorded in the Petroleum Quality Information System (PQIS). Each point represents one batch of fuel. Energy density is calculated using the fuels’ density and lower heating values. The lower the energy density, the greater volume of fuel is needed to do the same amount of work. The energy density of this blend was at the lower end of the 2009 experiential range for JP-8. Cetane index is an indicator of ignition delay. Higher cetane values are often associated with engine performance benefits, including improved cold start performance. The derived cetane number of the blend was near the upper end of the 2009 experiential range of JP-8.
HEFA-SPK Blend, 34.3
0
5
10
15
20
25
30
33 34 34 35 35 36 36
Mill
ions
of U
SG
Volumetric Energy Density (MJ/L)
PQIS 2009 JP-8 Energy DensityWorldwide Distribution 1
2
3
4
5
6
7
8
Region

UNCLASSIFIED
A4 - 3
Engine 1, Fuel
JP-8 Fuel Sample Analysis Used for 400 Hour Data
Min
for d
iese
l fue
l
HEFA-SPK Blend48.2
0
5
10
15
20
25
30
32 37 42 47
52 57
Mill
ions
of U
SG
Cetane Index (ASTM D 976)
PQIS 2009 JP-8 Cetane IndexWorldwide Distribution
1
2
3
4
5
6
7
8
Region

UNCLASSIFIED
A4 - 4
HRJP-8 Fuel Sample Analysis Used for 400 Hour Data
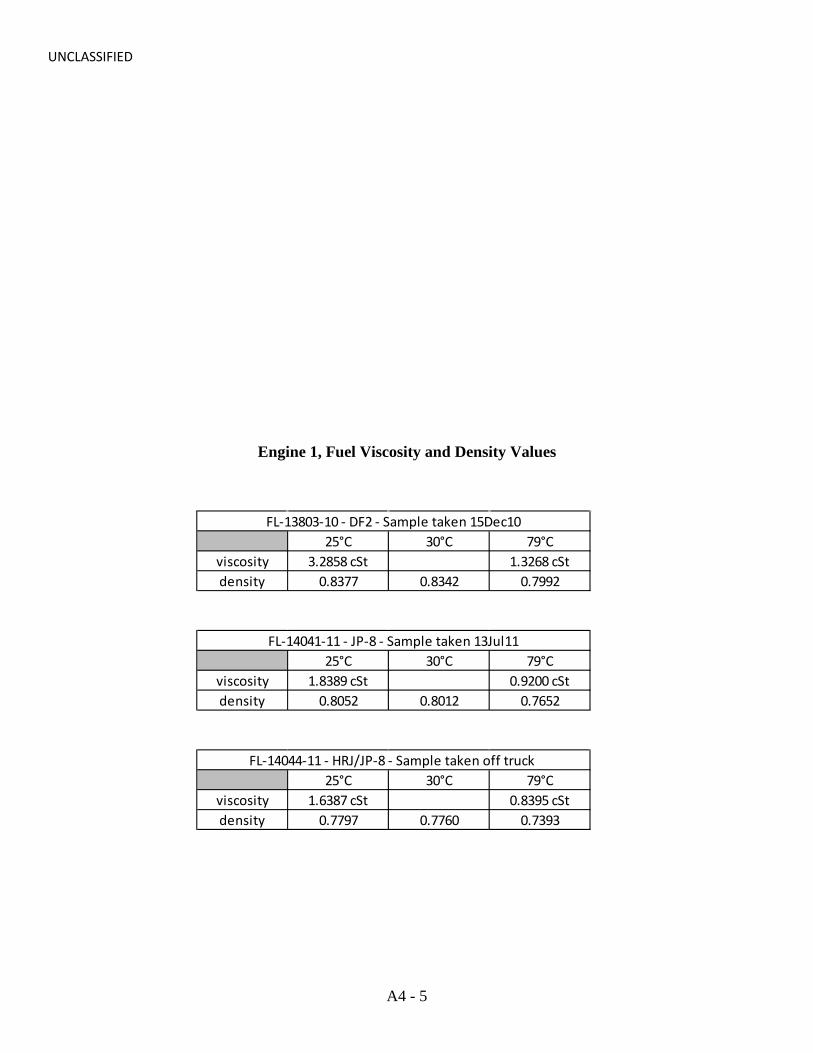
UNCLASSIFIED
A4 - 5
25°C 30°C 79°Cviscosity 3.2858 cSt 1.3268 cStdensity 0.8377 0.8342 0.7992
25°C 30°C 79°Cviscosity 1.8389 cSt 0.9200 cStdensity 0.8052 0.8012 0.7652
25°C 30°C 79°Cviscosity 1.6387 cSt 0.8395 cStdensity 0.7797 0.7760 0.7393
FL-13803-10 - DF2 - Sample taken 15Dec10
FL-14041-11 - JP-8 - Sample taken 13Jul11
FL-14044-11 - HRJ/JP-8 - Sample taken off truck
Engine 1, Fuel Viscosity and Density Values

UNCLASSIFIED
A4 - 6
Engine 1, Oil
Oil Sample Analyses for Engine 1 at 100 Hour Intervals

UNCLASSIFIED
A4 - 7
Engine 2 Fuel Analysis
WO-00995: 3 Apr 12Sample Dated: 25 Jan 12
JP-8 from cell #2Property Unit ASTM D min max FL-14266-12
Saybolt Color 156 17Total Acid Number mg KOH/g 3242 0.015 0.0071Aromatics 25.0 16.9Olefins 1.9Saturates 81.2Sulfur, total mass% 2622 0.30 0.08Distillation Temperature
IBP 169.610% recovered 205 194.620% recovered 200.950% recovered 215.390% recovered 242.9FBP 300 263.9Residue vol% 1.5 1.5Loss vol% 1.5 0.6
Flash Point °C 93 38 50.51298 0.81664052 0.81641298 41.74052 41.7
Freezing Point °C 7053 -47 -48.9445 5.77042 5.7445 1.57042 1.5
Viscosity @ 100°C 445 0.7Net Heat of Combustion MJ/kg 3338 42.8 43.2Hydrogen Content mass% 3343 13.4 13.7
976 44.04737 44.7
Derived Cetane Number 6890 46.33Copper Strip Corrosion 130 No.1 1AThermal Oxidation Stability
change in pressure drop mm Hg 25 7.57heater tube deposit visual rating <3 <4P
Existant Gum mg/100mL 381 7.0 0.9Particulate Matter mg/L 6217 1.0 0.2Water Separation Index 3948 70* 39Fuel System Icing Inhibitor vol% 5006 0.10 0.15 0.10Fuel Electrical Conductivity pS/m 2624 150 600 392BOCLE Wear Scar Diameter mm 5001 0.57
report
* = CI/LI additive spec requires that when added to fuel it will be able to meet a 0.65 max wear scar
not required
3241
not required*
Gravity @ 60°F API 37.0 51.0
Calculated Cetane Index report
Viscosity @ -20°C
Viscosity @ 40°Cmm2/s
8.0
not required
JP-8 IAW MIL-DTL-83133H Table 1
report
vol% 1319 Not required
reportreport
Density @ 15°C kg/L 0.775 0.840
86°C
report

UNCLASSIFIED
A4 - 8
Engine 2, Fuel Viscosity and Density Values

UNCLASSIFIED
A4 - 9
Engine 2, Oil
Oil Sample Analyses for Engine 2 at 100 Hour Intervals
![Gas Detection using Multibeam Mapping Sonar · Gas Detection using Multibeam Mapping Sonar Processed data 56.2 Predicted bubble Distance [m] displacement 50.5 54.3 HYDRO 2010 04.11.2010,](https://static.fdocuments.net/doc/165x107/5e6855db021fec61e211231e/gas-detection-using-multibeam-mapping-sonar-gas-detection-using-multibeam-mapping.jpg)