DuPont at Bernstein's 31st Annual Strategic Decisions Conference 2015
25
May 27, 2015 EXECUTING OUR TRANSFORMATION FOR HIGHER GROWTH, HIGHER VALUE Ellen Kullman, Chair of the Board and CEO E. I. du Pont de Nemours and Company
-
Upload
dupontinv -
Category
Investor Relations
-
view
6.044 -
download
0
Transcript of DuPont at Bernstein's 31st Annual Strategic Decisions Conference 2015

May 27, 2015
EXECUTING OUR TRANSFORMATION FOR
HIGHER GROWTH, HIGHER VALUE
Ellen Kullman, Chair of the Board and CEO
E. I. du Pont de Nemours and Company

REGULATION G
The attached charts include company information that does not conform with generally accepted accounting principles (GAAP).
Management believes the use of these non-GAAP measures are meaningful to investors because they provide insight with respect to
operating results of the company and additional metrics for use in comparison to competitors. These measures should not be viewed as
an alternative to GAAP measures of performance. Furthermore, these measures may not be consistent with similar measures used by
other companies. This data should be read in conjunction with previously published company reports on Forms 10-K, 10-Q, and 8-K.
These reports, are available on the Investor Center of www.dupont.com. Reconciliations of non-GAAP measures to GAAP are also
included with this presentation.
FORWARD-LOOKING STATEMENTS
This document contains forward-looking statements which may be identified by their use of words like “plans,” “expects,” “will,”
“believes,” “intends,” “estimates,” “anticipates” or other words of similar meaning. All statements that address expectations or
projections about the future, including statements about the company’s strategy for growth, product development, regulatory approval,
market position, anticipated benefits of recent acquisitions, timing of anticipated benefits from restructuring actions, outcome of
contingencies, such as litigation and environmental matters, expenditures and financial results, are forward looking statements.
Forward-looking statements are not guarantees of future performance and are based on certain assumptions and expectations of future
events which may not be realized. Forward-looking statements also involve risks and uncertainties, many of which are beyond the
company’s control. Some of the important factors that could cause the company’s actual results to differ materially from those projected
in any such forward-looking statements are: fluctuations in energy and raw material prices; failure to develop and market new products
and optimally manage product life cycles; ability to respond to market acceptance, rules, regulations and policies affecting products
based on biotechnology; significant litigation and environmental matters; failure to appropriately manage process safety and product
stewardship issues; changes in laws and regulations or political conditions; global economic and capital markets conditions, such as
inflation, interest and currency exchange rates; business or supply disruptions; security threats, such as acts of sabotage, terrorism or
war, weather events and natural disasters; ability to protect and enforce the company’s intellectual property rights; successful
integration of acquired businesses and separation of underperforming or non-strategic assets or businesses and successful completion
of the proposed spinoff of the Performance Chemicals segment including ability to fully realize the expected benefits of the proposed
spinoff. The company undertakes no duty to update any forward-looking statements as a result of future developments or new
information.
DEVELOPING MARKETS
Total developing markets is comprised of Developing Asia, Developing Europe, Middle East & Africa, and Latin America. A detailed list
of all developing countries is available on the Earnings News Release link on the Investor Center website at www.dupont.com.
2

3
DuPont is a Science Company
We work collaboratively to find sustainable, innovative, market-
driven solutions to solve some of the world’s biggest challenges,
making lives better, safer, and healthier for people everywhere.
Our Purpose
© National Geographic Image

Delivering On Our Commitments
…Have Yielded Clear Results Key Strategic Objectives Established in 2009...
Emerge from the Global Financial Crisis
as a stronger company
Realign portfolio around core science capabilities
to generate higher growth with less volatility
Strengthen market driven innovation
Hyperfocus on cost reduction and
increased efficiency
Optimize operational performance
Initiate disciplined growth plans to allow for
increased capital return to shareholders
266% In total shareholder return
under management(1)
188% Growth in adjusted
operating EPS(2)
$9B
In 2014 revenue from
products introduced in the
last four years(3)
32% Reduction in management
headcount
740bps Expansion in segment
adjusted operating margin(4)
$14B In total capital returned to
shareholders(5)
4
1
2
3
4
5
6

Agriculture & Nutrition
43%
Bio-Based Industrials
4%
Advanced Materials
35%
Performance Chemicals
18% Agriculture &
Nutrition 26%
Advanced Materials
40%
Performance Chemicals
20%
Performance Coatings
14%
Acquisitions:
Higher Growth
Strong Strategic Fit
Positioning For Higher Growth, Higher Value
Strategic Portfolio Transformation
2008 DuPont
Sales: $30.7B(6)
2014 DuPont
Sales: $35.0B(6)
Divestitures:
Less Strategic Fit
Performance Coatings
Performance Chemicals
5

Build and Leverage World Leading Positions In Three Highly Attractive Strategic Focus Areas
Strategy to Deliver Higher Growth and Higher Value
6
Extend our leadership
across the high-value,
science-driven segments
of the agriculture and
food value chain
Strengthen and grow
our leading position in
differentiated high-value
materials and leverage
new sciences
Develop world-leading
industrial biotechnology
capabilities to create
transformational new
bio-based businesses
Agriculture
& Nutrition
Bio-Based
Industrials
Advanced
Materials

7
Nutrition &
Health Performance
Materials
Safety &
Protection
Industrial
Biosciences Electronics &
Communications Agriculture
2014 Sales*: $11.3B
Operating Earnings*: $2.4B
2014 Sales*: $3.5B
Operating Earnings*: $0.4B
Segments
* Segment sales include transfers. Operating earnings is defined as segment pre-tax operating income (GAAP) less significant items. See
appendix for reconciliation of non-GAAP measures.
2014 Sales*: $1.3B
Operating Earnings*: $0.2B
2014 Sales*: $2.4B
Operating Earnings*: $0.4B
2014 Sales*: $6.1B
Operating Earnings*: $1.3B
2014 Sales*: $3.9B
Operating Earnings*: $0.8B
AG & NUTRITION ADVANCED MATERIALS BIOBASED INDUSTRIALS
© National Geographic Image
Performance Chemicals 2014 Sales: $6.5B
Operating Earnings*: $0.9B

8
Strong Execution Will Continue to Deliver Superior Growth
Actively Manage
the Portfolio
Drive Operational
Efficiency and
Effectiveness
Increase Penetration
in Developing
Markets and Deliver
Local Solutions
Leverage
Innovation
Platform to
Generate Above
Market Growth
© National Geographic Image

Deliver Innovative Solutions from Our World-Leading Pipeline To Grow 2-3x GDP
Large and Growing Attractive Markets(7)
Core Markets 2020
Size ($B)*
Sales
CAGR
Seeds & Traits $60+ 6-10%
Crop Protection Products $70+ 5-7%
Specialty Food
Ingredients $45+ 6-8%
*Expected 2020 Addressable Market Size
9
Agriculture & Nutrition
Total Expected Addressable Market: $175B+ by 2020

10
Agriculture & Nutrition
Optimum AQUAMax® Hybrids Plenish®Soybeans HOWARU® Premium Probiotics
© National Geographic Image
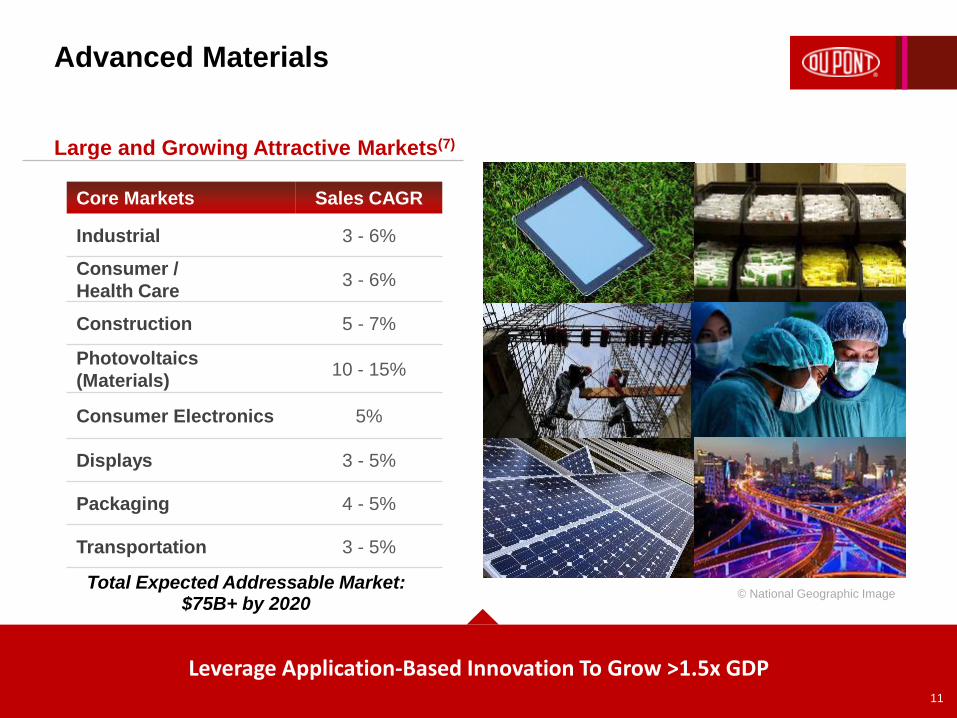
Leverage Application-Based Innovation To Grow >1.5x GDP
Large and Growing Attractive Markets(7)
Core Markets Sales CAGR
Industrial 3 - 6%
Consumer /
Health Care 3 - 6%
Construction 5 - 7%
Photovoltaics
(Materials) 10 - 15%
Consumer Electronics 5%
Displays 3 - 5%
Packaging 4 - 5%
Transportation 3 - 5%
Total Expected Addressable Market: $75B+ by 2020
11
© National Geographic Image
Advanced Materials

12
Sustainable Transportation
Advanced Materials
© National Geographic Image

Develop World-Leading Industrial Biotechnology To Drive Rapid Market Expansion and Grow >3x GDP
Large and Growing Attractive Markets(19)
13
Bio-Based Industrials
Total Expected Addressable Market: ~$50B+ by 2020
Core Markets 2014
Size ($B)
Sales
CAGR
Animal Nutrition $1.4 4 - 7%
Home & Personal Care $1.1 5 - 7%
Food Enzymes $1.2 6 - 8%
Grain Processing $0.9 8%+
PDO & PTT ~$2.0 10%+

14
Bio-Based Industrials
Home & Personal Care Market
Bio-based Polymers, Films and Fibers Market

Positioned To Lead Industrial Bio-Based
Technology Revolution Advanced Materials
Seed Coatings / Protection
Healthier Oils & Foods
Significant Bio-Based Opportunities
Agriculture & Nutrition
Enormous Market Potential With Unique and Superior Set of Essential Capabilities
15
Bio-based Industrials
Renewable Chemicals Cellulosic
Value Chains
Packaging Renewable Materials
Energy Production & Efficiency
Animal Nutrition & Wellness
Biologicals Home & Personal
Care

9.5%
14.1%
16.9%
2008 2011 2014
$20.1
$26.0
$28.5
2008 2011 2014
2008 – 2014
Total Segment Sales ($B)(8)
2008 – 2014
Segment Adjusted Operating Margin(4)
Continued Innovation and Operational Execution Have Driven Sales Growth and Margin Improvement
Our Transformation Strategy is Working
16

$1.10 $0.65
$1.89 $2.03 $2.23
$3.00 $3.17
$1.32
$1.26
$1.43
$1.99 $1.54
$0.88 $0.84
$2.42
$1.91
$3.32
$4.02 $3.77 $3.88
$4.01
2008 2009 2010 2011 2012 2013 2014
Ongoing Business Performance Chemicals and Pharma
Resulting in Strong Earnings Growth
2008 – 2014 Adjusted Operating EPS(9)
The Success of DuPont’s Transformation Is Evident In The Growth of Our Ongoing Business
17

Result
• Significant complexity reduction
with clear accountabilities and
performance measurement
• Core functions will serve
business units at lowest cost
• Transactional activities in
service centers employing
standard business processes
• Improved organization agility
with spans, layers and levels
better than benchmark
• Operational improvements will
increase plant efficiency and
optimize logistics
Operational Redesign Will Have A Significant And
Sustainable Benefit
Cost Reductions
Q4 2015
Run Rate
2017
Total Cost
Reduction
Costs Eliminated at
Performance Chemicals
Separation
$375 $375
Redesign, Simplify and
Standardize Company-
Wide Processes
Business Organizational
& Asset Streamlining
$625 $925
Target Annual Savings: $1,000 $1,300
“Fresh Start” Represents Another Step Towards Optimizing Operational Efficiency
Target Annual Savings ($MM)
18

$1B
$3B
$5B
$7B
$10B
$14B
2009 2010 2011 2012 2013 2014Cumulative Dividends Cumulative Buybacks
Successful Execution Has Enabled Significant
Return of Capital to Shareholders
Capital Returned as % of Market Cap
(2009 – 2014)(11)
Total Capital Returned to Shareholders(5) Strong Track Record of Capital Return
• Delivered 443 consecutive quarterly dividends
since 1904
• Maintained dividend level through the Global
Financial Crisis and increased the dividend by
12% from 2009 – 2014
• Planning to return to shareholders substantially all
of the one-time dividend proceeds from Chemours
– approximately $3.9B(10)
Shares Outstanding (mm)
2009 2010 2011 2012 2013 2014
904 917 926 933 927 905
DuPont Has Significantly Exceeded The S&P 500, S&P 500 Chemicals and S&P 500 Materials In Capital Returned To Shareholders
19
5.2%
4.3%
4.0%
3.3%
DuPont
S&P 500
S&P 500 Chemicals(12)
S&P 500 Materials(13)
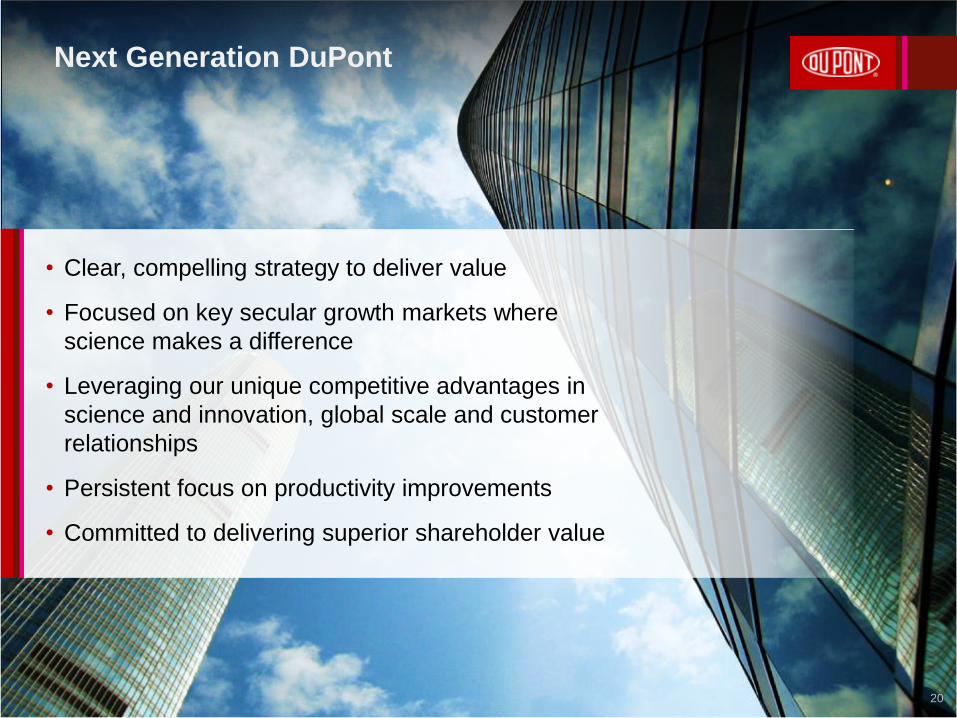
Next Generation DuPont
20
• Clear, compelling strategy to deliver value
• Focused on key secular growth markets where
science makes a difference
• Leveraging our unique competitive advantages in
science and innovation, global scale and customer
relationships
• Persistent focus on productivity improvements
• Committed to delivering superior shareholder value

21
Appendix

Notes
22
1) Thomson Reuters Datastream, (12/31/2008 – 12/31/2014). Total shareholder return is calculated as the appreciation or depreciation of a particular share, plus any dividends, over a given period, expressed as
a percentage of the share’s value at the beginning of the period. Closing prices are adjusted for spin-offs, stock splits, rights and special dividends.
2) Adjusted operating EPS is defined as diluted earnings per share from continuing operations excluding non-operating pension/OPEB costs, significant items, Performance Chemicals and Pharma. Growth is
calculated as percent change from 12/31/08 – 12/31/14. Reconciliations of non-GAAP measures to GAAP are included at the end of this presentation.
3) 2014 revenue from products introduced in the last four years, excluding Performance Chemicals.
4) Segment adjusted operating margin is based on total segment sales and segment adjusted operating earnings, excluding Performance Chemicals and Other/Pharma. Segment adjusted operating earnings are
calculated using segment pre-tax operating income excluding significant items; calculations include certain corporate expenses and exclude adjusted operating earnings of Performance Chemicals and
Pharma/Other. Calculation is from 12/31/08 vs. 12/31/14. Reconciliations of non-GAAP measures to GAAP are included at the end of this presentation.
5) Represents cumulative share repurchases and dividends paid. Calculated from 12/31/08 – 12/31/14.
6) Segment sales includes transfers and excludes “Other.”
7) Management estimates based on internal analyses including reports from IHS Global Insight, McKinsey & Company, and competitors public filings and presentations. Also based on certain industry specific
third party reports, including, but not limited to, for Agriculture & Nutrition: FAPRI, Euromonitor International, and Phillips McDougall; for Bio-Based Industrials: The Freedonia Group, HIS Inc., and
MarketsandMarkets; for Advanced Materials: Prismark, Digitimes Research, JMS Research/Reports, Pira International, Construction Intelligence Center/Timetric, Smithers Rapra, Frost and Sullivan.
8) Segment sales include transfers and exclude Performance Coatings, Performance Chemicals and Other; Compounded Annual Growth Rate (CAGR) is calculated from 12/31/08 – 12/31/14.
9) Adjusted operating EPS is defined as diluted earnings per share from continuing operations excluding non-operating pension/OPEB costs, significant items. Adjusted operating EPS compound annual growth
rate is calculated from 12/31/08 – 12/31/14 and is defined as diluted earnings per share from continuing operations excluding non-operating pension/OPEB costs, significant items, Performance Chemicals and
Pharma. As required under U.S. GAAP, EPS from continuing operations excludes Performance Coatings for all periods presented. Reconciliations of non-GAAP measures to GAAP are included at the end of
this presentation.
10) DuPont expects to return all or substantially all of the one-time dividend proceeds from Chemours of $3.9B to DuPont shareholders via share repurchases within 18 months of the separation, with a portion
expected to be returned in 2015.
11) Calculated as the average of each year’s combined dividends and share repurchases divided by the average market capitalization over each year (per Capital IQ); Metrics for indices based on the average of
the yearly medians of each index’s constituents. Calculated from 2009 – 2014.
12) S&P 500 Chemicals in 2014 consists of Airgas, Air Products, CF Industries, Dow, DuPont, Eastman Chemical, Ecolab, FMC, IFF, LyondellBasell, Monsanto, Mosaic, PPG, Praxair, Sherwin-Williams, and
Sigma-Aldrich.
13) S&P 500 Materials in 2014 consists of Air Products, Airgas, Alcoa, Allegheny Technologies, Avery Dennison, Ball, Bemis, CF Industries, Dow Chemical, DuPont, Eastman Chemical, Ecolab, FMC, Freeport-
McMoRan, IFF, International Paper, LyondellBasell, Martin Marietta Materials, MeadWestvaco, Monsanto, Mosaic, Newmont Mining, Nucor, Owens Illinois, PPG, Praxair, Sealed Air, Sherwin-Williams, Sigma-
Aldrich, and Vulcan Materials.

Reconciliation of Non-GAAP Measures (Unaudited) (dollars in millions)
23
RECONCILIATION OF SEGMENT PRE-TAX OPERATING INCOME (PTOI) TO OPERATING EARNINGS
Agriculture
Electronics &
Communications
Industrial
Biosciences
Nutrition &
Health
Performance
Chemicals
Performance
Materials
Safety &
Protection Other
For the year ended December 31, 2014
Segment PTOI (GAAP) (a) 2,668 271 198 365 913 1,590 742 (391)
Add: Significant Items Charge/ (Benefit) included in Segment PTOI (b) (316) 84 13 15 21 (292) 52 22
Segment Operating Earnings (Non-GAAP) 2,352 355 211 380 934 1,298 794 (369)
(a) Segment PTOI is defined as income (loss) from continuing operations before income taxes excluding non-operating pension and other postretirement employee benefit costs, exchange gains (losses), corporate expenses and
interest.
(b) For complete details of significant items, see quarterly news releases for E.I. DuPont de Nemours and Company.

Reconciliation of Non-GAAP Measures (Unaudited) (dollars in millions, except per share)
24
Year Year Year Year Year Year Year
RECONCILIATION OF ADJUSTED OPERATING EPS 2014 2013 2012 2011 2010 2009 2008
EPS from continuing operations (GAAP) 3.90 3.04 2.59 3.38 2.94 1.70 2.28
Add: Significant Items 0.01 0.45 0.72 0.25 - 0.11 0.42
Add: Non-Operating Pension & OPEB Costs / (Credits) 0.10 0.39 0.46 0.39 0.38 0.10 (0.28)
Operating EPS (Non-GAAP) 4.01 3.88 3.77 4.02 3.32 1.91 2.42
Less: Performance Chemicals (a),(b)
0.82 0.86 1.50 1.79 1.09 0.52 0.59
Less: Pharma (c)
0.02 0.02 0.04 0.20 0.34 0.74 0.73
Adjusted Operating EPS (excluding Performance Chemicals, Pharma) (Non-GAAP) 3.17 3.00 2.23 2.03 1.89 0.65 1.10
(c) Pharma operating earnings assumes a 35% tax rate.
(a) Prior periods reflect the reclassifications of Viton®
fluoroelastomers from Performance Materials to Performance Chemicals.
(b) Performance Chemicals operating earnings assumes a base income tax rate from continuing operations of 19.2%, 20.8%, 24.2%, 22.0%, 19.2%, 22.1% and 20.4% for 2014, 2013, 2012, 2011, 2010, 2009 and 2008,
respectively.
Year Year Year
2014 2011 2008
Total Segment Sales (a)
35,011 34,087 26,499
Less: Performance Chemicals (b)
6,497 8,055 6,245
Less: Other 5 40 160
Total Segment Sales (excluding Performance Chemicals and Other) 28,509 25,992 20,094
SEGMENT ADJUSTED OPERATING EARNINGS
Segment Pre-tax Operating Income (PTOI) (GAAP) 6,356 5,881 3,373
Less: Performance Chemicals PTOI (b)
913 2,162 619
Less: Other/Pharma PTOI (391) (55) 839
Less: Corporate Expenses (c)
572 496 479
Add: Significant Items (d)
(444) 383 466
Segment Adjusted Operating Earnings (excluding Performance Chemicals and Other/Pharma) (e)
(Non-GAAP) 4,818 3,661 1,902
RECONCILIATION OF NON-GAAP MEASURES (UNAUDITED)
(dollars in millions, except per share)
SEGMENT SALES
(a) Segment sales includes transfers.
(b) Prior periods reflect the reclassifications of Viton®
fluoroelastomers from Performance Materials to Performance Chemicals.
(c) Represents total corporate expenses excluding significant items, an estimate of DuPont Performance Coatings residual costs and an estimate for an amount that would be allocated to
Performance Chemicals.
(d) Represents significant items included in Segment PTOI, excluding those related to Performance Chemicals and Other/Pharma.
(e) Segment adjusted operating margin (non-GAAP) is based on total segment sales and segment adjusted operating earnings, excluding Performance Chemicals and Other/Pharma.

Copyright © 2014 DuPont or its affiliates. All rights reserved. The DuPont Oval Logo, DuPont™, The miracles of science™ and all products denoted with ™ or ® are registered trademarks or trademarks of E. I. du Pont de Nemours and Company or its affiliates.
Images reproduced by E. I. du Pont de Nemours and Company under license from the National Geographic Society.
Copyright © 2015 DuPont or its affiliates. All rights reserved. The DuPont Oval Logo, DuPont™, The miracles of science™ and all products, unless otherwise indicated, denoted with ™ or ® are registered trademarks or trademarks of E. I. du Pont de Nemours and Company or its affiliates.
Images reproduced by E. I. du Pont de Nemours and Company under license from the National Geographic Society.
© National Geographic Image 25


![Bernstein's Theorem · minimal k-cones in Rk+l would imply Bernstein's theorem for minimal graphs in Rk+2. In 1966, Almgren [A] proved that there exist no singular cones in R4. These](https://static.fdocuments.net/doc/165x107/5f13a577587f4a74b061b3b5/bernsteins-theorem-minimal-k-cones-in-rkl-would-imply-bernsteins-theorem-for.jpg)