Dunning and Nilekani Caste and Distribution 4 literature, quotas requiring the president of a...
61
When Formal Institutions Are Not Enough: Caste, Party Politics, and Distribution in Indian Village Councils Thad Dunning ∗ and Janhavi Nilekani + Yale University This version: May 12, 2010 Acknowledgements: We thank M.R. Hegde and his staff at the Karnataka State Election Commission, U.A. Vasanth Rao of the Chief Decentralization Analysis Cell of the Gram Swaraj Project, and especially Padmavathi B.S. of the international Academy for Creative Teaching (iACT) and her researchers at Bangalore University for their help with this project. Kanchan Chandra, Don Green, Drew Linzer, Ken Scheve, Steven Wilkinson, and seminar participants at Yale, Princeton, and the annual meetings of the Society for Political Methodology have provided very helpful comments on the broader project of which this paper forms part. ∗ Associate Professor, Department of Political Science, Yale University + Yale College, Class of 2010
Transcript of Dunning and Nilekani Caste and Distribution 4 literature, quotas requiring the president of a...

When Formal Institutions Are Not Enough:
Caste, Party Politics, and Distribution in Indian Village Councils
Thad Dunning∗ and Janhavi Nilekani+
Yale University
This version: May 12, 2010
Acknowledgements: We thank M.R. Hegde and his staff at the Karnataka State Election Commission, U.A. Vasanth Rao of the Chief Decentralization Analysis Cell of the Gram Swaraj Project, and especially Padmavathi B.S. of the international Academy for Creative Teaching (iACT) and her researchers at Bangalore University for their help with this project. Kanchan Chandra, Don Green, Drew Linzer, Ken Scheve, Steven Wilkinson, and seminar participants at Yale, Princeton, and the annual meetings of the Society for Political Methodology have provided very helpful comments on the broader project of which this paper forms part.
∗ Associate Professor, Department of Political Science, Yale University + Yale College, Class of 2010

2
Abstract: The reservation of the presidencies of Indian village councils for politicians from
marginalized castes, through electoral quotas, may generate greater policy benefits for members
of those castes, as several previous studies have emphasized. However, using a regression-
discontinuity design that allows us to compare otherwise similar village councils, and drawing on
our original surveys of citizens, bureaucrats, members and presidents of councils in the state of
Karnataka, we find very weak policy and distributive effects of reservation. We explore several
classes of mechanisms that might explain the invariance of distributive outcomes to the presence
of electoral quotas, including the dominance of local bureaucrats, the electoral power of majority
castes, and party competition at the village council level. While our evidence on the mechanisms
is necessarily tentative, the role of political parties appears particularly important. The results
suggest the importance of complementary conditions in shaping the outcomes of formal
institutional change.

3
I. Introduction
Does reservation of political office for marginalized groups in India lead to greater policy
benefits for members of those groups? Advocates suggest that electoral quotas, in India and
elsewhere, generate substantive outcomes more favorable both to women (Dahlerup 2006, Duflo
2005, Htun 2004, Reynolds 1999, Norris 2004) and to members of marginalized castes and tribes
(Besley et al. 2004, Besley, Pande, and Rao 2008, Palaniswamy and Krishnan 2008).1 This claim
seems compelling and intuitive on theoretical grounds: after all, the idea that formal institutional
rules shape distributive outcomes is a basic tenet of political economy. Just as extension of the
suffrage may generate pressure for redistribution to the newly-enfranchised poor (Acemoglu and
Robinson 2006a), reserving elected offices for candidates from particular groups should in
principle engender greater policy benefits for members of those groups.
Yet in other contexts, distributive outcomes sometimes appear relatively invariant to
formal institutional change. Even after suffrage extensions, for example, elites may continue to
control the policy-making process by using alternative political technologies such as fraud
(Ziblatt 2009), violence (Wilkinson 2004), or more prosaic methods such as lobbying and
campaign contributions (Grossman and Helpman 2001). Other factors, such as the nature of state
institutions, may undercut the influence of changes in formal rules as well.2 In India, anecdotal
accounts often suggest that the numerical superiority and social dominance of forward and
backward castes allow them to dominate elected leaders from marginalized castes and tribes. In
sum, changes in the formal or de jure power of marginalized groups may not always cause a
marked shift in the distribution of de facto power (Acemoglu and Robinson 2006b, 2008).
In this paper, we assess the distributive impact of electoral quotas for the presidencies of
village councils in the southern Indian state of Karnataka. Local village councils (known as
panchayats) are significant conduits for central and state government funds in Karnataka, as
elsewhere in India, and previous studies have found that the identity of the council president has a
substantial impact on the allocation of government benefits. Indeed, according to a substantial
1 Substantive or policy outcomes are not, of course, the only rationale offered for electoral quotas: achieving “descriptive representation” may provide another motivation (Pitkin 1975: 60-91). 2 For example, the extent of redistribution after suffrage extensions may depend crucially on the capacity of the state to impose taxation (see Soifer and vom Hau 2008).

4
literature, quotas requiring the president of a village council be drawn from lower-castes or
tribes—referred to in India as the “reservation” of the council presidency for Scheduled Castes
(SCs)3 or Scheduled Tribes (STs)4—tilt distributive policy in favor of members of those groups.5
Yet as we discuss below, there are both substantive and methodological reasons to think
that such findings could be misleading. On the substantive front, local descriptions often seem to
stress the relative invariance of distributive policy to reservation; below we discuss a number of
reasons why this might, in theory, be so. On the methodological front, as we show in this paper,
the potential for unobserved heterogeneity across constituencies with and without quotas is a
difficult issue confronting studies of reservation at the local level. Just as in studies of the impact
of reservation of seats in the national parliament or state legislatures (Pande 2003), the crux of the
problem is that reservation of council presidencies is not assigned at random, in Karnataka and
many other Indian states. Rather, reservation of council presidencies depends on the proportion
of the panchayat population comprised by the particular castes or tribal groups for which quotas
are instituted. In any election, reserved and unreserved councils will thus differ systematically in
terms of the proportion of the council constituency comprised by the reserved group—as well as,
perhaps, unobserved confounders. Comparisons across reserved and unreserved councils may
therefore lead to biased inferences about the impact of reservation, even after conditioning on
observables.
In order to evaluate reservation’s distributive effects, we exploit a research design that
plausibly allows us to make unbiased inferences about the causal effects of reservation. Because
reservation of the presidency rotates between councils across electoral terms, and because the
method of rotation depends in a systematic way on the population proportion of the relevant
castes or tribes in each constituency, we can use a regression-discontinuity (RD) design to
overcome threats to the internal validity of our causal inferences. This regression-discontinuity
design involves selecting panchayats which are just on either side of the population proportion
threshold for reservation in a given election; since only very minor differences on the assignment
3 Scheduled Castes include Dalits (the former untouchables) and other castes; see discussion below. 4 Scheduled Tribes include the tribal groups, now called adavasis; see below. 5 See, inter alia, Besley et al. 2004, Besley, Pande, and Rao 2008, Palaniswamy and Krishnan 2008, Pande 2003 on the effects of caste reservation. There is a separate literature on the impact of gender reservation, which we do not consider in detail here; see Duflo (2005), Duflo et al. (2004), Beaman et al. (2008).

5
covariate distinguish councils on either side of this threshold, reservation of the council
presidency is plausibly assigned “as-if” at random among such councils. In Karnataka, as we
explain, the validity of this design is further bolstered by the fact that in the neighborhood of the
threshold, panchayats are selected for reservation through an actual randomized procedure (the
drawing of lots).6
Using this RD design, we constructed a study group of 200 ex-ante similar councils—the
presidencies of 100 of which were reserved for Scheduled Castes or Scheduled Tribes in 2007
and 100 of which were not—that are plausibly identical on average with respect to all variables,
save the reservation status of the council president. We then implemented original surveys of
nearly 2,000 citizens, 188 local bureaucrats, and 523 council members and presidents in these 200
panchayats, thereby generating detailed data on perceptions of council priorities, distribution of
individual benefits, and fiscal expenditure patterns with which we could assess the effects of
reservation.
Comparing across reserved and unreserved councils,7 we find strikingly weak policy and
distributive effects of reservation. Reservation of the council presidency for a member of the
Scheduled Castes (SC) or Scheduled Tribes (ST) does not affect the probability that an SC or ST
citizen reports having received a job or benefit from the village council in the previous two years.
Nor does reservation affect the extent of participation by Scheduled Caste or Scheduled Tribe
citizens in open council meetings (called Gram Sabhas) or whether citizens say SC or ST groups
are the council’s priority. While reservation of the presidency does appear to have an effect on
whether the council is perceived by citizens to serve SC and ST groups effectively, citizens’
experience of council governance in panchayats with reserved and unreserved presidencies
appears otherwise nearly identical, on average.
Next, among bureaucrats, council members, and presidents themselves, reservation of the
presidency for SC or ST members does not affect the perceived effectiveness of the council; how
6 An additional advantage of our procedure, as we discuss below, is that because of the way reservation is determined in Karnataka, we end up with a heterogeneous as well as representative mixture of panchayats in our study group, which helps with external validity concerns. 7 For convenience, we sometimes refer to “reserved councils” and “unreserved councils,” though it is the presidencies of the councils that are reserved or unreserved. There is also reservation of members’ seats in village councils in Karnataka.

6
well or how often council members work together; the perceived power of the council president;
whether Scheduled Castes or Scheduled Tribes have the most power or receive the greatest
priority from the council; or whether the council effectively serves the needs of Scheduled Tribes
and Scheduled Castes. Finally, using fiscal data gathered from local bureaucrats in the councils
in our study group, we show that reservation has no significant effect on whether the council
assesses taxes or fees or on the extent of spending on government programs (schemes) that are
targeted towards SCs and STs.
Concerned that our null findings might reflect the relatively small size of our study group
and consequent lack of statistical power, we replicated our regression-discontinuity design, using
different outcome data and drawing our study group from 5,287 panchayats across the whole state
of Karnataka. Despite the larger size of the resulting study group of panchayats chosen at the
regression discontinuity (N=1430), here, too, we find no discernible fiscal effects of reservation.
Indeed, examining some 116 different indicators of fiscal outcomes and panchayat performance,
measured across either two or four different time periods, we find only five statistically-
significant effects of reservation (and none of these survive standard corrections for multiple
statistical comparisons).8
We then turn to the next crucial question raised by our main results: what explains the
weak effects of electoral quotas? We explore several classes of potential mechanisms. First,
drawing on experimental evidence presented by Dunning (2009), we discard the (implausible)
notion that caste simply does not matter; in a local context in which caste-based discrimination is
still highly prevalent, and in which people do expect caste identities to influence the allocation of
public benefits (as Chandra 2004 also argues), voters prefer, other things equal, to vote for
members of their own castes. Nor does a history of past reservation, or the nature of reservation
itself—the notion that “what goes around comes around”—appear to explain our null results.
Next, consistent with a large literature on the agenda-setting powers of council presidents
(Besley et al. 2004, 2008; Palaniswamy et al. 2008), we show that presidents appear to have
substantial power, relative both to other council members and to the local bureaucrats
(secretaries) who help oversee spending of the central and state government funds channeled 8 As we discuss further below, the discrepancy between our results and the previous literature may stem from methodological factors, or it may reflect other aspects of our study.

7
through councils; this is true in councils with reserved as well as unreserved presidencies. Thus,
for example, it does not appear to be the case that local bureaucrats or upper-caste council
members dominate Scheduled Caste and Scheduled Tribe council presidents, and thus offset the
distributive effects that might otherwise stem from reservation. Finally, we use our evidence to
test a popular thesis that the numerical superiority of dominant upper-castes allows them to elect
weak or pliant lower-caste presidents, who simply do the bidding of upper-caste groups. Our
detailed survey data on caste and voting behavior cast substantial doubt on this hypothesis as
well.
Our interpretation, which is necessarily tentative, is instead that patterns of party
competition at the local level may help explain the invariance of distributive outcomes to the
reservation of the council presidency. While caste is an imperfect predictor of party affiliation at
the local level, party ties themselves appear surprisingly important aspect of voting behavior in
panchayat elections (strikingly so, given that party involvement in village elections is formally
banned). Our data suggest the hypothesis, subject to further verification, that cross-caste party
linkages at the local level may help to explain the null effect of caste-based reservation on
distributive policies. As we discuss in the Conclusion when we return to issues of external
validity, the effect of reservation might thus well be different in Indian states with a recent history
of greater party mobilization along caste lines, such as Uttar Pradesh, than in Karnataka, where
attempts by parties such as the BSP to mobilize lower-caste voters along party lines largely failed
(Chandra 2004). Our findings therefore suggest an agenda for comparative research on how
complementary conditions shape the outcome of formal institutional change.
II. The Distributive and Policy Effects of Reservation
In India, electoral quotas have often been used to advance the interests of both religious
minorities (especially during the colonial period) and lower-caste citizens. In the post-
independence period, politicians have been elected to both the national parliament and to state
assemblies from constituencies reserved for particular castes or tribes. Such quota policies permit
all voters in a given constituency to vote; however, the politician must be drawn from the
particular caste or tribal category for which the seat is “reserved.” This policy of reservation was

8
extended to rural village councils called “gram panchayats” by the 73rd amendment to the Indian
constitution in 1993.9 In Karnataka and several other Indian states, the method of selection of
panchayats is indirect, as voters elect candidates as members of the council,10 and members then
elect the president.
There are both theoretical and empirical reasons to believe that reservation of council
presidencies for lower-caste groups should shape distributive as well as other policies. Social
discrimination against lower castes and tribes often remains profound in council constituencies,
with Dalits forbidden from worshipping in upper-caste temples and their continued association
with ritually-impure professions such as sanitation and butchery. (Dalits, formerly called
Untouchables, are included among the Scheduled Castes). In such a context, reservation may
provide a useful tool for redressing inequalities and promoting voice for marginalized castes in
rural villages (Duflo 2005). Moreover, in a context in which caste-based distribution is said to
motivate voting behavior as well as party strategy (Chandra 2004), reservation of office for
particular castes might clearly be expected to lead to greater distribution of benefits to members
of those castes. If members of particular castes or caste groupings have different preferences over
policy outcomes, election of a member of one caste group should then tilt policy at least in the
direction of group members’ preferences, as long as elected representatives act as even imperfect
agents of the group. A substantial previous literature also suggests that council presidents have
the capacity to affect the allocation and nature of public and private goods provision by village
councils across India (see e.g. Besley et al. 2004, Besley, Pande, and Rao 2008, Duflo (2005),
Duflo et al. (2004), Palaniswamy and Krishnan 2008).
Indeed, several previous studies find evidence that reservation shapes distributive
outcomes, in Karnataka as well as other Indian states. Besley, Pande, and Rao (2008), for
instance, drawing on Besley et al. (2004), show that Scheduled Caste and Scheduled Tribe
households in four surveyed South Indian states (including Karnataka) are significantly more 9 The term “gram panchayat” or simply “panchayat” usefully indicates both the council and the geographic constituency that elects the council and which the council governs; we will often refer to village councils but retain the term panchayat to refer to the constituency. Panchayats typically comprise several villages, which are often also wards that elect members.
10 An unusual feature of local elections in Karnataka is that villages or wards often elect multiple members; unlike the rest of India’s parliamentary, first-past-the-post system, at the local level there are multi-member constituencies.

9
likely to receive targeted benefits if the presidency of the village council is reserved for SC or ST,
while Palaniswamy and Krishnan (2008) find that within councils, wards or villages in which
members’ seats are reserved receive greater distributions from an SC-targeted spending scheme.11
Munshi and Rosenzweig (2008), using survey data from across India, find that reservation results
in the election of more competent candidates, since voters in reserved constituencies do not have
to trade off candidate quality against the desire to elect a member of their own group. At the state
level, Pande (2003) finds that Scheduled Caste legislators distribute more SC-targeted schemes to
their consituencies.
Yet there are also at least three reasons that reservation of a council presidency may not
translate into greater distribution to marginalized castes; we mention these hypotheses here and
explore them in greater depth below. One hypothesis is that council presidents are insufficiently
powerful. Because most panchayat funds come from central and state government grants and
schemes, and because funds are often tied to specific purposes, local politicians such as council
presidents may have limited discretion over the allocation of funds. Anecdotal accounts also
point to the important role of local bureaucrats, called secretaries, who manage panchayat
accounts and play an important role in the day-to-day functioning of village councils. Council
secretaries, who are typically better educated than panchayat presidents (as we show below),
might limit the substantive role played by council presidents and other elected council members.
While the assertion that elected representatives in village councils cannot affect distributive
outcomes contradicts evidence that council presidents have substantial agenda-setting power, for
instance, in allocating benefits and projects across villages in a single gram panchayat (Besley et
al. 2004, 2007; Palaniswamy and Krishnan 2008), it is worth considering seriously.
The second reason reservation may have limited effects stems from the electoral power of
dominant castes. In elections for representatives to village councils (as well as in reserved state
assembly and parliamentary constituencies), the groups for whom posts are reserved usually
constitute the minority of the electorate. Reserving posts for politicians from these groups—
while still permitting majority groups to vote in the election—could lead to the election of
disempowered or coopted minority representatives, simply because minority groups are at a
11 Palaniswamy and Krishnan focus on the intra-panchayat allocation of spending, across different villages (wards) that comprise the panchayat constituency.
10
numerical and therefore electoral disadvantage. In other words, the need to cultivate electoral
support from numerically-dominant castes could undercut the influence of politicians in reserved
constituencies. Indeed, this observation dates to pre-independence debates in India about the
merits of electoral quotas for minorities. Commenting on Jaffrelot (2003), Wilkinson (2003)
notes that “the designation of certain constituencies as ‘Scheduled Caste constituencies’ – in
which members of all communities could vote but only SC candidates could stand for election –
did not give Scheduled Castes a real radical ‘voice’…because politicians in these constituencies
still had to appeal to more conservative upper and middle caste voters to get elected…[Jaffrelot]
accepts Ambedkar’s argument in the 1930s…that creating special constituencies in which
religious or caste minorities were a majority of the population would allow the election of
members of legislative assemblies (state-level) and members of parliament who were more
authentic representatives of their communities, and therefore better equipped to protect minority
interests and press for real social change.”12
The third reason that reservation may not be strongly related to policy outcomes is
underexplored but is driven by the patterns in our survey data we discuss below: the role of party
competition. Party affiliation appears to play an important role in vote choice in local elections,
despite formal rules banning the entry of parties in village elections; this evidence is also
consistent with accounts that stress vote-buying by party intermediaries at the local level
(Breeding 2008). As we show, party membership and caste also cross-cut to some extent, so that
members of the same caste in the same village often support different parties. As we discuss
below, the cross-cutting relationship between party and caste may well undercut the influence of
reservation on distribution along caste-based lines. Our exploration of the role of parties in local
village councils is a new contribution to the literature on reservation and distribution; this
connection has apparently not been explored in previous work, perhaps because of laws that
ostensibly limit party participation in local elections.
12 Shastri (2009) makes a similar argument about politics in Karnataka.

11
III. Empirical Strategy: A Regression-Discontinuity Design
We can make unbiased inferences about the causal effect of reservation by exploiting the
system of rotation through which reservation is assigned. In the state of Karnataka,13 panchayat
presidencies are reserved for Scheduled Castes and Scheduled Tribes through a procedure
governed by state law and implemented by district-level bureaucrats for each “taluk” (an
administrative unit smaller than a district that contains, on average, about 35 village councils).14
Two elements of the procedure are key for our purposes. First, at least in principle, no panchayat
presidency is ever reserved for the same category (e.g. Scheduled Caste or Scheduled Tribe) in
subsequent electoral terms. Second, across electoral terms reservation of the presidency rotates
between panchayats within each taluk according to a strict formula based on the panchayat-level
population proportions of the relevant categories. In this section, we describe the formula and
how we were able to exploit it to use a regression-discontinuity design to select panchayats for
inclusion in our study group. We then present qualitative and quantitative evidence that the
rotation formula was observed in practice, before discussing our sampling design and other
aspects of the study.
Reservation of council presidencies has been rotated in Karnataka using the following
procedure, starting in 1994, and then again in 2000, 2002, 2005, and 2007.15 First, the bureaucrat
responsible for reservation16 uses census data on group proportions at the taluk level to determine
the number of panchayat presidencies that must be reserved for each category, within each taluk.
13 Similar systems of rotation are used in other Indian states, such as Rajasthan (see Chaugard 2009), Andhra Pradesh, and others. However, the details differ: the 93rd constitutional amendment left the implementation of panchayat reservation to the states. 14 In this paper, we compare councils in which the presidency is reserved for Scheduled Castes (a category that includes the former Untouchable castes, now called Dalits) and Scheduled Tribes to councils in which the presidency is left unreserved or reserved for Other Backward Classes (that is, groups that are substantially less marginalized than SCs or STs). Local politics (as well as state politics) in Karnataka tend to be dominated by two dominant Backward Classes, the Vokkaliga and the Lingayath; though there is Backward Class reservation as well, for purposes of assessing how reservation shapes distribution to marginalized groups, the effect of SC and ST reservation seems the most the relevant. See Dunning (2009) for further discussion. Within each category of reservation for caste, there is also reservation for women. 15 Presidencies were first reserved in 1994, the first panchayat elections after the passage of the 73 constitutional amendments. Panchayat members have five-year terms, but beginning in 2000, new legislation required rotation of the presidency every 30 months. 16 This is typically a district-level official such as a Deputy Commissioner, who has responsibility for allocating reservation across panchayats, in all the taluks in the district.

12
For example, if 25 percent of a taluk’s residents are Scheduled Caste, then in any given electoral
term, 25 percent of the panchayats in that taluk must have their presidencies reserved for
members of the Scheduled Castes.
Within each taluk, the bureaucrat then sorts the panchayats in descending order by the
number of panchayat members’ seats reserved for each category. Note that the number of
members’ seats reserved for each group/category is a proxy for the group’s population proportion
within the panchayat; for instance, if Scheduled Castes comprise 20 percent of the population of a
given panchayat, then 20 percent of members’ seats within that panchayat are reserved for
Scheduled Castes. In the first elections in 1994, after sorting panchayats in this descending order,
the bureaucrat would choose the required number of panchayats for reservation from the top of
the list (where the required number is given as described above). She would then rotate
reservation in the subsequent term (i.e., in 2000) to the block of panchayats that appear next on
the list, and so on across electoral terms. If the number of panchayats with a given number of
members’ seats exceeds the number of panchayats that must be reserved, the bureaucrat will
select panchayats for reservation by drawing lots.
Table 1 gives a hypothetical example of how this works, for a taluk with ten panchayats.
(This hypothetical taluk has far fewer panchayats than the average of around 32 panchayats per
taluk in our sample; the numbers are kept small to keep the example simple.) Suppose that 20
percent of the population of this taluk as a whole is Scheduled Caste.17 In this case, the
presidencies of two out of the ten taluks must be reserved for Scheduled Castes in each electoral
term (that is, in 1994, 2000, 2002, 2005, and 2007). Suppose furthermore that two of the taluk’s
ten panchayats have four seats reserved for SC members; three panchayats have three seats
reserved for SC members; four panchayats have two seats reserved for SC members; and one
panchayat has one seat reserved for an SC member.
[TABLE 1 ABOUT HERE]
17 For simplicity, we assume this taluk has no or negligible Scheduled Tribe residents, so that there is no reservation of presidencies for STs; below we consider the additional procedures that must take place when presidencies are reserved for ST as well.

13
To choose which two of the ten panchayats will have reserved presidencies in any given
term, the bureaucrat would follow the following hypothetical rotation procedure. In 1994, the
bureaucrat would pick the top two panchayats on the list to have reserved presidencies; since only
two presidencies must be reserved in any electoral term, she could stop there. In 2000, she would
move down the list and select two of the three panchayats that have three members’ seats
reserved for SC. Here, however, because the number of panchayats in this category exceeds the
number of presidencies to be reserved, the bureaucrat would select two of the three eligible
panchayats at random, by drawing lots. In 2002, she would pick the remaining panchayat with
three members’ seats reserved for SC and then select at random, again by drawing lots, one of the
four panchayats with two members’ seats reserved for SC. In 2005, she would select, again by
lot, two of the three remaining panchayats with two members’ seats reserved for SC. Finally, in
2007, she would take the remaining panchayat with two members’ seats reserved (i.e., the
panchayat in this category that had not yet had its presidency reserved) as well as the remaining
panchayat with just one member’s seat reserved for SC. In this example, all ten panchayats
would have their presidency reserved once for a member of the Scheduled Castes, over the course
of the five rotations of the presidency; in other examples, the bottom of the list would not have
been reached by 2007, while in some instances, reservation would have rotated back to the top of
the list. This depends both on the number of panchayats in a given taluk and the proportion of SC
residents in the taluk (which in turn determines the number of panchayats the presidencies of
which must be reserved for SCs in any term).
How does this play out with real data? Table 2 shows the history of reservation since 1994
in Chamarajanagar Taluk, using data that we acquired from the Karnataka State Election
Commission. The first column lists panchayats in descending order by the proportion of the
population that is Scheduled Caste, as per data from the 1991 census reported in the second
column. In the other columns to the right, we report the reservation status of the presidency in
each of the relevant electoral terms: 1994, 2000, 2002, 2005, and 2007. Panchayats in which the
presidency is reserved for Scheduled Castes in a given electoral term are marked with a “1”;
otherwise, the corresponding cell is left blank.
[TABLE 2 ABOUT HERE]

14
We can see that in Table 2, the pattern of reservation closely follows a diagonal pattern, in
which the 1’s move from the top left of the table to the bottom right. That is, in a given electoral
term, the panchayats that are reserved for SC presidents are clustered at the same part of the list,
since they share similar SC population proportions; in the subsequent term, the panchayats are
clustered in the next block down in the column to the right.18 Note that some small gaps (i.e.
unreserved panchayats that appear in the middle of a “cluster” of 1’s indicating reserved
panchayats) do appear in the clusters for each electoral term. This occurs because, as discussed
above, panchayats with reserved presidencies are often selected at random from among the set of
panchayats having the same numbers of members’ seats reserved for SC. Since the relationship
between population proportions and numbers of reserved members’ seats is only weakly
monotonic (i.e., panchayats with somewhat different SC population proportions can have the
same number of members’ seats reserved for SC), this random selection creates small gaps in the
cluster of panchayats that have reserved presidencies in a given term.19
Several other points about the process of reservation are useful to note. First, in any
electoral term, presidencies are also reserved for Scheduled Tribes, using exactly the same
procedure as for Scheduled Castes: once the panchayats to be reserved for SC are selected, then
panchayats are sorted in descending order by the number of members’ seats reserved for
Scheduled Tribes, and the required number of panchayats are selected for reservation of the
presidency for STs.20 Note, however, that in most (but not all) taluks, the number of Scheduled
Tribe reserved presidencies is relatively small (just one or two panchayats), since Scheduled
Tribes typically comprise a small proportion of the taluk population, except for in “tribal” areas.
Second, in one-third of panchayats in which the presidency is not reserved for Scheduled Castes
18 Note that in the example in Table 2, the cluster of ones returns to the top rows of the table in 2007, but in other taluks, the list would not have been worked all the way through by 2007; whether reservation has cycled back up to the high-SC proportion panchayats depends on the number of panchayats as well as the proportion of the SC population in the taluk as a whole.
19 One additional minor source of error in Table 2 is that for presentational purposes, we use 1991 census data to rank the panchayats. However, for 2005 and 2007, bureaucrats used 2001 census data; when we order panchayats using 2001 census data, reservation in 2005 and 2007 follows a pattern even closer to that we expect. 20 In case a single Gram Panchayat appeared among the top N councils in both the Scheduled Caste and Scheduled Tribe categories, the presidency was reserved for Scheduled Castes (Order of the State Election Commission No. 54 EGP 99, February 16, 2000; interviews, Karnataka State Election Commission, January-February 2009.)

15
or Scheduled Tribes, the presidency is reserved for Backward Classes; however, since the census
does not record data on Backward Class proportions at the level of village, the same procedure
based on population proportions is not used.21 As discussed in a footnote above, since Backward
Classes tend to be dominant in villages in Karnataka (rather than, say, forward castes), we treat
“unreserved” (General category) and “reserved for BC” as analytically equivalent in our
discussion below. Finally, within each of the reservation categories (SC, ST, BC, and General),
one-third of presidencies are also reserved for women, also using a population-proportion rule.22
In Karnataka, various institutional safeguards help to protect the integrity of this
reservation procedure by making the selection criteria transparent. For instance, the list of
panchayats whose presidencies are selected for reservation are presented to council members in
taluk-level assemblies; there, the rules used to determine reservation must be explained by a
bureaucrat appointed by the District Commissioner (Order of the State Election Commission, No.
SEC 54 EGP 99, February 16, 2000, Annexure dated February 23, 2000). We verified through
qualitative fieldwork that such meetings had been held and that the selection procedures had been
explained in public fora, limiting the potential for lobbying on the part of council members
regarding the council reservation status. Another factor that likely limits the utility of lobbying is
rotation itself: no council can be reserved for the same category in subsequent elections. Finally,
we obtained data on the history of reservation for all Gram Panchayats in the state of Karnataka
since 1993 (similar to that presented in Table 2 for Chamarajanagar Taluk), which, together with
the census data used by bureaucrats, allows us to verify whether this procedure was in fact
followed.
To select panchayats for inclusion in our study group, we mimicked the reservation
process as nearly as possible, taking advantage of the fact that rotation of reservation of the
presidency is based on the population proportions of Scheduled Castes and Scheduled Tribes in
21 80 percent of posts reserved for Backward Classes are allotted to BC category A and 20 percent to category B (which includes Vokkaligas and Lingayaths). 22 Within each category of caste reservation in a taluk, panchayats are listed in descending order of the proportion of women; to determine assignment to reservation, bureaucrats appear to work down these lists just as for caste reservation. Thus, in Karnataka, reservation for female presidents is not randomly assigned, contrary to what is apparently the case in some other Indian states such as West Bengal (see Duflo et al. 2004). To study the effect of caste reservation for women in Karnataka, a regression-discontinuity design similar to the one we propose may be needed.

16
each panchayat (as proxied by the number of members’ seats reserved for each category).23 This
allowed us to use a regression-discontinuity design, in which reservation of the presidency is
assigned “as if” at random among the councils in our study group (Freedman 2006, Gerber and
Green 2008, Dunning 2008a).24 The key idea is that in any taluk, those panchayats, the SC or ST
population proportions of which are just above the floor for inclusion among the group of
reserved councils in a given election—and thus have reserved presidencies—are very similar on
average to panchayats just below the floor—the presidencies of which are not reserved for that
category. Suppose, for example, that in a given taluk and a given election, the floor of the
Scheduled Caste population proportion required for reservation of the presidency is 26 percent.
Whether 26.1 percent of panchayat residents are from the Scheduled Castes⎯thus prompting
reservation of the presidency⎯or instead just 25.9 percent are SC, thereby leaving the panchayat
presidency unreserved, is akin to a coin toss. In the neighborhood of the threshold, potential
confounders such as the salience of caste politics at the gram panchayat level should not be
associated with reservation. Moreover, the randomness of assignment to reservation is bolstered
in Karnataka because when the number of panchayats with a given number of members’ seats
reserved for a category exceeds the number of panchayat presidencies that must be reserved, the
panchayats are picked for reservation through an actual random process (by drawing lots).
After purposively picking six districts25 (selection criteria for the districts are discussed
below and described further in Dunning 2009), we used 2001 census data to sort panchayats
within each taluk in those districts in descending order of population proportions of Scheduled
23 At the time we selected villages for inclusion in our study group, unfortunately, we lacked data on the number of members’ seats reserved for each category, but this number is in turn based on the proportion of the population in each category; see discussion below. 24 A growing empirical literature has sought to take advantage of the apparent natural experiment provided by reservation of the Gram Panchayat presidencies to estimate the causal effects of electoral rules and political leadership. In fact, caste reservation is not randomly or “as if” randomly assigned (Dunning 2008) in most Indian states. Clearly, comparisons between all reserved and all unreserved Gram Panchayats after any given election could lead to biased inferences about the causal effects of reservation, since reserved panchayats would tend to have larger proportions of Scheduled Caste or Scheduled Tribe residents than unreserved panchayats (and could conceivably differ in many unobserved ways as well).
25 Districts include Bangalore Rural, Chamarajanagar, Mangalore (formerly Dakshin Kannada), Davanagere, Mandya, and Ramanagar; these were selected purposively to give variation on factors that might affect the role of caste in village councils, such the predominance of different sub-castes (jati), such as Lingayaths and Vokkaligas among the dominant Backward Classes and Madiga and Holaya among the Scheduled Castes. See Dunning (2009) for discussion.

17
Castes and Scheduled Tribes.26 We could thereby find the lower bound between reserved and
unreserved councils and thus, in each taluk, choose the village just above the threshold and the
village just below the threshold, for each category of reservation. For Scheduled Caste
reservation, we adopted the rule that the difference in the population proportions for each pair of
reserved and unreserved councils had to be less than one percent, though in most cases the
difference was substantially smaller: the mean difference across reserved and unreserved pairs is
0.33 percent, while the median is 0.25 percent. For Scheduled Tribe reservation, a more
permissive band of 1.5 percent was adopted, because there are typically fewer reservations for
Scheduled Tribes in each taluk and thus it can be difficult to find matches very near to each other
on the forcing variable (in this case, Scheduled Tribe population proportions).27 In most cases,
following the logic that bureaucrats move down lists of panchayats sorted in descending order of
population proportions, the reserved council had a slightly higher proportion of Scheduled Caste
or Scheduled Tribe residents than the unreserved council; in a few pairs, however, the closest
match to the reserved council had a slightly higher proportion of residents in the relevant
category.28
Using this regression-discontinuity design, we constructed a study population of 200
village councils in which reservation is essentially randomly assigned—100 of which had their
presidencies reserved for Scheduled Caste or Scheduled Tribe presidents and 100 of which were
unreserved or reserved for Backward Classes.29 To assess the claim of as-if random assignment,
26 One wrinkle is that, as mentioned above, bureaucrats use the numbers of members’ seats reserved for each category, rather than the proportion (interviews, State Election Commission, January 2009). This might tend, in principle, to place larger panchayats at the top of the list, since each panchayat is typically required to have one additional member for each 400 village residents. This should not lead to bias, since population should still be independent of Scheduled Caste and Scheduled Tribe population proportions in the neighborhood of the regression-discontinuity threshold. Moreover, there is no strong relationship between village size and the proportion of Scheduled Caste or Scheduled Tribe residents; the observed correlation between these variables is only 0.009 across the state of Karnataka. We verify below in our covariate balance tests that reserved and unreserved panchayats are balanced with respect to population. 27 However, even the Scheduled Tribe panchayats are well matched, with the average difference between reserved and unreserved pairs being just 0.49 percent, with a median of 0.29 percent. 28 This could occur if, for instance, several councils that would have been reserved by following the descending order had been reserved in the previous electoral term for the other category (SC or ST). In total, the unreserved council had slightly higher population proportions than the reserved council in 13.8 percent of Scheduled Caste pairs and 21.4 percent of Scheduled Tribe pairs. 29 In our analysis below, we compare councils with presidencies reserved for lower-castes or tribe to those without reservation—but not councils with lower-caste or tribal presidents and those without them. The

18
Table 3 presents a randomization or balance check, comparing reserved and unreserved villages
on measured pre-treatment covariates (and also across the assignment covariates, namely, SC and
ST proportions). As the table shows, reserved and unreserved villages are statistically
indistinguishable on these covariates, which is a necessary condition for a valid natural
experiment (Dunning 2008). In particular, reserved and unreserved villages are balanced with
respect to village size, literacy rate and the number of workers, as well as other pre-treatment
variable drawn from the census and on the assignment covariates (SC and ST proportions).
[TABLE 3 ABOUT HERE]
An advantage of our panchayat selection procedure (the regression discontinuity design)
in this context is that it produces a study group of panchayats with substantial heterogeneity in the
proportion of the population that is Scheduled Caste or Scheduled Tribe: this is because, in some
taluks bureaucrats had cycled through the list of panchayats and gone back up to the top by 2007
(as in Table 2), while in others they remained in the middle or towards the bottom of the list.
Thus, in some of the panchayats in our study group, Scheduled Castes and Scheduled Tribes
constitute a near-majority of the population, whereas in others they are a tiny minority; this is
useful for assessing whether the numerical power of these groups shapes the effect of reservation,
as discussed below. The method of selection also created variation in the extent to which the
presidencies of our panchayats had been previously reserved, another feature we exploit in our
empirical analysis. Finally, our study group of 200 panchayats is quite representative of the state
of Karnataka, as shown by comparing means on several covariates for panchayats in our study
group and panchayats in a statewide database (Table 4).
[TABLE 4 ABOUT HERE]
Our sampling design within panchayats called for us to recruit 10 citizens in the
headquarter village of each of the 200 panchayats in our study group, through a stratified random
sample. (In addition to completing the survey analyzed in this paper, subjects participated in the
experiment described below and discussed in Dunning 2009).30 We also interviewed the local
latter comparison is subject to selection bias, since panchayats that choose to elect lower-caste leaders may be unlike those that do not, in ways that may matter for the outcomes we analyze. 30 Within each village, field investigators were instructed to select at random four Scheduled Caste residents⎯two from the Holaya caste (jati) and two from the Madiga caste (jati)⎯and one Scheduled

19
panchayat president (called the adhyaksha in Karnataka), two other panchayat council members,
and the executive secretary (the state-level bureaucrat who assists the panchayat), using separate
survey instruments. The interviews were conducted by around forty field investigators, most of
whom are M.A. students in political science at Bangalore University, working in teams of two.31
The fieldwork for the project was undertaken from December to February 2009. Our survey
questions and descriptive statistics across all panchayats are given in Tables 5 and 6.
[TABLES 5 AND 6 HERE]
IV. The Weak Policy Effects of Reservation
Does reservation of the council presidency affect the distribution of benefits to Scheduled
Caste or Scheduled Tribe citizens? We asked citizens whether they had received a benefit or job
from the village council in the previous year or two; since reservation of council presidencies was
last rotated in April 2007, and since our surveys were conducted in January-February 2009,
comparing answers across councils with reserved and unreserved presidencies indicates whether
reservation affects the benefits citizens receive. As the first row of Table 7 indicates, reservation
does not increase the probability that members of either the Scheduled Castes or Scheduled
Tribes receive benefits or jobs from the village council. Indeed, the negative but statistically
insignificant point estimate suggests that Scheduled Caste respondents are, if anything, less likely
to receive a benefit when the council presidency is reserved for Scheduled Castes. Note that with
968 respondents from these two groups in our sample (774 Scheduled Caste and 194 Scheduled
Tribe), these are not low-power statistical tests; accounting for the clustering of respondents
within villages only further increases the standard errors and does not affect the null finding. Tribe resident. The other five participants in each village were to be selected at random from the general and backward caste population. Because villages in rural Karnataka tend to be residentially segregated along caste and even sub-caste lines, stratifying the population for sampling purposes was relatively straightforward. Scheduled Castes comprise 40.2 percent of the sample of citizens, while Scheduled Tribes comprise 9.2 percent, while dominant Backward Classes are 38.4 percent, other Backward Classes are 5.3 percent, and forward castes are 6.7 percent. Our probability sample was thus intented to overrepresent SCs and STs (for instance, Scheduled Castes comprise around 18 percent of the population of Karnataka). See Dunning (2009) for further details. 31 One of us (Dunning) accompanied two teams of investigators to several villages in Chamarajanagar district (Kollegala taluk) and Davanagere district (Harapanahalli taluk). Many teams also typically included one more senior and experienced investigator.

20
[TABLE 7 ABOUT HERE]
Perhaps surprisingly, reservation also does not affect political knowledge and engagement
on the part of Scheduled Caste or Scheduled Tribe citizens, as measured by participation of SC
and ST citizens in Gram Sabhas (biannual meetings in which the entire panchayat reviews council
affairs), Ward Sabhas (meetings in which wards, usually villages, express views to their
representatives), or Panchayat Jamabandis (social audits held by taluk-level bureaucrats in which
council activities are publically reviewed). Not only are SC and ST citizens no more likely to
participate in such public meetings in reserved panchayats, but those who do participate are no
more likely to say that their participation was effective in helping them obtain resolution of a
problem that mattered to them. Reservation actually appears to decrease the proportion of SC or
ST respondents who know the president’s name, though this could possibly reflect differential use
of surnames by upper- and lower-castes (below, we discuss other aspects of political knowledge).
This is not to say that reservation might not affect citizens’ perceptions of council
priorities. Yet even here, the evidence is mixed. The percentage of Scheduled Caste or
Scheduled Tribe respondents who say that the council gives the most priority to SC or ST citizens
is 53.9 in reserved panchayats and 41.0 in unreserved panchayats, a statistically-significant
difference of 12.9 percentage points (third row of Table 7). At the same time, however,
reservation does not affect the percentage of Scheduled Caste and Scheduled Tribe respondents
who say that their group has the most power or influence over the council (second row of Table
7).32 For Scheduled Castes and Scheduled Tribes as a whole, reservation does not increase the
percentage who say that the council serves their groups effectively; for SC respondents alone, the
estimated effect of reservation is negative but insignificant, though for ST respondents, it is
positive and significant. In sum, while there is some evidence that reservation increases the
propensity of members of the target groups to say that the council prioritizes them, reservation
does not strongly boost perceptions that the council effectively serves SC and ST communities.33
32 Interestingly, averaging across reserved and unreserved councils, 31.9 percent of respondents from these groups say that SC or ST groups have the most influence. 33 The biggest effect of reservation we find in the citizens’ survey regards the percentage who identify the council president as being from an SC or ST caste (jati). Yet the whopping difference of 50.9 percentage points across reserved and unreserved villages simply serves as an indicator of the salience of caste

21
Turning to our interviews of council members, presidents, and secretaries, we find even
weaker policy effects of reservation (Table 8). As in the citizens’ module, we asked what group
has the most power or influence over the council; what group receives the most priority from the
council in allocating benefits; and to what extent the council effectively serves Scheduled Castes
and Scheduled Tribes. For none of these variables do we find significant effect of reservation,
either as measured by responses from members and presidents or by responses from secretaries.
Nor do these null effects differ when we restrict the sample to Scheduled Caste and Scheduled
Tribe council members.34 We also asked whether members and presidents favor their own castes
in allocating benefits from schemes; interestingly, while we found an effect of reservation, it went
in the opposite direction⎯council members in unreserved villages were significantly more likely
to say yes⎯and this result does not hold up among lower-caste members alone. The one
exception is that we find that councils with reserved presidencies are said to more effectively
serve SC and ST communities; but this is driven by the answers of presidents (the difference for
members alone is not significant), so the answers are conceivably self-serving. Moreover, there is
no significant effect of reservation on whether Scheduled Castes or Scheduled Tribes are deemed
to have the most power or influence or to receive the council’s priority in allocating funds.35
[TABLE 8 ABOUT HERE]
Nor does reservation of the presidency for lower-castes appear systematically to affect the
functioning of village councils, as reported by members, presidents, and secretaries. For
example, reservation does not affect the reported number of Gram Panchayat meetings held in the
previous six months. It does not affect the reported effectiveness of panchayats in serving
citizens, among respondents at large as well as lower-caste respondents alone; whether members
of the village council work well together; or whether the primary source of disagreement among
identity, since the president actually is from an SC or ST castes in reserved villages (while few SC or ST members are selected for unreserved presidencies).
34 On average, members, presidents and secretaries are much more optimistic than citizens about the extent to which the council effectively serves SC and ST members: the former rate effectiveness at 4.3 on a 5-point scale, while the latter rate effectiveness at just 2.0. 35 These answers code responses to open-ended questions about which group (caste) has the most power or influence and which receives the council’s priority.
22
members is the choice of beneficiaries of schemes.36 There is no effect of reservation on how
transparent is the availability of council funds to members or presidents. As in the citizens’
survey, the surveys of members, presidents, and secretaries do not indicate any effect of
reservation on whether Gram Sabhas, Ward Sabhas, Panchayat Jamabandis are held or how
effective they are deemed.37
What about actual fiscal outcomes? In Table 9, we report analysis of panchayat revenue
and expenditure data we obtained from council secretaries (in some cases, from the panchayat
annual reports provided by secretaries) to investigate the fiscal effects of reservation in the 200
panchayats in our study group.38 We find that there is virtually no significant effect of reservation
on the level or composition of taxes in the 200 village councils in our study group. For example,
the estimated effect of reservation on the amount of revenues raised through property taxes, water
taxes, license fees, and other fees are each insignificant. There is one significant effect of
reservation for a residual category, “other taxes;” However, this finding appears to be strongly
affected by a few large values in the unreserved category and as such could conceivably reflect
measurement error. Moreover, when applying a Bonferroni correction for the multiple
comparisons we are making, this effect is also insignificant.39 In our survey of members and
presidents, we also asked whether the panchayat levies property/house taxes, and there we found
no effect of reservation as well.40
Nor does reservation increase actual spending on schemes (welfare programs) targeted to
Scheduled Castes or Scheduled Tribes. In Table 9, we report analysis of total SC-targeted 36 One of the few significant findings is that secretaries report that presidents work one half-day per week less in reserved panchayats, a difference that is statistically significant. As we discuss below, this may reflect bias on the part of secretaries; there is no difference in evaluations of the number of days worked by presidents, among members from both upper and lower castes. 37 The one exception is that Panchayat Jamabandi meetings are deemed significantly more effective in reserved villages. 38 There is some missing data here, but the missingness is statistically unrelated to reservation status.
39 The Bonferroni correction reflects the fact that with multiple comparisons, we expect a certain number of significant test statistics, even under the null hypothesis (say, 5 out of 100 t-statistics). The correction adjusts the level at which the null is rejected in any individual test to reflect the number of comparisons to be made. 40 Unlike the other results, this finding could reflect low variance: 97 percent of council members and president say house/property taxes are levied. However, there is much more variance in the amounts raised through such taxes. In general, such taxes constitute a small proportion of overall panchayat funding.

23
spending as well as disaggregated expenditures on three schemes: the Ashraya Rural Housing
Programme (which provides subsidies and loans to aid the construction of dwellings for members
of the SC and ST groups, up to a maximum of 50% of the total allocation, and others below the
poverty line); the Indira Awaas Yojana (IAY) (which provides income support and shelter based
on a poverty standard), and the Ambedkar Housing Scheme (which builds houses for Scheduled
Caste and Scheduled Tribes).41 While funds for such schemes typically come from the state or
central level and are supposed to be allocated scheme- or project-wise (i.e., towards the schemes
to which they are dedicated), reservation might well affect the level of actual expenditures by
panchayats on such schemes.42 For none of these three schemes, however, do we find an effect
of reservation on spending. Nor do we find a significant effect for any one of the other 25
schemes on which we have collected expenditure data from local secretaries in our surveyed
panchayats.43 Our evidence is thus not consistent with an effect of reservation on the allocation
of expenditure to SC or ST-targeted schemes.44
[TABLE 9 ABOUT HERE]
41 With respect to some of these schemes, such as Ashraya and the Ambedkar Housing Scheme, beneficiaries are supposed to be selected in Gram Sabha meetings, a process that council presidents may well be able to influence. 42 In our surveys of council members and presidents, for instance, we asked whether project funds are distributed equally among the members of the gram panchayat, concentrated project-wise, or allocated in some other way; just 25 percent of our respondents (N=390) said that funds were concentrated project-wise, while 71 percent said they were shared among members and 4 percent said they were allocated in some other manner. Furthermore, in our larger dataset of 5,697 panchayats across the state of Karnataka (described below), allocations from states to panchayats for Ashraya spending are correlated at 0.80 with actual expenditures on this scheme, while allocations for IAY spending are correlated at 0.84—suggesting some room for discretion on the part of village councils and thus some potential role for reservation. 43 The other schemes on which we collected expenditure data are as follows. Central-government schemes: 11/12th Finance Fund, Mini Water Supply, and SGRY. State-government schemes: Section 206 of the PRI Act of 1993, Developmental Grants, and Nirmal Karnataka. Other or mixed schemes: Swacha Grama Yojane, Male Neeru Koilo (rain water), Library, Vada Samvadhana, Kugrama Suvarna Grama, Namma Bhumi Namma, Mid-Day Meals, Gram Swaraj, Employment Guarantee (NREGA), Total Sanitation, Swajaladara, Watershed Development, Continuing Education, SGSY, PMGY, Jal Nirmal, Jala Rakshane, Bharath Nirman, and drinking water maintenance. 44 We also found no significant effect of reservation on the panchayats’ opening balance, funds from central grants, funds from state grants, revenues from taxes, fees levied, other revenue sources, or the panchayats’ closing balance at the end of the fiscal year. These results are perhaps expected in the case of central and state grants, since these are often formula-based; since central and state grants comprise the major proportion of panchayat fiscal revenue, we might expect the opening balance to be similar in reserved and unreserved councils.

24
We were concerned that these null findings are simply an artifact of our relatively small
sample size. With 100 panchayats assigned to treatment and 100 assigned to control, the
probability of rejecting a null hypothesis of zero—given a true treatment effect of about one-
quarter of one standard-deviation—is about 80%. Thus, while our statistical power is not trivial,
neither is it enormous; in repeated trials, we would fail to reject small treatment effects with
relatively high probability.
To address this concern, we replicated our regression-discontinuity design for a much
larger study group, using census and reservation data on 5,697 Gram Panchayats located in all
taluks across the state of Karnataka.45 As above, we picked reserved and unreserved panchayats
located just at the threshold for reservation; we thereby created a study group of 1,430
panchayats—715 with presidencies reserved for Scheduled Tribes or Scheduled Castes and 715
unreserved or reserved for dominant Backward Castes.46 The advantage here is the much larger
sample size and consequent statistical power: with this expanded sample, the probability of
rejecting the null hypothesis of no effect is about 80% for a true treatment effect of just 0.15 of
one standard deviation. The disadvantage is that we cannot measure the distribution of benefits
or perceptions of caste politics in the detailed way we could with our own survey, though we do
have detailed data on fiscal outcomes for the larger sample, as described below. With respect to
balance, as for our smaller sample, we fail to reject the null hypothesis of equality of means in the
treatment and control groups for all of the pre-treatment covariates for which we have data.47
For this larger study group, we draw on two sources of outcome data. First, the Karnataka
Department of Rural Development and Panchayati Raj provides publically-available data on 45 There are around twenty “rural” panchayats with exceedingly large populations in the state; including these in the population from which the study group would be drawn would tend to make our estimates more unstable, making it less likely that we would reject the null hypothesis of no effect. In our analyses below, we therefore excluded panchayats that are more than 4 standard deviations above mean population. However, including such panchayats in the study group (where matched pairs are available) makes no difference for the null results reported below. 46 204 of the 715 reserved panchayats are reserved for Scheduled Tribes, while 511 are reserved for Scheduled Castes; each of these is paired with a panchayat with an unreserved presidency (or one that is reserved for dominant backward castes) with a very similar proportion of the population of the reserved. As above, this pairing allows us to look at the effects of Scheduled Caste or Scheduled Tribe reservation separately, as well as the effects of reservation for either. 47 The pre-treatment covariates on which we assessed balance include total population, female population, number of literates, number of workers, and number of marginal workers; we also assessed balance on proportions for each of these (e.g., the literacy rate). Results available on request.
25
several indicators of performance at the panchayat level, including local taxes and fees,
expenditures on particular schemes, numbers of panchayat meetings held, and outcome indicators
such as latrines or wells built by the panchayat. Second, the Gram Swaraj Project, financed by
the Government of Karnataka and the World Bank, has gathered extensive fiscal data at the
panchayat level. Some of these data are available for the entire state, while other data are
available just for the 39 taluks in which the Gram Swaraj Project is working. These fiscal data
have the advantage that they have been extensively audited at the panchayat level by the Gram
Swaraj Project team, so their accuracy rivals our own data gathered from local secretaries in the
panchayats in our smaller study group.
For purposes of comparison with our results above, in Table 10 we present data on fiscal
outcomes similar to those presented above; these include total taxes, property taxes, other fees,
and expenditures on the same SC- and ST-targeted schemes as in Table 9 (Ashraya Rural
Housing Programme, IAY, and Ambedkar housing scheme). We also present data on several
other outcome variables, such as number of Gram Panchayat meetings, Gram Sabha meetings,
expenditure on drinking water infrastructure, number of individual latrines built, and community
latrines built. Of all of the outcome variables available to us on the larger population, we thought
these might conceivably be most sensitive to reservation for SC or ST presidents. For instance,
the scheme under which individual latrines are financed are supposed to give strong preference
for the building of individual latrines in SC or ST households, Duflo (2005) for instance, points
out that SCs and STs are usually poorer on average, and they may be the most likely to benefit
from the building of individual latrines or other targeted poverty alleviation (now called Total
Sanitation Campaign).
[TABLE 10 ABOUT HERE]
Reservation has no significant effect on any of the response variables analyzed in Table
10. Even the effect of reservation on total fees, which was significant in our smaller sample
(though only without a correction for multiple comparisons), is here insignificant. Moreover, we
tested the effects of reservation on many other variables on which we have data but which are not
included in Table 10. Using the data from the Rural Department and Panchayati Raj, we found
just 2 significant results in 108 tests (27 variables measured at four different six-month intervals);
using the Grama Swaraj data, we found 3 significant effects in 178 tests (89 variables measured in
26
2006 and 2007). None of our five “significant” results come close to surviving standard
Bonferroni corrections for multiple comparisons. Our data thus fairly resoundingly reject the idea
that reservation of the council presidency for Scheduled Castes or Scheduled Tribes has a strong
effect on panchayat performance or caste distribution.
Of course, our data may not allow us to estimate counterfactual outcomes in the absence
of reservation as a system⎯that is, to estimate what would have happened if the 73rd
constitutional amendment had not mandated some form of reservation in council elections and if
the state of Karnataka had not passed and implemented laws governing reservation of council
presidencies for Scheduled Castes and Scheduled Tribes. In principle, it is possible that
equilibrium policy outcomes are shaped, system-wide, by the presence of reservation. Another,
related possibility is that a history of past reservation limits the political or distributive impact of
current reservation. After all, Karnataka does have a long history of local panchayat elections
that predates the passage of the 73rd Constitutional Amendment in 1993.48
However, these possibilities seem fairly far-fetched to us—though as we discuss further
below, it is possible that reservation affects party linkages at the local level and thereby has some
system-wide effects that do not show up in our data. Out of the nearly 4,000 panchayats in the
state of Karnataka for which we have complete reservation history dating back to 1994, just 6
percent have had the presidency reserved more than once for the same category, across the 1994,
2000, 2002, 2005, and 2007 terms. Of the 209 panchayats whose presidencies have been reserved
twice for Scheduled Castes, 178 were reserved in 1993, and of these, 128 of these were next
reserved again in 2007. So reservation of the presidency for Scheduled Castes or Scheduled
Tribes is not very frequent; it seems unlikely that reservation every fifteen years or so would
create a repeated game in which equilibrium behavior would lead to invariance to the actual
reservation of the presidency.49 Moreover, we estimated treatment effects using the outcome
48 Karnataka had local elections in the 1980s as well as a long history of reservation of various offices dating back to the colonial period. For a contrast between caste relations in South and North India, see e.g. Jaffrelot (2003). 49 However, some of the unreserved panchayats in our study group were reserved more recently than 1994. This is because reservation for some panchayat presidencies in 2007 was determined by drawing lots among panchayats with the same numbers of members’ seats reserved for SC or ST; thus, there are “gaps” in the lists of reserved and unreserved panchayats sorted in descending order (recall Table 1). This implied that when we picked unreserved panchayats at the regression-discontinuity threshold to pair with
27
variables reported in Tables 7 and 8, but splitting our study group of 200 panchayats into two sub-
samples: those 74 panchayat-pairs in which the panchayat with the unreserved presidency (in
2007) had the presidency reserved in 2005, and the other 126 panchayat-pairs in the data set that
had either never had a presidency reserved for the relevant category or else had not had it (in most
cases) since 1994—that is, almost 15 years before our survey.50 We find almost no difference in
estimated treatment effects between these groups. Using the members’ data, there is one effect
that is significant in the larger group of 126 panchayats but not in the smaller group; namely,
councils with reserved presidencies are seen as more effectively serving SC/ST needs than
councils with unreserved presidencies. However, few other differences appear between the two
groups, and none of the differences persist to adjustments for multiple comparisons.51 In sum, by
exploiting our intra-study group variation in the extent of previous reservation, we find that a
history of previous reservation does not easily explain our results.52
Our null findings stand in sharp contrast to several previous studies. Besley, Pande and
Rao (2008), for example, analyze data from a village- and household-level survey conducted in
Andhra Pradesh, Karnataka, Kerala, and Tamil Nadu in September-November 2002 (see also
Besley et al. 2004); regressing a measure of whether a household received a targeted benefit (such
as an electricity or water hook-up) on whether the household is SC or ST, whether the presidency
of the respondent’s panchayat is reserved for an SC or ST, and their interaction (along with
controls), these authors find that SC/ST households living in a panchayat with a reserved
presidency are seven percentage points more likely to receive a targeted benefit. What explains
the contrast between our findings and those of previous studies? One reason for the discrepancy
may be methodological. As our discussion above of the process of rotation makes clear,
reserved panchayats, we sometimes picked unreserved panchayats that had been reserved in the previous term or two.
50 Panchayats with reserved presidencies in the first electoral term, of course, would have had reservation from 1994 to 2000. 51 With the secretary data, there are two findings that are significant in the larger group but not the smaller group: in the former group, the president is seen by the president as having less power in reserved councils, but the secretary also decides on beneficiaries to a greater extent in the unreserved councils. These apparently inconsistent results do not withstand Bonferroni corrections for multiple comparisons. 52 Interestingly, however, there is some difference on the variable tapping whether the council is perceived to serve SC/ST citizens effectively: in panchayat pairs where the unreserved council presidency had been reserved in the previous term, the difference between the reserved and unreserved panchayat is significant—but it is the unreserved council (in 2007) that is deemed more effective.

28
reservation depends (in Karnataka) on the proportion of the population that is Scheduled Caste or
Scheduled Tribe.53 Since reserved panchayats will systematically different (often larger)
proportions of Scheduled Caste/Scheduled Tribes than unreserved panchayats, and since having
larger population proportions could be associated with having greater political power,
comparisons between reserved and unreserved panchayats may lead to misleading inferences
about the effect of reservation on the targeting of benefits to SC and ST households. Even if
relative population size is not the right potential confounder, and even if this variable is
controlled, other unobserved omitted variables could clearly be associated both with reservation
and with targeting and thus produce a spurious relationship between reservation and the allocation
of benefits to Scheduled Castes and Scheduled Tribes.
V. What Explains Invariance?
Why, then, does the reservation of council presidencies for politicians from marginalized
castes not, apparently, affect the distribution of benefits to citizens from those castes? One
possibility is that caste simply does not matter in local politics. However, this seems very
unlikely. While some scholars point to the relatively weaker political role of caste in South India
than in North India, many studies of local and state politics in Karnataka emphasize the important
role of caste (Manor 1989, Shastri 2009). Our own survey evidence also suggests that people
believe caste plays an important role in politics.
Moreover, in a companion paper to this article, Dunning (2009) finds substantial evidence
that caste shapes voters’ preferences over political candidates. In Dunning’s (2009) experimental
design, citizens in the same 200 panchayats surveyed in this article were shown identical
videotaped political speeches, given by a single politician (actually, actor). The caste surname of
the politician was manipulated in different treatment conditions: for some citizens, the politician
53 For example, the survey on which Besley, Pande, and Rao (2008) draw was conducted in September-November 2002. At this time, just two electoral terms (those beginning in 1994 and 2000) had probably been completed, since the presidency would have been rotated in September or November of 2002. With only two electoral terms elapsed, bureaucrats would not have had much time to work down lists of panchayats sorted in descending order of SC or ST population proportions. It is thus plausible that the reserved and unreserved panchayats in this study have systematically different population proportions of lower castes, or differ in other unobserved ways.

29
was a member of their own caste (jati), for others a member of a different caste but the same caste
category (such as Scheduled Caste), and for a third group of participants the politician’s surname
made him a member of a different caste category altogether. This experimental evidence shows
that other things equal, voters do favor politicians from their own caste (jati); moreover,
reservation makes caste more salient to voters. Thus, the claim that reservation does not affect
distribution because caste is in fact unimportant in our study group of panchayats has little
empirical basis.54
We are therefore led to consider several other possible explanations, including the
dominance of local bureaucrats over panchayat presidents; the electoral power of dominant
backward castes; and the role of party competition and party politics at the local level. We
describe each of these hypotheses below and evaluate the available evidence in favor or against
each of them.
Lack of Presidential Power?
First, perhaps presidents simply lack power. After all, if presidents lack the ability to
effectuate a policy agenda, policies should be invariant to the caste identity of the council
president. Such a claim goes against a significant literature that has found that the identity of the
council president, in general, affects policy outcomes (Besley et al. 2004, 2008; Duflo et al. 2004;
Palaniswamy and Krishnan 2008), yet it is worth exploring. There are at least two possible
sources of presidential weakness: dominance by local bureaucrats and the power of other council
members.
Bureaucratic dominance
While federal constitutional reforms in 1993 substantially devolved political power to
elected officials at the three tiers of the panchayat system, experts on the panchayat system
sometimes suggest that local bureaucrats called executive secretaries (or just secretaries) retain
54 As discussed below, however, the biggest effects of caste on political preferences in Dunning (2008) occur in affective dimensions; effects on perceptions of distributive politics, while not unimportant, are less pronounced. Dunning (2008) discusses this as evidence for the importance of the “politics of dignity.”

30
substantial power in setting the expenditure priorities of panchayats.55 Such bureaucrats are
responsible for transferring central and state government funds to panchayats and also mediate
other village council interactions with higher tiers in the governance system. Essentially, the
powerful role of such bureaucratic actors might make the elected panchayat president irrelevant,
thus leading to invariance of outcomes across councils with reserved and unreserved presidencies.
There are at least two variants to this hypothesis. The first is simply that secretaries are
too powerful: if bureaucrats call the shots regardless of the identity of the council president, or
have the ability to structure the availability of information in a way that serves particular interests,
then the identity of the council president may be irrelevant. In other words, the invariance of
outcomes to the reservation status of the council presidency may simply reflect the fact that the
president has too little power, regardless of his or her caste identity.
However, our evidence suggests that secretaries do not have unbridled power and is thus
inconsistent with this first hypothesis. We asked council members and presidents how
disagreements among council members about how the council should spend its funds are
resolved: does the secretary decide, does the president decide, is there a majority vote of the
members, or is the disagreement resolved through some other procedure? Among members, 71.6
percent said a majority vote and 21.4 percent said the president must decide, while just 3.9
percent said the secretary decides (and 3.2 percent mentioned some other procedure). When the
same question was posed to presidents, 69.5 percent said a majority vote, 22.5 percent said the
president decides, 3.3 percent said the secretary decides, and 4.6 percent mentioned another
procedure. In other words, at least according the members and presidents, the secretary does not
have a great deal of power to resolve disputes about expenditure priorities.
We also asked respondents how much independent power the secretary has to set the
council’s expenditure priorities and (in a separate question) to determine beneficiaries of welfare
schemes, relative to council members.56 For both questions, the modal response across reserved
55 Dr. SS Meenakshisundaram, IAS, former Joint Secretary in the Ministry of Rural Development, Government of India; Interview, Bangalore, January 17, 2009. 56 We intended to ask the question about the power of secretaries relative to members and presidents; in the Kannada translation of the survey instrument, however, the mention of the president was dropped. This makes the results somewhat more ambiguous, as the secretary could have “somewhat more power” than members but equivalent or lesser power than presidents.

31
and unreserved villages, and among members and presidents, was that secretaries had “somewhat
more power” than members, with the average lying between “somewhat more power” and equal
power.57 However, our data also do not strongly suggest that secretaries are perceived as hoarding
information that is important to the workings of the council. Among presidents—whom we asked
whether secretaries or some other person is to blame for any lack of transparency in the
availability or expenditure of funds—75 percent blamed the secretaries. But among members—
whom we asked whether secretaries, the president, or some other person was to blame—54
percent blamed the presidents, while just 40 percent blamed the secretaries. Thus, presidents are
perceived as at least as responsible as secretaries for transparency problems, suggesting again that
the president has an important degree of power relative to secretaries.
A second hypothesis about bureaucratic domination is more subtle: secretaries might
assume greater power when the council president is less experienced or less competent, or when
the president encounters substantial resistance from council members. If lower-caste presidents
do encounter more resistance (from upper-caste council members) or tend to be less competent,
then the enhanced power of the secretary in reserved panchayats might offset any gains to
marginalized groups that stem from electing the village council president.58 These two
contrasting effects might then produce the null result, that is, the invariance of outcomes to the
reservation status of the council.59
However, our evidence is also largely not consistent with this second, subtler hypothesis,
that secretaries disproportionately dominate reserved presidents. First, we find that the reservation
status of the presidency has no significant effect on the decision procedure (as reported by both
members and presidents and by the secretaries themselves), in case of disagreement among
council members about how the council should spend its funds; that is, reservation does not affect 57 We also asked secretaries what the expenditure priority of the panchayat should be, and what the priority of the panchayat actually is, and compared the responses. Ninety-two percent of secretaries reported that the actual panchayat priority is their own priority, suggesting, if true, an important degree of secretary influence. Recall, however, that 87 percent of presidents and members said the same, suggesting that this question may not provide our most reliable indicator of secretary power. 58 We do not intend to presume that politicians in reserved constituencies are less competent. Munshi and Rosenzweig (2009), in fact, argue that the average competence of elected politicians should be greater in reserved constituencies, if voters are willing to sacrifice competence in order to elect politicians of their own caste; in reserved constituencies, where politicians must come from a singe caste category, voters may thus choose politicians of higher average quality, relative to unreserved constituencies. 59 This, of course, assumes that the objectives of reserved presidents and executive secretaries diverge.

32
whether the secretary decides, the president decides, or whether there is instead a majority vote in
case of disagreement.60 Next, reservation does not affect the perceived power of secretaries to
determine expenditures or beneficiaries, relative to members (as reported by secretaries,
members, and presidents), nor the degree of match between the secretary’s preferred priority and
the council’s actual priority (as reported by the secretary).
Finally, while secretaries are better educated than members and presidents in our sample,
educational differences appear unlikely to be a channel through which secretaries
disproportionately dominate Scheduled Caste or Scheduled Tribe presidents. To be sure, the
modal (and median) secretary in our sample is a graduate with a college degree or other
equivalent degree, while the modal council member and presidents completed high school or
equivalent but did not pursue further studies.61 Yet interestingly, the modal and median education
level of presidents in reserved and unreserved village councils does not differ. Here again, it
seems unlikely that there is a substantial difference in secretary-adhyaksha relations across
reserved and unreserved councils.
In only two areas did we find a significant effect of reservation on what secretaries say
about the functioning of panchayats. First, in reserved panchayats, secretaries say that the council
president works about one-half day less per week, on average, relative to unreserved panchayats;
the effect is significant at standard levels. In the eyes of secretaries, then, lower-caste presidents
in reserved panchayats may be less hardworking than presidents in unreserved panchayats.
However, it should be born in mind, as we saw above, that there is no difference across reserved
and unreserved panchyats in what members (as well as presidents themselves) report about how
many days per week the president works. Thus, rather than indicate lower effort on the part of
reserved presidents, this finding may provide some evidence of prejudice on the part of
secretaries.
Second, however, we asked members and adhyakshas whether the secretary distributes
Government Circulars or other government documents relating to the revenues and expenditures
of the Gram Panchayat. There is a highly significant difference of 9 percentage points between
60 Interestingly, among members and presidents, there is no difference in perceptions of the power of the secretary by caste of respondent, across both reserved and unreserved villages. 61 The median member and president completed at least Class VIII but not Class X in higher school.

33
reserved and unreserved councils⎯but secretaries are more likely to distribute circulars in
reserved panchayats than in unreserved panchayats.62 In other words, rather than take advantage
of their possible prejudice against lower-caste presidents to exploit informational asymmetries,
secretaries seem to make information more readily available in reserved panchayats.
In sum, there is little evidence in our data to suggest that secretaries take disproportionate
advantage of weak or marginalized Scheduled Caste or Scheduled Tribe presidents in reserved
councils to advance their own interests, and thereby offset other advantages to marginalized
groups that may stem from electing lower-caste politicians in reserved constituencies. Secretaries
are not irrelevant, but the strength of the secretary hardly appears sufficient to make the identity
of the president irrelevant and thereby account for the invariance of outcomes to the reservation
for presidents from lower-caste groups.
Members’ power
What about members’ power? As noted above, 71.6 percent of members and 69.5 percent
of presidents said that disagreements are resolved by majority vote, which may suggest that
members have strong powers relative to presidents (thus reducing the impact of the president).
However, presidents may have important agenda-setting powers; while presidents are supposed to
work full-time on council matters, members do not. Moreover, presidents are perceived as having
substantial power. When asked how much power presidents have to decide expenditures and
beneficiaries, relative to council members, on a 5-point ascending scale, members report average
scores of 3.97 and 3.85, respectively, which correspond to answers of “somewhat more power.”
(Presidents themselves report average scores of 4.26 for expenditures and 4.13 for beneficiaries,
answers which lie between “somewhat more power” and “a lot more power”). Furthermore, there
is no significant difference in these responses across reserved and unreserved councils. Thus,
reserved presidents are not, in fact, perceived as having less power, relative to members, than
unreserved presidents.
In sum, there is little evidence for the contention that our null findings are driven either by
the lack of power of council presidents, in general, or the specific lack of power of lower-caste
presidents in reserved constituencies. According to council members, presidents, and secretaries, 62 The difference between reserved and unreserved panchayats is largely driven by what the members (rather than presidents themselves) say; since members may have weak incentives to misrepresent what the secretary does, these should be fairly reliable indicators.

34
local bureaucrats do not have more power in reserved councils than unreserved councils. Nor are
presidents weaker, relative to members, in reserved councils than unreserved councils. A lack of
power on the part of council presidents thus does not seem to be a plausible explanation for our
null findings.
Upper-Caste Electoral Power
Another potential explanation for the invariance of policy and distributive outcomes to
reservation, as discussed above, is that upper-caste voters in reserved constituencies may elect
lower-caste candidates whose preferences are similar to theirs. Recall that most council
constituencies are dominated numerically by upper castes; only in a very small fraction of
panchayats do Scheduled Castes and/or Scheduled Tribes actually constitute a majority. (On
average, across panchayats in the state of Karnataka, Scheduled Castes constitute 18.4 percent of
citizens, while Scheduled Tribes comprise 8.1 percent). The numerical superiority of upper-caste
groups may thus allow them to elect pliant or weak lower-caste council members in reserved
constituencies—or simply to elect lower-caste politicians who share their policy preferences more
closely than would a lower-caste voter selected at random.63
We can investigate this hypothesis in a number of ways. First, recall that there is
substantial heterogeneity across our study group of panchayats in the percentage of the population
that comes from a Scheduled Caste or Scheduled Tribe.64 This is because taluks have different
numbers of Gram Panchayats, and also different proportions of SC and ST residents—thus, in any
given election, the proportion of Scheduled Castes or Scheduled Tribes in panchayats located at
the threshold of our regression-discontinuity will vary (recall the hypothetical reservation
procedure shown in Table 1). In our study group, the minimum Scheduled Caste proportion is 0.8
percent and the maximum is 49.4 percent, while the minimum Scheduled Tribe proportion is 0
percent and the maximum is 51.7 percent.
63 Interestingly, upper-caste members say the president has more power to decide, relative to members, in unreserved villages, relative to reserved villages. 64 On average across the state of Karnataka, taluks have about 32.9 Gram Panchayats, with a standard deviation of 11.4. Thus, after five rotations of the adhyaksha position (1993, 2000, 2002, 2005, and 2007), the threshold for reservation in some taluks will be near the top of their list (or will have cycled through the list), implying a high SC or ST proportion near the threshold, while other selected Gram Panchayats will have a lower proportion SC and ST.

35
While the Scheduled Castes comprise an absolute majority of the population in none of
the panchayats in our study group (and Scheduled Tribes comprise an absolute majority in only a
small fraction), there are nonetheless a substantial number of village councils in which these
groups constitute the plurality of the population. In such councils, Scheduled Castes and
Scheduled Tribes should potentially have substantial power to elect candidates who share their
collective or typical preferences over distributive policy. This seems especially true, given an
electoral system in which multiple candidates are sometimes elected as members from single
wards (typically villages); given multiple posts, a plurality of, say, forty percent of the population
(the Scheduled Castes or Scheduled Tribes) who share preferences over strong, non-pliant
candidates should clearly be able to elect their preferred candidates as members.65
On this account, the distributive effects of reservation should be stronger where Scheduled
Castes or Scheduled Tribes are relatively numerous. To investigate this hypothesis, Table 10
shows the effects of reservation among Gram Panchayats in the upper quartiles of the Scheduled
Caste (21.6 to 49.4 percent) and Scheduled Tribe (11.5-51.7) population proportions,
respectively, using data from both the citizens’ and members’/presidents’ modules.66 The first
column of the table reports the effects of SC reservation, using data from SC respondents
(citizens and members); the second column reports the effects of ST reservation, using data from
ST respondents (again, citizens and members); while the third column pools SC and ST
respondents and reports the effects of SC or ST reservation.
Our null results persist entirely in the upper quartile of the distribution. Almost none of
the effects are significant; and while the power of some of our tests is low, at least when we use
data from the members’ surveys and restrict the sample to SC or ST respondents alone (each
upper quartile includes just 50 villages), even the direction of many of the (insignificant) effects
does not suggest that reservation empowers Scheduled Castes or Scheduled Tribes. Indeed, as
reported in Table 10, the only significant effect we find using the citizens’ data is that the council
president is significantly more likely to be identified as being from an SC or ST jati in reserved
councils in the upper-quartile of the distribution—but this simply reflects the fact that council
65 For state legislative and national elections, India has a single-member first-past-the-post parliamentary system. Local elections such as those in Karnataka appear unique in that multiple members can be elected from single constituencies. 66 Results from the secretaries’ module are similar to those reported in Table 6.

36
presidents are from SC jati in reserved GPs. And the only significant effect we find in the upper
quartile, using data from our members’/presidents’ survey, is that SC and ST respondents are
significantly less likely to say that the council prioritizes SC/ST residents when the presidency is
reserved. Finally, we estimated the effect of reservation on fiscal outcomes, as reported in Tables
8 and 9, using both our focused sample and our statewide sample, and found only one significant
effect across seventeen statistical tests in the upper quartile of the population distributions.67
Thus, even where Scheduled Castes and Scheduled Tribes are relatively numerous—and could
thus, in principle, elect representatives who would direct more benefits to lower-caste and tribal
citizens—we do not see a strong effect of reservation on distribution.
[TABLE 10 HERE]
There are at least two other related reasons to think that the standard story about the
electoral or social dominance of upper-castes cannot explain why reservation does not boost
distribution to marginalized groups. The first, related to the discussion above, is the indirect
method of selection of presidents and the fact that there are multimember constituencies. It seems
quite likely that if upper- and lower-castes were voting as blocks, lower-caste voters could
succeed in electing a member who would represent their collective distributive preferences. The
second related reason is precisely that upper castes are not voting as blocks. As we will see in the
next section, there are substantial splits in candidate preferences within villages, among voters of
the same castes. This takes us to a final explanation for the invariance of distributive outcomes to
reservation of the presidency, an explanation for which we find more support in our data.
67 Moreover, this effect—which is significant only when we do not adjust for multiple comparisons using a Bonferroni correction—suggests a negative effect of reservation on SC-targeted spending from the IAY scheme.
37
Party Competition
Our evidence makes clear the salience of parties in local electoral politics. First, our
survey data reveal that citizens, members and presidents have substantial knowledge of the party
affiliation of elected representatives. Among citizens in our sample, 81.7 percent could identify
the political party of the council president, while 87.9 percent of respondents knew the party of
the candidate for whom they voted in the most recent elections.68 Since 85.7 percent also
identified the caste of the president, the data suggest that political party may be roughly as salient
as caste, at least as far as voter knowledge goes. Moreover, party affiliation is strongly related to
electoral behavior. For example, among the 308 Scheduled Caste and Scheduled Tribe
respondents who are party members and also identified the party of the candidate for whom they
voted in the last elections, 71.8 percent voted for a candidate from their party.69 In total,
including backward and forward castes, 73.3 percent of respondents reported membership in a
political party, and 78.8 percent of those party members voted for a candidate from their party in
the most recent elections. Thus, parties clearly play an important role in panchayat elections.
This is all the more striking because in Karnataka, candidates are banned from running on party
symbols in local elections: following the Gandhian ideal, village elections are supposed to be
party-free.70
The importance of party competition for our argument is that, at least in village council
elections in Karnataka, members of the same caste are frequently members of different parties.
On the one hand, it is true that across our sample of panchayats, Scheduled Caste and Scheduled
Tribe citizens are substantially more likely to be members of Congress than members of the BJP
68 Note that the proportion of citizens who identified the party of the candidate for whom they voted is 8 or 9 percentage points higher than the proportion who identified the party of the candidate they most preferred, which may suggest the importance of party labels in shaping voting behavior: on the margin, voters may vote strategically for candidates affiliated with a party.
69 If we do the same but looking at the party to which the respondent feels closest, we find that among the 388 Scheduled Caste respondents who reported to which party they feel closest and also identified the party of the candidate for whom they voted in the last elections, 79.8% voted for a candidate from their party. (Adding 115 Scheduled Tribe respondents who identified the party to which they feel closest and who reported their chosen candidate’s party, the percentage rises to 80.8%). 70 The Karnataka Panchayat Raj (Conduct of Election) Rules—1993, Rule 20.

38
or the JD (S), the other two major parties in Karnataka,71 while backward and forward castes are
somewhat more likely to support the BJP than Congress.72 Yet this fact does not appear to
translate into a strong relationship between caste, party, and vote choice within villages. In our
sample of citizens, for instance, there are 160 panchayats in which at least two Scheduled Caste
respondents (and never more than four SC respondents, since this was the upper bound on the
number of SC respondents per village) identified the party of the candidate for which they voted.
Strikingly, these SC respondents voted for the same party in just 59 of these 160 panchayats.
Thus, in 101/160 or 63 percent of these panchayats, the small number of surveyed Scheduled
Caste respondents voted for different parties (and, perforce, different candidates).
Nor do Scheduled Caste and Scheduled Tribe members of the same village council
necessarily come from the same party. In the 32 panchayats in our sample in which we surveyed
more than one SC or ST council member, and in which at least two of these respondents
answered the party affiliation question, we found that these respondents came from the same
party in 18/32 or 56 percent of panchayats—which implies that in 14/32 of 44 percent of the
councils, SC/ST respondents came from different parties. Moreover, among members and
presidents, there is no statistically significant association between SC/ST caste and affiliation in
any of the three main parties, Congress, BJP, or JD (S). Clearly, within villages, membership in a
particular caste category does not imply homogenous choices by voters over candidates; nor does
it imply that council members from the same caste category are members of the same party.
How might the cross-cutting relationship between caste and party affiliation help to
explain our null findings? Essentially, our hypothesis—which requires further verification—is
that linkages between upper- and lower-caste council members, via party organizations, blunt the
distributive impact of the reservation of the presidency. After all, if Scheduled Caste or Schedule
71 27.3 percent of SC/ST respondents are members of Congress, while 8.9 percent are members of the JD (S) and 10.5 percent are members of the BJP. SC/ST citizens are around 18 percentage points more likely to be members of Congress than are respondents from other castes. 72 Note that we did not find any distinction by jati, or the individual castes that comprise the SC/ST categories. For instance, the major Scheduled Castes in Karnataka, the Holaya and the Madiga, are about equally likely to belong to any of the three major parties. Among dominant Backward Castes, however, the Vokkaliga tend to support the JD (S), while Lingayaths disproportionately back Congress; there is no significant difference in BJP membership across Vokkaligas and Lingayaths. Yet party splits across different jati in the dominant groups seems unlikely to affect the relationship between reservation of the presidency for the SC/ST category and distribution to SC/ST residents.
39
Tribe presidents are members of larger parties or coalitions that include both lower- and upper-
caste members, are supported by voters of all castes, and that also exclude some SC or ST
members of the council, then the policy preferred by the governing party or coalition (and, on this
argument, promoted by the council president) may largely reflect intra-party bargaining, rather
than caste-based preferences. That is, if a particular party or coalition on the council is dominant,
then the (weighted average) policy preferences of members of this coalition as a whole may be
most important, whether the president is from the Scheduled Castes or not.73 On this argument,
reservation of the council presidency might shift policy marginally in the direction of greater
distribution to Scheduled Castes and Scheduled Tribes—we are not arguing that council members
don’t want to distribute goods to their own castes, other things equal, or that voters don’t prefer to
support candidate from their own castes (see Dunning 2009 for evidence to the contrary)—but if
party distributive platforms already reflect the (weighted average) preferences of party members,
then the marginal shift due to reservation may not lead to a large effect on distributive outcomes.
We present this argument as a hypothesis subject to further verification, and our data do
not allow us to explore the full implications of the hypothesis; yet our data, which we believe to
be some of the first systematic data on reservation, caste, and party politics at the local level, do
clearly support two claims: parties play an important role in electoral competition at the local
level in Karnataka, and Scheduled Castes and Scheduled Tribes are by no means homogenous
voting blocks. Our analysis parallels in some ways the findings of Thachil (2009) and Thachil
and Herring (2008) that disadvantaged populations vote for radically dissimilar parties across
different Indian states. Here, we find not only that Scheduled Castes and Scheduled Tribes vote
for different parties across different local constituencies in the same state, but also that within the
same local constituency, Scheduled Castes and Scheduled Tribes (as well as individual castes or
jati within those larger caste categories) are often substantially split in their party affiliations.
Our data therefore suggest the plausibility that cross-cutting party ties undercut the influence of
electoral quotas on caste-based distribution of council benefits; exploring the influence of party
73 The indirect method of selecting the president may also matter here: since voters elect members, and members select the council president, the majority or plurality coalition on the council is plausibly going to be determinative in the selection of the president, whether the presidency is reserved for Scheduled Castes or not.

40
competition on the relationship between reservation, caste, and distribution should thus be an
important avenue for future research.
Conclusion
A large literature suggests, intuitively enough, that political reservation for women or for
lower-castes should lead to policies favored by these groups—whether in the form of greater
targeted transfers, spending on public goods valued by the reserved group, or other policies (see
Duflo 2005 for a review). Our findings cast substantial doubt on this hypothesis, in a single but
important case, using a research design in which the fiscal effects of political reservation are
unlikely to be confounded by omitted variables. Both in our sample of 200 panchayats, in which
we gathered close-range survey data on individual perceptions and benefit receipt as well as
aggregate fiscal outcomes, and in a much larger sample of 1,430 village councils drawn from the
entire state of Karnataka, we fail to reject the null hypothesis of no effect for most of the many
variables that tap distributive or policy outcomes. Moreover, because of the way our regression-
discontinuity design is constructed, our sample contains substantial heterogeneity in village-level
covariates (such as proportions of Scheduled Tribe and Scheduled Caste citizens) and is also, on
average, quite representative of Karnataka; so our results seem quite likely to extend to the state
as a whole. In Karnataka, then, reservation of village council presidencies does not appear to
have strong distributive or policy effects.
Of course, we do not argue that either caste or reservation are irrelevant; indeed,
experimental evidence drawn from the same 200 villages surveyed in this paper show that, other
things equal, caste does affect the voting preferences of citizens (Dunning 2009). Our survey
evidence suggests that people by and large do expect that the caste identity of politicians has a
distributive impact. It is also important to emphasize that we do not suggest that reservation has
no policy or distributive effect whatsoever; previous studies have found that the identity of
council members and presidents shapes the allocation of resources across the multiple villages
contained in a single panchayat (Besley et al., 2004, 2007, Palaniswamy and Krishnan 2008), and
we lack empirical leverage to assess the inter-village distribution of resources. We simply argue
that other, complementary conditions may be necessary to prompt greater distribution to

41
marginalized groups, even after the enactment of quotas that elevate members of those groups to
political power. We also show that two common anecdotal explanations given for the
ineffectiveness of reserved council presidents—their lack of power relative to bureaucrats or
other council members and the electoral power of upper-caste groups—are not consistent with our
data. Instead, the character of party competition at the local level may help to explain why policy
appears relatively invariant to the presence of an electoral quota.
What is the larger significance of these findings? To be sure, Karnataka is one state in
one country, and it is one with a slightly longer history of local elections, and arguably less
conflictive relations between upper- and lower-castes, than some states in India. Other work using
similar research designs might thus well find contrasting effects in other states.74 Indeed, our
argument would suggest that the effect of reservation should vary in other states. Part of the
explanation for our null finding in Karnataka may well be that lower-castes are not exclusively
mobilized as part of a lower-caste party, but are instead split at the local level between parties that
have some caste basis but are nonetheless aptly characterized (at least in terms of caste) as catch-
all parties. If so, we might indeed see different results in states such as, say, Uttar Pradesh, where
the Bahujan Samaj Party (BSP) and its chief minister Mayawati have successfully mobilized
many lower-castes, and Karnataka, where the BSP’s attempt to mobilize along Scheduled Caste
lines largely failed (Chandra 2004). Since many Indian states use similar principles (though
different rules) to rotate reservation of the presidency across panchayats, future research could
exploit similar designs to assess the effects of reservation in different states (see Chauchard
2009).
Such research could lead to an accumulation of research on how complementary
conditions shape the effects of formal institutional change.75 Comparison of findings in different
settings may help reinforce our main point: while electoral quotas may encourage the tilting of
policy in favor of the groups for whom reservation is made, they may not be sufficient. In some
settings, reservation of electoral offices may spark large policy shifts; in others, as in Karnataka,
74 Chauchard (2009) presents a research design that will use a similar regression-discontinuity approach to study the effects of reservation at the local level in Rajasthan. 75 One difficulty with this strategy from an empirical point of view, of course, is that while the formal institutional changes may be as-if randomly assigned within states, the complementary conditions are not as-if randomly assigned across states.

42
distributive outcomes may be largely invariant to formal institutional change. Exploration of
what kinds of conditions complement formal institutional change thus provides an important
agenda for future research, in India and other contexts.
Viewed from a broader perspective, our null results may seem like good news: after all,
panchayats with reserved presidents do not perform any worse that panchayats without reserved
presidents. Yet viewed in the context of the continued marginalization of former Untouchable
castes and others making up the Scheduled Caste and Scheduled Tribe groups, our results may
also have more troubling normative and positive implications. If explicit electoral quotas do not
result in greater allocation of benefits to such marginalized groups, it is difficult to see what other
formal institutional changes would. On the other hand, it may be that reinforcing complementary
changes that enhance the effects of formal institutions are necessary, and in this respect the
research may suggest positive steps with important normative consequences.

43
References
Acemoglu, Daron, and James Robinson. 2006a. Economic Origins of Dictatorship and
Democracy. New York: Cambridge University Press.
Acemoglu, Daron, and James Robinson. 2006b. “De Facto Political Power and Institutional
Persistence.” American Economic Review 96 (2): 326-330.
Acemoglu, Daron and James Robinson. 2008. “Persistence of Power, Elites, and Institutions.”
American Economic Review 98, no.1 (2008): 267-93.
Bardhan, P., and D. Mookherjee. 2006. “Pro-poor targeting and accountability of local
governments in West Bengal.” Journal of Development Economics. 79 (2): 303–327.
Beaman, Lori, Raghabendra Chattopadhyay, Esther Duflo, Rohini Pande, and Petia Topalova.
2008. “Powerful Women: Does Exposure Reduce Prejudice?” Weatherhead Center for
International Affairs, Harvard University: WCFIA Working Paper.
Besley Timothy, Rohini Pande, Lupin Rahman, and Vijayendra Rao. 2004. “The politics of
public good provision: Evidence from Indian local governments.” Journal of the European
Economic Association. 2 (2–3): 416–426.
Besley, Timothy, Rohini Pande, and Vijayendra Rao. 2007. “Just rewards? Local politics and
public resource allocation in South India.” Development Economics Papers 49, Suntory and
Toyota International Centres for Economics and Related Disciplines, LSE.
Besley, Timothy, Rohini Pande, and Vijayendra Rao. 2008. “The Political Economy of Gram
Panchayats in South India.” In Gopal K. Kadekodi, Ravi Kanbur, and Vijayendra Rao, eds.,
Development in Karnataka: Challenges of Governance, Equity, and Empowerment. New
Delhi: Academic Foundation.
Breeding, Mary. 2008. “Rewarding Loyalists, Buying Turnout, and Mobilizing the Poor: The
Success of Mixed-Clientelist Strategies in Bangalore Elections.” Discussion paper prepared
for the Political Economy Methods Group, Georgetown University, October 21, 2008.
Chandra, Kanchan. 2004. Why Ethnic Parties Succeed: Patronage and Ethnic Head Counts in
India. New York: Cambridge University Press.
Chauchard, Simon. 2009. “Do Political Quotas for Disadvantaged Groups Affect Prejudiced
Attitudes and Behaviors? Providing Evidence from Experiments in Rural India.” Presented

44
at the annual meetings of the American Political Science Association, Toronto, Canada,
August 27-31, 2009.
Dahlerup, Drude, ed. 2006. Women, Quotas, and Politics. Routledge Research in Comparative
Politics. New York: Routledge.
Duflo, E., and P. Topalova. 2004. “Unappreciated Service: Performance, Perceptions, and
Women Leaders in India.” Manuscript, Department of Economics, Massachusetts Institute
of Technology.
Duflo, Esther. 2005. “Why Political Reservations?” Journal of the European Economic
Association 3.2-3.3: 668-678.
Dunning, Thad. 2008. “Improving Causal Inference: Strengths and Limitations of Natural
Experiments.” Political Research Quarterly 61 (2): 282-293.
Dunning, Thad. 2009. “The Salience of Ethnic Categories: Field and Natural Experimental
Evidence from Indian Village Councils.” Manuscript, Department of Political Science,
Yale University.
Freedman, David. 2006. “Statistical Models for Causation: What Inferential Leverage Do They
Provide?” Evaluation Review 30: 691-713.
Gerber, Alan S., and Donald P. Green. 2008. “Field Experiments and Natural Experiments.” In
Janet M. Box-Steffensmeier, Henry E. Brady, and David Collier (eds.), Handbook of
Political Methodology. New York: Oxford University Press, pp.357-381.
Grossman, Gene M. and Elhanan Helpman. 2001. Special Interest Politics. Cambridge and
London: MIT Press.
Htun, Mala. 2004. “Is Gender Like Ethnicity?” Perspectives on Politics 2 (3).
Jaffrelot, Christophe. 2003. India's Silent Revolution: The Rise of the Lower Castes in India. New
York: Columbia University Press.
Manor, James. 1989. “Karnataka: Caste, Class, Dominance and Politics in a Cohesive Society.”
In F. Frankel and M.S.A. Rao, eds., Dominance and State Power in Modern India: Decline
of a Social Order, vol. 1. Delhi: Oxford University Press.
Munshi, Kaivan, and Mark Rosenzweig. 2008. “The Efficacy of Parochial Politics: Caste,
Commitment, and Competence in Indian Local Governments.” Manuscript, Departments of
Economics, Brown University and Yale University.

45
Norris, Pippa. 2004. Electoral Engineering: Voting Rules and Political Behavior. New York:
Cambridge University Press.
Palaniswamy, Nethra, and Nandini Krishnan. 2008. “Local Politics, Political Institutions, and
Public Resource Allocation.” International Food and Policy Research Institute, Discussion
Paper 00834.
Pande, Rohini. 2003. “Can Mandated Political Representation Increase Policy Influence for
Disadvantaged Minorities? Theory and Evidence from India.” American Economic Review
93 (4): 1132-1151.
Pitkin, Hannah Fenichel. 1967. The Concept of Representation. Berkeley: University of
California.
Reynolds, Andrew. 1999. “Women in the Legislatures & Executives of the World.” World
Politics 51: 547-572.
Shastri, Sandeep. 2009. “Legislators in Karnataka: Well-entrenched Dominant Castes.” In
Christophe Jaffrelot and Sanjay Kumar, eds., Rise of the Plebeians? The Changing Face of
Indian Legislative Assemblies. New Delhi: Routledge.
Soifer, Hillel, and Mattias vom Hau. 2008. “Unpacking the Strength of the State: The Utility of
State Infrastructural Power.” Studies in Comparative International Development, 43 (3-4):
219-230.
Thachil, Tariq. 2009. The Saffron Wave Meets the Silent Revolution: Why the Poor Vote for
Hindu Nationalism in India. Ph.D. Dissertation, Department of Government, Cornell
University.
Thachil, Tariq, and Ronald Herring. 2008. “Poor Choices: Dealignment, Development, and
Dalit/Adivasi Voting Patterns in Indian States.” Contemporary South Asia, 16 (4): 441-64.
Weiner, Myron. 2001. “The Struggle for Equality: Caste in Indian Politics.” In Atul Kohli, ed.,
The Success of India’s Democracy. New Delhi: Cambridge University Press, First South
Asian Edition, Reprinted (2008): 193-225.

46
Wilkinson, Steven I. 2003. "Social cleavages and electoral competition in India." India Review
2(4): 31-4246.
Wilkinson, Steven I. 2004. Votes and Violence: Electoral Competition and Ethnic Riots in India.
New York: Cambridge University Press.
Ziblatt, Daniel. 2009. “Shaping Democratic Practice and the Causes of Electoral Fraud: The Case
of Nineteenth-Century Germany.” American Political Science Review 103 (1): 1-21.

47
Table 1: Hypothetical Example of Reservation Procedure Using Members’ Seats
Number of Members’ Seats Reserved for SC Year of presidency reservation
4 1994
4 1994
3 2000 or 2002 (by lottery)
3 2000 or 2002 (by lottery)
3 2000 or 2002 (by lottery)
2 2002, 2005, or 2007 (by lottery)
2 2002, 2005, or 2007 (by lottery)
2 2002, 2005, or 2007 (by lottery)
2 2002, 2005, or 2007 (by lottery)
1 2007
In this hypothetical example, there are ten panchayats, the presidencies of two of which will be reserved for SC candidates in any electoral term. The number of seats reserved for SC members in each panchayat is given in the left column, while the right column reports the year or years in which reservation of that panchayat may occur.
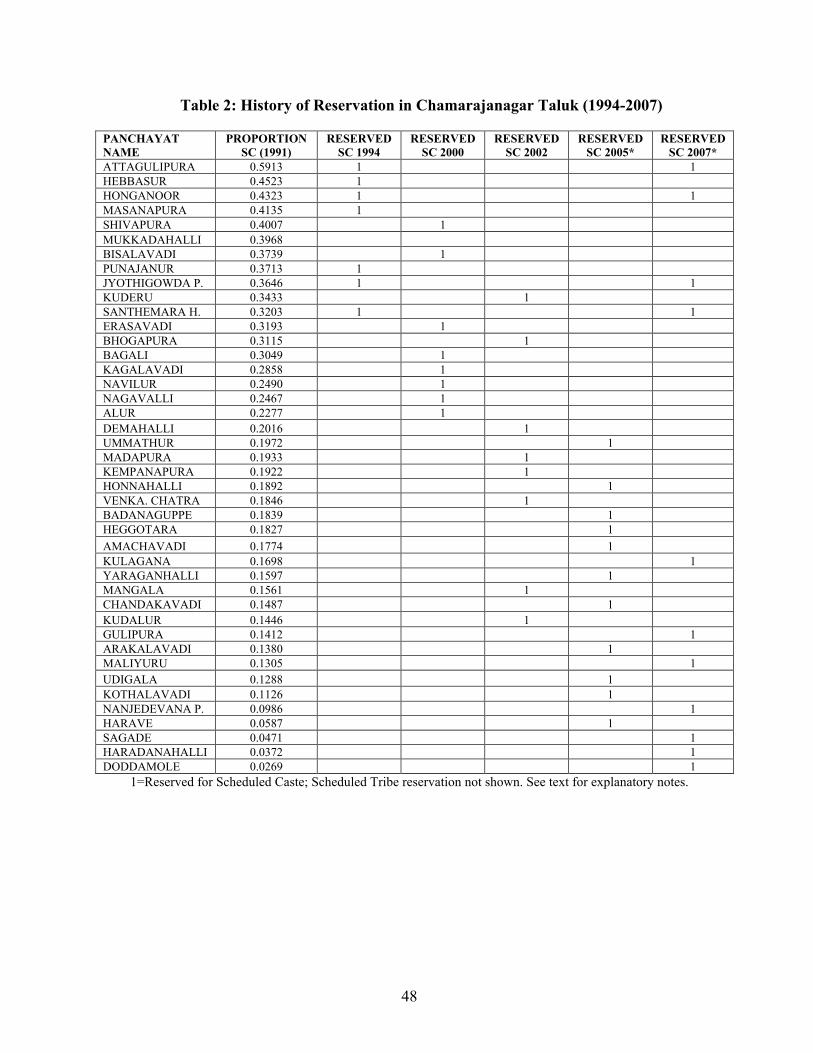
48
Table 2: History of Reservation in Chamarajanagar Taluk (1994-2007)
PANCHAYAT NAME
PROPORTION SC (1991)
RESERVED SC 1994
RESERVED SC 2000
RESERVED SC 2002
RESERVED SC 2005*
RESERVED SC 2007*
ATTAGULIPURA 0.5913 1 1 HEBBASUR 0.4523 1 HONGANOOR 0.4323 1 1 MASANAPURA 0.4135 1 SHIVAPURA 0.4007 1 MUKKADAHALLI 0.3968 BISALAVADI 0.3739 1 PUNAJANUR 0.3713 1 JYOTHIGOWDA P. 0.3646 1 1 KUDERU 0.3433 1 SANTHEMARA H. 0.3203 1 1 ERASAVADI 0.3193 1 BHOGAPURA 0.3115 1 BAGALI 0.3049 1 KAGALAVADI 0.2858 1 NAVILUR 0.2490 1 NAGAVALLI 0.2467 1 ALUR 0.2277 1 DEMAHALLI 0.2016 1 UMMATHUR 0.1972 1 MADAPURA 0.1933 1 KEMPANAPURA 0.1922 1 HONNAHALLI 0.1892 1 VENKA. CHATRA 0.1846 1 BADANAGUPPE 0.1839 1 HEGGOTARA 0.1827 1 AMACHAVADI 0.1774 1 KULAGANA 0.1698 1 YARAGANHALLI 0.1597 1 MANGALA 0.1561 1 CHANDAKAVADI 0.1487 1 KUDALUR 0.1446 1 GULIPURA 0.1412 1 ARAKALAVADI 0.1380 1 MALIYURU 0.1305 1 UDIGALA 0.1288 1 KOTHALAVADI 0.1126 1 NANJEDEVANA P. 0.0986 1 HARAVE 0.0587 1 SAGADE 0.0471 1 HARADANAHALLI 0.0372 1 DODDAMOLE 0.0269 1
1=Reserved for Scheduled Caste; Scheduled Tribe reservation not shown. See text for explanatory notes.

49
Table 3. Reservation in Surveyed Village Councils: As-If Randomization Tests
Group 1:
Reserved for SC or ST
(A)
Group 2: Unreserved or reserved for
OBC (B)
Difference of Means (A) - (B)
p-value (two-sided)
Mean population (Standard error)
5675.62 (205.94)
6055.30 (180.60)
-379.68 (273.74)
0.17
Mean male population (Standard error)
2869.12 (105.75)
3064.41 (92.96)
-195.29 (140.72)
0.17
Mean SC population (Standard error)
1119.21 (91.91)
1114.16 (67.84)
5.05 (114.23)
0.96
Mean ST population (Standard error)
505.52 (56.70)
444.85 (43.86)
60.67 (71.69)
0.40
Mean population aged 0-6 (Standard error)
698.54 (27.52)
755.61 (25.39)
-57.1 (37.43)
0.13
Mean number of literates (Standard error)
3076.63 (111.46)
3315.61 (114.5)
-238.98 (159.79)
0.14
Mean number of workers (Standard error)
2860.12 (103.03)
3017.59 (92.41)
-157.47 (138.40)
0.26
Mean number of marginal workers (Standard error)
644.77 (41.84)
631.59 (43.28)
13.19 (60.22)
0.83
Assignment Covariates: Mean SC proportion 0.18
(0.01) 0.18
(0.01) 0.00
(0.02) 0.97
Mean ST proportion 0.09 (0.01)
0.08 (0.01)
0.01 (0.01)
0.26
N 100 100 200 The unit of analysis is the Gram Panchayat. Data are from the 2001 census. P-values give the probability of observing a t-statistic as large in absolute value as the observed value, if Group 1 and Group 2 have equal means. Other covariates that also passed randomization tests include the number of households, total female population, male population aged 0-6, female population aged 0-6, and illiteracy rates (tests available upon request).
Table 4: Comparing Means in Our Study Group and State-Wide Database
Study Group State of Karnataka Mean population (Standard Deviation)
5869.7 (1912.03)
6132.1 (2287.1)
Mean SC population (Standard Deviation)
1116.7 (805.7)
1129.7 (760.2)
Mean ST population (Standard Deviation)
475.2 (506.5)
512.5 (715.8)
Mean number of literates (Standard Deviation)
3196.1 (1133.4)
3122.7 (1326.7)
Mean number of workers (Standard Deviation)
2938.9 (979.3)
3005.9 (1092.5)
Number of panchayats 200 5760

50
Table 5. Descriptive Statistics: Citizen Surveys All
respondents
(S.D.)
SC/ST respondents
(S.D.)
Received a job or benefit from village council in previous year (percent)
45.0
(49.8)
50.8
(50.0)
Scheduled Castes or Scheduled Tribes have the most influence or power over council of any group (percent)*
32.0
(46.7)
31.9
(46.7)
Scheduled Castes or Scheduled Tribes receive the most priority from the council when allocating funds (percent)*
48.9
(50.0)
47.3
(50.0)
Council effectively serves needs of Scheduled Castes and Scheduled Tribes (1-5, ascending scale)*
2.0
(1.0)
2.0
(1.0)
Attended a Gram Sabha meeting in previous two years 63.7
(48.1)
63.5
(48.2)
Participation in Gram Sabha was effective in helping respondent obtain resolution to a problem
(1-7, ascending scale)
4.4
(1.7)
4.3
(1.7)
Attended a Ward Sabha meeting in previous two years (percent) 43.8
(49.6)
43.0
(24.5)
Participation in Ward Sabha was effective in helping respondent obtain resolution to a problem
(1-7, ascending scale)
4.0
(1.7)
4.0
(1.7)
Attended a Panchayat Jamabandi (social audit) meeting in previous two years (percent)
36.6
(48.2)
34.9
(22.7)
Participation in Panchayat Jamabandi was effective in helping respondent obtain resolution to a problem
(1-7, ascending scale)
3.85
(1.9)
3.8
(1.9)
Knows the name of council president (percent) 84.5
(36.0)
85.3
(35.4)
Knows the caste (jati) of council president (percent) 87.5 87.7

51
(33.1) (32.9)
Knows the political party of council president (percent) 81.7
(38.7)
81.8
(38.6)
Knows the party of the candidate for whom he or she voted in most recent council elections (percent)
87.9
(32.6)
89.0
(31.2)
Knows the party of the candidate whom he or she preferred in most recent council elections (percent)
80.0
(40.1)
80.3
(39.8)
The respondent identified the council president’s caste (jati) as an SC or ST jati (percent)
46.2
(49.9)
46.6
(49.9)
The respondent perceives the council president’s caste category as SC or ST (percent)
42.5
(24.5)
42.9
(49.5)
In general, council presidents favor their own castes or tribes in allocating jobs and benefits (percent)
29.9
(45.8)
30.0
(45.9)
The table reports mean responses, across reserved and unreserved villages. Standard deviations are in parentheses. N= 1,966 citizens in 200 Gram Panchayats. Questions marked with an asterisk were only asked in the survey’s second phase (N=1,567). In the questions about knowledge of the name, party, and caste of the council president and the party of the candidate for whom the respondent voted, answers of “didn’t know” and “didn’t reply” are coded as zero. Otherwise, answers of “didn’t know” and “didn’t reply” are treated as missing.

52
Table 6. Descriptive Statistics:
Surveys of Council Members, Presidents, and Secretaries
Members Presidents Secretaries
Scheduled Castes or Scheduled Tribes have the most power or influence over council (percent)
11.4
(31.8)
15.4
(36.2)
16.8
(37.5)
Scheduled Castes or Scheduled Tribes receive the council’s priority in allocating funds (percent)
20.7
(40.6)
18.7
(39.1)
21.5
(41.2)
Council effectively serves needs of Scheduled Castes and Scheduled Tribes
(1-5, ascending scale)
4.4
(0.8)
4.3
(0.8)
--
Voters in this Gram Panchayat favor politicians from their caste (percent saying yes)
36.2
(48.2)
37.8
(48.7)
32.4
(46.9)
Do members of the council favor their own caste in allocating jobs and benefits? (percent saying yes)
44.2
(49.7)
46.0
(50.0)
--
Number of council meetings held in previous six months 4.2
(1.8)
4.1
(1.8)
4.1
(1.9)
Full days worked per week by council president on council matters
3.9
(1.6)
4.2
(1.7)
4.4
(1.7)
Council’s perceived effectiveness in undertaking desired works
(1-5, ascending scale)
4.3
(0.9)
4.3
(0.9)
4.4
(0.9)
Priority of respondent is the council’s actual priority (percent)
85.4
(35.4)
91.4
(28.1)
91.8
(27.6)
Council members work well together (1-5, ascending scale)
4.4
(0.7)
4.6
(0.6)
4.4
(0.9)
Council members most often disagree about the identity of beneficiaries, rather than other topics (percent)
36.8
(48.3)
33.6
(47.4)
29.1
(45.6)
In case of disagreement among council members, the president decides (percent saying yes)
23.2
(42.4)
23.2
(42.4)
23.9
(42.8)
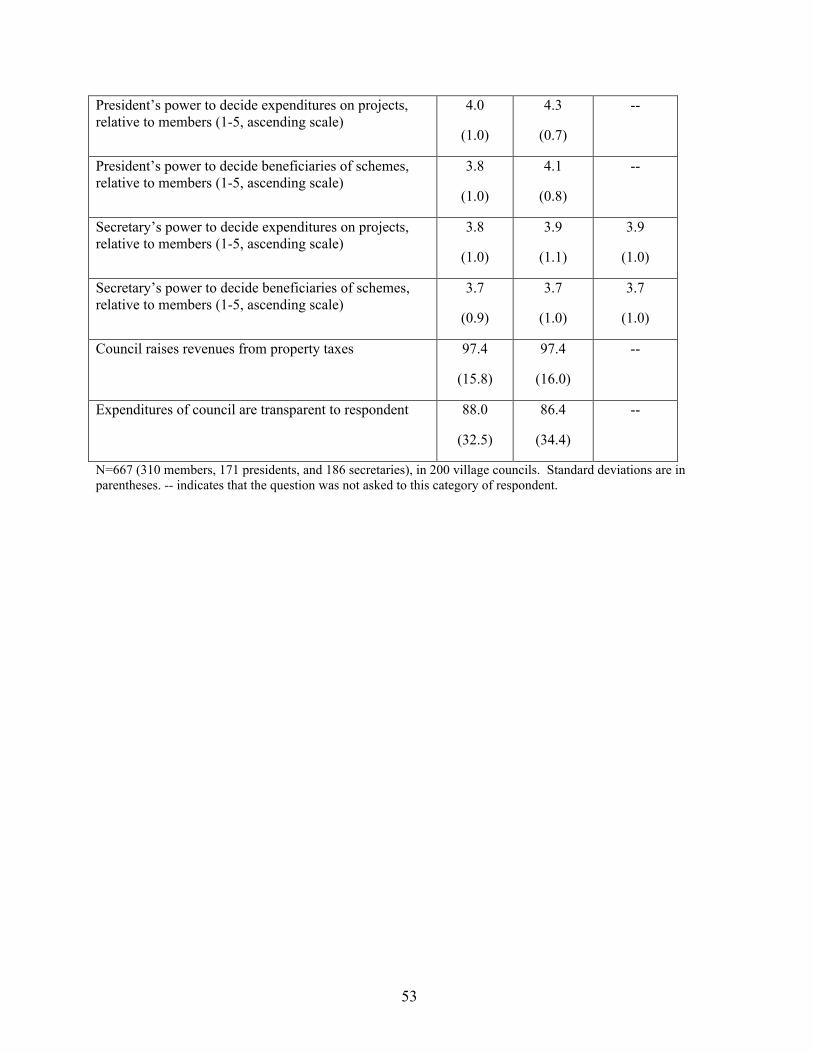
53
President’s power to decide expenditures on projects, relative to members (1-5, ascending scale)
4.0
(1.0)
4.3
(0.7)
--
President’s power to decide beneficiaries of schemes, relative to members (1-5, ascending scale)
3.8
(1.0)
4.1
(0.8)
--
Secretary’s power to decide expenditures on projects, relative to members (1-5, ascending scale)
3.8
(1.0)
3.9
(1.1)
3.9
(1.0)
Secretary’s power to decide beneficiaries of schemes, relative to members (1-5, ascending scale)
3.7
(0.9)
3.7
(1.0)
3.7
(1.0)
Council raises revenues from property taxes 97.4
(15.8)
97.4
(16.0)
--
Expenditures of council are transparent to respondent 88.0
(32.5)
86.4
(34.4)
--
N=667 (310 members, 171 presidents, and 186 secretaries), in 200 village councils. Standard deviations are in parentheses. -- indicates that the question was not asked to this category of respondent.

54
Table 7. The Effects of Reservation: Citizens’ Survey
(Differences of Means or Percentages, Reserved Minus Unreserved Councils)
SC respondents (reservation
for SC)
ST respondents
(reservation for ST)
SC and ST respondents
(reservation for SC or ST)
Received job or benefit in past year
(difference of percentages)
-1.9
(3.9)
11.3
(10.5)
-0.5
(0.3)
SC (ST) Castes are Most Influential (difference of percentages saying yes)
1.9
(4.6)
3.3
(11.4)
2.0
(3.9)
Council’s Priority is SC (ST) groups (difference of percentages saying yes)
8.6*
(4.4)
8.5
(12.2)
12.9***
(3.8)
Council serves SC (ST) groups effectively
(difference of percentages saying yes)
-11.1
(8.4)
51.4**
(22.1)
0.0
(7.3)
Knows council president’s name
(difference of percentages)
-3.6
(2.4)
-12.3
(6.7)
-5.2**
(2.1)
Perceives president as from SC (ST) caste
(difference of percentages)
44.0***
(4.2)
7.4
(11.8)
50.9***
(3.5)
Participated in Gram Sabha meeting
(difference of percentages)
-6.0
(3.7)
-14.1
(10.0)
-4.3
(3.1)
Effectiveness of GS participation
(difference of means on 1-7 scale)
9.1
(15.5)
4.6
(42.6)
0.86
(13.0)
Participated in Ward Sabha meeting
(difference in percentages)
-4.9
(3.8)
3.3
(10.5)
-2.4
(3.3)
Effectiveness of WS participation
(difference of means on 1-7 scale)
19.3
(18.5)
13.5
(47.9)
18.4
(15.4)
Participated in Panchayat Jamabandi (social audit) (difference of percentages)
1.6
(3.7)
-6.3
(10.2)
0.2
(3.2)
Effectiveness of PJ participation 11.8 -33.7 8.7

55
(difference of means on 1-7 scale) (21.3) (66.3) (18.3)
The table reports the estimated causal effects of reservation, using survey data from citizens in 200 Gram Panchayats. Differences of means or percentages (reserved councils minus unreserved councils) are reported. The first two columns report estimates for Scheduled Caste and Scheduled Tribe respondents only, comparing panchayats with presidencies reserved for each category with other panchayats. The final column gives all respondents, and reserved panchayats are those reserved for either Scheduled Caste or Scheduled tribe. N=968 for both Scheduled Caste and Scheduled Tribe respondents (N=774 for Scheduled Caste and N=194 for Scheduled Tribe). Standard errors for the differences in percentages are in parentheses. * p<0.05, ** p<0.01, *** p<0.001

56
Table 8. The Effects of Reservation: Council Members, Presidents, and Secretaries
(Differences of Means or Percentages, Reserved Minus Unreserved Councils)
Members Presidents Members and Presidents
Executive Secretaries
Number of council meetings held in previous six months
0.0667 (0.32)
0.0218 (0.08)
-0.0387 (-0.25)
0.152
(0.54)
Full days per week worked by president
0.115 (0.64)
-0.224 (-0.83)
0.00765
(0.05)
-0.538* (-2.17)
Council’s effectiveness in undertaking desired works
-0.206* (-1.97)
-0.121 (-0.86)
-0.128 (-1.53)
0.0323
(0.25)
Priority of respondent is council’s actual priority (difference of percentages)
1.11
(0.26)
-3.26 (-0.75)
-1.01
(-0.33)
5.56
(1.35)
Council works well together -0.0886 (-1.13)
0.0635 (0.62)
0.0281
(0.43)
0.0538
(0.40)
Council members most often disagree about the identity of beneficiaries (difference of percentages)
2.54
(0.41)
1.13 (0.13)
3.08
(0.66)
3.23
(0.44)
President decides in case of disagreement (difference of percentages)
7.28
(1.47)
-1.18 (-1.75)
2.13
(0.56)
-9.20
(-1.42)
President has the power to decide expenditures
-0.21
(-1.78)
-0.10
(-0.81)
-0.118
(-1.40)
--
President has the power to decide beneficiaries of schemes
0.14
(1.22)
-0.20
(-1.54)
0.073
(0.87)
--
Secretary has the power to decide expenditures
0.0300 (0.22)
0.0815 (0.41)
0.0570
(0.53)
-0.312* (-2.03)
Secretary has the power to decide beneficiaries
-0.130 (-1.03)
-0.134 (-0.77)
-0.115 (-1.21)
0.0860
(0.57)

57
Voters favor politicians from their caste (difference of percentages)
-4.28 (-0.72)
-4.64 (-0.06)
-3.51
(-0.76)
0.851
(0.12)
Scheduled Castes or Scheduled Tribes have the most power or influence (difference of percentages)
-5.25 (-1.36)
1.80 (0.30)
-1.23
(-0.40)
6.57
(1.06)
Scheduled Castes or Scheduled Tribes receive the council’s priority in allocating funds (difference of percentages)
-8.32
(-1.68)
-3.88
(-0.61)
-5.63
(-1.52)
-2.65
(-0.39)
Council effectively serves needs of Scheduled Castes and Scheduled Tribes (difference of percentages)
8.15
(0.90)
0.25* (1.96)
0.17*
(2.22)
--
Secretary gave copy of annual report (difference of percentages)
-- -- -- 2.90
(0.89)
N = 310 members, 171 presidents, 530 members/presidents, and 186 secretaries in 200 village councils. The number of members/presidents (530) is greater than the sum of members (310) and presidents (171) because the office (member or president) of 49 respondents on village councils was not recorded. The N reduces as low as 114 (for presidents) and 147 (for secretaries) due to missing data on some questions. * p<0.05, ** p<0.01, *** p<0.001. t statistics are in parentheses.
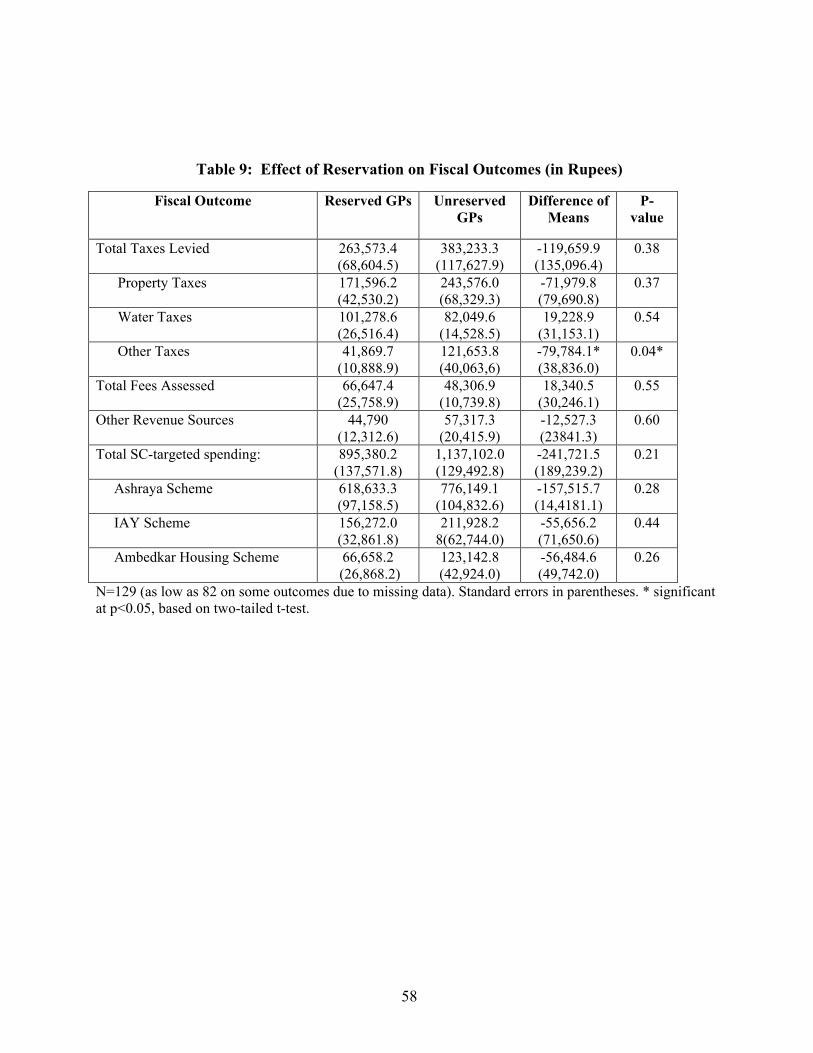
58
Table 9: Effect of Reservation on Fiscal Outcomes (in Rupees)
Fiscal Outcome Reserved GPs Unreserved GPs
Difference of Means
P-value
Total Taxes Levied 263,573.4 (68,604.5)
383,233.3 (117,627.9)
-119,659.9 (135,096.4)
0.38
Property Taxes 171,596.2 (42,530.2)
243,576.0 (68,329.3)
-71,979.8 (79,690.8)
0.37
Water Taxes 101,278.6 (26,516.4)
82,049.6 (14,528.5)
19,228.9 (31,153.1)
0.54
Other Taxes 41,869.7 (10,888.9)
121,653.8 (40,063,6)
-79,784.1* (38,836.0)
0.04*
Total Fees Assessed 66,647.4 (25,758.9)
48,306.9 (10,739.8)
18,340.5 (30,246.1)
0.55
Other Revenue Sources 44,790 (12,312.6)
57,317.3 (20,415.9)
-12,527.3 (23841.3)
0.60
Total SC-targeted spending: 895,380.2 (137,571.8)
1,137,102.0 (129,492.8)
-241,721.5 (189,239.2)
0.21
Ashraya Scheme 618,633.3 (97,158.5)
776,149.1 (104,832.6)
-157,515.7 (14,4181.1)
0.28
IAY Scheme 156,272.0 (32,861.8)
211,928.2 8(62,744.0)
-55,656.2 (71,650.6)
0.44
Ambedkar Housing Scheme 66,658.2 (26,868.2)
123,142.8 (42,924.0)
-56,484.6 (49,742.0)
0.26
N=129 (as low as 82 on some outcomes due to missing data). Standard errors in parentheses. * significant at p<0.05, based on two-tailed t-test.

59
Table 10: The Effect of Reservation on Fiscal Outcomes (State-Wide)
Rural Development and Panchayati Raj:
Reserved Unreserved Difference of Means
P-value (two-sided)
Number of Gram Panchayat Meetings Held+
4.39 (0.06)
4.28 (0.06)
0.11 (0.09)
0.24
Number of Gram Sabha Meetings Held+
1.80 (0.08)
1.75 (0.07)
0.05 (0.11)
0.66
Total Expenditure on Drinking Water Infrastructure (in Rupees)+
76,903.18 (3,057.68)
81,278.22 (3,005.40)
-4,375.0 (4287.2)
0.31
Individual Latrines Built+ 65.51 (5.82) 66.27 (5.94) -0.77 (8.315)
0.93
Community Latrines Built+ 1.11 (0.21)
1.16 (0.18)
-0.05 (0.28)
0.87
Gram Swaraj Project: Total taxes collected† 227,194.0
(18,799.28) 253,589.9 (26,298.2)
-26,395.9 (32,341.4)
0.42
Property taxes collected† 143,320.4 (16,360.4)
172,157.6 (23,257.9)
-28,837.2 (28,449.3)
0.31
Fees collected (excluding licenses) † 16,883.0 (2,9867.0)
13,535.4 (1,932.178)
3,347.1 (3,556.4)
0.35
Expenditure on Ashraya Scheme† 168,742.5 (8,157.4)
175,703.2 (8,278.368)
-6,960.7 (11,622.8)
0.55
Expenditure on IAY scheme† 171,198.5 (8987.8)
182,993.4 (9,421.8)
-11,794.9 (13,022.5)
0.37
Expenditure on Ambedkar Housing Scheme†
5,946.8 (5,507.0)
3,039.6 (2,873.7)
2,907.1 (6,219.9)
0.64
Reserved=Reserved for SC or ST; Unreserved=General Category or reserved for BC. + data from April to September 2006. † data from April 2006 to March 2007. N for Gram Swaraj Schemes=1420 (437 for Ambedkar Scheme); N for RDPR=1388 (as low as 1366 due to missing data). Standard errors in parentheses. * p<0.05, ** p<0.01, *** p<0.001

60
Table 11. The Effects of Reservation in Panchayats with Lower-Caste Pluralities
(Upper Quartile of SC/ST Population Proportion)
SC respondents
(SC reservation)
ST respondents
(ST reservation)
All respondents
(SC or ST reservation)
CITIZENS’ MODULE:
Received job or benefit
0.0200
(0.24)
0.0183
(0.09)
0.0588
(1.67)
SC (ST) Castes are Most Influential
-0.0825
(-0.81)
-0.0286
(-0.13)
-0.0204
(-0.47)
Council’s Priority is SC (ST) groups
0.0889
(0.82)
0.635
(1.40)
0.0800
(1.89)
Council serves SC (ST) effectively
0.279
(1.51)
0.259
(1.27)
-0.0700
(-0.91)
Knows president’s name
0.0550
(0.99)
-0.199
(-1.86)
-0.00671
(-0.29)
President perceived as SC (ST)
0.420***
(4.15)
0.309
(1.58)
0.638***
(19.62)
MEMBERS/PRESIDENTS’ MODULE:
SC (ST) Castes are Most Influential
-0.123
(0.74)
0.0909
(0.79)
-0.0672
(-1.13)
Council’s Priority is SC (ST) groups
-0.222
(-1.50)
-0.0758
(-0.44)
-0.175**
(-2.90)
Council serves SC (ST) effectively
0.213
(0.84)
-0.345
(-0.92)
0.142
(1.10)
The table reports the estimated effects of reservation, restricting the estimation sample to Gram Panchayats that are in the upper quartiles of the Scheduled Caste and Scheduled Tribe population proportions, respectively. The upper

61
quartiles run from 21.6 to 49.4 percent, for Scheduled Castes, and from 11.5 to 51.7 percent, for Scheduled Tribes. The first two columns report estimates for Scheduled Caste and Scheduled Tribe respondents only. For the citizens’ module, with only SC respondents, N = 210; with only ST respondents, N=___ INSERT. For the members/presidents module, with only SC respondents, N=30, N=31, or N=36 on the third question; for only ST respondents, N=17 or N=19; for all respondents, N=182 or N=199. t statistics in parentheses. * p<0.05, ** p<0.01, *** p<0.001.