
DUKE ENERGY PROGRESS
146
LOGO DUKE ENERGY PROGRESS INTEGRATED RESOURCE PLAN UPDATE REPORT 2019 PUBLIC
Transcript of DUKE ENERGY PROGRESS

LOGO
DUKE ENERGY PROGRESS
INTEGRATED RESOURCE PLAN
UPDATE REPORT
2019
PUBLIC

DEP 2019 IRP CONTENTS:
ABBREVIATIONS ................................................................................................................................................... 3
1. INTRODUCTION .......................................................................................................................................... 7
2. 2019 IRP SUMMARY .................................................................................................................................... 8
3. IRP PROCESS OVERVIEW .......................................................................................................................11
4. SIGNIFICANT CHANGES SINCE 2018 IRP ............................................................................................14
5. LOAD FORECAST .......................................................................................................................................26
6. RENEWABLE ENERGY AND ENERGY STORAGE .............................................................................40
7. INTEGRATED SYSTEM & OPERATIONS PLANNING (ISOP) .........................................................52
8. WESTERN CAROLINAS MODERNIZATION PROJECT (WCMP) ...................................................55
9. DEVELOPMENT OF THE RESOURCE PLAN .......................................................................................58
10. DEP FIRST RESOURCE NEED .................................................................................................................75
11. SHORT-TERM ACTION PLAN .................................................................................................................77
12. CONCLUSIONS ............................................................................................................................................83
13. DUKE ENERGY PROGRESS OWNED GENERATION ........................................................................85
14. WHOLESALE ...............................................................................................................................................93
15. FUEL COMMODITY PRICES ..................................................................................................................96
16. CROSS-REFERENCE TABLES ................................................................................................................97
ATTACHMENT I: NC REPS COMPLIANCE PLAN .......................................................................................99
ATTACHMENT II: COMPETITIVE PROCUREMENT OF RENEWABLE ENERGY ..............................132

ABBREVIATIONS: AC Alternating Current
ACE Affordable Clean Energy
ADP Advanced Distribution Planning
AEO Annual Energy Outlook
BCFD Billion Cubic Feet Per Day
CAIR Clean Air Interstate Rule
CAMA North Carolina Coal Ash Management Act of 2014
CAMR Clean Air Mercury Rule
CAPP Central Appalachian Coal
CC Combined Cycle
CCR Coal Combustion Residuals Rule
CCS Carbon Capture and Sequestration
CECPCN Certificate of Environmental Compatibility and Public Convenience and Necessity (SC)
CEP Comprehensive Energy Planning
CFL Compact Fluorescent Light bulbs
CO2 Carbon Dioxide
COD Commercial Operation Date
COL Combined Construction and Operating License
COWICS Carolinas Offshore Wind Integration Case Study
CPCN Certificate of Public Convenience and Necessity (NC)
CPRE Competitive Procurement of Renewable Energy
CSAPR Cross State Air Pollution Rule
CT Combustion Turbine
DC Direct Current
DCA Design Certification Application
DEC Duke Energy Carolinas
DEF Duke Energy Florida
DEI Duke Energy Indiana
DEK Duke Energy Kentucky
DEP Duke Energy Progress
DER Distributed Energy Resource
DESC Dominion Energy South Carolina, Inc.
DIY Do It Yourself
DOE Department of Energy
DOJ Department of Justice
DSM Demand-Side Management
EE Energy Efficiency
EIA Energy Information Administration
EPA Environmental Protection Agency
EPC Engineering, Procurement, and Construction Contractors
EPRI Electric Power Research Institute
EVs Electric Vehicles
FERC Federal Energy Regulatory Commission

ABBREVIATIONS: FGD Flue Gas Desulfurization
FLG Federal Loan Guarantee
FPS Feet Per Second
GALL-SLR Generic Aging Lessons Learned for Subsequent License Renewal
GHG Greenhouse Gas
GWh Gigawatt-hour
HRSG Heat Recovery Steam Generator
HVAC Heating, Ventilation and Air Conditioning
IA Interconnection Agreement
IGCC Integrated Gasification Combined Cycle
ILB Illinois Basin
ILR Inverter Load Ratios
IRP Integrated Resource Plan
IS Interruptible Service
ISOP Integrated Systems and Operations Planning
IT Information Technologies
ITC Federal Investment Tax Credit
IVVC Integrated Volt-Var Control
JDA Joint Dispatch Agreement
kW Kilowatt
kWh Kilowatt-hour
LCR Table Load, Capacity, and Reserves Table
LED Light Emitting Diodes
LEED Leadership in Energy and Environmental Design
LEO Legally Enforceable Obligation
LFE Load Forecast Error
LNG Liquified Natural Gas
LOLE Loss of Load Expectation
M&V Measurement and Verification
MACT Maximum Achievable Control Technology
MATS Mercury and Air Toxics Standard
MGD Million Gallons Per Day
MW Megawatt
MWh Megawatt-hour
NAAQS National Ambient Air Quality Standards
NAP Northern Appalachian Coal
NAPP Northern Appalachian Coal
NC North Carolina
NC HB 589 North Carolina House Bill 589
NC REPS North Carolina Renewable Energy and Energy Efficiency Portfolio Standard
NCCSA North Carolina Clean Smokestacks Act
NCDAQ North Carolina Division of Air Quality
NCEMC North Carolina Electric Membership Corporation

ABBREVIATIONS: NCMPA1 North Carolina Municipal Power Agency #1
NCTPC NC Transmission Planning Collaborative
NCUC North Carolina Utilities Commission
NEMS National Energy Modeling Systems
NERC North American Electric Reliability Corporation
NES Neighborhood Energy Saver
NESHAP National Emission Standards for Hazardous Air Pollutants
NOx Nitrogen Oxide
NPDES National Pollutant Discharge Elimination System
NRC Nuclear Regulatory Commission
NSPS New Source Performance Standard
NUG Non-Utility Generator
NUREG Nuclear Regulatory Commission Regulation
NYMEX New York Mercantile Exchange
O&M Operating and Maintenance
OATT Open Access Transmission Tariff
PD Power Delivery
PEV Plug-In Electric Vehicles
PJM PMJ Interconnection, LLC
PMPA Piedmont Municipal Power Agency
PPA Purchase Power Agreement
PPB Parts Per Billion
PROSYM Production Cost Model
PSCSC Public Service Commission of South Carolina
PSD Prevention of Significant Deterioration
PURPA Public Utility Regulatory Policies Act
PV Photovoltaic
PVDG Solar Photovoltaic Distributed Generation Program
PVRR Present Value Revenue Requirement
QF Qualifying Facility
RCRA Resource Conservation Recovery Act
REC Renewable Energy Certificate
REPS Renewable Energy and Energy Efficiency Portfolio Standard
RFP Request for Proposal
RICE Reciprocating Internal Combustion Engines
RIM Rate Impact Measure
RPS Renewable Portfolio Standard
RRP Refrigerator Replacement Program
SAE Statistical Adjusted End-Use Model
SAT Single-Axis Tracking
SC South Carolina
SC Act 62 South Carolina Energy Freedom Act of 2018

ABBREVIATIONS: SC DER or SC
ACT 236 South Carolina Distributed Energy Resource Program
SCR Selective Catalytic Reduction
SEPA Southeastern Power Administration
SERC Southeastern Electric Reliability Corporation
SERVM Strategic Energy Risk Valuation Model
SG Standby Generation
SIP State Implementation Plan
SISC Solar Integration Services Charge
SLR Subsequent License Renewal
SMR Small Modular Reactor
SO System Optimizer
SO2 Sulfur Dioxide
SRP – SLR Standard Review Plan for the Review of Subsequent License Renewal
STAP Short-Term Action Plan
T&D Transmission & Distribution
TAG Technology Assessment Guide
The Company Duke Energy Progress
The Plan Duke Energy Progress Annual Plan
TRC Total Resource Cost
TVA Tennessee Valley Authority
UCT Utility Cost Test
UEE Utility Energy Efficiency
VACAR Virginia/Carolinas
VAR Volt Ampere Reactive
WERP Weatherization and Equipment Replacement Program
ZELFRS Zero – Emitting Load Following Resources

1. INTRODUCTION
For more than a century, North and South Carolinians have received affordable and reliable
electricity from Duke Energy Progress (DEP) who now serves more than 1.5 million customers.
Working with businesses and communities, Duke Energy helped shape the Carolinas of today,
building important infrastructure like our power plants, transmission grid and other facilities that
power our homes and businesses. Duke Energy is committed to securing a sustainable energy
future for its growing number of customers by planning for resource needs in the most reliable and
economic way possible while using increasingly clean forms of energy. DEP works across the
Carolinas to support a cleaner environment and mitigate climate change by being an industry
leader in carbon-free nuclear, hydro-electric and solar generation. DEP is also a driving force of
innovation in a region well-known for research and scientific exploration, helping to engineer new
technologies that move the Carolinas forward. Through its Joint Dispatch Agreement (JDA) with
Duke Energy Carolinas (DEC), the two companies collectively provide approximately 55% of all
energy delivered on the combined Carolinas system with carbon-free resources.
Each year, as required by the North Carolina Utilities Commission (NCUC) and the Public Service
Commission of South Carolina (PSCSC), DEP submits a long-range planning document called the
Integrated Resource Plan (IRP). The IRP details projections of infrastructure needed to match the
forecasted electricity needs of our customers plus an adequate reserve margin to maintain a reliable
electric system for customers over the next 15 years.
The Company files a comprehensive Biennial IRP in even numbered years. This document is an
update to the comprehensive DEP 2018 IRP.
In recent years, the Company has filed separate IRP updates to the comprehensive plan for NC and
SC, which has created some confusion. The IRP is truly a single plan, for a single system that
happens to span both NC and SC. As a result, the Company is filing one IRP update for both
states to ensure each Commission and all stakeholders have a clear and comprehensive view
of the Company’s integrated resource plan. The IRP update analyzes the DEP system in total
across both states including customer demand, energy efficiency (EE), demand side
management (DSM), renewable resources and traditional supply-side resources.

2. 2019 IRP SUMMARY
Each year, as required by the NCUC and the PSCSC, DEP submits an IRP detailing projected
infrastructure needed to meet the forecasted electricity requirements for its customers over the next
15 years. The 2019 IRP is the best projection of how the Company’s capacity and energy portfolio
is expected to evolve over the next 15 years, based on current data assumptions. This projection
may change over time as variables such as the projected load forecasts, fuel price forecasts,
environmental regulations, technology cost and performance characteristics and other outside
factors change.
The proposed plan will meet the following objectives:
• Provide reliable electricity throughout the year, especially during periods of high peak demand such as cold winter mornings, by maintaining adequate planning reserve margins. Peak demand refers to the highest amount of electricity being consumed for any given hour across DEP’s entire system.
• Select new resources at the lowest reasonable cost to customers. These resources include a balance of EE, DSM, renewable resources, battery storage and natural gas generation.
• Improve the environmental footprint of the portfolio by meeting or exceeding all federal,
state and local environmental regulations. Furthermore, Duke Energy Corporation is
committed to reducing its carbon emissions. Over the next decade, we are on track in
the Carolinas to reduce carbon emissions by over 50 percent relative to a 2005 baseline
level. Beyond 2030 even further reductions are attainable with continued technology
development in the areas of carbon free generation and energy storage.
As 2019 is an update year, DEP developed two cases which reflect updates to the 2018 IRP
Base Case. The first case, or the “Base Case,” is an update to the presented base case in the
2018 IRP, which includes the expectation of future carbon legislation. Additionally, a “No
Carbon Case” was developed in which no carbon legislation is considered. All results presented in
this IRP represent the Base Case, unless otherwise noted. DEP has updated several key
planning assumptions such as technology cost assumptions, fuel prices, renewable generation
projections and the DEP load forecast.
As shown in the 2019 IRP Base Case, projected incremental needs are driven by load growth,
contract expirations and the retirement of aging coal-fired and natural gas/oil resources. Of note,
DEP has an increased load forecast relative to the prior IRP filing. A more detailed discussion of
the load forecast can be found in Chapter 5. This increased forecast, coupled with contract

expirations and retirement of aging natural gas/oil resources at DEP have left a short-term need
for capacity in the mid-2020 timeframe. As mentioned in the Short-Term Action Plan, the
Company has worked diligently to procure both renewable and traditional generation to meet this
energy and capacity need in the near term. Those developments have been reflected in this year’s
IRP update.
The 2019 IRP seeks to achieve a reliable, economic long-term power supply through a balance of
incremental renewable resources, EE, DSM, energy storage and traditional supply-side resources
planned over the coming years which allows the Company to maintain a diversified resource mix
while also providing increasingly clean energy. Chart 2-A represents the incremental investments
required to meet future needs.

Chart 2-A 2020 and 2034 Base Case Winter Capacity Mix and Sources of Incremental
Capacity

3. IRP PROCESS OVERVIEW
To meet the future needs of DEP’s customers, it is necessary for the Company to adequately
understand the load and resource balance. For each year of the planning horizon, the Company
develops a load forecast of cumulative energy sales and hourly peak demands. To determine total
resources needed, the Company considers the peak demand load obligation plus a 17% minimum
planning reserve margin.
The projected capability of existing resources, including generating units, EE and DSM, renewable
resources and purchase power contracts, is measured against the total resource need. Any deficit in
future years will be met with a mix of additional resources that reliably and cost-effectively meet the
load obligation and planning reserve margin while complying with all environmental and regulatory
requirements.
Growth in Peak
Demand and Energy
Consumption
+ Resource Retirements
Contract Expirations = New Resource Needs
It should be noted that DEP considers the non-firm energy purchases and sales associated with the
JDA with DEC in the development of its independent Base Case. To accomplish this, DEP and DEC
plans are determined simultaneously to minimize revenue requirements of the combined jointly-
dispatched system while maintaining independent reserve margins for each company.
DEP’s IRP includes new resource additions driven by winter peak demand projections inclusive of
winter reserve requirements. The completion of a comprehensive reliability study in 2016
demonstrated the need to include winter peak planning in the IRP process. The study recognized the
growing volatility associated with winter morning peak demand conditions such as those observed
during recent polar vortex events. The study also incorporated the expected significant growth in solar
facilities that provide valuable assistance in meeting summer afternoon peak demands on the system
but do little to assist in meeting demand for power on cold winter mornings. Based on results of the
reliability study, DEP is utilizing a winter planning reserve margin of 17% in its planning process.
For the 2019 Update IRP, the Company presents a Base Case with a carbon tax beginning in 2025.
However, remaining consistent with the Commission’s Order to both include and exclude costs
associated with carbon regulation, the current assumption of a carbon tax is intended to serve as a

placeholder for some form of potential future carbon regulation. 1 An additional case assuming no
carbon legislation was also developed.
While future carbon legislation is unknown, the Company feels that it is prudent to continue to plan
for this scenario, as well as other potential future scenarios. Furthermore, a primary focus of this
update IRP is the Short-Term Action Plan (STAP), which covers the period 2020 to 2024. It was
determined that the inclusion of the carbon tax did not have a significant impact on the STAP, and
therefore the majority of the data presented in this report represents the Base Case.
Figure 3-A represents a simplified overview of the resource planning process in the update years (odd
years) of the IRP cycle.
1 “Order Accepting Integrated Resource Plans and Accepting REPS Compliance Plans”; NCUC Docket No. E-100,
Sub 147; p. 35

Figure 3-A Simplified IRP Process
Page 13

4. SIGNIFICANT CHANGES FROM THE 2018 IRP
As an initial step in the IRP process, all production cost modeling data is updated to include the most
current data. Throughout the year, best practices are implemented to ensure the IRP best represents
the Company’s planning assumptions including load forecast, generation system, conservation
programs, renewable energy and fuel costs. The data and methodologies are regularly updated and
reviewed to determine if adjustments can be made to further improve the IRP process and results.
As part of the review process, certain data elements, with varying impacts on the IRP, inevitably
change. A discussion of new or updated data elements that have the most substantial impact on the
2019 IRP is provided below.
a) Load Forecast
The Duke Energy Progress Spring 2019 forecast provides projections of the energy and peak demand
needs for its service area. The forecast covers the time period of 2020 – 2034 and represents the needs
of the following customer classes:
• Residential
• Commercial
• Industrial
• Other Retail
• Wholesale
The Retail forecast consists of the three major classes: Residential, Commercial and Industrial.
The Residential class sales forecast is comprised of two projections. The first is the number of
residential customers, which is driven by population. The second is energy usage per customer, which
is driven by weather, regional economic and demographic trends, electricity prices and appliance
efficiencies.
The average annual growth rate of Residential energy sales in the Spring 2019 forecast, including the
impacts of Utility Energy Efficiency programs (UEE), rooftop solar and electric vehicles from 2020
– 2034 is 1.3%.
The three largest sectors in the Commercial class are offices, education and retail. Commercial energy
sales are expected to grow 0.8% per year over the forecast horizon.

The Industrial class is forecasted by a standard econometric model, with drivers such as total
manufacturing output, textile output, and the price of electricity. Overall, Industrial sales are expected
to grow 0.5% per year over the forecast horizon.
The Company continues to look at ways to improve the load forecasting methodology in order to
develop the most accurate and reasonable demand forecasts for DEP. The load forecast has increased
in the 2019 Update as compared to the 2018 IRP, primarily driven by adding 2018 peaks to the history
used in the forecast. The key economic drivers and forecast changes are shown below in Tables 4-A
and 4-B. A more detailed discussion of the load forecast can be found in Chapter 5.
Table 4-A Key Drivers
2020-2034
Real Income 2.7%
Manufacturing Industrial Production Index (IPI) 1.1%
Population 1.6%
Table 4-B reflects a comparison between the 2018 and 2019 growth rates of the load forecast with
and without impacts of EE.
Table 4-B 2019 Load Forecast Growth Rates vs. 2018 Load Forecast Growth Rates
(Inclusive of Retail and Wholesale Load)
2019 Forecast
(2020 – 2034)
2018 Forecast
(2019 – 2033)
Summer
Peak
Demand
Winter
Peak
Demand
Energy
Summer
Peak
Demand
Winter
Peak
Demand
Energy
Excludes impact of
new EE programs 1.2% 1.1% 1.2% 1.0% 0.8% 0.7%
Includes impact of
new EE programs 1.0% 0.9% 1.0% 0.8% 0.7% 0.5%

Peak Demand and Energy Forecast
The load forecast projection for energy and capacity, including the impacts of UEE, rooftop solar,
and electric vehicles, that was utilized in the 2019 IRP is shown in Table 4-C.
Table 4-C Load Forecast Net of Energy Efficiency Programs
YEAR SUMMER
(MW)
WINTER
(MW)
ENERGY
(GWH)
2020 13,133 14,473 63,964
2021 13,182 14,434 64,040
2022 13,274 14,557 64,465
2023 13,404 14,649 65,043
2024 13,529 14,843 65,724
2025 13,663 14,965 66,330
2026 13,867 15,106 66,990
2027 13,995 15,326 67,718
2028 14,198 15,502 68,586
2029 14,359 15,690 69,295
2030 14,551 15,883 70,163
2031 14,735 16,073 71,241
2032 14,937 16,276 72,552
2033 15,136 16,461 73,374
2034 15,360 16,654 74,306
Avg.
Annual
Growth
Rate 1.0% 0.9% 1.0%
Note: This table differs from Tables 9-A and 9-B due to a 150 MW firm sale in years 2020 – 2024.

b) Contract Expirations and Short-Term Need
The 2018 IRP reflected the impact of approximately 1,500 megawatts (MW) of purchase power
contract expirations by 2025. The expiration of these contracts, along with the increase in the winter
peak demand forecast and the planned retirement of nearly 500 MW of aging CT units at the
Darlington CT Complex, created a significant short-term resource need. The Company has worked
diligently to address this short-term need by issuing a Request for Proposals (RFP) resource
solicitation in 2018. DEP received a significant response to the solicitation, and as a result, DEP is
currently in the process of negotiating contracts with short-listed bidders to fulfill its near-term needs.
As discussed in Section 10, contracts that have been executed as part of this solicitation as of August
1, 2019 are included as firm designated resources in this year’s IRP while others are still under
negotiation. Contracts that have yet to be executed are not included as designated resources in the
IRP and, as such, the IRP continues to reflect a resource need as early as the winter of 2020. The
Company fully expects to fill this resource gap through future execution of these contracts.
c) Energy Storage
Building on the 2018 IRP which included placeholders for approximately 140 MW of usable
alternating current (AC)2 grid-tied battery storage, the 2019 Update IRP includes estimates for
additional battery storage that is coupled with solar. The inclusion of nearly 100 MW of storage
coupled with solar over the planning horizon is driven by two factors. First, the results of the first
tranche of CPRE in DEC included two solar plus storage winning projects which provide some
guidance as to the types of projects being developed. Second, the most recent avoided cost rate
structures proposed in both NC and SC provide strong price incentives for Qualifying Facilities (QFs)
to shift energy from lower priced energy-only hours to hours that have higher energy and capacity
prices. This new rate design provides appropriate incentives to encourage storage plus solar projects.3
The amount of solar coupled with storage represented in the IRP will change over time as conditions
evolve, but these initial assumptions represent a first-step towards including such installations.
2 Usable alternating current for battery storage refers to the portion of the battery’s nameplate AC MW rating that is
available to the grid after taking into account limitations in depth of charge and discharge. 3 From North Carolina Avoided Cost Docket No. E-100, Sub 158 and South Carolina Avoided Cost Docket Nos.
2019-185-E and 2018-186-E.

Looking forward, advancements in modeling capabilities and plans to further study the capacity value
of storage in the Carolinas will help the Company ensure the reliability benefits of these technologies
are appropriately captured in its planning process.
d) Combined Heat and Power
Combined Heat and Power (CHP) systems, also known as cogeneration, generate electricity and
useful thermal energy in a single, integrated system. CHP is not a new technology, but an approach
to applying existing technologies. Heat that is normally wasted in conventional power generation is
recovered as useful energy, which avoids the losses that would otherwise be incurred from separate
generation of heat and power. CHP incorporating a gas-fired combustion turbine (CT) and heat
recovery steam generator (HRSG) is more efficient than the conventional method of producing power
and usable heat separately with a CT/generator and a stand-alone steam boiler.
DEP is exploring and working with potential customers with good base thermal loads on a regulated
Combined Heat and Power offer. The steam sales are credited back to the revenue requirement of the
projects to reduce the total cost of this resource. Along with the potential to be a cost-competitive
generation resource, CHP can result in carbon dioxide (CO2)emission reductions, and is a potential
economic development opportunity for both NC and SC. In DEP, discussions with potential steam
hosts are currently underway.
Potential projects with industrial customers have been challenging due to credit requirements, contract
length, estimated capital cost, and changes to natural gas price forecasts. As such, no projections for
CHP have been included this DEP IRP update.
This is a difference from the 2018 IRP placeholders have been removed in the update::
2021: 22 MW (winter) / 20 MW (summer)
2022: 22 MW (winter) / 20 MW (summer)
As CHP development continues, future IRPs will incorporate CHP, as appropriate. Additional
technologies evaluated as part of this IRP are discussed in Chapter 9.

e) Transmission Planned or Under Construction
This section lists the planned transmission line additions. A discussion of the adequacy of DEP’s
transmission system is also included. Table 4-D lists the transmission line projects that are planned
to meet reliability needs. This section also provides information pursuant to the North Carolina
Utilities Commission Rule R8-62
Table 4-D: DEP Transmission Line Additions
Location Capacity Voltage
Year From To MVA KV Comments
2019 Roxboro Plant Person (Hyco) 1084 230 Uprate
2020 Cleveland
Matthews Rd. Tap
Cleveland
Matthews Rd 621 230 New
2020 Sutton Plant Wallace 580 230 Uprate
2020 Jacksonville Grants Creek 1195 230 New
2020 Newport Harlowe 681 230 New
2021 Vanderbilt West Asheville 307 115 Upgrade
2021 Asheboro Asheboro East
North Line 307 115 Upgrade
2021 Sutton Plant Castle Hayne
North Line 239 115 Upgrade
2022 Baldwin Tap Baldwin 209 115 New
2023 Chestnut Hills Milburnie 202 115 Uprate

DEP has three transmission line projects, 161 kilovolt (kV) and above, currently under
construction. These are the Cleveland Matthews Rd 230 kV Tap Line, the Jacksonville-Grants
Creek 230 kV Line and the Newport-Harlowe 230 kV Line.
The remainder of this section provides information pursuant to the North Carolina Utility
Commission Rule R8-62.
Rule R8-62: Certificates of environmental compatibility and public convenience and necessity for
the construction of electric transmission lines in North Carolina.
(p) Plans for the construction of transmission lines in North Carolina (161 kV and above) shall
be incorporated in filings made pursuant to Commission Rule R8-60. In addition, each public
utility or person covered by this rule shall provide the following information on an annual
basis no later than September 1:
(1) For existing lines, the information required on FERC Form 1, pages 422, 423, 424, and
425, except that the information reported on pages 422 and 423 may be reported every five
years.
Please refer to the Company’s FERC Form No. 1 filed with NCUC in April 2019.
(p) Plans for the construction of transmission lines in North Carolina (161 kV and above)
shall be incorporated in filings made pursuant to Commission Rule R8-60. In addition,
each public utility or person covered by this rule shall provide the following information
on an annual basis no later than September 1:
(2) For lines under construction, the following:
a. Commission docket number;
b. Location of end point(s);
c. Length;
d. Range of right-of-way width;
e. Range of tower heights;
f. Number of circuits;
g. Operating voltage;
h. Design capacity;

i. Date construction started;
j. Projected in-service date;
Cleveland Matthews Road 230 kV Tap Line
Project Description: Construct new 230 kV transmission line from the Erwin-Selma 230 kV Line
in Johnston County to the Cleveland Matthews Road 230 kV Substation in Johnston County.
a. Docket number: E-2, Sub 1150
b. County location of end point(s); Johnston County
c. Approximate length; 11.5 miles
d. Typical right-of-way width for proposed type of line; 125 feet
e. Typical tower height for proposed type of line; 80 – 120 feet
f. Number of circuits; 1
g. Operating voltage; 230 kV
h. Design capacity; 621 MVA
i. Date construction started; March 2019
j. Projected in-service date; June 2020
Jacksonville – Grants Creek 230 kV Line
Project Description: Construct new 230 kV transmission line from the Jacksonville 230 kV
Substation in Onslow County to the Grants Creek 230 kV Substation in Onslow County.
a. Docket number: E-2, Sub 1102
b. County location of end point(s); Onslow County
c. Approximate length; 15 miles
d. Typical right-of-way width for proposed type of line; 125 feet
e. Typical tower height for proposed type of line; 80 – 120 feet
f. Number of circuits; 1
g. Operating voltage; 230 kV
h. Design capacity; 1195 MVA
i. Date construction started; September 2018
j. Projected in-service date; June 2020

Newport – Harlowe 230 kV Line
Project Description: Construct new 230 kV transmission line from the Newport 230 kV
Substation in Carteret County to the Harlowe 230 kV Substation in Carteret County.
a. Docket number: E-2, Sub 1113
b. County location of end point(s); Carteret County
c. Approximate length; 8 miles
d. Typical right-of-way width for proposed type of line; 125 feet
e. Typical tower height for proposed type of line; 80 – 120 feet
f. Number of circuits; 1
g. Operating voltage; 230 kV
h. Design capacity; 681 MVA
i. Date construction started; October 2018
j. Projected in-service date; June 2020
(p) Plans for the construction of transmission lines in North Carolina (161 kV and above) shall
be incorporated in filings made pursuant to Commission Rule R8-60. In addition, each
public utility or person covered by this rule shall provide the following information on an
annual basis no later than September 1:
(3) For all other proposed lines, as the information becomes available, the following:
a. county location of end point(s);
b. approximate length;
c. typical right-of-way width for proposed type of line;
d. typical tower height for proposed type of line;
e. number of circuits;
f. operating voltage;
g. design capacity;
h. estimated date for starting construction (if more than 6 month delay from last
report, explain); and
i. estimated in-service date (if more than 6-month delay from last report, explain).
(NCUC Docket No. E-100, Sub 62, 12/4/92; NCUC Docket No. E-100, Sub 78A,
4/29/98.)

The following pages represent those projects in response to Rule R8-62 part (3).
Porters Neck 230 kV Tap Line
Project Description: Construct new 230 kV transmission line from the Castle Hayne-Folkstone
230 kV Line to the Porters Neck 230 kV Substation in New Hanover County.
a. County location of end point(s); New Hanover County
b. Approximate length; 4.5 miles
c. Typical right-of-way width for proposed type of line; 125 feet
d. Typical tower height for proposed type of line; 80 – 120 feet
e. Number of circuits; 1
f. Operating voltage; 230 kV
g. Design capacity; 442 MVA
h. Estimated date for starting construction; January 2022
i. Estimated in-service date; June 2023
DEP Transmission System Adequacy
DEP monitors the adequacy and reliability of its transmission system and interconnections
through internal analysis and participation in regional reliability groups. Internal transmission
planning looks 10 years ahead at available generating resources and projected load to identify
transmission system upgrade and expansion requirements. Corrective actions are planned and
implemented in advance to ensure continued cost-effective and high-quality service. The DEP
transmission model is incorporated into models used by regional reliability groups in developing
plans to maintain interconnected transmission system reliability. DEP works with DEC, North
Carolina Electric Membership Corporation (NCEMC) and ElectriCities to develop an annual NC
Transmission Planning Collaborative (NCTPC) plan for the DEP and DEC systems in both North
and South Carolina. In addition, transmission planning is coordinated with neighboring systems
including Dominion Energy South Carolina (DESC) and Santee Cooper under a number of
mechanisms including legacy interchange agreements between DESC, Santee Cooper, DEP,
and DEC.
The Company monitors transmission system reliability by evaluating changes in load, generating
capacity, transactions and topography. A detailed annual screening ensures compliance with

DEP’s Transmission Planning Summary guidelines for voltage and thermal loading. The annual
screening uses methods that comply with SERC Reliability Corporation (SERC) policy and North
American Electric Reliability Corporation (NERC) Reliability Standards and the screening results
identify the need for future transmission system expansion and upgrades. The transmission
system is planned to ensure that no equipment overloads and adequate voltage is maintained to
provide reliable service. The most stressful scenario is typically at projected peak load with
certain equipment out of service. A thorough screening process is used to analyze the impact of
potential equipment failures or other disturbances. As problems are identified, solutions are
developed and evaluated.
Transmission planning and requests for transmission service and generator interconnection are
interrelated to the resource planning process. DEP currently evaluates all transmission reservation
requests for impact on transfer capability, as well as compliance with the Company’s
Transmission Planning Summary guidelines and the FERC Open Access Transmission Tariff
(OATT). The Company performs studies to ensure transfer capability is acceptable to meet
reliability needs and customers’ expected use of the transmission system. Generator
interconnection requests are studied in accordance with the Large and Small Generator
Interconnection Procedures in the OATT and the North Carolina and South Carolina
Interconnection Procedures.
SERC audits DEP every three years for compliance with NERC Reliability Standards.
Specifically, the audit requires DEP to demonstrate that its transmission planning practices meet
NERC standards and to provide data supporting the Company’s annual compliance filing
certifications. SERC conducted a NERC Reliability Standards compliance audit of DEP in June
2019. DEP received “No Findings” from the audit team.
DEP participates in a number of regional reliability groups to coordinate analysis of regional, sub-
regional and inter-balancing authority area transfer capability and interconnection reliability.
Each reliability group’s purpose is to:
• Assess the interconnected system’s capability to handle large firm and non-firm
transactions for purposes of economic access to resources and system reliability;
• Ensure that planned future transmission system improvements do not adversely affect
neighboring systems; and

• Ensure interconnected system compliance with NERC Reliability Standards.
Regional reliability groups evaluate transfer capability and compliance with NERC Reliability
Standards for the upcoming peak season and five- and ten-year periods. The groups also perform
computer simulation tests for high transfer levels to verify satisfactory transfer capability.
Application of the practices and procedures described above ensures that DEP’s transmission
system continues to provide reliable service to its native load and firm transmission customers.

5. LOAD FORECAST
Methodology
The Duke Energy Progress spring 2019 forecast provides projections of the energy and peak demand
needs for its service area. The forecast covers the time period of 2020 – 2034 and represents the needs
of the following customer classes:
• Residential
• Commercial
• Industrial
• Other Retail
• Wholesale
Energy projections are developed with econometric models using key economic factors such as
income, electricity prices, industrial production indices, along with weather, appliance efficiency
trends, rooftop solar trends, and electric vehicle trends. Population is also used in the residential
customer model.
The economic projections used in the Spring 2019 Forecast are obtained from Moody’s Analytics, a
nationally recognized economic forecasting firm, and include economic forecasts for the states of
North and South Carolina. Moody’s forecasts consist of economic and demographic projections,
which are used in the energy and demand models.
The Retail forecast consists of the three major classes: Residential, Commercial and Industrial.
The Residential class sales forecast is comprised of two projections. The first is the number of
residential customers, which is driven by population. The second is energy usage per customer, which
is driven by weather, regional economic and demographic trends, electricity prices and appliance
efficiencies.
The usage per customer forecast was derived using a Statistical Adjusted End-Use Model (SAE). This
is a regression based framework that uses projected appliance saturation and efficiency trends
developed by Itron using Energy Information Administration (EIA) data. It incorporates naturally
occurring efficiency trends and government mandates more explicitly than other models. The outlook
for usage per customer is essentially flat through much of the forecast horizon, so most of the growth
is primarily due to customer increases. The average annual growth rate of residential in the Spring

2019 forecast, including the impacts of Utility Energy Efficiency programs (UEE), rooftop solar and
electric vehicles from 2020 – 2034 is 1.3%.
The Commercial forecast also uses an SAE model in an effort to reflect naturally occurring as well as
government mandated efficiency changes. The three largest sectors in the commercial class are
offices, education and retail. Commercial energy sales are expected to grow 0.8% per year over the
forecast horizon.
The Industrial class is forecasted by a standard econometric model, with drivers such as total
manufacturing output, textile output, and the price of electricity. Overall, Industrial sales are expected
to grow 0.5% per year over the forecast horizon.
Weather impacts are incorporated into the models by using Heating Degree Days with a base
temperature of 59 and Cooling Degree Days with a base temperature of 65. The forecast of degree
days is based on a 30-year average, which is updated every year.
The appliance saturation and efficiency trends are developed by Itron using data from the Energy
Information Administration (EIA). Itron is a recognized firm providing forecasting services to the
electric utility industry. These appliance trends are used in the residential and commercial sales
models.
Peak demands were projected using the SAE approach. The peak forecast was developed using a
monthly SAE model, similar to the sales SAE models, which includes monthly appliance saturations
and efficiencies, interacted with weather and the fraction of each appliance type that is in use at the
time of monthly peak.
Forecast Enhancements
In 2013, as referenced above, the Company began using the SAE model projections to forecast sales
and peaks. The end use models provide a better platform to recognize trends in equipment /appliance
saturation and changes to efficiencies, and how those trends interact with heating, cooling, and “other”
or non-weather-related sales. These appliance trends are used in the residential and commercial sales
models. In conjunction with peer utilities and ITRON, the company continually looks for refinements
to its modeling procedures to make better use of the forecasting tools, and develop more reliable
forecasts.
Each time the forecast is updated, the most currently available historical and projected data is used.
The current 2019 forecast utilizes:

• Moody’s Analytics January 2019 base and consensus economic projections.
• End use equipment and appliance indexes reflect the 2018 update of ITRON’s end-use data,
which is consistent with the Energy Information Administration’s 2018 Annual Energy
Outlook
• A calculation of normal weather using the period 1988-2017
The Company also researches weather sensitivity of summer and winter peaks, hourly shaping of
sales, and load research data in a continuous effort to improve forecast accuracy.
Assumptions
Below are the projected average annual growth rates of several key drivers from DEP’s Spring 2019
Forecast.
2020-2034
Real Income 2.7%
Manufacturing Industrial Production Index (IPI) 1.1%
Population 1.6%
In addition to economic, demographic, and efficiency trends, the forecast also incorporates the
expected impacts of UEE, as well as projected effects of electric vehicles and behind the meter solar
technology.
Utility Energy Efficiency
UEE Programs continue to have a large impact in the acceleration of the adoption of energy
efficiency. When including the impacts of UEE on energy and peaks, careful attention must be paid
to avoid the double counting of UEE efficiencies with the naturally occurring efficiencies included in
the SAE modeling approach. To ensure there is not a double counting of these efficiencies, the
forecast “rolls off” the UEE savings at the conclusion of its measure life. For example, if the
accelerated benefit of a residential UEE program is expected to have occurred 7 years before the
energy reduction program would have been otherwise adopted, then the UEE effects after year 7 are
subtracted (“rolled off”) from the total cumulative UEE. With the SAE model’s framework, the
naturally occurring appliance efficiency trends replace the rolled off UEE benefits serving to continue
to reduce the forecasted load resulting from energy efficiency adoption.

The table below illustrates this process on sales:
Table 5-A UEE Program Life Process (GWh)

Customer Growth
Tables 5-B and 5-C show the history and projections for DEP customers
Table 5-B Retail Customers (annual average in thousands)

Table 5-C Retail Customers (annual average in thousands)
Electricity Sales
Table 5-D shows the actual historical gigawatt hour (GWh) sales. As a note, the values in Table 5-D
are not weather adjusted Sales.

Table 5-D Electricity sales (GWh)
Note: The wholesale values in Table 5-D exclude NCEMPA sales for all years before 2015, and is only partially included
in 2015.
System Peaks
Charts 5-E and 5-F show the historical actual and weather normalized peaks for the system:

Chart 5-E Winter Peaks
Note: WN Peak/Forecast values in years 2020-2024 are forecasted peak values from the 2019 Spring Forecast. The
Temperatures are the average daily temperature on the day of the peak.
Chart 5-F Summer Peaks
Note: WN Peak/Forecast values in years 2019-2024 are forecasted peak values from the 2019 Spring Forecast. The
Temperatures are the average daily temperature on the day of the peak.

Forecast Results
A tabulation of the utility’s sales and peak forecasts are shown as charts below:
• Table 5-G: Forecasted energy sales by class (Including the impacts of UEE, rooftop
solar, and electric vehicles)
• Table 5-H: Summary of the load forecast without UEE programs and excluding any
impacts from demand reduction programs
• Table 5-I: Summary of the load forecast with UEE programs and excluding any
impacts from demand reduction programs
These projections include Wholesale, and all the loads and energy in the tables and charts below are
at generation, except for the class sales forecast, which is at the meter.
Load duration curves, with and without UEE programs are shown as Charts 5-A and 5-B.
The values in these tables reflect the loads that Duke Energy Progress is contractually obligated to
provide and cover the period from 2020 to 2034.

Table 5-G Forecasted Energy Sales by Class
Note: Values are at meter

Table 5-H Summary of the Load Forecast without UEE Programs and Excluding any
Impacts from Demand Reduction Programs
YEAR SUMMER
(MW)
WINTER
(MW)
ENERGY
(GWH)
2020 13,194 14,522 64,302
2021 13,281 14,523 64,587
2022 13,409 14,687 65,223
2023 13,574 14,819 66,016
2024 13,732 15,069 66,910
2025 13,902 15,237 67,722
2026 14,143 15,415 68,578
2027 14,304 15,670 69,491
2028 14,536 15,876 70,522
2029 14,723 16,084 71,352
2030 14,936 16,302 72,319
2031 15,138 16,512 73,488
2032 15,355 16,727 74,870
2033 15,569 16,921 75,747
2034 15,799 17,113 76,692
Avg. Annual
Growth Rate 1.2% 1.1% 1.2%
Note: Values are at generation level

Chart 5-A
Load Duration Curve without Energy Efficiency Programs and Before Demand Response Programs
Page 37

Table 5-I Summary of the Load Forecast with UEE Programs and Excluding any Impacts
from Demand Reduction Programs
YEAR SUMMER
(MW)
WINTER
(MW)
ENERGY
(GWH)
2020 13,133 14,473 63,964
2021 13,182 14,434 64,040
2022 13,274 14,557 64,465
2023 13,404 14,649 65,043
2024 13,529 14,843 65,724
2025 13,663 14,965 66,330
2026 13,867 15,106 66,990
2027 13,995 15,326 67,718
2028 14,198 15,502 68,586
2029 14,359 15,690 69,295
2030 14,551 15,883 70,163
2031 14,735 16,073 71,241
2032 14,937 16,276 72,552
2033 15,136 16,461 73,374
2034 15,360 16,654 74,306
Avg. Annual
Growth Rate 1.0% 0.9% 1.0%
Note: Values are at generation level
Values differ from Tables 9-A and 9-B due to 150 MW firm sale in years 2020 – 2024.
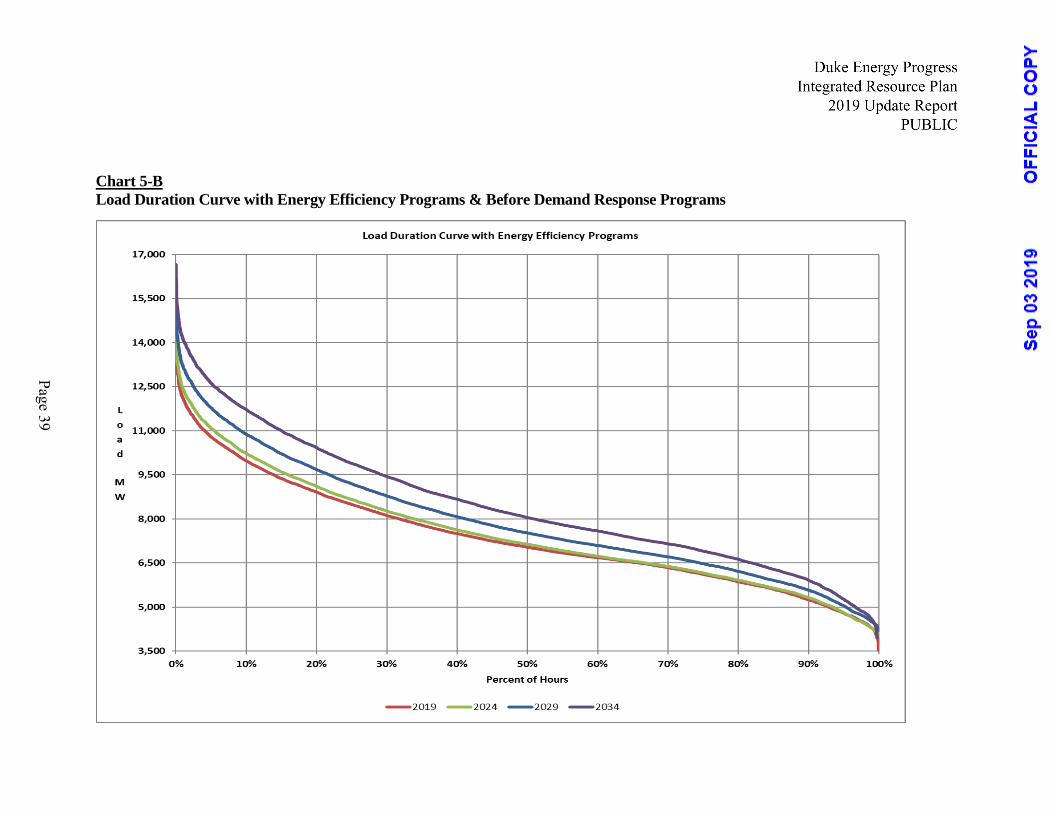
Chart 5-B
Load Duration Curve with Energy Efficiency Programs & Before Demand Response Programs
Page 39

6. RENEWABLE ENERGY AND ENERGY STORAGE
The growth of renewable generation in the United States continued in 2018. According to EIA, in
2018, 6.6 GW of wind and 4.9 GW of utility-scale solar capacity were installed nationwide. Green
Tech Media, a subsidiary of Wood Mackenzie, estimates 4.5 GW of small scale solar was added as
well. Meanwhile, 12.9 GW of coal was retired in 2018 with no new coal-fired generation installed.4
North Carolina ranked third in the country in solar capacity added in 2018, and remains second behind
only California in total solar capacity online. According to Green Tech Media, South Carolina ranked
twelfth in 2018. Duke Energy’s compliance with the North Carolina Renewable Energy and Energy
Efficiency Portfolio Standards (NC REPS), the South Carolina Distributed Energy Resource Program
(SC DER or SC Act 236), the Public Utility Regulatory Policies Act (PURPA) as well as the
availability of the Federal Investment Tax Credit (ITC) were key factors behind the high penetration
of solar.
The interconnection queue has remained steady compared to 2018, with the DEP and DEC combined
solar queue representing approximately 12 GW. Key drivers to queue growth have been North
Carolina House Bill 589 (NC HB 589), the implementation of the SC DER Program and anticipated
further growth in South Carolina via Act 62 (described below), and favorable avoided cost rates and
15-year contract terms for QFs under PURPA that previously existed in North Carolina pre- NC HB
589.
The implementation of NC HB 589, and the passage of Act 62 in SC are significant to the amount of
solar projected to be operational during the planning horizon. Growing customer demand, the federal
ITC, and declining installed solar costs make solar capacity the Company’s primary renewable energy
resource in the 2019 IRP. The following key assumptions regarding renewable energy were included
in the 2019 IRP:
• Installed solar capacity increases in DEP from 3,005 MW in 2020 to 4,629 MW in 2034 with
approximately 100 MW of usable AC storage coupled with solar included;
• Compliance with NC REPS continues to be met through a combination of solar, other
renewables, EE, and Renewable Energy Certificate (REC) purchases;
• Achievement of the SC Act 236 goal of 39 MW of solar capacity located in DEP; and
4 All renewable energy GW/MW represent GW/MW-AC (alternating current) unless otherwise noted.

• Implementation of NC HB 589 and continuing solar cost declines drive solar capacity growth
above and beyond NC REPS requirements and SC Act 236 requirements, and in support of
SC Act 62.
NC HB 589 Competitive Procurement of Renewable Energy (CPRE):
NC HB 589 established a competitive solicitation process, known as the Competitive Procurement of
Renewable Energy (CPRE), which calls for the addition of 2,660 MW of competitively procured
renewable resources across the Duke Energy Balancing Authority Areas over a 45-month period. On
July 10, 2018, Duke issued a request for bids for the first tranche of CPRE, requesting 600 MW in
DEC and 80 MW in DEP. On April 9, 2019 the independent administrator selected 12 projects totaling
515 MW in DEC and two projects totaling 83 MW in DEP. Both DEP projects are third party owned
although one of the DEP projects will be transmission tied in NC and the other will be distribution
tied in SC. See the annual CPRE Program Plan included as Attachment II for additional details.
The Companies expect to request the same amount of system capacity in the second tranche of CPRE
as the first (600 MW in DEC and 80 MW in DEP). Given continued increases in capacity referred to
in this document as the “Transition MW”, the Companies will continue to monitor potential impacts
on future tranche volumes. These “Transition MW” represent the total capacity of renewable
generation projects in the combined Duke Balancing Authority area that are (1) already connected; or
(2) have entered into purchase power agreements (PPAs) and interconnection agreements (IAs) as of
the end of the 45-month competitive procurement period, and which are not subject to curtailment or
economic dispatch. The total CPRE target of 2,660 MW will vary based on the amount of Transition
MW at the end of the 45-month period, which NC HB 589 expected to total 3,500 MW. If the
aggregate capacity in the Transition MW exceeds 3,500 MW, the competitive procurement volume
of 2,660 MW will be reduced by the excess amount. As of August 2019, there are approximately
3,700 MW that currently meet NC HB 589’s definition of “Transition MW”, meaning CPRE will be
reduced by a minimum of 200 MW. The company believes the Transition may exceed 3,500 MW by
as much as 1,400 MW, and possibly more depending on the extent to which Act 62 drives new solar
growth in SC by the end of the 45-month CPRE period.
NC and SC Interconnection Queues:
Through the end of 2018, DEP had approximately 2,500 MW of utility scale solar on its system, with
over 450 MW interconnecting in 2018. When renewable resources were evaluated for the 2019 IRP,

DEP reported another approximately 500 MW of third party solar under construction and more than
6,500 MW in the interconnection queue. Table 6-A contains interconnection queue information for
renewable resources which provides details on the number of pending projects and pending capacity
by state.
Table 6-A: Renewable Interconnection Queue as of 7-31-19
Projecting future solar connections from the interconnection queue presents a significant challenge
due to the large number of project cancellations, ownership transfers, interconnection studies
required, and the unknown outcome of which projects will be selected through the CPRE program.
DEP’s contribution to the Transition depends on many variables including connecting projects under
construction, the expected number of projects in the queue with a PPA and IA, SC Act 62, and SC
DER Program Tier I. As of May 31, 2019, DEP had approximately 2,700 MW of solar capacity with
a PPA and IA, and roughly 100 MW of non-solar renewable capacity with PPAs that extend through
the 45-month CPRE period. A number of additional projects in the queue are expected to acquire both
a PPA and IA prior to the expiration of the 45-month period defined in NC HB 589, potentially
resulting in approximately an additional 800 MW contributing to the Transition. In total, DEP may
contribute roughly three-quarters of the Transition MW with DEC accounting for the remaining
quarter.
Utility
DEP Total 392 7,526.2
SC Total 144 2,494.9
SC Solar 144 2,494.9
NC Total 248 5,031.3
Solar 231 4,148.3
Other 1 14.0
Biomass 1 4.2
DEP NC Battery 4 864.8
Facility State Energy Source Type Number of Pending Projects Pending Capacity (MW AC)
Facility State: NC,SC
OPCO: DEP
Report Month End: 07-31-2019
Annual IRP Interconnection QueueReport as of: 07-31-2019

NC REPS Compliance:
DEP remains committed to meeting the requirements of NC REPS, including the poultry waste, swine
waste, and solar set-asides, and the general requirement, which will be met with additional renewable
and energy efficiency resources. DEP’s long-term general compliance needs are expected to be
met through a combination of renewable resources, including RECs obtained through the NC
HB 589 competitive procurement process. For details of DEP’s NC REPS compliance plan,
please reference the NC REPS Compliance Plan, included as Attachment I to this IRP.
NC HB-589 Competitive Procurement and Utility-Owned Solar:
DEP continues to evaluate utility-owned solar additions to grow its renewables portfolio. DEP
owns and operates four utility-scale solar projects, totaling 141 MW-AC, as part of its efforts to
encourage emission free generation resources and help meet its compliance targets:
• Camp Lejeune Solar Facility – 13 MW, located in Onslow County, NC placed in service
in November 2015;
• Warsaw Solar Facility – 65 MW, located in Duplin County, NC placed in service in
December 2015;
• Fayetteville Solar Facility – 23 MW, located in Bladen County, NC placed in service in
December 2015; and
• Elm City Solar Facility – 40 MW, located in Wilson County, NC placed in service in
March 2016.
No more than 30% of the CPRE Program requirement may be satisfied through projects in which
Duke Energy or its affiliates have an ownership interest at the time of bidding. DEP intends to bid
into the second tranche of the CPRE and will also evaluate the potential for acquiring facilities where
appropriate. NC HB 589 does not stipulate a limit for DEP’s option to acquire projects from third
parties that are specifically proposed in the CPRE RFP as acquisition projects, though any such project
will not be procured unless determined to be among the most cost-effective projects submitted.
Additional Factors Impacting Future Solar Growth:
A number of factors impact the Company’s forecasting of future solar growth in the Carolinas. First,
potential changes in the Company’s avoided cost in either NC or SC may impact the development of

projects under PURPA, NC HB 589, and SC Act 62. Avoided cost forecasts are subject to variability
due to changes in factors such as natural gas and coal commodity prices, system energy and
demand requirements, the level and cost of generation ancillary service requirements and
interconnection costs. PURPA requires utilities to purchase power from QFs at or below the utility’s
avoided cost rates. NC HB 589 requires that competitive bids are priced below utility’s avoided cost
rates, as approved by the NCUC, in order to be selected. Therefore, the cost of solar is a critical input
for forecasting how much solar will materialize in the future.
Solar costs are also influenced by other variables. Panel prices have historically decreased at a
significant rate and are expected to continue to decline. However, in January 2018, President Trump
announced a tariff on solar modules and cells with a rate of 30% in year 1, declining 5% per year until
the fourth and final year in which the tariff rate is 15%. Additional factors that could put upward
pressure on solar costs include direct interconnection costs, as well as costs incurred to maintain the
appropriate operational control of the facilities. Finally, as panel prices have decreased, there has been
more interest in installing single-axis tracking (SAT) systems (as demonstrated in CPRE tranche 1)
and/or systems with higher inverter load ratios (ILR) which change the hourly profile of solar output
and increase expected capacity factors. DEP now models fixed tilt and SAT system hourly profiles
with a range of ILR’s as high as 1.6 (DC/AC ratio).
In summary, there is a great deal of uncertainty in both the future avoided costs applicable to
solar and the expected price of solar installations in the years to come. As a result, the Company
will continue to closely monitor and report on these changing factors in future IRP and
competitive procurement filings.
NC HB 589 Customer Programs:
In addition to the CPRE program, NC HB 589 offers direct renewable energy procurement for major
military installations, public universities, and other large customers, as well as a community solar
program. These programs will complement the existing SC Act 236 Programs and upcoming SC Act
62 programs.
As part of NC HB 589, the renewable energy procurement program for large customers such as
military installations and universities enables large customers to procure renewable energy attributes
from new renewable energy resources. The program allows for up to 600 MW of total capacity, with
set asides for military installations (100 MW of the 600 MW) and the University of North Carolina

(UNC) system (250 MW of the 600 MW). The 2019 IRP base case assumes all 600 MW of this
program materialize, with the DEP/DEC split expected to be roughly 45/55. If all 600 MW are not
utilized, the remainder will roll back to the competitive procurement, increasing its volume.
The community solar portion of NC HB 589 calls for up to 20 MW of shared solar in DEP. This
program is similar to the SC Act 236 shared solar program, and allows customers who cannot or do
not want to put solar on their property to take advantage of the economic and environmental benefits
of solar by subscribing to the output of a centralized facility. The 2019 IRP Base Cases assume that
all 20 MW of the NC HB 589 shared solar program materializes.
NC HB 589 also calls for a rebate program for rooftop solar. The rebate program opened in July 2018
and the program has spurred greater interest in solar installations and therefore, more net metered
customers in NC. Residential and non-residential capacity limits were quickly fully subscribed in
2018 and 2019. In 2018, DEP NC installed approximately 11 MW of rooftop solar, more than triple
the capacity installed in 2017. Through June of 2019, installed rooftop solar capacity is approximately
8 MW or only three MW short of 2018 totals.
SC Act 236 and SC Act 62:
Steady progress continues to be made with the first two tiers of the SC DER Program summarized
below, completion of which would unlock the third tier:
• Tier I: 13 MW of solar capacity from facilities each >1 MW and < 10 MW in size.
• Tier II: 13 MW of behind-the-meter solar facilities for residential, commercial and industrial
customers, each ≤1 MW, 25% of which must be ≤ 20 kilowatts (kW). Since Tier II is behind
the meter, the expected solar generation is embedded in the load forecast as a reduction to
expected load.
• Tier III: Investment by the utility in 13 MW of solar capacity from facilities each >1 MW and
<10 MW in size. Upon completion of Tiers I and II (to occur no later than 2021), the Company
may directly invest in additional solar generation to complete Tier III.
DEP has executed two PPAs to complete Tier I which will result in 15 MW, 5 MW of which are
currently operational. Tier II incentives have resulted in growth in private solar in DEP, as nearly 16
MW of rooftop solar has been installed in DEP SC.

The Company launched its first Shared Solar program as part of Tier I. Duke Energy designed its
initial SC Shared Solar program to have appeal to residential and commercial customers who rent or
lease their premises, residential customers who reside in multifamily housing units or shaded housing
or for whom the relatively high up-front costs of solar PV make net metering unattainable, and non-
profits who cannot monetize the ITC. The program capacity is 1 MW including 200 kW set aside for
customers earnings less than 200% of the federal poverty line. As of the end of June 2019, 52 kW
was subscribed. The unreserved 800 kW of capacity sold out within 60 days due to the program’s
strong economic proposition.
SC Act 62 passed in South Carolina on May 16, 2019. SC Act 62 will likely drive additional PURPA
solar as DEP must offer fixed price PPAs to certain small power producers at avoided cost for a
contract term of 10 years. The 10-year rate is applicable for projects located in SC until DEP has
executed IAs and PPAs with aggregated nameplate capacity equal to 20 percent of the previous 5-
year average of DEP’s SC retail peak load, or roughly 260 MW. After 260 MW have executed IAs
and PPAs the Commission will determine conditions, rates, and terms of length for future contracts.
Given there is roughly 2,500 MW of solar pending in DEP SC, the Company expects to easily meet
260 MW within the IRP planning period. The Company intends to closely monitor the capacity with
executed IAs and PPAs, evaluate impacts on the HB 589 Transition MW and corresponding reduction
in CPRE volume.
SC Act 62 also called for additional customer programs, requiring the utilities to file voluntary
renewable energy programs within 120 days of the Act passing, encouraging additional community
solar. The Company has a proposed voluntary renewable energy program pending before the
Commission, which would create a 150 MW program for DEC and DEP SC combined (37 MW in
DEP) offering up to 15-year PPA’s. The Companies are considering whether additional community
solar should be pursued.
Finally, SC Act 62 lifted the cap on net metering, requiring the Company to offer net metering through
June 1, 2021. No later than January 1, 2020, the Commission will open a docket to establish a solar
choice metering tariff to go into effect for customer applications received after May 31, 2021.
Wind:
DEP considers wind a potential energy resource in the long term to support increased renewables
portfolio diversity, long-term general compliance needs, as well as a potential resource for further

carbon reduction. However, investing in wind inside of DEP’s footprint may be challenging in the
short-term, primarily due to a lack of suitable sites, permitting challenges, and more modest capital
cost declines relative to other renewable technologies like solar. Opportunities may exist to transmit
wind energy into the Carolinas from out of state regions where wind is more cost-effective. The
Company will continue to monitor the economic feasibility of offshore wind as well.
Summary of Expected Renewable Resource Capacity Additions:
The 2019 IRP incorporates the Base Case renewable capacity forecast below. This case includes
renewable capacity components of the Transition MW of NC HB 589, such as capacity required for
compliance with NC REPS, PURPA purchases, the SC DER Program, and the additional three
components of NC HB 589 (competitive procurement, renewable energy procurement for large
customers, and community solar). The Base Case also includes additional projected solar growth
beyond NC HB 589, and in support of expected growth from SC Act 62 and the Company’s efforts
to reduce carbon emissions. While certain regions of DEP may become saturated with solar, it is the
Company’s belief that continued declines in the installation cost of solar and storage, will enable solar
and coupled “solar plus storage” systems to contribute to growing energy needs. The Company also
believes supportive policies for solar and solar plus storage will continue to exist in NC and SC even
beyond the NC HB 589 procurement horizon.
Given two DEC projects in the first tranche of CPRE included storage, the Company is projecting a
similar ratio of solar capacity coupled with storage in future tranches of CPRE. Additionally, the most
recent avoided cost rate structures proposed in both NC and SC provide strong price incentives for
QFs to shift energy from lower priced energy-only hours to hours that have higher energy and capacity
prices. This new rate design provides appropriate incentives to encourage storage plus solar projects.
The Company this year is also projecting that a significant amount of incremental solar beyond NC
HB 589 will be coupled with storage. Additional scenarios will be included in the 2020 IRP, but for
now the 2019 base case assumes storage is DC coupled with solar, has a four-hour duration, and the
maximum capacity of the battery storage is 25% of the max capacity of the solar. In total, DEP expects
nearly 100 MW of storage coupled with solar by the end of 2034.
The Company anticipates a diverse portfolio including solar, biomass, hydro, storage, and other
resources. Actual results could vary substantially for the reasons discussed previously, as well as
other potential changes to legislative requirements, tax policies, technology costs, carbon prices,
ancillary costs, interconnection costs, and other market forces. The details of the forecasted capacity

additions, including both nameplate and contribution to winter and summer peaks are summarized in
Table 6-B below.
While solar is not at its maximum output at the time of DEP’s expected peak load in the summer,
solar’s contribution to summer peak load is large enough that it may push the time of summer peak
to a later hour if solar penetration levels continue to increase. However, solar is unlikely to have a
similar impact on the morning winter peak due to little solar output in the morning hours. Solar
capacity contribution percentages to summer and winter peak demands are assumed to be the same
as those used in the 2018 IRP. Note, however the solar contribution to peak values now also include
additional contributions provided by storage coupled with solar, assumed to be 80% of the storage
capacity installed.

Table 6-B: DEP Base Case Total Renewables
As a number of solar contracts are expected to expire over the IRP planning period, the Company is
additionally breaking down its solar forecast into three buckets described below:
• Designated: Contracts that are already connected today or those who have yet to connect but
have an executed PPA are assumed to be designated for the duration of the purchase power
contract.
• Mandated: Capacity that is not yet under contract but is required through legislation
(examples include future tranches of CPRE, the renewables energy procurement program for
large customers, and community solar under NC HB 589 as well as SC Act 236)
• Undesignated: Additional capacity projected beyond what is already designated or mandated.
Expiring solar contracts are assumed to be replaced in kind with undesignated solar additions.
Such additions could include existing providers or new facilities that enter into contracts that
have yet to be executed.
SolarBiomass/
HydroTotal Solar
Biomass/
HydroTotal Solar
Biomass/
HydroTotal
2020 3,005 264 3,269 1,052 264 1,316 30 264 294
2021 3,274 116 3,390 1,111 116 1,227 33 116 149
2022 3,477 116 3,593 1,142 116 1,257 35 116 151
2023 3,784 113 3,897 1,185 113 1,298 40 113 152
2024 3,987 112 4,099 1,206 112 1,318 42 112 154
2025 4,069 105 4,174 1,214 105 1,319 43 105 148
2026 4,157 105 4,262 1,234 105 1,338 54 105 159
2027 4,210 48 4,258 1,246 48 1,294 62 48 110
2028 4,262 44 4,306 1,259 44 1,303 70 44 114
2029 4,325 33 4,359 1,273 33 1,307 79 33 113
2030 4,381 32 4,413 1,287 32 1,319 87 32 120
2031 4,441 32 4,473 1,301 32 1,333 96 32 129
2032 4,491 31 4,522 1,313 31 1,344 104 31 135
2033 4,563 30 4,593 1,330 30 1,360 114 30 144
2034 4,629 30 4,659 1,345 30 1,376 124 30 154
Solar includes 0.5% per year degradation
Capacity l isted excludes REC Only Contracts
Contribution to peak based on 2018 Astrape analysis plus 80% estimated capacity value for storage that is coupled with solar
DEP Base Renewables - Compliance + Non-Compliance
MW Nameplate MW Contribution to Summer Peak MW Contribution to Winter Peak

The chart below shows DEP’s breakdown of these three buckets through the planning period. Note
for avoided cost purposes, the Company only includes the Designated and Mandated buckets in the
base case. For pricing the second tranche of CPRE, the Company includes the Designated bucket
only.
Energy Storage
The Company is assessing the integration of battery storage technology into its portfolio of assets.
Battery storage costs are expected to continue to decline, which may make this resource a viable
option for grid support services, including frequency regulation, solar smoothing during periods with
high incidences of intermittency, as well as, the potential to provide overall energy and capacity
value. Energy storage can also provide value to the transmission and distribution (T&D) system by
deferring or eliminating traditional upgrades and can be used to improve reliability and power quality
to locations on the Company’s distribution system. This approach results in stacked benefits which
couples value streams from the Transmission, Distribution, and Generation systems. This unique
evaluation process falls outside of the Company’s traditional IRP process which focuses primarily on
meeting future generation needs reliably and at the lowest possible cost. This new approach to
evaluating technologies that have generation, transmission and distribution value is being addressed
through the ISOP enhancements, discussed further in the following section.

The Company has begun investing in multiple grid-connected storage systems dispersed throughout
its North and South Carolina service territories that will be located on property owned by the
Company or leased from its customers. These deployments will allow for a more complete evaluation
of potential benefits to the distribution, transmission and generation system while also providing
actual operations and maintenance cost impacts of batteries deployed at a significant scale. This will
allow the Company to explore the nature of new offerings desired by customers and fill knowledge
gaps such as how the Company can best integrate battery storage into its daily operations. The
Company will work with Generation, Transmission and Distribution organizations in this evaluation
process, utilizing the ISOP framework. The goal is to optimize the location to couple localized T&D
system benefits with bulk system benefits, and to minimize cost and maximize benefits for its
customers. The Company believes such investments are consistent with the direction of state policy
in both NC and SC under the NC HB 589 and SC DER Program respectively, as well as the most
recently proposed avoided cost rates in both states. Additionally, the Company plans to further study
the capacity value of storage in the Carolinas with any learnings to be included in the 2020 IRP

7. INTEGRATED SYSTEM & OPERATIONS PLANNING (ISOP)
The concept of ISOP was introduced in the 2018 IRP filed in NC and SC. Duke continues to view
this effort as a natural evolution in the planning process to address continued trends in technology
development, declining cost projections for grid-tied technologies, and customer preferences for
distributed energy resources such as roof-top solar and end-use electrification such as electric vehicles
(EVs). The anticipated growth of energy resources on (or closer to) the grid edge, particularly energy
storage, will require utilities to move beyond the traditional utility distribution and transmission
planning practice of analysis that considers only a few snapshots of system conditions at discrete
points in time. Moving forward, analysis of the distribution and transmission systems will need to
account for increasing volatility of net demand (load less variable distributed resources), which will
require significant changes to modeling inputs and tools.
Recognizing that development of new tools and analytical methods involve significant uncertainty of
timing and outcomes, Duke’s goal at this point is to implement the basic elements of ISOP in the
2022 IRPs for the Carolinas. This timeline is based on the Company’s perspective that ISOP will
provide additional analytic tools and planning processes to support future IRPs as the potential for
distributed energy resources grows and as the electrification of the transportation sector and other
end-uses begin to have more significant impacts on energy planning, as a whole. To be clear, the
ISOP effort is not prejudging the analytical outcome of the effort, but rather is intended to enhance
the planning methodology and tool sets to enable a fair and thorough evaluation of resources in an
evolving energy marketplace. It should be noted that changed introduced by a stakeholder
engagement process or potential rulemaking by NCUC or PSCSC could impact the ISOP timeline.
One of the first steps in this process is development of an hourly forecast of projected load and DER
output for each distribution circuit that covers a sufficient time horizon. This granular forecast is
required to determine potential operational issues and costs at the circuit level as well as to capture
potential benefits of deferred capacity additions for DERs. Given the size of the Company’s system,
this effort involves a significant time and resource commitment to gather the necessary input data and
build the forecasting models required to support this extensive level of granular forecasting. For
example, Duke is developing models to enable derivation of hourly forecasts for 4500+ distribution
circuits in the Carolinas covering a ten-year horizon.
Additionally, new modeling capabilities are necessary to perform hourly power flow analysis of the
effects of DERs. Duke has been working with the Electric Power Research Institute (EPRI), as well
as a 3rd party industry leader in distribution modeling, to develop an Advanced Distribution Planning
(ADP) tool capable of evaluating both traditional and non-traditional solutions on the distribution

system, which requires analyzing distribution circuits for potential violations on an hourly basis. The
development and testing effort for the basic ADP functionality is targeted to be rolled out
progressively to DEC and DEP Distribution Planners during 2021. Subsequent development efforts
will focus on adding more robust capability such as multi-circuit analysis of more complex switching,
combinations of traditional and non-traditional solutions, etc.
Basic functionality of the ADP toolset will include the ability to evaluate DERs (including energy
storage) as a potential solution, and determine the hourly pattern where the DER would be utilized to
address local issues. In the case of energy storage, the unutilized hours of the resource can then be
evaluated for additional value at the transmission and bulk generation levels, where feasible. This
points out the need for coordination and data integration between the respective models across
distribution, transmission, and generation planning disciplines to assess value across multiple use
cases for DERs, which will add significant complexity. One practical implication is that the
envisioned coordinated modeling processes will likely require more time than the current stand-alone
generation planning processes, which could impact the development timeline for future IRPs.
Duke is also testing an established 3rd party DC transmission power flow model to develop an
effective hourly power flow analysis process to complement the AC power flow model used for
transmission planning today. The DC power flow analysis could be used for screening over much
broader time periods to help identify hours and conditions that may warrant more detailed AC power
flow analysis in conventional transmission planning processes. As it relates to ISOP modeling
coordination, the hourly DC power flow model would be used to develop the need profile where there
are opportunities to utilize energy storage as a non-traditional solution on the transmission system.
The value of remaining hours of energy storage availability could then be evaluated at the bulk level.
Enhanced generation production cost models are expected to provide additional areas of improvement
in the planning process. Duke continues to refine the quantification of ancillary requirements
associated with intermittent resources, such as solar and while also working on the development of
on-shore and off-shore wind ancillary requirements to evaluate benefits of a more diverse renewable
resource mix in the Carolinas. Additionally, enhancements to hourly production cost models can help
to better represent the sub-hourly impact of intermittent resources as well as the ability of energy
storage to mitigate such costs. Duke is exploring the ability of sub-hourly models to address these
challenges, as shown in the filing for the Solar Integration Services Charge (SISC) agreed to between
Duke and the NC Public Staff and filed with the NCUC on May 21, 2019.
Finally, it should be noted that outreach has been and remains an important part of the ISOP effort.
Over the last several years, the Company’s ISOP development team has gathered input from other

utilities, national labs, EPRI, consultants, and academic groups to inform our vision and work-scope
to better address the challenges of modeling renewables and energy storage at both the distributed and
bulk levels. We recognize that there is also interest in these ISOP development efforts from our
regulators and customers, as well as environmental advocates, business interest groups and other
stakeholders. Duke has initiated outreach to stakeholders in recent months, providing an overview of
the ISOP process and inviting feedback regarding a potential stakeholder engagement process to
continue the constructive dialog. It is important to note that DEC and DEP Balancing Areas include
both NC and SC resources and load obligations, and both states have benefitted from the economies
of scale from a large system with a combined planning process. As such, ISOP-related stakeholder
engagement requires both NC and SC stakeholder representatives to ensure balanced outcomes for
customers in both states. As part of the broader outreach effort, Duke will also support the NARUC-
NASEO Task Force on Comprehensive Energy Planning (CEP). The Company views this as an
important collaborative effort to support the building up and sharing of knowledge necessary to
address the challenges and opportunities of incorporating non-traditional solutions across the
respective planning disciplines within varying utility, regulatory, and market structures.

8. WESTERN CAROLINAS MODERNIZATION PROGRAM (WCMP)
The WCMP has five primary components, all of which are moving forward on schedule:
• Complete construction of two 280 MW new combined cycle natural-gas fired units at the
Asheville Plant to serve DEP’s system in NC and SC.
• Retire the Asheville Coal Plant by Jan. 31, 2020.
• Improvements to the transmission and distribution system.
• Addition of at least 15 MW of solar in DEP-West.
• Addition of at least 5 MW of energy storage in DEP-West.
In 2016, the Energy Innovation Task Force (EITF), comprised of a diverse group of community
leaders, was convened by Duke Energy Progress, City of Asheville and Buncombe County to:
1. Avoid or delay the construction of the planned contingent CT.
2. Transition DEP-West to a smarter, cleaner and affordable energy future.
As referenced in the 2018 Integrated Resource Plan, through community collaboration in DEP-
West, specifically Buncombe County, the contingent CT has been pushed out beyond the horizon
of this 15-year planning analysis.
The Energy Innovation Task Force, through its external-facing movement the Blue Horizons
Project, had great success toward both goals during 2018/2019.
Energy Efficiency and Demand-side Management
The group continues to engage and leverage grassroots networks to increase demand-side
management with both residential and non-residential customers; increase adoption and uptake in
energy efficiency programs; and make purposeful and deliberate investments in renewables and
storage.
The EnergyWise Home and Business programs continue to be priority areas to drive peak demand
reductions in the region. As evidenced in the goal results, performance on this front has been
strong. Following are some of the key drivers of this success:
1. Community advocacy: Several organizations, including those known for their advocacy of
clean and sustainable energy solutions, have visibly and tangibly advocated for local home
and business participation in EnergyWise. This grass roots support has had both direct and

indirect positive impacts on results that have been achieved. It has increased awareness that
the benefits of the programs go far beyond the financial incentives that are offered and it has
made Duke Energy’s marketing and sales efforts more effective as a result.
2. Duke Energy Marketing/Sales: Aggressive efforts to encourage EnergyWise participation
have continued. Co-branding with the Blue Horizons Project has helped make third-party
advocacy more effective. A continuation of door-to-door campaigning has also proven to be
effective.
3. Multi-Family/Rental Properties: A focused effort has been undertaken to pursue multi-family
and rental properties, which has been a relatively underperforming segment for EnergyWise
participation. Modifications to the load control switches have been made to enable installation
of these applications, and work is underway to engage directly with landlords to encourage
participation for their properties.
Additionally, in December 2018, the NCUC approved the Pay for Performance program to be
piloted in the Asheville/Buncombe County area. This work is being completed by Community
Action Opportunities and the Greenbuilt Alliance. There have been excellent results with the
diversity of measures installed and the clear need in the community.
Distributed Energy Resources
Construction is complete on the Company’s first DEP-West microgrid (solar and storage) in the
Great Smoky Mountains National Park. Construction is underway for a battery storage project
adjacent to a company-owned substation in south Asheville, near Rock Hill Road. The Company
is starting construction on a large solar/storage microgrid project in Hot Springs, N.C.
In DEP’s 2018 Integrated Resource Plan, the Company included a placeholder for 140 MW of
battery storage, of which approximately 50 MW are planned to be deployed in the Western
Carolinas. These grid-connected battery storage projects are intended to provide solutions for the
transmission and distribution systems with the possibility of simultaneously providing benefits to
DEP’s generation resource portfolio. Since the utility is ultimately responsible for system
reliability, DEP is the natural owner and operator of battery storage, which supports this critical
objective for its customers.
What’s Next
In late 2018, both Asheville (City) and Buncombe County (County) passed 100 percent
clean/renewable energy goals, joining several other local governments in North Carolina that have

set similar goals. The goals require both the City and County achieve the 100 percent targets for
operations by 2030, and for all homes and businesses by 2042.
Considering the 100 percent goals set by the City and County, the EITF determined that its
objectives should be updated to reflect achievement of the goals. The Energy Innovation Task
Force has started its work to rename itself and redirect its goals toward helping the City of
Asheville and Buncombe County meet their aggressive renewable energy goals.
The partnership between the City, County, and Duke Energy, through the EITF will be critical to
enable achievement of the very ambitious goals that have been set.

9. DEVELOPMENT OF RESOURCE PLAN
The following section details the Company’s expansion plan and resource mix that is required
to meet the needs of DEP’s customers over the next 15 years. The section also includes a
discussion of resource adequacy, the various technologies considered during the development
of the IRP, as well as, a summary of the resources required in the No Carbon Case.
Tables 9-A and 9-B represent the winter and summer Load, Capacity, and Reserves (LCR)
tables for the Base Case.

Table 9-A Load, Capacity and Reserves Table – Winter
2020 2021 2022 2023 2024 2025 2026 2027 2028 2029 2030 2031 2032 2033 2034
Load Forecast
1 DEP System Winter Peak 14,522 14,523 14,687 14,819 15,069 15,237 15,415 15,670 15,876 16,084 16,302 16,512 16,727 16,921 17,113
2 Firm Sale 150 150 150 150 150 0 0 0 0 0 0 0 0 0 0
3 Cumulative New EE Programs (48) (90) (131) (170) (226) (271) (309) (344) (375) (394) (419) (439) (451) (460) (459)
4 Adjusted Duke System Peak 14,623 14,584 14,707 14,799 14,993 14,965 15,106 15,326 15,502 15,690 15,883 16,073 16,276 16,461 16,653
Existing and Designated Resources
5 Generating Capacity 13,941 14,123 13,626 13,626 13,626 13,626 13,398 13,398 13,398 13,404 12,351 12,361 12,361 12,361 12,361
6 Designated Additions / Uprates 566 0 0 0 0 4 0 0 6 0 10 0 0 0 0
7 Retirements / Derates (384) (497) 0 0 0 (232) 0 0 0 (1,053) 0 0 0 0 (1,409)
8 Cumulative Generating Capacity 14,123 13,626 13,626 13,626 13,626 13,398 13,398 13,398 13,404 12,351 12,361 12,361 12,361 12,361 10,952
Purchase Contracts
9 Cumulative Purchase Contracts 2,193 2,599 2,470 2,429 2,152 1,971 1,407 894 552 551 550 550 547 33 32
Non-Compliance Renewable Purchases 103 35 37 39 41 42 42 39 37 36 35 35 33 33 32
Non-Renewables Purchases 2,090 2,565 2,433 2,389 2,110 1,929 1,365 855 515 515 515 515 514 0 0
Undesignated Future Resources
10 Nuclear
11 Combined Cycle 1,341 1,341
12 Combustion Turbine 470 1,880 470 940 1,410
13 Short-Term Market Purchases 200 100 200 100 500 (200) (100) (200) (100) (500)
Renewables
14 Cumulative Renewables Capacity 191 114 114 113 113 106 117 71 77 77 85 94 102 112 121
Renewables w/o Storage 191 114 114 111 111 104 104 50 48 39 39 40 40 40 40
Solar w/ Storage (Solar Component) 0 0 0 0 0 0 1 1 1 2 2 3 3 3 4
Solar w/ Storage (Storage Component) 0 0 0 2 2 2 13 20 28 36 44 52 59 68 77
15 Combined Heat & Power 0 0 0 0 0 0 0 0 0 0 0 0 0 0 0
16 Grid-connected Energy Storage 12 12 12 14 14 16 16 16 0 0 0 0 0 0 0
17 Cumulative Production Capacity 16,719 16,663 16,746 16,818 17,055 17,797 17,160 17,758 17,798 18,124 18,141 18,620 18,625 19,060 19,071
Demand Side Management (DSM)
18 Cumulative DSM Capacity 478 487 495 505 514 520 525 530 536 541 547 553 558 564 571
19 Cumulative Capacity w/ DSM 17,197 17,150 17,241 17,323 17,569 18,317 17,685 18,288 18,334 18,665 18,688 19,172 19,183 19,625 19,642
Reserves w/ DSM
20 Generating Reserves 2,574 2,567 2,534 2,525 2,577 3,352 2,580 2,962 2,833 2,975 2,805 3,100 2,908 3,164 2,988
21 % Reserve Margin 17.6% 17.6% 17.2% 17.1% 17.2% 22.4% 17.1% 19.3% 18.3% 19.0% 17.7% 19.3% 17.9% 19.2% 17.9%
Winter Projections of Load, Capacity, and Reserves
for Duke Energy Progress 2019 Annual Plan
Page 59

Table 9-B Load, Capacity and Reserves Table – Summer
2020 2021 2022 2023 2024 2025 2026 2027 2028 2029 2030 2031 2032 2033 2034
Load Forecast
1 DEP System Summer Peak 13,194 13,281 13,409 13,574 13,732 13,902 14,143 14,304 14,536 14,723 14,936 15,138 15,355 15,569 15,799
2 Firm Sale 150 150 150 150 150 0 0 0 0 0 0 0 0 0 0
3 Cumulative New EE Programs (62) (99) (134) (170) (204) (239) (276) (309) (338) (364) (385) (403) (418) (432) (440)
4 Adjusted Duke System Peak 13,283 13,332 13,424 13,554 13,679 13,663 13,867 13,995 14,198 14,359 14,551 14,735 14,937 15,136 15,360
Existing and Designated Resources
5 Generating Capacity 12,734 12,852 12,473 12,473 12,473 12,475 12,299 12,299 12,303 12,303 11,262 11,262 11,262 11,262 11,262
6 Designated Additions / Uprates 496 0 0 0 2 0 0 4 0 6 0 0 0 0 0
7 Retirements / Derates (378) (379) 0 0 0 (176) 0 0 0 (1,047) 0 0 0 0 (1,392)
8 Cumulative Generating Capacity 12,852 12,473 12,473 12,473 12,475 12,299 12,299 12,303 12,303 11,262 11,262 11,262 11,262 11,262 9,870
Purchase Contracts
9 Cumulative Purchase Contracts 2,688 3,190 3,100 3,128 2,925 2,759 1,668 1,315 1,302 1,290 1,278 1,267 1,255 759 749
Non-Compliance Renewable Purchases 722 719 765 809 844 859 843 829 817 804 793 782 771 759 749
Non-Renewables Purchases 1,967 2,471 2,335 2,319 2,080 1,899 825 485 485 485 485 485 484 0 0
Undesignated Future Resources
10 Nuclear
11 Combined Cycle 1,241 1,241
12 Combustion Turbine 426 1,278 426 852 1,278
13 Short Term Market Purchases 200 100 200 100 500 (200) (100) (200) (100) (500)
Renewables
14 Cumulative Renewables Capacity 594 507 492 492 477 462 514 493 525 553 587 623 654 693 730
Renewables w/o Storage 594 507 492 487 472 457 482 444 458 466 482 499 514 532 549
Solar w/ Storage (Solar Component) 0 0 0 3 3 3 19 29 39 51 61 72 81 93 104
Solar w/ Storage (Storage Component) 0 0 0 2 2 2 13 20 28 36 44 52 59 68 77
15 Combined Heat & Power 0 0 0 0 0 0 0 0 0 0 0 0 0 0 0
16 Grid-connected Energy Storage 12 12 12 14 14 16 16 16 0 0 0 0 0 0 0
17 Cumulative Production Capacity 16,346 16,495 16,601 16,743 17,041 17,742 16,619 17,306 17,651 17,404 17,426 17,877 17,896 18,291 18,204
Demand Side Management (DSM)
18 Cumulative DSM Capacity 917 941 960 974 982 986 990 995 1,000 1,005 1,009 1,015 1,020 1,025 1,031
19 Cumulative Capacity w/ DSM 17,263 17,436 17,561 17,717 18,022 18,728 17,609 18,301 18,651 18,408 18,435 18,891 18,915 19,316 19,235
Reserves w/ DSM
20 Generating Reserves 3,981 4,104 4,137 4,163 4,344 5,065 3,742 4,305 4,453 4,049 3,884 4,156 3,979 4,180 3,875
21 % Reserve Margin 30.0% 30.8% 30.8% 30.7% 31.8% 37.1% 27.0% 30.8% 31.4% 28.2% 26.7% 28.2% 26.6% 27.6% 25.2%
Summer Projections of Load, Capacity, and Reserves
for Duke Energy Progress 2098 Annual Plan
Page 60

DEP - Assumptions of Load, Capacity, and Reserves Table
The following notes are numbered to match the line numbers on the Winter Projections of Load, Capacity,
and Reserves table. All values are MW (winter ratings) except where shown as a percent.
1. Planning is done for the Winter peak demand for the Duke Energy Progress System.
2. Firm sale of 150 MW through 2024.
3. Cumulative energy efficiency and conservation programs (does not include demand response
programs).
4. Peak load adjusted for firm sales and cumulative energy efficiency.
5. Existing generating capacity reflecting designated additions, planned uprates, retirements and
derates as of July 1, 2019.
6. Designated Capacity Additions include:
Planned nuclear uprates totaling 26 MW in the 2020 - 2030 timeframe.
560 MW Asheville combined cycle addition in November 2019.
7. Planned Retirements include:
384 MW Asheville Coal Units 1-2 in November 2019.
497 MW Darlington CT Units 1-6, 8 and 10 by December 2020.
232 MW Blewett CT Units 1-4 and Weatherspoon CT units 1-4 in December 2024.
1,053 MW Roxboro Units 1-2 in December 2028
1,409 MW Roxboro Units 3-4 in December 2033
Planning assumptions for nuclear stations assume subsequent license renewal at the end of the
current license. 797 MW Robinson 2 is assumed to be relicensed in 2030.
All retirement dates are subject to review on an ongoing basis. Dates used in the 2019 IRP are for
planning purposes only, unless already planned for retirement.
8. Sum of lines 5 through 7.

DEP - Assumptions of Load, Capacity, and Reserves Table (cont.)
9. Cumulative Purchase Contracts including purchased capacity from PURPA Qualifying Facilities.
Additional line items are shown under the total line item to show the amounts of renewable and
traditional QF purchases.
10. New nuclear resources selected to meet load and minimum planning reserve margin
Capacity must be on-line by June 1 to be included in available capacity for the summer peak of
that year and by December 1 to be included in available capacity for the winter peak of the
following year.
No new nuclear resources were selected in the Base Case in the 15-year study period.
11. New combined cycle resources economically selected to meet load and minimum planning
reserve margin.
Capacity must be on-line by June 1 to be included in available capacity for the summer peak of
that year and by December 1 to be included in available capacity for the winter peak of the next
year.
Addition of 1,341 MW of combined cycle capacity online December 2024
Addition of 1,341 MW of combined cycle capacity online December 2026.
12. New combustion turbine resources economically selected to meet load and minimum planning
reserve margin.
Capacity must be on-line by June 1 to be included in available capacity for the summer peak of
that year and by December 1 to be included in available capacity for the winter peak of the next
year.
Addition of 470 MW of combustion turbine capacity online December 2027.
Addition of 1,880 MW of combustion turbine capacity online December 2028.
Addition of 470 MW of combustion turbine capacity online December 2030.
Addition of 940 MW of combustion turbine capacity online December 2032.

DEP - Assumptions of Load, Capacity, and Reserves Table (cont.)
Addition of 1,410 MW of combustion turbine capacity online December 2030.
13. Short-term market purchases needed to meet load and minimum planning reserve margin.
14. Resources to comply with NC REPS, NC HB 589 and SC Act 236 along with solar customer
product offerings such as Green Source and SC DER Program were input as existing resources.
The contribution to peak is subdivided into resources that do not include energy storage, and
resources (solar) that are coupled with energy storage. The contribution to peak for solar
coupled with energy storage is further subdivided into the contribution from the solar
component and contribution from the storage component.
15. No new Combined Heat and Power projects are included.
16. Addition of 113 MW (80% of usable AC capacity) of energy storage over the years 2020 through
2027.
17. Sum of lines 8 through 17.
18. Cumulative Demand Side Management programs including load control and DSDR.
19. Sum of lines 18 and 19.
20. The difference between lines 20 and 4.
21. Reserve Margin = (Cumulative Capacity-System Peak Demand)/System Peak Demand
Line 21 divided by Line 4.
Minimum winter target planning reserve margin is 17%.

Resource Adequacy
Background:
Resource adequacy refers to the ability of the electric system to supply the aggregate electrical
demand and energy requirements of the end-use customers at all times, taking into account scheduled
and reasonably expected unscheduled outages of system elements. Utilities require a margin of
reserve generating capacity in order to provide reliable service. Periodic scheduled outages are
required to perform maintenance, inspections of generating plant equipment, and to refuel nuclear
plants. Unanticipated mechanical failures may occur at any given time, which may require shutdown
of equipment to repair failed components. Adequate reserve capacity must be available to
accommodate these unplanned outages and to compensate for higher than projected peak demand due
to forecast uncertainty and weather extremes. DEP utilizes a reserve margin target in its IRP process
to ensure resource adequacy. Reserve margin is defined as total resources minus peak demand,
divided by peak demand. The reserve margin target is established based on probabilistic assessments
of resource adequacy.
2016 Resource Adequacy Study:
DEP retained Astrapé Consulting in 2016 to conduct an updated resource adequacy study.5 The
updated study was warranted to account for the extreme weather experienced in the service territory
in recent winter periods, and the significant amount of solar capacity that has been added to the system
and in the interconnection queue. Solar resources provide meaningful capacity benefits in the summer
since peak demand typically occurs in afternoon hours when the sun is shining and solar resources
are available. However, solar resources contribute very little capacity value to help meet winter peak
demands that typically occur in early morning hours.
Based on results of the 2016 resource adequacy assessment, the Company adopted a 17% minimum
winter reserve margin target for scheduling new resource additions and incorporated this planning
criterion beginning with the 2016 IRP. The Company plans to update all inputs and assumptions and
conduct a new resource adequacy study to support the development of its 2020 IRP.
5 Astrapé Consulting is an energy consulting firm with expertise in resource adequacy and integrated resource
planning. Astrapé conducted resource adequacy studies for DEC and DEP in 2012 and 2016.

Adequacy of Projected Reserves:
The IRP provides general guidance in the type and timing of resource additions. Projected reserve
margins will often be somewhat higher than the minimum target in years immediately following new
generation additions since capacity is generally added in large blocks to take advantage of economies
of scale. Large resource additions are deemed economic only if they have a lower Present Value
Revenue Requirement (PVRR) over the life of the asset as compared to smaller resources that
better fit the short-term reserve margin need.
DEP’s resource plan reflects winter reserve margins ranging from approximately 17.1% to 22.4%.
Reserves projected in DEP’s IRP meet the minimum planning reserve margin target and thus satisfy
the one day in 10 years LOLE criterion. Projected reserve margins exceed the minimum 17% winter
target by 3% or more in 2025 as a result of a large combined cycle addition. Reserves projected in
the Company’s IRP are appropriate for providing an economic and reliable power supply.
16% Winter Reserve Margin Sensitivity:
The NCUC’s April 16, 2018 Order Accepting Filing of 2017 Update Reports and Accepting 2017
REPS Compliance Plans in Docket No. E-100, Sub 147, concluded that DEC and DEP may continue
to utilize the minimum 17% winter reserve margin for planning purposes in their 2018 IRPs. The
Commission also required the Companies to present a sensitivity analysis in their 2018 IRPs that
illustrates the impact of a 16% winter reserve margin, including the specific risk impact (LOLE) of
using a 16% minimum reserve margin versus a 17% minimum reserve margin. For information
purposes, the Company has also included a 16% reserve margin scenario in its 2019 IRP.
Table 9-C below shows a comparison of DEP’s base case resource additions using a 17% winter
reserve margin compared to a scenario using a 16% winter reserve margin. As illustrated in the table,
use of a 16% reserve margin would result in changes to the short-term market purchases, a one-year
deferral of a CT block from 2031 to 2032 and a one-year deferral of a CT block from 2033 to 2034.
The reserve margins resulting from these changes are depicted in the table.
The 2016 resource adequacy study recommendation used a consensus of the DEC and DEP study
results to establish a minimum 17% winter reserve margin target for the two companies. This
minimum reserve margin target is needed to maintain an LOLE of one day in ten years (0.1 days/year).
Based on results from the 2016 study, allowing the DEP reserve margin to decline to 16% for a given
year would increase the loss of load expectation to approximately 0.13 days/year for DEP, which
equates to one expected firm load shed event approximately every 7.7 years.

Table 9-C: 16% Reserve Margin Sensitivity
Page 66

Technologies Considered
Similar to the 2018 IRP, the Company considered a diverse range of technology choices utilizing a
variety of different fuels in order to meet future generation needs in the 2019 IRP. The Company
conducted an economic screening analysis of various technologies as part of the 2019 IRP, with
changes from the 2018 IRP highlighted below.
Dispatchable (Winter Ratings)
• Base load – 782 MW Ultra-Supercritical Pulverized Coal with CCS
• Base load – 557 MW 2x1 IGCC with CCS
• Base load – 2 x 1,117 MW Nuclear Units (AP1000)
• Base load – 672 MW – 1x1x1 Advanced Combined Cycle (No Inlet Chiller and Fired)
• Base load – 1,341 MW – 2x2x1 Advanced Combined Cycle (No Inlet Chiller and Fired)
• Base load – 22 MW – Combined Heat & Power (Combustion Turbine)
• Base load – 9 MW – Combined Heat & Power (Reciprocating Engine)
• Base load – 720 MW – Small Modular Reactor (SMR)
• Peaking/Intermediate – 18 MW 2 x Reciprocating Engine Plant
• Peaking/Intermediate – 197 MW 4 x LM6000 Combustion Turbines (CTs)
• Peaking/Intermediate – 201 MW 12 x Reciprocating Engine Plant
• Peaking/Intermediate – 756 MW 2 x J-Class Combustion Turbines (CTs)
• Peaking/Intermediate – 940 MW 4 x 7FA.05 Combustion Turbines (CTs)
• Storage – 10 MW / 10 MWh Li-ion Battery
• Storage – 10 MW / 20 MWh Li-ion Battery
• Storage – 10 MW / 40 MWh Li-ion Battery
• Storage – 50 MW / 200 MWh Li-ion Battery
• Storage – 50 MW / 300 MWh Li-ion Battery
• Storage – 102 MW / 816 MWh Redox Flow Battery
• Storage – 1,400 MW Pumped Storage Hydro (PSH)
• Renewable – 75 MW Wood Bubbling Fluidized Bed (BFB, biomass)
• Renewable – 5 MW Landfill Gas
Non-Dispatchable (Nameplate)
• Renewable – 150 MW Wind - On-Shore
• Renewable – 75 MW Solar PV, Fixed-tilt (FT)
• Renewable – 75 MW Solar PV, Single Axis Tracking (SAT)
• Renewable – 75 MW Solar PV plus 20 MW / 80 MWh Li-ion Battery

Combined Cycle base capacities: Based on proprietary third-party engineering studies, the
Advanced CC saw minor increases in base load output. The 1x1x1 Advanced CC increased 5 MW
while the 2x2x1 Advanced CC increased 2 MW.
Small Modular Reactor base capacities: As described in Appendix F of the 2018 IRP, the leading
SMR design increased from 600 MW to 720 MW due to a 20% upgrade in the design. The 2019
update reflects the new 720 MW output of the proposed design.
Combustion Turbine base capacities and technologies: Based on proprietary third-party
engineering studies, the CT technologies saw a minor change in winter capacity. The most significant
change was the F-Frame CT, which increased 21 MW. Additionally, a smaller Reciprocating Engine
of 18 MW was considered in addition to the 201 MW design. The G/H-Frame CTs were not
considered in the updated IRP. However, as the Company begins the process of evaluating particular
technologies for future undesignated generation needs, these technologies, along with other new
technologies, may be considered based on factors such as generation requirements, plot size, new
environmental regulations, etc.
Energy Storage capacities and technologies: Energy storage solutions, in particular batteries,
continue to be viewed as an increasing necessity for support of grid services, including frequency
regulation, solar smoothing, and/or energy shifting from localized renewable energy sources with a
high incidence of intermittency (i.e. solar and wind). These technologies are capable of providing
resiliency benefits and economic value for the utility and its customers. Duke Energy is committed to
supporting emerging technologies that can complement more conventional technologies and is in a
prime position to optimize the investment in batteries by dispatching them in a manner that directly
benefits customers.
The updated IRP includes additional battery options, reflecting the continued change in the industry,
to allow for larger batteries with increasing durations. The additional sizes allow for greater flexibility
in deployment, and the increased capacities take advantage of economies of scale. Additionally, a
Redox Flow Battery is now considered in addition to the Lithium-Ion options. Although Redox Flow
Batteries are still in an immature state compared to Lithium-Ion batteries, the high cycling ability of
Redox Flow Batteries and longer duration of storage shows promise to meet future grid requirements.
Solar PV Capacity: Solar PV continues to evolve as the industry matures. The capacity of solar PV
was increased from 50 MW to 75 MW to reflect typical industry deployments.

Solar PV Plus Storage Capacity and Usage: Hybrid solar and storage projects have been deployed
more frequently in the last year and continue to be announced across the country. The energy storage
component of such a system can be dispatched in a variety of ways depending on price signals and
needs of the broader DEP system. For instance, during winter months, DEP’s peak demand occurs
during mornings when there is little to no solar energy being generated, but a solar facility coupled
with energy storage can store solar energy from the previous day when that energy is less valued on
the DEP system and dispatch it during those high-value, early winter morning hours. Additionally,
there is value for the battery to supplement solar energy during times of cloud cover to “smooth” the
output of the solar plus storage facility thereby reducing the effects of solar intermittency on the DEP
system. The ability for a solar plus storage facility to both shift energy and smooth output may be
limited based on the design of the hybrid facility, the terms of the battery warranty, and other
constraints. For the purposes of the 2019 Update IRP, solar PV plus storage is modeled at 75 MW
solar alongside a 20 MW battery with a 4-hour duration. This ratio of nameplate storage capacity to
nameplate solar capacity is consistent with recent projects evaluated on the DEC and DEP systems.
Expansion Plan and Resource Mix
A tabular presentation of the 2019 Base Case resource plan represented in the above LCR table is
shown below:

Table 9-D DEP Base Case Resources– Winter (with CO2)
Year
2020 Nuclear Uprates Solar Energy Storage 6 204 15
2021
2022 Energy Storage 15
2023 Solar Energy Storage 297 18
2024 Energy Storage 18
2025 Nuclear Uprates New CC Energy Storage 4 1,341 20
2026 Solar Energy Storage 34 20
2027 Solar + Storage Solar Energy Storage 37 (9) 16 20
2028 Nuclear Uprates New CT Solar + Storage 6 470 36 (9)
2029 Solar + Storage 42 (11)
2030 Solar + Storage 38 (10)
2031 Solar + Storage 40 (10)
2032
2033 Solar + Storage 45 (12)
2034 Solar + Storage 43 (11)
Notes: (1) Table includes both designated and undesignated capacity additions
(2) Incremental solar additions represent nameplate ratings and do not include solar coupled with storage
(3) Incremental Energy Storage additions represent useable AC MW capacity
(4) Solar + Storage values in ( ) represent useable AC MW storage behind solar inverter
(5) Future additions of other renewables, EE and DSM not included
(6) Table does not include short term PPA purchases in 2020 through 2024.
Solar
Solar
18
20
15
26
23
Solar
Solar
10
1410
16
22
940
560
54 (14)
1,341
470
35 (9)
203
Duke Energy Progress Resource Plan (1)
Base Case - Winter
MWResource
1880
Asheville CC
Solar Energy Storage
Solar + Storage
Nuclear Uprates
Solar
Solar
Solar
Solar
Solar
Solar
Solar + Storage
New CT
10 (2)
269 15
203
82
New CC
New CT
New CT
Solar + Storage
New CT
Page 70

Table 9-E DEP Base Case Resources (with CO2) Cumulative Winter Totals
The following charts illustrate both the current and forecasted capacity by fuel type for the DEP
system, as projected in the Base Case. As demonstrated in Chart 9-A, the capacity mix for the DEP
system changes with the passage of time. In 2034, the Base Case projects that DEP will have a smaller
percentage reliance on coal, nuclear and external purchases, and a higher reliance on gas-fired
resources, renewable resources, energy storage and EE as compared to the current state.
Nuclear 26
Solar 1,448
Solar + Storage 380 (97)
CC 3,242
CT 5,170
CHP 0
Energy Storage 141
Total 10,407
Cumulative Winter Totals - 2020 - 2034
DEP Base Case Resources

Chart 9-A 2020 & 2034 Base Case Winter Capacity Mix 7
Chart 9-B represents the energy of both the DEC and DEP Base Case over time. Due to the joint
dispatch agreement (JDA), it is prudent to combine the energy of both utilities to develop a
meaningful energy figure. From 2020 to 2034, the figure shows that nuclear resources will continue
to serve almost half of DEC and DEP energy needs, a reduction in the energy served by coal, and an
increase in the energy served by natural gas, renewables and EE.
7 EE represents incremental EE and does not reflect impacts of historical efforts.

Chart 9-B 2020 & 2034 DEC and DEP Energy – Base Case
As discussed earlier, the Company developed one additional case which represents a variation of the
Base Case that assumes no carbon regulations. The expansion plan for this case is shown below in
Table 9-F.

Table 9-F No Carbon Case - Winter
Year
2020 Nuclear Uprates Solar Energy Storage 6 204 15
2021
2022 Energy Storage 15
2023 Solar Energy Storage 297 18
2024 Energy Storage 18
2025 Nuclear Uprates New CC Energy Storage 4 1,341 20
2026 Solar Energy Storage 34 20
2027 Solar + Storage Solar Energy Storage 37 (9) 16 20
2028 Nuclear Uprates New CT Solar + Storage 6 470 36 (9)
2029 Solar + Storage 42 (11)
2030 Solar + Storage 38 (10)
2031 Solar + Storage 40 (10)
2032
2033 Solar + Storage 45 (12)
2034 Solar + Storage 43 (11)
Notes: (1) Table includes both designated and undesignated capacity additions
(2) Incremental solar additions represent nameplate ratings and do not include solar coupled with storage
(3) Incremental Energy Storage additions represent useable AC MW capacity
(4) Solar + Storage values in ( ) represent useable AC MW storage behind solar inverter
(5) Future additions of other renewables, EE and DSM not included
(6) Table does not include short term PPA purchases in 2020 through 2024.
New CT 940
New CT 1410
New CT 470
Solar + Storage 35 (9)
Solar 16
New CT Solar 1880 22
1,341
Solar + Storage 54 (14)
New CC
Solar 82
203
Solar + Storage 10 (2)
Solar 203
Solar Energy Storage 269 15
Resource MW
No CO2 Case - Winter
Asheville CC 560
Duke Energy Progress Resource Plan (1)
Solar
Solar
Solar
Solar
Solar
Solar
Nuclear Uprates 10 18
20
15
26
23
Page 74

10. DEP FIRST RESOURCE NEED
The IRP process provides a resource plan to most economically and reliably meet the projected load
requirements and a reasonable reserve margin throughout the 15-year study period. In addition to
load growth, planned unit retirements and expiring purchase power contracts contribute to the need
for new generation resources.
The resources used to meet the load requirements fall into two categories: Designated and
Undesignated. Designated resources are those resources that are in service, projects that have been
granted a Certificate of Public Convenience and Necessity (CPCN) or Certificate of Environmental
Compatibility and Public Convenience and Necessity (CECPCN), smaller capacity additions that are
a result of unit uprates that are in the Companies’ planning budget, firm market purchases over the
duration of the signed contract or DSM/EE programs.
Undesignated resources include purchase power contracts that have not yet been executed and
projected resources in the IRP that do not have a CPCN or CECPCN granted.
Additionally, firm market purchases, which include wholesale contracts, including renewable
contracts, are assumed to end at the end of the currently contracted period. There is no guarantee that
the counterparty will choose to sell, or the Company will agree to purchase its capacity after the
contracted timeframe. Beyond the contract period the seller may elect to retire the resource or sell
the output to an entity other than the Company. As such, contracted resources are deemed designated
only for the duration of their legally enforceable contract.
Further, solar renewable contracts are broken down into three categories: Designated, Mandated and
Undesignated. As discussed in Chapter 6, the definitions of each bucket are below:
• Designated: Contracts that are already connected today or those who have yet to connect but
have an executed PPA are assumed to be designated for the duration of the purchase power
contract.
• Mandated: Capacity that is not yet under contract but is required through legislation
(examples include future tranches of CPRE, the renewables energy procurement program for
large customers, and community solar under NC HB 589 as well as SC Act 236).
• Undesignated: Additional capacity projected beyond what is already designated or mandated.
Expiring solar contracts are assumed to be replaced in kind with undesignated solar additions.
Such additions could include existing providers or new facilities that enter into contracts that
have yet to be executed.
Only designated and mandated resources are considered when determining the first need for purposes
of the determination of standard offer avoided capacity rates.

Designated resources have an impact on the determination of the first resource need in the IRP. A list
of designated resources for DEP is below:
• Asheville Combined Cycle
• Designated and mandated renewable resources
• Nuclear Uprates
• Designated wholesale contracts
• DSM/EE programs
Including only the designated and mandated resources, Chart 10-A demonstrates the first need for
DEP is in 2020. To the extent current contracts under negotiation become executed and move from
an undesignated to a designated resource, the timing of the first need will change accordingly.
Chart 10-A Load Resource Balance for DEP First Need

11. SHORT-TERM ACTION PLAN
The Company’s Short-Term Action Plan, which identifies accomplishments in the past year and
actions to be taken over the next five years, is summarized below:
Continued Reliance on EE and DSM Resources
The Company is committed to continuing to grow the amount of EE and DSM resources utilized
to meet customer growth. The following are the ways in which DEP will increase these resources:
• Continue to execute the Company’s EE and DSM plan, which includes a diverse portfolio
of EE and DSM programs spanning the residential, commercial, and industrial classes.
• Continue on-going collaborative work to develop and implement additional cost-effective
EE and DSM products and services.
• Continue to seek enhancements to the Company’s EE/DSM portfolio by: (1) adding new or
expanding existing programs to include additional measures, (2) program modifications to
account for changing market conditions and new measurement and verification (M&V)
results and (3) other EE research & development pilots.
• Continue to seek additional DSM programs that will specifically benefit during winter peak
situations.
Continued Focus on Renewable Energy Resources
DEP is committed to the addition of significant renewable generation in its resource
portfolio. Supporting policies such as SC Act 236, NC REPS, NC HB 589, and the newly signed
SC Act 62 have all contributed to DEP’s aggressive plans to grow its renewable resources. DEP
is also committed to meeting its targets for the SC DER Program.
Under NC HB 589, DEP and DEC successfully procured approximately 550 MW of solar
capacity through tranche one of CPRE and intend to request another 680 MW of solar capacity in
the second tranche. The Companies also launched shared solar programs in SC and have proposed
a voluntary renewable energy program totaling 150 MW pending before the SC Commission.
These activities will be done in a manner that allows the Companies to continue to reliably and

cost-effectively serve customers’ future energy needs. For further details, refer to Chapter 6, as
well as Attachments I and II.
DEP continues to pursue CHP opportunities, as appropriate, and placeholders will be included in
future IRPs.
Integration of Battery Storage on System
The Company continues to identify locations to deploy energy storage on the DEP system. These
deployments will allow for a more complete evaluation of potential benefits to the distribution,
transmission and generation system while also providing actual operations and maintenance cost
impacts of batteries deployed at a significant scale. The Company will work with generation,
transmission and distribution departments in this evaluation process, utilizing the ISOP framework.
The goal is to optimize the location to couple localized T&D system benefits with bulk system
benefits, and to minimize cost and maximize benefits for its customers.
In line with these objectives, DEP will complete construction of a 9 MW battery storage project
adjacent to a company-owned substation in south Asheville, near Rock Hill Road that will be used to
help the electric system operate more efficiently and reliably for customers in that area. Additionally,
the company is beginning construction on a 2 MW solar / 4 MW battery storage system microgrid
project in Hot Springs, N.C. that was approved by the NCUC in May 2019. This asset will be used
to improve reliability of the Hot Springs community while also provide benefits to allow the bulk
system to operate more efficiently. There are a number of additional projects under development on
both the transmission and distribution systems. The Company also plans to further study the capacity
value of storage in the Carolinas and will include any learnings in the 2020 IRP.
Addition of Clean Natural Gas Resources
• Continue to evaluate older CTs on the DEP system. The Company is evaluating the
condition and economic viability of the older CTs on the system. In doing so, DEP is
preparing for the potential retirement of these units. This includes determining the type of
resources needed to reliably replace these units to maintain a minimum planning reserve
margin.
• Darlington CT Unit 5 was officially retired in May 2018.
• Darlington CT Units1-4, 6-8 and 10 are projected to retire in 2020.

• Weatherspoon and Blewett CT Units are projected to retire in 2024.
• Complete construction and commission the new combined cycle units at the Asheville
facility (560 MW/ 495 MW winter/summer) by year-end 2019 as part of the Western
Carolinas Modernization Project (WCMP).
• Asheville Coal Units will retire upon the commercial operation of the Asheville
combined cycle.
• Take actions to ensure capacity need beginning in the winter of 2025 is met. The 2019 IRP
continues to project that the best resources to meet this 2025 demand are combined cycle
units.
Expiration of Wholesale Purchase Contracts and Short-Term Need
The 2018 IRP reflected the impact of approximately 1,500 MW of purchase power contract
expirations by 2025. The expiration of these contracts, along with the increase in the winter peak
demand forecast and the planned retirement of nearly 500 MW of aging CT units at the Darlington
CT Complex, created a significant short-term resource need. The Company has worked diligently to
address this short-term need by issuing a Request for Proposals (RFP) resource solicitation in
2018. DEP received a significant response to the solicitation and, as a result, DEP is currently in
the process of negotiating contracts with short-listed bidders to fulfill its near-term needs.
As discussed in Section 10, contracts that have been executed as part of this solicitation as of August
1, 2019 are included as firm designated resources in this year’s IRP while others are still under
negotiation. Contracts that have yet to be executed are not included as designated resources in the
IRP and, as such, the IRP continues to reflect a resource need as early as the winter of 2020. The
Company fully expects to fill this resource gap through future execution of these contracts.
Subsequent License Renewal for Nuclear Power Plants
Duke Energy will continue to evaluate SLR for all its nuclear plants and is actively working on
DEC’s Oconee Nuclear Station SLR application to extend the licenses to 80 years. The remaining
nuclear sites will do likewise where the cost/benefit balance proves acceptable.
Continued Focus on System Reliability and Resource Adequacy for the DEP System
Based on results of the 2016 resource adequacy assessment, the Company adopted a 17% minimum
winter reserve margin target for scheduling new resource additions and incorporated this planning

criterion beginning with the 2016 IRP. The Company plans to work with the state regulatory staffs
to update all inputs and assumptions and conduct a new resource adequacy study to support the
development of its 2020 IRP.
Continued Transition Toward Integrated System & Operations Planning:
As introduced in the 2018 IRP and discussed in Chapter 7 of this Updated IRP, the traditional methods
of utility resource planning are continuing to evolve. DEP is committed to moving toward an
integrated planning process to meet the changing needs of planning in the future. The traditional
methods of utility resource planning will be enhanced through an ISOP effort.
One key goal of ISOP is for the planning models to reasonably mimic the future operational
realities to allow DEP to serve its customers with newer technologies. These enhancements in
planning are being addressed and will be incorporated over the next several years, as soon as the
modeling tools, processes and data development will allow.
Continued Focus on Evolving Regulations and Environmental Compliance:
• As of December 2013, all of DEP’s older, un-scrubbed coal units have been retired. In total, DEP has retired 1,600 MW of older vintage coal units since 2011. Additionally, over the same period, DEP has retired approximately 400 MW of older vintage fuel-oil turbines bringing total retirements to 2,000 MW.
• The 2019 IRP shows more than 1,100 MW of additional retirements over the 5-year duration of the short-term action plan with nearly 400 MW of coal being retired at the Asheville site and over 700 MW of combustion turbines being retired at the Darlington, Weatherspoon, and Blewett sites. Weatherspoon and Blewett are expected to retire in December 2024, making them unavailable for the winter of 2025. As such, they are not represented in Table 11-A. Additionally, nearly 2,500 MW of coal are expected to be retired at the Roxboro site over the remainder of the 15-year IRP horizon.
• Engage with state environmental agencies to determine the plan to implement the
Affordable Clean Energy (ACE) Rule. The ACE Rule was published by the US
EPA on July 8, 2019. The rule revokes and replaces the Clean Power Plan and
establishes a requirement for states to develop carbon dioxide emissions standards for
coal-fired electric utility generating units based on evaluation of certain heat rate
improvement (efficiency) measures. ACE requires states to submit plans to the EPA
by July 8, 2022, and facilities are required to demonstrate compliance within 2 years of
that date (July 8, 2024). Various parties (including the State of North Carolina) have filed

litigation opposing EPA’s action to replace the Clean Power Plan. However, unless the
federal courts take action to stay the rule pending judgment, states and affected industry
will be obligated to meet the deadlines established by the ACE Rule. Duke Energy does
not have sufficient information to determine the impact of the ACE Rule on its facilities.
• Continue to stay informed of changes and updates to existing and potential environmental regulations such as the Mercury and Air Toxics Standards (MATS), the
Coal Combustion Residuals Rule (CCR), the Cross-State Air Pollution Rule (CSAPR), and
the new Ozone National Ambient Air Quality Standard (NAAQS). The Company will
comply with any regulatory requirements associated with these regulations.
• Evaluate and monitor the draft NC Clean Energy Plan Issued on August 16, 2019, as it
is finalized.
Regulatory:
• Continue to monitor energy-related statutory and regulatory activities.
• Continue to examine the benefits of joint capacity planning and pursue appropriate regulatory
actions.
• Comply with all NCUC and PSCSC orders resulting from state specific legislation and
pending regulatory dockets.
A summarization of the capacity resources over the next five years for the base plan in the 2019
IRP is shown in Table 11-A below. Capacity retirements and additions are presented as
incremental values in the year in which the change is projected to impact the winter peak. The
values shown for renewable resources, EE and DSM represent cumulative totals.

Table 11-A DEP Short-Term Action Plan
Year Retirements Additions (3)
Solar (4)
Solar w/
Storage(5)
Biomass/
Hydro
Cumulative
EE DSM (6)
2020 384 MW Asheville 1-2
560 MW Asheville CC
6 MW Nuc Uprate
15 MW Energy Storage
200 MW Short-Term PPA 3,005 0 264 48 478
2021 497 MW Darlington CT 1-4, 6-8, 10
15 MW Energy Storage
100 MW Short-Term PPA 3,274 0 116 90 487
2022
15 MW Energy Storage
200 MW Short-Term PPA 3,477 0 116 131 495
2023
18 MW Energy Storage
100 MW Short-Term PPA 3,774
10 w/ 2
Storage 113 170 505
2024
18 MW Energy Storage
500 MW Short-Term PPA 3,977
10 w/ 2
Storage 112 226 514
Notes:
(1) Capacities shown in winter ratings unless otherwise noted.
(2) Dates represent when the project impacts the winter peak.
(3) Energy storage is grid-tied storage and represents total usable MW
(4) Capacity is shown in nameplate ratings and does not include solar coupled with energy storage.
(5) Solar coupled with storage; storage only charged from solar
(6) Includes impacts of grid modernization.
2019 Duke Energy Progress Short-Term Action Plan (1) (2)
Renewable Resources
(Cumulative Nameplate MW)
Page 82

12. CONCLUSIONS
DEP continues to focus on the needs of customers by meeting the growing demand in the most
economical and reliable manner possible while improving the environmental footprint of its
resource portfolio. The Company continues to improve the IRP process by determining best
practices and making changes to more accurately and realistically represent the DEP System
in its planning practices. The 2019 IRP represents a 15-year projection of the Company’s plan
to balance future customer demand and supply resources to meet this demand plus a 17%
minimum winter planning reserve margin. Over the 15-year planning horizon, DEP expects
to add 10,407 MW of generating resources in addition to the incremental EE and DSM already
in the resource plan.
The Company focuses on the needs of the short-term, while keeping a close watch on market
trends and technology advancements to meet the demands of customers in the long-term. The
Company’s short-term and long-term plans are summarized below:
Short-Term
Over the next 5 years, DEP’s 2019 IRP focuses on the following:
• Continue construction of the two new combined cycle units at the Asheville facility in the
2019 timeframe as part of the WCMP.
• Pursue investment in a limited number of battery storage projects to gain additional
operational and technical experience with evolving utility-scale storage technologies.
• Take actions to ensure short-term system capacity needs beginning in 2020 are met.
• Take necessary steps to ensure that the combined cycle capacity need in 2025 is met.
• Procure CHP resources as cost-effective and diverse generation sources, as appropriate.
• Continue to meet NC REPS, SC Act 236 and NC HB 589 compliance plans.
• Implement requirements of SC Act 62.
• Continue to invest in EE and DSM in the Carolinas region.
• Continue to seek additional DSM programs that will specifically benefit during winter peak
situations.
• Continue to transition toward Integrated System & Operations Planning.
• Conduct new resource adequacy study to support the development of 2020 IRP.
• Continue to study energy storage and solar plus storage capacity value.
• Retire Asheville coal units and Darlington 1-4, 6-8, and 10.
• Continue with plan for subsequent license renewal of existing nuclear units.

Long-Term
Beyond the next 5 years, DEP’s 2019 IRP focuses on the following:
• Continue to seek the most cost-effective, reliable resources to meet the growing customer
demand in the service territory. Currently, those are new combined cycle units and
combustion turbine units in the 15-year planning horizon.
• Continue evaluating and deploying storage and zero-emitting-load-following resources in
order to better integrate increasing levels of intermittent renewable resources on the DEP
system.
• Continue to reduce the carbon footprint of the Company’s generation portfolio.
• Continue discussions with other potential steam hosts to pursue CHP opportunities, as
appropriate.
• Continue to meet NC REPS, SC Act 236 and NC HB 589 compliance plans and invest in
additional cost-effective and diverse renewable resources.
• Continue implementing all portions of the NC HB 589 bill.
• Continue to grow and enhance cost-effective EE and DSM in the Carolinas region.
• Plan for the retirements of Weatherspoon and Blewett CTs and Roxboro 1-4 coal units.
DEP’s goal is to continue to diversify the DEP system by adding a variety of cost-effective, reliable,
clean resources to meet customer demand. Over the next 15 years, the Company projects filling the
increasing demand with investments in natural gas, renewables, storage, EE and DSM.

13. DUKE ENERGY PROGRESS OWNED GENERATION
Duke Energy Progress’ generation portfolio includes a balanced mix of resources with different
operating and fuel characteristics. This mix is designed to provide energy at the lowest reasonable
cost to meet the Company’s obligation to serve its customers. Duke Energy Progress-owned
generation, as well as purchased power, is evaluated on a real-time basis to select and dispatch the
lowest-cost resources to meet system load requirements.
The tables below list the Duke Energy Progress’ plants in service in North Carolina (NC) and
South Carolina (SC) with plant statistics, and the system’s total generating capability.
Existing Generating Units and Ratings 1, 3
All Generating Unit Ratings are as of January 1, 2019 unless otherwise noted.
Coal
Unit Winter
(MW)
Summer
(MW) Location Fuel Type Resource Type
Asheville 1 192 189 Arden, NC Coal Intermediate
Asheville 2 192 189 Arden, NC Coal Intermediate
Mayo 2 1 746 727 Roxboro, NC Coal Intermediate
Roxboro 1 380 379 Semora, NC Coal Intermediate
Roxboro 2 673 668 Semora, NC Coal Intermediate
Roxboro 2 3 698 694 Semora, NC Coal Intermediate
Roxboro 2 4 711 698 Semora, NC Coal Intermediate
Total Coal 3,592 3,544

Combustion Turbines
Unit Winter
(MW)
Summer
(MW) Location Fuel Type
Resource
Type
Asheville 3 185 160 Arden, NC Natural Gas/Oil Peaking
Asheville 4 185 160 Arden, NC Natural Gas/Oil Peaking
Blewett 1 17 13 Lilesville, NC Oil Peaking
Blewett 2 17 13 Lilesville, NC Oil Peaking
Blewett 3 17 13 Lilesville, NC Oil Peaking
Blewett 4 17 13 Lilesville, NC Oil Peaking
Darlington 1 63 50 Hartsville, SC Natural Gas/Oil Peaking
Darlington 2 61 48 Hartsville, SC Oil Peaking
Darlington 3 63 50 Hartsville, SC Natural Gas/Oil Peaking
Darlington 4 60 48 Hartsville, SC Oil Peaking
Darlington 6 62 43 Hartsville, SC Oil Peaking
Darlington 7 61 47 Hartsville, SC Natural Gas/Oil Peaking
Darlington 8 62 44 Hartsville, SC Oil Peaking
Darlington 10 65 49 Hartsville, SC Oil Peaking
Darlington 12 133 118 Hartsville, SC Natural Gas/Oil Peaking
Darlington 13 133 116 Hartsville, SC Natural Gas/Oil Peaking
Smith 4 1 189 157 Hamlet, NC Natural Gas/Oil Peaking
Smith 4 2 187 156 Hamlet, NC Natural Gas/Oil Peaking
Smith 4 3 185 155 Hamlet, NC Natural Gas/Oil Peaking
Smith 4 4 186 159 Hamlet, NC Natural Gas/Oil Peaking
Smith 4 6 187 145 Hamlet, NC Natural Gas/Oil Peaking
Sutton 4 49 39 Wilmington, NC Natural Gas/Oil Peaking
Sutton 5 49 39 Wilmington, NC Natural Gas/Oil Peaking
Wayne 1/10 192 177 Goldsboro, NC Oil/Natural Gas Peaking
Wayne 2/11 192 174 Goldsboro, NC Oil/Natural Gas Peaking
Wayne 3/12 193 173 Goldsboro, NC Oil/Natural Gas Peaking
Wayne 4/13 191 170 Goldsboro, NC Oil/Natural Gas Peaking
Wayne 5/14 195 163 Goldsboro, NC Oil/Natural Gas Peaking
Weatherspoon 1 41 31 Lumberton, NC Natural Gas/Oil Peaking
Weatherspoon 2 41 31 Lumberton, NC Natural Gas/Oil Peaking
Weatherspoon 3 41 32 Lumberton, NC Natural Gas/Oil Peaking
Weatherspoon 4 41 30 Lumberton, NC Natural Gas/Oil Peaking
Total NC 2,597 2,203
Total SC 763 613
Total CT 3,360 2,816

Combined Cycle
Unit Winter
(MW)
Summer
(MW) Location Fuel Type
Resource
Type
Lee CT1A 225 170 Goldsboro, NC Natural Gas/Oil Base
Lee CT1B 227 170 Goldsboro, NC Natural Gas/Oil Base
Lee CT1C 228 170 Goldsboro, NC Natural Gas/Oil Base
Lee ST1 379 378 Goldsboro, NC Natural Gas/Oil Base
Smith 4 CT7 194 154 Hamlet, NC Natural Gas/Oil Base
Smith 4 CT8 194 153 Hamlet, NC Natural Gas/Oil Base
Smith 4 ST4 182 169 Hamlet, NC Natural Gas/Oil Base
Smith 4 CT9 216 174 Hamlet, NC Natural Gas/Oil Base
Smith 4 CT10 216 175 Hamlet, NC Natural Gas/Oil Base
Smith 4 ST5 248 248 Hamlet, NC Natural Gas/Oil Base
Sutton
Sutton
Sutton
CT1A
CT1B
ST1
224
224
271
170
171
266
Wilmington, NC
Wilmington, NC
Wilmington, NC
Natural Gas/Oil
Natural Gas/Oil
Natural Gas/Oil
Base
Base
Base
Total CC 3,028 2,568
Hydro
Unit Winter
(MW)
Summer
(MW) Location Fuel Type
Resource
Type
Blewett 1 4 4 Lilesville, NC Water Intermediate
Blewett 2 4 4 Lilesville, NC Water Intermediate
Blewett 3 4 4 Lilesville, NC Water Intermediate
Blewett 4 5 5 Lilesville, NC Water Intermediate
Blewett 5 5 5 Lilesville, NC Water Intermediate
Blewett 6 5 5 Lilesville, NC Water Intermediate
Marshall 1 2 2 Marshall, NC Water Intermediate
Marshall 2 2 2 Marshall, NC Water Intermediate
Tillery 1 21 21 Mt. Gilead, NC Water Intermediate
Tillery 2 18 18 Mt. Gilead, NC Water Intermediate
Tillery 3 21 21 Mt. Gilead, NC Water Intermediate
Tillery 4 24 24 Mt. Gilead, NC Water Intermediate
Walters 1 36 36 Waterville, NC Water Intermediate
Walters 2 40 40 Waterville, NC Water Intermediate
Walters 3 36 36 Waterville, NC Water Intermediate
Total Hydro 227 227

Nuclear
Unit Winter
(MW)
Summer
(MW) Location Fuel Type
Resource
Type
Brunswick 2 1 975 938 Southport, NC Uranium Base
Brunswick2 2 953 932 Southport, NC Uranium Base
Harris 2 1 1009 964 New Hill, NC Uranium Base
Robinson 2 797 741 Hartsville, SC Uranium Base
Total NC 2,937 2,834
Total SC 797 741
Total Nuclear 3,734 3,575
Solar 5
Unit Winter
(MW)
Summer
(MW) Location Fuel Type
Resource
Type
NC Solar 1.4 49.3 NC Solar Intermittent
Total Generation Capability
Winter Capacity (MW) Summer Capacity (MW)
TOTAL DEP SYSTEM - N.C. 12,382 11,425
TOTAL DEP SYSTEM - S.C. 1,560 1,354
TOTAL DEP SYSTEM 13,942 12,779
Note 1: Ratings reflect compliance with NERC reliability standards.
Note 2: Duke Energy Progress completed the purchase from NCEMC of jointly owned Roxboro 4, Mayo 1,
Brunswick 1 & 2 and Harris 1units effective 7/31/2015.
Note 3: Resource type based on NERC capacity factor classifications which may alternate over the forecast
period.
Note 4: Richmond County Plant renamed to Sherwood H. Smith Jr. Energy Complex.
Note 5: Solar capacity ratings reflect contribution to winter and summer peak values.

Note 1: Capacity not reflected in Existing Generating Units and Ratings section.
Retirements
Unit & Plant
Name Location
Capacity (MW)
Winter / Summer
Fuel
Type
Retirement
Date
Cape Fear 5 Moncure, NC 148 144 Coal 10/1/12
Cape Fear 6 Moncure, NC 175 172 Coal 10/1/12
Cape Fear 1A Moncure, NC 14 11 Combustion Turbine 3/31/13
Cape Fear 1B Moncure, NC 14 12 Combustion Turbine 3/31/13
Cape Fear 2A Moncure, NC 15 12 Combustion Turbine 3/31/13
Cape Fear 2B Moncure, NC 14 11 Combustion Turbine 10/1/12
Cape Fear 1 Moncure, NC 12 11 Steam Turbine 3/31/11
Cape Fear 2 Moncure, NC 12 7 Steam Turbine 3/31/11
Darlington 5 Hartsville, SC 66 51 Combustion Turbine 5/31/18
Darlington 9 Hartsville, SC 65 50 Combustion Turbine 6/30/17
Darlington 11 Hartsville, SC 67 52 Combustion Turbine 11/8/15
Lee 1 Goldsboro, NC 80 74 Coal 9/15/12
Lee 2 Goldsboro, NC 80 68 Coal 9/15/12
Lee 3 Goldsboro, NC 252 240 Coal 9/15/12
Lee 1 Goldsboro, NC 15 12 Combustion Turbine 10/1/12
Lee 2 Goldsboro, NC 27 21 Combustion Turbine 10/1/12
Lee 3 Goldsboro, NC 27 21 Combustion Turbine 10/1/12
Lee 4 Goldsboro, NC 27 21 Combustion Turbine 10/1/12
Morehead 1 Morehead City, NC 15 12 Combustion Turbine 10/1/12
Robinson 1 Hartsville, SC 179 177 Coal 10/1/12
Robinson 1 Hartsville, SC 15 11 Combustion Turbine 3/31/13
Weatherspoon 1 Lumberton, NC 49 48 Coal 9/30/11
Weatherspoon 2 Lumberton, NC 49 48 Coal 9/30/11
Weatherspoon 3 Lumberton, NC 79 74 Coal 9/30/11
Planned Uprates
Unit Completion Date Winter
MW
Summer
MW
Brunswick 1 1 Spring 2024 4 2
Brunswick 2 1 Spring 2027 6 4
Brunswick 2 1 Spring 2029 4 2
Brunswick 2 1 Spring 2029 6 4

Retirements (cont.)
Unit & Plant
Name Location
Capacity
(MW)
Winter /
Summer
Fuel
Type Retirement Date
Unit & Plant
Name
Sutton 1 Wilmington, NC 98 97 Coal 11/27/13
Sutton 2 Wilmington, NC 95 90 Coal 11/27/13
Sutton 3 Wilmington, NC 389 366 Coal 11/4/13
Sutton GT1 Wilmington, NC 12 11 Combustion Turbine 3/1/17
Sutton GTA Wilmington, NC 31 23 Combustion Turbine 7/8/17
Sutton GTB Wilmington, NC 33 25 Combustion Turbine 7/8/17
Total 2,154 MW 1,972 MW

Planning Assumptions – Unit Retirements a, b
Unit & Plant
Name Location
Winter
Capacity
(MW)
Summer
Capacity
(MW)
Fuel Type Expected
Retirement
Asheville 1 Arden, N.C. 192 189 Coal 11/2019
Asheville 2 Arden, N.C. 192 189 Coal 11/2019
Mayo 1 Roxboro, N.C. 746 727 Coal 12/2035
Roxboro 1 Semora, N.C. 380 379 Coal 12/2028
Roxboro 2 Semora, N.C. 673 665 Coal 12/2028
Roxboro 3 Semora, N.C. 698 691 Coal 12/2033
Roxboro 4 Semora, N.C. 711 698 Coal 12/2033
Darlington 1 Hartsville, S.C. 63 52 Natural Gas/Oil 12/2020
Darlington 2 Hartsville, S.C. 64 48 Oil 12/2020
Darlington 3 Hartsville, S.C. 63 52 Natural Gas/Oil 12/2020
Darlington 4 Hartsville, S.C. 66 50 Oil 12/2020
Darlington 6 Hartsville, S.C. 62 45 Oil 12/2020
Darlington 7 Hartsville, S.C. 65 51 Natural Gas/Oil 12/2020
Darlington 8 Hartsville, S.C. 66 48 Oil 12/2020
Darlington 10 Hartsville, S.C. 65 51 Oil 12/2020
Blewett 1 Lilesville, N.C. 17 13 Oil 12/2024
Blewett 2 Lilesville, N.C. 17 13 Oil 12/2024
Blewett 3 Lilesville, N.C. 17 13 Oil 12/2024
Blewett 4 Lilesville, N.C. 17 13 Oil 12/2024
Weatherspoon 1 Lumberton, N.C. 41 32 Natural Gas/Oil 12/2024
Weatherspoon 2 Lumberton, N.C. 41 32 Natural Gas/Oil 12/2024
Weatherspoon 3 Lumberton, N.C. 41 33 Natural Gas/Oil 12/2024
Weatherspoon 4 Lumberton, N.C. 41 31 Natural Gas/Oil 12/2024
Total 4,338 4,115
Note a: Retirement assumptions are for planning purposes only; retirement dates are based on the depreciation
study approved as part of the most recent DEP rate case.
Note b: For planning purposes, the 2019 IRP Base Case assumes subsequent license renewal for existing nuclear
facilities beginning at end of current operating licenses.

Planning Assumptions – Unit Additions
Unit & Plant
Name Location
Winter
Capacity
(MW)
Summer
Capacity
(MW) Fuel Type
Expected
Commercial
Date
Asheville CC Arden, N.C. 560 495 Natural Gas 11/2019
Operating License Renewal
Planned Operating License Renewal
Unit &
Plant Name Location
Original
Operating
License
Expiration
Date of
Approval
Extended Operating
License Expiration
Blewett #1-6 1 Lilesville, NC 04/30/08 April 2015 2055
Tillery #1-4 1 Mr. Gilead, NC 04/30/08 April 2015 2055
Robinson #2 Hartsville, SC 07/31/10 04/19/2004 07/31/2030
Brunswick #2 Southport, NC 12/27/14 06/26/2006 12/27/2034
Brunswick #1 Southport, NC 09/08/16 06/26/2006 09/08/2036
Harris #1 New Hill, NC 10/24/26 12/12/2008 10/24/2046
Note 1: The license renewal for the Blewett and Tillery Plants was received in April 2015. The license extension was
granted for 40 years.

14. WHOLESALE
The following information describes the tables included in this chapter.
Wholesale Sales Contracts
This aggregated table includes wholesale sales contracts that are included in the Spring 2019 Load
Forecast.
Wholesale Purchase Contracts
This aggregated table includes all wholesale purchase contracts that are included as resources in
the 2019 IRP.

Table 14-A Wholesale Sales Contracts
2019 2020 2021 2022 2023 2024 2025 2026 2027 2028
3,750 4,107 4,100 4,148 4,199 4,249 4,045 4,095 4,043 4,094
Notes:
- For wholesale contracts, Duke Energy Progress/Duke Energy Carolinas assume all wholesale sales contracts will renew
unless there is an indication that the contract will not be renewed.
- Table represents winter capacity.
DEP Aggregated Wholesale Sales Contracts
Commitment (MW)
Page 94

Table 14-B Firm Wholesale Purchase Power Contracts
Volume of
Purchases
(MWh)
Jul 17-Jun 18
Peaking / Gas 1583 NC/SC 2,518,800
Intermediate / Gas 150 NC 1,342,585
Notes:
- Data represented above represents contractual agreements. These resources may be
modeled differently in the IRP.
Purchased Power ContractSummer Capacity
(MW)Location

15. FUEL COMMODITY PRICES
The following table provides the fuel commodity prices used in the 2019 IRP for natural gas, coal
and fuel oil.
Natural Gas Coal Fuel Oil
Year Henry Hub DEP Average Average
2020 $2.50 $2.49 $14.48
2021 $2.57 $2.52 $14.15
2022 $2.61 $2.55 $13.97
2023 $2.68 $2.63 $14.13
2024 $2.78 $2.93 $14.55
2025 $2.90 $3.24 $14.99
2026 $3.01 $3.54 $15.44
2027 $3.12 $3.85 $15.90
2028 $3.25 $4.15 $16.38
2029 $3.39 $4.45 $16.87
2030 $3.68 $4.55 $17.53
2031 $4.07 $4.67 $18.20
2032 $4.50 $4.82 $18.86
2033 $5.04 $4.93 $19.52
2034 $5.30 $5.07 $20.18
DEP Annual Average Fuel Prices, $/MMBtu

TABLE 16-A CROSS-REFERENCE TABLE
This section contains a cross-reference table, Table 16-A, that provides the document location of
information required by both NCUC and PSCSC in this 2019 IRP Update report.
REQUIREMENT: CHAPTER LOCATION:
1. Summary of significant amendments or revisions to most recently filed
biennial report (including amendments to type and size of resources
identified Chapters 2, 4
2. The electric utility’s annual update must describe the impact of the updated
base planning assumptions on the selected resource plan. Chapter 9
3. Short-Term Action Plan Chapter 11
4. REPS Compliance Plan Attachment 1
5. Renewable Energy Forecast Chapter 6
6. Most recent 10-year history and forecast of:
• Customers by each customer class
• Energy sales (mwh) by each customer class
• Utilities summer and winter peak load
Chapter 5
7. 15-year table (w/ and w/o projected supply or demand side resources) of:
• Peak loads for summer and winter seasons of each year
• Annual energy forecasts
• Reserve margins
• Load duration curves
• Effects of DR and EE programs on forecasted annual energy and peak
loads
Chapters 5, 9
8. Description of future supply-side resources including type of capacity /
resource (MW rating, fuel source, base, intermediate, or peaking) Chapter 9
9. List of existing units in service with:
• Type of fuel(s) used
• Type of unit (base, int, peak)
• Location of existing unit
• List of units to be retired with location and date
• List of units for which there are specific plans for life extension,
refurbishment, or upgrading
• Other changes to existing generating units that are expected to impact gen
capability by 10% or 10 mw
Chapter 13
10. Planned Generation Additions with:
• Type of fuel used
• Type of unit (MW rating, base, int, peak)
• Location if determined
• Summaries of analyses supporting any new gen additions included in its
15-year forecast
Chapters 9, 10, 11

REQUIREMENT: CHAPTER LOCATION:
11. List of all NUG facilities
• Facility name
• Location
• Primary fuel type
• Capacity (base, int, peak)
• Which are included in its total supply of resources
External document
12. Commodity Fuel Prices Chapter 15
13. Cumulative resource additions necessary to meet load obligation & reserve
margins Chapters 9, 10, 11, 12

LOGO
ATTACHMENT I:
The Duke Energy Progress NC Renewable Energy &
Energy Efficiency Portfolio Standard (NC REPS)
Compliance Plan

DUKE ENERGY PROGRESS NC REPS COMPLIANCE PLAN CONTENTS:
I. Introduction .................................................................................................................. 101
II. REPS Compliance Obligation ..................................................................................... 102
III. REPS Compliance Plan ............................................................................................... 103
A. Solar Energy Resources ................................................................................ 103
B. Swine Waste-to-Energy Resources .............................................................. 104
C. Poultry Waste-to Energy Resources............................................................ 107
D. General Requirement Resources ................................................................. 109
E. Summary of Renewable Resources ............................................................. 111
IV. Cost Implications of Reps Compliance Plan ............................................................. 112
A. Current and Projected Avoided Cost Rates ............................................... 112
B. Projected Total NC Retail and Wholesale Sales
and Year-End Number of Customer Accounts by Class ........................... 114
C. Projected Annual Cost Cap Comparisonof Total and
Incremental Costs, REPS Rider and Fuel Cost Impact ............................ 114
EXHIBIT A............................................................................................................................... 115
EXHIBIT B ............................................................................................................................... 123

I. INTRODUCTION
Duke Energy Progress, LLC (“DEP” or “the Company”) submits its annual Renewable Energy and
Energy Efficiency Portfolio Standard (“NC REPS” or “REPS”) Compliance Plan (“Compliance
Plan”) in accordance with NC Gen. Stat. § 62-133.8 and North Carolina Utilities Commission (“the
Commission”) Rule R8-67(b). This Compliance Plan, set forth in detail in Section II and Section III,
provides the required information and outlines the Company’s projected plans to comply with NC
REPS for the period 2019 to 2021 (“the Planning Period”). Section IV addresses the cost implications
of the Company’s REPS Compliance Plan.
In 2007, the North Carolina General Assembly enacted Session Law 2007-397 (Senate Bill 3),
codified in relevant part as NC Gen. Stat. § 62-133.8, in order to:
• Diversify the resources used to reliably meet the energy needs of consumers in the State;
• Provide greater energy security through the use of indigenous energy resources available
within the State;
• Encourage private investment in renewable energy and energy efficiency; and
• Provide improved air quality and other benefits to energy consumers and citizens of the
State.
As part of the broad policy initiatives listed above, Senate Bill 3 established the NC REPS, which
requires the investor-owned utilities, electric membership corporations or co-operatives, and
municipalities to procure or produce renewable energy, or achieve energy efficiency savings, in
amounts equivalent to specified percentages of their respective retail megawatt-hour (MWh) sales
from the prior calendar year.
Duke Energy Progress seeks to advance these State policies and comply with its REPS obligations
through a diverse portfolio of cost-effective renewable energy and energy efficiency resources.
Specifically, the key components of Duke Energy Progress’ 2019 Compliance Plan include: (1)
purchases of renewable energy certificates (“RECs”); (2) purchases of renewable biogas to generate
RECs; (3) constructing and operating Company-owned renewable facilities; (4) energy efficiency
programs that will generate savings that can be counted towards the Company’s REPS obligation;
and (5) research studies to enhance the Company’s ability to comply with its future REPS obligations.
The Company believes that these actions yield a diverse portfolio of qualifying resources and
allow a flexible mechanism for compliance with the requirements of NC Gen. Stat. § 62-133.8.

In addition, the Company has undertaken, and will continue to undertake, specific regulatory and
operational initiatives to support REPS compliance, including: (1) submission of regulatory
applications to pursue reasonable and appropriate renewable energy and energy efficiency initiatives
in support of the Company’s REPS compliance needs; (2) solicitation, review, and analysis of
proposals from renewable energy suppliers offering RECs and diligent pursuit of the most attractive
opportunities, as appropriate; and (3) development and implementation of administrative processes to
manage the Company’s REPS compliance operations, such as procuring and managing renewable
resource contracts, accounting for RECs, safely interconnecting renewable energy suppliers, reporting
renewable generation to the North Carolina Renewable Energy Tracking System (“NC-RETS”), and
forecasting renewable resource availability and cost in the future.
The Company believes these actions collectively constitute a thorough and prudent plan for
compliance with NC REPS and demonstrate the Company’s commitment to pursue its renewable
energy and energy efficiency strategies for the benefit of its customers.
II. REPS COMPLIANCE OBLIGATION
Duke Energy Progress calculates its NC REPS Compliance Obligations1 for 2019, 2020, and 2021
based on interpretation of the statute (NC Gen. Stat. § 62-133.8), the Commission’s rules
implementing Senate Bill 3 (Rule R8-67), and subsequent Commission orders, as applied to the
Company’s actual or forecasted retail sales in the Planning Period. The Company’s contracts with
wholesale customers for whom it supplied REPS compliance services terminated on December 31,
2017; therefore, this Compliance Plan only reflects REPS compliance services for DEP’s retail
customers. Table 1 below shows the Company’s retail customers’ REPS Compliance Obligation.
1 For the purposes of this Compliance Plan, Compliance Obligation is more specifically defined as Duke Energy
Progress’ native load obligations for the Company’s retail sales. The Company’s contracts with the Town of
Sharpsburg, the Town of Stantonsburg, the Town of Lucama, the Town of Black Creek and the Town of Winterville
terminated on December 31, 2017.

Table 1: Duke Energy Progress’ NC REPS Compliance Obligation
As shown in Table 1, the Company’s requirements in the Planning Period include the solar energy
resource requirement (“Solar Set-Aside”), swine waste resource requirement (“Swine Waste Set-
Aside”), and poultry waste resource requirement (“Poultry Waste Set-Aside”). In addition, the
Company must also ensure that, in total, the RECs that it produces or procures, combined with energy
efficiency savings, are an amount equivalent to 10% of its prior-year retail sales in compliance years
2019 and 2020, and 12.5% of its prior-year retail sales in compliance year 2021. The Company refers
to this as its Total Obligation. For clarification, the Company refers to its Total Obligation, net of the
Solar, Swine Waste, and Poultry Waste Set-Aside requirements, as its General Requirement.
III. REPS COMPLIANCE PLAN
In accordance with Commission Rule R8-67b(1)(i), the Company describes its planned actions to
comply with the Solar, Swine Waste, and Poultry Waste Set-Asides, as well as the General
Requirement below. The discussion first addresses the Company’s efforts to meet the Set-Aside
requirements and then outlines the Company’s efforts to meet its General Requirement in the Planning
Period.
A. SOLAR ENERGY RESOURCES
Pursuant to NC Gen. Stat. § 62-133.8(d), the Company must produce or procure solar RECs
equal to a minimum of 0.20% of the prior year’s total electric energy in megawatt-hours (MWh)
sold to retail customers in North Carolina in 2019, 2020 and 2021.
Based on the Company’s actual retail sales in 2018, the Solar Set-Aside is 77,375 RECs in 2019.
Based on forecasted retail sales, the Solar Set-Aside is projected to be approximately 75,930
RECs in 2020 and 76,250 RECs in 2021. The Company has fully satisfied and exceeded the
Compliance
Year
Previous Year
DEP Retail
Sales
(MWhs) (1)
Solar Set-
Aside
(RECs)
Swine Set-
Aside
(RECs)
Poultry Set-
Aside
(RECs)
REPS
Requirement
(%)
Total REPS
Compliance
Obligation
(RECs)
2019 38,687,268 77,375 27,081 197,318 10% 3,868,727
2020 37,964,762 75,930 26,575 253,695 10% 3,796,476
2021 38,124,840 76,250 53,375 253,695 12.5% 4,765,605
(1) Annual compliance REC requirements are determined based on prior-year MWh sales. Retail sales figures
shown for compliance years 2020 and 2021 are estimates of 2019 and 2020 retail sales, respectively.

minimum Solar Set-Aside requirements in the Planning Period through a combination of Power
Purchase Agreements and Company-owned solar facilities, including those listed below.
• Camp Lejeune Solar Facility – 13MW, located in Onslow County, placed in service in
November 2015;
• Warsaw Solar Facility – 65MW, located in Duplin County, placed in service in December
2015;
• Fayetteville Solar Facility – 23MW, located in Bladen County, placed in service in
December 2015; and
• Elm City Solar Facility – 40MW, located in Wilson County, placed in service in March
2016.
Additional details with respect to the REC purchase agreements are set forth in Exhibit A.
B. SWINE WASTE-TO-ENERGY RESOURCES
Pursuant to NC Gen. Stat. § 62-133.8(e), as amended by the North Carolina Utilities Commission
(“NCUC”) Order Modifying the Swine and Poultry Waste Set-Aside Requirement and Providing
Other Relief, Docket No. E-100, Sub 113 (October 2018), for compliance years 2019 and 2020, at
least 0.07%, and in 2021, at least 0.14%, of prior-year total retail electric energy sold in aggregate by
utilities in North Carolina must be supplied by energy derived from swine waste. The Company’s
Swine Waste Set-Aside is estimated to be 27,081 RECs in 2019, 26,575 RECs in 2020, and
53,375 RECs in 2021.
Swine waste-to-energy compliance challenges have been numerous and varied. Three paths to
the creation of swine waste-to-energy RECs have been identified, although each faces unique
challenges.
1. On-farm generation
Projects consisting of digestion and generation on a single farm or tight cluster of farms often
face gas production and feedstock agreement challenges, as well as interconnection difficulties.
The Company understands that many farms in NC are contract growers and have only limited
term agreements with the integrators. Accordingly, many contract growers are not in a position
to provide a firm supply of waste sufficient to support project financing. On July 27, 2017
Governor Cooper signed into law the “Competitive Energy Solutions for North Carolina” bill or
House Bill 589 (“HB 589”) (SL 2017-92), which includes establishing an expedited interconnection

review process for swine and poultry waste facilities that are two megawatts or less in size. This
provision should help overcome some of the interconnection difficulties projects have experienced in
the past.
2. Centralized digestion
This type of system would benefit farmers that cannot individually construct and operate an
anaerobic digester manure handling system on their own due to the capital expense or just don’t
have the number of animals required to operate a digester successfully or cost effectively. Farms
located close to each other could share the cost of the centrally located digester system. The
centralized digester operated by an individual or private company would carry out the operation
and maintenance of the digester and its mechanical systems. It would have the same advantages
as on-farm digesters of odor reduction, pathogen and weed seed destruction, biogas production
and a stable effluent ready to fertilize fields and crops. A downside with centralized digestion
exists if the liquid swine waste has to be transported to the central site. One project has overcome
this risk by co-locating the facility adjacent to a swine processing plant. The Company
recognizes that NIMBY ("Not In My Back Yard") issues may scuttle some developers' plans for
overcoming fuel supply and interconnection problems faced by more rural, on-farm projects.
3. Directed biogas
Directed biogas2 reduces costs by piping isolated methane to a central area where it is cleaned
up and injected into a natural gas pipeline and moved to large, efficient combined cycle plants
in the place of smaller, less-efficient reciprocating engines typical of other projects.
Technological advances in this field have helped drive pricing down to comparable levels of on-
site generation for swine projects. The Company has worked diligently with Piedmont Natural
Gas Company, Inc. (“Piedmont”) and other market participants to help develop specifications
for injection and contracts that developers can utilize. Continued challenges in this area include
pipeline interconnection costs, gas clean-up requirements prior to injection and the general lack
of physical proximity between clusters of farms and pipeline infrastructure.
The Company has entered into three contracts to purchase swine waste-derived directed biogas
from projects in North Carolina. One of these projects, Optima KV, successfully interconnected
3 “Directed Biogas” is defined as pipeline quality methane, injected into the pipeline system, and nominated to Duke
Energy Progress generating facilities; this methane is biogenically derived from Swine Waste, Poultry Waste, and general
Biomass sources.

with Piedmont in March 2018 and is sending biogas to DEP’s Smith Energy Complex where
swine RECs are being generated, and the other two projects are expected to come online in 2020.
The Company continues to explore opportunities for additional directed biogas in North Carolina
through discussions with developers as well as participation in a collaborative group working to
deploy renewable natural gas in Eastern North Carolina.
On June 19, 2018, the NCUC issued an Order Approving Appendix F and Establishing a Pilot
Program in Docket No. G-9, Sub 698. This Order introduces some uncertainty surrounding the future
of swine and poultry waste-derived directed biogas projects, as it establishes a three-year pilot
program where Piedmont will provide information to the NCUC regarding the impact of Alternative
Gas3 on its system operations and its customers. Piedmont and other Alternative Gas suppliers may
apply to the Commission to participate in the pilot program; however, it must be demonstrated to the
Commission that such additions will be useful in gathering the information and data sought by the
Commission. At the end of the three-year period, the Commission will consider additional
modifications to Appendix F, which sets forth the terms and conditions under which Piedmont will
accept Alternative Gas into its system, based on the experience gained during the pilot period.
Therefore, since NCUC approval is now required for any new swine or poultry-derived biogas project
to be accepted into the pilot program, there’s an additional level of uncertainty surrounding new swine
and poultry-derived directed biogas projects coming online and the timing of these projects. These
factors have presented challenges to timely project development of these resources as well as the
relatively high cost that will likely be required to ultimately develop and deliver RECs from swine
and poultry waste fuel.
In an effort to meet compliance with the Swine Waste Set Aside, the Company (1) continues
direct negotiations for additional supplies of both in-state and out-of-state resources; (2) works
diligently to understand the technological, permitting, and operational risks associated with
various methods of producing qualifying swine RECs and to aid developers in overcoming those
risks; when those risks cannot be overcome, the Company works with developers via contract
amendments to adjust for outcomes that the developers believe are achievable based on new
experience; (3) explores modifications to current biomass and set-asides contracts by working
with developers to add swine waste to their fuel mix; (4) continues pursuit of swine-derived
3 “Alternative Gas” is defined in Appendix F as gas capable of combustion in customer appliances or facilities which
is similar in heat content and chemical characteristics to natural gas produced from traditional underground well
sources and which is intended to act as a substitute or replacement for Natural Gas (as that term is defined in
Piedmont’s North Carolina Service Regulations). Alternative Gas shall include but not be limited to biogas,
biomethane, and landfill gas, as well as any other type of natural gas equivalent produced or manufactured from
sources other than traditional underground well sources.

directed biogas from North Carolina facilities to be directed to DEP’s combined cycle plants for
combustion and generation; (5) utilizes the broker market for out-of-state swine RECs available
in the market; (6) engages the North Carolina Pork Council (“NCPC”) in a project evaluation
collaboration effort that will allow the Company and the NCPC to discuss project viability, as
appropriate with respect to the Company’s obligations to keep certain sensitive commercial
information confidential; and (7) participates in the North Carolina Energy Policy Council
Biogas Working Group.
In spite of Duke Energy Progress’ active and diligent efforts to comply with its Swine Waste Set-
Aside requirements, current projections indicate that DEP will not be able to comply with the swine
waste set-aside in 2019, as existing contracts have not been able to reach contracted levels of
production, and new contracts have not come online in the timeframe originally planned. Several
swine projects are scheduled to come online over the next few years. The ability of these facilities to
achieve projected delivery requirements and commercial operation milestones will determine the
levels of compliance that DEP is able to meet in 2020 and 2021. The Company understands that swine
waste-to-energy projects have encountered difficulties in achieving the full REC output of their
contracts due to issues including local opposition to siting of the facilities, the inability to secure firm
and reliable sources of swine waste feedstock from waste producers in North Carolina, difficulties
securing project financing and technological challenges encountered when ramping up production. In
addition, after terminating two contracts for swine waste RECs since 2017 due to failure to perform,
the Company was notified by another project in January 2019 that the project will not be continuing
due to failure to operate. Due to its expected non-compliance in 2019, the Company will submit a
motion to the Commission for approval of a request to lower the 2019 compliance requirement and
delay subsequent increases by one year.
The Company remains actively engaged in seeking additional resources and continues to make every
reasonable effort to comply with the Swine Waste Set-Aside requirements. Additional details with
respect to the Company’s compliance efforts and REC purchase agreements are set forth in Exhibit
A and the Company’s semiannual progress reports, filed confidentially in Docket No. E-100,
Sub 113A.
C. POULTRY WASTE-TO-ENERGY RESOURCES
Pursuant to NC Gen. Stat. § 62-133.8(f), as amended by NCUC Order Modifying the Swine and
Poultry Waste Set-Aside Requirements and Providing Other Relief, Docket No. E-100, Sub 113
(October 2018), for calendar year 2019, at least 700,000 MWhs, and for 2020 and 2021, at least
900,000 MWhs, or an equivalent amount of energy, shall be produced or procured each year from

poultry waste, as defined per the Statute and additional clarifying Orders. As the Company’s retail
sales share of the State’s total retail megawatt-hour sales is approximately 28%, the Company’s
Poultry Waste Set-Aside is estimated to be 197,318 RECs in 2019, 253,695 RECs in 2020, and
253,695 in 2021.
In an effort to meet compliance with the Poultry Waste Set-Aside, the Company (1) continues
direct negotiations for additional supplies of both in-state and out-of-state resources with
multiple counterparties; (2) works diligently to understand the technological, permitting, and
operational risks associated with various methods of producing qualifying poultry RECs and to
aid developers in overcoming those risks; when those risks cannot be overcome, the Company
works with developers via contract amendments to adjust for more realistic outcomes; (3)
explores leveraging current biomass contracts by working with developers to add poultry waste
to their fuel mix; (4) explores adding thermal capabilities to current poultry sites to bolster REC
production; (5) explores poultry-derived directed biogas at facilities located in North Carolina
and directing such biogas to combined cycle plants for combustion and electric generation; (6)
utilizes the broker market for out-of-state poultry RECs available in the market; and (7)
participates in the North Carolina Energy Policy Council Biogas Working Group.
Duke Energy Progress is in a position to comply with its Poultry Waste Set-Aside requirement in
2019, but the Company’s ability to procure sufficient volumes of RECs to meet its pro-rata share of
the increased Poultry Waste Set-Aside requirements in 2020 and 2021 is dependent on the
performance of poultry waste-to-energy developers under current contracts, particularly achievement
of projected delivery requirements and commercial operation milestones. One new poultry facility
came online in 2018, and another is expected to come online in the third quarter of 2019. However, a
third is undergoing an outage to perform repairs, and three contracts for out-of-state poultry waste
RECs were terminated due to failure to perform or force majeure issues. DEP’s ability to comply in
2020 and 2021 is dependent on facilities producing at their contracted levels, and historical experience
indicates that facilities usually experience some start-up issues and take time to reach full expected
production levels. Ramping up to meet the increased compliance targets for 2020 - 2021 has been
problematic because suppliers have either delayed projects or lowered the volume of RECs to be
produced. The Company is, nevertheless, encouraged by the growing use of thermal poultry RECs
and the proposals that it has recently received from developers.
In order for all electric suppliers to be able to meet the state-wide poultry waste set-aside
requirement, the Company, along with the other North Carolina electric suppliers, will submit a
motion to the Commission for approval of a request to reduce the 2019 Poultry Waste Set-Aside
requirement and delay subsequent increases by one year.

The Company remains actively engaged in seeking additional resources and continues to make every
reasonable effort to comply with the Poultry Waste Set-Aside requirements. Additional details with
respect to the Company’s compliance efforts and REC purchase agreements are set forth in Exhibit
A and the Company’s semiannual progress reports, filed confidentially in Docket No. E-100,
Sub 113A.
D. GENERAL REQUIREMENT RESOURCES
Pursuant to NC Gen. Stat. § 62-133.8, DEP is required to comply with its Total Obligation by
submitting for retirement a total volume of RECs equivalent to 10% of prior-year retail sales in North
Carolina in 2019 and, 2020, and 12.5% of prior-year retail sales in North Carolina in 2021. Based on
the Company’s actual retail sales in 2018, the Total Requirement is 3,868,727 RECs in 2019. Based
on forecasted retail sales, the Total Requirement is projected to be approximately 3,796,476 RECs in
2020, and 4,765,605 RECs in 2021. This requirement net of the Solar, Swine Waste, and Poultry
Waste Set-Aside requirements, referred to as the General Requirement, is estimated to be 3,566,953
RECs in 2019, 3,440,276 RECs in 2020, and 4,382,286 RECs in 2021. The various resource options
available to the Company to meet the General Requirement are discussed below, as well as the
Company’s plan to meet the General Requirement with these resources. The Company has
contracted for, or otherwise procured, sufficient resources to meet its General Requirement in the
Planning Period. The Company submits that the actions and plans described herein represent a
reasonable and prudent plan for meeting the General Requirement.
1. Use of Solar Resources for General Requirement
Duke Energy Progress plans to meet a significant portion of the General Requirement with RECs
from solar facilities. Solar energy has emerged as a predominant renewable energy resource in the
Southeast, and the Company views the downward trend in solar equipment and installation costs over
the past several years as a positive development. As such, the Company is using solar resources to
contribute to our compliance efforts beyond the Solar Set-Aside minimum threshold for NC REPS,
and will continue to do so during the Planning Period.
i. Net Metering Facilities
Under the current Net Metering for Renewable Energy Facilities Rider offered by DEP (Rider NM-
4B), a customer receiving electric service under a schedule other than a time-of-use schedule with
demand rates shall provide any RECs to DEP at no cost. Per the NCUC’s June 2018 Order Approving
Rider and Granting Waiver Request, filed in Docket No. E-2, Sub 1106, since net metering generators
are not individually metered, DEP is permitted to estimate the RECs generated by these facilities
using the PVWatts Solar Calculator developed by the National Renewable Energy Laboratory. Thus,
DEP will follow the calculations approved by the NCUC to estimate the number of RECs generated
from net metering facilities and will use these RECs for REPS compliance.
ii. North Carolina Solar Rebate Program
North Carolina HB 589 introduced a solar rebate program, which offers incentives to residential and
nonresidential customers for the installation of small customer owned or leased solar energy facilities
participating in the Company’s net metering tariff. The incentive is limited to 10 kilowatts alternating
current (“kW AC”) for residential solar installations and 100 kW AC for nonresidential solar
installations. The program incentive shall be limited to 10,000 kW of installed capacity annually
starting January 1, 2018 and continuing until December 31, 2022. Since all customers participating
in the Solar Rebate Program must be participating in DEP’s net metering tariff, DEP retains the rights
to the RECs from these facilities, as described in the net metering section above. In addition, under
HB 589, DEP shall be authorized to recover all reasonable and prudent costs of incentives provided
to customers and program administrative costs through the REPS Rider.
2. Energy Efficiency
During the Planning Period, the Company plans to meet up to 25% of the Total Obligation with
Energy Efficiency (“EE”) savings in 2019 and 2020, and up to 40% of the Total Obligation with EE
savings in 2021, which is the maximum allowable amount under NC Gen. Stat. § 62-133.7(b)(2)c.
The Company continues to develop and offer its customers new and innovative EE programs that will
deliver savings and count towards its future NC REPS requirements. The Company has attached a list
of those EE measures that it plans to use toward REPS compliance, including projected impacts and
a description of the measure, as Exhibit B.
3. Biomass Resources
Duke Energy Progress plans to meet a portion of the General Requirement through a variety of
biomass resources, including landfill gas to energy, combined heat and power, and direct combustion
of biomass fuels. The Company is purchasing RECs from multiple biomass facilities in the Carolinas,
including landfill gas to energy facilities and biomass-fueled combined heat and power facilities, all
of which qualify as renewable energy facilities. Please see Exhibit A for more information on each of
these contracts.
Duke Energy Progress notes, however, that reliance on direct-combustion biomass remains limited in
long-term planning horizons, in part due to continued uncertainties around the developable potential

of such resources in the Carolinas and the projected availability of more cost-effective forms of
renewable resources.
4. Hydroelectric Power
Duke Energy Progress plans to use hydroelectric power from hydroelectric generation suppliers
whose facilities have received Qualifying Facility (QF or QF Hydro) status. RECs from QF Hydro
facilities will be used towards the General Requirements of Duke Energy Progress’ retail customers.
Please see Exhibit A for more information on these contracts.
5. Wind
Duke Energy Progress considers wind a potential viable option to support increased diversity of
the renewables portfolio and potentially long-term general compliance needs. While the Company
may rely upon wind resources for future REPS compliance, the extent and timing will depend on
deliverability, policy changes and market prices. Additional opportunities may exist to transmit
wind energy from out of state regions where wind is more prevalent into the Carolinas.
6. Competitive Procurement of Renewable Energy (“CPRE”)
North Carolina HB 589 introduced a competitive procurement process for adding 2,660 MW
(subject to adjustment) of additional renewable energy and capacity in the Carolinas, with
proposals issued over a 45-month period beginning on February 21, 2018, when the NCUC
approved the CPRE Program. Renewable energy facilities eligible to participate in the CPRE
solicitation(s) include those facilities that use renewable energy resources identified in G. S. § 62-
133.8(a)(8), the REPS statute. DEP plans to use the RECs acquired through the CPRE RFP
solicitations as needed for its future REPS compliance requirements and has therefore included the
planned MW allocation and timeline in its REPS compliance planning process. Please see the
CPRE Program Plan, which is included as Attachment II to this IRP, for additional information.
E. SUMMARY OF RENEWABLE RESOURCES
The Company has evaluated, procured, and/or developed a variety of types of renewable energy and
energy efficiency resources to meet its NC REPS requirements within the compliance Planning
Period. As noted above, several risks and uncertainties exist across the various types of resources and
the associated parameters of the NC REPS requirements. The Company continues to carefully
monitor opportunities and unexpected developments across all facets of its compliance requirements.

Duke Energy Progress submits that it has crafted a prudent, reasonable plan with a diversified balance
of renewable resources that will allow the Company to comply with its NC REPS obligation over the
Planning Period.
IV. COST IMPLICATIONS OF REPS COMPLIANCE PLAN
A. CURRENT AND PROJECTED AVOIDED COST RATES
The Current Avoided Energy and Capacity costs included in the table below represent key data
elements used to determine the PP (NC) tariff rates filed for DEP in Docket No. E-100, Sub 158.
The “Energy” columns reflect the cost of fuel and variable O&M per kwh embedded in the filed tariff
energy rates. The “Capacity” column is based on the installed cost and capacity rating of a combustion
turbine unit as reflected in the filed capacity rates.
The Projected Avoided Energy Costs included below reflect updated estimates of the same data
elements provided with the current costs. The capacity cost shown is a placeholder based on the
current avoided cost filing.
The avoided costs contained herein are subject to change, including (but not limited to) fuel price
projections, variable O&M estimates, turbine costs and equipment capability.

Table 2: Current and Projected Avoided Cost Rates Table
[BEGIN CONFIDENTIAL)
(END CONFIDENTIAL]
Page 113
Duke Energy Progress Integrated Resource Plan
2019 Update Report PUBLIC

B. PROJECTED TOTAL NORTH CAROLINA RETAIL SALES AND YEAR-
END NUMBER OF CUSTOMER ACCOUNTS BY CLASS
Table 3: Retail Sales
Table 4: Retail Year-end Number of Customer Accounts
C. PROJECTED ANNUAL COST CAP COMPARISON OF TOTAL AND
INCREMENTAL COSTS, REPS RIDER AND FUEL COST IMPACT
Projected compliance costs for the Planning Period are presented in the cost tables below by calendar
year. The cost cap data is based on the number of accounts as reported above.
Table 5: Projected Annual Cost Caps and Fuel Related Cost Impact
2018 Actual 2019 Forecast 2020 Forecast 2021 Forecast
Retail MWh Sales 38,687,268 37,964,762 38,124,840 38,208,829
The MWh sales reported above are those applicable to REPS compliance years 2019-2022, and represent actual MWh
sales for 2018, and projected MWh sales for 2019-2021.
2018
(Actual)
2019
(Projected)
2020
(Projected)
2021
(Projected)
Residential Accts 1,210,740 1,220,728 1,233,140 1,246,567
General Accts 195,967 198,344 199,900 199,936
Industrial Accts 1,810 1,800 1,790 1,777
The number of accounts reported above are those applicable to the cost caps for compliance years 2019-2022, and
represent the actual number of REPS accounts for year-end 2018, and the projected number of REPS accounts for year-
end 2019–2021.
2019 2020 2021
Total projected REPS compliance costs 244,072,357$ 252,126,388$ 233,984,530$
Recovered through the Fuel Rider 201,068,979$ 203,028,452$ 183,187,701$
Total incremental costs (REPS Rider) 43,003,378$ 49,097,936$ 50,796,828$
Total including Regulatory Fee 43,063,667$ 49,166,769$ 50,868,043$
Projected Annual Cost Caps (REPS Rider) 63,895,030$ 64,511,427$ 65,069,892$

EXHIBIT A
Duke Energy Progress Integrated Resource Plan
2019 Update Report PUBLIC
Duke Energy Progress, LLC's 2019 REPS Compliance Plan Duke Energy Progress' Renewable Resource Procurement from 3rd Parties
(signed contracts as of June 30, 2019)
[BEGIN CONFIDENTIAL]
Page 115

Page 116
Duke Energy Progress Integrated Resource Plan
2019 Update Report PUBLIC

Page 117
Duke Energy Progress Integrated Resource Plan
2019 Update Report PUBLIC

Page 118
Duke Energy Progress Integrated Resource Plan
2019 Update Report PUBLIC

Page 119
Duke Energy Progress Integrated Resource Plan
2019 Update Report PUBLIC

Page 120
Duke Energy Progress Integrated Resource Plan
2019 Update Report PUBLIC

Page 121
Duke Energy Progress Integrated Resource Plan
2019 Update Report PUBLIC

(END CONFIDENTIAL)
Page 122
Duke Energy Progress Integrated Resource Plan
2019 Update Report PUBLIC

EXHIBIT B
Duke Energy Progress, LLC’s 2019 REPS Compliance Plan
Duke Energy Progress, LLC's EE Programs and Projected REPS Impacts
Forecast of Annual Energy Efficiency Impacts for the REPS Compliance
Planning Period 2019-2021 (kWh)
Residential Programs 2019 2020 2021
Energy Efficient Appliances and Devices 21,361,415 21,046,461 18,501,587
Energy Education Program for Schools 3,781,055 4,083,659 4,042,979
Multi-Family Energy Efficiency 13,509,474 13,888,978 13,194,824
My Home Energy Report 99,252,843 98,147,032 103,767,203
Neighborhood Energy Saver 1,922,046 1,197,596 1,197,596
Residential Energy Assessments 5,700,445 10,905,498 11,817,810
Residential New Construction 4,963,168 2,187,745 2,297,132
Residential Smart $aver® Energy Efficiency 5,355,774 4,913,142 4,922,903
Low Income Weatherization Pay for Performance Pilot 8,714 0 0
Sub Total 155,854,935 156,370,110 159,742,034
Non-Residential Programs 2019 2020 2021
Non-Residential Smart $aver® EE Products &
Assessment 67,632,538 91,015,448 99,287,245
Non-Residential Smart $aver® Performance Incentive 325,540 3,120,818 4,340,451
Small Business Energy Saver 35,886,412 33,358,290 31,676,953
EnergyWise for Business 49,099 46,746 46,746
Sub Total 103,893,589 127,541,302 135,351,395
Combined Residential and Non-Residential Programs 2019 2020 2021
Energy Efficient Lighting 69,170,415 32,724,972 24,052,824
Sub Total 69,170,415 32,724,972 24,052,824
Total 328,918,938 316,636,384 319,146,253

DEP Energy Efficiency Programs
DEP uses the following energy efficiency (EE) programs in its IRP to efficiently and cost-effectively
alter customer demands and reduce the long-run supply costs for energy and peak demand.
Residential EE Programs
• Energy Efficient Appliances and Devices
• Energy Efficiency Education
• Multi-Family Energy Efficiency
• My Home Energy Report
• Neighborhood Energy Saver
• Residential Energy Assessments
• Residential New Construction
• Residential Smart $aver® Energy Efficiency
• Low Income Weatherization Pay for Performance Pilot
Non-Residential EE Programs
• Non-Residential Smart $aver® Energy Efficiency Products and Assessment
• Non-Residential Smart $aver® Performance Incentive
• Small Business Energy Saver
• EnergyWise for Business
Combined Residential/Non-Residential EE Programs
• Energy Efficient Lighting
Residential EE Programs
Energy Efficient Appliances and Devices Program
The Energy Efficient Appliances and Devices Program is a new program that combines DEP’s
previous “Save Energy and Water Kit” with a variety of high efficiency products available through
the Company’s Online Savings Store, including but not limited to Air Purifiers, Dehumidifiers and
LED Fixtures. The Save Energy and Water kit offers low flow water fixtures and insulating pipe tape
to residential single-family homeowners with electric water heaters. Program participants are eligible
for one kit shipped free of charge to their home. Kits are available in two sizes for homes with one
or more full bathrooms and contain varying quantities of shower heads, bathroom aerators, kitchen
aerator and insulating pipe tape.

Energy Efficiency Education Program
The Energy Efficiency Education Program is an energy efficiency program available to students in
grades K-12 enrolled in public and private schools who reside in households served by Duke Energy
Progress. The Program provides principals and teachers with an innovative curriculum that educates
students about energy, resources, how energy and resources are related, ways energy is wasted and
how to be more energy efficient. The centerpiece of the current curriculum is a live theatrical
production focused on concepts such as energy, renewable fuels and energy efficiency performed by
two professional actors.
Following the performance, students are encouraged to complete a home energy survey with their
family to receive an Energy Efficiency Starter Kit. The kit contains specific energy efficiency
measures to reduce home energy consumption and is available at no cost to student households at
participating schools. Teachers receive supportive educational material for classroom and student
take home assignments. The workbooks, assignments and activities meet state curriculum
requirements.
Multi-Family Energy Efficiency Program
The Multi-Family Energy Efficiency Program provides energy efficient lighting and water measures
to reduce energy usage in eligible multi-family properties. The Program allows Duke Energy
Progress to target multi-family apartment complexes with an alternative delivery channel. The
measures are installed in permanent fixtures by the program administrator or the property
management staff. The program offers LEDs including A-Line, Globes and Candelabra bulbs and
energy efficient water measures such as bath and kitchen faucet aerators, water saving showerheads
and pipe wrap.
My Home Energy Report Program
The My Home Energy Report (MyHER) Program provides residential customers with a comparative
usage report that engages and motivates customers by comparing energy use to similar residences in
the same geographical area based upon the age, size and heating source of the home. The report also
empowers customers to become more efficient by providing them with specific energy saving
recommendations to improve the efficiency of their homes. The actionable energy savings tips, as
well as measure-specific coupons, rebates or other Company program offers that may be included in
a customer’s report are based on that specific customer’s energy profile.
The program includes an interactive online portal that allows customers to further engage and learn
more about their energy use and opportunities to reduce usage. Electronic versions of the My Home

Energy Report are sent to customers enrolled on the portal. In addition, all MyHER customers with
an email address on file with the Company receive an electronic version of their report monthly.
Neighborhood Energy Saver (Low-Income) Program
DEP’s Neighborhood Energy Saver Program reduces energy usage through the direct installation of
energy efficiency measures within the households of income qualifying residential customers. The
Program utilizes a Company-selected vendor to: (1) provide an on-site energy assessment of the
residence to identify appropriate energy conservation measures, (2) install a comprehensive package
of energy conservation measures at no cost to the customer, and (3) provide one-on-one energy
education. Program measures address end-uses in lighting, refrigeration, air infiltration and HVAC
applications.
Program participants receive a free energy assessment of their home followed by a recommendation
of energy efficiency measures to be installed at no cost to the resident. A team of energy technicians
will install applicable measures and provide one-on-one energy education about each measure
emphasizing the benefit of each and recommending behavioral changes to reduce and control energy
usage.
Residential Energy Assessments Program
The Residential Energy Assessments Program provides eligible customers with a free in-home energy
assessment, performed by a Building Performance Institute (“BPI”) certified energy specialist and
designed to help customers reduce energy usage and save money. The BPI certified energy specialist
completes a 60 to 90 minute walk-through assessment of a customer’s home and analyzes energy
usage to identify energy savings opportunities. The energy specialist discusses behavioral and
equipment modifications that can save energy and money with the customer. The customer also
receives a customized report that identifies actions the customer can take to increase their home’s
efficiency.
In addition to a customized report, customers receive an energy efficiency starter kit with a variety of
measures that can be directly installed by the energy specialist. The kit includes measures such as
energy efficiency lighting, low flow shower head, low flow faucet aerators, outlet/switch gaskets,
weather stripping and an energy saving tips booklet.
Residential New Construction Program
The Residential New Construction Program provides incentives for new single family and multi-
family residential dwellings (projects of three stories and less) that fall within the 2012 North Carolina

Residential Building Code to meet or exceed the 2012 North Carolina Energy Conservation Code
High Efficiency Residential Option (“HERO”). If a builder or developer constructing to the HERO
standard elects to participate, the Program offers the homebuyer an incentive guaranteeing the heating
and cooling consumption of the dwelling’s total annual energy costs. Additionally, the Program
incents the installation of high-efficiency heating, ventilating and air conditioning (“HVAC”) and
heat pump water heating (“HPWH”) equipment in new single family, manufactured, and multi-family
residential housing units.
New construction represents a unique opportunity for capturing cost effective EE savings by
encouraging the investment in energy efficiency features that would otherwise be impractical or more
costly to install at a later time.
Residential Smart $aver® Energy Efficiency Program
The Residential Smart $aver® EE Program offers DEP customers a variety of energy conservation
measures designed to increase energy efficiency in existing residential dwellings. The Program
utilizes a network of participating contractors to encourage the installation of: (1) high efficiency
central air conditioning (AC) and heat pump systems with optional add on measures such as Quality
Installation and Smart Thermostats, (2) attic insulation and sealing, (3) heat pump water heaters, and
(4) high efficiency variable speed pool pumps.
The prescriptive menu of energy efficiency measures provided by the program allows customers the
opportunity to participate based on the needs and characteristics of their individual homes. A referral
channel provides free, trusted referrals to customers seeking reliable, qualified contractors for their
energy saving home improvement needs.
Low Income Weatherization Pay for Performance Pilot
The Low Income Weatherization Pay for Performance Pilot was designed to provide payments, based
on kilowatt-hour ("kWh") savings, to local non-profit organizations that provide weatherization and
other energy saving upgrades to residential low-income households. These payments are intended to
assist the organizations in expanding the number of customers they serve through their programs. The
Pilot is also intended to leverage funding from other third-party sources. The Company is proposing
that this Pilot remain in place for thirty-six months and begin in Buncombe County, North Carolina.

Non-Residential EE Programs
Non-Residential Smart $aver® Energy Efficient Products and Assessment Program
The Non-Residential Smart $aver® Energy Efficient Products and Assessment Program provides
incentives to DEP commercial and industrial customers to install high efficiency equipment in
applications involving new construction and retrofits and to replace failed equipment.
Commercial and industrial customers can have significant energy consumption but may lack
knowledge and understanding of the benefits of high efficiency alternatives. The Program provides
financial incentives to help reduce the cost differential between standard and high efficiency
equipment, offer a quicker return on investment, save money on customers’ utility bills that can be
reinvested in their business, and foster a cleaner environment. In addition, the Program encourages
dealers and distributors (or market providers) to stock and provide these high efficiency alternatives
to meet increased demand for the products.
The program provides incentives through prescriptive measures, custom measures and technical
assistance.
• Prescriptive Measures: Customers receive incentive payments after the installation of
certain high efficiency equipment found on the list of pre-defined prescriptive measures,
including lighting; heating, ventilating and air conditioning equipment; and refrigeration
measures and equipment.
• Custom Measures: Custom measures are designed for customers with electrical energy
saving projects involving more complicated or alternative technologies, whole-building
projects, or those measures not included in the Prescriptive measure list. The intent of the
Program is to encourage the implementation of energy efficiency projects that would not
otherwise be completed without the Company’s technical or financial assistance. Unlike the
Prescriptive portion of the program, all Custom measure incentives require pre-approval prior
to the project implementation.
• Energy Assessments and Design Assistance: Incentives are available to assist customers
with energy studies such as energy audits, retro commissioning, and system-specific energy
audits for existing buildings and with design assistance such as energy modeling for new
construction. Customers may use a contracted Duke Energy vendor to perform the work or
they may select their own vendor. Additionally, the Program assists customers who identify
measures that may qualify for Smart $aver Incentives with their applications. Pre-approval is
required.

Non-Residential Smart $aver® Performance Incentive Program
The Non-Residential Smart $aver® Energy Efficient Products and Assessment Program offers
financial assistance to qualifying commercial, industrial and institutional customers to enhance their
ability to adopt and install cost-effective electrical energy efficiency projects. The Program
encourages the installation of new high efficiency equipment in new and existing nonresidential
establishments as well as efficiency-related repair activities designed to maintain or enhance
efficiency levels in currently installed equipment. Incentive payments are provided to offset a portion
of the higher cost of energy efficient installations that are not eligible under either the Smart $aver®
Prescriptive or Custom programs. The Program requires pre-approval prior to project initiation.
The types of projects covered by the Program include projects with some combination of unknown
building conditions or system constraints, or uncertain operating, occupancy, or production schedules.
The intent of the Program is to broaden participation in non-residential efficiency programs by being
able to provide incentives for projects that previously were deemed too unpredictable to calculate an
acceptably accurate savings amount, and therefore ineligible for incentives. This Program provides
a platform to understand new technologies better. Only projects that demonstrate that they clearly
reduce electrical consumption and/or demand are eligible for incentives.
The key difference between this program and the custom component of the Non-Residential Smart
$aver® Energy Efficient Products and Assessment program is that Performance Incentive participants
get paid based on actual measure performance, and involves the following two-step process.
• Incentive #1: For the portion of savings that are expected to be achieved with a high degree
of confidence, an initial incentive is paid once the installation is complete.
• Incentive #2: After actual performance is measured and verified, the performance-based
part of the incentive is paid. The amount of the payout is tied directly to the savings
achieved by the measures.
Small Business Energy Saver Program
The Small Business Energy Saver Program reduces energy usage through the direct installation of
energy efficiency measures within qualifying non-residential customer facilities. Program measures
address major end-uses in lighting, refrigeration, and HVAC applications. The program is available

to existing non-residential customers that are not opted-out of the Company’s EE/DSM rider and have
an average annual demand of 180 kW or less per active account.
Program participants receive a free, no-obligation energy assessment of their facility followed by a
recommendation of energy efficiency measures to be installed in their facility along with the projected
energy savings, costs of all materials and installation, and up-front incentive amount from Duke
Energy Progress. The customer makes the final determination of which measures will be installed
after receiving the results of the energy assessment. The Company-authorized vendor schedules the
installation of the energy efficiency measures at a convenient time for the customer, and electrical
subcontractors perform the work.
EnergyWise for Business Program
EnergyWise for Business is both an energy efficiency and demand response (“DR”) program for non-
residential customers. Program participants can choose between a Wi-Fi thermostat or load control
switch that will be professionally installed for free on each air conditioning or heat pump unit. The
Wi-Fi thermostat option provides both EE and DR savings opportunities, while the load control switch
option only offers DR savings capability. Only the EE component of the program is assumed to
provide energy savings.
• EE Component
Participants choosing the thermostat will be given access to a portal that will allow them to set
schedules, adjust the temperature set points, and receive energy conservation tips and
communications from DEC. In addition to the portal access, participants will also receive
conservation period notifications, so they can make adjustments to their schedules or notify
their employees of the upcoming conservation periods.
• DR Component
The DR portion of the program allows DEC to reduce the operation of participants’ air
conditioning units to mitigate system capacity constraints and improve reliability of the power
grid. In addition to equipment choice, participants can also select the cycling level they prefer
(i.e., a 30%, 50% or 75% reduction of the normal on/off cycle of the unit). During a
conservation period, DEC will send a signal to the thermostat or switch to reduce the on time
of the unit by the cycling percentage selected by the participant. Participating customers will
receive a $50 annual bill credit for each unit at the 30% cycling level, $85 for 50% cycling, or
$135 for 75% cycling. Participants that have a heat pump unit with electric resistance
emergency/back up heat and choose the thermostat can also participate in a winter option that
allows control of the emergency/back up heat at 100% cycling for an additional $25 annual bill
credit. Participants will also be allowed to override two conservation periods per year.

Combined Residential/Non-Residential Customer Programs
Energy Efficient Lighting Program
The Energy Efficient Lighting Program partners with lighting manufacturers and retailers across
North and South Carolina to provide marked-down prices at the register to DEP customers purchasing
energy efficient lighting products. Starting in 2017, the Program removed CFLs and only offers LEDs
and energy-efficient fixtures.
As the program enters its eighth year, the DEP Energy Efficient Lighting Program will continue to
encourage customers to adopt energy efficient lighting through incentives on a wide range of energy
efficient lighting products. Customer education is imperative to ensure customers are purchasing the
right bulb for the application in order to obtain high satisfaction with lighting products and subsequent
purchases.

LOGO
ATTACHMENT II:
The Duke Energy Progress Competitive Procurement
of Renewable Energy (CPRE) Plan

Duke Energy Carolinas, LLC’s & Duke Energy Progress, LLC’s Competitive Procurement of
Renewable Energy (CPRE) Program Plan Update September 1, 2019
Introduction
In accordance with North Carolina Utilities Commission (“NCUC” or the “Commission”) Rule
R8-71(g), Duke Energy Carolinas, LLC (“DEC”), and Duke Energy Progress, LLC (“DEP” and
together with DEC, “Duke Energy” or “the Companies”) provide this update to the Program Plan
for the Companies’ Competitive Procurement of Renewable Energy (“CPRE”) Program
(“Program”).
The CPRE Program is being implemented pursuant to N.C. Gen. Stat. § 62-110.8, as enacted by
North Carolina Session Law 2017-192 (“HB 589”). This updated Program Plan presents the
Companies’ current plans for implementing the CPRE Program. The following provides a brief
summary of significant events since the Program Plan was filed on September 1, 2018, in Docket
Nos. E-2, Sub 1159 and E-7, Sub 1156, as part of the annual Integrated Resource Plan filing.
On January 9, 2018, the NCUC approved Accion, Inc. to act as the independent administrator
(“IA”) of the CPRE Program by its Order Approving the Independent Administrator of the CPRE
Program in Docket No. E-100, Sub 151.
On February 21, 2018, the NCUC issued its Order Modifying and Approving Joint CPRE
Program. The Order directed certain modifications to the initial Program Guidelines, which were
incorporated into the CPRE Tranche 1 RFP documents that served as the Companies’ Guidelines
for purposes of the Tranche 1 RFP.1
On June 25, 2018, the NCUC issued its Order Denying Joint Motion, Approving Pro Forma PPA,
and Providing Other Relief, specifically approving Duke Energy’s final Tranche 1 PPA. The
Companies then issued the final RFP to the IA on July 5, 2018, as required by section (f)(1)(vi).
On July 10, 2018, the IA issued the final Tranche 1 RFP documents opening the RFP to bids. The
Tranche 1 submission period closed on October 9, 2018 and winning bids were announced on
April 9, 2019
On July 2, 2019, the NCUC issued its Order Modifying and Accepting CPRE Program Plan
establishing a timeline for Tranche 2 without significant departure from the Tranche 1 framework
1 As explained in the Companies’ letter filed on May 11, 2018, the Tranche 1 RFP summary document constituted the updated CPRE Program Guidelines as required under Rule R8-71(f)(1)(ii) and conformed with the requirement
of the Commission’s Program Order to modify the initial CPRE Program Guidelines.

On July 8, 2019 the contracting period for Tranche 1 closed.
The acceptance of proposals for Tranche 2 shall open on October 15, 2019 and close on December
15, 2019 subject to adjustment depending on the timing of the issuance of a final order in the Sub
158 Proceeding.
1. CPRE Compliance Plan
1.1. Implementation of Aggregate CPRE Program requirements
Under N.C. Gen. Stat. § 62-110.8(a), the Companies are responsible for procuring renewable
energy and capacity through a competitive procurement program in a manner that allows the
Companies to continue to reliably and cost-effectively serve customers’ future energy needs. The
Companies are required to procure energy and capacity from renewable energy facilities in the
aggregate amount of 2,660 MW (“Initial Targeted Amount”) through requests for proposals
(“RFPs”). The CPRE RFPs must be reasonably allocated over a term of 45 months beginning with
the Commission approval of the CPRE Program on February 21, 2018.
Renewable energy facilities eligible to participate in the CPRE RFPs include those facilities that
use renewable energy resources identified in N.C. Gen. Stat. § 62-133.8(a)(8) but are limited to a
nameplate capacity rating of 80 MW or less that are placed in service after the date of the electric
public utility's initial competitive procurement. The renewable energy facilities to be developed or
acquired by the Companies or procured from a third party through a power purchase agreement
under the CPRE Program must also deliver to the Companies all of the environmental and
renewable attributes associated with the power.
The Companies can satisfy the CPRE Program requirements through any of the following:
(i) Renewable energy facilities to be acquired from third parties and subsequently owned
and operated by the Companies;
(ii) Self-developed renewable energy facilities to be constructed, owned, and operated by
the Companies up to a 30% cap identified in N.C. Gen. Stat. § 62-110.8(b)(4)2; or
(iii) The purchase of renewable energy, capacity, and environmental and renewable
attributes from renewable energy facilities owned and operated by third parties that commit
to allow the Companies rights to dispatch, operate, and control the solicited renewable
energy facilities in the same manner as the Companies’ own generating resources.
2 The Companies voluntarily agree to recognize both Self-developed Proposals, as well as third-party PPA Proposals
offered by any Duke Energy affiliate bid into the CPRE RFP Solicitation(s), as being subject to the 30% cap.

Per N.C. Gen. Stat. § 62-110.8(b), electric public utilities may jointly or individually implement
these aggregate competitive procurement requirements. The Companies plan to continue to jointly
implement the CPRE Program.
1.2. Projected Uncontrolled Renewable Energy Generating Capacity
N.C. Gen. Stat. § 62-110.8(b)(1) provides that if prior to the end of the initial 45-month competitive
procurement period, the Companies have executed PPAs and interconnection agreements for
renewable energy and capacity within their Balancing Authorities (“BAs”) that are not subject to
economic dispatch or curtailment and were not procured pursuant to N.C. Gen. Stat. § 62-159.2
(“Transition MW Projects”) having an aggregate capacity in excess of 3,500 MW, the Commission
shall reduce the competitive procurement aggregate amount by the amount of such exceedance. If
the aggregate capacity of such Transition MW Projects is less than 3,500 MW at the end of the
initial 45-month competitive procurement period, the Commission shall require the Companies to
conduct an additional competitive procurement in the amount of such deficit.
As of the end of July 2019, approximately 3,665MW of Transition MW Projects are installed or
under construction, creating an excess of approximately 165 MW. Note, at time the initial Program
Plan was filed in November, 2017, approximately 2,900 MW of Transition MW Projects was
installed or under construction.
Error! Reference source not found. specifies additional projects that may contribute to the
Transition MWs but do not have both a signed IA and a signed PPA. The range was derived based
on applying a materialization factor to the projects that have an established LEO to sell to the
Companies. This includes many MW from certain settlement agreements that enabled certain
projects to retain the rights to previously established LEO’s from older avoided cost dockets. This
increase in the number of MW that have reached settlement agreements is the primary cause of the
significant increase in the projected total number of Transition MWs. As previously noted, a
project must have executed a PPA and an Interconnection Agreement prior to the end of the CPRE
Procurement Period in order to qualify as a Transition MW. Given the uncertainty about the
number of projects that will satisfy the statutory criteria, the Companies are currently projecting a
range for total Transition MW of 4,300 to 4,900. Note that some percentage of these potential
Transition MW may not be counted as Transition MW due to delays in the Interconnection process,
but may still be constructed after the CPRE Program has concluded.

Figure 1. Potential Transition MW’s
*Includes projects with a signed PPA, but no IA as well as projects with a LEO but no PPA. The
upper end of the range is based on Duke’s estimates of materialization rates for these projects.
Lower end of range is a more conservative view of materialization rates and intended to bound
potential outcomes.
The updated estimate for the Transition MWs shows that the Companies procurement through
CPRE will be less than the initial 2,660 MW target. Note that the Companies’ projections have
assumed that there will be no re-allocation of capacity to the CPRE program for unsubscribed MW
under G.S. 62-159.2 (Renewable Energy Procurement for Major Military Installations, Public
Universities and Other Large Customers).
1.3. Tranche 1 Results
On April 9, 2019 the Independent Administrator completed the selection process and delivered
final status notifications to each Market Participant in Tranche 1 of the CPRE RFP. The
contracting period for Tranche 1 concluded on July 8, 2019. Below is a summary of results for
DEC and DEP:
600 MW DEC Request
▪ 58 proposals ranging from 7 to 80 MW-AC totaling 2,733 MW
▪ Median proposal was 50 MW
▪ All proposals were solar, 3 included storage
▪ 1,416 MW proposed in NC, 1,317 MW in SC
▪ 11 projects were contracted totaling 465 MW
▪ 9 in NC totaling 415 MW; 2 in SC totaling 50 MW
▪ 2 projects included battery energy storage
Consolidated Transition Summary DEC DEP Total
Solar Connected 676 2,407 3,083
Non-Solar Connected 83 96 179
Additional Solar with a PPA/IA 91 312 403
Sub-Total 850 2,815 3,665
Potential Additional MW's* 350 to 480 265 to 780 615 to 1260
Total ~1,200 to 1,300 ~3,100 to 3,600 ~4,300 to 4,900

▪ 2 DEC utility-owned projects selected (94 MW) and 3 Duke affiliate (Duke Energy
Renewables “DER”) projects selected (95 MW)
▪ Average all in delivered price ~$37.75; estimated savings versus avoided cost of
$247.8 million over 20 year term
80 MW DEP Request
▪ 20 proposals ranging from 7 to 80 MW-AC totaling 1,231 MW
▪ Median proposal was 75 MW
▪ All proposals were solar, 1 included storage
▪ 617 MW proposed in NC, 614 MW in SC
▪ 2 projects were contracted totaling 87 MW
▪ 1 in NC totaling 80 MW; 1 in SC totaling 7 MW
▪ Average all in delivered price ~$38.31; estimated savings versus avoided cost of
$33.17 million over 20-year term
1.4. Planned RFP Solicitations
1.5. Allocations of Resources
As prescribed by N.C. Gen. Stat. § 62-110.8(c), the Companies have the authority to determine
the location and allocated amount of each CPRE RFP, as well as the CPRE Total Obligation to be
procured within their respective service territories taking into consideration:
(i) the State's desire to foster diversification of siting of renewable energy resources
throughout the State;
(ii) the efficiency and reliability impacts of siting of additional renewable energy facilities
in each public utility's service territory; and
(iii) the potential for increased delivered cost to a public utility's customers as a result of
siting additional renewable energy facilities in a public utility's service territory, including
additional costs of ancillary services that may be imposed due to the operational or
locational characteristics of a specific renewable energy resource technology, such as non-
dispatchability, unreliability of availability, and creation or exacerbation of system
congestion that may increase redispatch costs.
The Companies are currently planning to allocate and procure the CPRE Program Total Obligation
through the Tranche 1-3 CPRE RFP Solicitations, discussed above, by soliciting the amounts of
Renewable Energy Resource capacity shown in Error! Reference source not found.. The total

solicitation is impacted by the amount of Transition MWs. The calculation of potential additional
Transition MWs is dynamic and uncertain so Figure 2 shows a range of potential solicitations for
Tranche 3.
Figure 2. Planned CPRE Solicitation Targets by Tranche
DEC
(Approximate MW)
DEP
(Approximate MW)
Tranche 1 - Contracted 465 86
Tranche 2 - Issued 600 80
Tranche 3 0 to 570* 0 to 80*
Total 1,065 to 1635 166 to 246
*If all potential additional Transition MWs materialize then Tranche 3 may not be
necessary. The upper end of the range represents a low materialization estimate for
potential additional transition MWs
This allocation reflects the same consideration that informed the Companies’ initial allocation of
MW as described in the Companies’ initial Program Plan. The Companies’ system operational
experience integrating additional renewable energy resource capacity into the DEC and DEP BAs
and distribution and transmission system operations, will inform the manner in which future CPRE
Program Plans propose to allocate the remaining CPRE Program Procurement between the DEC
and DEP service territories. As a result, the planned CPRE solicitation targets for DEC and DEP
shown in Figure 2 are subject to change.
The Companies took into consideration the following factors prescribed by N.C. Gen. Stat. § 62-
110.8(c) when establishing the allocation of MWs to DEC an DEP:
(i) Fostering Diversification of Siting of Additional Renewable Energy Resources3
The Companies’ primary objective is to procure cost-effective renewable energy resource facilities
that allow DEC and DEP to reliably dispatch, operate, and control the facilities in the same manner
as utility-owned generating resources, while diversifying the siting of renewable energy facilities
across the Companies’ BAs. The CPRE Program recognizes the State’s desire to foster
diversification of additional renewable energy facilities and to more effectively integrate additional
3 All Proposals bid into the Tranche 1 CPRE RFP Solicitation were utility-scale solar generating facilities. The
Companies have primarily analyzed the need for additional diversification of siting for utility-scale solar resources.
The Companies may consider the need to analyze diversification of siting of other renewable energy resource
technologies in future CPRE Program Plans, depending on interest from other technologies in the Tranche 2 CPRE
RFP Solicitation.

utility-scale solar and other resources into the Companies’ system operations. The Companies have
developed the CPRE Program Plan allocations to meet the goals of diversifying the locations and
avoiding inefficient or unreliable over-concentration of additional renewable energy facilities, and
improving planning for the siting of additional facilities across the Companies’ BAs and within
their respective service territories throughout North Carolina and South Carolina.
Adding CPRE Utility-Scale Solar in DEC will Foster Improved Diversification as Existing Utility-
Scale Solar is Concentrated in DEP
DEP is a smaller BA than DEC. In 2017, the DEC winter peak load was approximately 16,700
MW in comparison to the DEP winter peak load of approximately 14,200 MW, as seen in Figure
3.
Figure 3. 2017 Peak Load by BA4
While DEP is a smaller BA, the Companies have experienced a significantly greater concentration
of utility-scale solar development in DEP compared to DEC. As of August 6, 2019, the Companies
are contractually obligated to purchase from third-party owners approximately 3,748 MW of solar
under REPS and legacy PURPA contracts, in addition to 225 MW of utility-owned solar, and
excluding CPRE Tranche 1 contracts. As shown in Error! Reference source not found., this
utility-scale solar growth has been especially significant in DEP, where approximately 80% of the
total non-CPRE MWs under contract are located.
4 Peak demand values shown in Error! Reference source not found. are for 2017 winter peak production demand
allocators from the 2018 Cost of Service study.

If the total solar energy capacity in DEC and DEP were to be spread across the service territories
based on their respective utilities’ peak load, the DEC service territory should have approximately
60% of the solar energy capacity rather than its current ~20%.
To achieve the goals of diversifying the siting of renewable energy facilities throughout the
Companies’ service territories in a manner that promotes efficiency, reliability, and mitigates cost
impact on the Companies’ customers, the Companies’ Tranche 1 RFP, as well as the planned total
CPRE Program procurement allocation (provided in Error! Reference source not found.), seeks
proposals primarily in the DEC service territory in North Carolina and South Carolina. If the
Transition MW proceed as expected and the CPRE targets are met with primarily or all solar
capacity, the resulting composition is a more balanced split of solar capacity between DEC and
DEP.
Figure 4. Solar Capacity under Contract as of August 6, 2019
(ii) System Operations and Reliability Impacts
In developing the proposed allocation of CPRE Program resources between the DEP and DEC
service territories, the Companies also considered the operational efficiency and reliability impacts
of siting additional renewable energy facilities within the DEC and DEP BAs. The highly
concentrated levels of uncontrolled legacy PURPA contract solar that are currently installed, under
construction, and under contract to be installed in the DEP BA has caused the Companies to

primarily allocate the planned CPRE Program procurement towards the larger DEC BA, where
significantly less utility-scale solar is installed today. The Companies’ planned CPRE Program
allocation between the DEC and DEP BAs is also supported by the growing levels of operationally
excess energy and increasingly steep ramping requirements in the DEP BA.
Independent BA System Operations Basics
DEP and DEC are each independent BAs responsible for maintaining compliance with North
American Electric Reliability Corporation (“NERC”) reliability standards to ensure reliable
operations on their systems, as well as managing power flows between their systems and other
utility systems. DEP and DEC must independently control their respective network resources to
meet system loads and maintain compliance with reliability regulations within their separate BAs.
Each BA must independently comply with NERC’s mandatory Reliability Standards on a unified
basis across the entire BA that encompasses territory in both North Carolina and South Carolina.
DEP’s and DEC’s system operators independently plan and operate each BA’s generating
resources to reliably meet increasing and decreasing intra-day and day-ahead system loads within
reliability and generating unit availability and operating limits. These reliability requirements
place the burden on the DEP and DEC BAs to balance generation resources (including new
dispatchable CPRE renewable energy facilities), unscheduled energy injections (existing QF and
renewable energy contracts), and load demand in real-time, all of which is essential to providing
reliable firm native load service. To meet this objective, DEP and DEC must independently plan
for and maintain a “Security Constrained Unit Commitment” of baseload and load-following
assets, regulation resources, operating reserves, and spinning reserves, working together to ensure
real-time frequency support and balancing.
The Companies’ baseload5 and must-run regulation units6 represent the foundational resources
necessary to meet load requirements, provide reliability, and meet mandatory NERC Reliability
Standards. In the aggregate, the operationally constrained minimum reliable output of these
generators represents the Lowest Reliability Operating Level (“LROL”) of the BA’s Security
Constrained Unit Commitment. These essential generating resources cannot be de-committed in
real time nor on an intra-day basis, because they must run within specified engineering levels and
provide essential frequency and regulation support to the BA, and because they are needed to meet
upcoming peak demands, such as the evening peak demands and next day peak demands. The
5 The Companies’ baseload units are firm native load generating resources such as nuclear, coal, and large natural gas
combined cycle units that form the foundation of reliable service to meet the core system demand. 6 Must-run regulation and regulation reserves resources are generating resources that must run to provide load
balancing regulation and frequency regulation support to maintain reliability by supporting system frequency to the
required target of 60 Hz in compliance with mandatory NERC Reliability Standards.

LROL represents the level on the BA at which continued energy injections into the BA above the
BA’s load causes the BA to have operationally excess energy.7
As has been discussed in recent avoided cost and IRP filings and in the initial CPRE plan filed in
November, 2017, integration of additional solar is increasingly causing operationally excess
energy and extreme ramping events in DEP. Further increases of solar generation in the DEP BA
will continue to increase the risk of future potential NERC noncompliance and associated
reliability risks, unless DEP has adequate dispatch control rights to proactively plan and dispatch
generation resources on its system. Continued addition of solar generation in the DEP BA will
exacerbate existing reliability challenges and increase the potential future risks of NERC
noncompliance. The DEP BA’s growing experience managing operationally excess energy and
increasingly steep ramping requirements as additional unscheduled and uncontrolled solar
generation comes online will also increase the likelihood of emergency curtailment in DEP. DEC
currently is better positioned to accommodate additional solar resources without creating routine
instances of operationally excess energy. However, DEC will also eventually face similar issues
with operationally excess energy and ramping as additional solar generation is added to the system.
This further strengthens the importance of the additional contractual curtailment rights available
to DEC and DEP for the CPRE facilities.
(iii) Potential for Increased Delivered Cost; Ancillary Services
The Companies have evolved and will continue to evolve the modeling necessary to quantify the
increased delivered costs and additional ancillary services needed to maintain NERC Balancing
Authority compliance due to siting additional renewable energy facilities in DEC or DEP. Based
on the prior two factors discussed, the vast majority of the MW’s to be procured through CPRE
have been allocated to DEC, however this third factor may influence future decisions to further
adjust this allocation.
Allocation of Resources
In summary, the growing concentration of legacy PURPA solar facilities installed in the DEP BA,
associated operational challenges and reliability risks on the DEP system and growing risks of
uncompensated system emergency curtailments in DEP, and projections of DEP’s and DEC’s
respective ability to reliably accommodate additional solar energy have informed the Companies’
decision to allocate CPRE development primarily in the DEC service territory. The Companies
anticipate that the designated allocation of CPRE Program capacity may evolve over the CPRE
7 The Companies testified to the importance of managing system operations to maintain the LROL of the BA’s
Security Constrained Unit Commitment in the 2016 avoided cost proceeding. See In the Matter of Biennial
Determination of Avoided Cost Rates for Electric Utility Purchases from Qualifying Facilities – 2016, Pre-filed Direct
Testimony of John S. Holeman, III, at 7-8, 12-13 Docket No E-100, Sub 148 (filed February 21, 2017).

Procurement Period, and the Companies intend to meet the CPRE Program requirements in a
manner that ensures continued reliable electric service to customers while procuring cost-effective
renewable energy resource capacity located within the DEC and DEP service territories. The
Companies will update the planned allocation, if it is determined that changes are appropriate,
through subsequent CPRE Program Plan filings.
1.6. Locational Designation
For purposes of the Tranche 1 CPRE RFP Solicitation, the Companies published Grid Locational
Guidance information to the Independent Administrator’s website on May 10, 2018 and also held
a webinar open to all registrants to review and discuss these materials and answer questions from
potential market participants and other interested parties. The Grid Locational Guidance was
updated at conclusion of Tranche 1 and published to the Independent Administrator’s website
August 6, 2019 in advance of a webinar discussion on August 7, 2019. This guidance was intended
to provide market participants with information on areas that have known transmission and
distribution limitations as a result of the amount of existing or approved renewable energy facilities
in the area. The goal of providing this grid locational guidance is to minimize the need for costly
network upgrades to integrate CPRE renewable energy facilities and to provide information to
market participants for use when planning development activities for the proposals to be submitted
into the Tranche 2 CPRE RFP. The grid locational guidance information consists of a map and a
table of circuits and substations that have known or increasing constraints.
The Companies continue to evaluate how to provide further updates to this guidance to provide
potential participants in CPRE as much information as possible to enable the most cost effective
proposals to be bid into the RFP.
2. CPRE Tranche 1 RFP Document and Pro forma PPA
The Tranche 1 RFP constitute the Companies’ Program Guidelines for the completed solicitation.
Comments on stakeholder engagement regarding the Pro forma PPA
Consistent with the directive in the NCUC’s order approving the CPRE Program in February 2018
in Docket Nos. E-2, Sub 1159 and E-7, Sub 1156, the Companies have substantially revised the
PPA based on feedback received through two formal comment periods and continued to engage
with stakeholders to determine if consensus can be reached on additional revisions to the PPA.
More specifically, based on comments filed by stakeholders in Docket Nos. E-2, Sub 1159 and E-
7, Sub 1156, the Companies made significant revisions to the November 2017 version of the Pro
forma PPA before publishing this on May 11 as a pre-solicitation document for Tranche 1 of the
RFP. Market Participants and other interested parties then had a second opportunity to review the

Pro Forma PPA (along with other draft solicitation documents). These comments were provided
via the IA website. The Companies and the IA evaluated all of the comments received on the
draft documents, including the Pro forma PPA and proceeded to make further, significant revisions
to the Pro forma PPA before publishing the final PPA to be used in the Tranche 1 solicitation on
June 8, 2018. The IA detailed the results of the comment period in their report which was
completed on June 20, 2018 and posted to the website on June 21, 2018. In this report, the IA
finds that the Companies gave full consideration to each observation and the IA agreed with the
changes that the Companies elected to make to the PPA. On June 25, 2018 the Commission
approved the final Pro forma PPA for use in Tranche 1 of the CPRE program.
The Companies held an additional stakeholder meeting regarding the PPA on August 7, 2018 via
webinar. Approximately 50 participants called in to the webinar. The Companies presented a
summary of the process that led to the Commission approval of the Tranche 1 PPA and
summarized key changes made during the course of this process in response to comments and
suggestions made by stakeholders. The Companies then opened the floor to questions from the
webinar participants. Several of these questions were unrelated to the PPA and these individuals
were directed to use the message board and Q&A process on the IA website. The comments on
the PPA itself were very limited. The Companies provided responses to these comments on the
call and reiterated the commitment to take these comments into consideration during the drafting
of the Tranche 2 PPA document.
2. CPRE Tranche 2 RFP Document and Pro forma PPA
The Tranche 2 RFP document and pro-forma PPA are in review and subject to revisions during
the Tranche 2 60-day pre-solicitation period which opened August 15, 2019. These documents
will be posted to the Independent Administrators website when finalized:
https://decprerfp2019.accionpower.com .
Comments on stakeholder engagement regarding the Pro forma PPA
Pursuant to the NCUC Order Modifying and Accepting CPRE Program Plan on July 2, 2019, the
pre-solicitation process for Tranche 2 will allow for comment opportunity with stakeholders that
will be supervised by the Independent Administrator. The Commission order requires monthly
stakeholder meetings to address any issues not specifically addressed in the order and to reach
consensus on Tranche 2 documents. The schedule for these meetings is provided as Figure 5.

Figure 5. Tranche 2 Stakeholder Meeting Schedule
Date Topic(s)
August 7, 2019
Review of IA’s final Tranche 1 Report
Grid Locational Guidance
Discussion concerning PPA Storage Protocols
September 12, 2019 PPA Terms and Conditions
Grouping Study Base Case
October 10, 2019 General RFP Structure
Asset Acquisition Discussion
November 13, 2019 Bidding Questions
December 12, 2019 To be determined
4. Other Program Plan Updates
Energy Storage
Recognizing the improving cost effectiveness of energy storage technologies and planned future
adoption by the Companies and consideration by other utilities in recent competitive generation
procurements, the Companies’ made the determination that Renewable plus Storage Proposals—
if thoughtfully integrated into the Companies’ system operations—should be accepted for
consideration in the CPRE RFP. For this reason, the Companies’ Tranche 1 RFP and pro forma
Tranche 1 PPA enabled market participants the option to offer Renewable plus Storage Proposals.
Storage was included in 4 bids in Tranche 1 and 2 of these bids were ultimately awarded contracts.
To facilitate equitable consideration in the RFP, as well as to ensure effective integration of energy
storage with the Companies’ system operations under the CPRE Program framework, the
Companies incorporated into the Pro Forma PPA a limited number of modifications, including a
two-page “Energy Storage Protocol”.
On May 23, 2019 the Companies participated in an NCUC CPRE Stakeholder Technical
Conference to discuss modifications to the Energy Storage Protocol. The Companies provided an
updated Energy Storage Protocol for Tranche 2 on August 7, 2019 for discussion in the initial
Tranche 2 Stakeholder Meeting. The pre-solicitation feedback window is currently open.


