ductile iron nodularity
34
DIS RESEARCH PROJECT NO. 37 NODULARITY, ITS MEASUREMENT, AND ITS CORRELATION WITH THE MECHANICAL PROPERTIES OF DUCTILE IRON June 18, 2006 BY RICHARD B. GUNDLACH STORK CLIMAX RESEARCH SERVICES 51229 CENTURY COURT WIXOM, MICHIGAN 48393
-
Upload
karthikkanda -
Category
Documents
-
view
214 -
download
9
Transcript of ductile iron nodularity
DIS RESEARCH PROJECT NO. 37
NODULARITY, ITS MEASUREMENT, AND ITS CORRELATION WITH THE MECHANICAL PROPERTIES
OF DUCTILE IRON
June 18, 2006
BY
RICHARD B. GUNDLACH
STORK CLIMAX RESEARCH SERVICES
51229 CENTURY COURT WIXOM, MICHIGAN 48393
DIS Research Project No. 37
Page 2 of 34
DIS RESEARCH PROJECT NO. 37
NODULARITY, ITS MEASUREMENT, AND ITS CORRELATION WITH THE MECHANICAL PROPERTIES
OF DUCTILE IRON
ABSTRACT The relationship between nodularity and mechanical properties in the various SAE grades of ductile iron were determined in this study. In addition, a correlation between nodularity and ultrasonic velocity was also developed and an evaluation of this relationship was performed. A large number of heats (26) were procured for this investigation. Six grades of ductile iron were produced, including D4018 Annealed, D4018 As-cast, D4512, D5506, D7003 and D9002. Test bars were produced at various levels of nodularity with nodularities ranging from 95% to 43%. The test castings consisted of keel blocks and rounds of 1-inch section size. The results of the study showed that both tensile strength and elongation decrease with nodularity. When achieving the minimum properties of each SAE grade, the acceptable nodularity level varied with the grade of iron. As strength increased, the degradation in properties began at higher nodularity values. The correlation of nodularity and ultrasonic velocity was loose, and the correlation of mechanical properties and ultrasonic velocity was poor. In addition to the strong influence of nodularity, ultrasonic velocity was also affected by graphite volume and matrix structure.
DIS Research Project No. 37
Page 3 of 34
BACKGROUND INFORMATION The mechanical properties of ductile iron are tied directly to nodularity. Castings with poor nodularity will display lower tensile elongation and often do not meet minimum tensile strength and/or impact strength requirements. Degenerate graphite particles are stress risers and can also reduce the fatigue strength of ductile iron. Consequently, industrial specifications usually establish the minimum acceptable percent nodularity allowed in a part. The amount of degradation that occurs with a given deviation from 100% nodularity can vary with the ductile iron grade. The high-strength grades are more susceptible to the presence of degenerate graphite than the low-strength, high-ductility grades. Industrial standards do not necessarily reflect this fact. The objective of this investigation was to determine the relationship between nodularity and mechanical properties of ductile iron. The need for developing more quantitative data on the correlation of nodularity and properties in ductile iron castings is growing. There is a need to better define what an acceptable microstructure, and or properties, should be. Both the producer and buyer of ductile iron castings need to know this correlation, particularly when the criterion of acceptance is based on these properties. A more precise method of measuring nodularity is also needed to properly referee casting quality. In consideration of current times, this has become more and more important in light of the liability with litigation of suspect castings. While it would appear that the correlation of nodularity and mechanical properties is well understood, the literature provides very little quantitative data on this subject. All of the data uncovered in a preliminary search compares properties with nodularities that were determined by visual estimates. The estimation of nodularity by individuals has been shown to be quite subjective, particularly as nodularity decreases (it is easier to recognize 95 to 100% nodularity). Several investigators have shown a correlation between nodularity and sonic properties but, again, the correlations are based on visual estimates of nodularity. With the advent of modern analytical tools it seems appropriate to revisit this subject. With the utilization of ductile iron castings in applications requiring high ductility and toughness and high reliability, various quality assurance techniques have been developed to ensure that high nodularity has been achieved in the casting. Both resonant frequency and ultrasonic velocity measurements have become routine in the foundry. Because of the importance of the correlation between mechanical properties, nodularity and these NDT properties, this investigation makes an attempt to develop correlations between mechanical properties, nodularity and ultrasonic velocity. To improve the repeatability and precision of the nodularity measurement, nodularity was determined by image analysis. What’s different in this proposal are the methods being used to evaluate the graphite structure. Instead of visual estimations of the nodularity and graphite shape, the structures are being evaluated more quantitatively using automated image analysis. Automated image analysis allows the operator to evaluate many more fields to better obtain an average rating of the microstructure. Image analysis will also minimize the variability of the measurement due to operator bias.
DIS Research Project No. 37
Page 4 of 34
Furthermore, the correlation of graphite structure with mechanical properties will be extended to include the most common grades of ductile iron. HISTORY AND THEORY Historical investigations1-4 have shown that properties vary significantly with nodularity in ductile iron. Several papers have been published, primarily by BCIRA and in AFS Transactions showing the correlation between nodularity and tensile strength, yield strength and impact toughness. Tensile properties degrade more quickly in high-strength irons than in lower-strength irons as nodularity decreases. The currently available correlations cover only two grades (ferritic and pearlitic); this investigation addresses six grades of ductile iron. The powerful influence of nodularity on strength is due to the effects of increased stress concentration associated with non-nodular graphite particles. As the graphite structure becomes more degenerated, some dimensions of the graphite particles increase in size. The larger particles produce an increase in stress intensity around each particle and thus reduce the critical stress for crack propagation. The stress concentration increases in proportion to the square root of the major dimension of the particle. This change in the shape of the graphite particles also changes the elastic modulus and sonic properties of the material, thus, making it possible to evaluate change in structure by NDT techniques. Several investigations1,2,4 have shown such correlations.
EXPERIMENTAL PROCEDURES The experimental procedure consists of producing many sets of test bars required for this study. The test bars were supplied by the Casting Laboratory of DIS member DaimlerChrysler, which greatly reduced the cost of this project. More than 26 heats were produced to obtain four as-cast grades with a wide range of nodularities. While it was not particularly difficult to produce castings with high nodularities, the production of the four grades with specific levels of low nodularity was quite difficult. Several trial heats were produced that could not be used due to duplication. Table 1 contains a list of the desired materials and test matrix for this study. There are various methods that could be employed to produce low nodularity in ductile iron, including reduced Mg treatment levels, holding the treated iron to achieve fade, or adding tramp elements to spoil the graphite structure. For this investigation, the nodularity was varied by controlling the Mg treatment level and also by adjusting nodularity with small additions of S to the treated metal. Both double-coupon keel blocks and round test bars were poured for this study. The chemically bonded sand molds for the keel blocks were produced by Wescast Industries and supplied to DaimlerChrysler for casting. Numerous castings were poured due to the number of test bars required for the investigation. For the annealed ferritic grade D4018 “Annealed”, certain heats were selected based on nodularity and on compositions which were expected to best respond to a ferritize annealing heat
DIS Research Project No. 37
Page 5 of 34
treatment. Up to six bars from each heat were subjected to a subcritical anneal. The test bars were heated to 1325oF, held for 4 hours, and furnace-cooled. For the quenched and tempered grade D9002, additional heats were selected based on nodularity and on compositions which were expected to through-harden upon quenching from the austenitizing temperature. Up to six bars from each heat were subjected to a heat treatment by heating to 1650oF, holding 1.5 hours and quenching in oil. The test bars were subsequently tempered at 950oF for 2 hours and furnace-cooled.
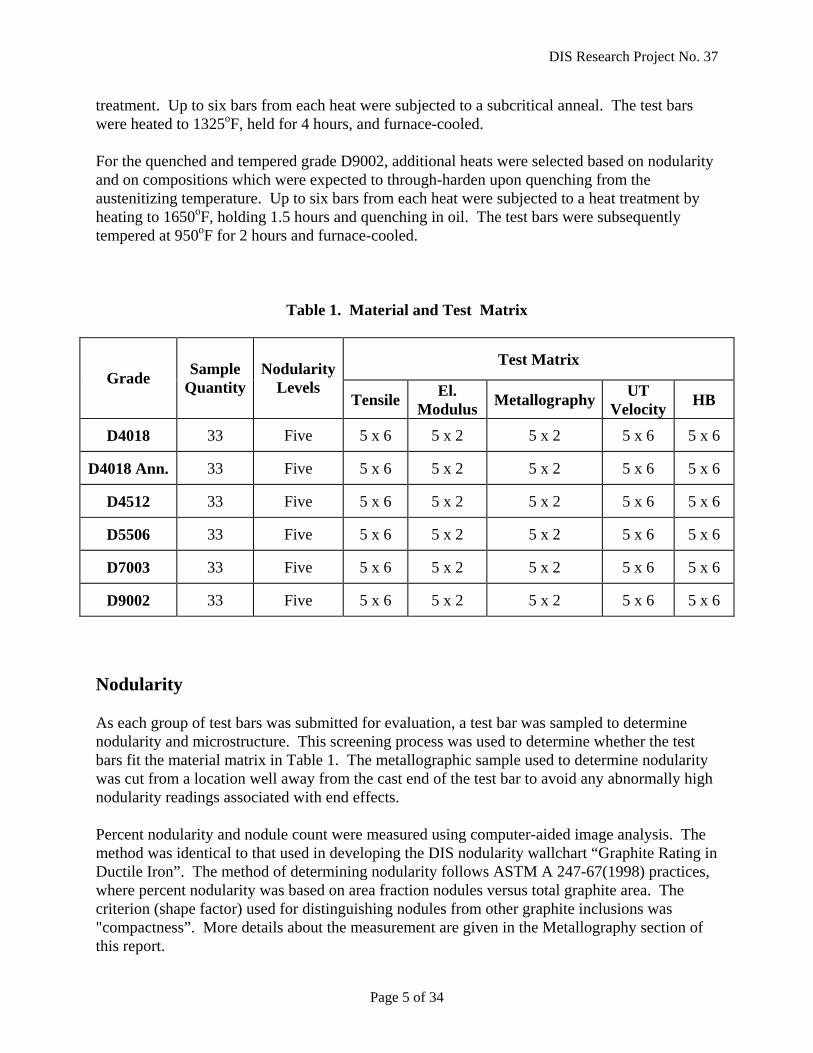
Table 1. Material and Test Matrix
Test Matrix Grade Sample
Quantity Nodularity
Levels Tensile El.
Modulus Metallography UT Velocity HB
D4018 33 Five 5 x 6 5 x 2 5 x 2 5 x 6 5 x 6
D4018 Ann. 33 Five 5 x 6 5 x 2 5 x 2 5 x 6 5 x 6
D4512 33 Five 5 x 6 5 x 2 5 x 2 5 x 6 5 x 6
D5506 33 Five 5 x 6 5 x 2 5 x 2 5 x 6 5 x 6
D7003 33 Five 5 x 6 5 x 2 5 x 2 5 x 6 5 x 6
D9002 33 Five 5 x 6 5 x 2 5 x 2 5 x 6 5 x 6
Nodularity As each group of test bars was submitted for evaluation, a test bar was sampled to determine nodularity and microstructure. This screening process was used to determine whether the test bars fit the material matrix in Table 1. The metallographic sample used to determine nodularity was cut from a location well away from the cast end of the test bar to avoid any abnormally high nodularity readings associated with end effects. Percent nodularity and nodule count were measured using computer-aided image analysis. The method was identical to that used in developing the DIS nodularity wallchart “Graphite Rating in Ductile Iron”. The method of determining nodularity follows ASTM A 247-67(1998) practices, where percent nodularity was based on area fraction nodules versus total graphite area. The criterion (shape factor) used for distinguishing nodules from other graphite inclusions was "compactness”. More details about the measurement are given in the Metallography section of this report.
DIS Research Project No. 37
Page 6 of 34
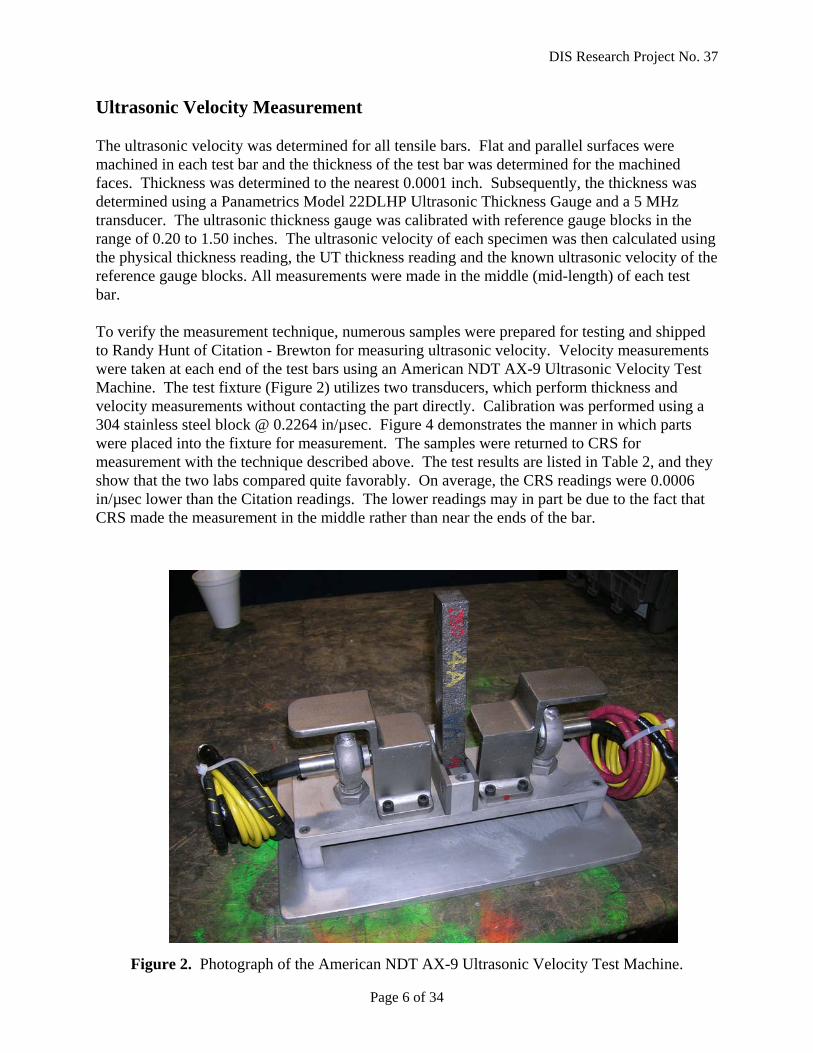
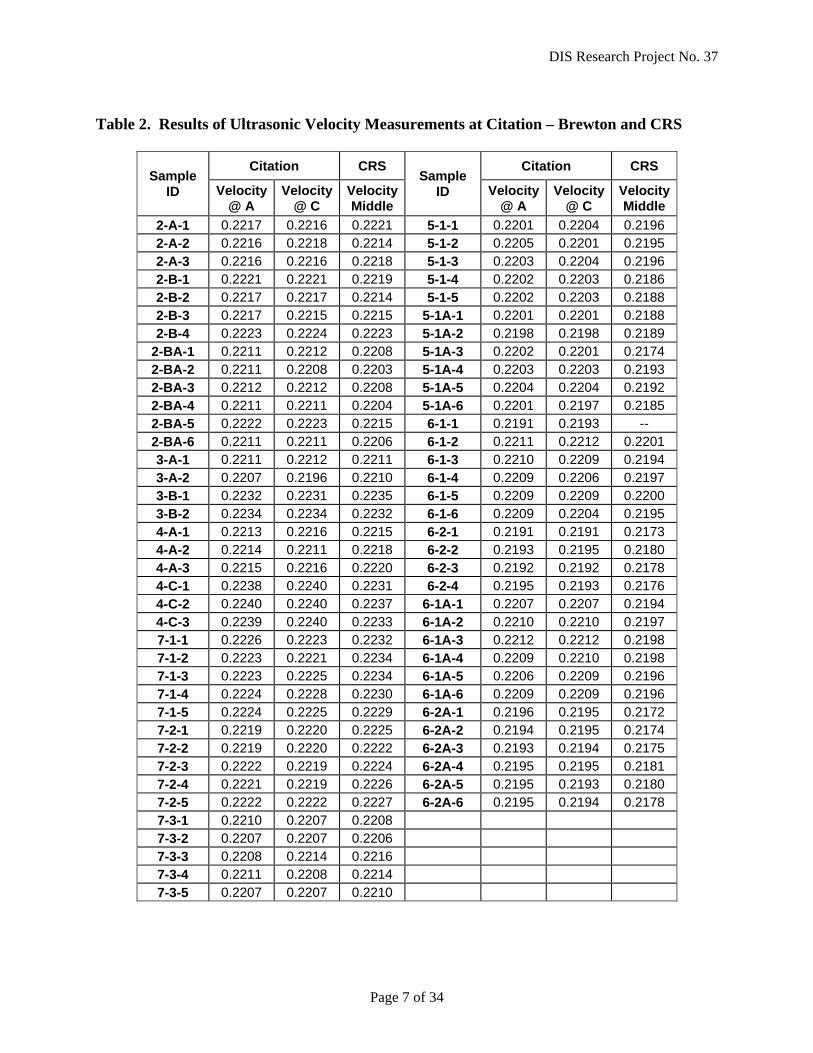
Ultrasonic Velocity Measurement The ultrasonic velocity was determined for all tensile bars. Flat and parallel surfaces were machined in each test bar and the thickness of the test bar was determined for the machined faces. Thickness was determined to the nearest 0.0001 inch. Subsequently, the thickness was determined using a Panametrics Model 22DLHP Ultrasonic Thickness Gauge and a 5 MHz transducer. The ultrasonic thickness gauge was calibrated with reference gauge blocks in the range of 0.20 to 1.50 inches. The ultrasonic velocity of each specimen was then calculated using the physical thickness reading, the UT thickness reading and the known ultrasonic velocity of the reference gauge blocks. All measurements were made in the middle (mid-length) of each test bar. To verify the measurement technique, numerous samples were prepared for testing and shipped to Randy Hunt of Citation - Brewton for measuring ultrasonic velocity. Velocity measurements were taken at each end of the test bars using an American NDT AX-9 Ultrasonic Velocity Test Machine. The test fixture (Figure 2) utilizes two transducers, which perform thickness and velocity measurements without contacting the part directly. Calibration was performed using a 304 stainless steel block @ 0.2264 in/µsec. Figure 4 demonstrates the manner in which parts were placed into the fixture for measurement. The samples were returned to CRS for measurement with the technique described above. The test results are listed in Table 2, and they show that the two labs compared quite favorably. On average, the CRS readings were 0.0006 in/µsec lower than the Citation readings. The lower readings may in part be due to the fact that CRS made the measurement in the middle rather than near the ends of the bar.
Figure 2. Photograph of the American NDT AX-9 Ultrasonic Velocity Test Machine.
DIS Research Project No. 37
Page 7 of 34
Table 2. Results of Ultrasonic Velocity Measurements at Citation – Brewton and CRS
Citation CRS Citation CRS Sample
ID Velocity @ A
Velocity@ C
VelocityMiddle
Sample ID Velocity
@ A Velocity
@ C VelocityMiddle
2-A-1 0.2217 0.2216 0.2221 5-1-1 0.2201 0.2204 0.2196 2-A-2 0.2216 0.2218 0.2214 5-1-2 0.2205 0.2201 0.2195 2-A-3 0.2216 0.2216 0.2218 5-1-3 0.2203 0.2204 0.2196 2-B-1 0.2221 0.2221 0.2219 5-1-4 0.2202 0.2203 0.2186 2-B-2 0.2217 0.2217 0.2214 5-1-5 0.2202 0.2203 0.2188 2-B-3 0.2217 0.2215 0.2215 5-1A-1 0.2201 0.2201 0.2188 2-B-4 0.2223 0.2224 0.2223 5-1A-2 0.2198 0.2198 0.2189
2-BA-1 0.2211 0.2212 0.2208 5-1A-3 0.2202 0.2201 0.2174 2-BA-2 0.2211 0.2208 0.2203 5-1A-4 0.2203 0.2203 0.2193 2-BA-3 0.2212 0.2212 0.2208 5-1A-5 0.2204 0.2204 0.2192 2-BA-4 0.2211 0.2211 0.2204 5-1A-6 0.2201 0.2197 0.2185 2-BA-5 0.2222 0.2223 0.2215 6-1-1 0.2191 0.2193 -- 2-BA-6 0.2211 0.2211 0.2206 6-1-2 0.2211 0.2212 0.2201 3-A-1 0.2211 0.2212 0.2211 6-1-3 0.2210 0.2209 0.2194 3-A-2 0.2207 0.2196 0.2210 6-1-4 0.2209 0.2206 0.2197 3-B-1 0.2232 0.2231 0.2235 6-1-5 0.2209 0.2209 0.2200 3-B-2 0.2234 0.2234 0.2232 6-1-6 0.2209 0.2204 0.2195 4-A-1 0.2213 0.2216 0.2215 6-2-1 0.2191 0.2191 0.2173 4-A-2 0.2214 0.2211 0.2218 6-2-2 0.2193 0.2195 0.2180 4-A-3 0.2215 0.2216 0.2220 6-2-3 0.2192 0.2192 0.2178 4-C-1 0.2238 0.2240 0.2231 6-2-4 0.2195 0.2193 0.2176 4-C-2 0.2240 0.2240 0.2237 6-1A-1 0.2207 0.2207 0.2194 4-C-3 0.2239 0.2240 0.2233 6-1A-2 0.2210 0.2210 0.2197 7-1-1 0.2226 0.2223 0.2232 6-1A-3 0.2212 0.2212 0.2198 7-1-2 0.2223 0.2221 0.2234 6-1A-4 0.2209 0.2210 0.2198 7-1-3 0.2223 0.2225 0.2234 6-1A-5 0.2206 0.2209 0.2196 7-1-4 0.2224 0.2228 0.2230 6-1A-6 0.2209 0.2209 0.2196 7-1-5 0.2224 0.2225 0.2229 6-2A-1 0.2196 0.2195 0.2172 7-2-1 0.2219 0.2220 0.2225 6-2A-2 0.2194 0.2195 0.2174 7-2-2 0.2219 0.2220 0.2222 6-2A-3 0.2193 0.2194 0.2175 7-2-3 0.2222 0.2219 0.2224 6-2A-4 0.2195 0.2195 0.2181 7-2-4 0.2221 0.2219 0.2226 6-2A-5 0.2195 0.2193 0.2180 7-2-5 0.2222 0.2222 0.2227 6-2A-6 0.2195 0.2194 0.2178 7-3-1 0.2210 0.2207 0.2208 7-3-2 0.2207 0.2207 0.2206 7-3-3 0.2208 0.2214 0.2216 7-3-4 0.2211 0.2208 0.2214 7-3-5 0.2207 0.2207 0.2210
DIS Research Project No. 37
Page 8 of 34
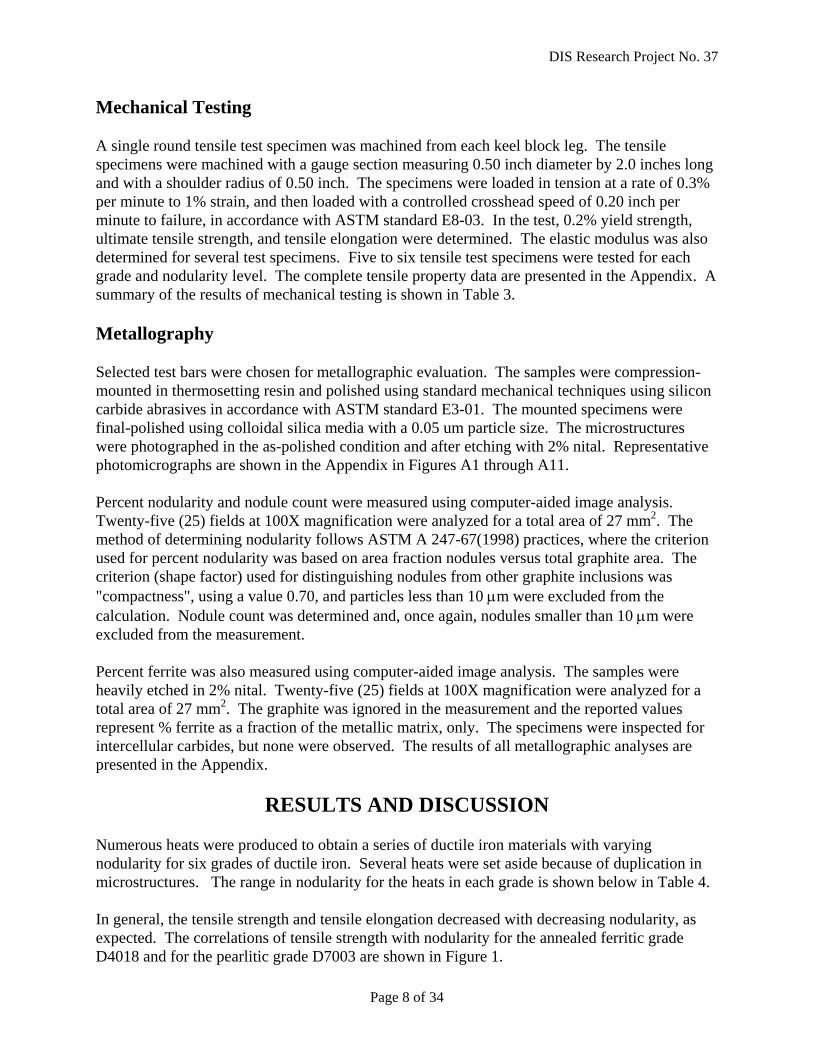
Mechanical Testing A single round tensile test specimen was machined from each keel block leg. The tensile specimens were machined with a gauge section measuring 0.50 inch diameter by 2.0 inches long and with a shoulder radius of 0.50 inch. The specimens were loaded in tension at a rate of 0.3% per minute to 1% strain, and then loaded with a controlled crosshead speed of 0.20 inch per minute to failure, in accordance with ASTM standard E8-03. In the test, 0.2% yield strength, ultimate tensile strength, and tensile elongation were determined. The elastic modulus was also determined for several test specimens. Five to six tensile test specimens were tested for each grade and nodularity level. The complete tensile property data are presented in the Appendix. A summary of the results of mechanical testing is shown in Table 3. Metallography Selected test bars were chosen for metallographic evaluation. The samples were compression-mounted in thermosetting resin and polished using standard mechanical techniques using silicon carbide abrasives in accordance with ASTM standard E3-01. The mounted specimens were final-polished using colloidal silica media with a 0.05 um particle size. The microstructures were photographed in the as-polished condition and after etching with 2% nital. Representative photomicrographs are shown in the Appendix in Figures A1 through A11. Percent nodularity and nodule count were measured using computer-aided image analysis. Twenty-five (25) fields at 100X magnification were analyzed for a total area of 27 mm2. The method of determining nodularity follows ASTM A 247-67(1998) practices, where the criterion used for percent nodularity was based on area fraction nodules versus total graphite area. The criterion (shape factor) used for distinguishing nodules from other graphite inclusions was "compactness", using a value 0.70, and particles less than 10 µm were excluded from the calculation. Nodule count was determined and, once again, nodules smaller than 10 µm were excluded from the measurement. Percent ferrite was also measured using computer-aided image analysis. The samples were heavily etched in 2% nital. Twenty-five (25) fields at 100X magnification were analyzed for a total area of 27 mm2. The graphite was ignored in the measurement and the reported values represent % ferrite as a fraction of the metallic matrix, only. The specimens were inspected for intercellular carbides, but none were observed. The results of all metallographic analyses are presented in the Appendix.
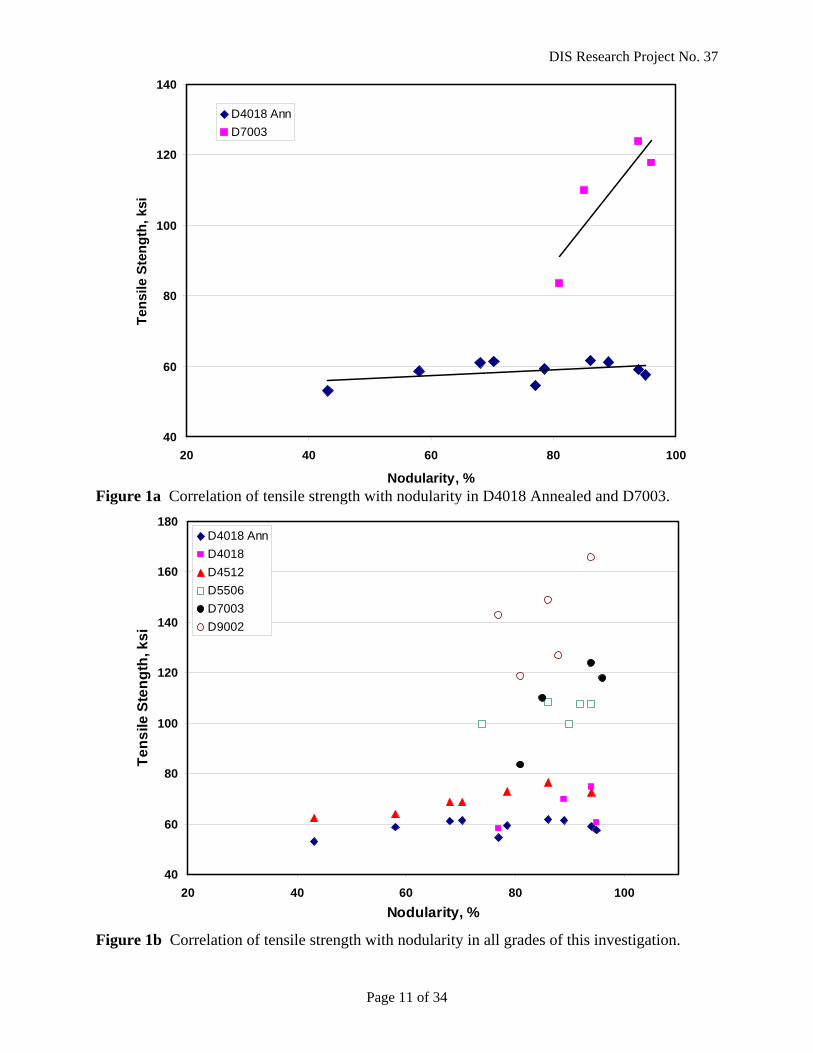
RESULTS AND DISCUSSION Numerous heats were produced to obtain a series of ductile iron materials with varying nodularity for six grades of ductile iron. Several heats were set aside because of duplication in microstructures. The range in nodularity for the heats in each grade is shown below in Table 4. In general, the tensile strength and tensile elongation decreased with decreasing nodularity, as expected. The correlations of tensile strength with nodularity for the annealed ferritic grade D4018 and for the pearlitic grade D7003 are shown in Figure 1.
DIS Research Project No. 37
Page 9 of 34
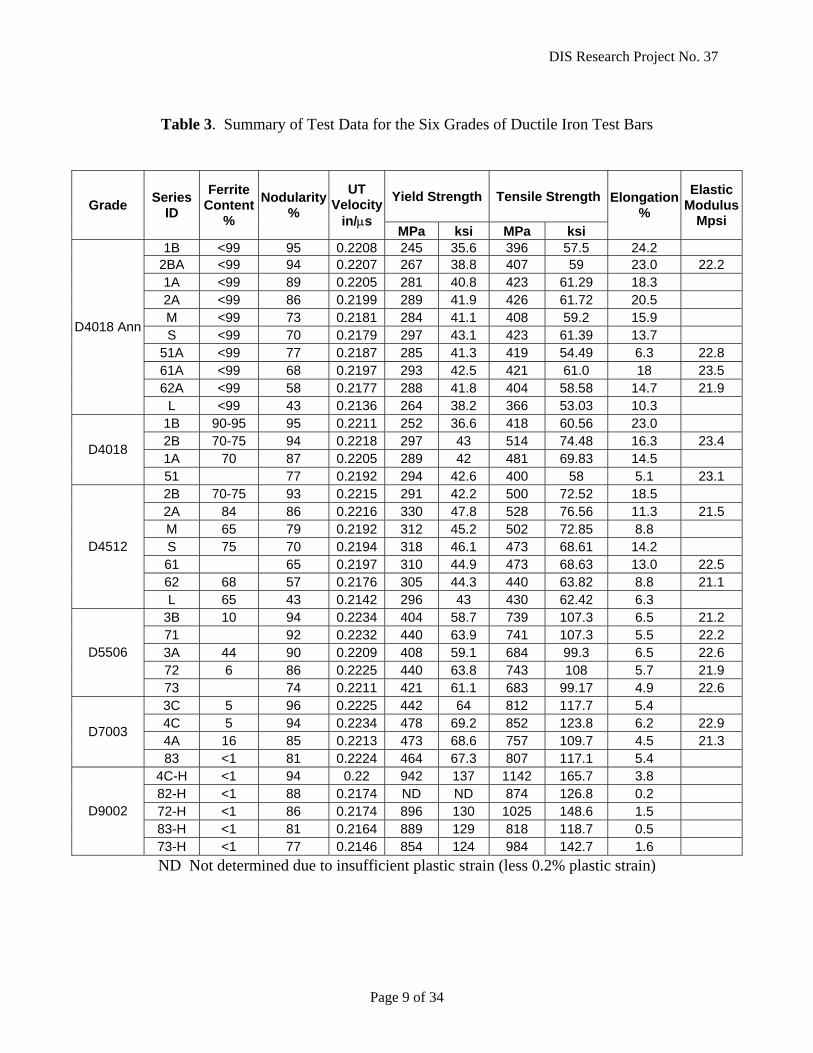
Table 3. Summary of Test Data for the Six Grades of Ductile Iron Test Bars
Yield Strength Tensile Strength Grade Series ID
Ferrite Content
%
Nodularity %
UT Velocity
in/µs MPa ksi MPa ksi
Elongation%
Elastic Modulus
Mpsi
1B <99 95 0.2208 245 35.6 396 57.5 24.2 2BA <99 94 0.2207 267 38.8 407 59 23.0 22.2 1A <99 89 0.2205 281 40.8 423 61.29 18.3 2A <99 86 0.2199 289 41.9 426 61.72 20.5 M <99 73 0.2181 284 41.1 408 59.2 15.9 S <99 70 0.2179 297 43.1 423 61.39 13.7
51A <99 77 0.2187 285 41.3 419 54.49 6.3 22.8 61A <99 68 0.2197 293 42.5 421 61.0 18 23.5 62A <99 58 0.2177 288 41.8 404 58.58 14.7 21.9
D4018 Ann
L <99 43 0.2136 264 38.2 366 53.03 10.3 1B 90-95 95 0.2211 252 36.6 418 60.56 23.0 2B 70-75 94 0.2218 297 43 514 74.48 16.3 23.4 1A 70 87 0.2205 289 42 481 69.83 14.5
D4018
51 77 0.2192 294 42.6 400 58 5.1 23.1 2B 70-75 93 0.2215 291 42.2 500 72.52 18.5 2A 84 86 0.2216 330 47.8 528 76.56 11.3 21.5 M 65 79 0.2192 312 45.2 502 72.85 8.8 S 75 70 0.2194 318 46.1 473 68.61 14.2 61 65 0.2197 310 44.9 473 68.63 13.0 22.5 62 68 57 0.2176 305 44.3 440 63.82 8.8 21.1
D4512
L 65 43 0.2142 296 43 430 62.42 6.3 3B 10 94 0.2234 404 58.7 739 107.3 6.5 21.2 71 92 0.2232 440 63.9 741 107.3 5.5 22.2 3A 44 90 0.2209 408 59.1 684 99.3 6.5 22.6 72 6 86 0.2225 440 63.8 743 108 5.7 21.9
D5506
73 74 0.2211 421 61.1 683 99.17 4.9 22.6 3C 5 96 0.2225 442 64 812 117.7 5.4 4C 5 94 0.2234 478 69.2 852 123.8 6.2 22.9 4A 16 85 0.2213 473 68.6 757 109.7 4.5 21.3
D7003
83 <1 81 0.2224 464 67.3 807 117.1 5.4 4C-H <1 94 0.22 942 137 1142 165.7 3.8 82-H <1 88 0.2174 ND ND 874 126.8 0.2 72-H <1 86 0.2174 896 130 1025 148.6 1.5 83-H <1 81 0.2164 889 129 818 118.7 0.5
D9002
73-H <1 77 0.2146 854 124 984 142.7 1.6 ND Not determined due to insufficient plastic strain (less 0.2% plastic strain)
DIS Research Project No. 37
Page 10 of 34
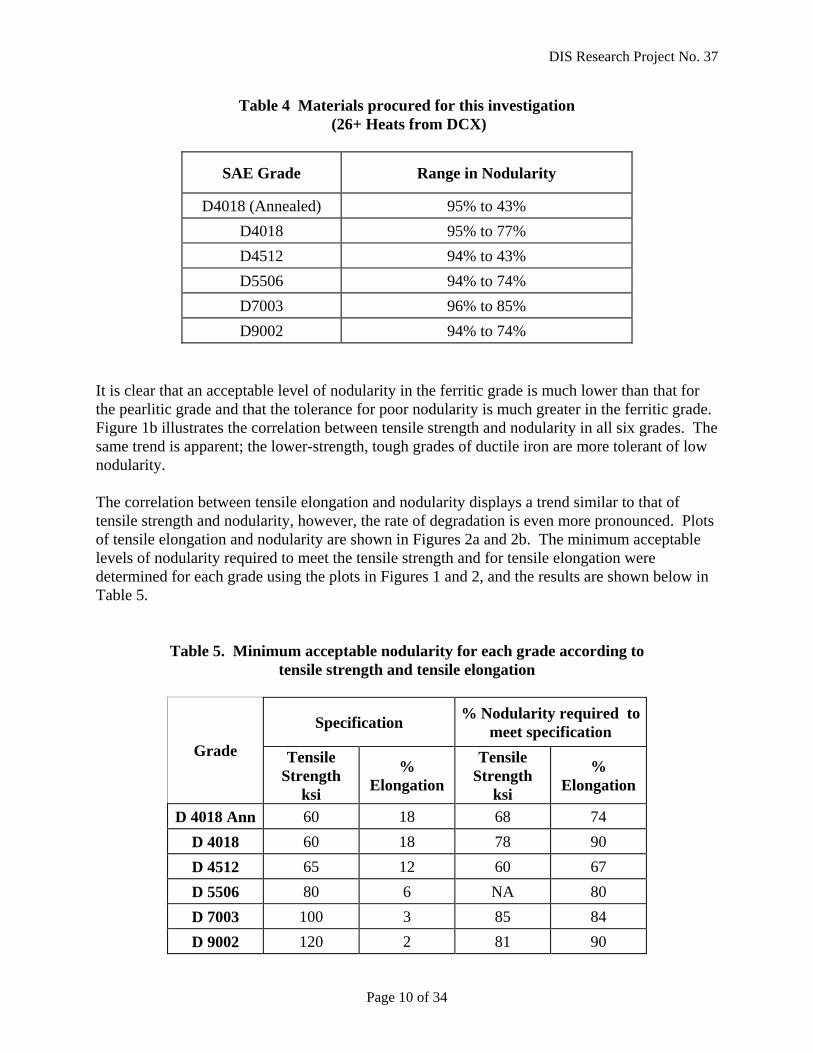
Table 4 Materials procured for this investigation (26+ Heats from DCX)
SAE Grade Range in Nodularity
D4018 (Annealed) 95% to 43% D4018 95% to 77% D4512 94% to 43% D5506 94% to 74% D7003 96% to 85% D9002 94% to 74%
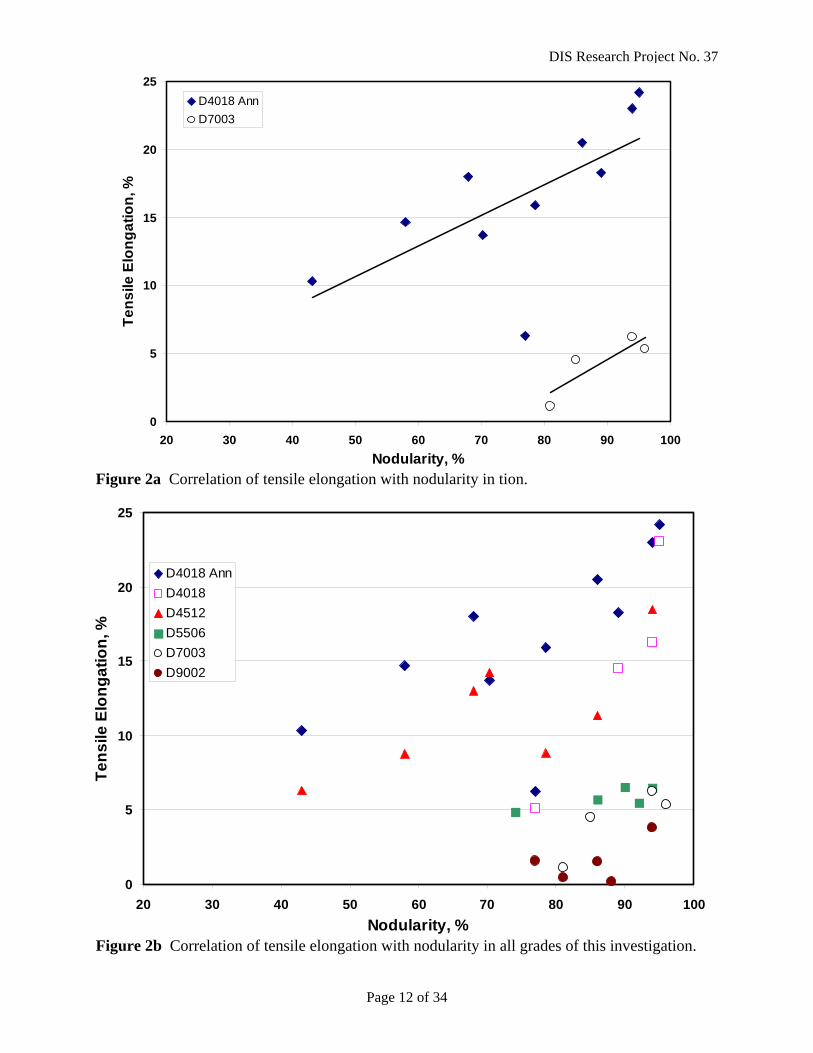
It is clear that an acceptable level of nodularity in the ferritic grade is much lower than that for the pearlitic grade and that the tolerance for poor nodularity is much greater in the ferritic grade. Figure 1b illustrates the correlation between tensile strength and nodularity in all six grades. The same trend is apparent; the lower-strength, tough grades of ductile iron are more tolerant of low nodularity. The correlation between tensile elongation and nodularity displays a trend similar to that of tensile strength and nodularity, however, the rate of degradation is even more pronounced. Plots of tensile elongation and nodularity are shown in Figures 2a and 2b. The minimum acceptable levels of nodularity required to meet the tensile strength and for tensile elongation were determined for each grade using the plots in Figures 1 and 2, and the results are shown below in Table 5.
Table 5. Minimum acceptable nodularity for each grade according to tensile strength and tensile elongation
Specification % Nodularity required to meet specification
Grade Tensile Strength
ksi
% Elongation
Tensile Strength
ksi
% Elongation
D 4018 Ann 60 18 68 74 D 4018 60 18 78 90 D 4512 65 12 60 67 D 5506 80 6 NA 80 D 7003 100 3 85 84 D 9002 120 2 81 90
DIS Research Project No. 37
Page 11 of 34
Figure 1a Correlation of tensile strength with nodularity in D4018 Annealed and D7003. Figure 1b Correlation of tensile strength with nodularity in all grades of this investigation.
40
60
80
100
120
140
20 40 60 80 100
Nodularity, %
Tens
ile S
teng
th, k
si
D4018 AnnD7003
40
60
80
100
120
140
160
180
20 40 60 80 100Nodularity, %
Tens
ile S
teng
th, k
si
D4018 AnnD4018D4512D5506D7003D9002
DIS Research Project No. 37
Page 12 of 34
Figure 2a Correlation of tensile elongation with nodularity in tion. Figure 2b Correlation of tensile elongation with nodularity in all grades of this investigation.
0
5
10
15
20
25
20 30 40 50 60 70 80 90 100Nodularity, %
Tens
ile E
long
atio
n, %
D4018 AnnD4018D4512D5506D7003D9002
0
5
10
15
20
25
20 30 40 50 60 70 80 90 100Nodularity, %
Tens
ile E
long
atio
n, %
D4018 AnnD7003
DIS Research Project No. 37
Page 13 of 34
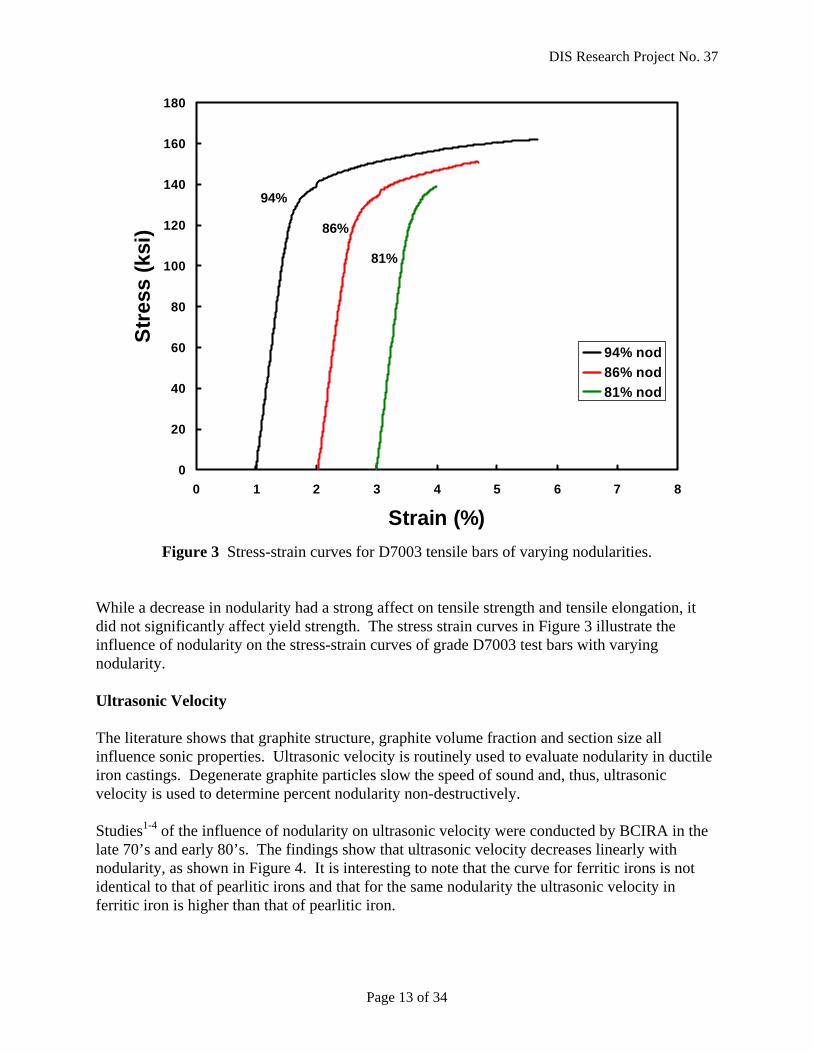
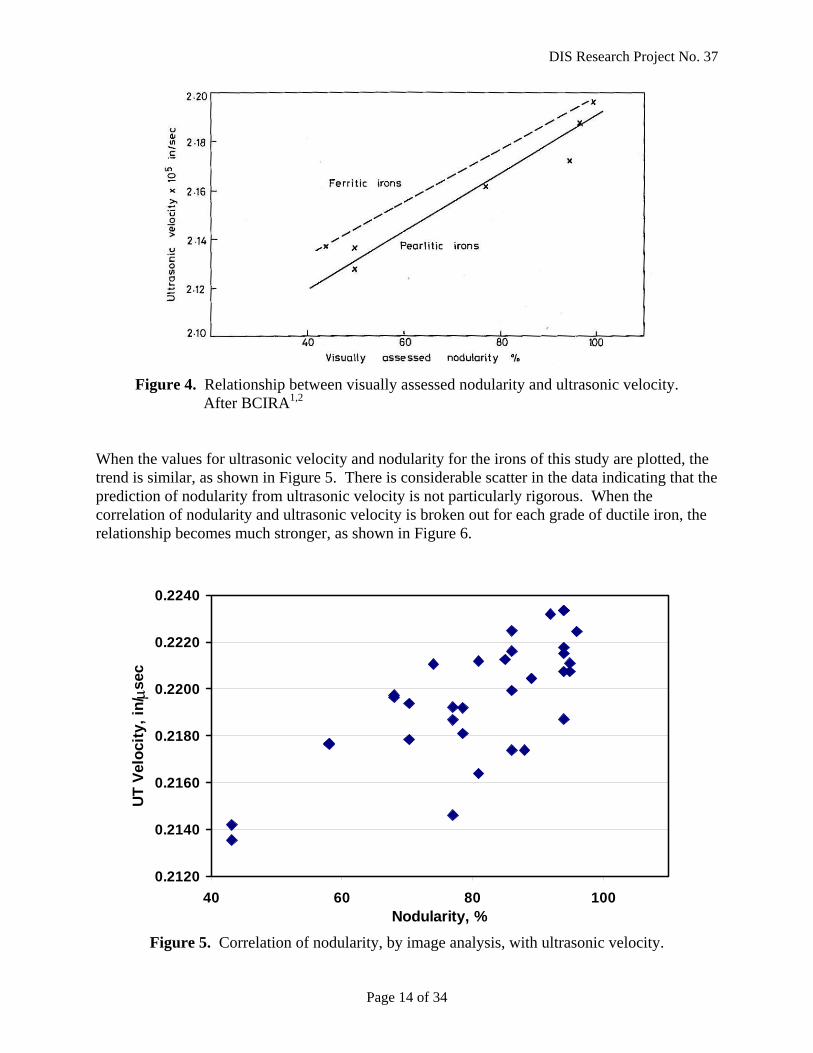
Figure 3 Stress-strain curves for D7003 tensile bars of varying nodularities. While a decrease in nodularity had a strong affect on tensile strength and tensile elongation, it did not significantly affect yield strength. The stress strain curves in Figure 3 illustrate the influence of nodularity on the stress-strain curves of grade D7003 test bars with varying nodularity. Ultrasonic Velocity The literature shows that graphite structure, graphite volume fraction and section size all influence sonic properties. Ultrasonic velocity is routinely used to evaluate nodularity in ductile iron castings. Degenerate graphite particles slow the speed of sound and, thus, ultrasonic velocity is used to determine percent nodularity non-destructively. Studies1-4 of the influence of nodularity on ultrasonic velocity were conducted by BCIRA in the late 70’s and early 80’s. The findings show that ultrasonic velocity decreases linearly with nodularity, as shown in Figure 4. It is interesting to note that the curve for ferritic irons is not identical to that of pearlitic irons and that for the same nodularity the ultrasonic velocity in ferritic iron is higher than that of pearlitic iron.
0
20
40
60
80
100
120
140
160
180
0 1 2 3 4 5 6 7 8
Strain (%)
Stre
ss (k
si)
4CH-57-2H-38-3H-1
94% nod86% nod81% nod
81%
94%
86%
DIS Research Project No. 37
Page 14 of 34
Figure 4. Relationship between visually assessed nodularity and ultrasonic velocity. After BCIRA1,2 When the values for ultrasonic velocity and nodularity for the irons of this study are plotted, the trend is similar, as shown in Figure 5. There is considerable scatter in the data indicating that the prediction of nodularity from ultrasonic velocity is not particularly rigorous. When the correlation of nodularity and ultrasonic velocity is broken out for each grade of ductile iron, the relationship becomes much stronger, as shown in Figure 6.
Figure 5. Correlation of nodularity, by image analysis, with ultrasonic velocity.
0.2120
0.2140
0.2160
0.2180
0.2200
0.2220
0.2240
40 60 80 100Nodularity, %
UT
Velo
city
, in/µs
ec
DIS Research Project No. 37
Page 15 of 34
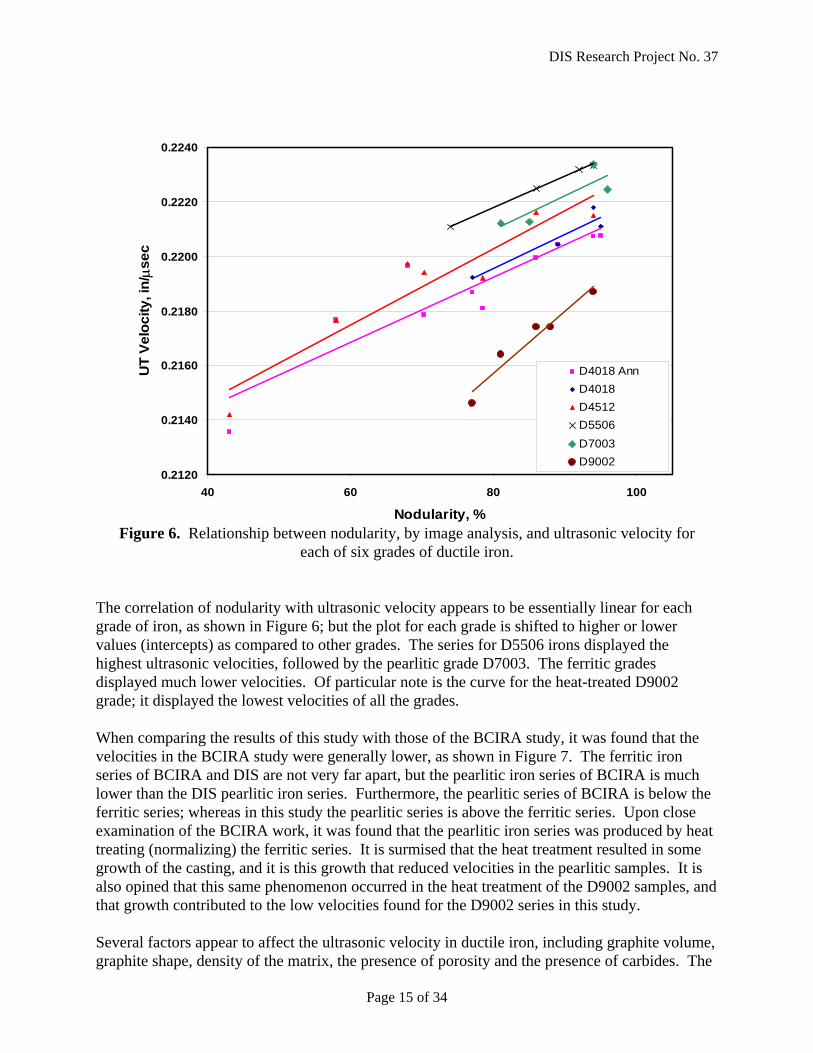
Figure 6. Relationship between nodularity, by image analysis, and ultrasonic velocity for each of six grades of ductile iron.
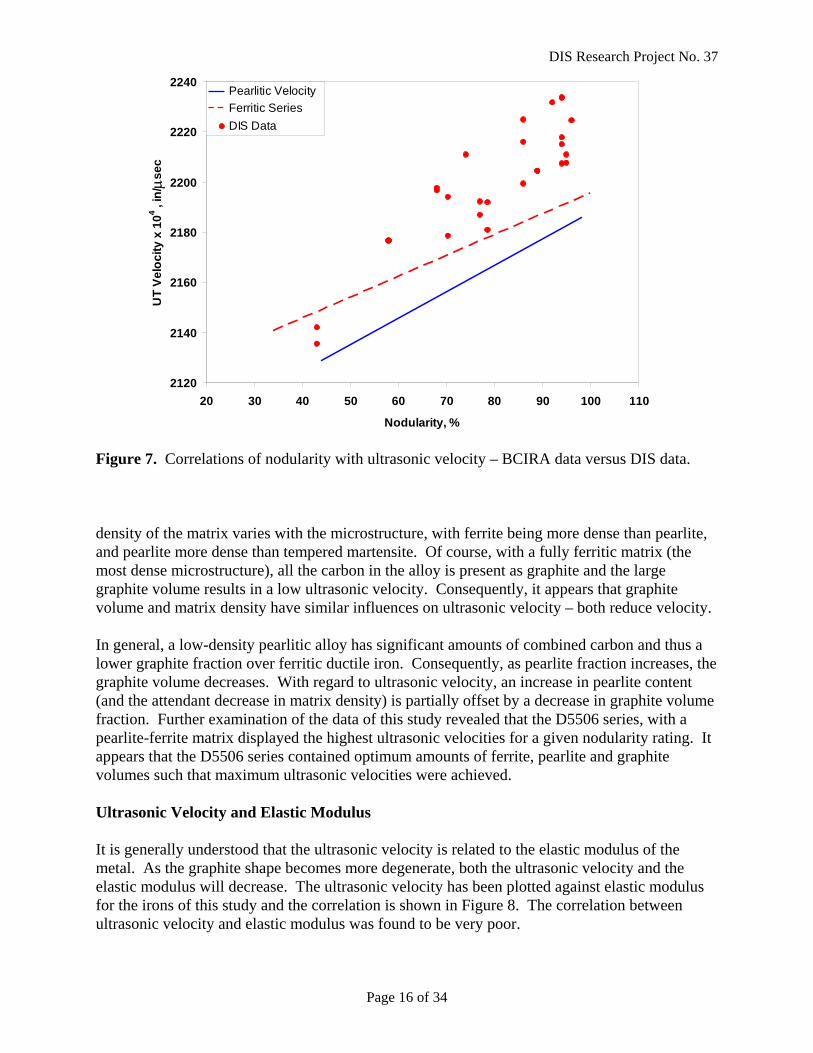
The correlation of nodularity with ultrasonic velocity appears to be essentially linear for each grade of iron, as shown in Figure 6; but the plot for each grade is shifted to higher or lower values (intercepts) as compared to other grades. The series for D5506 irons displayed the highest ultrasonic velocities, followed by the pearlitic grade D7003. The ferritic grades displayed much lower velocities. Of particular note is the curve for the heat-treated D9002 grade; it displayed the lowest velocities of all the grades. When comparing the results of this study with those of the BCIRA study, it was found that the velocities in the BCIRA study were generally lower, as shown in Figure 7. The ferritic iron series of BCIRA and DIS are not very far apart, but the pearlitic iron series of BCIRA is much lower than the DIS pearlitic iron series. Furthermore, the pearlitic series of BCIRA is below the ferritic series; whereas in this study the pearlitic series is above the ferritic series. Upon close examination of the BCIRA work, it was found that the pearlitic iron series was produced by heat treating (normalizing) the ferritic series. It is surmised that the heat treatment resulted in some growth of the casting, and it is this growth that reduced velocities in the pearlitic samples. It is also opined that this same phenomenon occurred in the heat treatment of the D9002 samples, and that growth contributed to the low velocities found for the D9002 series in this study. Several factors appear to affect the ultrasonic velocity in ductile iron, including graphite volume, graphite shape, density of the matrix, the presence of porosity and the presence of carbides. The
0.2120
0.2140
0.2160
0.2180
0.2200
0.2220
0.2240
40 60 80 100
Nodularity, %
UT
Velo
city
, in/µs
ec
D4018 AnnD4018D4512D5506D7003D9002
DIS Research Project No. 37
Page 16 of 34
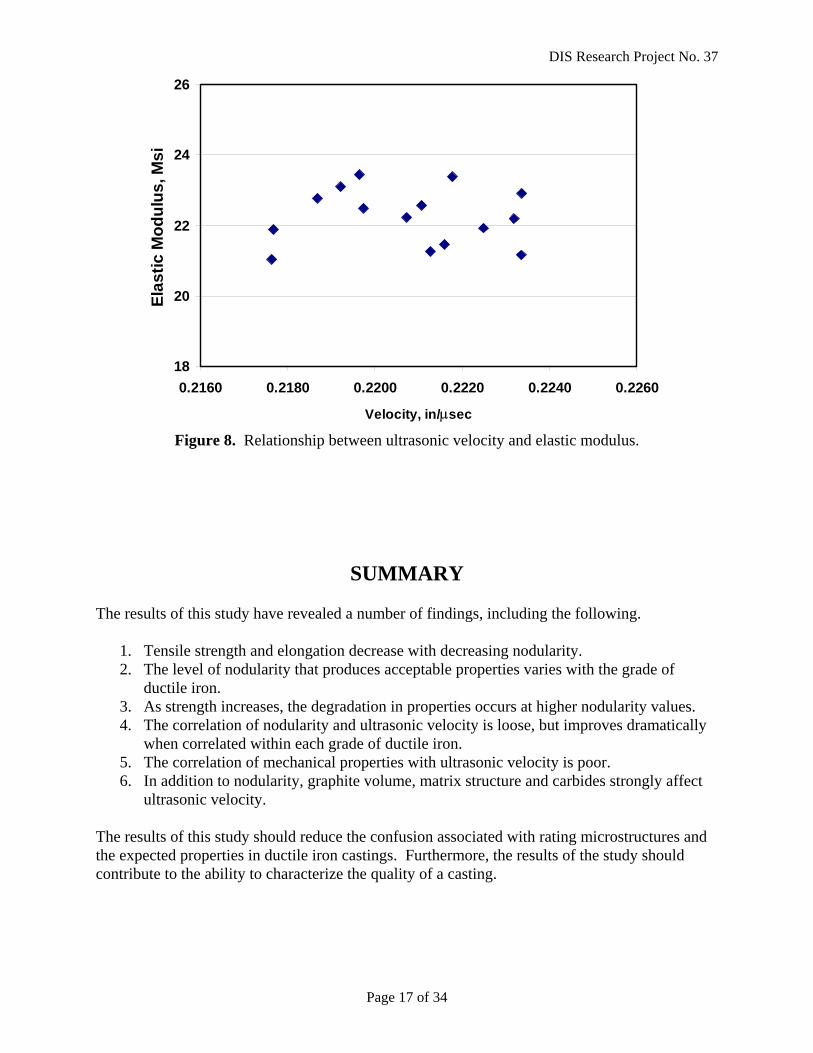
Figure 7. Correlations of nodularity with ultrasonic velocity – BCIRA data versus DIS data. density of the matrix varies with the microstructure, with ferrite being more dense than pearlite, and pearlite more dense than tempered martensite. Of course, with a fully ferritic matrix (the most dense microstructure), all the carbon in the alloy is present as graphite and the large graphite volume results in a low ultrasonic velocity. Consequently, it appears that graphite volume and matrix density have similar influences on ultrasonic velocity – both reduce velocity. In general, a low-density pearlitic alloy has significant amounts of combined carbon and thus a lower graphite fraction over ferritic ductile iron. Consequently, as pearlite fraction increases, the graphite volume decreases. With regard to ultrasonic velocity, an increase in pearlite content (and the attendant decrease in matrix density) is partially offset by a decrease in graphite volume fraction. Further examination of the data of this study revealed that the D5506 series, with a pearlite-ferrite matrix displayed the highest ultrasonic velocities for a given nodularity rating. It appears that the D5506 series contained optimum amounts of ferrite, pearlite and graphite volumes such that maximum ultrasonic velocities were achieved. Ultrasonic Velocity and Elastic Modulus It is generally understood that the ultrasonic velocity is related to the elastic modulus of the metal. As the graphite shape becomes more degenerate, both the ultrasonic velocity and the elastic modulus will decrease. The ultrasonic velocity has been plotted against elastic modulus for the irons of this study and the correlation is shown in Figure 8. The correlation between ultrasonic velocity and elastic modulus was found to be very poor.
2120
2140
2160
2180
2200
2220
2240
20 30 40 50 60 70 80 90 100 110
Nodularity, %
UT
Velo
city
x 1
04 , in
/ µse
c
Pearlitic VelocityFerritic SeriesDIS Data
DIS Research Project No. 37
Page 17 of 34
Figure 8. Relationship between ultrasonic velocity and elastic modulus.
SUMMARY The results of this study have revealed a number of findings, including the following.
1. Tensile strength and elongation decrease with decreasing nodularity. 2. The level of nodularity that produces acceptable properties varies with the grade of
ductile iron. 3. As strength increases, the degradation in properties occurs at higher nodularity values. 4. The correlation of nodularity and ultrasonic velocity is loose, but improves dramatically
when correlated within each grade of ductile iron. 5. The correlation of mechanical properties with ultrasonic velocity is poor. 6. In addition to nodularity, graphite volume, matrix structure and carbides strongly affect
ultrasonic velocity. The results of this study should reduce the confusion associated with rating microstructures and the expected properties in ductile iron castings. Furthermore, the results of the study should contribute to the ability to characterize the quality of a casting.
18
20
22
24
26
0.2160 0.2180 0.2200 0.2220 0.2240 0.2260
Velocity, in/µsec
Elas
tic M
odul
us, M
si
DIS Research Project No. 37
Page 18 of 34
RECOMMENDATIONS The literature and the findings of this study show that graphite structure, graphite volume fraction and section size all influence sonic properties. It has been proposed that the matrix microstructure (ferrite vs. pearlite vs. martensite) influences ultrasonic velocity through its influence on density. It has also been proposed that graphite volume similarly influences UT velocity. These findings suggest that there may be a good correlation of UT velocity with both nodularity and density. It is anticipated that some additional work will be conducted to further investigate the correlations of nodularity, sonic properties, density, and mechanical properties in some grades of ductile iron.
ACKNOWLEDGEMENTS The author wishes to acknowledge the contributions of Phil Seaton and DaimlerChrysler for providing all of the test castings for this investigation. The keel block molds used to pour the test bars were provided by Tony Thoma and Wescast. And, the ultrasonic testing performed by Randy Hunt and Citation-Brewton are gratefully acknowledged. The author also wishes to thank Al Alagarsamy for the technical support he provided during this study. And lastly, the helpful suggestions and support of Martin Gagne, Kathy Hayrynen, Jim Mullins and Phil Seaton who make up the DIS Steering Committee are greatly appreciated.
REFERENCES 1. Emerson, P.J., Simmons, W., "Final Report on the Evaluation of Graphite Form in Ferritic Ductile Irons by Ultrasonic and Sonic Testing and on the Effect of Graphite Form on Mechanical Properties", AFS Trans., Vol. 84, p. 109-128 (1976). 2. Fuller, A.G., "Evaluation of the Graphite Form in Pearlitic Ductile Iron by Ultrasonic and Sonic Testing and Effect of Graphite Form on Mechanical Properties", AFS Trans., Vol. 85, p. 509 (1977). 3. Fuller, A.G., "Effect of Graphite Form on Fatigue Properties of Pearlitic Ductile Irons ", AFS Trans., Vol. 85, p. 527 (1977). 4. Fuller, A.G., Emerson, P.J. and Sergeant, G.F. "A Report on the Effect Upon Mechanical Properties of Variation in Graphite Form in Irons Having Varying Amounts of Ferrite and Pearlite in the Matrix Structure and the Use of Nondestructive Tests in the Assessment of Mechanical Properties of Such Irons", AFS Trans., Vol. 88, p. 21 (1980).
DIS Research Project No. 37
Page 19 of 34
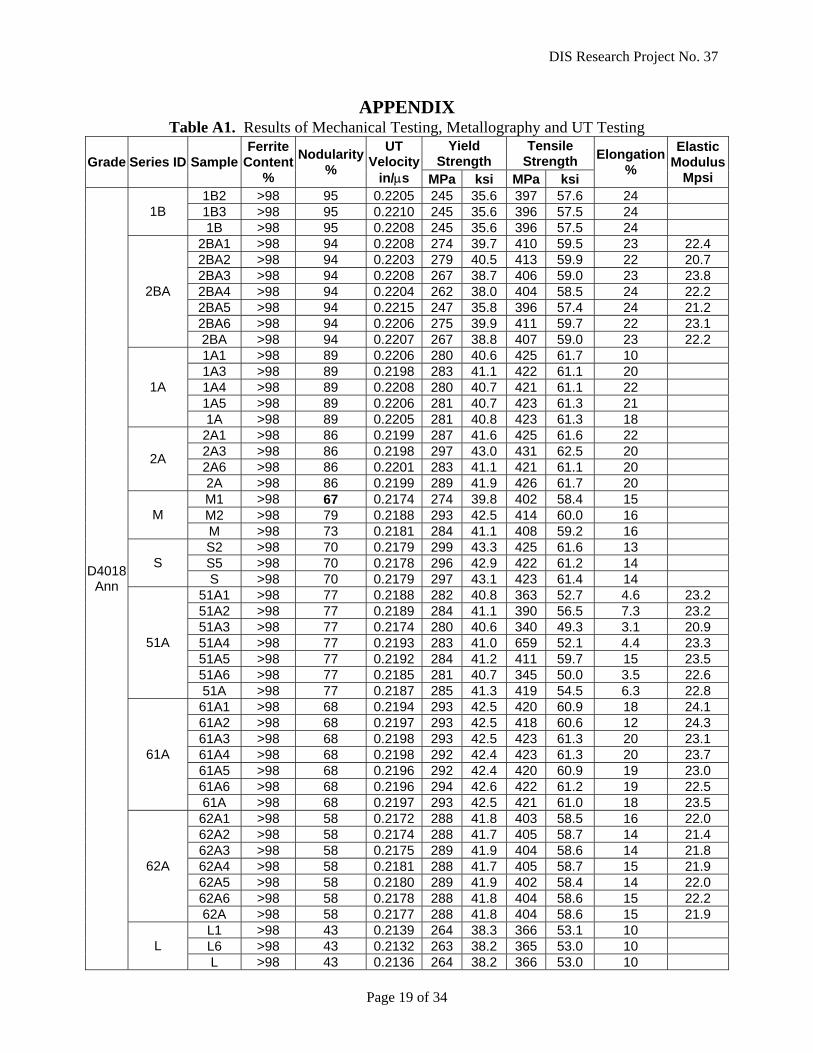
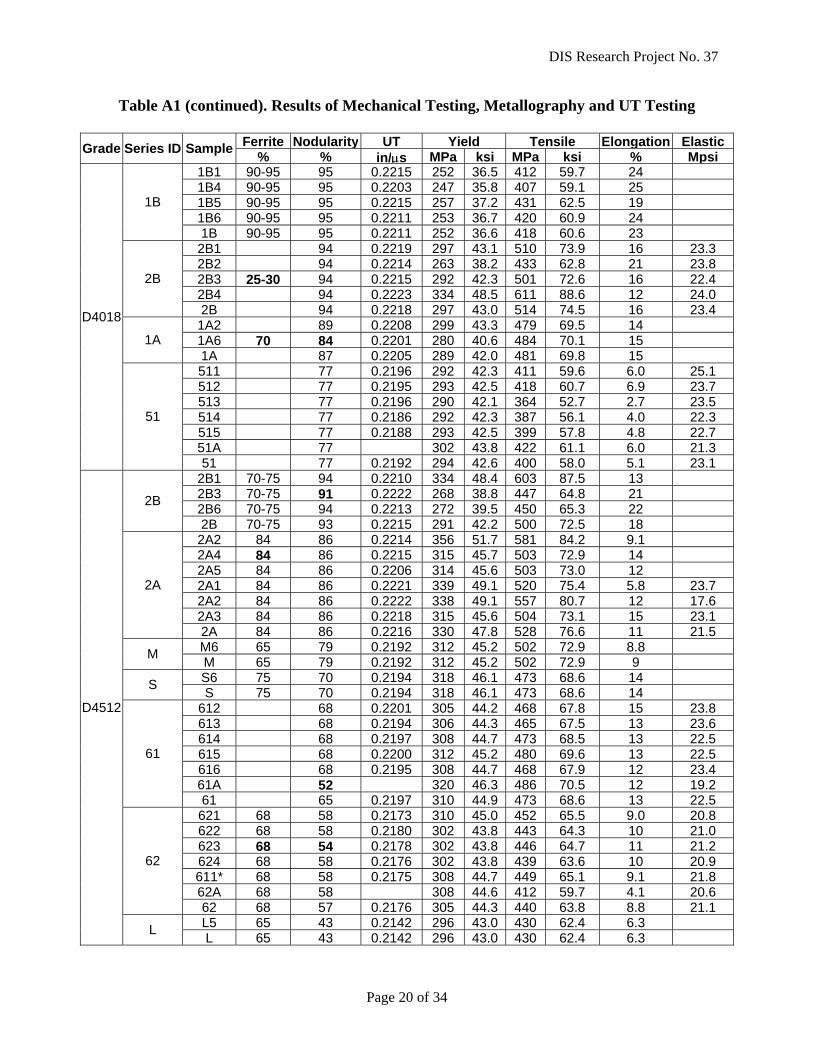
APPENDIX Table A1. Results of Mechanical Testing, Metallography and UT Testing
Yield Strength
Tensile Strength Grade Series ID Sample
Ferrite Content
%
Nodularity%
UT Velocity
in/µs MPa ksi MPa ksi
Elongation%
Elastic Modulus
Mpsi 1B2 >98 95 0.2205 245 35.6 397 57.6 24 1B3 >98 95 0.2210 245 35.6 396 57.5 24 1B 1B >98 95 0.2208 245 35.6 396 57.5 24
2BA1 >98 94 0.2208 274 39.7 410 59.5 23 22.4 2BA2 >98 94 0.2203 279 40.5 413 59.9 22 20.7 2BA3 >98 94 0.2208 267 38.7 406 59.0 23 23.8 2BA4 >98 94 0.2204 262 38.0 404 58.5 24 22.2 2BA5 >98 94 0.2215 247 35.8 396 57.4 24 21.2 2BA6 >98 94 0.2206 275 39.9 411 59.7 22 23.1
2BA
2BA >98 94 0.2207 267 38.8 407 59.0 23 22.2 1A1 >98 89 0.2206 280 40.6 425 61.7 10 1A3 >98 89 0.2198 283 41.1 422 61.1 20 1A4 >98 89 0.2208 280 40.7 421 61.1 22 1A5 >98 89 0.2206 281 40.7 423 61.3 21
1A
1A >98 89 0.2205 281 40.8 423 61.3 18 2A1 >98 86 0.2199 287 41.6 425 61.6 22 2A3 >98 86 0.2198 297 43.0 431 62.5 20 2A6 >98 86 0.2201 283 41.1 421 61.1 20 2A
2A >98 86 0.2199 289 41.9 426 61.7 20 M1 >98 67 0.2174 274 39.8 402 58.4 15 M2 >98 79 0.2188 293 42.5 414 60.0 16 M M >98 73 0.2181 284 41.1 408 59.2 16 S2 >98 70 0.2179 299 43.3 425 61.6 13 S5 >98 70 0.2178 296 42.9 422 61.2 14 S S >98 70 0.2179 297 43.1 423 61.4 14
51A1 >98 77 0.2188 282 40.8 363 52.7 4.6 23.2 51A2 >98 77 0.2189 284 41.1 390 56.5 7.3 23.2 51A3 >98 77 0.2174 280 40.6 340 49.3 3.1 20.9 51A4 >98 77 0.2193 283 41.0 659 52.1 4.4 23.3 51A5 >98 77 0.2192 284 41.2 411 59.7 15 23.5 51A6 >98 77 0.2185 281 40.7 345 50.0 3.5 22.6
51A
51A >98 77 0.2187 285 41.3 419 54.5 6.3 22.8 61A1 >98 68 0.2194 293 42.5 420 60.9 18 24.1 61A2 >98 68 0.2197 293 42.5 418 60.6 12 24.3 61A3 >98 68 0.2198 293 42.5 423 61.3 20 23.1 61A4 >98 68 0.2198 292 42.4 423 61.3 20 23.7 61A5 >98 68 0.2196 292 42.4 420 60.9 19 23.0 61A6 >98 68 0.2196 294 42.6 422 61.2 19 22.5
61A
61A >98 68 0.2197 293 42.5 421 61.0 18 23.5 62A1 >98 58 0.2172 288 41.8 403 58.5 16 22.0 62A2 >98 58 0.2174 288 41.7 405 58.7 14 21.4 62A3 >98 58 0.2175 289 41.9 404 58.6 14 21.8 62A4 >98 58 0.2181 288 41.7 405 58.7 15 21.9 62A5 >98 58 0.2180 289 41.9 402 58.4 14 22.0 62A6 >98 58 0.2178 288 41.8 404 58.6 15 22.2
62A
62A >98 58 0.2177 288 41.8 404 58.6 15 21.9 L1 >98 43 0.2139 264 38.3 366 53.1 10 L6 >98 43 0.2132 263 38.2 365 53.0 10
D4018 Ann
L L >98 43 0.2136 264 38.2 366 53.0 10
DIS Research Project No. 37
Page 20 of 34
Table A1 (continued). Results of Mechanical Testing, Metallography and UT Testing
Ferrite Nodularity UT Yield Tensile Elongation Elastic Grade Series ID Sample % % in/µs MPa ksi MPa ksi % Mpsi1B1 90-95 95 0.2215 252 36.5 412 59.7 24 1B4 90-95 95 0.2203 247 35.8 407 59.1 25 1B5 90-95 95 0.2215 257 37.2 431 62.5 19 1B6 90-95 95 0.2211 253 36.7 420 60.9 24
1B
1B 90-95 95 0.2211 252 36.6 418 60.6 23 2B1 94 0.2219 297 43.1 510 73.9 16 23.32B2 94 0.2214 263 38.2 433 62.8 21 23.82B3 25-30 94 0.2215 292 42.3 501 72.6 16 22.42B4 94 0.2223 334 48.5 611 88.6 12 24.0
2B
2B 94 0.2218 297 43.0 514 74.5 16 23.41A2 89 0.2208 299 43.3 479 69.5 14 1A6 70 84 0.2201 280 40.6 484 70.1 15 1A 1A 87 0.2205 289 42.0 481 69.8 15 511 77 0.2196 292 42.3 411 59.6 6.0 25.1512 77 0.2195 293 42.5 418 60.7 6.9 23.7513 77 0.2196 290 42.1 364 52.7 2.7 23.5514 77 0.2186 292 42.3 387 56.1 4.0 22.3515 77 0.2188 293 42.5 399 57.8 4.8 22.751A 77 302 43.8 422 61.1 6.0 21.3
D4018
51
51 77 0.2192 294 42.6 400 58.0 5.1 23.12B1 70-75 94 0.2210 334 48.4 603 87.5 13 2B3 70-75 91 0.2222 268 38.8 447 64.8 21 2B6 70-75 94 0.2213 272 39.5 450 65.3 22 2B
2B 70-75 93 0.2215 291 42.2 500 72.5 18 2A2 84 86 0.2214 356 51.7 581 84.2 9.1 2A4 84 86 0.2215 315 45.7 503 72.9 14 2A5 84 86 0.2206 314 45.6 503 73.0 12 2A1 84 86 0.2221 339 49.1 520 75.4 5.8 23.72A2 84 86 0.2222 338 49.1 557 80.7 12 17.62A3 84 86 0.2218 315 45.6 504 73.1 15 23.1
2A
2A 84 86 0.2216 330 47.8 528 76.6 11 21.5M6 65 79 0.2192 312 45.2 502 72.9 8.8 M M 65 79 0.2192 312 45.2 502 72.9 9 S6 75 70 0.2194 318 46.1 473 68.6 14 S S 75 70 0.2194 318 46.1 473 68.6 14 612 68 0.2201 305 44.2 468 67.8 15 23.8613 68 0.2194 306 44.3 465 67.5 13 23.6614 68 0.2197 308 44.7 473 68.5 13 22.5615 68 0.2200 312 45.2 480 69.6 13 22.5616 68 0.2195 308 44.7 468 67.9 12 23.461A 52 320 46.3 486 70.5 12 19.2
61
61 65 0.2197 310 44.9 473 68.6 13 22.5621 68 58 0.2173 310 45.0 452 65.5 9.0 20.8622 68 58 0.2180 302 43.8 443 64.3 10 21.0623 68 54 0.2178 302 43.8 446 64.7 11 21.2624 68 58 0.2176 302 43.8 439 63.6 10 20.9611* 68 58 0.2175 308 44.7 449 65.1 9.1 21.862A 68 58 308 44.6 412 59.7 4.1 20.6
62
62 68 57 0.2176 305 44.3 440 63.8 8.8 21.1L5 65 43 0.2142 296 43.0 430 62.4 6.3
D4512
L L 65 43 0.2142 296 43.0 430 62.4 6.3
DIS Research Project No. 37
Page 21 of 34
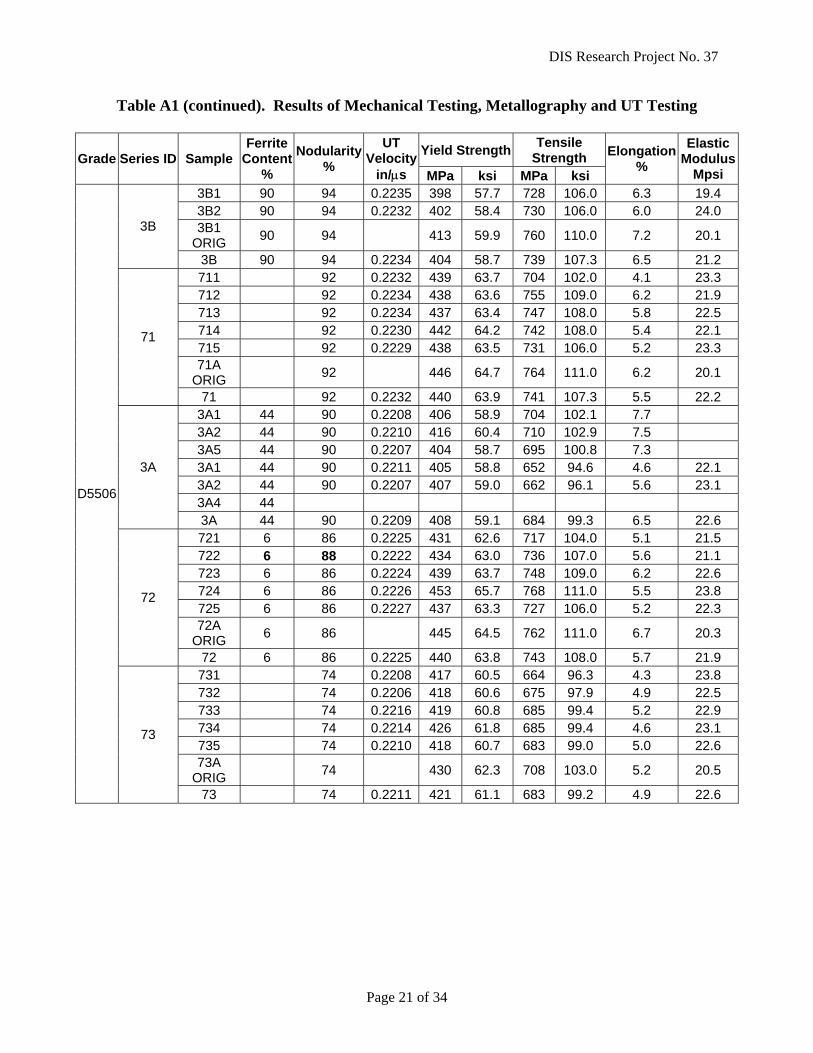
Table A1 (continued). Results of Mechanical Testing, Metallography and UT Testing
Yield Strength Tensile Strength Grade Series ID Sample
Ferrite Content
%
Nodularity%
UT Velocity
in/µs MPa ksi MPa ksi
Elongation%
Elastic Modulus
Mpsi 3B1 90 94 0.2235 398 57.7 728 106.0 6.3 19.4 3B2 90 94 0.2232 402 58.4 730 106.0 6.0 24.0 3B1
ORIG 90 94 413 59.9 760 110.0 7.2 20.1 3B
3B 90 94 0.2234 404 58.7 739 107.3 6.5 21.2 711 92 0.2232 439 63.7 704 102.0 4.1 23.3 712 92 0.2234 438 63.6 755 109.0 6.2 21.9 713 92 0.2234 437 63.4 747 108.0 5.8 22.5 714 92 0.2230 442 64.2 742 108.0 5.4 22.1 715 92 0.2229 438 63.5 731 106.0 5.2 23.3 71A
ORIG 92 446 64.7 764 111.0 6.2 20.1
71
71 92 0.2232 440 63.9 741 107.3 5.5 22.2 3A1 44 90 0.2208 406 58.9 704 102.1 7.7 3A2 44 90 0.2210 416 60.4 710 102.9 7.5 3A5 44 90 0.2207 404 58.7 695 100.8 7.3 3A1 44 90 0.2211 405 58.8 652 94.6 4.6 22.1 3A2 44 90 0.2207 407 59.0 662 96.1 5.6 23.1 3A4 44
3A
3A 44 90 0.2209 408 59.1 684 99.3 6.5 22.6 721 6 86 0.2225 431 62.6 717 104.0 5.1 21.5 722 6 88 0.2222 434 63.0 736 107.0 5.6 21.1 723 6 86 0.2224 439 63.7 748 109.0 6.2 22.6 724 6 86 0.2226 453 65.7 768 111.0 5.5 23.8 725 6 86 0.2227 437 63.3 727 106.0 5.2 22.3 72A
ORIG 6 86 445 64.5 762 111.0 6.7 20.3
72
72 6 86 0.2225 440 63.8 743 108.0 5.7 21.9 731 74 0.2208 417 60.5 664 96.3 4.3 23.8 732 74 0.2206 418 60.6 675 97.9 4.9 22.5 733 74 0.2216 419 60.8 685 99.4 5.2 22.9 734 74 0.2214 426 61.8 685 99.4 4.6 23.1 735 74 0.2210 418 60.7 683 99.0 5.0 22.6 73A
ORIG 74 430 62.3 708 103.0 5.2 20.5
D5506
73
73 74 0.2211 421 61.1 683 99.2 4.9 22.6
DIS Research Project No. 37
Page 22 of 34
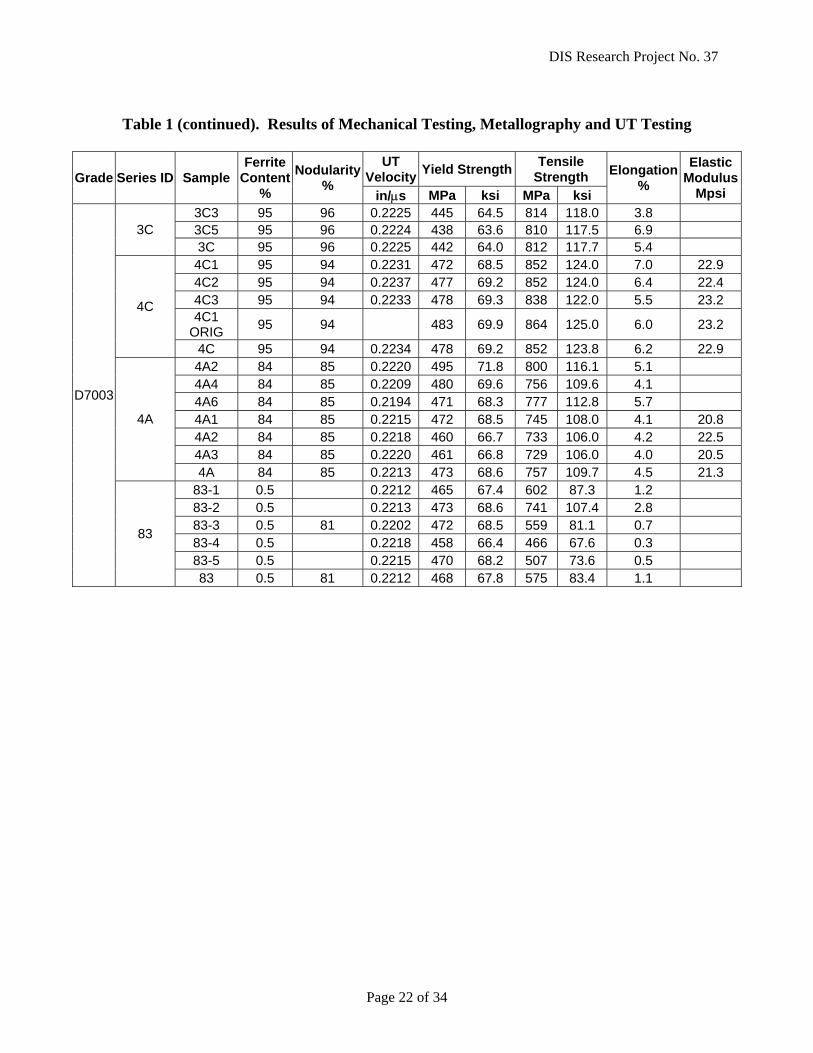
Table 1 (continued). Results of Mechanical Testing, Metallography and UT Testing
UT
Velocity Yield Strength Tensile Strength Grade Series ID Sample
Ferrite Content
%
Nodularity%
in/µs MPa ksi MPa ksi
Elongation%
Elastic Modulus
Mpsi 3C3 95 96 0.2225 445 64.5 814 118.0 3.8 3C5 95 96 0.2224 438 63.6 810 117.5 6.9 3C 3C 95 96 0.2225 442 64.0 812 117.7 5.4
4C1 95 94 0.2231 472 68.5 852 124.0 7.0 22.9 4C2 95 94 0.2237 477 69.2 852 124.0 6.4 22.4 4C3 95 94 0.2233 478 69.3 838 122.0 5.5 23.2 4C1
ORIG 95 94 483 69.9 864 125.0 6.0 23.2 4C
4C 95 94 0.2234 478 69.2 852 123.8 6.2 22.9 4A2 84 85 0.2220 495 71.8 800 116.1 5.1 4A4 84 85 0.2209 480 69.6 756 109.6 4.1 4A6 84 85 0.2194 471 68.3 777 112.8 5.7 4A1 84 85 0.2215 472 68.5 745 108.0 4.1 20.8 4A2 84 85 0.2218 460 66.7 733 106.0 4.2 22.5 4A3 84 85 0.2220 461 66.8 729 106.0 4.0 20.5
4A
4A 84 85 0.2213 473 68.6 757 109.7 4.5 21.3 83-1 0.5 0.2212 465 67.4 602 87.3 1.2 83-2 0.5 0.2213 473 68.6 741 107.4 2.8 83-3 0.5 81 0.2202 472 68.5 559 81.1 0.7 83-4 0.5 0.2218 458 66.4 466 67.6 0.3 83-5 0.5 0.2215 470 68.2 507 73.6 0.5
D7003
83
83 0.5 81 0.2212 468 67.8 575 83.4 1.1
DIS Research Project No. 37
Page 23 of 34
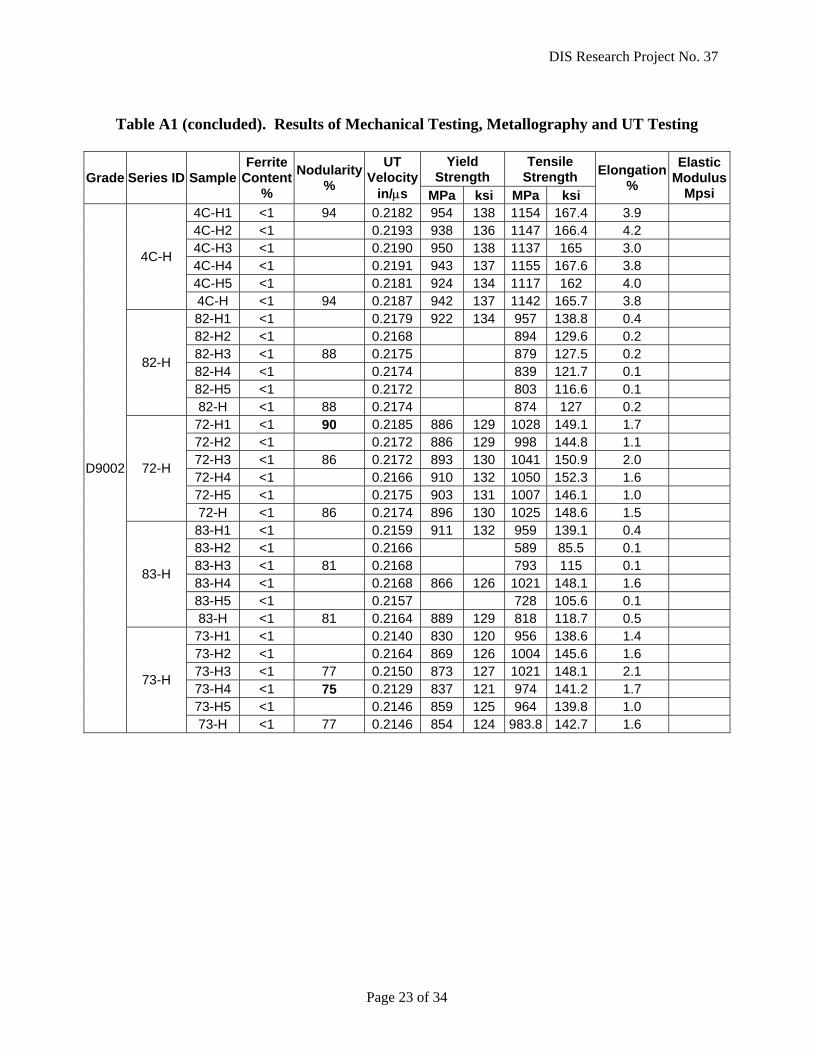
Table A1 (concluded). Results of Mechanical Testing, Metallography and UT Testing
Yield
Strength Tensile
Strength Grade Series ID Sample Ferrite
Content %
Nodularity%
UT Velocity
in/µs MPa ksi MPa ksi
Elongation%
Elastic Modulus
Mpsi 4C-H1 <1 94 0.2182 954 138 1154 167.4 3.9 4C-H2 <1 0.2193 938 136 1147 166.4 4.2 4C-H3 <1 0.2190 950 138 1137 165 3.0 4C-H4 <1 0.2191 943 137 1155 167.6 3.8 4C-H5 <1 0.2181 924 134 1117 162 4.0
4C-H
4C-H <1 94 0.2187 942 137 1142 165.7 3.8 82-H1 <1 0.2179 922 134 957 138.8 0.4 82-H2 <1 0.2168 894 129.6 0.2 82-H3 <1 88 0.2175 879 127.5 0.2 82-H4 <1 0.2174 839 121.7 0.1 82-H5 <1 0.2172 803 116.6 0.1
82-H
82-H <1 88 0.2174 874 127 0.2 72-H1 <1 90 0.2185 886 129 1028 149.1 1.7 72-H2 <1 0.2172 886 129 998 144.8 1.1 72-H3 <1 86 0.2172 893 130 1041 150.9 2.0 72-H4 <1 0.2166 910 132 1050 152.3 1.6 72-H5 <1 0.2175 903 131 1007 146.1 1.0
72-H
72-H <1 86 0.2174 896 130 1025 148.6 1.5 83-H1 <1 0.2159 911 132 959 139.1 0.4 83-H2 <1 0.2166 589 85.5 0.1 83-H3 <1 81 0.2168 793 115 0.1 83-H4 <1 0.2168 866 126 1021 148.1 1.6 83-H5 <1 0.2157 728 105.6 0.1
83-H
83-H <1 81 0.2164 889 129 818 118.7 0.5 73-H1 <1 0.2140 830 120 956 138.6 1.4 73-H2 <1 0.2164 869 126 1004 145.6 1.6 73-H3 <1 77 0.2150 873 127 1021 148.1 2.1 73-H4 <1 75 0.2129 837 121 974 141.2 1.7 73-H5 <1 0.2146 859 125 964 139.8 1.0
D9002
73-H
73-H <1 77 0.2146 854 124 983.8 142.7 1.6
DIS Research Project No. 37
Page 24 of 34
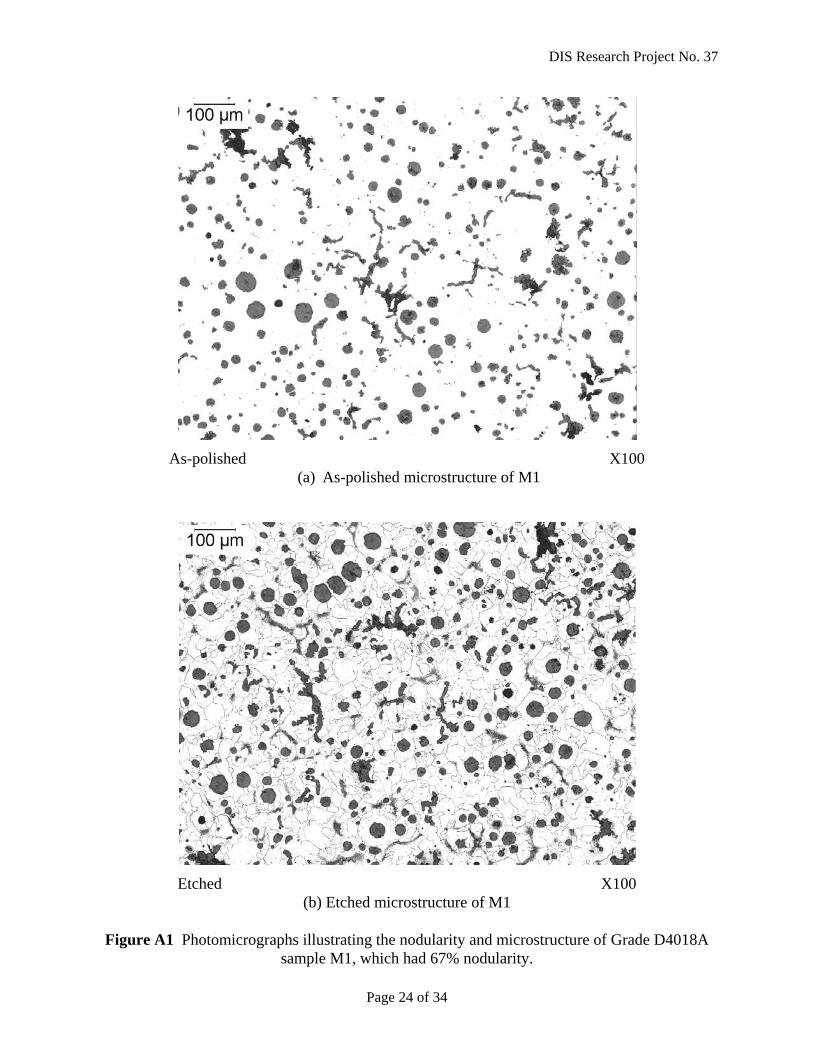
As-polished X100 (a) As-polished microstructure of M1
Etched X100 (b) Etched microstructure of M1
Figure A1 Photomicrographs illustrating the nodularity and microstructure of Grade D4018A
sample M1, which had 67% nodularity.
DIS Research Project No. 37
Page 25 of 34
Figure 1
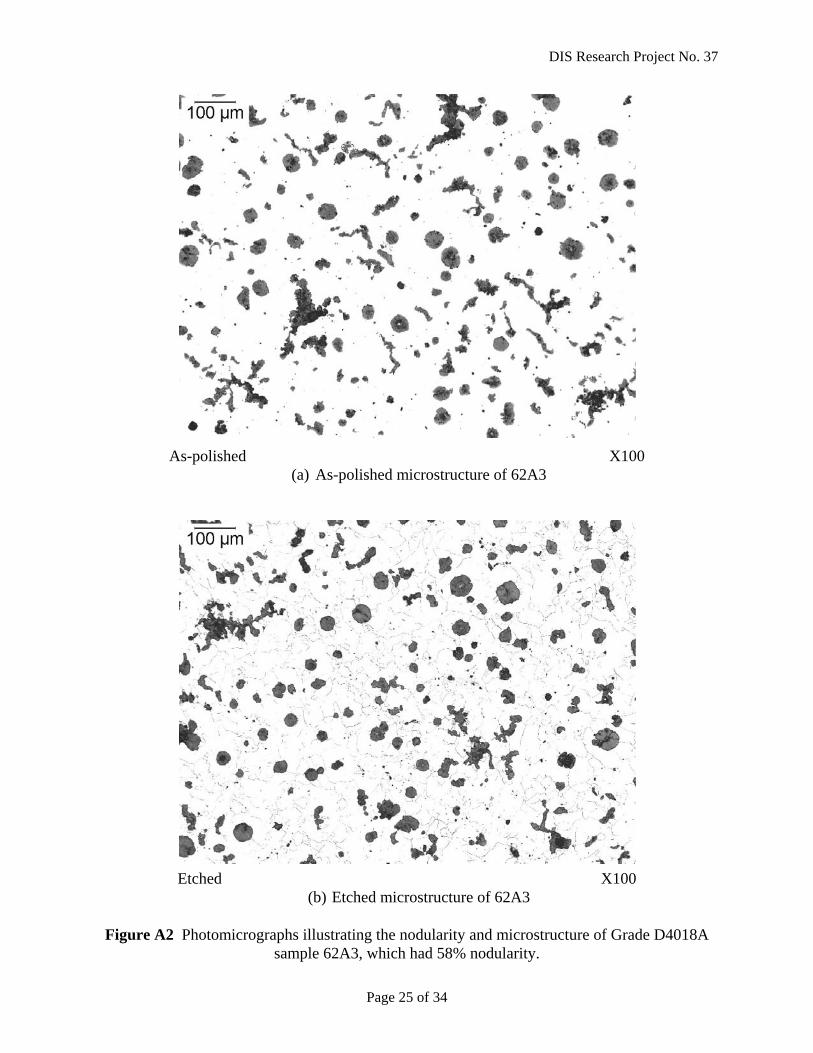
As-polished X100 (a) As-polished microstructure of 62A3
Figure 2
Etched X100 (b) Etched microstructure of 62A3
Figure A2 Photomicrographs illustrating the nodularity and microstructure of Grade D4018A
sample 62A3, which had 58% nodularity.
DIS Research Project No. 37
Page 26 of 34
Figure 3
Figure 4
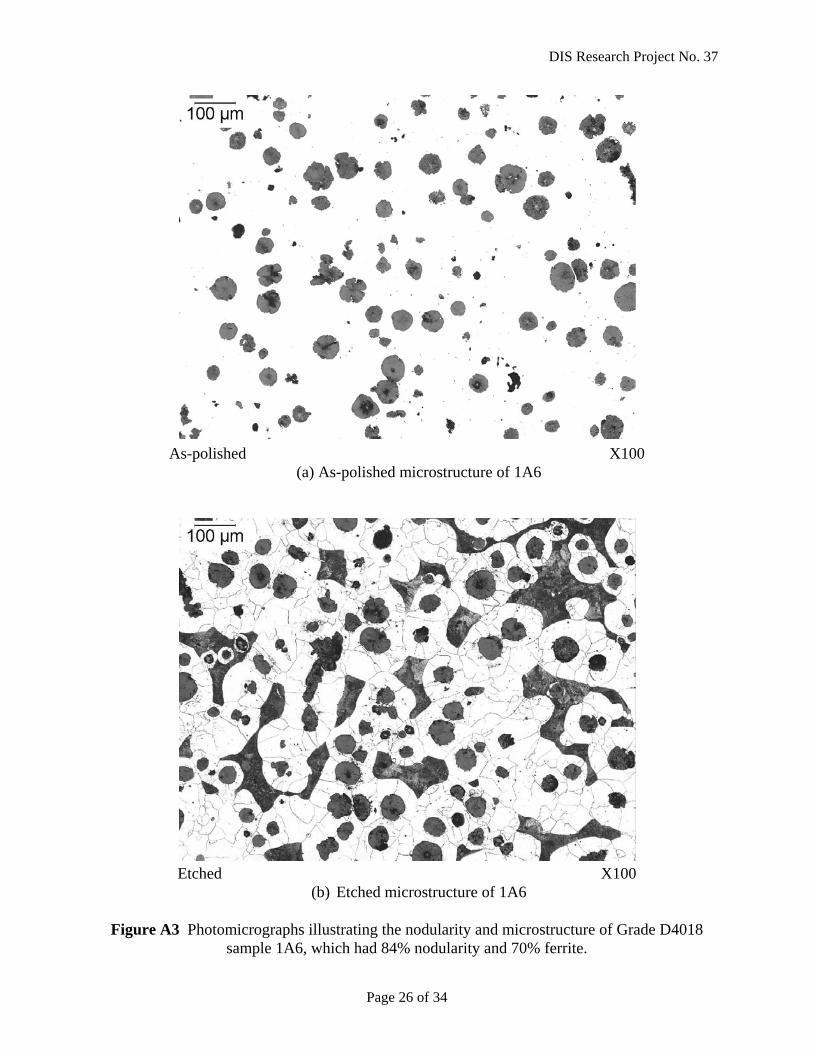
As-polished X100 (a) As-polished microstructure of 1A6
Figure 5
Figure 6
Etched X100 (b) Etched microstructure of 1A6
Figure A3 Photomicrographs illustrating the nodularity and microstructure of Grade D4018
sample 1A6, which had 84% nodularity and 70% ferrite.
DIS Research Project No. 37
Page 27 of 34
Figure 7
Figure 8
Figure 9
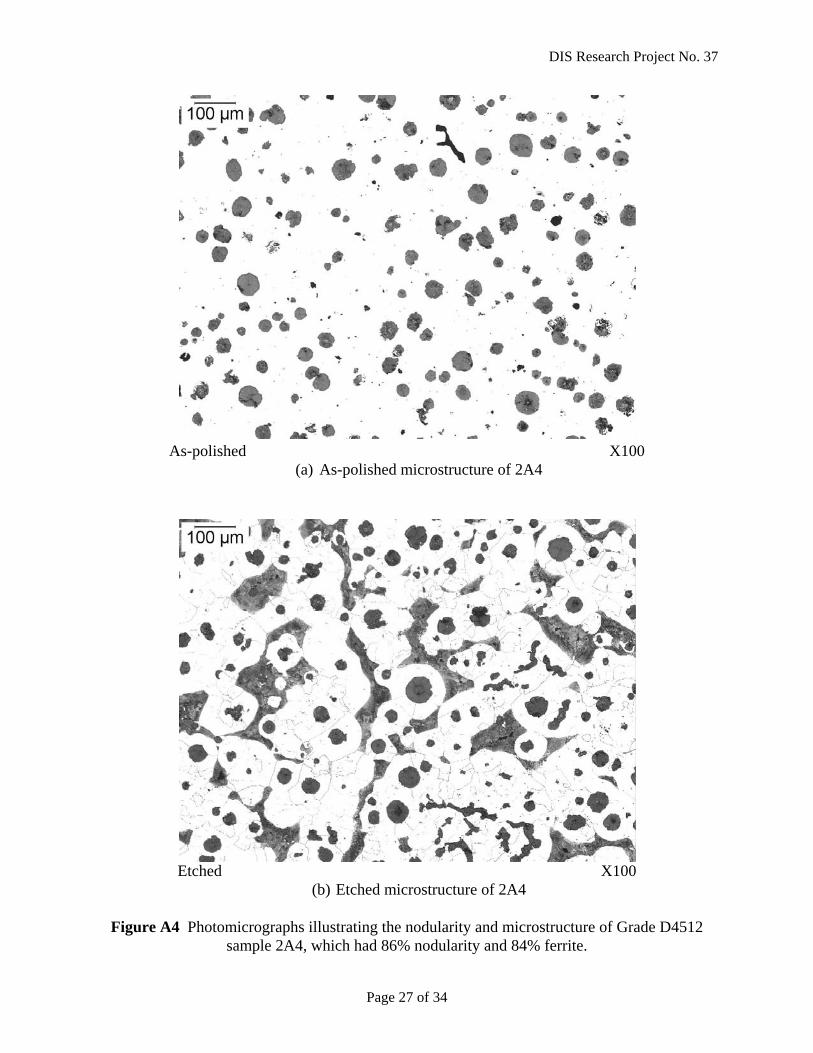
As-polished X100 (a) As-polished microstructure of 2A4
Figure 10
Figure 11
Etched X100 (b) Etched microstructure of 2A4
Figure A4 Photomicrographs illustrating the nodularity and microstructure of Grade D4512
sample 2A4, which had 86% nodularity and 84% ferrite.
DIS Research Project No. 37
Page 28 of 34
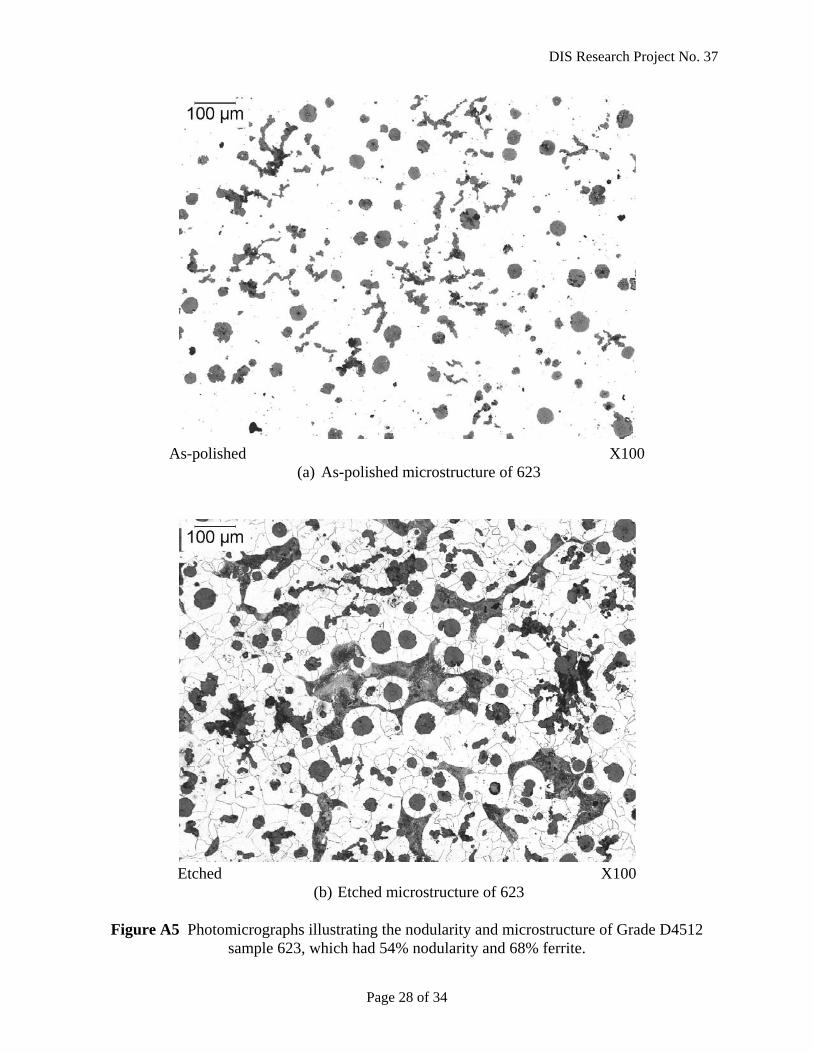
Figure 12
Figure 13
As-polished X100 (a) As-polished microstructure of 623
Figure 14
Figure 15
Etched X100 (b) Etched microstructure of 623
Figure A5 Photomicrographs illustrating the nodularity and microstructure of Grade D4512
sample 623, which had 54% nodularity and 68% ferrite.
DIS Research Project No. 37
Page 29 of 34
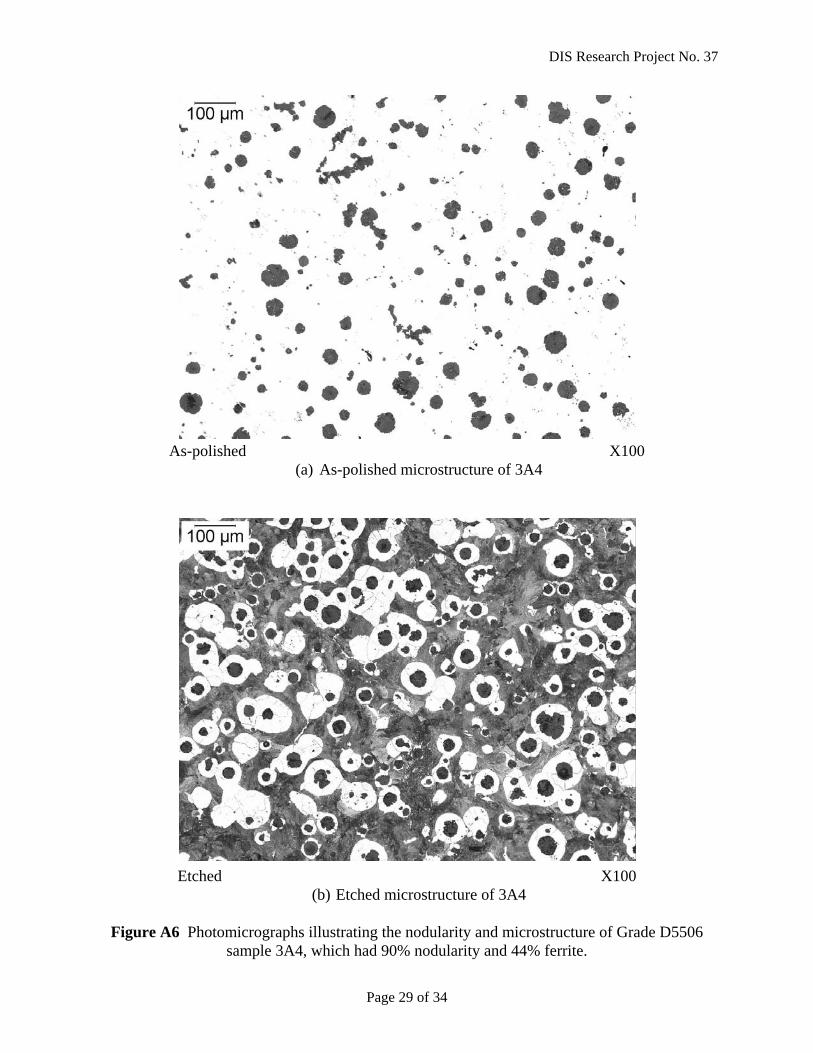
Figure 16
Figure 17
Figure 18
As-polished X100 (a) As-polished microstructure of 3A4
Etched X100 (b) Etched microstructure of 3A4
Figure A6 Photomicrographs illustrating the nodularity and microstructure of Grade D5506
sample 3A4, which had 90% nodularity and 44% ferrite.
DIS Research Project No. 37
Page 30 of 34
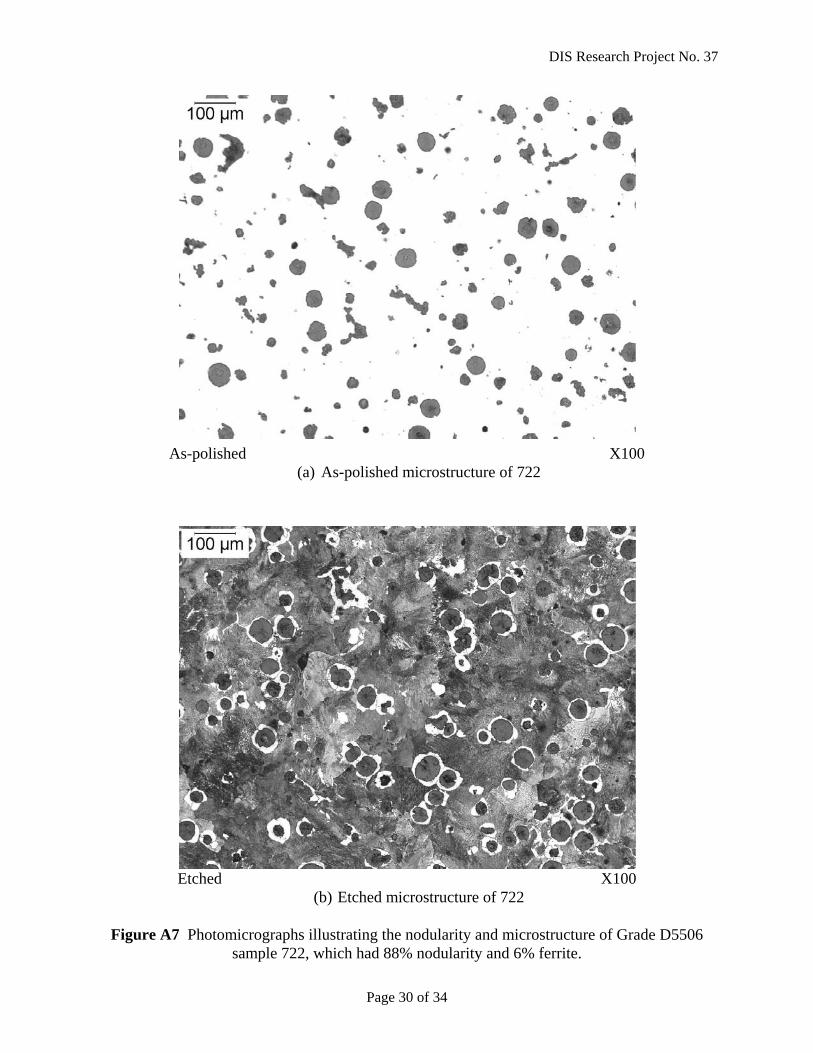
Figure 19
Figure 20
Figure 21
As-polished X100 (a) As-polished microstructure of 722
Etched X100 (b) Etched microstructure of 722
Figure A7 Photomicrographs illustrating the nodularity and microstructure of Grade D5506
sample 722, which had 88% nodularity and 6% ferrite.
DIS Research Project No. 37
Page 31 of 34
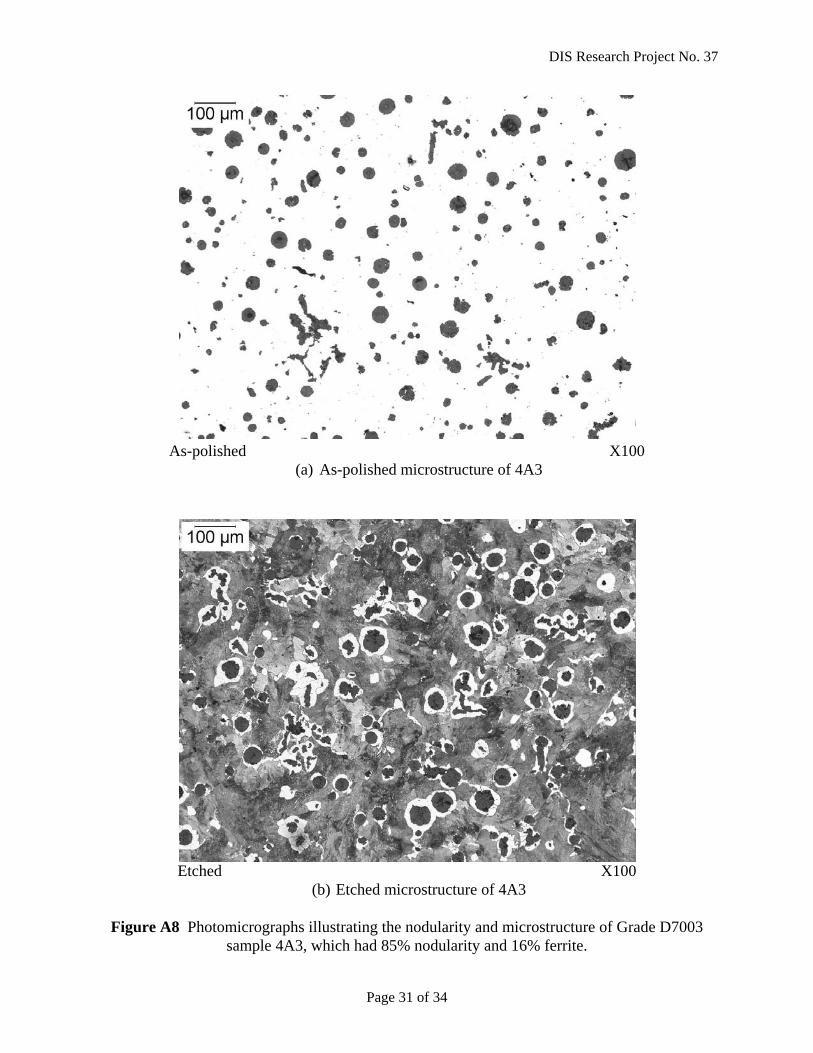
Figure 22
As-polished X100 (a) As-polished microstructure of 4A3
Etched X100 (b) Etched microstructure of 4A3
Figure A8 Photomicrographs illustrating the nodularity and microstructure of Grade D7003
sample 4A3, which had 85% nodularity and 16% ferrite.
DIS Research Project No. 37
Page 32 of 34
Figure 23
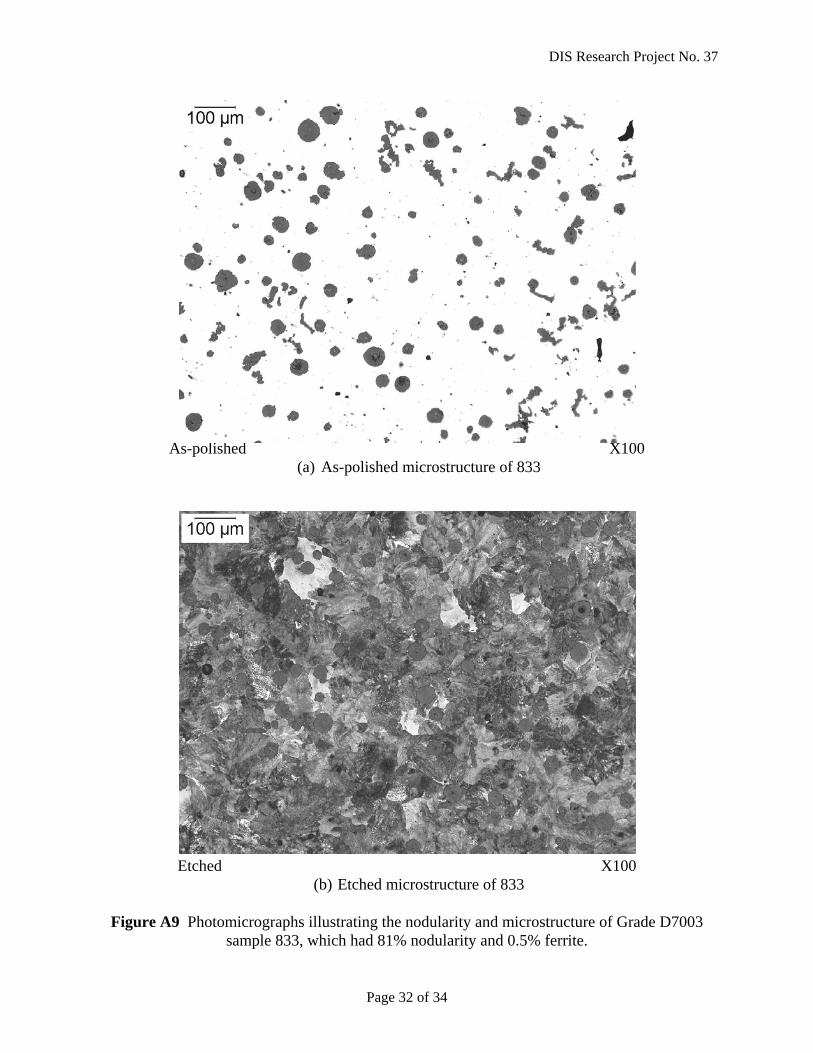
As-polished X100 (a) As-polished microstructure of 833
Figure 24
Etched X100 (b) Etched microstructure of 833
Figure A9 Photomicrographs illustrating the nodularity and microstructure of Grade D7003
sample 833, which had 81% nodularity and 0.5% ferrite.
DIS Research Project No. 37
Page 33 of 34
Figure 25
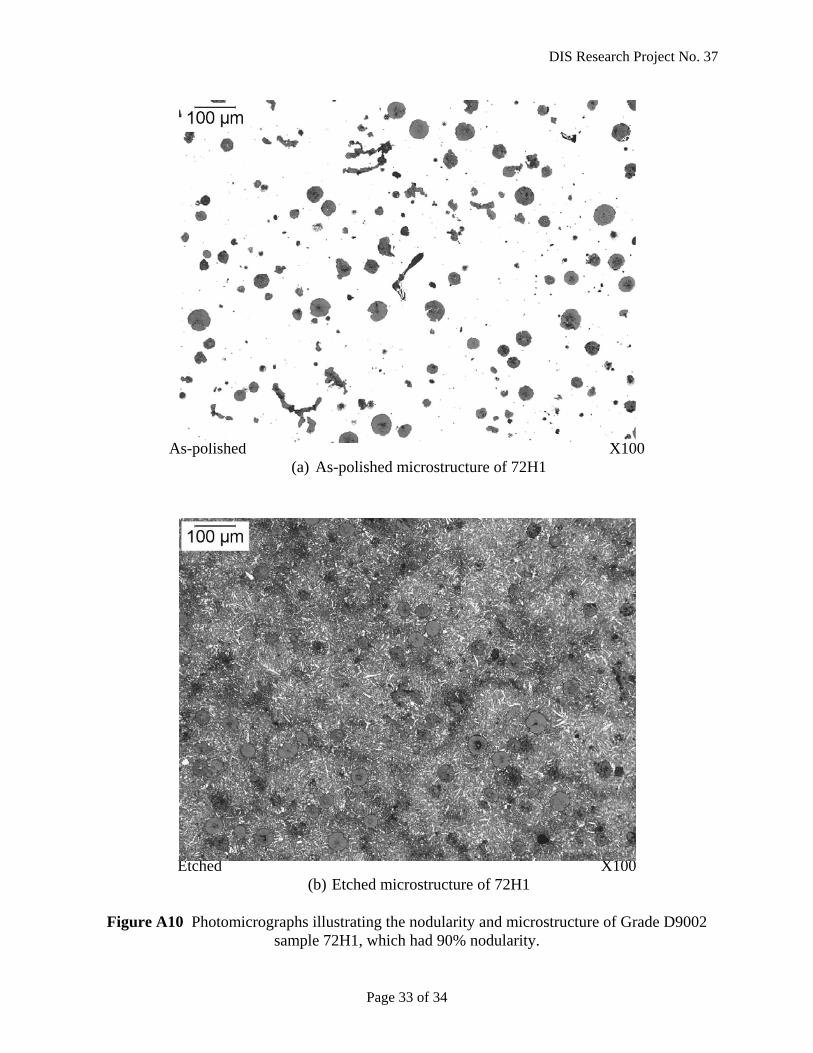
As-polished X100 (a) As-polished microstructure of 72H1
Etched X100 (b) Etched microstructure of 72H1
Figure A10 Photomicrographs illustrating the nodularity and microstructure of Grade D9002
sample 72H1, which had 90% nodularity.
DIS Research Project No. 37
Page 34 of 34
Figure 26
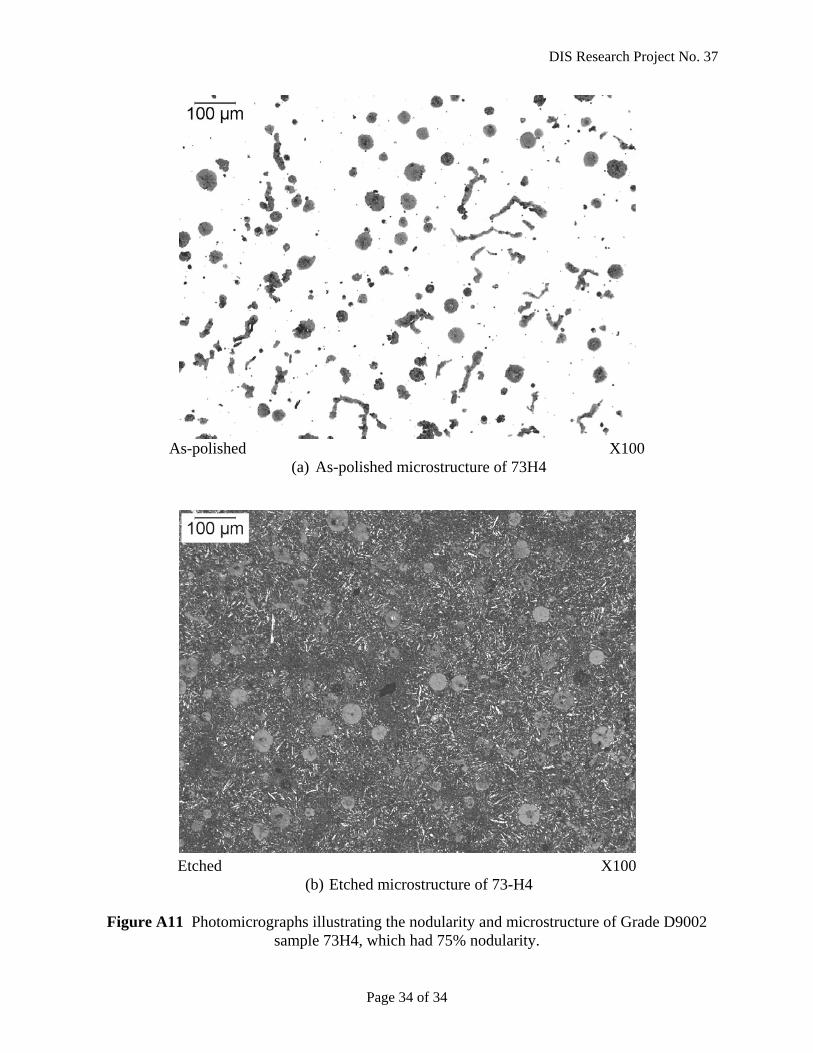
As-polished X100 (a) As-polished microstructure of 73H4
Etched X100 (b) Etched microstructure of 73-H4
Figure A11 Photomicrographs illustrating the nodularity and microstructure of Grade D9002
sample 73H4, which had 75% nodularity.


![Ductile Iron Digest1]](https://static.fdocuments.net/doc/165x107/56d6c04d1a28ab301699d0b6/ductile-iron-digest1.jpg)