DUBBO TRANSPORTATION STRATEGY 2020
67
STAPLETON TRANSPORTATION AND PLANNING Pty Ltd ABN 49 051 948 531 PO Box 854 Edgecliff 2027 NSW Email [email protected] www.stap.com.au DUBBO TRANSPORTATION STRATEGY 2020 Prepared for Dubbo Regional Council May 2020
Transcript of DUBBO TRANSPORTATION STRATEGY 2020

STAPLETON TRANSPORTATION AND PLANNING Pty Ltd
ABN 49 051 948 531
PO Box 854 Edgecliff 2027 NSWEmail [email protected]
www.stap.com.au
DUBBO TRANSPORTATION STRATEGY
2020
Prepared for Dubbo Regional Council
May 2020

2020 DUBBO TRANSPORTATION STRATEGY
STAPLETON TRANSPORTATION & PLANNING Pty Ltd 2
CONTENTS
Page #
1. SCOPE OF WORK 3
1.1. Goals 3 1.2. Scale of Development 5 1.3. Information Gathered - Outline Of Work Conducted 5
2. DIRECTIONS 6
2.1. Priority for North Bridge 6 2.2. Future Population 8 2.3. Future Employment 12 2.4. Strategic Roads 15 2.5. Natural Assets 16 2.6. Future Transport Modes 17
3. TRANSPORT PATTERNS 21
3.1. Current Patterns 21 3.2. Patterns Of Growth 23
4. ROADS FOR THE FUTURE 28
5. CONCLUSIONS 32
5.1. Reference to Modelling 32 5.2. 2020 - 2030 10 Year Investment Program 32 5.3. 2020 - 2025 5 Year Priority 37 5.4. 2030 - 2040 20 Year Investment Program 40 5.5. 2040 – 2055 35 Year Investment Horizon 43 5.6. Goals Achieved 46 5.7. Towards 100,000 46 5.8. Next Steps 50
6. DATA ANALYSIS 52
6.1. Modelling Process 52 6.2. Transport Task 53 6.3. Network Performance 54 6.4. Cost and Savings 56 6.5. Traffic Flows 58 6.6. Surveys 65

2020 DUBBO TRANSPORTATION STRATEGY
STAPLETON TRANSPORTATION & PLANNING Pty Ltd 3
1. SCOPE OF WORK
1.1. Goals
1.1.1. Resolving Current Transport Issues
Dubbo is losing its ten-minute City feel where most trips can be made in under ten minutes. Just a few
delays can make the journey feel much longer. Whilst the rapidly growing changes in traffic conditions
are observed throughout Dubbo, including say crossing Cobra St from Dubbo South or entering the Emile
Serisier Bridge from Thompson St the main Issues are associated with the Highways.
Figure 1.1 Current Transport Issues
The major current transport issues are:
Overcrowding on the LH Ford Bridge
Excessive heavy vehicle movement in Erskine St
Turning of heavy vehicles and all traffic at the intersection of Mitchell Hwy and Newell
Hwy in West Dubbo
Increasing traffic in Cobra St
2020 DUBBO TRANSPORTATION STRATEGY
STAPLETON TRANSPORTATION & PLANNING Pty Ltd 4
1.1.2. Responding to State Investment for North Bridge
The State Government is funding the construction of a second high level bridge, partly in response to the
growing level of delays in Dubbo, more specifically to improving trucks manoeuvring through the town
streets and as a State policy to upgrade the Newell Hwy for operations during flood events, at least until
for the 10 year flood occurrence (that is expected to increase in frequency). Council has the opportunity
to benefit from this investment. This bridge is referred to as North Bridge.
1.1.3. Optimising Public and Private Investment
Development in Dubbo has always been encouraged and supported by Council. This included Council
having a robust developer contribution system that is both fair and equitable. There is an opportunity to
direct these funds to facilitate current and future development in an efficient manner.
1.1.4. Maintain Quality of Life for 20,000 New Residents
The population of Dubbo has been increasing consistently over many years; this analysis is based on this
increase continuing.
One of the primary attractions to Dubbo is its lifestyle, everything available at short notice using a high
quality public realm. This is attracting younger people who grew up in Dubbo to return to the quality of
life they remember. One element is the quality of the town centre both in the facilities provided and in
the public realm. Part of this is a general lack of intrusive traffic; for, whilst the Highways are busy, they
have been generally free from congestion and therefore less pollution and Macquarie St has its own
relaxed pace.
New transport infrastructure must support growth without decreasing amenity.
1.1.5. Maintain Dubbo as a Competitive Community
Another major attraction to Dubbo is job opportunities. Commercial investment is encouraged by a
cohesive approach to location, amenity, accessibility and cost. This has been recognised by the
development of Enterprise Zones. The East Dubbo area also has access to the Blueridge Business Plan
and bulky goods retailing.
The transport infrastructure needs to enhance commercial development.
2020 DUBBO TRANSPORTATION STRATEGY
STAPLETON TRANSPORTATION & PLANNING Pty Ltd 5
1.2. Scale of Development
The growth in population is a fixed input to this study. Residential development will occur in four Sectors.
The footprint for existing development is located predominantly on the east side of the Macquarie River.
The eastern side will be fully built out in the next 10 to 20 years (Excluding rural residential). Land is
available for development to the west that is close to the City centre. This will continue to deliver the
efficient 10-minute City. Further details of the staging of development are discussed in Chapter 2.
The analysis of transport infrastructure is generally based on a detailed 10 year plan, when most variables
can be estimated accurately; a 20 year plan that supports the continuing trends in population and
employment; and a 35 year horizon with the main purpose being to measure the ongoing role of Projects
built in the first 20 years. This is relevant to major infrastructure. For example; a new bridge should
accommodate the projected flow for 35 years either by additional traffic lanes that are built on at the
time, or plans to provide a second bridge during this period. This optimises public investment.
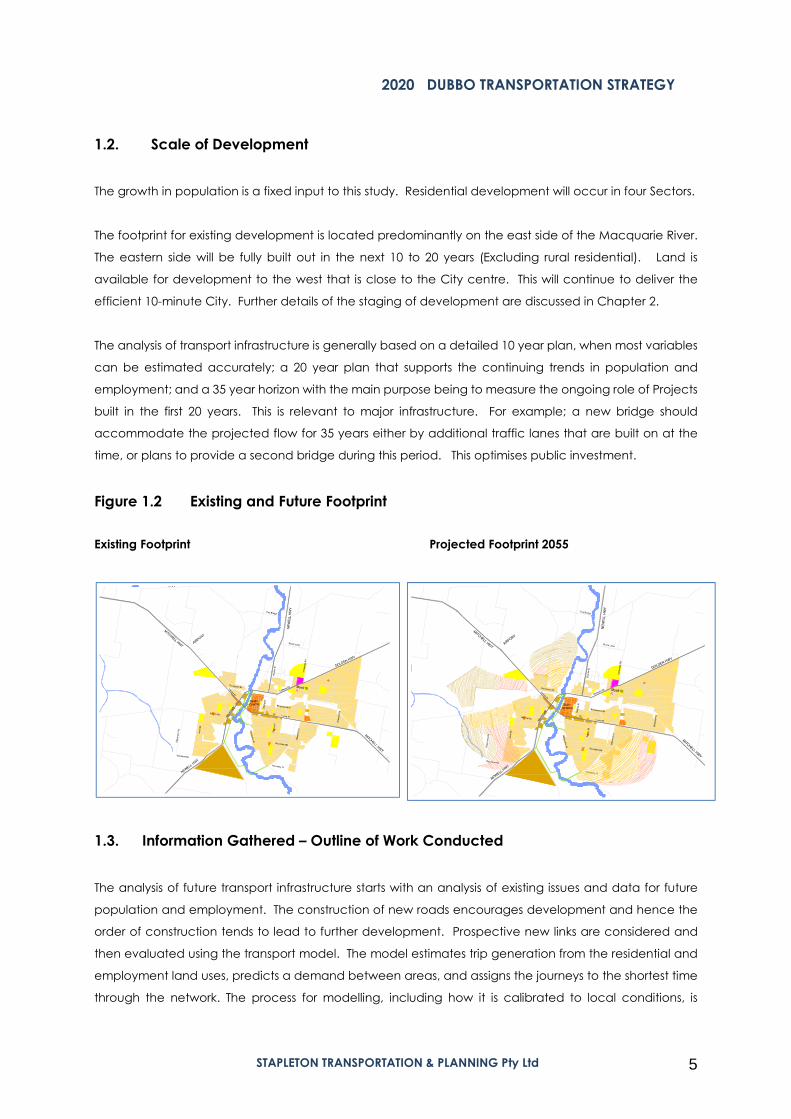
Figure 1.2 Existing and Future Footprint
Existing Footprint Projected Footprint 2055
1.3. Information Gathered – Outline of Work Conducted
The analysis of future transport infrastructure starts with an analysis of existing issues and data for future
population and employment. The construction of new roads encourages development and hence the
order of construction tends to lead to further development. Prospective new links are considered and
then evaluated using the transport model. The model estimates trip generation from the residential and
employment land uses, predicts a demand between areas, and assigns the journeys to the shortest time
through the network. The process for modelling, including how it is calibrated to local conditions, is

2020 DUBBO TRANSPORTATION STRATEGY
STAPLETON TRANSPORTATION & PLANNING Pty Ltd 6
described further in Chapter 6. The model has the advantage of providing a logic to the initial concepts
and placing them in priority with other potential projects. The patterns of movement are discussed in
Chapter 3 and indicate when links will be required. The type of roads required impacts on cost; these are
described in Chapter 4. Different scenarios are considered for each time period, these and the
conclusions are discussed in Chapter 5.
Firstly, in Chapter 2 below, is a discussion on how the goals can be directed to shape the expansion of
Dubbo. These topics have been guided by a number of internal workshops where different skills have
been applied to direct the value of the study.
2. DIRECTIONS
2.1. Priority for North Bridge
The construction of North Bridge and its associated infrastructure is a priority for the State Government.
The works include (See Figure 1)
1. A new high-level bridge in the alignment of River St.
2. A flood free Riverside connection road on the western bank of the Macquarie
River.
3. Realignment of the intersection of Emile Serisier Bridge with Whylandra St to provide
flood free access to the new bridge (details not provided by the RMS).
4. Reconfiguration of intersection of Mitchell Hwy and Newell Hwy in West Dubbo to
facilitate turning of Trucks in all directions and to accommodate future demand.

2020 DUBBO TRANSPORTATION STRATEGY
STAPLETON TRANSPORTATION & PLANNING Pty Ltd 7
Figure 2.1 North Bridge and Highway Works
2.1.1 Flood Free Route
The primary purpose of the North Bridge for the State of NSW is the provision of a second high-level bridge
operating during flood events. Recent flood events have resulted in chaos and extensive delays on the
LH Ford Bridge. Unfortunately the Newell Hwy north of River St (e.g. Bourke St) and Fitzroy St are flood
affected. Therefore, whilst a second bridge will reduce congestion during flood events (when just 2 of 3
bridges will be operating), without further changes to the network traffic, the Newell Hwy will be forced
to return to Erskine St and thence use Yarrandale Rd to access the north at Troy Crossing. This issue has
been considered and it is proposed to open River St through to Yarrandale Rd during flood events; this is
discussed further in 5.2.4.
2.1.2 Integration with Prime Development Area
Another major issue to address is that the western side of North Bridge lands into the centre of the primary
riverside development area of the City. This area has been identified for development for over 20 years.
Figure 2.2 (a) illustrates an indicative road network for the Northwest Sector drawn up in the 2007 Structure
Plan. The diversion of the Newell Hwy from Erskine St will also continue to pass directly (Figure 2.2 (b)
through West Dubbo which were also identified in the 2007 Structure Plan as the next stage of
development of the City Centre, required as the Western Parts of Dubbo expand.

2020 DUBBO TRANSPORTATION STRATEGY
STAPLETON TRANSPORTATION & PLANNING Pty Ltd 8
Figure 2.2 Opportunity for Prime Development (2007)
a) Indicative Development of Northwest Sector b) Indicative Twin Development of City Centre
The 2007 Structure Plan also identified (Figure 2.2 (c)) as a prime development corridor of the “Riverside
Boulevard”. This was identified to accommodate prime commercial development, which could include;
hotels, accommodation, high end offices and health care; all set in front of residential estates with River
St West as a local centre. This was planned on the premise that highway traffic would, at some point be
diverted to a Northern Bypass from Troy Crossing connecting to a Western Bypass at the Mitchell Hwy and
then continuing south to re-join the Newell Hwy south of the Zoo. This was the 2007 plan and has been
amended during the preparation of this strategy in response to the consequences of the North Bridge
proposal.
c) 2007 Riverside Commercial Opportunity d) 2018 Twin Enterprise Zones
The most recent incentive for attracting employment to Dubbo has been the twin Enterprise Zones near
the Dubbo City Regional Airport and the Dubbo Base Hospital that will also impact on the RMS/State plan
for a Highway connection using North Bridge. This is discussed further in 2.3.3.

2020 DUBBO TRANSPORTATION STRATEGY
STAPLETON TRANSPORTATION & PLANNING Pty Ltd 9
2.1.3 Need for Long Term Resolution of Traffic Intrusion
The relocation of the Newell Hwy to the proposed route still leaves the question of how to reduce the
impact of the City traffic on highway traffic in the long term.
2.2. Future Population
2.2.1 Development Trends and Population
The basic predictor for this study has been the ongoing increase in the number of houses built in Dubbo.
It has been assumed that the rate of 250 new households per year will be maintained into the future. This
is not further discussed here. There is an underlying statistic (ABS) that household size is decreasing in
Dubbo and throughout Australia, brought on by factors including an ageing population and more single
parents. This statistic is relevant to the number of employees and therefore the journey to work. (See 2.3).
2.2.2 Distribution of Future Residential Development
The precise location of new development is not required for modelling because it will be served by only
a few roads. Hence although the exact areas of each new estate have been identified they are shown
in Figure 2.3 as hatching per decade.
TABLE 2.1 HOUSEHOLDS AND POPULATIO
Projected
Development
Recent Trend 2015 - 2020 (1250)
10 Year Contribution Plan 2020 - 2025 1250
2025 - 2030 1250
20 Year Rollling Plan 2030 - 2040 2500
35 Year Project Life 2040 - 2055 3050
ON PROJECTION
Households Persons per Population
household
14796 2.56 37878
16046 2.53 40667
17296 2.51 43397
19796 2.46 48676
22846 2.41 55052

2020 DUBBO TRANSPORTATION STRATEGY
STAPLETON TRANSPORTATION & PLANNING Pty Ltd 10
Figure 2.3 Residential Staging (By Decade/Colours)
Table 2.2 summarises the information in Figure 2.3.
Development is expected to continue to be concentrated in the SE Sector in the next five years with 60%
of new housing, and 20% in the SW and NW Sector. In the following five years the completion of North
Bridge is expected to concentrate 44% of new housing in the NW Sector, whilst still maintaining 36% in the
SE Sector. No development is expected in the SW Sector in the next 10 years with only the Delroy West
Estate being completed adjacent to Minore Rd in addition to some rural residential estates. The total
development for 2020 is 1200 in the SE Sector that 800 in the NW Sector, and 500 in the SW Sector that will
be subject to a new roads Section 7.11 (formerly Section 94).

2020 DUBBO TRANSPORTATION STRATEGY
STAPLETON TRANSPORTATION & PLANNING Pty Ltd 11
The capacity of the SE Sector is expected to be complete with 800 dwellings built in the period 2030 –
2040. The concentration of development during this period is expected to be in the SW Sector, mostly
along Joira Rd and Chapmans Rd. The SW Sector will accommodate its first estates.
Development is expected to be contained mostly within a 5km radius of the City Centre during the next
15 years until 2055. The majority of new housing, 51%, occurring in NW Sector, and a further 30% in the CW
Sector, possibly low density lifestyle development. Only 3050 new houses have been allocated into the
sectors in the 2040 – 2055 period, this is 700 short of the 250 new households per year used in this analysis.
The reason for this is an assumption that increased density of housing in existing areas will have become
a trend by this stage, due in part to the smaller household size and retirement housing. Funding for
transport upgrades in existing areas is considered separately.
2.2.3 Capacity of Sectors
The physical limitations to development are a factor in the direction of development, as is connectivity.
It is anticipated that the SE Sector and the NW Sector will be built out within the next 35 years with 2750
new dwellings in the SE Sector and 2600 in the NW Sector.
Suitable land is available to expand Dubbo West in the CW and the SW Sectors . An arbitrary boundary
has been drawn at the Whylandra Creek. Taking out land that would most likely be assessed as natural
open space, the capacity of these sectors is between 5500 to 6500 dwellings, the difference being the
density of housing. For the purposes of examining the transport infrastructure needs (in the modelling)
1150 dwellings have been allocated to the CW Sector from 2030 to 2055, all served by new roads and
1850 in the SW most served by existing roads (upgraded). This perhaps illustrates how development tends
to follow the least line of resistance, and how good planning can “direct” efficient outcomes.
TABLE 2.2 PROPOSED DISTRIBUTION OF NEW DWELLINGSSECTORS
SE NW SW CWc
Recent Trend2015 - 2020 1250 750 50 450 0
60% 4% 36% 0%
Total Households Proposed DistributionPROJECTION
2020 - 2025 1250 750 250 250 0
60% 20% 20% 0%2025 - 2030 1250 450 550 250 0
36% 44% 20% 0%
2030 - 2040 2500 800 200 1250 25032% 8% 50% 10%
2040 - 2055 3050 0 1550 600 900
0% 51% 20% 30%

2020 DUBBO TRANSPORTATION STRATEGY
STAPLETON TRANSPORTATION & PLANNING Pty Ltd 12
Figure 2.4 Capacity of Each Sector
2.3 Future Employment
2.3.1 Changes in Employment
As previously discussed, household size is changing as is the number of employees per household. These
trends (ABS) determine the future number of employees per household.
Table 2.3 shows the combined impact of both trends with 8050 new households increasing the population
by 17,174 from 2.56 persons per household to 2.41. But the workforce is expected to increasing by only
6,413 the rate of employment decreasing from 1.18 to 1.04 employed persons per household.
These factors drive the location of employment and therefore traffic movement.
2020 DUBBO TRANSPORTATION STRATEGY
STAPLETON TRANSPORTATION & PLANNING Pty Ltd 13
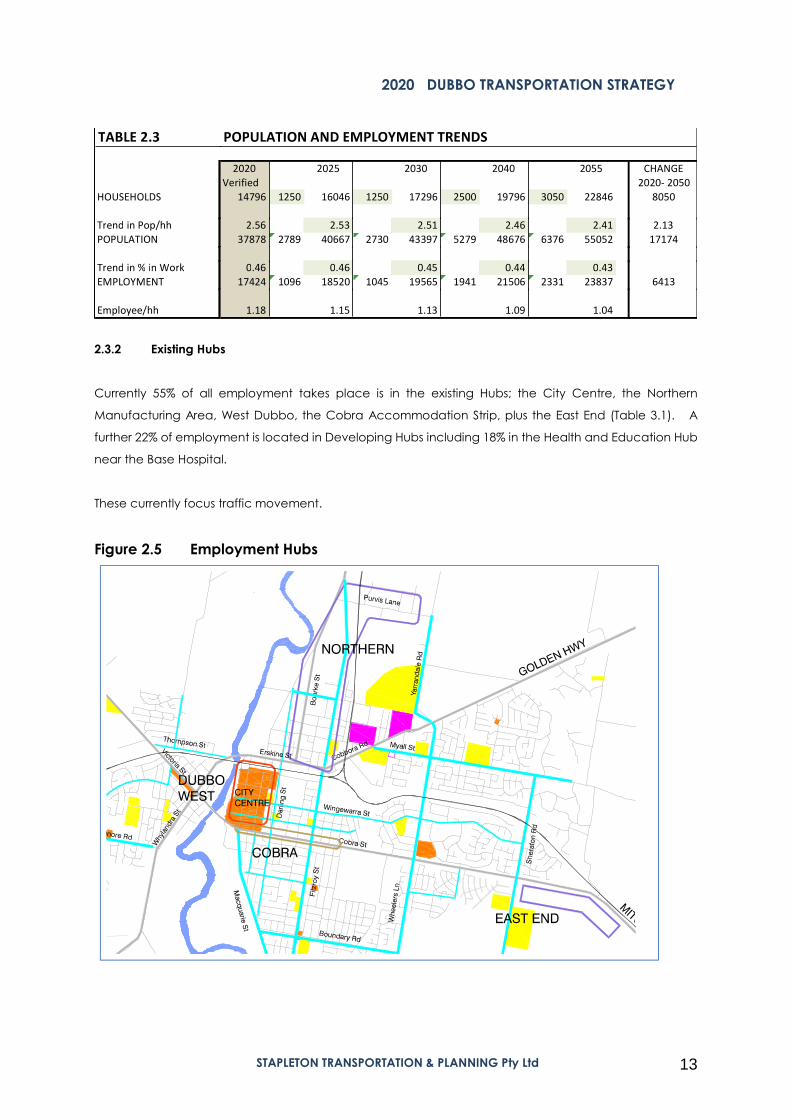
2.3.2 Existing Hubs
Currently 55% of all employment takes place is in the existing Hubs; the City Centre, the Northern
Manufacturing Area, West Dubbo, the Cobra Accommodation Strip, plus the East End (Table 3.1). A
further 22% of employment is located in Developing Hubs including 18% in the Health and Education Hub
near the Base Hospital.
These currently focus traffic movement.
Figure 2.5 Employment Hubs
TABLE 2.3
HOUSEHOLDS
POPULATION AND EMPLOYMENT TRENDS
2020 2025 2030 2040 2055 CHANGE
Verified 2020- 2050
14796 1250 16046 1250 17296 2500 19796 3050 22846 8050
Trend in Pop/hh
POPULATION
2.56 2.53 2.51 2.46 2.41 2.13
37878 2789 40667 2730 43397 5279 48676 6376 55052 17174
Trend in % in Work
EMPLOYMENT
0.46 0.46 0.45 0.44 0.43
17424 1096 18520 1045 19565 1941 21506 2331 23837 6413
Employee/hh 1.18 1.15 1.13 1.09 1.04

2020 DUBBO TRANSPORTATION STRATEGY
STAPLETON TRANSPORTATION & PLANNING Pty Ltd 14
Employment is changing and this impacts on the growth of Hubs. Many categories used in ABS data,
have different trip generation characteristics. Retailing generates a high daily demand per
employee/area; finance trends to be based in the city centre, community is spread throughout the town
including homework and heath, manufacturing is generally located in zones but also has a proportion
spread throughout the town, and “other” is also multi-located.
Table 2.4 summarises the changes in employment projected to occur in Dubbo and this corresponds to
the total employment (including external commuters). (Source Council)
Whilst the proportion of retail employment is projected to decrease from 15% to 12% there is still a small
increase in the total number employed in retail (7%), thanks to the increased population. Hence the
vitality of the City Centre will be retained. In addition, financial services are expected to increase by 38%
in line with the population. Employment in community services and manufacturing are predicted to
have the greatest increases of 54% (4752 employees) and 50% (1352) employees respectively.
These factors will change the patterns of demand and have a strong bearing on how to plan the future.
2.3.3 The Enterprise Axis
Referring to the statistic above, in anticipation of changes to future employment Council has been
actively planning for two Enterprise Zones, the Health and Education Precinct is currently the subject of a
Master Plan. The Airport Precinct is also the subject of detailed future planning.
The shear strength of these two expanding Hubs suggests an Enterprise Axis. This conveniently follows
River St and the new river crossing.
TABLE 2.4 TREND IN TYPE OF EMPLOYMENT
Ret Fin Com Man Other Total
2019 3088 1802 8875 2681 3378 20011
% Total 15% 9% 44% 13% 17%
2025 3210 1931 9893 2976 3406 21615 108%% Total 15% 9% 46% 14% 16%
increase 122 129 1018 295 28 1604
2030 3241 2051 10771 3128 3503 22993 106%
% Total 14% 9% 47% 14% 15%increase 153 249 1896 447 125 2982
2040 3270 2249 12100 3635 3542 25196 110%
% Total 13% 9% 48% 14% 14%increase 182 447 3225 954 164 5185
2055 3319 2481 13627 4033 3967 27927 111%
% Total 12% 9% 49% 14% 14%increase 231 679 4752 1352 589 7916
Overall Change 7% 38% 54% 50% 17% 40% 140%

2020 DUBBO TRANSPORTATION STRATEGY
STAPLETON TRANSPORTATION & PLANNING Pty Ltd 15
This east-west axis strengthens the earlier Riverside Boulevard (2.1.2) as the confluence of two highly
strategic employment initiatives. This focuses on the intersection at the western side of North Bridge and
the Riverside Boulevard.
Figure 2.6 The Enterprise Axis
This mutual attraction is perfect for development but not so easy to reconcile with the RMS objective for
a free flowing Newell Hwy sharing part of the East-west axis and the Riverside Boulevard. Council cannot
afford to lose the opportunity to coordinate with the RMS in designing the public realm for the mutual
benefit of employment for the City and ease of passage for the Highway. This can be achieved.
2.4 Strategic Roads
The design of roads suitable for their future role in the transport network efficiently is a key objective of the
study, and in particular the development of a new Developer Contributions Plan for Roads.
Four fundamental directions dictate the design of strategic roads for Dubbo, as below:
2.4.1 Maintain Flexibility of Movement
The secret of success in Dubbo for the, until recently, lack of congestion has been the flexibility offered by
the Grid Network of roads that serve Dubbo. This provides intuitive flexibility, some choosing their
traditional route from A to B, others thinking of avoiding a short delay.

2020 DUBBO TRANSPORTATION STRATEGY
STAPLETON TRANSPORTATION & PLANNING Pty Ltd 16
2.4.2 Maintain Amenity
The Grid Network, with a few notable exceptions, provides roads with a maximum flow of 600 vehicles per
hour or less (Many less). This is a threshold to amenity; relatively easy to cross; relatively easy to be polite
and let the slow cross at ease; relatively but not perfectly quiet. Many of course choose to live in the
even quieter local streets and only need to travel a short distance to join the Grid Network.
2.4.3 Enhance Quality Of Life
The ease of movement allows residents to maintain a high quality of life, there is very little thought given
to can I get there on time or easily. This is an ideal condition for transport that is recognised by many of
the returning residents.
2.4.4 Provide an Efficient Transport Network
It could be said that most strategic road are initially under-designed and then regretted a few years later.
However the Dubbo Grid has kept on delivering convenient movement with little need for upgrades.
The challenge for the upgraded street designs (Chapter 4) is to continue this legacy and anticipate future
trends.
2.5 Natural Assets
2.5.1 Macquarie River
Dubbo was settled along the Macquarie River and the flood plain provides the settling for recreational
open space. The proposed Riverside Boulevard extends this opportunity. Unfortunately Macquarie St
does not address the open space riverfront through the City.
2.5.2 Vistas/ Lookouts
Less well known are the vistas from the ridge to the west of the Macquarie River – shown in Figure 2.7 -
These can lead urban development as lookouts or other community focus points and are utilised in the
Active Transport Plan (2.6.1). A third potential Lookout has also been identified at the Drive-in Cinema in
West Dubbo and this features later in the discussion.
2.5.3 Connectivity of Open Space
The existing urban area contains many areas of recreational open space. The previous Strategic Plan
identified some existing linear connections in eastern parts of Dubbo and adopted plans to extend this
as a continuous ring around Dubbo (Figure 2.8). This network is suitable for Active Transport.

2020 DUBBO TRANSPORTATION STRATEGY
STAPLETON TRANSPORTATION & PLANNING Pty Ltd 17
Figure 2.7 Natural Features
2.6 Future Transport Modes
2.6.1 Active Transport
Active Transport networks are being developed in Dubbo. (Refer to Council documents including
Cycleways in Dubbo). With the exception of paths along the Macquarie River these are predominantly
on road facilities following bike lanes or quiet streets.
Recent developments of electric power have lead to an upsurge of new micro vehicles ranging from
electric assisted bikes to boards and scooters. Mobility scooters are also undergoing changes in range
and capability and are seen as a transport mode for deliveries and car replacements.

2020 DUBBO TRANSPORTATION STRATEGY
STAPLETON TRANSPORTATION & PLANNING Pty Ltd 18
These vehicles are permitted to use Cycleways and will become part of the mainstream movement. This
will alter the balance and priority given to the Green Ring and the extension of the Green Ring. Works
on this network have been included in this Strategic Transport Plan. This follows on from the previous 2007
Transport Strategy.
Figure 2.8 Green Ring
These electric powered vehicles are also using footpaths to the detriment of more vulnerable pedestrians
including the mobility limited and parents with small children.
Figure 2.9 illustrates the need for local connectivity. This intrusion is not the subject of this report but needs
to be addressed as part of a future “hierarchy” of integrated networks.

2020 DUBBO TRANSPORTATION STRATEGY
STAPLETON TRANSPORTATION & PLANNING Pty Ltd 19
Figure 2.9 Active Transport Connectivity
2.6.2 Autonomous Vehicles
The introduction of larger electric powered vehicles is also on the agenda. All new vehicles have some
form of driver assistance and are becoming to some degree “autonomous”. This will have no impact on
traffic operations in Dubbo in the short term. Driver advisories for congestion are already assisting in rural
highways in Europe and the US but again will have no impact in Dubbo.
The next generation of AV’s are aiming to have surveillance to protect pedestrians as well create efficient
traffic platoons. This application will not be in general operation for at least 20 years although some truck
operations may become more Autonomous earlier.
Nevertheless the Strategic Transport Strategy can address the possibilities for AV operations in new areas
and this has been considered in Chapter 4.

2020 DUBBO TRANSPORTATION STRATEGY
STAPLETON TRANSPORTATION & PLANNING Pty Ltd 20
2.6.3 Public Transport
Public transport will continue to provide a service to bring residents from the residential areas into the City
Centre, Schools, and to work and recreation throughout Dubbo. The route system is efficiently designed
for this role with all services focusing on Macquarie St and providing the opportunity to transfer to every
other service and thereby move throughout Dubbo.
A detailed review of the existing function of public transport is not required for this study.
Given the time lag for the introduction of AVs public transport will continue its important role in
accessibility.
All Street styles are capable of accommodating bus services.
2.6.4 Electric Vehicles and Noise
One goal is the reduction of noise and the intrusion of Highway traffic in Dubbo and hopes for a Bypass
to the west of the City.
During the course of this work it has become apparent that further State investment on a Bypass is unlikely
to be justified even in the long term (35 years plus).
The introduction of electric powered heavy vehicles – to start with in towns – will reduce noise (as well as
pollution) and this will achieve some of the goals to remediate intrusion. This is further discussed in Chapter
4.

2020 DUBBO TRANSPORTATION STRATEGY
STAPLETON TRANSPORTATION & PLANNING Pty Ltd 21
3. TRANSPORT PATTERNS
The modelling calculates the three shortest routes through an average of ten road sections between
each of the 280 zone pairs, (2.3m digits of information). The intention of this Chapter is to illustrate how
traffic is manipulated through the existing and future roads. Firstly to disperse current congestion and
secondly to spread traffic throughout the network and in particular to show how new links contribute to
the dispersal of traffic. This is summarised numerically in Chapter 6.
3.1. Current Patterns
3.1.1. Traffic Conditions
Results from the Modelling include diagrams that measure sections of road under “stress”. This is
calculated by measuring the “Level of Service” of street sections and intersections. This is a standard
measure of traffic congestion, progressing from excellent to complete stand still.
The diagrams are colour coded. Circles (there are none in Figure 3.1) indicate where an Intersection
may require attention, and bars indicate where the street “link” itself may require attention. The links are
less critical than the Intersections because the measure is an indication of the lack of opportunity to pass
that is more suited to rural conditions than urban streets. It could be argued that some “Bars”/congestion
in streets busy with pedestrian activity are a sign of good traffic management.
The output from the modelling is an indicator of the urgency of creating the alternative, with emphasis
on alternative rather than necessarily upgrading the location in stress. For example; in traditional
engineering a blocked high street can sometimes be resolved by a new Bypass.
The diagrams of “stress” are used in the analysis for future networks, in Chapter 5, and need to be
considered in that light.
Referring to the formal Level of Service [LoS] terminology and its impact on travel in Dubbo.
Green, LoS D warns of the need for attention in the near future.
Blue LoS E, requires an alternative to be designed.
Orange LoS F, should not be reached because the alternative should be in place.
Many Dubbo residents are intolerant to delays and indeed the free flow traffic conditions are an
attraction to living in the 10 minute City of Dubbo. A lower tolerance is more applicable in Dubbo where
LoS C (that is not illustrated in the diagrams) is a sign that some Dubbo drivers are finding conditions
unacceptable and might seek an alternative way to avoid the intersection.

2020 DUBBO TRANSPORTATION STRATEGY
STAPLETON TRANSPORTATION & PLANNING Pty Ltd 22
This analysis consistently shows Cobra St with green sections and not moving to Blue, this is because the
strategy consistently aims to marginally reduce traffic on Cobra St. The question of how much time
difference is summarised in Chapter 6 with measurements of the time taken to move along Cobra St from
near Wheelers Ln to near Macquarie St and is in the order of 5 to 7 seconds on a 6 minute trip. This is
considered within a tolerable range of changing conditions.
Figure 3.1A shows the working analysis of existing conditions and indicates stressed conditions on the LH
Ford Bridge, in Coborra Rd – at the railway – both being difficult to avoid and along short sections of
Cobra St. (It is considered that the LH Ford Bridge experiences unacceptable queuing for a short period
in the morning peak. Because this occurs for a short time this is not reflected in this analysis but is
recognised in the Strategy).
The same delays occur if nothing was done in 2025 (Figure 3.1.B) with Coborra Rd moving to
unacceptable delays requiring an alternative and LH Ford is stressed in both directions during the morning
peak. (This by the way with the intersection of Whylanda St and Victoria St upgraded. (Those with keen
eyes will note that Fig 3.1 B has some other new local links added (in the SE Sector and others that are not
being used at this time).
Figure 3.1. a) 2019 Level of Service b) 2025 No Minimum Level of Service
As a planning tool this representation shows how efforts must be made to move a small proportion of
existing traffic off Cobra St. And confirms that conditions on the LH Ford Bridge are deteriorating fast.
2020 DUBBO TRANSPORTATION STRATEGY
STAPLETON TRANSPORTATION & PLANNING Pty Ltd 23
3.2. Patterns Of Growth
3.2.1. Employment
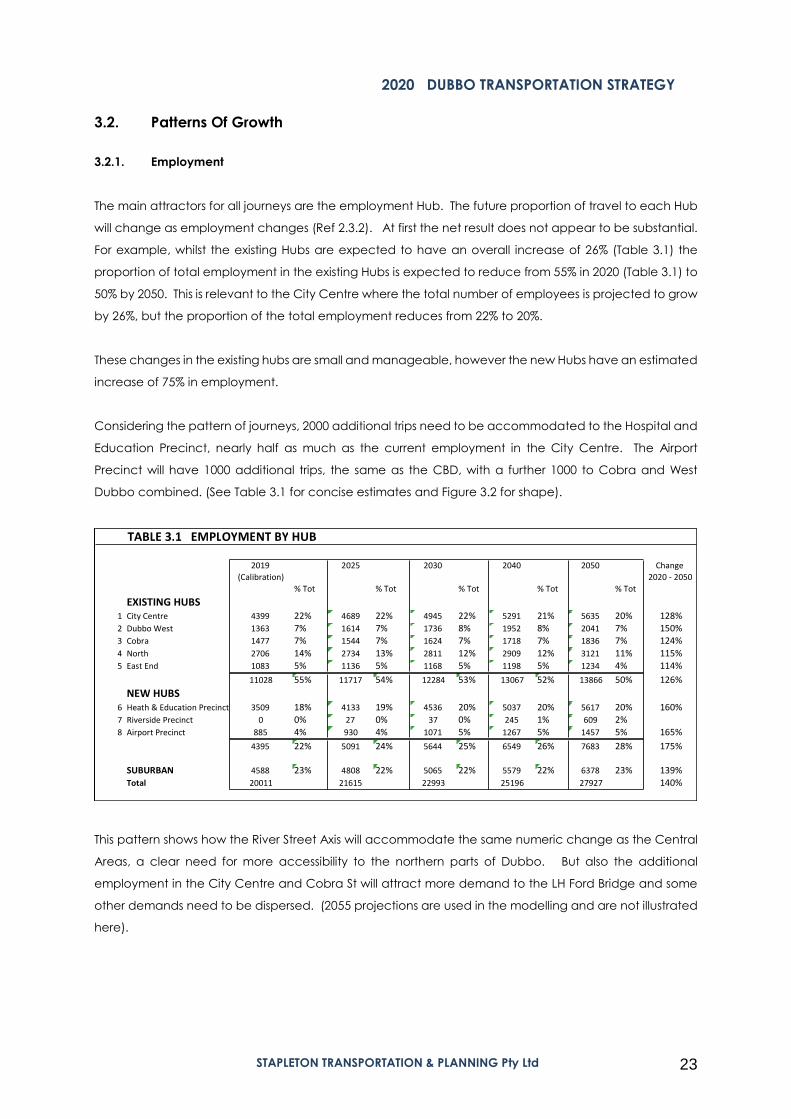
The main attractors for all journeys are the employment Hub. The future proportion of travel to each Hub
will change as employment changes (Ref 2.3.2). At first the net result does not appear to be substantial.
For example, whilst the existing Hubs are expected to have an overall increase of 26% (Table 3.1) the
proportion of total employment in the existing Hubs is expected to reduce from 55% in 2020 (Table 3.1) to
50% by 2050. This is relevant to the City Centre where the total number of employees is projected to grow
by 26%, but the proportion of the total employment reduces from 22% to 20%.
These changes in the existing hubs are small and manageable, however the new Hubs have an estimated
increase of 75% in employment.
Considering the pattern of journeys, 2000 additional trips need to be accommodated to the Hospital and
Education Precinct, nearly half as much as the current employment in the City Centre. The Airport
Precinct will have 1000 additional trips, the same as the CBD, with a further 1000 to Cobra and West
Dubbo combined. (See Table 3.1 for concise estimates and Figure 3.2 for shape).
This pattern shows how the River Street Axis will accommodate the same numeric change as the Central
Areas, a clear need for more accessibility to the northern parts of Dubbo. But also the additional
employment in the City Centre and Cobra St will attract more demand to the LH Ford Bridge and some
other demands need to be dispersed. (2055 projections are used in the modelling and are not illustrated
here).
TABLE 3.1 EMPLOYMENT BY HUB
2019 2025 2030 2040 2050 Change
(Calibration) 2020 - 2050
% Tot % Tot % Tot % Tot % Tot
EXISTING HUBS1 City Centre 4399 22% 4689 22% 4945 22% 5291 21% 5635 20% 128%2 Dubbo West 1363 7% 1614 7% 1736 8% 1952 8% 2041 7% 150%3 Cobra 1477 7% 1544 7% 1624 7% 1718 7% 1836 7% 124%
4 North 2706 14% 2734 13% 2811 12% 2909 12% 3121 11% 115%5 East End 1083 5% 1136 5% 1168 5% 1198 5% 1234 4% 114%
11028 55% 11717 54% 12284 53% 13067 52% 13866 50% 126%
NEW HUBS6 Heath & Education Precinct 3509 18% 4133 19% 4536 20% 5037 20% 5617 20% 160%7 Riverside Precinct 0 0% 27 0% 37 0% 245 1% 609 2%
8 Airport Precinct 885 4% 930 4% 1071 5% 1267 5% 1457 5% 165%
4395 22% 5091 24% 5644 25% 6549 26% 7683 28% 175%
SUBURBAN 4588 23% 4808 22% 5065 22% 5579 22% 6378 23% 139%Total 20011 21615 22993 25196 27927 140%

2020 DUBBO TRANSPORTATION STRATEGY
STAPLETON TRANSPORTATION & PLANNING Pty Ltd 24
Figure 3.2 Employment Hubs
3.2.2. New Residents
Figure 3 A to D illustrates the directional split of journey to work from each Residential Sector, the light
green bars showing demand using new facilities, the base colour showing demand on existing roads.
This “pre analysis” before the modelling continues to indicate the usefulness of new strategic
infrastructure; in particular North Bridge and South Bridge but also crossing the railway line at Chapmans
Rd (referred to below as Western Railway). This summary was then used to make first calculations of the
potential scale of demand on new facilities to indicate the number of new links required.
Demand from the NW Sector will concentrate on the Riverside to Emile Serisior Bridge with a proportion
using North Bridge and practically no traffic on the LH Ford Bridge.
Demand from the SE Sector primarily uses existing roads (for journey to work). The scale of this additional
traffic needs to be considered at this Stage. For example; Figure 3.1 B indicates a strong demand using
Hennessy Rd and the southern part of Macquarie St. This represents 261 peak hour trips in 2030 from the
SE Sector, (Table 3.3 A) with (a surprising) 180 peak hour trips as contraflow from other new development.
Cumulatively this is less than 600 vehicles per hour, and therefore within the environmental goal for the
Neighbourhood Grid. Demand increases later (Table 3.3.B) to a maximum of 10,000 vehicles per day in
2055.

2020 DUBBO TRANSPORTATION STRATEGY
STAPLETON TRANSPORTATION & PLANNING Pty Ltd 25
Figure 3. A) Demand from NW Sector b) Demand from SE Sector
Conclusion; the connection to South Bridge via Macquarie St south is suitable in the foreseeable future
and no other option, such as the Southern Bypass (Ref Figure 5.6.1) needs be considered for 10 years.
As a point of clarification, whilst there may be concern over the accuracy figures estimated for 20 or 35
years hence the strategy will be reviewed regularly and other options will be considered at the time. This
analysis gives a sense of direction.
Figure 3. c) Demand from CW Sector d) Demand from SW Sector
Demand from the CW Sector concentrates on North Bridge and LH Ford Bridge indicating that some
existing traffic must be diverted from this access and hence South Bridge is required.
Demand form the SW Sector concentrates on South Bridge. Further, a new bridge over the railway at
Chapmans Rd will spread traffic across the west and onto North Bridge. When combined these will
successfully reduce impacts on Cobra St and through West Dubbo. Traffic from the existing parts of the
SW will predominantly use South Bridge, this is not reflected in these figures.

2020 DUBBO TRANSPORTATION STRATEGY
STAPLETON TRANSPORTATION & PLANNING Pty Ltd 26
Again before starting the modelling it is apparent that North Bridge will be well used by Dubbo traffic by
2030. The figure of 6000 Vehicles per day [vpd] (Referring to Table 3.2A) is higher than the demand from
new development for South Bridge ~ 4000 vpd. (See Chapter 6 for modelled results).
Taking these initial estimates to 2055 indicates that North Bridge will be stressed (18000 vpd similar to
current flows on LH Ford), South Bridge will be relatively small from newly generated traffic (4000 vpd),
Hennessey Rd, as mentioned above will be close to capacity for a Residential Grid Road, and a bridge
over the Railway in the SW should be working well (15,000 vpd).
These patterns will form from residential development.
3.2.3.
3.2.4. Scale of External Traffic and Heavy Vehicles
The third pattern of movement is external traffic. This often dominates discussion but is a small proportion
of total movement in Dubbo. However, is essential to the economy as Dubbo is the regional centre for
120,000 residents.
TABLE 3.2A 2030 INDICATIVE USE OF NDEMAND FOR 2030 BY NEW DEVELOPMENT ONLY; E
MAJOR PEAK TRAFFIC GENERATION
NEW NW SectorINFRASTRUCTURE
Total Gen 800Additional
Estimated Traffic% using
North Bridge 40% 320
South Bridge 0% 0
Bligh St 0% 0
Hennessy 10% 80
Western Railway 2% 16
NEW MAJOR INFRASTEXISTING TRAFFIC WILL ALSO
SE Sector
Total Gen 1450Additional
Estimated Traffic% using
0% 0
8% 116
10% 145
18% 261
2% 29
TRUCTUREO DIVERT TO NEW FACILITIES
CW Sector
Total Gen 0Additional
Estimated Traffic% using
40% 0
12% 0
0% 0
15% 0
3% 0
S
SWSector
Total Gen 700Additional
Estimated Traffic% using
40% 280
41% 287
22% 154
15% 105
2% 14
TOTALDAILYTRAFFIC
0.1
6000
4030
2990
4460
590
TABLE 3.2B 2055 INDICATDEMAND FOR 2055 BY NEW DEVELO
MAJOR PEAK TRAFF
TIVE USE OF NEW MAOPMENT ONLY; EXISTING TRA
FIC GENERATION
AJOR INFRASTRUCTURAFFIC WILL ALSO DIVERT TO
RENEW FACILITIES
NEW NW SectorINFRASTRUCTURE
Estimated
% usingNorth Bridge 36%
South Bridge 0%
Bligh St 0%
Hennessy 5%
Western Railway 8%
SE Sector
CumulativeAdditional Estimated
% using702 0%
0 15%
0 10%
98 25%
156 7%
CW Sector
CumulativeAdditional Estimated
% using0 31%
338 8%
225 0%
563 8%
158 16%
SWSector
CumulativeAdditional Estimated
% using357 31%
92 32%
0 10%
92 11%
184 41%
CumulativeAdditional
760
784
245
270
1005
TOTALDAILY
TRAFFIC
18180
12135
4700
10215
15020

2020 DUBBO TRANSPORTATION STRATEGY
STAPLETON TRANSPORTATION & PLANNING Pty Ltd 27
Through traffic forms approximately 20% of external traffic (Table 3.3). Regional traffic is considered in two
types, Commuters and other regional traffic. Currently of the total regional traffic 50% is journey to work
commuter traffic and 50% are regional visitors; shopping, business, school recreation etc.
Through traffic is expected to increase on the existing trend of 3% per year. Regional movement is
expected to increase in line with the anticipated small increase in population, generally 1% per year.
Commuting from rural areas has increased over the last decade and is expected to continue in line with
changing types of employment in Dubbo.
Considering the total increase in employment, the resident employees in the Dubbo Study area (ABS) is
currently made up of 87% internal residents and 13% regional commuters. This is not expected to vary in
the future.
External traffic will increase faster than internal traffic (60% and 40% respectively). This will not have an
impact on traffic in Dubbo in the foreseeable future.
In conclusion to this Chapter, the Transport Strategy has been a response to the current pattern that
centralises demand, the movement of employment more to the north and the centroid of population
moving more to the west and little change in the proportion of external traffic.
TABLE 3.3 COMPOSITION OF EXTERNAL TRAFFIC (Two way traffic)
2019 Applied 2025 2030 2040 2055
Survey AnnualIncrease
Through traffic 2460 103% 1.16 2852 1.16 3306 1.34 4443 1.56 6922Commuter 5174 Varies 1.13 5847 1.1 6431 1.08 6946 1.07 7432
Regional Movement 5271 101% 1.03 5404 1.03 5540 1.05 5824 1.08 6276
TOTAL EXTERNAL 12905 14103 15278 17213 20631
109% 118% 133% 160%
TABLE 3.4 EXTERN
ORIGIN OF EMPLOYEES
Internal ResidentExternal Commuters
Total
NAL COMMUTERS
2020 2025 2030 2040 2055
17424 87% 18520 86% 19565 86% 21506 86% 238372587 13% 2923 14% 3216 14% 3473 14% 3716
20011 21443 22781 24979 27553
87%13%

2020 DUBBO TRANSPORTATION STRATEGY
STAPLETON TRANSPORTATION & PLANNING Pty Ltd 28
4. ROADS FOR THE FUTURE
The purpose of this Chapter is to establish suitable Sections for new transport infrastructure that can be
costed for use in the Developer Contributions Plan and to make estimates of future infrastructure
programs.
The actual traffic requirements, traffic lanes, parking, footpaths and landscape are based on typical
Arterial Roads. The traditional Dubbo Suburban Road is included as a comparison for costing and
amenity. The design originated with the need to accommodate trucks and turning traffic and evolved
to accommodate pedestrian amenity with central refuges, streets include Cobra St, Fitzroy St and tended
to spread to most older Grid Roads.
Unit-Cost Prices have been provided by Council. They include the cost (Table 4.2) for m2 of, pavement,
parking lanes, footpaths, bridges, for m length of footpaths, and m3 for earthworks - earthworks are only
estimated for flood plains. Acquisition costs are not included.
Based on these costs the typical existing Dubbo Suburban Road with 14m of heavy-duty pavement and
4.2m of parking pavement cost in the order of $4,000 per-metre length.
Five situations have been considered.
1 Residential Grid - a typical Grid Road within a neighbourhood.
Many new links will have similar characteristics to the existing layout of the Grid Roads in Dubbo; frontage
housing and low volumes of predominantly local traffic. Whilst the traditional streets are very attractive,
and part of the Dubbo identity, more recent Suburban Roads, such as, Boundary Road have been built
to the standards of more typical metropolitan streets with 6m of payment plus two parking lanes. (Table
4.1 Costing Infrastructure)
The reserve width is reduced to 15m.
These are primarily internal Suburban Streets and cost $2000 per m length; half of the traditional street
style.
2 Urban Edge – located at the edge of residential development and requiring one residential service
road and a separate carriageway for other traffic (note, not through traffic but simply other local
traffic). The per-metre cost of this profile is still a moderate $2800.
The reserve width is maintained at 22m.

2020 DUBBO TRANSPORTATION STRATEGY
STAPLETON TRANSPORTATION & PLANNING Pty Ltd 29
The use of Urban Edge Streets is recommended at a number of locations, either at the edge of
development or where there is a strong linear barrier to development. For example; Hennessey Rd could
eventually (and not in the 35 year horizon) become part of the Southern Link Rd and is situated on the
edge of the flood plane. (Hennessey Rd is already designed using the profile).
3 Segregated Arterial – crossing flood plains or permanently outside the Urban Expansion (e.g. under
airport flight path)
A number of links are built across flood planes or outside the future urban areas, operating at a higher
speed they require larger carriageways. Given the higher speed – and given that a Greenway network
is included in the costing of Infrastructure – it is desirable to segregate pedestrians from these roads and
hence there are no footpaths. The per-metre cost reflects the wider carriageway at $3000.
TABLE 4.1 COSTING OF INFRASTRUCTUREUNIT PRICES Unit Price
Pavement/drainage $/m2 $220 220
Parking Pavement $/m2 $120 120
Kerbs $/m $75 75Footpaths Width $/m2 $90 90
Bridge Water $/m2 $6,000
Bridge Land $/m2 $4,800
Earthworks $/m3 $2,106
OPTIONS FOR ROAD SECTIONSWidth Pavement Light Footpath Kerbs TOTAL
Pavement Per m
EXISTING ARTERIALS m m m m m
Central turning Quantity 22 14 4 3 2
and pedestrian refuge $ $3,080 $480 $270 $150 $3,980
1 RESIDENTIAL GRIDNo Regional Traffic Quantity 15 6 4 0 2
or wider footpaths/verges $ $1,320 $480 $0 $150 $1,950
2 URBAN EDGELocal and passing traffic Quantity 22 10.5 2 0 3
$ $2,310 $240 $0 $225 $2,775
3 SEGREGATED ARTERIALLimited pedestrian access Quantity 19 13 0 0 2
$ $2,860 $0 $0 $150 $3,010
4 COMMERCIAL INTEGRATORThree carriageways Quantity 33 17 4 0 4
$ $3,740 $480 $0 $300 $4,520
5 RESIDENTIAL INTEGRATOR5.1 Stage 1 Single carriageway Quantity 33 5.5 0 1.5 2
$ $1,210 $0 $135 $150 $1,495
5.2 Stage 2 Two Carriageways Quantity 33 5.5 0 1.5 2
$ 1210 0 135 150 $1,495
5.3 Three Carriageways Quantity 30 8 10 3 2
$ 1760 1200 270 150 $3,380

2020 DUBBO TRANSPORTATION STRATEGY
STAPLETON TRANSPORTATION & PLANNING Pty Ltd 30
4 Commercial Integrator – passing through mixed development requiring service roads
accommodating heavy vehicles and a central carriageway for passing traffic.
This situation was identified in the previous Strategic Transport Plan, (River St West). This is the most flexible
means of bringing high volumes of traffic through a commercial area. The 33m width (Table 4.2 Road
Design Options) allows for landscaping and therefore provides an attractive street environment.
The per-metre cost of $4500 reflects the stronger carriageways.
5 Residential Integrator – Also with the potential for three carriageways but passing through
residential development where Service Roads can, be used to accommodate local traffic and not
requiring heavy-duty use. (Southern part of Wheelers Lane).
The Residential Integrator can be staged to suit development. This provides the ultimate in flexibility,
particularly of the future role of the link is not settled, as is the case for the 20 to 35 year plan.
Stage 1; Residential development on one-side of the reserve requiring one Service Road. At a cost of
$1500 per-metre length this is the least cost for a Strategic Road. But because this style is built in stages
the Service Road is built for heavy-duty use (and 5.5m in width).
Stage 2; Residential development on the second side of the reserve requiring a second Service Road.
Suitable when there is still no certainly on the future use of the Central Carriageway
Stage 3; Build the three carriageways concurrently with two light duty Service Roads. The per-metre cost
of $3400 is less than adding the central carriageway to two heavy duty service roads and less than the
Commercial Integrator ($4520).
Also note the specification requires space for an 8m central carriageway not the 7m for a Commercial
Integrator this is interchangeable. Also Light Duty Service roads can always be upgraded if the need
arises in the future. (8m probably ideal for advanced AV vehicles)
In conclusion, using a series of Sections that offer flexibility for future transport demands can make
substantial saving to the alternative of simply adopting to continue to use the current Grid Road Section.
And furthermore provide a more sustainable long-term transport network; a fact established in the 2007
Transport Strategy.

2020 DUBBO TRANSPORTATION STRATEGY
STAPLETON TRANSPORTATION & PLANNING Pty Ltd 31
TAB
LE4
.2R
OA
DSE
TRA
DIT
ION
AL
DU
BB
OG
RI
Cen
tral
turn
ing
and
ped
estr
ian
refu
ge
1R
ESID
ENTI
AL
GR
ID
Co
uld
incl
ud
eA
ven
ue
Med
ian
or
wid
erfo
otp
ath
s/ve
rges
2U
RB
AN
EDG
E
Twin
carr
iage
way
3SE
GR
EGA
TED
AR
TER
IAL
No
pe
des
tria
nac
cess
4C
OM
MER
CIA
LIN
TEG
RA
TO2
Serv
ice
road
s
5SU
BU
RB
AN
INTE
GR
ATO
R
5.1
Sin
gle
carr
iage
way
Stag
e1
5.2
Two
Car
riag
ew
ays
Stag
e2
Ad
dit
oin
alca
rria
gew
ay
5.3
Thre
eC
arri
agew
ays
Stag
e3
All
3ca
rria
gew
ays
ECTI
OW
idth
ID
22 15 22 19
OR 33 33
2
33
3
33
ON
S Foo
tpat
h1
.5TR
EE
Bik
e1
.5Tr
affi
c3.
5C
entr
alTu
rnin
gLa
ne
Traf
fic
3.5
Bik
e1
.5TR
EEFo
otp
ath
1.5
0.5
2P
ark
ing
22
44
42
Par
kin
g2
20
.5
SER
VIC
ES
2.4
22
SER
VIC
ES2
.4
Foo
tpat
h1
.5TR
EE
Traf
fic
Traf
fic
TRE
EFo
otp
ath
1.5
0.5
Pa
rkin
g2
33
Par
kin
g2
10
.53
SER
VIC
ES
2.4
SER
VIC
ES2
.4
Foo
tpat
h1
.5TR
EE
Serv
ice
TREE
Edge
Traf
fic
Traf
fic
TRE
E
0.5
Pa
rkin
g2
44
44
42
SER
VIC
ES
2.4
Edge
Har
dSh
ou
lder
Traf
fic
Traf
fic
Har
dSh
ou
lde
rEd
ge
33
44
33
Foo
tpat
h1
.5TR
EE
Serv
ice
(tw
ow
ay)
TRE
EEd
geTr
affi
c3
.5Tr
affi
c3.
5Ed
geTR
EESe
rvic
eTR
EE
Foo
tpat
h1
.5
0.5
Pa
rkin
g2
54
44
45
Par
kin
g2
0.5
SER
VIC
ES
2.4
22
SER
VIC
ES2
.4
Foo
tpat
h1
.5TR
EE
Traf
fic
and
par
kin
g5.
5m
TRE
ETR
EE
TREE
TREE
TREE
0.5
26
14
10
SER
VIC
ES
2.4
STA
GE
38m
Stag
e2
Foo
tpat
h1
.5TR
EE
Traf
fic
and
par
kin
g5.
5m
TRE
ETR
EE
TREE
TREE
Traf
fic
and
par
kin
g5.
5m
TREE
Foo
tpat
h1
.5
0.5
22
61
46
22
0.5
SER
VIC
ES
2.4
STA
GE
38m
SER
VIC
ES2
.4
Foo
tpat
h1
.5TR
EE
Traf
fic
and
par
kin
g5.
5m
TRE
ETr
affi
cTR
EETr
affi
can
dp
arki
ng
5.5
mTR
EEFo
otp
ath
1.5
0.5
22
63
83
62
20.
5
SER
VIC
ES
2.4
SER
VIC
ES2
.4
2020 DUBBO TRANSPORTATION STRATEGY
STAPLETON TRANSPORTATION & PLANNING Pty Ltd 32
5. CONCLUSIONS
It should be noted that the conclusions are based on an assumed location of development; this is known
with some accuracy in the short term but becomes progressively less certain as the timeline expands.
The location of the Residential Grid will normally only occur when development is underway. The order
might change but the intent is the same, i.e. the network is connected and must be maintained.
5.1. Reference to Modelling.
The conclusions reached in this study are assisted by the modelling of journeys predicted to be made in
the future from varying employment and population. A more thorough list of network performance is
given in Chapter 6.
This Chapter concentrates on conclusions of the future physical form of Dubbo.
5.2. 2020 - 2030 - 10 Year Investment Program
5.2.1. Program
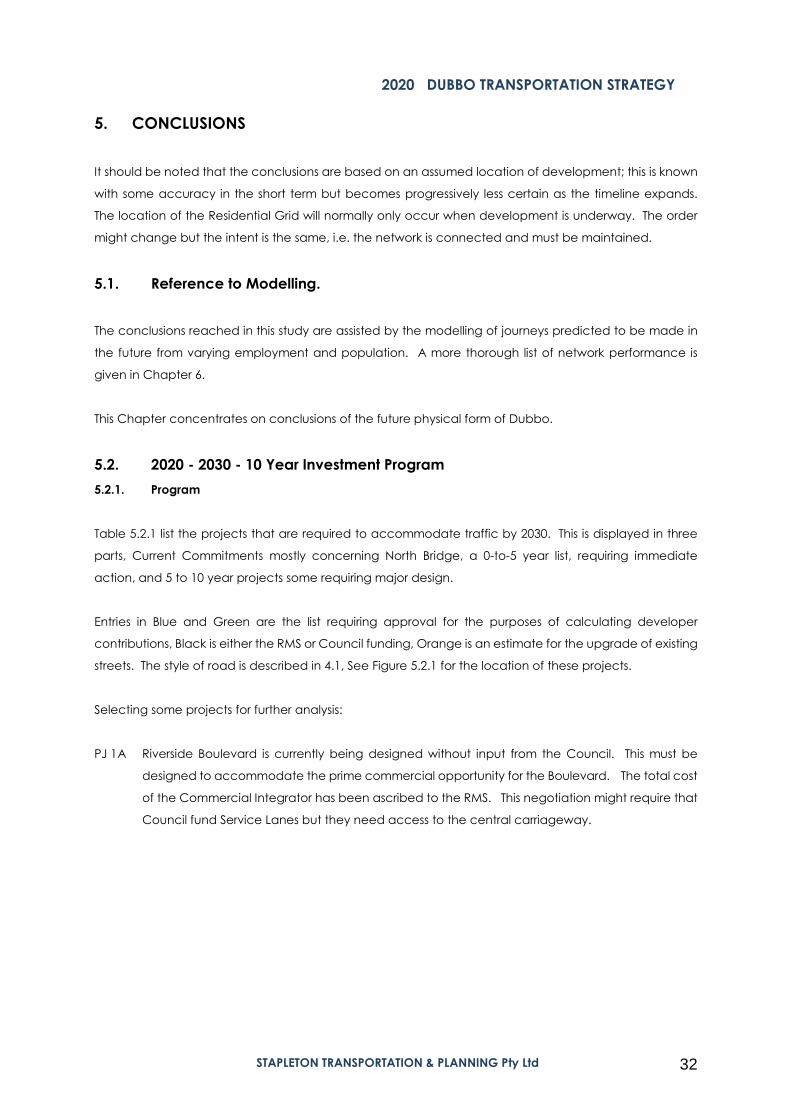
Table 5.2.1 list the projects that are required to accommodate traffic by 2030. This is displayed in three
parts, Current Commitments mostly concerning North Bridge, a 0-to-5 year list, requiring immediate
action, and 5 to 10 year projects some requiring major design.
Entries in Blue and Green are the list requiring approval for the purposes of calculating developer
contributions, Black is either the RMS or Council funding, Orange is an estimate for the upgrade of existing
streets. The style of road is described in 4.1, See Figure 5.2.1 for the location of these projects.
Selecting some projects for further analysis:
PJ 1A Riverside Boulevard is currently being designed without input from the Council. This must be
designed to accommodate the prime commercial opportunity for the Boulevard. The total cost
of the Commercial Integrator has been ascribed to the RMS. This negotiation might require that
Council fund Service Lanes but they need access to the central carriageway.

2020 DUBBO TRANSPORTATION STRATEGY
STAPLETON TRANSPORTATION & PLANNING Pty Ltd 33
Figure 5.2.1 2030 - 10 Year Infrastructure
TABLE 5.2.1 0 - 10 YEAR (2020 - 2030) T
CURRENT COMMITMENTS
Ref Project
1C North Bridge
1A Riverside Boulevard Stage 1
1B Whylandra/Victoria Int
UP1 Extn Boundary Rd
0 to 5 YEARS 2020 - 2025
Ref Project
2 Hennessy Macquarie St Upgrade
3 Sheraton Link
4 Blackbutt Rd Stage 1
UP2 Existing Street Upgrades
5 Greenway to Blackbutt
6 Greenway S E Loop
7 Greenway Delroy Loop
5 - 10 YEARS 2025 - 2030
8 South Bridge (low Level)
9 Bligh St Link
10 Minore Rd
11 River Street West
12 Riverside Boulevard Stage 2
13 River St East
14 Blueridge Link Rd
15 Chapmans Rd Diversion
UP3 Existing Street Upgrades
16 Greenway North West St 1
TRANSPORT INFRASTRUCTURE PROGRAM
Purpose Design Style Comment
Strategic Network 3 80k Segregated Arterial RMS funded
Strategic Network 4 60k Commercial Integrator Passes thro prime River Front (RMS)
Strategic Network Upg Intersection RMS funded
Residential Grid 1 50k Only Local Traffic Under construction (Excl earth works)
100,000s
Purpose Design Style Comment Est Cost
Future Strategic Option 2 60k Urban Edge Minor Upgrade Macquarie St $2,969
Residential Grid 1 50k Only Local Traffic $4,298
Residential Grid 1 60k No Access $1,950
Item Cost Potential - Bligh St Circulatn $2,000
Start of Budden Creek Loop $322
Required for SE Sector (over 10 years) $2,689
Required for SW Sector $663
Strategic Network 3 80k Segregated Arterial No Footpaths use existing bridge $17,930
Strategic Network 3 70k Segregated Arterial Footpaths within Playing Fields $5,076
Existing Street Upgrade Upg 50k Special case Access to existing properties $1,950
Strategic Network 4 60k Commercial Integrator Passes through Commercial $5,005
Strategic Network 4 60k Commercial Integrator Passes through Commercial $2,189
Residential Grid 1 50k/40k Also Flood Management Passes through Active Area (Campus) $2,340
Residential Grid 1 50k/40k Part with access part not $3,900
Future Strategic Option 5.1 60k Residential Integrator St 1 Option for 3 carriageways as Type 4 $1,271
Essential Coborra St Rail Crossing $2,000
River Crossing $835

2020 DUBBO TRANSPORTATION STRATEGY
STAPLETON TRANSPORTATION & PLANNING Pty Ltd 34
PJ2 Hennessey Drive - Macquarie St – are minor works for traffic management in Macquarie St and
Urban Edge in Hennessey.
PJ3 Sheraton Rd extension to Hennessey Drive – a perfect example of cooperation to achieve the
best connectivity involving the developer, with payment from Developer Contributions.
PJ4 Blackbutt Rd Stage 1 Illustrates how if the link is not built at the time of development it will become
impossible in the future. Lost opportunities have included a Gangewood connection to the
Newell Hwy that could have located the Southern Bypass to the north of the Zoo and relieved
demand on Minore Rd. Together with Stage 2 this forms a part of the SW grid.
PJ 8 South Bridge has been held in the 2020 – 2030 construction program because of the deterioration
of traffic amenity even with North Bridge completed, see 5.3.
PL9 Strengthening of Bligh St to distribute traffic to the main Town Centre car parks has been in plans
for many years with a number of iterations. The conclusion to connect Bligh St to South Bridge
and thence to Macquarie St South if fundamental to creating a stable traffic network that can
accommodate traffic until at least 2055. (See Wingewarra crossing Table 5.6.1)
PL10 Upgrading Minore Rd for two through lanes per direction is also as a result of the lack of east-west
connection from the SW Sector to the Newell Hwy. Baird Dr has taken much of the additional
traffic over the last 15 years (Delory/Grangewood) and this has less capacity and is reaching its
design capacity. The loss of amenity in Minore Rd has been slowly growing as traffic has
increased, this is the result.
PL11 River St West and PL12 Riverside Boulevard Stage 2 emphasise the manner in which the NW Sector
will develop quickly and connect with North Bridge. River St West is also an expensive
Commercial Integrator but its role grows in the next few decades. This intersection is identified as
the Next Step in the strategic planning process. (Section 5.8)
PL13 River St East also has long-term strategic impacts. (It fails in 2055!). At this time it is required to
give access to the Health and Education Precinct. It is designed to have high pedestrian amenity
and therefore low traffic capacity, particularly the link though the precinct to Cobbora Rd.
PL14 Blueridge is currently only served by Mitchell Hwy and access form Sheraton Rd (Schools) is
inappropriate. The 2007 Strategy relied on the expensive Southern Distributor (See PJ 43 Table
5.6.1). The lack of growth of external traffic precluded tis option in the foreseeable future but
there are local demands that will be relieved by this link, plus it will be beneficial to the
development of this employment Hub. Requires immediate negotiation.

2020 DUBBO TRANSPORTATION STRATEGY
STAPLETON TRANSPORTATION & PLANNING Pty Ltd 35
PL15 Chapmans Rd was previously identified as part of the “Western Bypass”. Environmental
constraints have required that the alignment in the south be relocated to the west. This
needs to be established with development south of Minore Rd (assumed to occur in this
period). This forms part of a strategic road linking the SW and the CW.
The estimate for upgrading existing Streets ($4m excluding River St East PJ 13) include works at the railway
crossing in Cobbora St. Other works have not been identified and will tend to follow developments. It is
noted that the upgrade of Bligh St as part of South Bridge (and already included in budgeting) will
probably trigger the opportunity to make changes to circulation in the City Centre.
5.2.2. Greenways
As discussed (2.5.3) in 2007 Council adopted the construction of a Green Ring for active transport that
circled the Town Centre (Figure 2.8). Active Transport Networks also can be by small electric powered
micro vehicles and in effect are becoming more viable as a transport network. The 2007 Transport Strategy
concentrated on the Green Ring passing through the SE Sector and Delroy. The Greenways are an
extension to the Green Ring bringing Active Transport close to all new residents.
The cost of this network, be it a community cost or a transport mode, is included in this analysis.
Projects for the period 2020 to 2030 include:
PJ 5 Extension to Blackbutt Rd. This is the first of the projects that add to the Greenways as
development occurs, in the same manner as the Residential Grid, in this case Blackbutt Rd PJ 4.
This section of the Greenway extending from the front of the Zoo follows roads, something
generally avoided but in this case the most efficient way to bring these and future residents to
the west into the main network. This is the start of the Buddens Creek Loop.
PJ 6 The South Eastern Loop was intended (in 2007) to become an attraction for new residents in the
SE and to bring the benefits of Active Transport through the existing areas of eastern Dubbo. PL6
includes the entire construction of the Green Ring through the SE Sector and up to Troy Creek.
PJ16 Takes the Green Ring over the Macquarie River near Devils Hole and into the development of the
NW.
PL7 The Delroy Loop is also part of the original Green Ring linking development at the top of Minore
Rd back to the River. This involves negotiation with the Dubbo Golf Course to use the northern
edge of the course from the existing path to Yuille Court.

2020 DUBBO TRANSPORTATION STRATEGY
STAPLETON TRANSPORTATION & PLANNING Pty Ltd 36
5.2.3. Costing for S94 and Upgrading Existing Networks
The total cost of Roads (Blue
text) and Greenways (Green
text) in new areas in the period
2020 to 2030 is estimated at
$24,840,400. This cost has been
derived from the additional
movement generated by 2500
new houses. The cost per
dwelling in new areas is $9,928.
(Table 5.2.2.) This is applicable
to S94.
In addition it is expected that $6.34m will be required to upgrade existing roads; and $25.0m will be
required for South Bridge and its approaches.
5.2.4. Flood Management.
In respect of the proposed North Bridge, The northern parts of Bourke St, Darling St and Fitzroy St are flood
affected in a 50 year event.
Three “groups” of traffic will use North Bridge during a flood event a 4th will relocate to Yarrandale Rd.
1 Highway Traffic from the North must use Yarrandale Rd and can be given some priority by having
a right turn access into River St, available only during flood events. The Left turn from Yarrandale
Rd would be prohibited to give advantage to Highway traffic. Similarly a left turn into Yarrandale
Rd but not a right turn.
2 This would limit intrusion into the Campus, albeit heavy vehicles. Further limitation would be
extended but prohibiting movement between River St and Caroline St thereby requiring that
Cobbora Rd traffic comes down to Fitzroy St – which does not continue north. Hence, Cobbora
Rd would access River St from Fitzroy St and with access via River St West could access the Mitchell
Hwy.
TABLE 5.2.2 0 - 10 YEAR TRANSPORT INFRASTRUCTURE COST
2020 - 20300 - 5 Years 2020 - 2025 100,000's
Road Infrastructure in new areas $9,217
Dubbo Greenway Infrastructure $2,330
Existing Network Upgrades $2,000
5 - 10 Years 2025 - 2030
Road Infrastructure in new areas $11,094
Dubbo Greenway Infrastructure $2,180
Existing Network Upgrades $4,340
Internal Funding $24,956
Total 2020 - 2030 Road Infrastructure in new areas $20,311
Dubbo Greenway Infrastructure $4,509
2500 Dwellings Cost Per dwelling (For S94) $9,928
Existing Network Upgrades $6,340
Internal Funding $24,956

2020 DUBBO TRANSPORTATION STRATEGY
STAPLETON TRANSPORTATION & PLANNING Pty Ltd 37
Figure 5.2.2 Indicative Traffic Management during Flood.
3 In the meantime traffic
normally using Fitzroy St to
travel north could be advised
to divert to Wheelers Lane
crossing Cobbora Rd in what
should be a congestion free
intersection.
4 Town Traffic normally using
Emile Serisior Bridge – inundated
by flood water – would seek to
avoid the congestion at LH Ford
Bridge by continuing to North
Bridge and then returning into
North Dubbo via Bourke St or
Darling St and possibly to avoid
queuing on North Bridge not
Brisbane St. The Cobbora Rd
traffic would be encouraged to
continue to Fitzroy St by limiting
access into Erskine St thereby
simplifying the right turn from
Cobbora Rd. It may also be necessary to limit access from Fitzroy St south into Cobbora Rd.
5.3. 2025 – The 5 Year Priority
5.3.1. South Bridge as a 5 Year Priority
The existing 2018 traffic conditions (Fig 3.1) indicate Cobra St, the LH Ford Bridge and Cobbora Rd being
under stress.
Without any action development between 2020 and 2025 (1250 Dwelling in New Areas) would deteriorate
traffic conditions to stress both directions of traffic on the LH Ford Bridge, and Cobbora Rd would reach
unacceptable delays. (Fig 3.1). An alternative is required.

2020 DUBBO TRANSPORTATION STRATEGY
STAPLETON TRANSPORTATION & PLANNING Pty Ltd 38
Figure 5.3.1 Stressed Traffic Conditions - 2025 AM Peak North Bridge Only
The traffic conditions are not
improved by the completion of
North Bridge (Figure 5.3.1). A
reduction in demand on Cobbora
Rd (diversion to River St) bring some
relief, but new stress at Thompson St
even with a generously designed
intersection, and similar conditions
on Cobra St and for both directions
of the LH Ford Bridge.
Figure 5.3.2 Stressed Traffic Conditions - 2025 AM Peak Both Bridges
With North Bridge and South Bridge
completed in 2025 the Stressed
Sections of Cobra St, Fitzroy St and
Cobbora Rd settle down and are
not experience any further stress in
the long term. (Fig 5.4.2 and Fig
5.5.2)
But it is the Costs and Savings
achieved, 5.4 and 5.5; and how this
expenditure provides for the future
5.6 that justify expenditure and
explains the logic. Before the hard
economic facts the ‘perception”
of traffic conditions is view through “Stressed Conditions” continues below.

2020 DUBBO TRANSPORTATION STRATEGY
STAPLETON TRANSPORTATION & PLANNING Pty Ltd 39
Figure 5.3.3 Stressed Traffic Conditions - 2030 AM Base No Improvements
Just in case we needed any
justification for building a new
crossing urgently Figure 5.3.3
illustrates Stressed Streets in 2030.
With the eastbound direction of LH
Ford and Emile Serisior Bridge both
requiring action to be taken.
Figure 5.3.4 Stressed Traffic Conditions - 2030 AM Peak Both Bridges
Whereas with both Bridges built the
2030 conditions show similar
conditions to 2025 with pressure
building in the Health and
Education Precinct (Cobbora Rd)
This is addressed for 2040 (See 5.4.2
but returns as an issue in 2050 (See
5.4.2).

2020 DUBBO TRANSPORTATION STRATEGY
STAPLETON TRANSPORTATION & PLANNING Pty Ltd 40
5.4. 2030 - 2040 20 Year Investment Program
New residential growth is expected to occur mostly in SW (1250) and SE (800) with small developments in
the CW (250) and NW (200). Infrastructure for the SE is complete and 10 to 20 year program of works
concentrate mostly on a Strategic Link in the Central West (PJ 22, PJ 23) and Residential Grid roads in new
development. The Strategic Link successfully spreads the newly generated traffic away from LH Ford and
across to North Bridge.
Table 5.4.1 list the projects that are required to accommodate traffic by 2040. This is displayed in two
parts, a 10-to-15 year list, requiring budgeting in the next few years, and 15 to 20 year projects where no
action if required – unless of course if development occurs ahead of the schedule used in this analysis,
this particularly refers to the Residential Grid.
Entries in Blue and Green are the list are potential for a future S94 plan, Orange is an estimate for the
upgrade of existing streets. The Style of Street is described in 4.1, See Figure 5.4.1 for the location of these
projects.
Selecting some projects for more comment:
PJ 17 The extension of Grangewood Rd is part of the Residential Grid and not expected to increase
traffic on the existing road. This route is expected to serve a future school but not in this stage of
construction.
PJ 18 Also in the same area this extension of the Greenway needs to be planned and will open up the
remnant forest be to set aside near Chapmans Rd.
PJ 19 A link of Chapmans Rd over the Rail line to the CW Sector (and PJ 22) has been delayed until
after 2040, mostly as a cost saving but also because it did not carry sufficient traffic to impact on
West Dubbo. Nevertheless it would advantageous to “set” the travel pattern between the SW
and River St.
TABLE 5.4.1 10 - 20 YEAR (2030 - 2040)
10 - 15 YEARS 2030 - 2035
Ref Project
17 Grangewood Extn Stage 1
UP4 Existing Street Upgrades
18 Greenway Chapman Park
15 - 20 YEARS 2035 - 2040
20 River St West Extn
21 Mitchell Hyway Upgrade
22 Central West Spine Rd Stage 1
23 Extn to River St
24 Central West Link Rd Stage 1
25 Keswick Collectors
UP5 Existing Street Upgrades
26 Greenway CW Stage 1
27 Greenway Rail Crossing
TRANSPORT INFRASTRUCTURE PROGRAM
100,000s
Purpose Speed Design Style Comment Est Cost
Residential Grid 1 50k Only Local Traffic $1,658
Item Cost Potential City Circulation $2,000
Opening Forest $550
Strategic Network 4 60k Commercial Integrator Could have access to School $4,140
Strategic Network Upg Existing Could be earlier $3,000
Future Strategic Option 2 60k Urban Edge $6,132
Future Strategic Option 2 60k Urban Edge Draw to North Bridge $2,414
Residential Grid 1 50k Only Local Traffic $2,438
Residential Grid 1 50k Only Local Traffic $3,900
Item Cost ? Golden Hwy Yarrandale $2,000
Chapmans Creek Loop Complete $844
Delroy Loop Complete $280

2020 DUBBO TRANSPORTATION STRATEGY
STAPLETON TRANSPORTATION & PLANNING Pty Ltd 41
PJ 20 The extension of River St is required to access the Central West Spine Road PJ 22 and PJ23. It is
likely to serve a future school.
Figure 5.4.1 2040 10 - 20 Year Infrastructure
PJ 21 Upgrading of the Mitchell Hwy has been allocated to New Residential Development (Item cost
$3m). This could perhaps be allocated to non-residential development with the cost saving going
towards PJ 19 ($4.8m). As can be seen from this discussion there will be alternative to discuss in 5
years.
PJ 22 The Central West Spine Road is a Strategic Road. This section through the CW from the Mitchell
Hwy to Rosedale Rd has been “located” so that it is paralleled with the Greenway PJ 26. Master
Planning could indicate other more environmentally sensitive options. Also the alignment may
not actually be contained within the development assumed to be occurring in this area. Hence
PJ 24 is possibly longer than will be required at the time.
PJ 23 A separate project extending the Central West Spine Road to River St. This could be the subject
of a detailed land use plan including the intersection at the Mitchell Hwy and the potential
“Lookout” at the Drive-In cinema.
PJ 24 Is Stage 1 of the Central West Link Rd and illustrates how the Residential Grid themselves form a
connective network in the same way as the existing Residential Grid in Dubbo.

2020 DUBBO TRANSPORTATION STRATEGY
STAPLETON TRANSPORTATION & PLANNING Pty Ltd 42
PJ 25 The Keswick Collectors have been ‘on the plan’ for about 20 years and are strategically
orientated to disperse traffic from Keswick without putting pressure on any one of the access
roads.
PJ 26 Is the afore mentioned Green Ring almost completed (PJ 32)
PJ 27 Is the last Greenway connection for the Delroy Loop.
The upgrading of Existing Streets are again not specifically identified, it could be anticipated that
circulation is again subject to change as the benefits of Bligh St are recognised throughout the town. And
the growing employment in the Heath and Education Precinct plus some levels of stress could trigger a
circulation plan for this area.
Figure 5.4.2 Stressed Traffic Conditions 2040 AM Peak
The measures taken to move traffic
north south across the new western
areas has taken pressure off the three
river crossings.
Meanwhile the slow growth in
demand from the SE and E maintains
the levels of stress in Cobra St and
Fitzroy St but does not overload these
links indicating that previous
infrastructure has set up a long term
solution. Stress around the Base
Hospital continues.
The estimated cost for all works
attributed to dwellings in new
areas for this decade is
$25,355,000, or $10,142 per
dwelling.
Costs for upgrading existing streets, possibly in the City and Heath and Education Precinct are not known
but nominated as $4m. Interestingly the existing intersections throughout town are not reporting an
additional delays; this may not be the case for individual developments.
TABLE 5.4.2 10 - 20 YEAR TRANSPORT INFRASTRUCTURE COST2030 - 2040
100,000's
Road Infrastructure in new areas $23,681
Dubbo Greenway Infrastructure $1,674
2500 Dwellings Cost Per Dwelling $10,142
Existing Network Upgrades $4,000

2020 DUBBO TRANSPORTATION STRATEGY
STAPLETON TRANSPORTATION & PLANNING Pty Ltd 43
5.5. 2040 – 2055 35 Year Investment Horizon
The pattern for new development between 2040 and 2055 (20 to 35 years) is entirely to the West and it is
assumed that development will keep as close as possible to the City Centre. Hence; the NW is built out
with 1550 new dwellings; the first major expansion occurs in the CW (900 Dwls); and a slow continuation
in the SW (600 Dwls).
New links are orientated to continue the dispersal of traffic after 2055 years and start to concentrate
demand on new employment/activity hubs possibly a linear extension of River St. This of course will be
reviewed in, say, 2025 when 2055 on will be the new 20-year plan.
The program includes:
PJ 19 The Chapmans rail crossing, reallocated from the 2030 2040 projects.
PJ 37 The second western rail crossing between the SW and CW Sectors.
PJ 28 and PJ 35 Further extensions of Grangewood Rd and Blackbutt Rd
PJ 29 Continuation of the Central West Link Rd.
PJ 30 and PJ 31 in the NW Sector
PJ 36 and PJ 38 creating a continuous connection between Blackbutt St and the Central West Link Road.
TABLE 5.5.1 20 - 35 YEAR (2040 - 2055)
20 - 25 YEARS 2040 - 2045
Ref Project
19 Chapmans Rail Crossing Stage 1
28 SW Extn of Grangewood Rd
29 Central West Link Rd Stage 2
30 Northern City Access
31 Riverside Boulevard Stage 3
UP5 Internal Street Upgrades
32 Greenway NW
33 Greenway NW Loop
34 Greenway NW-Rail Loop
25 - 35 YEARS 2045 - 2055
35 SW Extn of Blackbutt
36 Southern Link Rd Stage 1
37 Southern Link Rd Stage 2
38 Northern Link Rd Stage 1
UP5 Internal Street Upgrades
39 Buddens Creek
INDICATIVE TRANSPORT INFRASTRUCTURE PROGRAM
100,000s
Purpose Speed Design Style Comment Est Cost
Future Strategic Option 5.1 60k Residential Integrator St 2 One rail bridge $4,764
Residential Grid 1 50k Only Local Traffic $1,950
Future Strategic Option 5.1 60k Residential Integrator St 1 Option for 3 carriageways as Type 4 $2,243
Residential Grid 1 50k Only Local Traffic $3,900
Future Strategic Option 2 60k Urban Edge $5,106
Item Cost Not Identified $2,000
Green Ring Complete $238
$550
$544
Residential Grid 1 50k Only Local Traffic Draw away from Minore $975
Future Strategic Option 5.1 60k Residential Integrator St 1 Option for 3 carriageways as Type 4 $1,944
Future Strategic Option 5.1 60k Residential Integrator St 1 Increases significance after 2050 $2,990
Future Strategic Option 5.1 60k Residential Integrator St 1 Increases significance after 2050 $4,186
Item Cost Not Identified $4,000
Buddens Creek Loop Complete $669

2020 DUBBO TRANSPORTATION STRATEGY
STAPLETON TRANSPORTATION & PLANNING Pty Ltd 44
Figure 5.5.2 Stressed Traffic Conditions 2055 AM Peak
The modelling reports Stress in the
usual places on Cobra St, and a
critical situation in Caroline St
(Heath and Education Precinct).
Stress also returns to LH ford and
occurs for the first time on North
Bridge.
These two signs indicate a 5th
Crossing will be required on or
around 2055; 30 years after South
Bridge and Bryon Bay have been
built.
Figure 5.5.1 2055 - 35 Year Infrastructure

2020 DUBBO TRANSPORTATION STRATEGY
STAPLETON TRANSPORTATION & PLANNING Pty Ltd 45
The estimated cost per new dwelling
in the 20 to 35 year period (Table
5.5.2), indicates a level of investment
per dwelling, $9,855, almost exactly
the same as the 2020 – 2030 estimate.
These figures include Greenway costs.
We can confidently conclude that the modelling has confirmed the rate of new infrastructure required
by time period over the next 35 years, subject to changes in the scale of development or possibly the
location of development. For example; additional development in the SE might force consideration of
a new, highly costly Southern Bypass that has not been considered for this or the previous Strategic
Transport Plan.
This development scenario concludes with a Road Hierarchy (Fig 5.5.2) that look similar to the existing
road hierarchy, consisting of extensive new Residential Grid Road and an expanding Strategic Network.
This scenario is extended to long-term development (5.7).
Figure 5.5.3 The 2055 Road Hierarchy
TABLE 5.5.2 20 - 35 YEAR TRANSPORT INFRASTRUCTURE COST2040 - 2055
100,000's
Road Infrastructure in new areas $28,056
Dubbo Greenway Infrastructure $2,001
3050 Dwellings Cost Per Dwelling $9,855
Existing Network Upgrades Not Known

2020 DUBBO TRANSPORTATION STRATEGY
STAPLETON TRANSPORTATION & PLANNING Pty Ltd 46
The second reality check is to summaries the Infrastructure Costs per time period (Table 5.5.3). They are
balanced.
(The CW and SW Figures are derived later in 5.6)
5.6. Goals Achieved
The report started by setting out the aims of the transport network.
In response these proposals:
Allow for the population to increase by 17000 new residents whilst:
Maintaining the 10 minute City.
Resolving current issues on the LH Ford.
Continuing to provide the high level of amenity for access throughout Dubbo.
Providing the flexibility for movement without concentrating traffic.
Providing new residents with the same level of amenity as the existing areas.
Avoiding increasing the capacity of Cobra St to maintain it as a mixed commercial residential
street.
Keeping the cost of new infrastructure to within $10,000 per new dwelling.
5.7. Towards 100,000
The final question is how the 2055 proposals will fit into the continuing extension of the residential areas.
Figure 2.4 shows how development in the next 35 years will fill the SE and NW Sectors to capacity and
there will be capacity for a further 8000 dwellings at the current density of development in the SW and
CW . Estimates get a bit open ended in this time frame certainly not suitable for conclusive modelling.
The more important planning question is; will the form of infrastructure accommodate additional
population after 2055?
TABLE 5.5.3 INFRASTRUCTURE COSTS BY TIME PERIOD
Total Cost of RMS Existing Rd Council Construction in new Areas Houses Cost per
Infrastructure Funded Upgrades Funding Greenways Roads built New Dwelling
2020 - 2030 $124,807,280 $68,690,880 $6,340,000 $24,956,000 $4,509,000 $20,311,400 2500 $9,928
2030 - 2040 $29,355,000 0 $4,000,000 0 $1,674,400 $23,680,600 2500 $10,142
2040 - 2055 $36,056,600 0 $6,000,000 0 $2,000,500 $28,056,100 3050 $9,855
CW and SW $102,301,500 Potential $16,395,500 $0 $5,754,000 $80,152,000 8050 $10,672

2020 DUBBO TRANSPORTATION STRATEGY
STAPLETON TRANSPORTATION & PLANNING Pty Ltd 47
This following exercise looks at urban form and, as a reality check, costs the infrastructure and the
indicative the cost per new dwelling in the same manner as the analysis to 2055.
Continuity defines how roads are used. In a perfect grid everyone tries to go by the shortest route but
tend also to avoid make turns – particularly right turns. A grid network tends to concentrate demand at
the centre of the network. The concept for Dubbo is to create two series of roads that offer direct no-
turn paths over long distances. One is the traditional grid system serving the Town Centre and a second
series of roads are orientated to draw demand away from the Town centre. Figure 5.7.1 illustrates these.
The traditional grid for the City Centre includes
1 The southern edge of the Mitchell Hwy.
2 The northern edge from Thompson St to Cobbora Road.
3 The eastern edge of Fitzroy St to the Mitchell Hwy.
4 The western edge of Whylandra St.
Using any of these streets leads to the opportunity to make one turn into the circulation road in the City
Centre.
Three additional roads have been added to increase the capacity of access to the City Centre
1 Bligh Street with direct no-turn access from the SE.
2 South Bridge with direct no-turn access from Minore Rd and the SW.
3 And or around 2055 a bridge at Wingewarra Rd providing a secondary direct link from
Wingewarra Rd east possibly through West Dubbo and via Bumblegumbie Rd to the NW.
Conclusion – The City Access network provides a substantial increased capacity, well beyond that
needed for the growth of the City. This relieves some capacity on the existing roads for other additional
trips.

2020 DUBBO TRANSPORTATION STRATEGY
STAPLETON TRANSPORTATION & PLANNING Pty Ltd 48
Figure 5.7.1 Long term Strategy
The second series of long roads all originate in the western development areas. Four long streets,
preferably designed with different identities, aim to draw traffic away from the Residential Grid.
These new continuous roads are:
1 The River St axis with a change of orientation to the SW and without a turn.
2 The Northern Link Road, orientated to the north and continues north possibly onto the Northern
Bypass.
3 The Southern Link Road orientates to the south at the Newell Hwy and possibly onto the Southern
Bypass.
These three roads have been focused on the western rail crossing between the CW and SW Sectors. This
could vary but it indicates how a powerful position could be created for a future Activity Centre.
4 The Chapmans Loop a continuous street between the CW and the SW providing legibility and
accessing 1, 2 and 3 along the way.
This is only an exercise but in the final part of this analysis this concept was costed using the same road
styles as earlier work (Fig 5.7.2)
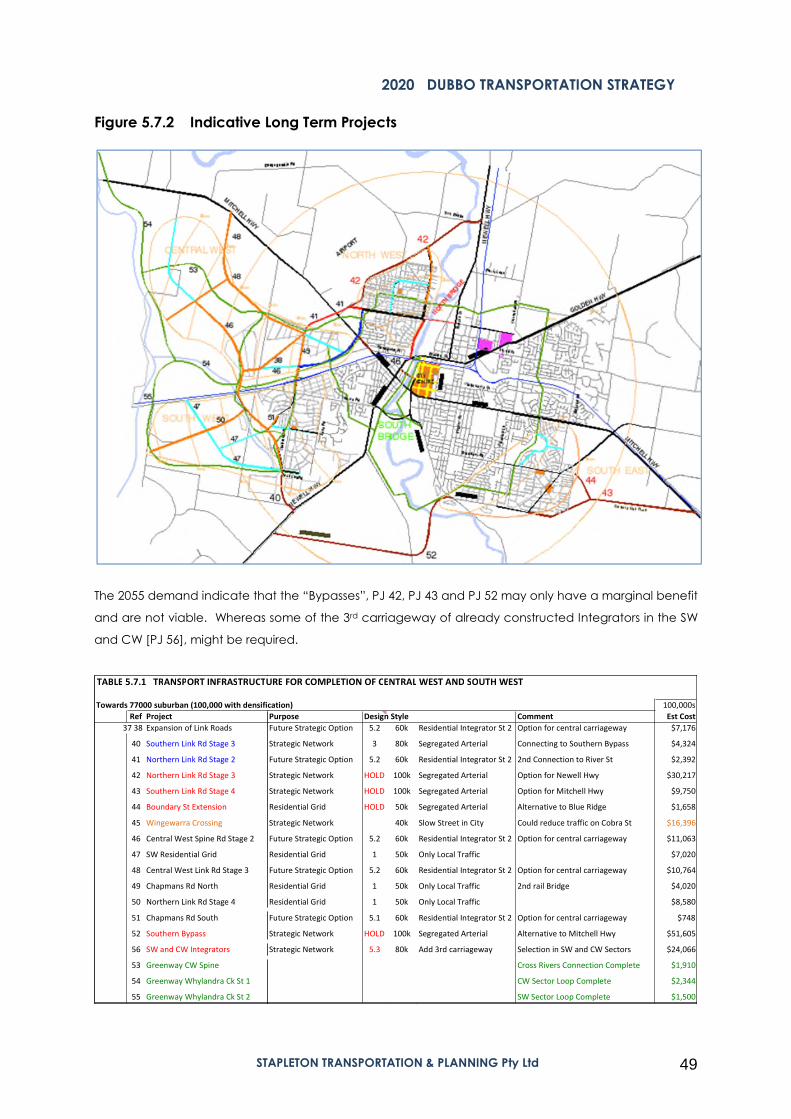
2020 DUBBO TRANSPORTATION STRATEGY
STAPLETON TRANSPORTATION & PLANNING Pty Ltd 49
Figure 5.7.2 Indicative Long Term Projects
The 2055 demand indicate that the “Bypasses”, PJ 42, PJ 43 and PJ 52 may only have a marginal benefit
and are not viable. Whereas some of the 3rd carriageway of already constructed Integrators in the SW
and CW [PJ 56], might be required.
TABLE 5.7.1 TRANSPORT INFRASTRUCTU
Towards 77000 suburban (100,000 with densific
Ref Project
37 38 Expansion of Link Roads
40 Southern Link Rd Stage 3
41 Northern Link Rd Stage 2
42 Northern Link Rd Stage 3
43 Southern Link Rd Stage 4
44 Boundary St Extension
45 Wingewarra Crossing
46 Central West Spine Rd Stage 2
47 SW Residential Grid
48 Central West Link Rd Stage 3
49 Chapmans Rd North
50 Northern Link Rd Stage 4
51 Chapmans Rd South
52 Southern Bypass
56 SW and CW Integrators
53 Greenway CW Spine
54 Greenway Whylandra Ck St 1
55 Greenway Whylandra Ck St 2
URE FOR COMPLETION OF CENTRAL WEST AND SOUTH WEST
cation) 100,000s
Purpose Design Style Comment Est Cost
Future Strategic Option 5.2 60k Residential Integrator St 2 Option for central carriageway $7,176
Strategic Network 3 80k Segregated Arterial Connecting to Southern Bypass $4,324
Future Strategic Option 5.2 60k Residential Integrator St 2 2nd Connection to River St $2,392
Strategic Network HOLD 100k Segregated Arterial Option for Newell Hwy $30,217
Strategic Network HOLD 100k Segregated Arterial Option for Mitchell Hwy $9,750
Residential Grid HOLD 50k Segregated Arterial Alternative to Blue Ridge $1,658
Strategic Network 40k Slow Street in City Could reduce traffic on Cobra St $16,396
Future Strategic Option 5.2 60k Residential Integrator St 2 Option for central carriageway $11,063
Residential Grid 1 50k Only Local Traffic $7,020
Future Strategic Option 5.2 60k Residential Integrator St 2 Option for central carriageway $10,764
Residential Grid 1 50k Only Local Traffic 2nd rail Bridge $4,020
Residential Grid 1 50k Only Local Traffic $8,580
Future Strategic Option 5.1 60k Residential Integrator St 2 Option for central carriageway $748
Strategic Network HOLD 100k Segregated Arterial Alternative to Mitchell Hwy $51,605
Strategic Network 5.3 80k Add 3rd carriageway Selection in SW and CW Sectors $24,066
Cross Rivers Connection Complete $1,910
CW Sector Loop Complete $2,344
SW Sector Loop Complete $1,500

2020 DUBBO TRANSPORTATION STRATEGY
STAPLETON TRANSPORTATION & PLANNING Pty Ltd 50
Whilst the analysis is of no consequence for the conclusions reached for 2055 it is reassuring to note that
the cost per new dwelling remains around $10,000 indicating a viable extension of the investment until
2055 (Figure 5.7.2). And a project such as the Wingewarra Crossing would cost a further $2000 per
dwelling. Of course this will be attributed to upgrading the existing areas and not new development
(Figure 5.7.3)
Conclusion - South Bridge provides stable network that can grow without further intervention until 2055.
5.8. Next Steps.
The short term conclusion from the long term form for Dubbo is that the decision to build North Bridge has
strengthened three Enterprise Zones. The Heath and Education Precinct, the Airport Precinct and the
Riverside Precinct. These need to be enhanced by legible, purpose built, uniquely identifiable, road
connections.
The River St Commercial Axis will inevitably extend across the Mitchell Hwy,
The next step is to identify how this axis will work in the short term whilst North Bridge is being constructed;
in the medium term as the NW Sector develops and the Axis becomes a Commercial Integrator; and in
the long term as it extends it will become a recognisable commercial focus.
Conclusion – This alignment needs to be protected now. As does the Riverside Boulevard?
TABLE 5.7.2 INDICATIVE FUTURE INFRASTRUCTURE COSTS2055 Plus
100,000's
Road Infrastructure in new areas $80,152
Dubbo Greenway Infrastructure $5,754
8050 Dwellings Cost Per Dwelling $10,672
Strategic Network (See HOLD) $43,535 $5,408
TABLE 5.6.3 FLEXIBILITY FOR ADDITIONAL PROJECTS2055 Plus
100,000's
8050 Dwelling Completed
A
Include Wingewarra Crossing 2040 - Ultimate (More likely to be internal)
Wingewarra $16,396
Additional Cost per Dwelling $2,037
Current Plan $10,672
Total $12,708
Additional 19%

2020 DUBBO TRANSPORTATION STRATEGY
STAPLETON TRANSPORTATION & PLANNING Pty Ltd 51
Figure 5.8 Key links to protect

2020 DUBBO TRANSPORTATION STRATEGY
STAPLETON TRANSPORTATION & PLANNING Pty Ltd 52
6. DATA ANALYSIS
6.1. Modelling Process
TABLE 6.1 DATA FLOW IN MODELLINGOUTPUT
1 DATA BASE
Population by CCD Settle on Employment Categories(for trip generation)
ê êDemographic
# in Family
# in Employment
Settle on Zones ~ 200 1 Retail, 2 Finance, 3 Commercial, 4Manufacturing, 5 Other incl Education
ê î ê êDemographic Trends
# in Family# in Employment
Trip Generation
by Time AM PM INTL Veh and H Veh
Trip Generation by
Category and TimeL Veh and H veh
çEmployment by Zone
ê î íTRIPS
AM PM INT
êSurvey Vehicle Counts
and through trafficè
MATCH BASE YEAR(Calibrate)
çROAD NETWORK Classification
Speed Vol profile Intersection type
êTrends in
Through traffic andexternal traffic
ê ê ê ê ê
2 2019 BASE YEAR
Adjust Housing from2016
èDemand from recent
residential devleopmentè
Adjust Trip Demandfrom Survey
çVerify Employment from 2016 Census
êReport network
CharacteristicsNetwork 2019
çROAD UPGRADES
None çCurrent Upgrades
Extn of Boundary Rd
ê ê ê ê ê
3 2025 South Bridge Verification
Housing andDemographic Forecast
èDemand from new
residential devleopmentFuture Trip Demand
çEmployment Forecast
by Category and location
ê êAdd Internal Grid Roads
è
Identify defficienciesand add upgrades
ç
SELECT ROADUPGRADES
to meet TravelStandard including
intersection upgrades
ç
POTENTIAL UPGRADES1 North Bridge, Riverside, Victoria
Whylandra2 Macquarie St to Sheraton3 South Bridge, Bligh St
4 Minore Rd
êReport networkCharacteristics
Network 2025è è
Infrastructure
Program 2025
ê ê ê ê ê
4 2030 SECTION S94 NEXUS
Housing and
Demographic Forecastè
Demand from new
residential devleopmentè
Future Trip Demandç
Employment Forecast
by Category and location
ê ê êAdd Internal Grid Roads
è
Identify defficienciesand add upgrades
ç
SELECT ROADUPGRADES
to meet TravelStandard including
intersection upgrades
ç
POTENTIAL UPGRADES4 Minore Rd5 Cobbora Rd Rail Crossing6 River St W and E
7 Chapman Rd Rail Bridge
êReport Network
CharacteristicsNetwork 2030
è èInfrastructure
Program 2030(Cost Benefit)
êCost of travel all users
(A)
êDelete demand from
New Res Development è èCost of travel with no
new users (B) ç
êA - B =
Costs imposed by new
usersè è
Section 94
Contribution Plan
êREPORT
Demand from
SE,SW,CW NW.è
ê ê ê ê ê
5 2040 and 2050
Housing and
Demographic Forecastè
Demand from new
residential devleopmentè
Future Trip Demandç
Employment Forecast
by Category and location
ê êAdd Internal Grid Roads
è
Identify defficienciesand add upgrades
ç
SELECT ROADUPGRADES
to meet TravelStandard including
intersection upgradesç
POTENTIAL UPGRADES6 River St W and E7 Chapman Rd Rail Bridge and CentralWest Link Rd Stage 1
8 Western Distributor S to ExtnGrangewood Rd9 Western Distributor N to Mitchell Hwy
and River St W
êReport Network
Characteristics è èInfrastructure
Program 2040and 2050
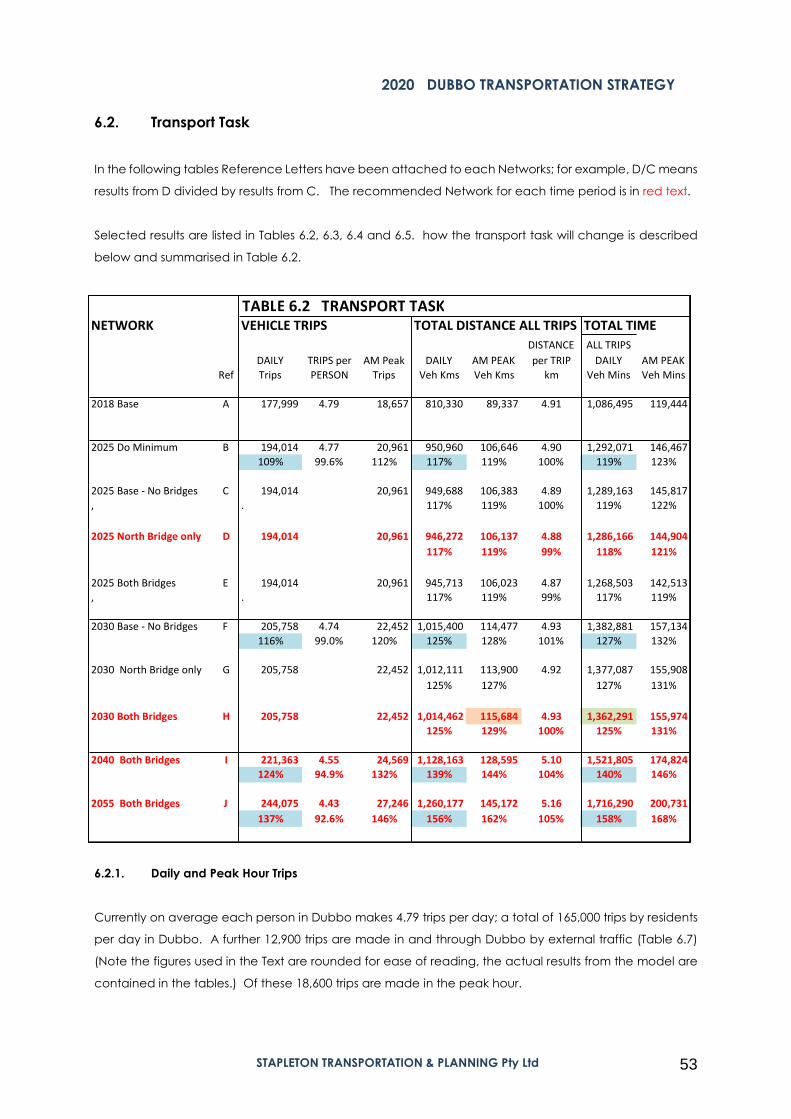
2020 DUBBO TRANSPORTATION STRATEGY
STAPLETON TRANSPORTATION & PLANNING Pty Ltd 53
6.2. Transport Task
In the following tables Reference Letters have been attached to each Networks; for example, D/C means
results from D divided by results from C. The recommended Network for each time period is in red text.
Selected results are listed in Tables 6.2, 6.3, 6.4 and 6.5. how the transport task will change is described
below and summarised in Table 6.2.
6.2.1. Daily and Peak Hour Trips
Currently on average each person in Dubbo makes 4.79 trips per day; a total of 165,000 trips by residents
per day in Dubbo. A further 12,900 trips are made in and through Dubbo by external traffic (Table 6.7)
(Note the figures used in the Text are rounded for ease of reading, the actual results from the model are
contained in the tables.) Of these 18,600 trips are made in the peak hour.
TABLE 6.2 TRANSPORT TASKNETWORK VEHICLE TRIPS TOTAL DISTANCE ALL TRIPS TOTAL TIME
DISTANCE ALL TRIPS
DAILY TRIPS per AM Peak DAILY AM PEAK per TRIP DAILY AM PEAK
Ref Trips PERSON Trips Veh Kms Veh Kms km Veh Mins Veh Mins
2018 Base A 177,999 4.79 18,657 810,330 89,337 4.91 1,086,495 119,444
2025 Do Minimum B 194,014 4.77 20,961 950,960 106,646 4.90 1,292,071 146,467
109% 99.6% 112% 117% 119% 100% 119% 123%
2025 Base - No Bridges C 194,014 20,961 949,688 106,383 4.89 1,289,163 145,817
, . 117% 119% 100% 119% 122%
2025 North Bridge only D 194,014 20,961 946,272 106,137 4.88 1,286,166 144,904
117% 119% 99% 118% 121%
2025 Both Bridges E 194,014 20,961 945,713 106,023 4.87 1,268,503 142,513
, . 117% 119% 99% 117% 119%
2030 Base - No Bridges F 205,758 4.74 22,452 1,015,400 114,477 4.93 1,382,881 157,134
116% 99.0% 120% 125% 128% 101% 127% 132%
2030 North Bridge only G 205,758 22,452 1,012,111 113,900 4.92 1,377,087 155,908
125% 127% 127% 131%
2030 Both Bridges H 205,758 22,452 1,014,462 115,684 4.93 1,362,291 155,974
125% 129% 100% 125% 131%
2040 Both Bridges I 221,363 4.55 24,569 1,128,163 128,595 5.10 1,521,805 174,824
124% 94.9% 132% 139% 144% 104% 140% 146%
2055 Both Bridges J 244,075 4.43 27,246 1,260,177 145,172 5.16 1,716,290 200,731
137% 92.6% 146% 156% 162% 105% 158% 168%

2020 DUBBO TRANSPORTATION STRATEGY
STAPLETON TRANSPORTATION & PLANNING Pty Ltd 54
The number of trips made per person is reducing due to demographics and therefore the number of trips
to be handled by the transport network does not rise in direct proportion to population. Daily trips are
expected to rise by 37% to 244,000 trips per day in 2055. The varying proportions in the type of
employment are altering the proportion of trip made in the morning peak hour. Demand in the peak
period is expected to rise by 46% to 27,200 trips per hour.
6.2.2. Distance travelled on Network,
The gradual increasing size of Dubbo is increasing the distance travel per trip; it is currently 4.91 km per
trip and is expected to rise to 5.16 km per trip by 2055. Hence the total vehicle kilometres will rise by 56%
in the period to 2055 and by 62% in the peak period.
This is the basic input to the model.
6.2.3. Time Spent on Network,
Output from the model finds that the number of minutes travelled per day will increase from 1.1million
minutes to 1.7m minutes, a 58% increase in time. The rise is consistent through the years. Morning Peak
hour travel will increase by 68%. This is due to more trips to accommodate and not as a result of
congestion.
6.3. Network Performance
A selection of Performance Indicators are described below and listed in Table 6.3.
6.3.1. Minutes per Trip
Dubbo is described as the 10-minute City and the current average trip time is 6.58 minutes. Thinking of a
distribution of trips the majority of journeys are indeed less than 10 minutes.
This is an ideal performance indicator for the future networks.
The output from the Model shows the average time hardly varying through to 2030 as demand increases
by 25%. The average time increases (by a mere) 18 seconds (4%) by 2040; mostly as a result of the greater
area of development. The same applies to 2055 when most development is occurring 5 to 6 km west of
the City Centre and the average time increases 7% to 7.03 minutes.
Conclusions – the Land Use and Transport Strategy is successful.

2020 DUBBO TRANSPORTATION STRATEGY
STAPLETON TRANSPORTATION & PLANNING Pty Ltd 55
6.3.2. Time on Cobra St
Of more local concern to some would be the “Green Bars” seen consistently along Cobra St. A specific
measurement was taken from a point near Wheelers Ln along Cobra St to a point near Macquarie St.
(This includes some time getting to and from Cobra St). The current time during the morning peak is 6.93
minutes. Without further action but with the increased population the time would increase by 2% by 2030
but with both bridges in operation the time increases by 1% or 6 seconds. This shows the sensitively of the
model to very small changes in traffic conditions, as reported in the “Stressed Sections” diagrams.
And even when many parts of the road network will be operating with some difficulty in 2055 the increase
in time along Cobra St is only expected to be 3% or 12 seconds, well below the average increase time
throughout Dubbo (17 seconds).
Conclusion – The Strategy to draw a little traffic away from Cobra St is successful.
NETWORK
Ref
2018 Base A
2025 Do Minimum B
2025 Base - No Bridges C
,
2025 North Bridge only D
2025 Both Bridges E
,
2030 Base - No Bridges F
2030 North Bridge only G
2030 Both Bridges H
2040 Both Bridges I
2055 Both Bridges J
TABLE 6.3 NETWORK PERFORMANCECOBRA St AVERAGE SPEED
MINUTES Difference Time Difference
per TRIP from 2018 from 2018 AM Peak Day Period PM Peak
Min Sec Min Sec kmph kmph kmph
6.58 6.93 44.9 44.7 44.7
6.66 4.7 7.08 9 43.7 44.3 44.1
101% 102% 97% 99% 99%
6.64 3.8 7.00 4.2 43.8 44.3 44.1
101%
6.63 2.9 7.01 4.8 43.9 44.3 43.8
101%
6.54 -2.6 6.98 3 44.6 44.8 44.7
99% 101% 99% 100% 100%
6.72 8.4 7.06 7.8 43.7 44.2 44.0
102%
6.69 6.7 7.03 6 43.8 44.2 44.0
101%
6.62 2.4 7.03 6 44.5 44.7 44.7
101% 101% 99% 100% 100%
6.87 17.6 7.05 7.2 44.1 44.6 44.3
104% 102% 98% 100% 99%
7.03 27.0 7.13 12 43.4 44.3 43.9
107% 103% 97% 99% 98%

2020 DUBBO TRANSPORTATION STRATEGY
STAPLETON TRANSPORTATION & PLANNING Pty Ltd 56
6.3.3. Average Operating Speed
On a broader scale the average speed of trips indicates the overall condition of travel in Dubbo.
Currently is it 44.9 km/h in the morning peak and 44.7 km/h in the afternoon peak and during the day.
This is a very comfortable average speed that would be envied by most small towns let alone large
Metropolitan Areas. The little to no difference between peak and off-peak average speed is also a selling
point to the amenity of Dubbo.
And these average speeds are not expected to vary by more than 1% to 3 %, an almost immeasurable
difference that could be attributed to minor causes.
Conclusion – The amenity to move about Dubbo easily is not being compromised by development.
6.4. Costs and Savings
NETWORK
Ref
2018 Base A
2025 Do Minimum B
2025 Base - No Bridges C
,
2025 North Bridge only D
2025 Both Bridges E
,
2030 Base - No Bridges F
2030 North Bridge only G
2030 Both Bridges H
2040 Both Bridges I
2055 Both Bridges J
TABLE 6.4 INVESTMENT PERFORMANCECOST
Annual Cost SAVINGVehicle Time Total From Annual
$ $ $ $
$73,150,000 $128,160,000 $201,310,000
$85,840,000 $152,410,000 $238,250,000 Base 2025
118%
No Bridges
$85,730,000 $152,070,000 $237,800,000 B - C $450,000
118%
North Bridge Only
$85,420,000 $151,720,000 $237,140,000 D - C $660,000
118%
Addition for South Bridge
$85,370,000 $149,630,000 $235,000,000 E - D $2,140,000
117%
$91,660,000 $163,120,000 $254,780,000 Base 2030
127%
North Bridge Only
$91,360,000 $162,440,000 $253,800,000 F - G $980,000
126%
Addition for South Bridge
$91,580,000 $160,700,000 $252,280,000 H - G $1,520,000
125%
$101,840,000 $179,510,000 $281,350,000
140%
$113,760,000 $202,450,000 $316,210,000
157%
2020 DUBBO TRANSPORTATION STRATEGY
STAPLETON TRANSPORTATION & PLANNING Pty Ltd 57
6.4.1. Vehicle Costs and Time Costs
The cost estimates use 2016 ABS data of 30.09 cents/km for vehicle operating costs and 39.22 cents per
minute for the value of time when travelling. These are average figures that should be equally applicable
in Dubbo.
Due to the stability of the length of travel time and the distance travelled the cost of travel in Dubbo will
increase at near to the same rate as the number of trips increases. (This is somewhat different to a typical
cost/benefit discussion for Metropolitan infrastructure where travel time-saving are usually dominant).
The travel cost savings are calculated from the small time savings between schemes (networks). Hence
for 2025 the costs of [C] The No Bridges network that does have all other Grid Road against [B] the do
minimum where traffic is simply loaded onto the existing network show a saving of $450,000/annum.
Conclusion – The Residential Grid Roads have an economic benefit and are not uni-functional local
distributor roads.
6.4.2. Return on Investment
The addition of South Bridge to the 2030 Network [H] shows a saving of $1,520,000 per annum over [G]
Network with only North Bridge Built. The estimated cost for South Bridge is $25m. The simple division of
$25m by 1.52m indicates a ratio of 16. A full economic calculation is far more complex taking into
account changes in traffic etc, this is a comparative indicator.
Conclusion – The first year’s savings from South Bridge are 1/16th of the cost of the construction.
Comparing this with the construction of North Bridge ($68m for similar works and not including the
intersection at Thompson St) and the time saving of $980,000. The first year’s savings are 1/70th of
construction cost.
There are many further details, for both schemes, South Bridge looks to be an extremely beneficial project
for Council. And the benefits of North Bridge are enhanced by accommodating City traffic and
indirectly giving priority to new – Enterprise - employment and residential development.
Conclusion – North Bridge will become a viable project by carrying Dubbo City Traffic.

2020 DUBBO TRANSPORTATION STRATEGY
STAPLETON TRANSPORTATION & PLANNING Pty Ltd 58
6.5. Traffic Flows
The model reports the hourly and daily flows between each intersection for every street in the Networks
(Fig 3.1 indicates the density of streets included in the Model). Those streets that help explain the analysis
are listed in Table 6.5 and are more simply described in the text below. Existing residential streets that are
not listed when that generally following a pattern of little or no change or changes in flows of streets in
new areas that are simply proportional to new development.
Table 6.5 contains highlights
Green Identified in the Stress Diagrams (described earlier)
Light Orange Warning conditions could be coming critical and action is needed
Darker Orange Double warning
Olive green Flow decreased
Blue Large increase in time period.
Red Text Recommended scheme.
Five groups of results have been selected for their relationship to each other.
6.5.1. Traffic Crossing Macquarie River
The demand for crossing the Macquarie River sets the timing for new crossings. But the location of a new
crossing needs to attract demand from the crossings that are congested.
Currently 36,800 vehicles per day [VpD] cross the Macquarie River; 19,500 53% using the LH Ford Bridge;
and 17,300 using the Emile Serisior Bridge.
The completion of North Bridge by 2025 will only attract 10% of crossing traffic, mostly from Emile Serisior
Bridge (down to 38%) with only a 1% difference at LH Ford.
South Bridge on the other hand would attract 18% of crossing traffic in 2025 and 2030 reducing demand
on LH Ford to 40%. Daily traffic in the LH Ford would reduce to 17,700 VpD and stress free in 2030 (Net H).
By 2040 the road configuration in the west, combined with additional employment along the Enterprise
Axis, has drawn 15% of demand to North Bridge and 24% to South Bridge. The total demand has lifted
from 36,800 VpD existing to 57,800 VpD that is conveniently spread over the 4 crossings. LH Ford is
operating at the same demand as currently and therefore starting to experience stress (even though this
is not showing up in the statistics) (Fig 5.4.2).
2020 DUBBO TRANSPORTATION STRATEGY
STAPLETON TRANSPORTATION & PLANNING Pty Ltd 59
The further concentration of development in the CW and NW through to 2055 will increase the proportion
of crossing on North Bridge to 18% and a reduction in the proportion elsewhere (LH Ford from 34% to 31%,
Emile Serisior Bridge 28% to 27% and South Bridge 24% to 23%. Both the LH Ford (21,000 VpD) and North
Bridge (12,500 VpD) are under stress (Fig 5.5.2). But with LH Ford having slightly less demand than 2025
without South Bridge.
Conclusion – The Strategy maximises the use of new infrastructure.
It is also evident from these figures that a new crossing in the central part of the City, a continuation of
Wingewarra Rd, would reduce traffic on the LH Ford and Cobra St around 2055. And, combined with a
link through West Dubbo to the NW Sector (Figure 5.7.1) could possibly take just enough pressure off River
St at Cobbora Rd to ease demand on North Bridge.
Other features of the stats are that if nothing were to be done by 2030 then the LH Ford Bridge would be
operating at High Stress requiring immediate attention. Whereas with North Bridge and South Bridge the
LH Ford will be carrying 9% less traffic than today.
6.5.2. South End
The South End Group addresses the sensitivity of traffic intrusion into South Dubbo.
The intention of the new connectivity is to draw a small part of the demand generated in the SE Sector
from Boundary Rd into Hennessey Rd and thence the southern part of Macquarie St, the historic entry into
Dubbo.
Boundary St is currently carrying more than twice the demand on Hennessey Rd (Counted in Survey).
Between 2018 and 2030 traffic is expected to double on Hennessey Rd (107%) – close to the current flow
in Boundary St and traffic in Boundary St is expected to grow by 42%.
Conclusion - The orientation of streets in the SE to Hennessey Rd shows that the upgrade of Bligh St to
Macquarie St south will be successful.
Traffic on Bligh St, without the traffic from South Bridge is expected to grow by over 100 %. (Net G) The
addition of South Bridge will add a further 100% of current traffic, all located away from residential areas.
Referring to the recommended network for 2030 (Net H) traffic is expected to increase in the next 12 years
by 108% on Hennessey Rd and 45% on Boundary St both remaining well within their environment and
carrying capacity. The demand will increase gradually after 2030 on these two streets.

2020 DUBBO TRANSPORTATION STRATEGY
STAPLETON TRANSPORTATION & PLANNING Pty Ltd 60
Demand on Bligh St will continue to absorb the increase in traffic between the SW and the City Centre,
29% between 2030 and 2040 and 12% thereafter.
The figures in Network E and Network D illustrate the proportion of movements between South Bridge,
Macquarie St south, Bligh St and South Dubbo – that will continue to have access south of Tamworth St.
Looking in more depth to explain how traffic flows interact in this Scenario (Net D and Net E).
Without South Bridge 780 vph are using Boundary St to enter South Dubbo and 495 are using Hennessey.
Of these 450 are using Bligh St some from both origins some from South Dubbo itself.
With the addition of South Bridge the volumes on Boundary St hardly change (810 vph from 780 vph) and
do not change in Hennessey Rd hardly (495 vph). The demand on Bligh St increases by 380 to 830 vph.
One additional piece of information, the traffic on the link between South Bridge and Macquarie St south,
715 vph. This comprises traffic accessing South Bridge or Bligh St by residents in South Dubbo, and traffic
from Hennessey Rd and Boundary St.
With a maximum of 495 vph from Hennessey and a change of only 25 vph in Boundary the conclusion is
that 715 – 495 – 25 = 185 trips accessing South Bridge originate in South Dubbo. Some, maybe half, may
originate north of Cobra St and north of Fitzroy St. This is balanced by the outgoing flows indicating some
locals would find Cobra St easier for some destinations not used today.
In summary; currently South Dubbo accommodates (Net A) some 800 though trips per hour; with the
development of the SE this will increase to 1300 vph without the construction of South Bridge and increase
by as little as a further 100 with South Bridge built and connected as proposed.
Conclusion – South Dubbo will gain more convenient access via South Bridge than it will experience from
additional through traffic.
6.5.3. West End
The West End group in Table 6.5 indicates how the roads in West Dubbo will perform.
The intent of the Strategy was to draw traffic generated in the three western sectors away from this area
thereby allow commercial development to occur. There are two elements to this area, the Mitchell Hwy
and south along the Newell Hwy.
The manner in which traffic has been drawn away from key congestion is demonstrably noted on the
Mitchell Hwy where the increase at West Dubbo is consistently less than the increase in total demand.

2020 DUBBO TRANSPORTATION STRATEGY
STAPLETON TRANSPORTATION & PLANNING Pty Ltd 61
This dispersal of traffic is also achieved on the Mitchell Hwy at Thompson St where the need to widened
the section from Thompson St to Westview St is averted until 2040. This is in spite of a spike in growth West
of Westview St (31% by 2030 and a further 18% by 2040) due to the development of the Airport Enterprise
Zone. Traffic is dispersed to River St and North Bridge.
Demand for the Riverside Boulevard north of Thompson St starts at some 4,700 VpD in 2025, mostly
generated by development in the NW and grows in proportion to this Sector, 16% in the decade 2030 to
2040 and 30% following, still well within the capacity of this road.
Conclusion - If it were not for its use by Highway traffic the design of the Riverside Boulevard could be
moderated to one more suited to the riverside.
Predictions of traffic on the Newell Hwy will vary greatly depending on the construction of Strategic
Infrastructure. Without South Bridge demand south Victoria Rd will increase 28% in the next few years,
responding to development in the SW. With the addition of South Bridge demand in 2030 will drop by 16%
from 14,800 VpD to 12,400 VpD, without South Bridge 19,000 VpD. This will grow back in 2040 to 15,400
and possibly 17,200 in 2055 all very doable for 4 lanes albeit possibly carrying highway traffic through an
Active Commercial area.
Further south beyond Minore Rd the Newell Hwy is the only route serving development from the southern
parts of the SW to access South Bridge or any other parts of Dubbo hence demand will grow in line with
development.
The key contributor in accommodating the growth of the SW is Minore Rd. This is the only access suitable
for east west movement south of Victoria Road and the rail line. Traffic is expected to increase by 55% in
the next 12 years (2030).
The 2030 demand of 9,100 VpD can hardly be handled by two lanes.
Minore Rd will provide direct access to South Bridge and hence will experience an increase of 71% in the
decade 2030 to 2040 the highest increase on any road and a further 23% before 2055. By this time the
demand is expected to be 19,100 VpD (Currently 5,900 VpD) a similar demand currently in Cobbora St.
It can carry this demand in 4 lanes but amenity will be seriously affected.
Conclusion – Minore Rd is the only route to serve the expansion and the increase in demand requires it to
be 4 lanes. This move has been avoided for all other existing streets in Dubbo.
Conclusion – The design of the upgrade must address pedestrian movement particularly to school.
Minore Rd will also serve development west of Chapmans Rd and this can be handled with a lower key
Residential Grid Road, with other links taking the bulk of the load.

2020 DUBBO TRANSPORTATION STRATEGY
STAPLETON TRANSPORTATION & PLANNING Pty Ltd 62
6.5.4. North End
There is less certainty and more opportunity in the North End where the Heath and Education Precinct will
provide a focus for additional employment attracting trips from all directions.
The impact of North Bridge and extension of River St is indicated by the 60% increase in 2025 (Net D) and
also reflected by the decreases in Cobbora Rd, Bourke St and Fitzroy St north of Erskine; a transfer of 2700
VpD. Bourke St and Fitzroy St are two streets that are predicted to carry less traffic in 2055 than in 2018.
At the same time demand on River St continues to increase until the Link to Cobbora Rd (Caroline St)
exceeds capacity in 2055 (not shown in Table 6.5) and River St is also stressed (9,800 VpD 2055). (Triggers
for capacity vary with the style of street; 9,000 VpD is on the edge for an active retail street.)
This also explains why the intersection of Fitzroy St and Erskine St does not have as ongoing issue, and why
the volume in Fitzroy St south of Erskine St can increase slightly without further issues.
Conclusion - Further management options should be available in and around North End and will become
essential in the long term. Perhaps a short-term solution could solve long term issues.
6.5.5. East End
Finally East End describes how the existing grid changes.
Wingewarra St is a “second level” Residential Grid carrying a respectable 10,000 VpD that parallels and
is complementary to Cobra St offering a direct line into the City Centre for its local residents. Increases
are gradual and below average indicating a balanced existing network, (and no growth in the locality).
Cobra St has similar growth which; given that it is the most direct path serving the expansion of the SE ;
indicates that newly generated traffic is successfully dispersed (Hennessey in South End). Nevertheless
Cobra St will experience a slower speed than most other streets in Dubbo, (Table 6.3). The actual increase
in the peak hour volume is small currently 1852 (two – way) to 2027 in 2025 an additional 180 vehicles per
hour does not trigger an increase in Stress. A further increase of 100 vehicles per hour between 2030 and
2040 also has no impact. You might think the model is assuming driving will become more tolerant or
skilled or autonomous but the same measure of stress has been applied for the future. The peak hour flow
for 2055 is predicted as 2219 vph, 20% greater than today. The reason there is no change is that the time
(Table 6.3) is only 3% greater than today, or an increase of 12 seconds. This does not register as a failure
but is a reminder that travel conditions do not change in direct proportion to demand.
The same small changes are predicted in Fitzroy St south of Erskine St that also reports a los level of Stress
through to 2055. The demand changes between 2025 and 2030 (1698 to1834 vph) but is stable thereafter.

2020 DUBBO TRANSPORTATION STRATEGY
STAPLETON TRANSPORTATION & PLANNING Pty Ltd 63
A lesson that leaving something alone that just works is often the answer. This rule has been the approach
for the Dubbo Transport Strategy; optimise the network, don’t over spend and don’t concentrate only on
traffic flow but also amenity.
Conclusion – Assuming travel modes are similar to today residents moving around in 35 years time will be
experiencing similar conditions to today’s easy ways. A fine legacy for Transport Planning.
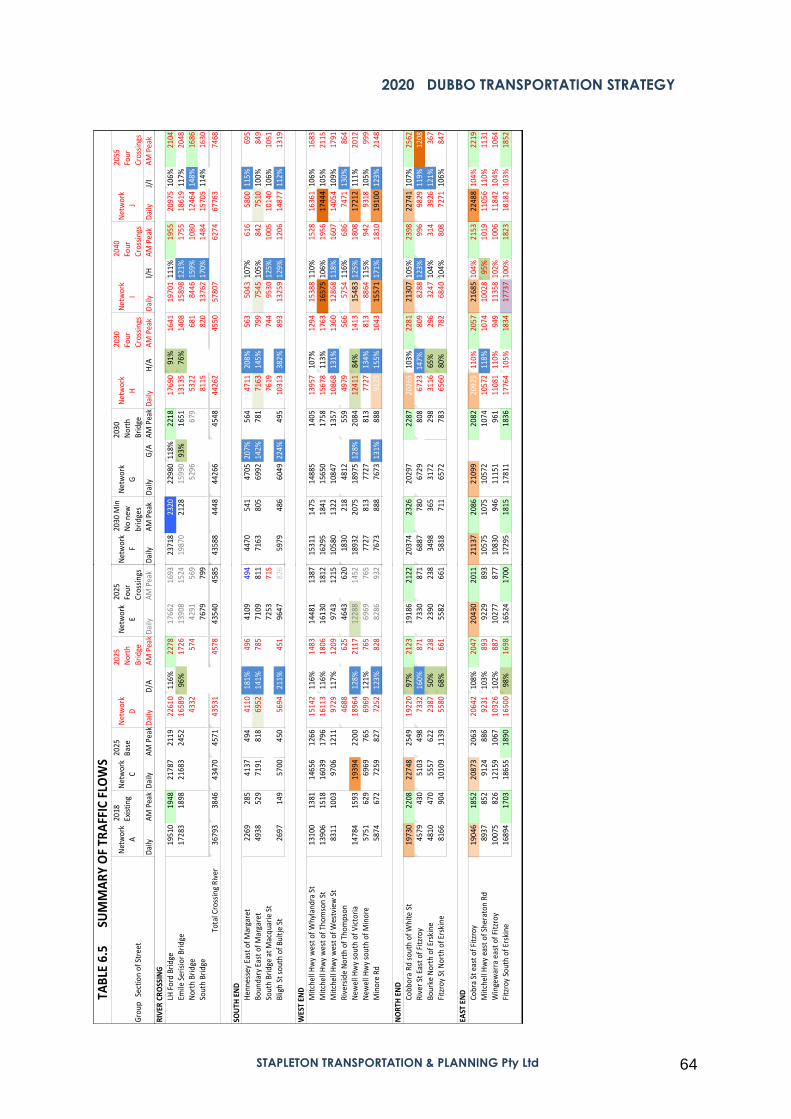
2020 DUBBO TRANSPORTATION STRATEGY
STAPLETON TRANSPORTATION & PLANNING Pty Ltd 64
TAB
LE6.
5SU
MM
AR
YO
FTR
AFF
ICFL
OW
S
Gro
up
Sect
ion
ofSt
reet
Net
wor
kA
2018
Exis
ting
Net
wor
kC
2025
Bas
eN
etw
ork
D
2025
Nor
th
Bri
dge
Net
wor
kE
2025
Four
Cro
ssin
gsD
aily
AM
Peak
Dai
lyA
MPe
akD
aily
D/A
AM
Peak
Dai
lyA
MPe
ak
Net
wor
kF
2030
Min
No
new
brid
ges
Net
wor
kG
2030
Nor
th
Brid
ge
Net
wor
kH
2030
Four
Cros
sing
s
Net
wor
kI
2040
Four
Cros
sing
s
Net
wor
kJ
2055
Four
Cros
sing
sD
aily
AM
Peak
Dai
lyG
/AA
MPe
akD
aily
H/A
AM
Peak
Dai
lyI/
HA
MPe
akD
aily
J/I
AM
Peak
RIV
ERCR
OSS
ING
LHFo
rdB
ridg
e19
510
1948
2178
721
1922
610
116%
2278
1766
216
93Em
ileSe
risi
orB
ridg
e17
283
1898
2168
324
5216
589
96%
1726
1390
815
24
Nor
thB
rid
ge43
3257
442
9156
9So
uth
Bri
dge
7679
799
Tota
lCro
ssin
gR
iver
3679
338
4643
470
4571
4353
145
7843
540
4585
SOU
THEN
DH
enne
ssey
East
ofM
arga
ret
2269
285
4137
494
4110
181%
496
4109
494
Bou
nda
ryEa
stof
Mar
gare
t49
3852
971
9181
869
5214
1%78
571
0981
1So
uth
Bri
dge
atM
acq
uari
eSt
7253
715
Blig
hSt
sout
hof
Bult
jeSt
2697
149
5700
450
5694
211%
451
9647
826
WES
TEN
DM
itch
ellH
wy
wes
tof
Why
land
raSt
1310
013
8114
656
1266
1514
211
6%14
8314
481
1387
Mit
chel
lHw
yw
est
ofTh
omso
nSt
1390
615
1816
039
1796
1611
311
6%18
0616
130
1812
Mit
chel
lHw
yw
est
ofW
estv
iew
St83
1110
0397
0612
1197
2911
7%12
0997
4312
15
Riv
ersi
deN
ort
hof
Thom
pson
4688
625
4643
620
New
ellH
wy
sout
hof
Vic
tori
a14
784
1593
1939
422
0018
964
128%
2117
1228
814
52
New
ellH
wy
sout
hof
Min
ore
5751
629
6969
765
6969
121%
765
6969
765
Min
ore
Rd58
7467
272
5982
772
5212
3%82
882
8693
2
NO
RTH
END
Cobb
ora
Rdso
uth
ofW
hite
St19
730
2208
2274
825
4919
220
97%
2123
1918
621
22R
iver
StEa
stof
Fitz
roy
4579
430
5103
498
7332
160%
871
7330
871
Bou
rke
Nor
thof
Ersk
ine
4810
470
5557
622
2387
50%
238
2390
238
Fitz
roy
StN
orth
ofE
rski
ne
8166
904
1010
911
3955
8068
%66
155
8266
1
EAST
END
Cobr
aSt
east
ofF
itzr
oy19
046
1852
2087
320
6320
642
108%
2047
2043
020
11M
itch
ellH
wy
east
ofS
hera
ton
Rd
8937
852
9124
886
9231
103%
893
9229
893
Win
gew
arra
east
ofFi
tzro
y10
075
826
1215
910
6710
326
102%
887
1027
787
7Fi
tzro
ySo
uth
ofEr
skin
e16
894
1703
1865
518
9016
500
98%
1698
1652
417
00
2371
823
2022
980
118%
2218
1769
091
%16
4119
701
111%
1955
2097
510
6%21
0419
870
2128
1599
093
%16
5113
135
76%
1408
1589
812
1%17
5518
619
117%
2048
5296
679
5322
681
8446
159%
1080
1246
414
8%16
8681
1582
013
762
170%
1484
1570
511
4%16
30
4358
844
4844
266
4548
4426
245
5057
807
6274
6776
374
68
4470
541
4705
207%
564
4711
208%
563
5043
107%
616
5800
115%
695
7163
805
6992
142%
781
7163
145%
799
7545
105%
842
7510
100%
849
7619
744
9530
125%
1005
1014
010
6%10
51
5979
486
6049
224%
495
1031
338
2%89
313
259
129%
1206
1487
711
2%13
19
1531
114
7514
885
1405
1395
710
7%12
9415
388
110%
1528
1636
110
6%16
83
1629
518
4115
650
1758
1567
811
3%17
6316
575
106%
1956
1744
410
5%21
1510
580
1322
1084
713
5710
868
131%
1360
1286
811
8%16
0714
054
109%
1791
1830
218
4812
559
4979
566
5754
116%
686
7471
130%
864
1893
220
7518
975
128%
2084
1241
184
%14
1315
483
125%
1808
1721
211
1%20
12
7727
813
7727
813
7727
134%
813
8864
115%
942
9318
105%
999
7673
888
7673
131%
888
9125
155%
1043
1557
117
1%18
1019
100
123%
2148
2037
423
2620
297
2287
2026
510
3%22
8121
307
105%
2398
2274
110
7%25
6268
8778
067
2980
867
2314
7%80
982
8812
3%99
698
2911
9%12
08
3498
365
3172
298
3116
65%
296
3247
104%
314
3926
121%
367
5818
711
6572
783
6560
80%
782
6840
104%
808
7271
106%
847
2113
720
8621
099
2082
2092
511
0%20
5721
685
104%
2153
2248
810
4%22
1910
575
1075
1057
210
7410
572
118%
1074
1002
895
%10
1911
056
110%
1131
1083
094
611
151
961
1108
111
0%94
911
358
102%
1006
1184
210
4%10
6417
295
1815
1781
118
3617
764
105%
1834
1773
710
0%18
2318
182
103%
1852

2020 DUBBO TRANSPORTATION STRATEGY
STAPLETON TRANSPORTATION & PLANNING Pty Ltd 65
6.6. Surveys
The study commenced with a large survey of existing traffic required to estimate external traffic and to
calibrate the model of internal traffic. The proportion of through traffic was surveys using Number Plate
recognition at entry/exit points to the Study Area.
The survey separated traffic into Heavy Vehicles, multiple axles, and Light Vehicles.
Full results of this survey have been lodged with Council.
Table 6.6 summarises the results of the Number Plate Recognition Survey for through traffic. The Newell
Hwy south has the highest proportion of through traffic, 23%. This was matched with 13% of through traffic
at the northern entry of the Newell Hwy (13%) The difference in through traffic reflects the proportion of
regional residents living north and south of Dubbo. The proportion of through traffic on other Highways
also reflect the importance of regional access, only 4% of traffic on the Golden Hwy is through traffic, 5%
on the Mitchell Hwy to the west and 7% on the Mitchell Hwy to the east. These figures are consistent with
regional population.
TABLE 6.6 EXTERNAL TRAFFIC - FROM SURVEYEXTERNAL ROAD TOTAL TRAFFIC THROUGH TRAFFIC (1) Heavy Vehicles (2) Light Vehicles (3) TOTAL
Total Heavy % Thru Heavy Light Small % Thru Light Total %Daily Peak Vehicles Daily Night daily Vehicles Trucks Daily Daily Daily Daily
Traffic AM PM Survey Total % Night Through Survey Through Though Total
1 Mitchell Hwy 2881 384 219 172 10% 19 11% 34 2424 285 4% 100 134 5%Bumblegumbie W
2 Newell Hwy 3201 183 307 455 33% 117 26% 227 2505 241 7% 195 422 13%
Troy Crossing3 Golden Highway 1427 91 147 93 17% 18 19% 31 1205 129 2% 25 55 4%
Mayfield Rd4 Mitchell Hwy 3818 525 270 4pm 195 11% 60 31% 75 3366 257 5% 183 257 7%
Eulomoga5 Newell Hwy 1578 111 83 3pm 359 49% 100 28% 227 1087 132 11% 135 361 23%
Camp St
1294 1026 1274 314 593 10587 1044 637 123012905 10% 8% 10% 2% 5% 82% 8% 10%
681 To from Dubbo % 48% 10994 To from Dubbo 52%53% % Non Through Total Thru Trips 95% % Non Through Total Thru Trips

2020 DUBBO TRANSPORTATION STRATEGY
STAPLETON TRANSPORTATION & PLANNING Pty Ltd 66
INDEX
10 minute City, ............................................................................................................................................... 21, 47 2007 Transport Strategy, .........................................................................................................................17, 30, 36 ageing population, .............................................................................................................................................. 8 Airport, ............................................................................................................................................ 8, 14, 22, 52, 63 Arterial Roads, .................................................................................................................................................... 28
Commercial Integrator, ............................................................................................................... 30, 33, 35, 52 Residential Grid, ........................................................................................ 26, 28, 33, 36, 41, 43, 46, 49, 59, 64 Segregated Arterial, ...................................................................................................................................... 29 Service road, .................................................................................................................................................. 30 Urban Edge, ........................................................................................................................................28, 29, 35
Autonomous Vehicles, ....................................................................................................................................... 18 Baird Dr, ............................................................................................................................................................... 35 Base Hospital, .............................................................................................................................................8, 12, 43 Blueridge, ............................................................................................................................................................ 35 Boundary St, .............................................................................................................................................28, 61, 62 Bypass, ................................................................................................................................ 7, 19, 20, 24, 35, 46, 49 Chapmans Rd, ...................................................................................................................... 10, 24, 25, 35, 42, 64 Current Transport Issues, ...................................................................................................................................... 2 Daily and Peak Hour Trips, ................................................................................................................................. 55 Delroy, ........................................................................................................................................................... 36, 43 Development Trends, ........................................................................................................................................... 8
Changes in Employment, ............................................................................................................................. 11 Future Residential Development, ................................................................................................................... 8
Electric Vehicles, ................................................................................................................................................ 19 Erskine St, ...................................................................................................................................... 2, 6, 7, 39, 64, 65 External Traffic, .................................................................................................................................................... 26 Figure
Demand from NW Sector, ............................................................................................................................ 24 Existing and Future Footprint, ......................................................................................................................... 4 North Bridge and Highway works, .................................................................................................................. 5 Prime Development, ....................................................................................................................................... 7 Residential Staging, ......................................................................................................................................... 9
Flood Management, .......................................................................................................................................... 38 Green Ring, ..............................................................................................................................................17, 36, 43 Greenways, ................................................................................................................................................... 36, 37 Heavy Vehicles, ............................................................................................................................................ 26, 67 Hennessey Rd, ................................................................................................................................... 26, 29, 61, 62 Hubs, ............................................................................................................................................. 12, 13, 14, 22, 23 Jiora Rd, ............................................................................................................................................................... 10 Level of Service, ........................................................................................................................................... 20, 21 Long Term, ....................................................................................................................................................... 8, 50 Macquarie St, ........................................................................................................ 3, 15, 19, 21, 24, 35, 57, 61, 62 Minore Rd, ................................................................................................................................ 9, 35, 36, 48, 63, 64 North Bridge, ...................................... 3, 5, 6, 7, 8, 9, 14, 24, 25, 26, 33, 35, 38, 39, 41, 45, 52, 59, 60, 61, 63, 64
Flood Free Route, ............................................................................................................................................ 6 Integration with Prime Development, ........................................................................................................... 6 Long Term Resolution, ..................................................................................................................................... 8
Optimising Investment, ........................................................................................................................................ 3 Performance Indicators, .................................................................................................................................... 56
Average Operating Speed, ......................................................................................................................... 58 Return on Investment, ................................................................................................................................... 59 Time on Cobra St, .......................................................................................................................................... 57 Time Spent, ..................................................................................................................................................... 56
Public Transport, ................................................................................................................................................. 19 Quality of Life, ....................................................................................................................................................... 3 River St, ....................................................................... 5, 6, 7, 14, 23, 30, 35, 36, 38, 39, 42, 44, 49, 52, 61, 63, 64 Riverside Boulevard, .......................................................................................................... 7, 14, 15, 33, 35, 52, 63 Section 94 Contribution Plan, .............................................................................................................................. 9
2020 DUBBO TRANSPORTATION STRATEGY
STAPLETON TRANSPORTATION & PLANNING Pty Ltd 67
Sectors, ........................................................................................................................................... 4, 10, 44, 47, 49 Sheraton Rd, ....................................................................................................................................................... 35 The Enterprise Axis, ............................................................................................................................................. 14 through traffic, .........................................................................................................................................28, 62, 67 Time Costs, .......................................................................................................................................................... 59 Traffic Crossing Macquarie River, ..................................................................................................................... 60 Unit-Cost Prices, .................................................................................................................................................. 28 Vehicle Costs, ..................................................................................................................................................... 59 Wheelers Ln, .................................................................................................................................................. 21, 57