
DUAL THERMOGRAPHIC MONITORING OF Ti-6AL-4V · PDF fileDUAL THERMOGRAPHIC MONITORING OF...
14
DUAL THERMOGRAPHIC MONITORING OF Ti-6AL-4V CYLINDERS DURING DIRECT LASER DEPOSITION G. Marshall 1 , W. J. Young II 1 , N. Shamsaei 1,2 , J. Craig 3 , T. Wakeman 3 , S. M. Thompson 1,2,† 1 Department of Mechanical Engineering, Mississippi State University, Mississippi State, MS 39762 USA 2 Center for Advanced Vehicular Systems, Mississippi State University, Starkville, MS 39759 USA 3 Stratonics, Inc., Lake Forest, CA 92630 USA † Corresponding author: Email: [email protected] Phone: (662) 325 1535 Abstract Understanding the thermal phenomena associated with Direct Laser Deposition (DLD) is necessary to begin manipulating fabricated part properties. In this study, a thermally monitored Laser Engineered Net Shaping (LENS) system is used with time-invariant (uncontrolled) build parameters to construct Ti-6Al-4V cylinders with two different build paths. Both paths utilize a circular contour with serpentine hatch fill; however, successive layer patterns are varied and the effects compared between 90° and 120° angular pattern shifts. During fabrication, the part’s thermal history and melt pool temperature are recorded via an in-chamber infrared (IR) camera and a dual-wavelength (DW) pyrometer, respectively. These tools are used for non-destructive thermographic inspection (NTI) of the part to ensure target quality and/or microstructure. A unique calibration method for the IR camera utilizing the DW pyrometer data is presented and a calibration correction factor was utilized for high temperature ranges. The melt pool was found to be 40-50% superheated reaching temperatures up to 2500 ºC at times. Temperature characteristics of two different layers were compared for different hatching patters, and the results show that for a given point in time, maximum temperatures can vary based on laser raster. Temperature gradients varied and peaked at about 1000 ºC/mm along the diameter of the small rods. This can lead to anisotropy in microstructural and mechanical properties allowing for unique property growth per build path. Cooling rates within the melt pool appear to increase as maximum melt pool temperature increases, for instance, from 16,000 ºC/s – 41,000 ºC/s. Introduction Laser Engineered Net Shaping (LENS TM ) is a Direct Laser Deposition (DLD) process first developed by Sandia National Laboratories [1]–[4]. This laser-based additive manufacturing (LBAM) technology has the potential to reduce production costs by lowering the amount of time and material required for fabrication. Direct Laser Deposition utilizes a slice file created from a 3-D Computer Aided Design (CAD) solid model to deposit a geometry one layer at a time. Each layer is deposited in tracks by feeding metal powder into a laser-formed melt pool onto a substrate. Before the benefits of DLD can be fully realized, a firm knowledge base must be developed to characterize the effects of DLD process parameters - such as laser power, travel speed, and powder feed rate - on a part’s thermal history, which in turn determines its final microstructure and mechanical properties. 259
Transcript of DUAL THERMOGRAPHIC MONITORING OF Ti-6AL-4V · PDF fileDUAL THERMOGRAPHIC MONITORING OF...
DUAL THERMOGRAPHIC MONITORING OF Ti-6AL-4V CYLINDERS DURING
DIRECT LASER DEPOSITION
G. Marshall1, W. J. Young II
1, N. Shamsaei
1,2, J. Craig
3, T. Wakeman
3, S. M. Thompson
1,2,†
1 Department of Mechanical Engineering, Mississippi State University, Mississippi State, MS 39762 USA
2 Center for Advanced Vehicular Systems, Mississippi State University, Starkville, MS 39759 USA
3 Stratonics, Inc., Lake Forest, CA 92630 USA
† Corresponding author:
Email: [email protected]
Phone: (662) 325 1535
Abstract
Understanding the thermal phenomena associated with Direct Laser Deposition (DLD) is
necessary to begin manipulating fabricated part properties. In this study, a thermally monitored
Laser Engineered Net Shaping (LENS) system is used with time-invariant (uncontrolled) build
parameters to construct Ti-6Al-4V cylinders with two different build paths. Both paths utilize a
circular contour with serpentine hatch fill; however, successive layer patterns are varied and the
effects compared between 90° and 120° angular pattern shifts. During fabrication, the part’s
thermal history and melt pool temperature are recorded via an in-chamber infrared (IR) camera
and a dual-wavelength (DW) pyrometer, respectively. These tools are used for non-destructive
thermographic inspection (NTI) of the part to ensure target quality and/or microstructure. A
unique calibration method for the IR camera utilizing the DW pyrometer data is presented and a
calibration correction factor was utilized for high temperature ranges. The melt pool was found
to be 40-50% superheated reaching temperatures up to 2500 ºC at times. Temperature
characteristics of two different layers were compared for different hatching patters, and the
results show that for a given point in time, maximum temperatures can vary based on laser raster.
Temperature gradients varied and peaked at about 1000 ºC/mm along the diameter of the small
rods. This can lead to anisotropy in microstructural and mechanical properties allowing for
unique property growth per build path. Cooling rates within the melt pool appear to increase as
maximum melt pool temperature increases, for instance, from 16,000 ºC/s – 41,000 ºC/s.
Introduction
Laser Engineered Net Shaping (LENSTM
) is a Direct Laser Deposition (DLD) process
first developed by Sandia National Laboratories [1]–[4]. This laser-based additive manufacturing
(LBAM) technology has the potential to reduce production costs by lowering the amount of time
and material required for fabrication. Direct Laser Deposition utilizes a slice file created from a
3-D Computer Aided Design (CAD) solid model to deposit a geometry one layer at a time. Each
layer is deposited in tracks by feeding metal powder into a laser-formed melt pool onto a
substrate. Before the benefits of DLD can be fully realized, a firm knowledge base must be
developed to characterize the effects of DLD process parameters - such as laser power, travel
speed, and powder feed rate - on a part’s thermal history, which in turn determines its final
microstructure and mechanical properties.
259
dlb7274
Text Box
REVIEWED
The length and maximum temperature of the melt pool increases with laser power and
slower travel speeds. As the melt pool moves, its tail rapidly solidifies and experiences the
highest cooling rates [5] and these rates increase with travel velocity [6]. During DLD, delivered
laser energy is transferred by conduction away from the melt pool through previous layers and
the substrate while the remainder contributes towards melting and vaporization or is transferred
away from the surface by convection and radiation [7]. Maximum DLD Ti-6Al-4V melt pool
temperatures can be up to 40% above their liquid temperature (i.e. superheat). Furthermore, local
melt pool temperature gradients and peak cooling rates for parts undergoing DLD have been
experimentally and numerically assessed at 100 °C/mm – 1000 °C/mm [3], [8]–[11] and 12,000
°C/s – 25,000 °C/s [12], [13] .
For the uncontrolled DLD process, in which time-invariant process parameters are
employed, the final part microstructure is greatly prone to anisotropy. This is due to many
thermal-fluidic phenomena, including: localized heating from the laser, non-uniform thermal
gradients, solidification and time-dependent cooling rates. Better understanding of the
sensitivity of such thermal phenomena to the uncontrolled DLD process parameters can allow for
their easier manipulation for minimizing anisotropy. One way of controlling heat transfer, and
thus final product quality, in both LENS and other DLD or cladding processes, is to use
nondestructive thermographic inspection (NTI) for generating data to be used in feedback control
[4], [14]–[16]. For example, one can relay melt pool temperatures to a laser controller for
microstructural uniformity throughout a part by compensating laser delivery based on local heat
transfer [16]. Common tools used for LBAM monitoring include infrared (IR) cameras and dual-
wavelength (DW) pyrometers [2], [3], [17]–[19].
In order to effectively utilize an IR camera for monitoring absolute temperature of a part
during DLD (or laser cladding), the spectral/directional, temperature-dependent surface
emissivity must be known. Due to radiation noise in a typical DLD chamber, and the transient
nature of surface emission, determining the surface emissivity can be very challenging if not
impossible. Thus, in-lieu of determining the absolute temperature distribution of a part, one can
opt to utilize relative temperature gradients provided by IR images. However, Griffith et al.
suggested that, if a valid expression for effective wavelength (as a function of temperature) is
known, then one can employ Wein’s Law to determine absolute temperature [8].
There has been some recent work focused on calibrating IR cameras for use in LBAM
processes. In 2005, Yang et al. showed that the emissivity of Ti-6Al-4V remained relatively
constant (at ~0.25) between 132 °C to 800 °C after which point it varied up to 0.98 at 1029 °C
due to severe oxidization [20]. Doubenskaia et al. experimentally determined the emissivity of
Ti-6Al-4V during a Nd:YAG laser cladding process purged with argon [21]. By using a
MICRON M390 to find brightness temperature with the IR camera, an emissivity of 0.201 was
determined in the phase transition temperature of the metal. Actual temperature was then found
by using the brightness temperature at liquid-solid transition, the determined emissivity, and the
grey body assumption [21]. Rodriquez et al. determined the emissivity of Ti-6Al-4V during a
Selective Laser Melting (SLM) process to be 0.26 between 650 °C and 750 °C (similar to [20]
and [21]) and 0.5 in powder form [22]. These values along with reflected temperature and optics
transmission were used to calculate actual surface temperature which was validated by using
260
thermocouples during the build. Actual temperatures varied from the recorded IR temperatures
by a near-constant value.
Pyrometers are an attractive means for non-contact temperature measurements in DLD
processes as they are able to measure high temperatures (>1000 °C) [16]–[19], [23], [24]. They
are, therefore, ideal for measuring melt pool temperatures that can exceed the liquidus
temperature of, say, Ti-6Al-4V – at 1636 °C. A DW pyrometer may be selected to reduce the
error caused by sensitivity to emissivity [13]. Utilization of two wavelengths allows for more
accurate surface temperature measurements by using the ratio of the relative radiation intensity at
both wavelengths [12], [13]. Many have used thermal monitoring for characterizing maximum
temperatures and cooling rates of a bulk part and melt pool during DLD, and relating them to the
microstructure and mechanical properties of parts [2]–[4], [8], [15], [17], [19], [25]. For instance,
Kobryn et al. mapped out solidification rates using thermography while experimenting with
various lasers in an additive cladding process. Solidification rates were then used to justify the
microstructure seen in the final parts [25]. Nassar et al. related thermal history to the growth of
microstructure and hardness along the height-wise direction of a build [16].
This current work focuses on utilizing LENS for fabricating Ti-6Al-4V cylindrical
specimens while monitoring their bulk and melt pool temperature responses, via in-chamber IR
camera and DW pyrometer, respectively. A demonstration of dual thermography of cylindrical
specimens during LENS and a unique approach for calibrating the high-end temperature of an IR
camera using online pyrometer data is provided. Thermographic images of the melt pool and
bulk part are provided. The effect of scan strategy (i.e. build pattern) on the temperature and
melt pool response is discussed, in addition to typical heating and cooling rates and temperature
gradients in vicinity of the heat affected zone (HAZ).
Experimental Setup and Procedure
Experiments were conducted to observe build pattern effects on part/pool thermal
signatures at various layers, as well as to determine a correction factor (CF) for the IR camera for
DLD of Ti-6Al-4V. An Optomec LENSTM
750 DLD system (chamber shown in Figure 1) with a
1 kW Nd:YAG laser was used for part fabrication. Titanium alloy (Ti-6Al-4V) powder (Phelly
Materials Inc.), manufactured via a Plasma Rotating Electrode Process (PREP) with -100/+325
mesh size was used. The powder was deposited onto a 152.4 x 152.4 x 3.175 mm3 Ti-6Al-4V
substrate placed atop a 6.4 mm thick copper spacer-plate that was attached to a moving build
stage.
The following parameters were utilized (values approximate): 350 W laser power, 16.9
mm/s scan speed, and 0.13 g/s powder feed rate. The DLD chamber was sealed and purged with
argon during all builds. Cylindrical specimens, Ø = 6.6 mm and 78.2 mm tall, were fabricated
using a 5.08 mm layer thickness and hatch spacing (each specimen was a total of 154 layers).
Two different build strategies, characterized by unique hatching (contour fill) patterns (Pattern A
and B) were examined in this study. For both patterns, the outer circumference of the rod was
deposited first in a counter-clockwise direction, followed by alternating tracks to fill in the circle
as shown in Figure 2. Pattern A designates a 0°, 90°, 180°, and 270° repeating sequence of the
aforementioned track deposits while Pattern B designates a 0°, 120°, and 240° repeating
261
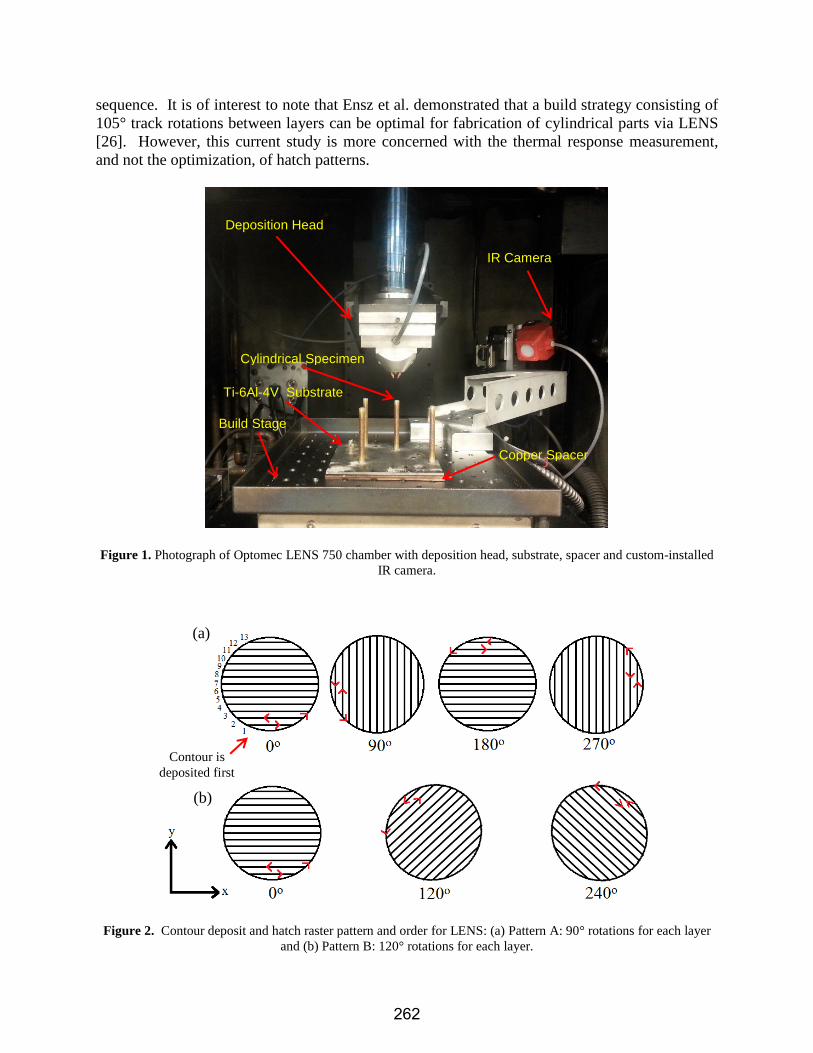
sequence. It is of interest to note that Ensz et al. demonstrated that a build strategy consisting of
105° track rotations between layers can be optimal for fabrication of cylindrical parts via LENS
[26]. However, this current study is more concerned with the thermal response measurement,
and not the optimization, of hatch patterns.
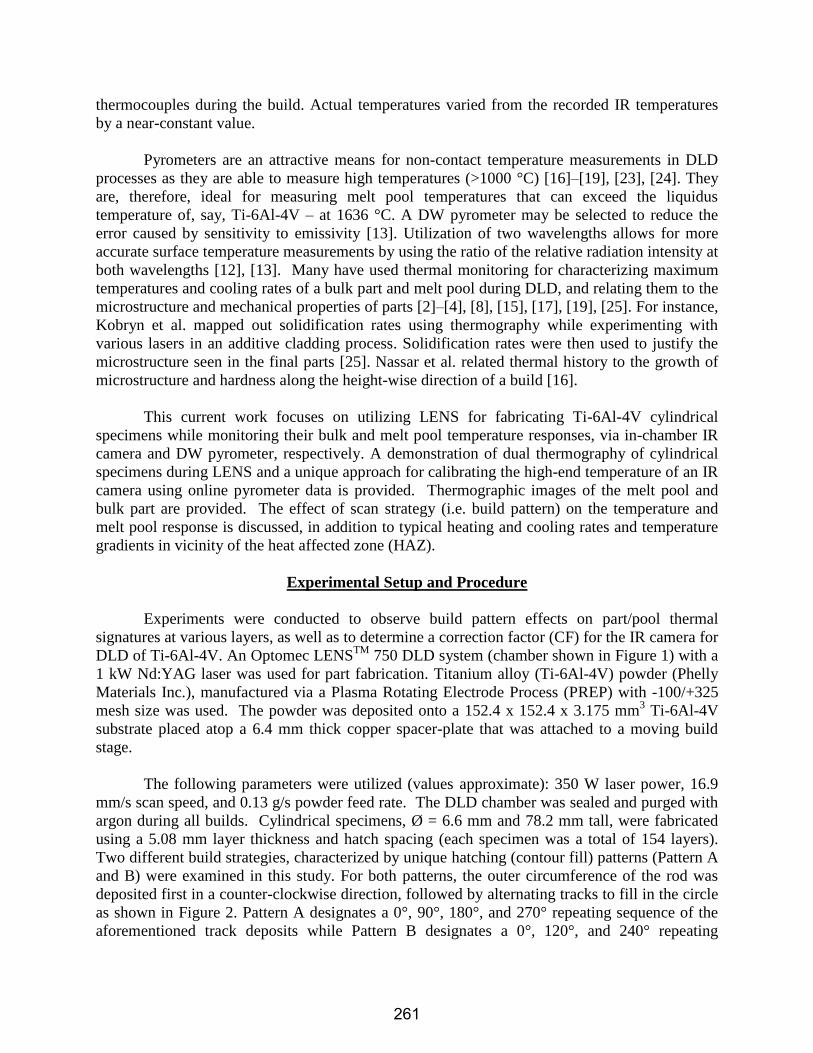
Figure 1. Photograph of Optomec LENS 750 chamber with deposition head, substrate, spacer and custom-installed
IR camera.
Figure 2. Contour deposit and hatch raster pattern and order for LENS: (a) Pattern A: 90° rotations for each layer
and (b) Pattern B: 120° rotations for each layer.
IR Camera
Ti-6Al-4V Substrate
Copper Spacer
Deposition Head
Build Stage
Cylindrical Specimen
(a)
(b)
Contour is
deposited first
262
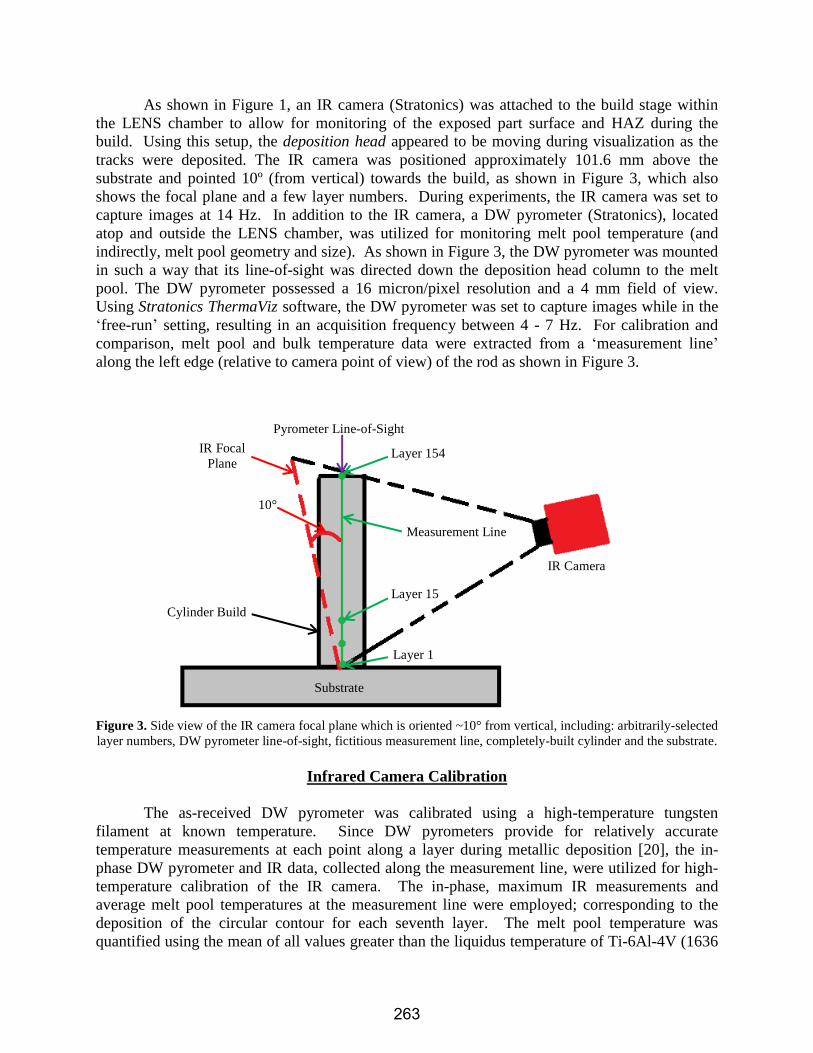
As shown in Figure 1, an IR camera (Stratonics) was attached to the build stage within
the LENS chamber to allow for monitoring of the exposed part surface and HAZ during the
build. Using this setup, the deposition head appeared to be moving during visualization as the
tracks were deposited. The IR camera was positioned approximately 101.6 mm above the
substrate and pointed 10º (from vertical) towards the build, as shown in Figure 3, which also
shows the focal plane and a few layer numbers. During experiments, the IR camera was set to
capture images at 14 Hz. In addition to the IR camera, a DW pyrometer (Stratonics), located
atop and outside the LENS chamber, was utilized for monitoring melt pool temperature (and
indirectly, melt pool geometry and size). As shown in Figure 3, the DW pyrometer was mounted
in such a way that its line-of-sight was directed down the deposition head column to the melt
pool. The DW pyrometer possessed a 16 micron/pixel resolution and a 4 mm field of view.
Using Stratonics ThermaViz software, the DW pyrometer was set to capture images while in the
‘free-run’ setting, resulting in an acquisition frequency between 4 - 7 Hz. For calibration and
comparison, melt pool and bulk temperature data were extracted from a ‘measurement line’
along the left edge (relative to camera point of view) of the rod as shown in Figure 3.
Figure 3. Side view of the IR camera focal plane which is oriented ~10° from vertical, including: arbitrarily-selected
layer numbers, DW pyrometer line-of-sight, fictitious measurement line, completely-built cylinder and the substrate.
Infrared Camera Calibration
The as-received DW pyrometer was calibrated using a high-temperature tungsten
filament at known temperature. Since DW pyrometers provide for relatively accurate
temperature measurements at each point along a layer during metallic deposition [20], the in-
phase DW pyrometer and IR data, collected along the measurement line, were utilized for high-
temperature calibration of the IR camera. The in-phase, maximum IR measurements and
average melt pool temperatures at the measurement line were employed; corresponding to the
deposition of the circular contour for each seventh layer. The melt pool temperature was
quantified using the mean of all values greater than the liquidus temperature of Ti-6Al-4V (1636
IR Camera
IR Focal
Plane
Measurement Line
10°
Pyrometer Line-of-Sight
Substrate
Cylinder Build
Layer 1
Layer 15
Layer 154
263
°C [27]) along fictitious lines parallel and perpendicular to the melt pool’s maximum
temperature zone. Absolute maximum temperature of the melt pool was also recorded. As shown
in Figure 3, the cylindrical rods were placed on the center of the substrate to ensure their relative
position to the IR camera focal plane was known with reasonable accuracy. Note that, for the
current setup, the IR temperature error increases with layer number due to the focal plane
diverging from the measurement line.
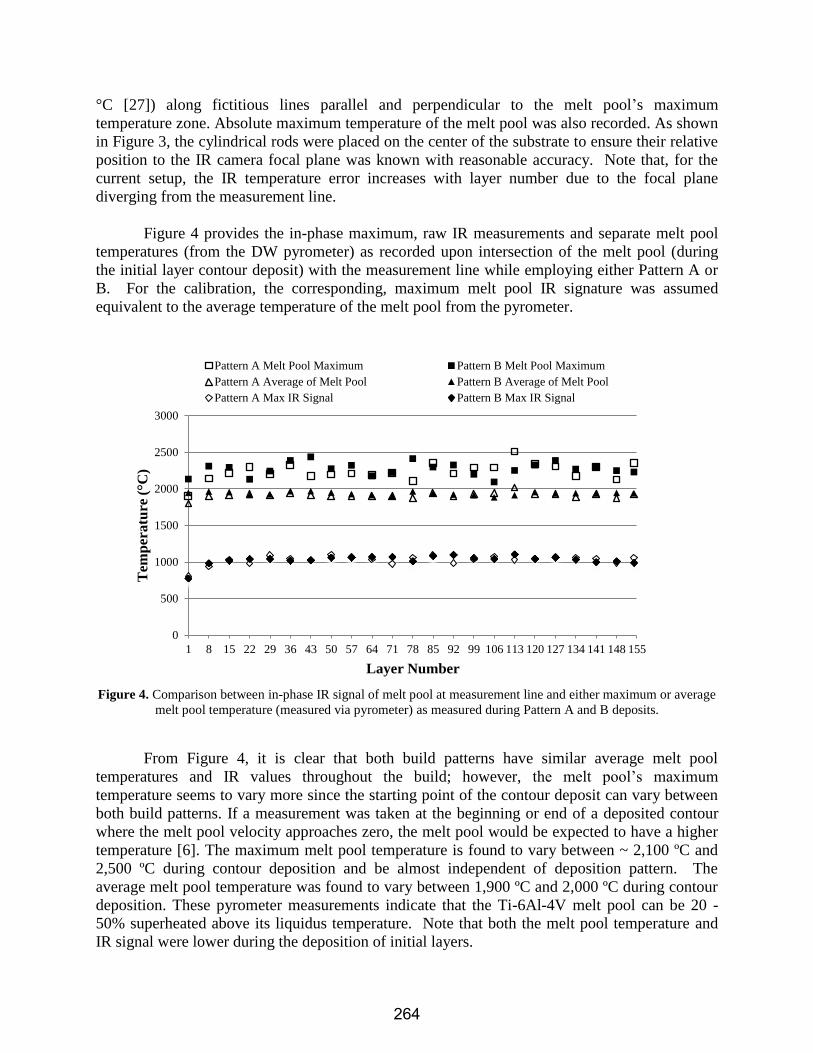
Figure 4 provides the in-phase maximum, raw IR measurements and separate melt pool
temperatures (from the DW pyrometer) as recorded upon intersection of the melt pool (during
the initial layer contour deposit) with the measurement line while employing either Pattern A or
B. For the calibration, the corresponding, maximum melt pool IR signature was assumed
equivalent to the average temperature of the melt pool from the pyrometer.
Figure 4. Comparison between in-phase IR signal of melt pool at measurement line and either maximum or average
melt pool temperature (measured via pyrometer) as measured during Pattern A and B deposits.
From Figure 4, it is clear that both build patterns have similar average melt pool
temperatures and IR values throughout the build; however, the melt pool’s maximum
temperature seems to vary more since the starting point of the contour deposit can vary between
both build patterns. If a measurement was taken at the beginning or end of a deposited contour
where the melt pool velocity approaches zero, the melt pool would be expected to have a higher
temperature [6]. The maximum melt pool temperature is found to vary between ~ 2,100 ºC and
2,500 ºC during contour deposition and be almost independent of deposition pattern. The
average melt pool temperature was found to vary between 1,900 ºC and 2,000 ºC during contour
deposition. These pyrometer measurements indicate that the Ti-6Al-4V melt pool can be 20 -
50% superheated above its liquidus temperature. Note that both the melt pool temperature and
IR signal were lower during the deposition of initial layers.
0
500
1000
1500
2000
2500
3000
1 8 15 22 29 36 43 50 57 64 71 78 85 92 99 106 113 120 127 134 141 148 155
Tem
per
atu
re (°C
)
Layer Number
Pattern A Melt Pool Maximum Pattern B Melt Pool Maximum
Pattern A Average of Melt Pool Pattern B Average of Melt Pool
Pattern A Max IR Signal Pattern B Max IR Signal
264
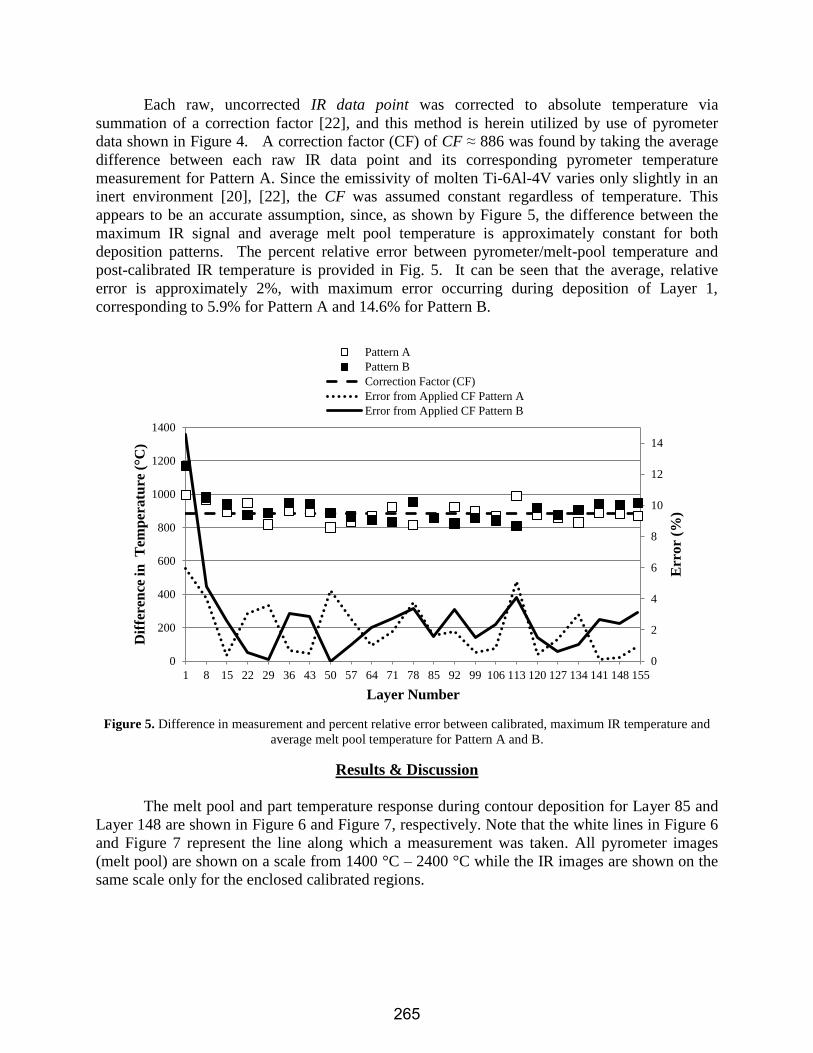
Each raw, uncorrected IR data point was corrected to absolute temperature via
summation of a correction factor [22], and this method is herein utilized by use of pyrometer
data shown in Figure 4. A correction factor (CF) of CF ≈ 886 was found by taking the average
difference between each raw IR data point and its corresponding pyrometer temperature
measurement for Pattern A. Since the emissivity of molten Ti-6Al-4V varies only slightly in an
inert environment [20], [22], the CF was assumed constant regardless of temperature. This
appears to be an accurate assumption, since, as shown by Figure 5, the difference between the
maximum IR signal and average melt pool temperature is approximately constant for both
deposition patterns. The percent relative error between pyrometer/melt-pool temperature and
post-calibrated IR temperature is provided in Fig. 5. It can be seen that the average, relative
error is approximately 2%, with maximum error occurring during deposition of Layer 1,
corresponding to 5.9% for Pattern A and 14.6% for Pattern B.
Figure 5. Difference in measurement and percent relative error between calibrated, maximum IR temperature and
average melt pool temperature for Pattern A and B.
Results & Discussion
The melt pool and part temperature response during contour deposition for Layer 85 and
Layer 148 are shown in Figure 6 and Figure 7, respectively. Note that the white lines in Figure 6
and Figure 7 represent the line along which a measurement was taken. All pyrometer images
(melt pool) are shown on a scale from 1400 °C – 2400 °C while the IR images are shown on the
same scale only for the enclosed calibrated regions.
0
2
4
6
8
10
12
14
0
200
400
600
800
1000
1200
1400
1 8 15 22 29 36 43 50 57 64 71 78 85 92 99 106 113 120 127 134 141 148 155E
rror
(%)
Dif
fere
nce
in
T
emp
eratu
re (°C
)
Layer Number
Pattern A
Pattern B
Correction Factor (CF)
Error from Applied CF Pattern A
Error from Applied CF Pattern B
265
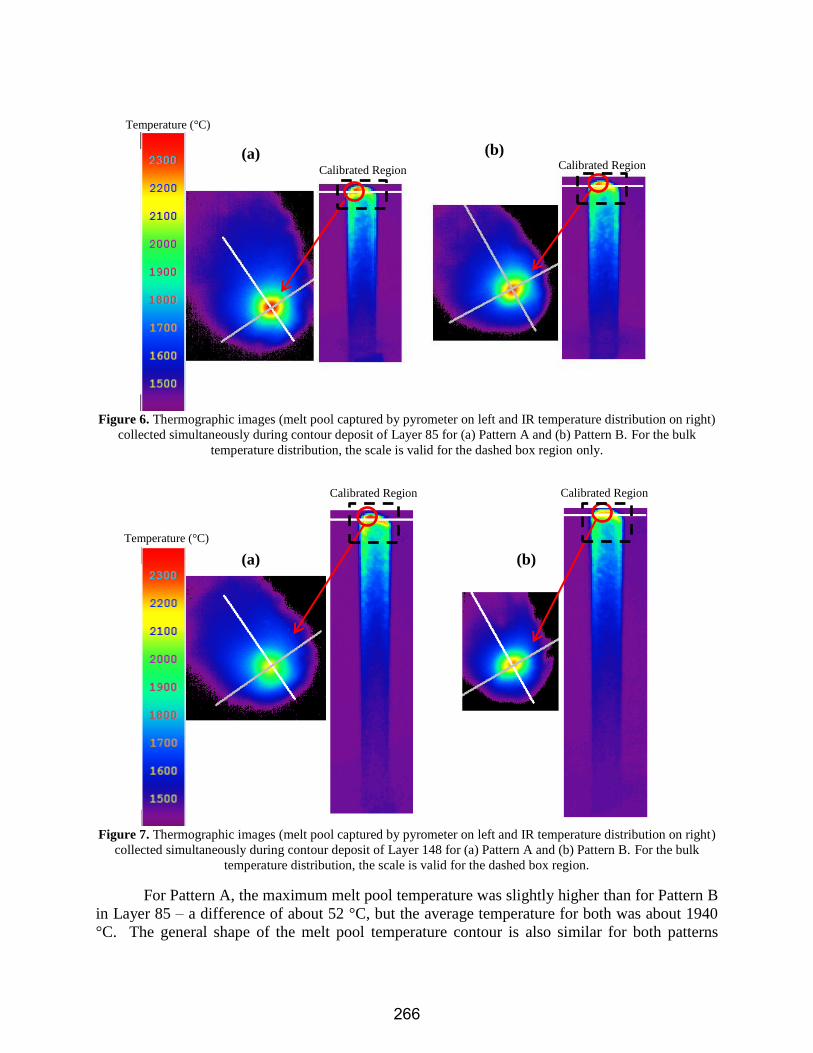
Figure 6. Thermographic images (melt pool captured by pyrometer on left and IR temperature distribution on right)
collected simultaneously during contour deposit of Layer 85 for (a) Pattern A and (b) Pattern B. For the bulk
temperature distribution, the scale is valid for the dashed box region only.
Figure 7. Thermographic images (melt pool captured by pyrometer on left and IR temperature distribution on right)
collected simultaneously during contour deposit of Layer 148 for (a) Pattern A and (b) Pattern B. For the bulk
temperature distribution, the scale is valid for the dashed box region.
For Pattern A, the maximum melt pool temperature was slightly higher than for Pattern B
in Layer 85 – a difference of about 52 °C, but the average temperature for both was about 1940
°C. The general shape of the melt pool temperature contour is also similar for both patterns
Temperature (°C)
(a) (b)
(a) (b)
Temperature (°C)
Calibrated Region Calibrated Region
Calibrated Region Calibrated Region
266
shown in Figure 6. Both build patterns were laying their tracks at 0° rotation and were thus
identical; therefore, one would expect such similar results from the thermal data. A 121 °C and
73 °C temperature difference exists between the maximum melt pool and average melt pool
temperatures respectively at Layer 148 as shown in Figure 7 – with Pattern B being the greater.
The diameter of the melt pool is also smaller here in Pattern B and suggests that the laser has just
begun its contour movement; whereas, Pattern A seems to have been half-way through its
deposit. Since the laser’s velocity at the beginning of the contour is zero, this creates a build-up
of heat and a more concentrated melt pool. The melt pool begins to cool and lengthen as the
velocity is increased as Figure 7 (a) suggests. At this point in time, Pattern B is laying a 0°
rotation track while Pattern A is laying a 270° rotation track; therefore, one could expect a
variation in temperature measurements as evidenced in the data. Though these maximum and
average temperatures are well above any phase transformation range, their difference in
magnitude still agrees that variations in microstructural and mechanical properties can exist
within a part under certain conditions due to temperature.
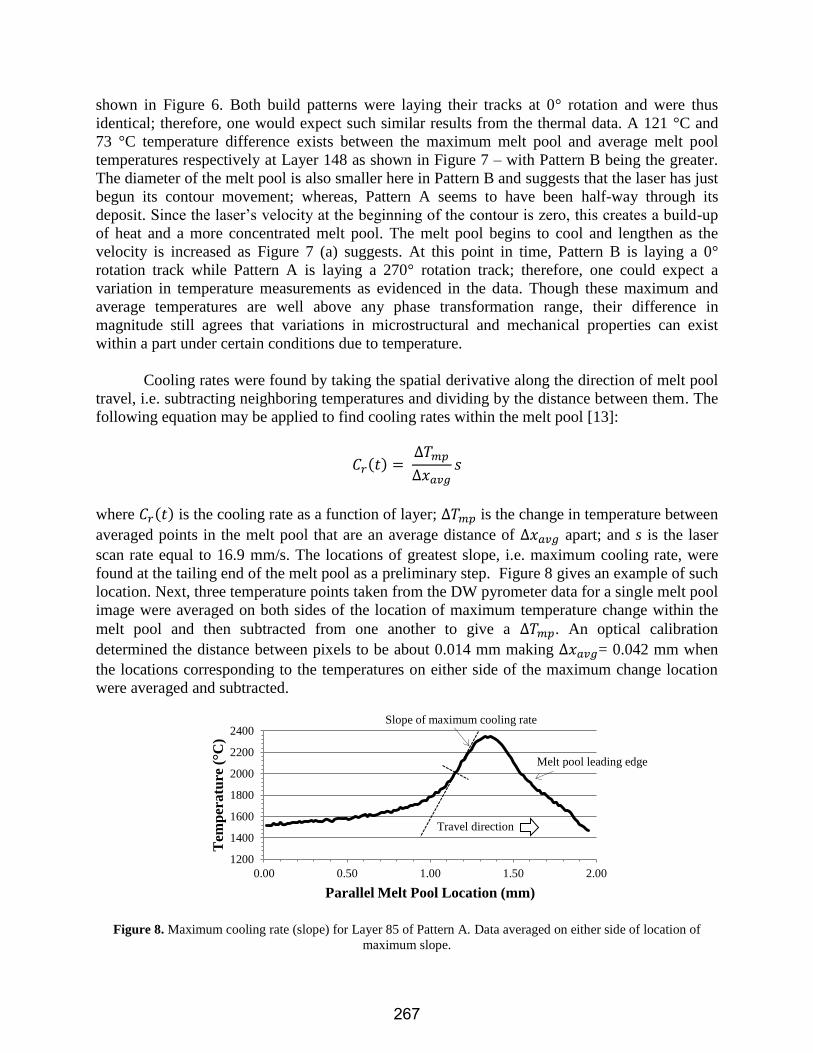
Cooling rates were found by taking the spatial derivative along the direction of melt pool
travel, i.e. subtracting neighboring temperatures and dividing by the distance between them. The
following equation may be applied to find cooling rates within the melt pool [13]:
𝐶𝑟(𝑡) = ∆𝑇𝑚𝑝
∆𝑥𝑎𝑣𝑔𝑠
where 𝐶𝑟(𝑡) is the cooling rate as a function of layer; ∆𝑇𝑚𝑝 is the change in temperature between
averaged points in the melt pool that are an average distance of ∆𝑥𝑎𝑣𝑔 apart; and s is the laser
scan rate equal to 16.9 mm/s. The locations of greatest slope, i.e. maximum cooling rate, were
found at the tailing end of the melt pool as a preliminary step. Figure 8 gives an example of such
location. Next, three temperature points taken from the DW pyrometer data for a single melt pool
image were averaged on both sides of the location of maximum temperature change within the
melt pool and then subtracted from one another to give a ∆𝑇𝑚𝑝. An optical calibration
determined the distance between pixels to be about 0.014 mm making ∆𝑥𝑎𝑣𝑔= 0.042 mm when
the locations corresponding to the temperatures on either side of the maximum change location
were averaged and subtracted.
Figure 8. Maximum cooling rate (slope) for Layer 85 of Pattern A. Data averaged on either side of location of
maximum slope.
1200
1400
1600
1800
2000
2200
2400
0.00 0.50 1.00 1.50 2.00
Tem
per
atu
re (°C
)
Parallel Melt Pool Location (mm)
Slope of maximum cooling rate
Melt pool leading edge
Travel direction
267
Values for the cooling rates are shown in Table 1 as well as the pattern rotation deposited
at the current layer number. The data shows that the first layer has the lowest cooling rate.
Profiles of the melt pool at this first stage are still developing; therefore, the calculated slopes
were less in this layer than the other observed layers. Both patterns experience an increase in
cooling rate in the middle layers. At these points, the melt pool has had time to develop –
creating larger cooling rates within the melt pool temperature profile. Pattern B’s cooling rate is
still greater in Layer 148 compared to Layer 85 – its maximum temperature is increasing (see
Figure 4), and the temperature slopes become steeper. However, a comparison between Pattern
A’s Layer 148 and Layer 85 shows a decrease in maximum temperature. Along with the
temperature decrease, the pattern is also different. As previously mentioned, the data suggested
that Pattern B was near the beginning of its contour deposition which created elevated
temperature over Pattern A. With similar average melt pool temperatures, an increase in
maximum melt pool temperatures corresponds with an increase in cooling rate. Others have seen
cooling rates of 25,000 °C/s [13] and 12,000 °C/s [12]. These cooling rates are comparable to
tabulated in Table 1; however, the increased scan speed as compared to [13] has caused these
results to exceed 25,000 °C/s.
These melt pool cooling rates should not be confused with bulk cooling or solidification
rates that will exist in a fabricated part. For instance, bulk cooling could be expected to be
greater in the first few layers as the substrate acts as a heat sink.
Table 1. Estimated cooling rates associated with three different layers for each pattern.
Pattern A Pattern B
Layer Number Cooling Rate
(°C/s)
Pattern
Rotation (°)
Cooling Rate
(°C/s)
Pattern
Rotation (°)
1 15,661 0 16,060 0
85 41,675 0 33,844 0
148 24,156 270 41,144 0
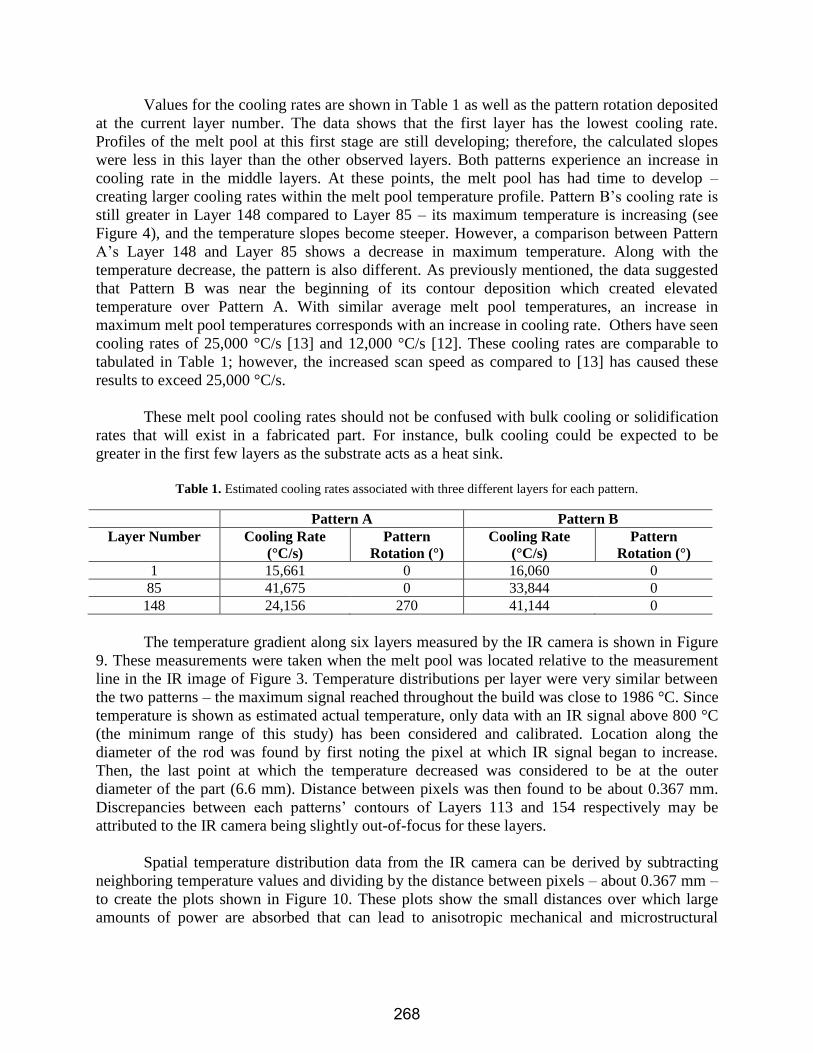
The temperature gradient along six layers measured by the IR camera is shown in Figure
9. These measurements were taken when the melt pool was located relative to the measurement
line in the IR image of Figure 3. Temperature distributions per layer were very similar between
the two patterns – the maximum signal reached throughout the build was close to 1986 °C. Since
temperature is shown as estimated actual temperature, only data with an IR signal above 800 °C
(the minimum range of this study) has been considered and calibrated. Location along the
diameter of the rod was found by first noting the pixel at which IR signal began to increase.
Then, the last point at which the temperature decreased was considered to be at the outer
diameter of the part (6.6 mm). Distance between pixels was then found to be about 0.367 mm.
Discrepancies between each patterns’ contours of Layers 113 and 154 respectively may be
attributed to the IR camera being slightly out-of-focus for these layers.
Spatial temperature distribution data from the IR camera can be derived by subtracting
neighboring temperature values and dividing by the distance between pixels – about 0.367 mm –
to create the plots shown in Figure 10. These plots show the small distances over which large
amounts of power are absorbed that can lead to anisotropic mechanical and microstructural
268
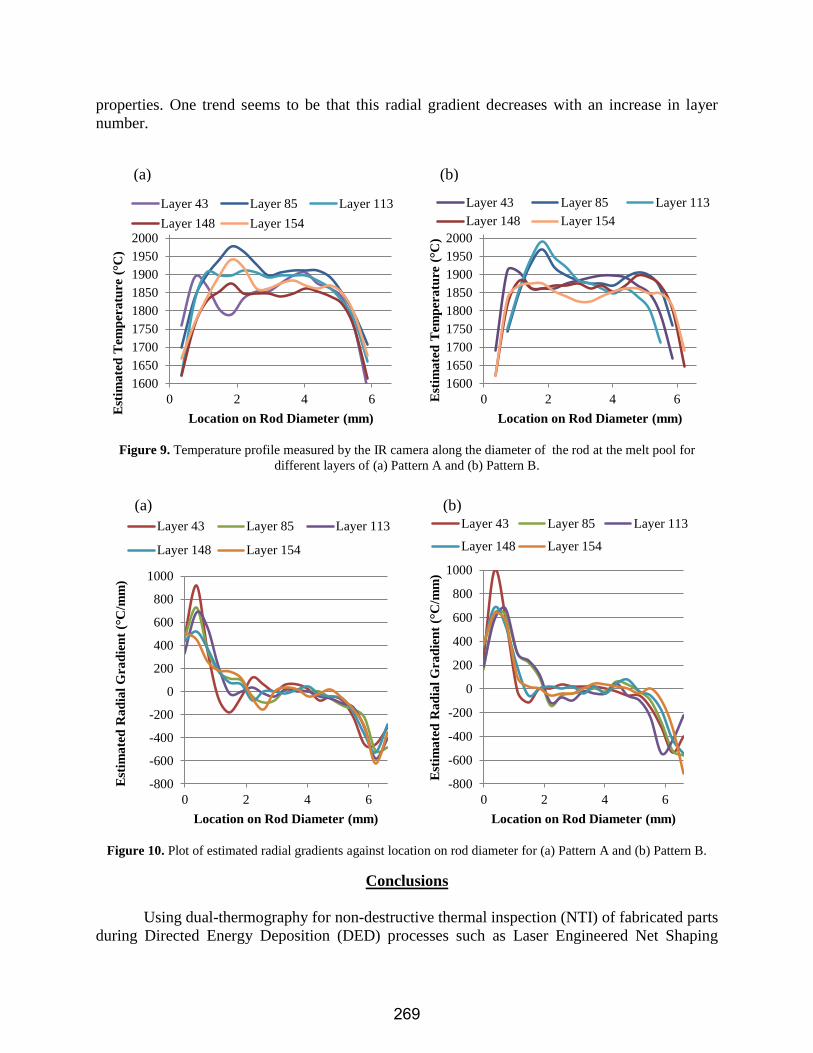
properties. One trend seems to be that this radial gradient decreases with an increase in layer
number.
Figure 9. Temperature profile measured by the IR camera along the diameter of the rod at the melt pool for
different layers of (a) Pattern A and (b) Pattern B.
Figure 10. Plot of estimated radial gradients against location on rod diameter for (a) Pattern A and (b) Pattern B.
Conclusions
Using dual-thermography for non-destructive thermal inspection (NTI) of fabricated parts
during Directed Energy Deposition (DED) processes such as Laser Engineered Net Shaping
1600
1650
1700
1750
1800
1850
1900
1950
2000
0 2 4 6
Est
ima
ted
Tem
per
atu
re (°C
)
Location on Rod Diameter (mm)
Layer 43 Layer 85 Layer 113
Layer 148 Layer 154
1600
1650
1700
1750
1800
1850
1900
1950
2000
0 2 4 6Est
ima
ted
Tem
per
atu
re (°C
)
Location on Rod Diameter (mm)
Layer 43 Layer 85 Layer 113
Layer 148 Layer 154
-800
-600
-400
-200
0
200
400
600
800
1000
0 2 4 6
Est
ima
ted
Ra
dia
l G
rad
ien
t (°
C/m
m)
Location on Rod Diameter (mm)
Layer 43 Layer 85 Layer 113
Layer 148 Layer 154
-800
-600
-400
-200
0
200
400
600
800
1000
0 2 4 6
Est
ima
ted
Ra
dia
l G
rad
ien
t (°
C/m
m)
Location on Rod Diameter (mm)
Layer 43 Layer 85 Layer 113
Layer 148 Layer 154
(a) (b)
(a) (b)
269
(LENS) will be important for assessing part quality and microstructure in real-time. In a
pyrometer/IR-camera setup, the melt pool temperature can be utilized for calibrating the IR
camera which can be located in the LENS chamber. In this case, a near-constant calibration
offset is feasible for a given temperature range. The current results indicate that the IR camera
high-temperature can achieve accuracies on-the-order of 2-5 %.
Build-path temperature effects were not visibly discernable when varying the scan
patterns for the cylindrical layers. However, upon analyzing thermographic data, temperature
gradient magnitudes and cooling rates were found to vary along the radius of the melt pool and
cylinder and this can influence final microstructure. For a given point in time and space, top-
level layers were shown to have temperature characteristics more dependent on hatch pattern.
Maximum melt pool temperature was observed to reach as high as 2500 ºC and to be dependent
on its contour track’s starting point. The increase in melt pool temperature appeared to translate
to an increase in cooling rate from about 16,000 ºC/s - 41,000 ºC/s for both investigated hatching
patterns. Radial temperature gradients decreased with increasing layers; ranging between 500
ºC/mm – 1000 ºC/mm near the tail-end of the melt pool. The hatch pattern consisting of less
layer revolutions appeared to have higher radial temperatures gradient, perhaps due to a
mismatch of the patterns’ deposition tracks.
Future work will aim to relate the observed thermal phenomena to determined microstructures
using cooling rates based on the tail of the melt pool. A larger temperature range will be
calibrated so that the IR camera may be more readily used for determining post solidification
evolution. In addition, a black-body method of IR calibration will be investigated and employed
to aid in determining emissivity of Ti-6Al-4V so that the results may be better compared to the
values found in the literature. The results may also help in determining an “emissivity correction
factor” for solidified regions of the part.
References
[1] Griffith, M. L., Keicher, D. M., Atwood, C. L., Romero, J. a., Smugeresky, J. E., Harwell,
L. D., Greene, D. L., 1996, “Free Form Fabrication of Metallic Components Using Laser
Engineered Net Shaping (LENS),” Proc. 7th Solid Free. Fabr. Symp., pp. 125–132, doi:
10.4028/www.scientific.net/AMR.15-17.175.
[2] Smugeresky, J. E., Keicher, D. M., Romero, J. A., Griffith, M. ., Harwell, L. ., “Thermal
behavior in the LENS process,” in World Congress on Powder Metallury and Particulate
Materials, 1997.
[3] Griffith, M. L., Schlienger, M. E., Harwell, L. D., Oliver, M. S., Baldwin, M. D., Ensz, M.
T., Essien, M., Brooks, J., Robino, C. V, Smugeresky, J. E., Hofmeister, W. H., Wert, M.
J., Nelson, D. V, 1999, “Understanding thermal behavior in the LENS process,” Mater.
Des., 20 (2)–(3), pp. 107–113, doi: 10.1016/S0261-3069(99)00016-3.
[4] Griffith, M. L., Ensz, M. T., Puskar, J. D., Robino, C. V, Brooks, J. A., Philliber, J.,
Smugeresky, J. E., Hofmeister, W. H., “Understanding the microstructure and properties
270
of components fabricated by lser engineered net shaping (LENS),” in Materials Research
Society Proceedings, 2000.
[5] Neela, V., De, a., 2009, “Three-dimensional heat transfer analysis of LENSTM process
using finite element method,” Int. J. Adv. Manuf. Technol., 45 (9)–(10), pp. 935–943, doi:
10.1007/s00170-009-2024-9.
[6] Wang, L., Felicelli, S. D., Craig, J. E., 2007, “Thermal Modeling and Experimental
Validation in the LENS Process,” Proc. 2007 Solid Free. Fabr. Symp., pp. 100–111, doi:
10.1557/PROC-625-9.
[7] Wang, L., Felicelli, S., 2006, “Analysis of thermal phenomena in LENS deposition,”
Mater. Sci. Eng. A, 435–436 (1)–(2), pp. 625–631, doi: 10.1016/j.msea.2006.07.087.
[8] Griffith, M. L., Schlienger, M. E., Harwell, L. D., Oliver, M. S., Baldwin, M. D., Ensz, M.
T., Smugeresky, E., Essien, M., Brooks, J., Robino, C. V, Nelson, D. V, “Thermal
behavior in the LENS process,” in Proceedings of the 9th solid Freeform Fabrication
Symposium, Austin, USA, 1998, pp. 89–96.
[9] Ye, R., Smugeresky, J. E., Zheng, B., Zhou, Y., Lavernia, E. J., 2006, “Numerical
modeling of the thermal behavior during the LENS process,” Mater. Sci. Eng. A, 428 (1)–
(2), pp. 47–53, doi: 10.1016/j.msea.2006.04.079.
[10] Gaumann, M., Bezencon, C., Canalis, P., Kurz, W., 2001, “Single-Crystal Laser
Deposition of Superalloys: Processing - Microstructure Maps,” Acta Mater., 49, pp. 1051–
1062.
[11] Hofmeister, W. ., Wert, M., Smugeresky, J. E., Philliber, J. A., Griffith, M. L., 1999,
“Investigating solidification with the laser-engineered net shaping (LENS) process,” JOM,
51, pp. 6–11.
[12] Wang, L., Felicelli, S., Gooroochurn, Y., Wang, P. T., Horstemeyer, M. F., 2008,
“Optimization of the LENS process for steady molten pool size,” Mater. Sci. Eng. A, 474
(1)–(2), pp. 148–156, doi: 10.1016/j.msea.2007.04.119.
[13] Craig, J. E., Wakeman, T., Grylls, R., Bullen, J., 2011, “On-line imaging pyrometer for
laser deposition processing,” Sensors, Sampling, Simul. Process Control, pp. 103–110.
[14] Bi, G., Gasser, A., Wissenbach, K., Drenker, A., Poprawe, R., 2006, “Characterization of
the process control for the direct laser metallic powder deposition,” Surf. Coatings
Technol., 201 (6), pp. 2676–2683, doi: 10.1016/j.surfcoat.2006.05.006.
[15] Ocylok, S., Alexeev, E., Mann, S., Weisheit, A., Wissenbach, K., Kelbassa, I., 2014,
“Correlations of Melt Pool Geometry and Process Parameters During Laser Metal
Deposition by Coaxial Process Monitoring,” Phys. Procedia, 56, pp. 228–238, doi:
10.1016/j.phpro.2014.08.167.
271
[16] Nassar, A. R., Keist, J. S., Reutzel, E. W., Spurgeon, T. J., 2015, “Intra-layer closed-loop
control of build plan during directed energy additive manufacturing of Ti–6Al–4V,”
Addit. Manuf., 6, pp. 39–52, doi: 10.1016/j.addma.2015.03.005.
[17] Liu, S., Farahmand, P., Kovacevic, R., 2014, “Optical monitoring of high power direct
diode laser cladding,” Opt. Laser Technol., 64, pp. 363–376, doi:
10.1016/j.optlastec.2014.06.002.
[18] Bi, G., Gasser, A., Wissenbach, K., Drenker, A., Poprawe, R., 2006, “Investigation on the
direct laser metallic powder deposition process via temperature measurement,” Appl. Surf.
Sci., 253 (3), pp. 1411–1416, doi: 10.1016/j.apsusc.2006.02.025.
[19] Bi, G., Gasser, A., Wissenbach, K., Drenker, A., Poprawe, R., 2006, “Identification and
qualification of temperature signal for monitoring and control in laser cladding,” Opt.
Lasers Eng., 44 (12), pp. 1348–1359, doi: 10.1016/j.optlaseng.2006.01.009.
[20] Yang, J., Sun, S., Brandt, M., Yan, W., 2010, “Experimental investigation and 3D finite
element prediction of the heat affected zone during laser assisted machining of Ti6Al4V
alloy,” J. Mater. Process. Technol., 210 (15), pp. 2215–2222, doi:
10.1016/j.jmatprotec.2010.08.007.
[21] Doubenskaia, M., Pavlov, M., Grigoriev, S., Smurov, I., 2013, “Definition of brightness
temperature and restoration of true temperature in laser cladding using infrared camera,”
Surf. Coatings Technol., 220, pp. 244–247, doi: 10.1016/j.surfcoat.2012.10.044.
[22] Rodriguez, E., Mireles, J., Terrazas, C. a., Espalin, D., Perez, M. a., Wicker, R. B., 2015,
“Approximation of absolute surface temperature measurements of powder bed fusion
additive manufacturing technology using in situ infrared thermography,” Addit. Manuf., 5,
pp. 31–39, doi: 10.1016/j.addma.2014.12.001.
[23] Purtonen, T., Kalliosaari, A., Salminen, A., 2014, “Monitoring and Adaptive Control of
Laser Processes,” Phys. Procedia, 56, pp. 1218–1231, doi: 10.1016/j.phpro.2014.08.038.
[24] Hagqvist, P., Sikström, F., Christiansson, A. K., 2013, “Emissivity estimation for high
temperature radiation pyrometry on Ti-6Al-4V,” Meas. J. Int. Meas. Confed., 46 (2), pp.
871–880, doi: 10.1016/j.measurement.2012.10.019.
[25] Kobryn, P. ., Semiatin, S. ., 2003, “Microstructure and texture evolution during
solidification processing of Ti–6Al–4V,” J. Mater. Process. Technol., 135 (2)–(3), pp.
330–339, doi: 10.1016/S0924-0136(02)00865-8.
[26] Ensz, M., Griffith, M., Harwell, L., “Software Development for Laser Engineered Net
Shaping,” in Proceedings for the Solid Freeform Fabrication Symposium, 1998, pp. 359–
366.
[27] Timet, “TIMET 6-4 Titanium Alloy (Ti-6Al-4V; ASTM Grade 5) Rod.” .
272