DTTIENT RESUME Served 4 COntinuing Educa-tion Program Area 70' DeMographic Characteristics 72 Age 72...
266
BD 207 624 AUTHOR TITLE INSTITUTION SPONS AGENCY PUB DATE NOTE EDRS. PRICE DESCRIPTORV IDENTIFIERS DTTIENT RESUME Shearon, 4:46.1d W.; And Othiars Putting LOrning to Work: A Profile or Students in North Carbiina munity Colleges, Technical 694 Institute, an -Technical C011eges. A Technical North C rolina State' Uni;., Raleigh. Dept. of Adult and Co munits-Coll. Education. North Carolina .St4ie Dep*.cif'Community Colleges, Raleigh. Odcupational Education Research'Servives. Nov BO .266p..; For a related document, , "see ED 196 4d6. I . e 4C 810 525 "N1701/PC11 Plus Postage. College Choice; College Transfer Students; *Community Colleges;Continuing Education; Information Sources; Participant Satisfaction; Population Trends; School Demography;'Socioeconomic Status; State Surveys; **Student Characteristids; Student Educational Objectives; 'Two Year Colleges; *Two Year College Students; Vocational Education *North Carolina 'ABSTRACT . This report provides an ins -depth profile of -the students enrolled in the 57 community colleges and technical institutes of the North Carolina Community College System during the spring of 1979. After an introductory section .identifying key issues and describing the research problem and objectives, the study methodology is described. Next, student Erofiles based on a statewide sample of more than 16,000 students are presented for the cohi'unity college students in.generaa and for.curriculu and 'continuing education students. These profiles. cover demographic, Socioeconomic,' academic, and atten e characteristics, and, in.addition, provide information on soarc-- of.influence,and information, students' value . orientation 'toward education, education and emiloyment plans, and feelings about the itandard useof community college as the designation'for all institutions in the .System. Next, demographic and socioeconompic comparisons are made between curriculum and continuing education studentsand North Carolina's projected 1979 adult population. The subsequent sectionsIxamine profile changes in the .curriculum'and continuing educationItudent populations over -the last ten yearS. After enrollment and population chafes are compared, the report presents a susmarj analysis of the findings. Appendices provide the survey instrument and other information related to the study ethodology.and results. (AYC) ' ° f . c *********,*********************Iga*****14******************************* a Reproauctions supplied by EDRSeore the best taat can be made * * from the original document. * . **************************i*****************************w000ploolgalgaa* O
Transcript of DTTIENT RESUME Served 4 COntinuing Educa-tion Program Area 70' DeMographic Characteristics 72 Age 72...

BD 207 624
AUTHORTITLE
INSTITUTION
SPONS AGENCY
PUB DATENOTE
EDRS. PRICEDESCRIPTORV
IDENTIFIERS
DTTIENT RESUME
Shearon, 4:46.1d W.; And OthiarsPutting LOrning to Work: A Profile or Students inNorth Carbiina munity Colleges, Technical
694Institute, an -Technical C011eges. A Technical
North C rolina State' Uni;., Raleigh. Dept. of Adult
and Co munits-Coll. Education.North Carolina .St4ie Dep*.cif'Community Colleges,Raleigh. Odcupational Education Research'Servives.Nov BO
.266p..; For a related document,
,
"see ED 196 4d6.I
. e 4C 810 525
"N1701/PC11 Plus Postage.College Choice; College Transfer Students; *CommunityColleges;Continuing Education; Information Sources;Participant Satisfaction; Population Trends; SchoolDemography;'Socioeconomic Status; State Surveys;
**Student Characteristids; Student EducationalObjectives; 'Two Year Colleges; *Two Year CollegeStudents; Vocational Education*North Carolina
'ABSTRACT .
This report provides an ins -depth profile of -thestudents enrolled in the 57 community colleges and technicalinstitutes of the North Carolina Community College System during thespring of 1979. After an introductory section .identifying key issues
and describing the research problem and objectives, the studymethodology is described. Next, student Erofiles based on a statewide
sample of more than 16,000 students are presented for the cohi'unity
college students in.generaa and for.curriculu and 'continuing
education students. These profiles. cover demographic, Socioeconomic,'
academic, and atten e characteristics, and, in.addition, provideinformation on soarc-- of.influence,and information, students' value
.orientation 'toward education, education and emiloyment plans, andfeelings about the itandard useof community college as thedesignation'for all institutions in the .System. Next, demographic andsocioeconompic comparisons are made between curriculum and continuingeducation studentsand North Carolina's projected 1979 adultpopulation. The subsequent sectionsIxamine profile changes in the.curriculum'and continuing educationItudent populations over -the last
ten yearS. After enrollment and population chafes are compared, thereport presents a susmarj analysis of the findings. Appendicesprovide the survey instrument and other information related to the
study ethodology.and results. (AYC) '
°
f
. c
*********,*********************Iga*****14*******************************a Reproauctions supplied by EDRSeore the best taat can be made *
* from the original document. *.
**************************i*****************************w000ploolgalgaa*
O

PUTTING. LEARNINGEJTO WORKw
A PROFILE OF STUDENTS IN NORTH CAROLINA ICOMMUNITY COLLEGES, TECHNICAL INSTITUTES,AND TECHNICAL.COLLEGES
PERMISSON PEPPCDUCE S
4ATER)A, -AS SEEN SPAN-ED
Ronal d . Shearon
A TECHNICAL REPORT
TO ",-4E Er.../LA,N.OPMAx -P.EP EP
RONALD W. SHEARONROBERT G. TEMPLIN, JR.DAVID E. DANIELLEE McGRAW HOFFMANRUSSELL F. WEST*
U S DEPARTNIEPT OF EDUCATIONNATIONAL INSTITUTE OF EDUCATION
E"),'CATI'JNAL RESOL,PZES NTOPMAT.ON-EN-ER ER C
^rS P ,- tHE, , aS
31K,
OThis proliNas conducted by the Department of Adult and Community CollegeEducation "North Carolina State University, Raleigh, North Carolina 27650, andsponsoeed.by Occupational Education. Research Servre.As, Division of Planning andResearch North Carolina Department of CommuniColleges, Raleigh, NorthCarolina 27611
November, 1980
'About the authors Ronald W Shearon, Professor, North Carolina State Univer-sity, Robert G Templin, Jr , Dean of Instruction, Piedmont Virgiwa CommunityCollege, David, E Daniel, President, Wilkes Community College, Lee McGrawHoffman Administrative Officer/Evaluation Specialist, Louisiana Department ofEducatioussell F ',West, Research AssoCiffte, North Carolina State University

4,1
ACKMDWLEDGEMENfTS
iii
Numerous persons contributed in various ways to the de-velopment, activation, coipletion, andreporting of thisproject, and the authOrs wish t0 express their gratitude toeach and every one. However, special acknowledgement is ex-tended" to the following-
--Larry S. Blake, State President, Department of Cpmmu-nity Colleges, and the State Board of Education forthe financiP support provided for the study.
--Fred W..Manley, Coordinator, Occupational EducationResearch Services, and Project Officer, for hissupport and'encouragement.
--All of,the presidents, fac4ty,4and students of the'57 participating institutions for their cooperation,time, and effort in making this study possible.,
- -The institutional coordinators whoseAutstanding per-formance made the data-collection process run sosmoothly.
- -Edgar J. Boone, Department of Adult and Commu-nity College Education, North Carolina State Oni-versity, for his Administrative support.
- -Carl J. Dolce, Dean, School of Education, North Caro-.lino State University, for his assistance and en-'couragemen t
--Suzanne ftrokon, W. L.'Gragg, -K. D. Mustian, and C. H.
,\ Proctor of North Carolina State University for tech-nical and methodological assistance.
--Michael McAnulty and Frances Pendergrass of-theNationitl Testing Serviee for their assistance indesigning and scoring the survey instrument.
- -Penni McCall, who designed the logo used on the cover
of thefreport.
- -Adele Porter Covington for editorial services, design_of the format, and preparation of the fi*al manu-script, .-
* 'e

1
V.
--Glenda Jacobsand Marjorie Edwards for typing klraftsof manuscripts and performing numerous othe{ fasksthat facilitated the completion of this proftict.
--Sherry Madison, a research assistant durftg the earlyphases of the project, for her contributions to the,research design, survey procedures, and data collec-
-x tion procesi,
--Clifton'Middleton fOr his contributions during thefinal phases of +t he project.
4R
W, Shearon''Robert G. Templln,
id E. DanielMcGraw Hoffman
ssell F, West
Jr,

*
ti
PREFACE
Since its establishment' in 1963, the institutions of theNorth Carolina Community College System have steadily' in-creased in number and services offered to the adult popula-tion of North Carolina, Leaders of these community-based,public, postsecondary educational institutions have respondedwith alacrity to the _varied demands from their communitiesfor training, educat'ion,.and community services. At the sametime, the State Board cif Education and its Department,of Com-munity Colleges have experienced complex demandS-for manage-ment and support services from the educational leadprs ofthese institutions, their trustees,.and the North CarolinaGeneral Assembly.
To determine the feasilpility of suggested changis in pol-icies, programs, and educational practices, based on informa-tion about the students being served by the institutAons andin what ways, the Department of Community Colleges has sup-ported continuing studies of the characteristicsiof these,stu-:,dents. Gerald Y. Bolick surveyed the credit students:enrolledin the System in' 1968. Curtis Phillips surveyed the noncreditstudents enrolled in the System in 1969. Five years later,,the State Board of Education contracted with the Departmentof ult and Community College Education at North CarolinaStat niveroity. to survey and profile both credit and non-credit students enrolled in the System in 1974. RonaldShtiro was Project Director, assisted by Robert Ilemplin, andDavid Der{ iel .
Between 1974 and 1979 the enrollments in North Caro-lina's public community colleges ind technical institutes in-creased dramatically, the characteristics of the studentschanged, and information based on 1974 data was n9' longer ade-quate to serve as a base for decisions about pro(ram offoriAgsand accountability. A&ordingly, the State Board of Educationagain contracted with the Department of Adult and CommunityCollege Education to expand.and update the aforementioned pro-file of student characteristics.
This report provides a current and accurate descriptionof the students enrolled in the 57 community colleges andtechnical institutes of the North Carolina Community CollegeSystem during ne spring quarter of 1979. (The survey datawere collected beforoe the name "technical college" was in use,and before the establishment of the fifty-eighth institution 4lIn -depth student profiles based on a statewide sample of mare
t

)vi
4 t
than 16,000 students representing each of the 57 institutionswere developedtfor.curriculum and Cont,irwing edUcation stu-dents in terns of their demographic, `socioeconomic, .academic,
' and attendance characte stics; sources that most influencedtheir decisions to atte ; sources of first infOrmation aboutthe,program in which, they enrolled; their value orientat'fonstoward education; ,institie,i0nal characteristics that most in-fluenced their enfolling7tbeir evaluation of the supportservices offered by the institutions and the importance ofthose services; and their opinions of and feelings about theuse of a standard name for all of the institutions, Changesin student characteristics over the past 10 years were deter.mined and comparisons, were made between the characteristics .
of the study respondents and North Carolina's adult popula-tion as projected for 1979.
The study findings are being disseminated in a numberof....... forms: this comprehensive technical' report, a concise sum-
Mary of the research findings, and a slide-tape presentation.,Further, ach,of the 57 institutions has - received a printoutof the da a collected from those of its studehts whb werereptesent d in the study sample.
The report and accompanying materials have been preparedfor the State Board of Education, the Department of CommunityColleges, and the individual community colleges, technicalcolleges, and technical institutes in the North Carolina Com-munity College System. The author believe that the data inthis report and their interpretations will be, of use to theeducational leaders and policymakers of the North CarolirfaCommunity Colkege System as they make deCisions on new pro-grams, program revisions, policy, and accountability efforts.
--The Authtirs
North Carolina State University, North Carolina
N vember, 1980

1
TABLE OF CONTENTS
vii
Page
LIST OF TABLES xiv
Chapter
1. INTRODUCTION 1
Some? Key Ispues 2
The "New" Adult Student 3
The Curriculum 5Access. to Educational Opportunities 6
The Institutions' Responsibility inEducational Market ing 8
The Problem 10Objectives 10
Research Quest ions 11
Definition of Terms 13
2 METHODOLOGY r7
Research Design 17
Population 17
Sample Design 17
ConstructiOn of the Sampling Frame 18
Participation of Institutional Coordinators 19
Institutional Coordinator Workshops 19
Actual Sample 2Q
Instrumentation 4 20
Data Collection 20
Data Analysis 21
Limit.ations 22
3 FINDINGS OF THE STUDY 23
Students Enrolled in Curriculum sand Con-tinuing Education Program Areas 23
, Demographic Characteristics 24
Age 24
aSex and Race , 24
Marital Status w 24
Veteran Status 26Residency, Location of Institution, w.ndResidence While Enrolled 26
1.4
r--

viii 1
'TAMA OF CONtiENTS (coatii3ued)
N\
Socioeconomic Characteristics
Educatios--Student and ParentsBeabhof-RouseholdIncomeStudent, Parents, and PrimaryOccupation He a d-of -HdIse hol dEmployment Status--Student . .....
Page
26
2627292931
Hours Worked/Week for Wages andWages/Hour 33
Academic Characteristics 33Attendance Characteristics
General Attendance and Enrollment
33,
Characteristics 34Choice of. Inst itut ions 37Sources of Influence and First
InformationSdurces of Income, Sources and Amount of
Financier-1. Aid, and Expenses . . . , 4QEducation and Employment Plans 43
Value Orientation Toward Ethication 43
_Institutional Characteristics ThatInfluenced Decision to- Attend 46
Evaluation and Importance of SupportServices and Use of a Standard Name 46
Evaluation and Importance of Support.Services . 46
Opinions of and Feelings About Use of aStandard Name for All Institutions . . 50
.
4,
, Students Being Selbved frn Curriculum Program4, Area .
/
50
aDemographic Characteristics . 50
Age 51
Sex 51
Race 54
Marital Status 54
Veteran Status 54
Socioeconomic and Academic Characteristics 54
Education -- Student and Parents 60Income--Student, PUrentw, and Primary . 60Occupation Rea d-of -Ho usehol d 61

S
ix
TABLE OF CONTENTS (continued)
Page''
Student's Employment Status 61
Prior Full-Time Enrollment in a Four-Year College/University 61
Attendance Characteristics 61
sae of Attendance, Location of 9asses,nd Distance to Class 62
Choice of Institutions 62
Sources of Most Influence to Attend andFirst Information About Program . .
62
Sources and Amount of Financial Aidand Expenses 65 '
Education and Epployment Plans lb
Students Ling Served 4 COntinuing Educa-tion Program Area 70'
DeMographic Characteristics 72
Age 72
Sex 72
Race .......... 72
Marital Status . .
72. . . .
Veteran Status 72
Socioeconomic and Acaqemic Characteristics 74
Education--Student and Parents 74
IncomeIrStudent, Parents, and Primary 74
Occupation Head-of-Household 78
Student's Employment yStatus 78
Prior Full-Time Enrollment at a Foui7Year College/University 79
Attendance Characteristics ,79
airTime of Attendance, Location of Classes,
and Distancdato Class 79
Choice of Institutions 80
Source of Most Influence to Attend andSource of First Information AboutPrOgram . .
82
Expensess 82-
Education and Employment Plans 82
Value Orientation Toward Education 85
1

x
TABLE OF CONTENTS'(coptinued)
Comparisons Between Curriculum mnd Continu-ing Education Students Enrolled in the
' North Catolina Community College System;1979, ana North Carolina's Projected
Page
1979 Adult Population' 85,
Demographic Comparisons 88
Age '88'Sex 90',Race 90
Socioeconomic Comparisons 90-1
Student's Edutation 90 °
Primary Income 92Occupation Head-of-,Household 93
Profile Changes in the Curriculum StudentPopulation Between 1968, 1974, and 1979 93
Demographic Characteristics 93
Age 93Sex 95Race 95Marital Status 95Location of Institution 95Residence While Enrolled 96
Socioeconomic,CharaCteristics 96
Education--Student and Parents 96Income--Student and Parents 96Employment Spitus--Student 98
Attendance Characteristics 98 14
Program in Which Enrolled I 99Time of Attendance, Hours in Class/Week,
and Digtance to Class 99 'Choice of Institutions 99'Plans for E,urther Education and % 0
Employment 99
Psofile Changes in the Continuing EducationStudent Population Between 1969, 1974,and 1978 102
I '
'so
I
TABLE OF CONTENTS (contnued)
X1
Page
Demographic Characteristics 102
Age 102
Sex 102
Race 102
Marital StatUO 102
Location'of Institution .. _ 104
Residence While Enrolled 44 104
Socioeconomic Cflaracteristics 104
Education -- Student and Parents 104, ..
IncomeStudent and Parents , 106
Employment Status--Student 107
Attendance Characteristics ,. 107
Time of Attendance and Distance to Class /107Continuing enrollment in the NCCCS andChoice of Institutions 107'
,Enrollment Changes as Compared to Changes inthe Adult Population of North CarolinaBetween 1974 and 1979 109
. . . ......Demographic Characteristics 109
Age 109
Sex 109
Race 113
Socioeconomic Characteristics 113
Student's Education 113
Stud is Income 115 .
0ccuation Hend-of-Household 115
Summary and Analysis of Relationships . 117
Students Being Served by the North Caro-lina Community College System, 1979 . . 117
The Typical Curriculum Student . . .
-The Typical Continuing Education StUdent
Descriptions of Students by EducationalProgrim
The College-Transfer StudentThe General Education Student
k1712q
;120
/120120

dk
.x i i
TABLE OF CONTENTS (continued)
4
1
. Pairthe Special Credit Student 120The Technical Student 121The Vocational Student 121The Academiq Extension Student 121
7 The Fundamental Education Student . . 121The Occupational Extension Student . 122
Extent to Which Studeriti Are .Reoresenta-tive of the Projected 1979 AdultPopulation of North Carolina 122
proup(s) Not Being Served by the NorthCarolina Community College System, X979 123
Changes in Student Profiles, 1968-1979 . 123Students Least Likely 'so Continue Their
Education in the Absence of North Caro-lina Community College SystemInStitutions ... s. 124
Students Leapt Likely to AttenTa, NOOth. .
V Carolina Community College System Insti-tution.es the DiStance to ClassIncreases 125
Studepts Who Selected North Carolina Com--munrcy College System Institutions' asFirst Choice Over Other Forms of Post-secondary Educ,ation , 125
Recruitment Strategies That Influenced,Studentsikra.A.ttend North Carolina Com-munity Colle'ge System Institutions andSource of ,First Information AboutProgram 126
Curricula's Studen-ts Who Received FinancialAid and the Source and Amount of ThatAid , s. - 126
Employment Status of Students 127Students Who flan to Work, Toward a'Four-
Year College Degree ------ 128Students Who Plan to W rk in North Caro-
lina Upon Completio of Their Educa-tional Program . 128
Major Reasons Students Were ContinuingThe ir E ducat ion .. . . . . 128
Institutional Characteris't'ics That Influ-ence Students to Attend North CarolinaCommunity College System Institutions 129
Student Evaluations of Support Servicesand the Support Services That Were-Most Important
41... 129

1
.1'ItEL1,3 OF COJTENTS (continued)...;
''4
.
St tent's opinions Of andFeelings Abothe Ilse of a Standard Name for "p11.
North Carolina Couunity College ;rSystem Institutions 130
fl
CONCLUSIONS AND IMPLICATIONS 13 j
'iii
Page
RENERENCES- .
APPENDICES.... 143.
1146- .
Appendix A Enrollment Projections. and Sample Sizesii..', for Institutions An the North Carolina Community
College System, Sprting Quartet, 1979. . . . 146Appendix B. Institutional Coordinators - 149Appendix C Procedures for Drawing the Sample . . 153Append ix D InstiVitiodal Response Rates . 157Appendix E:. Pretest Findings and Reliability of
Survey Indtrument Responses ' X60../ Apo,ndix F Survey Instrument . 7
Appendix G: Weighting Procedures 1
Appendix Ft; Relater Ihformatioq
D
,
We
1''
0
174

1. Weighted ,percentcontinuing educNorth Carolinaby age, sex, rastatus
LIST OF TApLES
Text
distribution of curriculum anda n students enrolled in the'Comiunity College System, 1979,ce, maritar status, and veteran
2. Weighted percentage distribution-of curriculum and ,continuing education students enrolled in theNorth Carolina Community College SyStem, 1979,by1residency, location of institution, andresidence while enrolled
3, Weighted percentage distrib-4tion of curriculum andlocontinuing education students enrolled in theNorth Carolina Community College System, 1979,by student's education, father's education, andmother's education
4. Weighted. percentage distributiOn of curriculum andcontinuing education students enrolledin theNorth Carolina Community College System, 1979,by head-of-household, student's income, Parent'sincome, rimary income, and occupation head-of-household 30
5. Weighted percentage distribution of curriculum andcontinuing education studefils enrolled in theNorth'Carolina Community College System, 1979,by employment status, hours worked per week forwages,'and wages per hour 32
6. Weighted percentage distribution of curriculum andcontinuing educat students enrolled in theNorth Carolina C College System, 1979,by prior full-t lment in four -yearcOrlege/univer score, hikh school gradeaverage, agd,hi sec ool rank 34
7. Weighted percentage distribution of curriculum andcontinuing education students enrolled in the'North Carolina CommunityiCollege System, 1979,40, program, tier of attendance, location ofClasses, hOurs in class per week, classes thistuarter, distance to class, trips to class /week,
' and total number of quarters enrolled - 35
Page
25
27
28

11
X V
LIST OF TABLES (cOntinued)
Page'
8,. leighted percentage distribution of curriculum andcontinuing education.students enrolled in theNorth Carolina Community College System, 1979,by would have attended another institution hadthis one not existed and this institution wasfirst choice 38
9. Weighted percentage distributiquof curriculum and
ile
continuing education,students nrolled in theNortti Carolina Community Coll System, 1979,by, source of most 4nfluence t attend and sourceof first information about program ,-,-/ 39
10 Weighted percentage distribution ot curriculum andcontinuing education students enrolled in the ,
North Carolina Community College System, 1972,-by sources of income, sources and amount offin&ncial aid, cost ofk books and supplies, andrent While attending 41
,
- .
11 Weighted percentage distribution of curriculum andcontinuing education students enrolled in theNorth Carolina Community College System, 1979,by plans to enroll in a degree'Trogram plansfor four-year college degree, and employmentplans 44
12. Distribution of curriculum and contintabg educa-tion students enrolled in the North CarolinaCommunity College System, 1979, by rank orderand raw score of relsons for continuing educe-Lion and institutional characteristics influ-
encing decision to attend 45
/
13. Weighted percentage distribution of 'Curriculum
and continuing education students enrolled in :
the North Carolina Community College System,1979, by evaluation of individual support serr-vices and importance of support services . . . . 47
14. Weighted percentage 4istribution of curriculum andcontinuing education students enrolled in theNorth Carolina Community College System, 1979,'by opiniods about a standard name for the insti-
tutions in the System and feelings about astandard name 51

xvi
LIST -OF TABLES'4continuet049
- Page
15! Weighted percentage distribution of ciirriculum.. students enrolled 0 the North Carolina,Com-
unity College System, 1979, by program, age,sex, race, maritill status, and veteran status 52
16.' Weighted percentage distribution of curriculumstudents enrolled4in the North Carolina Commu-nity College System; 1979, by program, student's°education, father's education, mother's educa-tion, student's 1978 income, parents' 1978 in-come, pristry 197t income, occupation head-of-household, studeet's employment status, andprior full-time enrollment in a four-yearcollege /university , . 55
17. Weighted pereentage -distribution of curriculum. studentsqenrolled in the North Carolina Commu-
nity College System, 1979,,by program, time ofclaSs attendance, locatiodrof classes, anddistande ,to clans .' ' 63
e18. Weighted percentage distribution of curriculum
students enrolled in the North Carolina Commu-nity College System, 1979, by prop am andchoice of institutire
/
64
-19, Weighted"percentage diZtr4bution of curriculumstudents enrolled in the North Carolina Comilou-
4nity College SySte 1979, by program, sourceof most influence attend, and source offirst informatipwa out program 66.
-0,
20. Weighted percentage distribution of curriculumstudents enrolled 4n the North Carolina Commu-nity College System, 1979, by program, sourceof financial aid, amount of financial aid, andcost of books tndSupplies this quarter
. . . . 68
'21. Weighted percentage'distribution of curriculumstudents enrolled in the North Carolina Commu-nity College System, 1979, by program, plans towork toward a Yokr-year college degree, stilEL
plans to work 4 North Carolina upon comp ionof educational program - 4 Z1

LIST OF TABLES (continued)
xvii
Page,
22. Weighted percentage distribution of continuing. education students et:Oiled id the North Caro-lina Community. College System?; 1979, by program,
age, sex, race, marital, status, and veteranstatus' ;
73
. ,
23. Weighted percentage distPibution of continuing .
education students enrolled in the North Caro-lina Community College System, 1979, by pro.-
I, gram', student's education, father's education,mother's education, student's 1978 income, par-qnts' 1978 income, primary 1978 income, occupa-
tion head-of-householci., student's employmentstatus, and prior full-time enrollment in a
four-year college/university .'075
24. Weighted percentage distribution of continuingeducation students enrolled in the North Caro-lineComskunity College System, 1979, by pro-'gram, time of-attendance., location of classes,
and- 'distance to class '80
. 25. Weighted percentage. distribution of continuingedkcation students enrolled in the North Caro-
1 Community College System, 1978, by pro-gr and choice of inst'itut'ions 81
26. Weighted percentage distribution of 'continuingeducation students enrolled in the North Caro-lina Community College System, 1979, by pro-gram, source.of most influence to attend, andsource of first information bogt program .
83
27, Wetghted percentage distribution'of continuingeducation students enrolled in the North Caro-lina Community College System, 1979, by pro-gram and cost of books and supplies for this
quarter 85-
0 28. Weighted percentage distribution of continuingeducation Students enrolled in the North Caro-lina Community College System, 1979, by pro-gram, plans to enroll in a degree prorgram, plansto work toward a tour-year collr degree, andemployment plkns after educatio ,
86
29. Value orientations toward education of continuing,education students enrolled in the North Caro-lina Community College System, 1979, by program,"rank order of responses, and raw scores (RS) 87

xviii
LIST OF TABLES (continued)
30.
1
Weighted percentage distribution of curriculum andcontinuing education students enrolled in theNorth Carolina Community College System, 1979,and the projected 1979 adult population of North
Page
Cals,olina, by age, sex, and race s 89
31. Weighted percentage distribution of curriculum andcontinuin education students enrolled in theNorth Car It ina Community College System, 1979,and the projected 1979 adult population of NorthCarolina, by student's education., primary income,and occupation head-of-household
. - 91
32 , Weighted perc e distribution o curriculumstudent nroll d in the North Carolina Commu-nity College System 1968, 1974, and 1979, by ,
age, sex, race, marital status, location ofinstitution, sand residence while enrolled . . 94
,4,..
33. Weighted per.centage distribution of curriculumstudents enrolled in the North Carolina Commu-aityCollege System, 1968, 19i,4, and 1979, bx,
student's educatipn, parents'ieducation, stu-dent's income, income, and student's,pakents'employment status 97
,
34. Wetghtld percentige distribution of curriculumstudthts enrolled in the North Carolina CI:Amu-nity College System, 1968, 1974, and 1979, byprogram in which enrolled, time of attendance,hours in.class/week, distance to class, wouldhave attended another institution if theirs hadnot existed, plans to work toward a /our-yearcollege degree, p ns to be employed 141 North
..-
Carolkina upon c let ion of progral; and otheremploymentfplan too
35. Weighte percentage distribution of continuingeduc 10n-students enrolled in the North Caro-lina Community Colo:: System, 1969, 19744 and1979, by ige, sex! e, marital status, loca-tion of institution, and residence whileenrolled 103
ti

ILIST OF TABLES (continued)
Page
36: 'Weighted percentage distribution of continuingeducation students enrolled in the North Caro-'Ina Community College System, 1969, 1974, and1979, by student's education, father's educa-tion, mother's education, student's income,parents' income, and student's employmentstatus 105
37. ,Weighted percentage distribution of continuingeducation students enrolled in the North Caro-lina Commdnity College System, 1969, 1974, and1979, by time of attendance, digtance to class,enrolled in first cCMcse, and would have at-tended another institution had theirs not ex-isted 6
I
38. Weighted percentage distribution of curriculum andcontinuing education students enrolled in theNorth Carolina Community College System, 1974
and 1979, as compared to the adult population ofNorth Carolina, 1974 and 1979, by age, sex, race,proportional changes over the five-year period,
hnd Representation Index '
39. Weighted percentage distribution of carrltulum andcontinuing education students enrolled in theNorth Carolina Community College System, 1974
and 1979, as compared- to the adult population ofNorth Carolina, 1974 and 1979, by education,proportional changes over the five-year period,andlIkepresentition Index
108
110
114
40. Meighteet*rcentage distribution of curriculum andcontinuing education students enrolled in theNorth Carolina Community College System, 1974and 1979, as compared to the adult population ofNorth Carolina, 1974 and 1979, by student's in-cake, proportional changes over the five-yearperiod, and Represensfion Index 116
_4 . .
41. Weighted percentage distribution of curriculum andconiinuing_education students enrolled in theNorth Carolina Community College System, 1974and l979, as compared to the adult population ofNorth Carolina, 1974 and 1979, by occupationhead-of-Aousihold, proportional chpnges over thefive-year period, and Representation Index . . 118

xx
LIST 4 TABLES (Ccintfnued)
sc s
AppendixP
1 Weighted'-perAntage distribution of curriculum andcontinuing education students enrolled in theNorth Carolina Community College System, 1979,whp would have attended another educational in-stitution if theirs had not existed, py age, sex,race, marital status, educational attainment;and occupat ion ,hea d-of -houshold
fr
2, Weighted percentage distribution of curriculumstudents enrolled in th,g North Carolina. Commu-
1 nity College System, 1979, by source of financialaid as related to program, age, seX racer mari-tal status, student's education, primary Income,and otcupation head-of-household
3 Weighted percentage distribution of curriculumstudents enrolled .in the North Carolina CommunityCollege System, 1979, by amount of financial aidreceived as related to program, age, sex, rade,marital status, student's education, primary in-come, and occupation head-of-household .
4 Rank order (RO) and raw scores (RS) of reasonscurriculum and continuing education stuckents en-rolled in the North Carolina Community Colblege',System, 1979, were continuing their education,by age, sex, race, marital status, educational,attainment,' primary income, and occupation head-of-household
5. Rank order ( RO) and raw scores (RS) for jty-tional that most influence tsar -
,riculum and c tinuing education students en-*rolled in the North Carolina Commun ity CollegeSystem, 1979, intheir decisions to attend, byave se k, race, marital status, edultionale at-tainment, primary income, and occupationion head-of-househol d
Weighted percentage distribution 9J -verriculumstudentsienrolled in the North Carolina Commu-nity College System, 1979, by prOgrim, evalua-tion of support services, and importance of
. support services
.
1
0
Page.
175
178
193
208
211
214

'LIST OF TABLES (continued)
7. Weighted percentage distributioneducation students enrolled inlina Co unity College System,`evaluation of support servicesof support services
8 Weighted percentage distribution of curriculumstudents enrolled in the North Carolina ,Commu-nity College System, 1979, by program, prefer-ence for using a standtrd name for the-institu-tions in the System, and feelings about astandard name
of cont inuingthe North Caro-1979,b.y program,
, and Importance
9 Weighted percentage distribution of,on'tinuingeducation students enrol in thCNOrth Caro-lina Community College Sntem, 1979, by program,preference for using a standard name for theinstitutions in the System, and feelings abouta standard name
0. Weighted percentage distribution of curriculumstudecits enrolled in the North Carolina Commu-nity College System, 1'979, -by program, ,source
..of income, parents pr-evide over one-half ofsupport, head-of-household, hours worked/week,wageg/hour, and employment plans 226
11. Weighted percentage distribution of curriculumstudents enrolled .1,n the North Carolina Comma-
' nity College System, 1979, by program, highschool average, high school rank, and GEDscope
12: ,Weighted, percentage distribution of curriculumstudents enrolled in the Nord, Carolina &maw.-nity College System, 1979, by program, change,'in residence to attend, dorrt*.ksrent, residencewhile attending, and trips to c ass /week . . 230 0,
13 , ye igh te d percentage distribution of cu4icul.ipn*/. students enrolled in the North Carolina Coisiou-
nity College System, A-979, by program, hours inclass/week, classes this quarter quarters en-rolled, and plans to enroll in eigree program 232
Pate
"/
219
224
229

.44
. LIST OF TABLES (continued)
Page
14, Value orientation toward education and institu-tional characteristics that most influencedcurriculum students to enroll in the NorthCarolina Community College System, 1979, byprogram, rank order (RO) of responses. arrdraw scores (RS), 234
15 Weighted percentage distribution of continuingeducation students enrolled in the North Caro-lina Community College System, 1979, by program,source of income,, parents provide over one-halfof support, head-of-household, hours worked/week,wages/hour, and employment plans .236
16 Weighted percentage distribution of continuingeducation students enrolled in the North Caro-lina Community College System, 1979, by program,high school average, high school rank, and GEDscore
L7. Weighted percentage distribution of continuingeducation students enrolled yh the North Caro-line Community College SystI, 1979, by program,
. change in residence to attend, monthly rent,residence while attendingdand trips to class/week
18. Weighted percentage distribution of continuingeducation students enrolled An the North Caro- ,
line Community College System, 1979, by program,hours in class/week, classes this quarter, andquarters enrolled
23 9
240
242
19. Instituti nal characteristics that most influencedcontinu 'education students to enroll in the
V' North Carolina' Community College System, 1979,by program, /sink order (RO) of responses, andraw scores (RS) . 244
t
4) fl
444

CHAPTER 1/
IN
rOver the past two decades, the comprehensive community
college has become an integral part of the fabric of American
postsecondary education. Enrollments in these two-year insti-tutions 'have more than dpibled since 1970. Characterized as"teaching institutions,T' dommunity colleges offer locally zbased.programs designed to meet the unique needs of their re-
spective communities, The hallmark of these institutions islow-cost programs, a cpaprehensive approach to educationalprogramming, and an opeh-door admission policy. And, at the
heart of thisr nationwide community college movement is a Com-
mitment to an egalitarian philosophy.
Because of their deep belief in this egalitarian philos-
ophy, the political, industrial business, civic, governmental,and educational leaders of North Carolina have initiate'dndare cosutitted to the development of a comprehensive system of
public two-year postsecondary educational institutions. within
the State, The major thrust of these institutions is to pro-ide access to education beyond high school for all adult
North Carolinians, North' Cairolioa has made significant prog-ress in thap direction. During the past 17 years, 57 commu-nity-colleges, technical colleges, and technical instituteshave been established throughout the State and all of them
no have at least the beginnings of permanent campuses (Ex-
cellence in Educlition, n.d.). Reflecting the national trend,enrollments in the North Carolina Community College Smptem4proliferated from 52,870 students in 1963-64 to 539,373 in1977-78 (1976-1978 Bienhial Report, 1978). To serve these'students, many educational programs have been added, mgditled,
or deleted (North Carolina Community College Report, 1970;1976-1978 Educationfl Guide, 1977).
. Across the nation, and especially in North Carolini, ac-
cess to postsecondary educational opportunities now agarsto be a reality (Templin et al., 1977). As Cohen and Lom-bardi (1979, p. 2) cdncluded: "Access for everyone who wantsto learn has been achieved." However, the progression in mak-ing educational opportunities available to all thgse adults
lobo desire it has not gone without challenge. Cohen and Lom-
bardi (1979, p. 27) suggested that, although much has beenaccomplished, "the challenge of teaching them all and of limiting institutidnal claims and growth remains open."
The decade of the 1980s will likely bring about a dif-
ferent set of issues and choices for-policystakers, chief
administrators, and faculty members of these public two-year
pOstseconcfary institutions, With a comprehensive deliverysystem firmly established, community college leaders now are
O

2
being called upon to examine questions concerning Institu-tional growth and maturation.
4The Commission on Goals for the North Carolina Community
College System (1977) recently called for the achievement ofexcellence in programs during the next two decades. However,
1 North Cirolina is by no means alone in its call for excellencein educational offerings. A number of national commissionsand authorities have sJggested that increased attention bebe givtn the adult learning process {how adults learn) and toprogram quality, especially in view of the changing character-istics of students now enrolling in these institutions.
These students have been variously described as the "new"student, the "non- traditional" student, or the "developmentallearner." ,They are homesakers,, middle-aged adults attendingclasses full time, Idults with ongoing careers and attending'asses part time, recent high school graduates unpreparedfor postsecondary education, and older adults.' In Accent onLearning, Patricia Crosk (1977)_ suggested that it is time togo beyond education for all -- toward education for each.'
Is the decade of the 1980s to be the decade of matura-tion in which these comprehensive institutions, attain evenhigher levels of excellence? Will leaders of these institu-tions meet the challenge of4change by enacting new policies;designink new, high quality educational programs; and devel-oping innovative educational practices? Although it is not
,possible to know in advance which directions these institu-tions will take in the 1980s, a more accurate prediction canbe made by examining some of the key issues that communitycollege leaders and policymakers are currently facing andlikely will face in the years ahead.
Some Key Issues
During the decade of the 1980s, community college lead-. ers are likely to encounter numerous issues that may impact
upon their institutionsrograms and services. However, atthe center of these concerns is a cluster of four, interre-lated, key issues that focus on (1) the nature of the "new"
1 Discussion of changing student characteristics and aconcern for quality services has been widespread. Authori-ties who have dealt with these subjects include. CarnegieCommission on Higher Education, The Open Door (New York:MoGraw-Hill, 1970);' K. Patricia Dross, Beyond the Open Door(Washington, D.C. Jossey-Bass, Inc., 1971); Terry O'Banion,Teachers for Tomorrow (Tucson University of Arizona Press;
. NUTTYlorence.B. Braver, "The Thirteenth Year," 01_51'11P,February, 197J); 32a-32d; J. Conrad Glass, Jr., and Richard/F. Harshberger, "The Full-Time Middle-Aged Adult Student in
4 I(

3
adult student, (2) the community college curriculum, (3) ac-
cess to educatlonal opportunity (socioeconoatic, academic,psychological, and geographic), and (4) the
andin-
stitution's responsibility in providing for and marketingeducational opportunities designed fafits service area.
4The "New" Adult Student
One of the major issues faciWg community college leaderin the 1980s will focus on the learners tbemselves;"Who are the students that will be serVed by these institu-tions in the 1980s?" and "How will the changing nature ofcommunity college clientele affect future administrative and
instructional proaesses?"
Forecasts suggest that the traditional college-age popu-lation will continue to decline during the next decade, with
a concomitant increase in older adult enrollments, as the"grayineof higher education" tales place (O'Keefe, 1977;McNamara, 1980). Studies of students enrolling in the two -
year institutions have docuMented the fact that these "new"students are older than the "traditional" college-age group,that, for the most part, they enroll on a part-time bas-iswhile bolding a full-time job (Shearon et al., 1976).
Authorities' in the field of adult education and develop-
mental psychology suggest that these mature adults, who nowmake up the majority of community college students, havecharacteristics that set them apart from the 18 to 22-year-
old college students. To design programs and support servicesthat meet the unique needs of this emergent clientele, commu-nity college administrators and faculty may need to work
under a different set 'clf assumptions about adult learners andthe teaching/learning process as it pertains to them.
Knowles (1978) posited four basic assumptions about thecharacteriStics of mature adults al learners which distinguish
them from younger students. F4ist, older adult students,typically, have a more independent self-concept than 4> the
younger,students. Second, older students have accumulated,more life experiences than have younger students., Third,
H gher Education," Journal of Heber Education, 45 (1974) ,
2 1-218; K. Patricia Cross, plc ins Non-Traditional Programs(' n Francisco: Jossey-Bass, Inc., 1974); John.E. Roueche and
Jerry J. Snow, Overc9m/a, Learning Problems (San Francisco:Jossey-Bass, Inc., 1977); K. Patricia Cross, Accent on Learn-lat (San Francisco: Jossey -Bass, Inc., 1977); Alexander W.Actin, Four_Critical Years (San Francisco: Jossey-Bass, Inc.,1978); E. J. Boone, R. W. 'Shearon, and E. R. White (eds.) ,
Serving Personal and Community Needs Through Adult Education
(San Francisco: Jossfy-Bass, Inc.,1980).
A

r4
these older adult. students have a readiness to learn that isbased upon a desire to undertake learning projects that helpthem face developmental tasks encountered as they move throughthe life cycle and enact changing soci roles, whereas de-velopmental tasks faced by young ad are primarily the re-sult of physiological and mental chap . Foartb, older adUltstudents undertake learning activi es to gain informationand skills which can pplied immediately to solving prob-lems encountered in dell 'living. Conversely, the youngergroup tends to 5e. more terested in learning subject matter.and to approach learning activities from a framework of pOst- .
poned application.
if the current trend of older -IrtNident enrollments con-tinues, then administrators and facultY members will find itnecessary to build such a developmental orientation into theirprogramming: As, Gleazer (1978, p. 16) in dicated,
. ,
. the community college needs to change to matchreality. In -reality, we deal with the seven develop-
, mental stages- -not just the first in the adult life.And as we look ahead, there is every reason to believethat the numbers of people in the later developmentalstages will increase. Planning should be based on thatpicture of the future.
Community ,college leaders may need to design programsand support services that reflect the developmental needs ofthese mature, adulj- clients. Change may be necessary through-out these institutions - -from the selection and preparation offaculty to the modification of instructional zones, to thescheduling of classes. The whole concept of student servicesmay need to be reoriented to the more mature, adult learnerwho has a family, )ob, and civic responsibilities. Indeed(Gleazer, 1978, p. 16),
. . . education, must be concurrent if it is to relateto -ithe learning needs generated by the tasks of eachdeiblopmental stage. Only) recently has education beenenvisioned as taking place at the same time as work orrecreation. More and more, studentship is concurrentwith the maintenance of work and citizenship roles andfamily respbasibilities.
_ \During the past decade, these institutions have. encour-
aged many mature adult learners to enroll in various programs.The central question is when and how polinymakers, adminis-trators, and faculty are going to face up to the faCt thatthe majority of their students will require thb development,of a ne1e set of assumptions and technologies for worki'hg withthe more mature, adult learner.

4
L. 1 5
The Curiculue
Another issuethat will confloont community college lead-
ers in-the 1980's centers around the comprehensive nature of
the programs offered by their institutions, "Should theseinstitutions continue to try to maintain comprehensive pro-
grams and support services, or should a more specialized pro-
gram and service emphasis be dev oped?"
During the initial stages olf the community college move-ment in this notion, these institutions tended to enroll amajocAty of their full-time students in the liberal arts cur-
riculum, However, with a odmmitment to "comprehensiveness,"durings.the 1960s the institutions undertook special efforts
designed to increase enrollments in the more occupation-
oriented programs. These efforts haVe been so successfu 'in
encouraging enrollments in occupation-oriented programs ver
'the past two decades that a new direclion appeas to hav
emerged for the community college, As Lombard}- (1978, p. 1)
wrote: "From .a predomlhantly baccalaureate-oriented insti-
tution, the community college has become an occupational
oriented-4stitution."\..
Over the past decade there has been an even more not ice -
able shaft to such an occupatio al orientation, along with\.emphasis upon conpensatory and c mm unity education programs.Indeed, it appears (Cohen and Loin 1979, p, 25) that
the college-transfer function "was a marked casualty in the
1970s." According to Lombardi (1979), the evidence is strong
that transfer ducat ion is no longer the principal function
of ommunity c leges.
While these enrollment, shifts reflect a 417a1 educational,
neeg, the new occupational orientation poses-several seriousqueltions,do community college leaders 'who are concerned
about retaining the cpmprehensiveness of their institutions.First, "Should a balance be maintained between curricular of-
ferings, or is the era of a-truly comprehensive institution Anearly over?" 'Second, "Is it still feasible to try, to be all
"-'1 things to to people, or should these institutions become
more unidimensional and single-purposed?" And, third, "Arethese institutions destined to become what Cohen and Lombardi(1979, p. 47) referred to as 'locally based career and com- 1 .
pensatory education centers'?" : . t.
In light of pressing social d economic realities,these-and similar questions mustti5e faced by community col-
lege leaders in the 1980s, The resolution of this dilemmamay bring about a new coveitment or a rqdeTinition of the"comprehensiveness" of the community college. However This
issue is dealt with, it will have tremendoms impactfupon the
community college movement throughout the 1980s--anst beyond.,
67/yr 9

Ati 6
(
Access to Educational Opportunities
Another issue facing comprehensiv6',community colleges inthe years ahead relates to their egalitarian philosophy andthe degree-to which these institutions will be able to pro-vide equal educatiOnal opportunities, "Will ,these institu-tions be capable of providing equal educational opportunity.to all who are eligible to attend, or is tbii notion whatCohen (1977) called simply 'a so 1 equalization fantasy'?"At the heart of this issue is concern for educational acces-sibility in terms of socioeconomic, academic, psychological.,and geographic factors.
Socioeconomic factors associated with educational acces-sibility have long been of interest to social scientdsts, andduring the 1970s e community college movement came underattack because its alleged relationship to the Americanclass str ure. Numerous critics attacked the communitycolle- s, alleging that these institutions were perpetuatingthe existing class structure by utilizing a social class-based trackinle system in Which students of high-status back-grounds were being encouraged to enroll'in high-status pro-grams and Dice versa. Trills, adult learners were being ---channeled into the same relative positions as in the socialstructure from whence they came (Karabel, 1974; Zwerling and
r Park, 1974) . Research findings in this area are inconclusivebut the evidence suggests that a relationship does exist be-tween adult learners' socioeconomic status and curriculum
,teack placement,3 an implication that raises serious ques-. . Lion's about community colleges' efforts, to .live up to theiregalitarian philosophy, It has been suggested that one indi-cator of a societal movement having reached a certain levelof maturity is when a significant number of critical thinkersbegin to question the basic tenets of the particular move-ment (Vaughan, 1979). If this is the case, perhaps it istime that community college leaders begin to examine thesecriticisms from a positive viewpoint so that the true -rela-tionship between the community college and existing socialprocessps will be completely understood.
Cdupled.with this issue is concern for academic accent-bility% Selective program requirements may indicate admis-sionA. policies that deny en adult learner the chance to com-plete a desired program of stud because he/she lacks certainattractive academic characteristics, Under such selectivepolicies, many' of these adults who are capable of completing
2 Robert G. Templin, Jr., and Ronald W. Shearon, "Channel-ingStudents Into Curricula: An Examination of Tracking in thecommunity College," Questioning the Cominity College: New Di-rectiops for Community Colleges, ed. George E,Vaughanpreparation),

7
the program may be rejected. Although other applicants foradmission may have more impressive credentials, high schoolgrade-point averages and standardized test scores may not bevalid indicators of potential success for the highly moti-
vatedadUlt.4 This is particularly true in technical pro-grams where "reverse transfer" student§ of higher socioeco-nomic origins are competing with thOse who may not have out-staliding academic credentials--yet, are capable of completing
the programs. Such policies make program admission very dif-
ficult for adult lea ers who might view the communitycollege as their on hope for social mobility.
Psychologiell accessibility is another concern to befaced by community college leaders in the years ahead. For
those individuals who need educational activity, yet lack thenecessary affective characteristics for enrollment, institu-
tions might consider designing marketing efforts that makeprograms relevant and meaningful for them. Additional ef-fortS'alight be necessary to attract those individuals who mayhave an educational need but whose prior educational experi-ences have resulted in unfavorable attitudes toward learning.It also may become necessary to concentrate more on makingprograms attractive to those students who consider the commu-
nity college a poor substriut, for some othsi forms of post-
secondary education. Through consumer ana sis and differen-tiated marketing techniques, psychological access barriers
can be broken, thus allowing previously inaccessible publics,to become relevant target groups for programmi4Offorts.
With rising energy costs and associated transportationcurtailment, geo aphic accessibility will become a criticalconcern to fa ed by community college leaders. Institu-
tions may fin t necessary to "take the educationto thepeople," or at least to find new techniques for making educa-
tional programs available to all adults who desire. to con-
tinue their education. Many new and innovative technOlogicaldelivery systems already have been developed that utilizetelevision, newspapers, and the telephone (Luskin and Zige-rell; 1978; Stewart and Duffy, 1979; Colburn, 1980). udents
who no longer can afford to travel to the main campus t-
tend classes will benefit most from the use 'Of such to
logical innovations.
The foregoirig emphasizes the importance offering pro-
grams in "non - traditional" educational settin such assatellite centers, the work place, and other off-campus sites.
Geographic accessibility will become a greater factor in theequal educational opportunity issue in the coming years, as
;allure to provide an increasing number of these non-traditiOnal delivery modes will exclude first Ahose.who might
benefit most from the opportunity.
4lbid.

8q
Therefore, it seems imperative that these four interre-lated accessibility factors -- socioeconomic, academic, psycho-logical, and geographic--be examined carefully if the insti-tutions are to provide the equality of educational opportunitywhich lies at the core of the egalitarian philosophy. Suchan examination is essential if community colleges are to moveforthrightly into the decade of the 1980s.
The Institutions' Responsibility inEducational Market ing
A critical assure facing community college leaders in the1980s focuses on the concept of "educational marketing.' Spe-cifi-cally, "To what degree should these institutions activelyengage in a marketing approach to educational management?"Within the past decade there has been growing emphasis withinthe community colleges, and higher education in general, o)the utilization of-selected tyo14, and techniques, first de-velopea by profit-oriented orgarlizations, to manage educa-tional services or ''products,"
Many writers argue that adopting a marketing approach toeducational management is essential ,for institutional sur-vival because of the high level of competition that now ex-ists among all postsecondary educational institutions. This
\ competition has,,created a "buyer's market" and, in its wake,alfl of these institutions are scrambling to secure their pro-portional share of that market. Advocates of the eduCationalmarketing approach emphasize the need to adopt a consumerorientation in which the educational product is examined interms of -its retail dimensions: quality, variety,, location,and t Jae (Comfort, 1978) .
The importabt question .is whether community college lead-ers want to become involved in such a marketing approach, al-though it can be argued that, in their efforts to attract non-traditional adul students, community college educators havelong been using any of the same methods and techniques ofmarketing used profit-making agencies.
The notion of a designated marketing management approachby postsecondary educational institutions seems to be counterto the current "ttitudes of many community college administra-tors; in facti tapy consider it unethical, In his book,Marketing for Nonprofit Organizations, Kotler (1975) identi-fied three reasons why use of the marketing approach in non-profit organizations often is con,sidered unethical. First isthe common belief that a clOmprehensive marketing plan'addsunnecessarily to the cost of iniiitutioQa1 operations. In anera of tight budgets and financial accountability, such costamay be viewed as. wastefnl. Second, it is argued that market-ing research activity is used to pry into the private lives

9
of those.wh91 live within the Institution's service area,'Third, marketing typically is considered to be a mechanismthrough which the target population can be. manipulated.Clearly, Chese ethical issues must be dealt with before commu-nity colleges can successfully implement a marketing manage-ment approach.
Community college leaders also must justify undertakingsuch a purposeful marketing approach, It may be argued thatsuch efforts will develop a greater public awareness and.pro-vide greater consumer satisfaction, since the emphasl.s is onthe precise identification Of the needs of specific targetgroups, Thiwarketing approach described herein utilizesdata-based information for 'decision-making; through its Useinstitutions may be able to operate with greater efficiency
Vavrek (1975) maintained that the functions and proc-eises in a marketing thanagement model can help institutionsbecos.e even more service-oriented and in the "people busi-ness," As a result of continuing iriflation, increased com-petition for enrollments, and the expansion of financial aidprograms, the student is becoming a powerful consumer of edu-cational programs, Community college leaders may be facedwith the prospect of implementing an educaticrnal manasementmodel which provides programs that effectively meet -the con-stantly changing needs of relevant target groups.
Whether or not they are, aware of it, most communitycolleges already.are using many sound marketing strategiesin their daily operations. As keim;(1979, p. 10) wrote.
We already know about marketing; allwe really needto do is apply our good sense to some basic princi-ples and work the territory, just as We always have,There is no magic to marketing
Apparently, the critical issue is not whether to market ornot to market, but how purposefully marketing principles areto be applied, I
Although, there are other issues to be faced ty admin-istrators and pcilicymakers of two-year, postsecondary educa-tional institutions, the four identified above may be ofcritical importance in the .coming decade; 1,e,, (1) "How willthese institutions respond to the changing nature of the com-munity college student?" (2) "Can these institutions continueto be all things to all people?" (3) "Will these institutionsremain committed to their egalitarian philosophy?" and (4)"Will events in the 1980s' create a need for a purposive mar-keting approach to community college management?"
I)

1
10
To make sound kolicy decisions that will speak to thesecritical issues and guide the community college tfitough the1980s, community college leaders will need to develop andmaintain a Current- and 'accurate' information base on the na-ture of these institutions,' and particulasly on the clienteleenrolling therein. Perhaps even, more imptrtant is the chal-ledge to make the necessary changes, in policies, programs,and educational practices based on informition about who isbeing served by these institutions and in'what ways,
The problem
`With the major goals of excellence in educational pro-grams and comprehensive learnin opportunities, the renewedemkhasis on accountability, and the diverse and"changingadult student population, there is, a greater need than everbefore to assess student characteristics on a regular andcont inuing basis
Detailed knowledge of ,the demographic, socioeconomic,academic, and attendance characteristics of its enrollees isof utmost importance to the North Carolina Community CollegeSystem.as it strives to provide excellence in programs andcomprehensive learning opportunities for the State's adultovulation In ongoing efforts to generate this essentialinfprmation,4three major studies of NCCCS srtudents have beenconduCted in the past decade. In 1968, Bolick (1969) devel-oped a socioeconomic prof ile of 10,184 cre dit students en-rolled in 4 institutions Phillips. (1970) 1969 study pro-vided data on 9,549 noncredit or .continuing education adultlearners Shearon, Templin, and Daniel (1976) coYlected andanalyzed information from 10,074 credit and,noncred1t stu-dents during th,e spring of 1974 The findings of these threestudies provided ample evidence of considerable diversityamong the students enrolled in the NCCCS and that studentcharacteristics change over time. The major purpose of thepre-tent study was to help facilitate tilt updating of infor-mation about NCCCS enrollees through a systematic gathering,and analysts of. data on the 1979 ,eprol lees in the NCCCS,
ectives
The specifINDtjectives of this study were to'
1, Develop 'distinguMing profiles of currently en-rolled adult' learners in terms of program. axe in which'enrolled (curriculum or continuing education) and selecteddemographic. socioecondrdic, academic, and attendance charac-teristics

if It2. , Develop subprof iles of currently enrolled adult
learners in terms of prograp, in which enrolled (college-transfer, general education, special credit, technical, vo-cational, academic extension, fundamental education, or oc-cupational extension) and selected demographic, socioeconomicacademic, and attendance Characteristict.
3. Determine curriculum and continuing education stu-dents' value orientation toward education and the institu-tional characteristics that influenced them to attend,
4. Determine recruitment strategies that were thesource of greatest influence in curriculum and continuingeducation students' decisions to attend and were the sourcesof first information regarding the program in which they en-rolled.
5 Provide demographic an socioeconomic profiles ofNorth Carolina's projected 1979 adult population (18 years ofage or older), to serve as a basis. for comparison with the1979 curricula And continuing education student population
..-6 Replicate and update data from the 1968, 1969, and
1974 studies of curriculum and continuing education studentsenrolled in the NCCCS for the purpose of detecting changes instudent proftle-
7, Determine curriculum and continuing education stu-dents' evaluition of support services offered by the institu-..tions and which of these services are the most important tothe students
8. Deters/the curriculum and continuing edictt-ion stu-dents' ,opinions of what standard name shouldibe uged for allNCCCS institutions and their feeling8 regarding the useof astandard name.
9. Analyze and summari2e relationships ietween educa-tional program area in which enrolled and selected demo-graphic, socioeconomic, academic, and attendance character-istics of students enrolled in 1979.
1Research Questions
Research questions formulated to guide the collection ofdata and the development of descriptive profiles of adultlearners enrolled in the NCCCS, 1979, were the following.9
1. Who are the .students being served by the NCCCS interms of pf.bgram area in which enrolled (curriculum or con-tinuing education) ; selected demographic, socioeconomic,
t
\\---r".1r

12
academic, and attendance characteristics; and institutionalcharacteristics that influenced,,them to attend9
2. Which students and enrolling in what educationalprograms9
3. What is the proportion of students enrolled in theNCCCS as compared to the proportion of the State's projected1979 adult population who are eligible to enrdll, in termsof selected demographic and socioeconomic characteristdcs?
4. What adult population group(s) is/are'not beingserved by the NCCCS in terms of selected demographio andsocioeconomic' characteristics? '
_5. What changes have occurred, in the pp:Aires of NCCCSstudents dur1ng the past 5 and 10 yekrs, respectively9
6. Which student's in what educational program areaswould least likely continue their education were it not forthe existence of these institutions, in terms of selecteddemographic and socioeconomic characteristics?
7.. Which students in what educational program areaswould be least likely to attend one of these institutions asthe distance traveled to class incrases9
8. Which students in what educational program areaswould be least likely to attend °Cie of these Institutions astheir first dhoice over other forms of postsecondary educa- _
tion9
9. What forms of recruitment strategies inflyrenced stu-dents in different wOucatimpal program areas to attend theseinstitutions and'served as the first source of informationabout the program in which they enrolled?
10. Which curriculum students in what programs are to -.ceiving financial aid and what are the sources and amounts ofthat aid in terms of selected demographic and socioeconomiccharacteristics?
Il. Which students in what educatiCal program areas areem.kl.spiad and to what' extent? .
1?: (111114b students in what educational program areasplan to work toward a four-year college degree?
13, Which students in what educational program areasplan to work in North Carolina following the completion oftheir educational programs?

13
14. What are the students' value orientations toward ed-ucation as related to educational program area and selecteddemographic and socioeconomic characteristics?
15. What institutional characteristics most influencedstudents to attend these institutions as related to educUretional program area and selected demographic and socioeconomiccharacteristics?
16. Row do curriculum and continuing education studentsrate support services offered by their institutions and whichof these services do they consider to_be imp ant",
17. What are curriculum and continuing educe ion stu-dents' opinions of and feelings about the use of a tandardname for all NCCCS institutions')
Lefinition of Terms
The following terms, used throughout this report aredefined and included here ' for clarity in presentation of the,study findings.
.
academic characteristics the academic characteristicsexamined. in this study were (1) prior full time enrollmentin a four-year college/university, (2) GEL score, (3) highschool grade average, and (4) high school rank
Academic extension' those educational activities, of-fered on a noncredit basis, which are designed to provideenrichment in the areas of the humanities, philosophy,mathematics, politics, and the social sciences
Attendance characteristics attendance characteristicsselected for 4kudy were: (1) program in which enrolled, (2)
time of class attendance, (3) location of classes, (4) boursin class/week, (5) classes this quarter, (6) distance to class,
(7) trips to r1,1,-,s/week, (8) nun.ber of quarter,-, enrolled, (9)
would have attended another institution had this one not ex-isted, (10) this institution first choice, (11) source of in-fluence to attend, (12) source of first information aboutprogram, '(13) sources of income, (14) sources of financialaid, (15) amount of financial aid, (16) cost of books andsupplies, (17) rent while attending, (18) plans to enroll ina degree program, (19) plans for a four-year college degree,and (20) employment plans after completing educartional pro-gram.
College-transfer" those educational activities forwhich course credit is given and which the student who trans-fers to a four-year college/university can substitute for/thefirst two years of credit toward a four-year college degree,

14
During the two years at. the community college, the studentreceives a general education in English, mathematics, human-ities, science, and social science, The program culminatesin a two-year Associate in Arts, Associate in Fine Arts; orAssociate in Science degree.
Community college: a two-year, public, postsecondaryeducational institution, operating under the provisiOns ofChapter 1.15-D of the North Carolina Generil Statutes, whichoffers (1) freshman and sophomore courses of a college ofarts and sciences; (2) courses in general. adult education;(3) organized credit courses for the training of technicians;and (4) technical, vocational, and trade speciality courses.
Continuing education program area: refers to all non-credit educational activities offered in a community/techni-cal college or technical institute, i.e,, academic extension,fundamental education, occupational extension, and recreationextension programs.
Curriculum program area refers to all .educational ac-tivities for which course credit is given in a community/technical college or technical institute, ie, college-transfer, general education, special credit, technical, andvocational programs,
Demographic characteristics the selected deiographiccharacteristics examined in this study were. (1) age, (2)
sex, (3) race, (4) marital status, (5) vVran status, (6)
residency, (7) location of institution, a d 8) residence
while enrolled.
Fundamental education: those noncredit educational ac-tivities desitned to provide adult learners with an elemen-tary and secondary education, ie., adult basic education(ABE), adult high school, and general educational development(GED) programs
General education those educational activities, forwhich course given, that are designed for adultswho wish to broaden their education, with emphasis on per-
sonal interest, growth, and development. Such programs mayinvolve a cluster of general education coursesfrom-one or
,more disciplines, 30 to 40 quarter -hours of -general educationand interest courses culminating in a General Education Cer-tificate, or 96 quarter-hours of general,,ed'ucation and inter-est courses culminating in an Associate in General Educationdegree.
Institutional characteristics as used in this study,include. (1) educational programs or courses available, (2)
financial assistance available, (3) job placement services,(4) location .(nearness to the student 's work or home) , (5)
low cost, (6) open-door admissions policy, (7) qutelity of
'4U'

15
instruction, (g) student-centered instruction and activities,and (9) " ot her" to be specified.
North Carolina Community College System: The system of58 pub-community colleges, technical colleges, and techni-cal institutes which is under the administration of the-NorthCarolina Department of C unity Colleges and the State Boardof Community ges as de ed in Chapter 115-D,of theNorth Caroli Ge eral Statute. .5 The constituent members ofthe North Caro Community liege System offer one-yearand two-year college programs leading to a degree or diploma,and noncredit c tinuing education programs leading to a cer-tificate, the ',Institutions are nonresident, multipurpose,and community-centered,
Occupational extension: those noncredit educational ac-tivities in the areas of technical occupations, agriculture,distribution/marketing, home economics, health and safety,off ice, and trades/industry' which are designed to upgradepersons in their jobs -- either help develop new skills,become more proficient in their voc ns, or train them foran occupation.
Primary income' students were asked if their parentsprovided more than one-half of their support; if the answerwas positive, the parents' 1978 income was considered as pri-mary; if the answer was negative, the student's 1978 incomewas considered as primary, _/
Rank order an ordinal ranking procedure that utilizessome criterion or criteria on which ranks are based. Rank-ordering thus assigns numbers to objects or variables andarranges them in numerical order.
Socioeconomic characteristics in this study refers to(1) student's education, (2) father's education, (3) mother'seducation, (4) head-of-household, (5) student's income, (6)
parents' income, (7) primary income, and (8) occupation head-of -househol d.
Special credit a category of students who are enrolledin educational activities for which course credit is given,but who are designated as not being officially in a degree,diploma, or certificate program.
5/tt the time the survey was conducted rspring, 1979) ,
the North Carolina Community College System consisted of 57member institutions, the title "technical college" had notcome into usage, and the Community College System was admin-istered by the Department 'of Community Colleges,,and the StateBoard of Education.

16
Technical institute (college) a two-year, public, post-secondary educational institution, operating under the provi-sions of Chapter 115-D of the. North Carolina General Statutes,which offers (1) courses in'general adult education, (2) or-ganized spec ial credit courses for train ing technicians, and(3) technical, vocational, and trade speciality courses.
Technical program: all educational activities, gener-ally two years in length, .which. are given for course creditat a community/technrcal college oa technical institute, aredesigned to prepare students for.eRAy-level jobs- in occupa-tions recognized as paraprofessional, and which lead to anAssociate in Applied Science degree.
Value orientation toward education: reasons studentsgive for continuing their education. The choicei used inthis study were: (1) to be able to contribute more to so-ciety, (2) to be able to earn more money, (3) to become morecultured, (4) to gain a general education, (5) to get a bet-ter job, (6) to improve my reading and study skills, (7) to
improve my social life, (8) to learn more things of interest,(9, to meet interesting people, (10) parents (or spouse) wantme to go, and (11, then was nothing better to do.
Vocational program all educational activities, rangingfrom one to four quarters in length, which are given forcourse credit at a community/technical college or technicalinstitute, are designed to train students for entrance intoa skilled occupation, and which Lead to a certificate or-ad iploma

CRAPTEFC/2I
METHODOLOGY
Factors considered in this discussion of tical procedures followed in this study of etudein the North Carolina CommAnity College System,(1) the research design, (2) the population, (3design, (4) the procedure used in constructingframe, (5) the selection and training -of institordinators, (6) the population sample used in t
construction of the survey instrument, (8) Vie-
Lion ,prhcess, (9) procedures used in analyzinglected, and (10) limitations of the study.
4-/-4Research Design
17
he methodolog-nts enrolled1979, were:
) the samplethe samplingutional co--he study, (7)
collec-th data col-
The cross-sectional survey research design selected for
use in the study was considered to be appropriate for col-lecting standardized descriptive and associational informa-
tion from a predetermined population at a specific point in
time (Sorg and Goll, 1976). This type 0 research designalso Is called "descriptive" (Hillway, 1964), Such survey de-
signs are practical for identifying trends:, current condi-tions, ardl potential needs, as well as providing information
on which administrative decisions can be based (Hillway,1964; Bouly, 1970). Survey data can be used to discusssingle variables or to look at complex relationships between
two or more variables (Borg and Goll, 1976).
Population
The study population consisted of all students enrolledin the North Carolina Community College System during theseventh and eighth weeks of the spring quarter of 1979. Be-
cause actual headcount was not available at the time, numbersand procedures provided by the Management Information ServicesDivision, North Carolina Department of Community Colleges,were used to project a total enrollment of 258,431 students,Actual unduplicated headcount enrollment, for the spring quar-ter, 1979, was 236,720 students.
Sample Design
the size of the study population dictated the use of asample rather than a complete census 4 students. In col-laboration with Charles H: Proctor, Professor of Statistics,North Carolina State University, ihd R. David Mustian, Pro-fessor of Sociology, North Carolina State University, a
f3"tJ

40
stratified systematic cluster sample design was selected asthe most appropriate and efficient design for this particu-lar study.
The sample was stratified to represent two identifiablesubpopulations, or strata, within the total student popula-lationstudents enrolled in the curriculum program area andstudents enrolled in the continuing education program area.Each subpopulation was proportionately represented in thesample. In this ,way, stratified sampling guards against wildsamples and assures that subpopulations of interest will notbe overlooked.
In systematic sampling, one randomly selects the firstelement and thereafter draws every "kt-h" element in the sam-pling fragile. For example, a systematic sample of. 10% of thenames in a telephone directory would begin by selecting onename and then choosing every tenth name thereafter. A sys-'tematic sample is more' frequently spread' uniformly over apopulation and can thus, provide more Information than asimple random sample might. Systematic sampling also is rel-atively easy to use and provides a great deal of informationper unit cost. Because each institution involved in thestudy drew its own sample of students, it was important toselect a sampling method that could be easily standardized. .
Practical Considerationssampling. In this procedure tter -- contains two or more popeis useful when the populationhere the unit of selection, ordividual class. Institutionalily accessible, Whereas it wousample individual students.
also led to the use of clusterhe unit of selection'the clus-lation units. Cluster samplingis naturally groupid into'units;cluster, was the intact, in-procedures make classes read-Id be virtually impossible to
Construction of thT Sampling Frame
Several factors entered into the decisions about thesize of the sample and the manner in which it was to be drawn,These includefil (1) a deire to provide each participating in-stitution w *th a reliable pEofile of its student body while de-veloping statellide informitRon; (2) the need to draw the sam-ple at a compatable point in time at e h institation; and .
.(3) the need for minimal disruption, normal academicactivities.
Using the aforementioned information supplied by the De-partment of Community Colleges, the research,feam calculatedenrollment projections for the spring quarter, 1979, for eachof the 57 institutions in the NCCCIS. A sample size that tookinto account the effects of stratified cluster sampling was

fi Q.
0 $ 19
developed for each institution. Thus, every sample reflectedthe size of the institution and provided each with infooleilLt ion 'as precise as that for the other institutions. The in-diyidual -instit-utional samples were summed for a desired sys-temwide sample of 20,038 students (see Appendix A).
sample fraime within each inatitut.ion consisted of alist ofd all classes being offered during the, seventh ande \weeks of the 'spring quarter', 1979 All Curriculum
ogram, area classes in operat iorrwere listed first, followedby listing all continuingf.education progr,iwn area classes,The saMple populat n was stratifie.d into 'these two m ,forprogram areas; s ing unitsfor the study were inta t, #1-dividual classes
Participation of Institutional Coordinators
The president:of each of the 57 community/technical col-leges and technical., institutes responded affirmatively to aletter inviting his/her institution to participate in thestudy, and in responding designated an institutional coordi-nitor for cbat institutiona The coordinators were to be re-sponsible for constructinggrthe institution's sampling frame,drawing ,the sample, orienting instructors
-s
to the study, admin-istering the survey in theit institution, co'lecting the Com-pleted survey instruments, and returning them to the projectstaff_ Their efforts and professional skills proved to beinvaluable to the success of the survey. A list of the insti-tutional coordinators who participated in the survey appearsin Ajapend ix B.
0
Institutional C,dordinatot Workshops0
To assure uniformity of procedures throughout the par-ticipating institutions, seven regional workshops were heldfor institutional coordinators. The workshops were de-2s-fg 1) to familiarize the coordinators with the purposeo.f.t Ludy and the potential uses of the survey data, (2)
to gain,e^x2pertence in drawing institutional samples, and (3)to discI " at gies for conducting the survey at their re- \spective stituiions. Standardized procedures were enhancedby providin-rvacji institutional coordinator with a detailed'coordinatorts handbook, requesting and checking ,copies oftheir institutional sampling frames, and maintaining contactthrough frequent telephone conversations and occasional sitevisits A precise description of how the samples were drawnappears in Appendix C.
.4

*IP
20
Actual Sample
As stated earlier, all 57 institutions in the NCCCS pir-ticipated in the survey. The total desired sample size was20,028 students 'however, 19,829 survey instruments were ac-tually administered. Of,that number, a total of L6,408 us-able instruments were returned. Response rates within each._institution were based upon actual sample size and ranged aifrom 59% to 99%, for a mean response rate of 82%. The pro-cedures used in calculating response rates and the responserote for, each institution are prebented in Appendix D.
Instrumentation
The 48-item survey instrument was basically a replica-tion and expansion of the instrument used in the 1974 surveyof NCCCS students conducted by Shearon, Temp lin, and Daniel(1976). The 1979 research instrument was pretested with 161students at three institutions, A port ion of, the pretest4roup were interviewed a week later to check the reliabilityof the instrument. Pretesting was primarily concerned withthe proposed use of an optical scan format for scoring the
. survey instrument. Other than minor rewording of a few ques-tions, the results of the pretest indicated no major diffi-culties. A more detailed discussion of the pretest resultsis presented in Appendix E.
Because the instrument was so constructed that the re-spondent received instructions to answer every question, itwas possible to compute the number of nonresponses and inap-propriate multiple responses to a single question. Over 90%of the respondents answered all questions except the threethat asked for GED score, parents' income, and evaluation pfinstitutional support services. As an additional chebk onreliability, algorithms were constructed to identify conflict-ing 'responses to different questions; for example, a case inwAich a respondent might report a grammar school educatipn inowe question and, in response to a Later quest ion in the in-strument, might indicate havigg a baccaraureate.,Inconsis-'tent responses showed that 11% of the continuing education-idents iridicateil that they were receiving financial aid,Wegumably because they confused institutional financial aidwith other formsof assistance, A complete report/ of the re-'iability checks on the survey instrument responses appearsin #ppendix E. A copy of the final survey instrument appearsin Appendix F.
Data Collect ion
During the seventh and eighth weeks of the spring quar-ter, 1979, institutional coordinators drew the samples of
el "

few
21
4, classes for their institutions, distributed the survey instru-- Rents to the instructors of the classes used in the study sam-
ple, collected the completed instruments, and returned themto the project'staff. In most cases instructors administeredthe instruments to their students; in a few instances thisresponsibility was assumed by other staff members.
Data Analysis
When the completed survey instruments were received bythe ptoject staff at North Carolina State University, theywere checked by hand for stray marks and responses thatcould not be registered by the optical scanning equipment.The edited instruments than were taken to the National Test-ing Service Corporation, Durham, North Carolina, where theywere machine scanned a d the data were transferred to com-puter discs.
Because intact classe were the ultimate samplin unitsin thk study, a student's Probability of being included inthe 'Wavle depended upon the umber of classes in which he/she wps enrolled. To prevent stortion in the findings thatWrould.result from these unequal obabilities, each individu-al's responses were weighted by a cedure based on the num-ber of classes in which he/she was enrclled (see Appendix G,Weighting Procedures*: This weighting raacedure assured thatstudents enrolled in five classes, for example, would not havefive times the, -impact" of students enrolled in a singleclass.
Because of the great variation in enrollMents at the 57institutions, an additional weighting procedure was used whenthe institutional data were pooled for the statewide sample,In this weighting procedUre, which was based on institutional
' enrollment, the data were adjusted so that each institutionFcontributed an &Mount of information to the total state en-ollment proportional to the liercentage of those students itactually represented, The institutional weighting process
_is described in Appendix G.
After subjection to the two weighting procedures, the ,
sample information generally fell within one percentage point ,of the actual population parameters for the spring quarter,1979, as presented in later institutional reports to the *De-partment of Community Colleges.
Tables were constructed to show dis-tributions and unweighted frequencies of all v riables in thestudy as related to the broad educational program areas ofcurriculum and continuing education and to the general pro-grams within each. of these program areas. Curriculum pro-grams were: (1) college-transfer, (2) general education,
6

22
(3) special credit, (4) technical', and (5) vocatipnal. Con-_ tinuing education programs were: (1) academic extension,
(2) fundamental eduCation, (3) occupational extension, and(4) recreation extension./
The only data subjected to statistical testing dealtwith the comparisons of the sample population with the pro-jected'1973 North Carolina adultpopulation, The chi-squaregoodness-of-fit test was used to reveal statistically signif-icant differences (.05 level of probability) that might existbetween the proportion of responses due to factors other thanchance,
Limitations
Five major limitations to the survey' data must be con-sidered,when interpreting the findings of this study. Themost i$ortant linqtation is that the sample was collected atone point in trace during the sprf quarter, 1979. Whilecurriculum classes generally are 11 quarter in length,continuing education classes tend be of shorter durationand to begin at cliff rent times ng the quarter, Conse-
g quarter, 1979, continuing educe-included the sampling frame, andhow rePwentarive were the contin-
udents WITS, ere enrol le ring theof that quarter,
self-report. Pretestingrevealetto m erstand the questions orit res oneei, but the pbssibility
quently, all of ,sprint ion classes could not, bethere was no way ,,t6t, jUdgeuing echication prograir stseventh and eighth, weeks
Tee survey re.it141 onno tendcy for s deltasmisreprtsene.nt f s tin themust be ;allowed,
,
Thet w I de rto 99%) Could intst itut fop ha cl, some, reasotypes of classesAgain, tikanswerednot posfible, f9x7examfailed to report pareValof the total group, dr'
st rates among institutions ,,(59%if students within a given in-
for.not responding or` if Certainmatically omitted-from the sample,also. could introduce bias; it is
, to tell whether students whoincome.:Were a representative sample
Comparisons between the student population' and the gen-eral adult population of North Carolina must be considered' astentative becausa4they We based upon projections of NorthCarolina adult population parameters for 1979. These projec-tions/were made by R. David ilustian, Professor of Sociokogy,North Carolina State University, on the. basis of 1970 U7 S.Census data, and are estimates rather than obserVels1 lues.
'Although included in the survey instrument, recre Ilionextension, program data were not analyzed because of the smallnumber of responden'hts in that program.
el;;
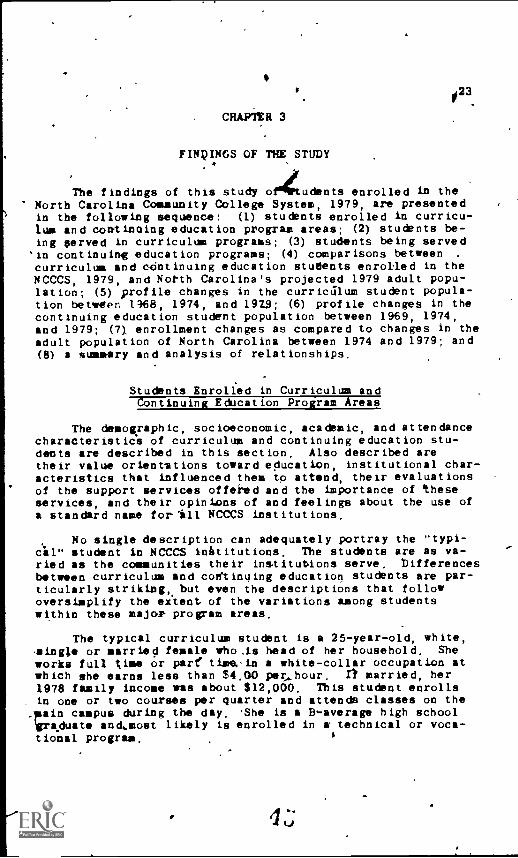
CHAPTER 3
FINDINGS OF THE STUDY
23.
The findings of this study ort udents enrolled in theNorth Carolina Community College System, 1979, are presentedin the following sequence: (1) students enrolled in curricu-lum and continuing education program areas; (2) students be-ing served in curriculum programs; (3) students being served
'in continuing education programs; (4) comparisons betweencurriculum and continuing education students enrolled in theNCCCS, 1979, and North Carolina's projected 1979 adult popu-lation; (5) profile changes in the curriculum student popula-tion between 1968, 1974, and 1929; (6) profile changes in thecontinuing education student population between 1969, 1974,and 1979; (7), enrollment changes as compared to changes in theadult population of North Carolina between 1974 and 1979; and(8) a summary and analysis of relationships.
Students Enrolled in Curriculum andContinuing Education Program Areas
The demographic, socioeconomic, academic, and attendancecharacteristics of curriculum and continuing education stu-dents are described in this section. Also described aretheir value orientations toward education, institutional char-acteristics that influenced them to attend, their evaluationsof the support services offered and the importance of 'theseservices, and their opinions of and feelings about the use ofa standard name for "ill NCCCS institutions.
No single description can adequately portray the "typi-cal" student in NCCCS institutions. The students are as va-ried as the communities their institutions serve. Differencesbetween curriculum and continuing education students are par-ticularly striking, but even the descriptions that followoversimplify the extent of the variations among studentswithin these major- program areas.
The typical curriculum student is a 25-year-old, white,-single or married female who .is head of her household. Sheworks full time or part' tine in a white-collar occupation atwhich she earns less than $4.00 per...hour. n married, her1978 family income was about $12,000. This student enrollsin one or two courses per quarter and attends classes on the
Amain campus during the day. She is a B,-average high schoolgraduate and..most likely is enrolled in a technical or voca-tional program.

24
The typical continuing education student is even moredifficult to describe since the noncredit course category caninclude the professional following a specific academic inter-est, the retiree seeking a second career, or the an or womanwho is learning basic literacy skills. The typical continu-
' ing education s cient most likely is a 38-year-old, married,-white female wh gives with her spouse, Rer 1978 'family in-
' come was between 310,000 hnd $12,000. She is a high schoolgraduate whose parents have less than an eighth-grade educa-''tion. This continuing education student is very likely to beenrolled in an occupational extension program, attending oneclass a week in the evening'at an off-campus site, She isemployed full time.
Demographic Characteristics
Demographic characteristics observed were (1) age, (2)sex, (3) race, (4) marital status, (5) veteran status, (6)North Carolina residency, (7) location of institution, and .
(8) residence while enrolled. Weighted percentage distribu-tions of curriculum and continuing education students by age,sex, race, marital stalk's, and veteran status appear inTable 1.
Age
Curriculum students were much younger than continuingeducation students, with 87% of the former as compared to 52%of the latter reporting that they were under 40 years of age,Median ages for the two groups were 25 and 38, respectively,Furthe'r analysis revealed that median ages for curriculum .
students ranged from 22 for college-transfer students +to 31for social credit studentp. For the continuing 'educationgrou , this range was from 28 for fundamental education stu-dents to 44 for academic extension students,
Sex and Race
Although males and females participated almost equallyin curriculum programs, over 70% of the continuing education-students were fenrales. Three out of four students were white,and virtually all students in the nonwhite cateury wereblack, Racial groups appeared to be distributedequally be-tween curriculum and continuing education program areas,
Mar ital Status
In keeping with the foregoing age differences, the typi-cal curriculum student was as likely to be single or engaged
IC

Table 1
25
Weighted percentage distributidn of curriculum. andcontinuing education students enrolled in theNorth Carolina Community College System, 1979, byage, sex, race, marital status, and veteran status
/-
variableStudentsa
ContinuingCurriculum education
Age, yr22 or less23-2930-3940-4950;-59
60 -6 9
70 or moreTotal
SexMaleFemale
Total
RaceBlackAmerican IndianWhiteAsiantither
Total
39.128 019.98 32 7
1.80,3
100 1
(11,774)
46 453,6
100 0(11,835)
20 91 7
76 5
0 5
0,7100.0
-(11,743)
13,118 5
20 513 3
12,711.010,9
100 0(4327)
28.871,2
100 0(4384)
20 81 8
76 80 20,4
100.0(4320)
Marital status:Single or engaged 45.0 18 0Married 45.1 61 5
Widowed 1 5 13.3Separated 3 5 2 8Divorced 4,8 4,4
Total 100.0 100.0(11,822) (4371)
Military veteran. If
Yes 24 9 10.1No 75,1 89,9
Total 100 0 100.0(11,810) (4341)
aNumbers in parentheses in this and subsequent tablesrepresent the total number of persons responding in the re-spective category.
4
/
.

26 0111111M14
as married, while three out of five of the continuing educa-tion students were married.
Veteran Status
One-fOurtb of the curriculum students and one-tenth ofthe continuing education students were military veterans.Even when sex distributions were taken into account, palesin curriculum programs still were more likely to be veteransthan were males in continuing education programs.
Residency. Location of Institution,and Residence While Enrolled
The weighted percentage dist(ibutions of curriculum andcontinuing education students, by the demographic character-istics of residency, location of institution, and residence
'while enrolled appear in Table 2.
A4
arge majority of the respondents were North Carolina
reside s. Continuing education students were somewhat lesslikely han their curriculum counterparts to commute to classfrom a county outside that in which tftir institution is lo-cated. Although thrre-fourths of the. curriculum studentslived with their spoLse or parents, there was morevariety in
the living arrangements of continuing-education students--amajority resided with a spouse, but about one-third livedalone, with parents, or in a living arrangement not listed onthe survey instrument.
Socioeconoii:Charecteristics
The socioeconomic characteristics selected for studywere: student's education, father's education, mother's edu-
cation (Table 3), head-of-household, student's income, par-ents' income,.primary income, occupation head-of-household(Table 4), student's employment status, hours worked/week for
wages, and wages/hour (Table 5).
EducationStudent and Parents
Almost all of the curriculum students (96%) had a highschool education or better as compared to slightly less than
two-thirds (64%) of the continuing education group (Table 3) .
The mothers of students in both groups tended to ha0e slightlymore formal educAtion than the fathers, but curriculum stu-dents' parents were considerably more likely than continuingeducation students' parents to have completed high school.

27
Table 2. Weighted percentage distribution of curriculum andcontinuing education students enrolled' in theNorth Carolina Community College System, 1979, byresidency, location of institution, and residencewh ile enrolled
Variable
Students
CurribCont inuingeducation
North Carolina resident-Yes 97.8 99 3
No 2,2 0,7
Total 100.0 100 0(11 ,835) (4346)
Institution located inhome countyYes 69 8 85 0
No, commute from other North , 18 2 8 9
Carolina co,untyNo, moved to attend 5 7, 1 2
,No, moved for other reasons E.4
Total 100 1 100 1"
Residence while enrolledrarentsSpouseChildren
(11,835) (434E)
31 343 F4 5
2
5
5co 1
4 8
Other relatives ,3 1,9
Board 0 4
Live by myself 9 3 11 4
Live with friends 3 8 1 1
Other not 1 iste d 4 4 10,5
Total 100 0 100°0(11 ,833) (432F)
Overall, the students were better educated than theirparents. Almost half of the curriculum students (491) hadformal education beyond high school as compared to one-fifth
of their parents. Among continuing education students, ?al-most one-third reported more than 12 years of educationcompared to about 15% of their mothers and fathers (Table 3).
Head-a-Household
Curriculum students were more likely than continuingeducation students to report a parent as head-of-household,

.
28
Table 3. Weighted percentage distribution of curriculum andcontinuing education students enrolled in the NorthCarolina Community College System, 1979, by stu-dent's,' education, father's education, and mother'seducation
VariableStudents
'CurriculumContinuingeducation
Student's education.Less than 7th grade , 0. 9:27th-8th grade 0.6 8.09th-llth grade - 2.8 18.7High school graduate 40.0 29.2GET 7.8 2.9High school - 1 yr
.... 46.7 6.3High school - 2-3 yr --- 23.5 9.9College graduate 6.2 10.6Graduate work 2,2 5,2
Total 100.0 100.0...
Father's education'
611;515) (4186)
Less tan 7tb grade 15 9 31.27th-ajfi grade 14.8 19.19th-llth grade 18.3 13.9High school graduate 26.4 20.5GE D 2 1 1.3High school + 1 yr 3.2 2.4High school + 2-3 yr 6.9 4.1College graduate 9.1 5.0Graduate work 3,4 2.5
Total 100.1 00(11,309) (3871)
Mother's education'Less than 7th grade 8.1 25.37th -8th grade 11.7 16.99th-llth grade. 22.0 18.8High,school graduate 35.7 24.7GE D . 2.1 1.1High school + 1 yr 4.6 3.1High school + 2-3 yr 5.1
. College graduate 7.1 3.9Graduate work 2,1 1,2
Total 99.9 100.1(11,391) (3897)

29
Nonetheless, among both groups,,the student was most likelyto report self or spouse as the household head (Table 4).
IncomeStudent Parents, and Primary
About half (47%) of the curriculum students had incomesof less than $8,000 in 1978, while approximately one-half(48%) of those whose parents were living reported parents'income at $12,d100 or more, This trend was reversed for con-tinuing education students, who generally reported a higherincome for themselves than for their parents. Slightly overone-half of the continuing education students had a 1978 in-come of $10,000 or more, while the median income for theirparents was less than $10,000 (Table 4).
The third category, primary income, was examined in thebelief that the socioeconomic status of a student whose par-ents provided more than 50% of his/her support is better re-flected by the parents' income than.the student's income.Primer x income for studebts who reported that their parentsprovided the major,part of their financial support was basedon the parents' 1978 income. Primary income for students re-porting thattffpit parents did not provide, more than 50% oftheir support was based on the student's 1978 income.
The primary income data (Table 4) indicated that curric-ulum students were *from slightly higher income backgroundsthan continuing education students. Slightly less than one-half (49%) of the curriculum students had a primary income of$12,000 or more in 1978, while over one-hall (55%) of the'con-tinuing education students had a 1978 primary income of lesSthan $12,000*.
Occupation Head-of-Household
The data in Table 4 indicate that, with the exception of'the greater proportion of continuing education students re-porting that their household head was a full-time student,homemaker, or retiree': the head-of-household's occupation didnot differ greatly between curriculum and continuing educa-tion students. When observed by occupational categories ofwhite collar, blue collar, unskilled, and farm, all major oc-cupations were included in the students' backgrounds. Littledifference was noted between curriculum and continuing educa-tion students when observed by these major occupational cate-gories.

30
Table 4. Weighted percentage distribution of curriculum andcontinuing education' students enrblled in the NorthCarolina Community College System, 1979, by head-of-household, student's income, parents' income,primary income, and occupation head-of-household
VariableStudents
CurriculumContinuingeducation
Head-of-householdFather 28.6 8.3
Mother 8.4 3.5Self 39.8 39.6Spouse 20.9 42.2(Aber relative '1.4 1.8Other not listed 1.0 4,6
Total 100.0 100,0(11,769) (4277)
Student income, 1978:Under $2,000 20.7 16.0
S 2,000- 2,999 6.3 6.1
S 3,000- 3,999 5.5 4.8S 4,000- 4,999 3.9 3.415 5,000- 5,999 4.4 3.6
$ 6,000-= 6,999 4.3 4.0
S 7,000- 7,999 4.2 4.2
S 8,000- 9,999 7.5 6.7
$10,000-11,999 7.210.1 110.$12,000-14,999
$15,000-19,999 10.8 12.3
$20,0P0-24,999 7.4 8.9$25,000 or over 7,5 11.3
Total
Parents' income,
100.000,747)
1978
1100.1(3894)
Under $2,000' 4.7 6.3
S 2,000- 2,999 3.4 3.7
S 3,000- 3,999 4.0 4.1
S 4,000- 4,999 3.6 3,2
$ 5,000- 5,999 3.4 3.1
$ 6,000- 6,999 4.2 4.0
$ 7,000- 7,999 4.7 4,3
$ 8,000- 9,999 6.9 5.7
$10,000-11,999 8.7 5.4
$12,000-14,999 11.2 5.9
$15,000-19,999 10.9 7.5
$20,000-24,999 9.9 4.4
$2$,000 or over 16.3 8.6Parents deceased 8,1 33'7
CrotAl 100.0 99.9
(9,572) (3059)

31
Table 4 (continued)
Variable
StudentsContinuing
Curriculum education
Primary income, 1978:Under $2,000 8.9 13.6
2,000- 2,999 4.3 6.0
$ 3,000- 3,999 4.0 4.5
$ 4,000- 4,999 ` 3.5 3.4
$ 5,000- 5,999 4.3 3.7
$ 6,000- 6,999 4.3 3.9
$ 7,000- 7,999 4.6 4.4
$ 8,000- 9,999 8.0 6.9
$10,000-11,999 8.6 8.3
$12,000-14,999 12.6 11.2
$15,000-19,999 13,6 13.1
$20,000-24,999 10.2 9.1
$25,000 or over 13.0 11.8
Parents deceased 0.2 0,2
Total 100.1 100.1(11,769) (4277)
Occupation head-of--householdProfessional/technical 11.8 11.5
Owner/manager . 12.3 10.0
Sales, clerical 10.8 7.1
Crafts, foreman 15.0 13.5
Operatives 9.8 9,3
Labor, nonfarm 3.8
Service a 7.3 6,3
Farm owner/manager 2.1 2.5
Farm worker 0.8 1.1
Domestic 0.6 1.3
Student, retired, homemaker 9,3 18.2
Other not listed 16.5 16.6
Total 100.1 100.2,(11,571) (4,190)
Employment Status -- student
The students' responses indicated that the majority were
employed (Table' 5). However, more than-three times as manycontinuing education as curricilum students described them-selves as homemakerspor retirees and thus not part of the°
labor market.

vto
32
Table 5. Weighted percelgi%ge distribution of curriculum andcontinuing education students enrolled in the NorthCarolina Community College System, 1979, by employ-ment status, 'hours worked per week for wages, andwages per hour
Variable'
StudentsContinutng
Curriculum education
Employment status.Workihg full timeWorking part timeHomemakerRetiredUnemployed
Total
43.121.76.23.025.9
45.110.015.315.9
11.Z100.0
(11,754)100.0
(4320)
Hours worked/week for wages.Less than 5 .. 2.6' 2.05-9 2 6 2.4
10-19 7.0 3.520-29 8.9 3.930-39 7.8 . 7.640-45 29.8 29.246-49, 5.2 5.4More than 4*.''...? 3.1 4.3Not aPwage ea ner
Total_11-Lloo.t
_il..11130.0
,, (11,777) (4317)
..--
Wagemiliour.Less, than S3.00 12.5 10.9$3.00-3.49 41 13.3 9.3$3.50-3.99 7.8 7.3$4.00-4.49 6.4 5.0$4.50-4.99 5.4 a.8$5.00-5.99 7.0 6.7$6.00-6.99' 4.2 4.2$7.00-8 99 A.4 3.6$9.00 or more 3.0 3.7Not a wage garner 36,0 45.6
Total 100.0 100.1
/ (11,634) (4164)
..._
,. . di 1

o
wt
33
BQursWorked/Wiek for Wages andRoux'. .
Eimi:k6yed students were most likely `to work full-time--, 40 to:454hours a week. There was little difference in the' hourly wage earned by ,curriculum and continuing educ tion I*Ns\
Students. Approx.imately one-half of those who worked n bothgrdups,reported earnings of less than $4.00 per hour (T ble.5). a
lo
i 2 iI
' s 4 s 44.
t Academic CharacteristicsrJ.
Data 'related to the academic characteristics of (1) prior
' ,fuli-time enrollmert,,in a four-year college/university,j2y-GED store,.. (J high school'grade average, and (4) high schoolrank appear ih Table6,-
Aglow all,respalndents, neiey one in four reported priorimeiRenrollmenit in a four.- ear college/university.
ong the curriculum.studIhnts who had taken the GEDtests (7%), 86 percent had scored 225 (passing) -or better.Among the'lcontinuinweducation students who had taken the GED444), 62% had acbieved,teis score.
About three-fourths of the curriculum st dents and two-...
thirds of the continding,elducation students o had attendedhigh school reported malt icing a B grade verage or better.The continuing education grOup included th- larger proportion
.of thdse respondents ho had not attended high school.-. -
1
The larger troportfion cif both curriculum and.continuingeducation stqdenfs reported being id the. middle one-third oft eir graduating class. Again, continuing educetion,students.
. w e more ),ikely not to have attended,h.igh school than were 1
c ricaum students,, k--
y .
IA Attendance Characteristics ..
,
TM% attendance characteristics of the study respondentsare dispusseg in this section under the categories of I) gen-
e,ral attend a and enrollment characteristics (progr in
- which enrolled, t se of attendance, location of classes, 4. -hours in class/we k, classes this quarter, distance to cl ss,
trips to class/week, and total number of quarters enrolled);(2) choice of` institutions; (3) source of influence to attendand first infdrmation about program or course; (4) sources ofincome, sources and amount of financial aid, and expenses;and (5) education and employment plans,
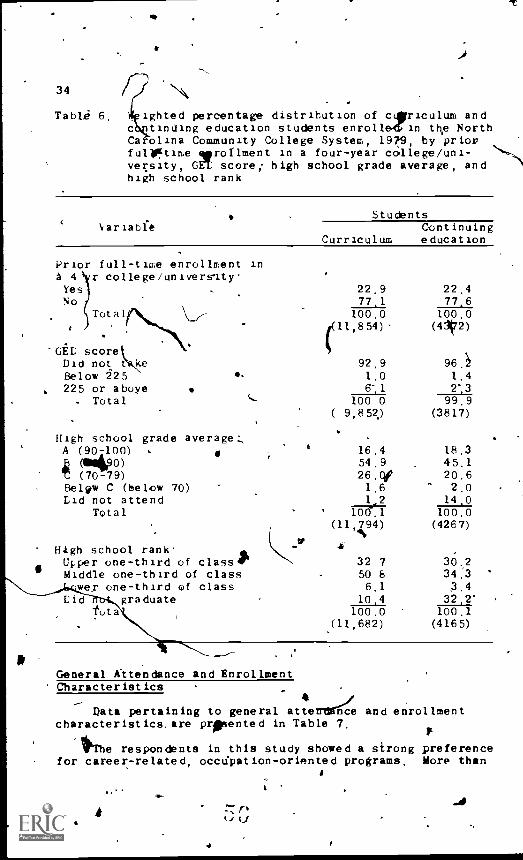
34
TahLi 6.-
ighted percentage distribution of clOriculum andc tinUing education students enroll in the NorthCarolina Community College System, 1979, by priorfullIFtime roIlment in a four-year college/uni-versity, GET score; high school grade average, andhigh school rank
variableStudents
ContinuingCurriculum education
Prior full-time enrollment inA 4 yr college/univer5atyYes 22.9No 77.1
Total 100.0
GEL scoreDid notBelow 225225 or aboye
Total
,
High school grade averageA (90-100) a 16.4 18.3i (010190) 54.9 45.1
(70-79) 26.qf 20.6Below C (below 70) 1,6 2.0Lid not attend La 14,0
Total ' 100.1 100.0(11,794) (4267)
92,91.06-1
100 0( 9,852)
22.477,6
100.0(4172)
96)1.42'399.9
(3817)
tr
High school rank.Upper one-third of class;
0 Middle one-third of classwer one-third of class
Lid graduatetota
32 750 86.1
10.4100.0
(11,682)
30.234.3 '
3.432,2'
100.1(4165)
General Attendance and EnrollmentCharacteristics
4Data pertaining to general atterrnalice and enrollment
characteristics, are prOpented in Table 7.
e respondents in this study showed a strong preferencefor career-related, occupation - oriented programs, More than
I
t

35
Table 7. Weighted percentage distribution of curriculum andcontinuing edudation students enrolled in the4NorthCarolina Community College System, 1979, by program,time of attendance, location of classes, hours inclass .per week, classes this quarter, di5tance toclass, trips to class/week, and total number of
1quarters enrolled
StudentVariable
Curriculum
ProgramCollege-transfer 11 1
General education 2,6Special creditTechnical 52,8Vocational 19,2
100.0(11,888)
Academic extensionFundamerital education -(ccupational extension,Recreation extension
Total
Time of attendance.'Lay 60.3Evening (afe.r.,5.p.0 p c. ) 39 7
Total 100.0(11,843)
Continuingeducation
11 29,213.457 30,1
100.0(4415)
. 38.861,2100.0(4374)
Location of classes. -
Main campus 84 4 28.2Residence oi wok 1,7 10.5Branch campus . 4.1- 9 4tdther. off-campus site i 9.8 51,9
'Total 100.0 100.0(11,808) (4331)
Hours in'class/week-1-5 21.86-10 19,011-15 20.616-20 14.721-25 8 7
26-30 9.0More than 6,3
Total 100.1*(11,834)
4
61.4'26.64 9
3.30.91.02,0
100.1(4378)
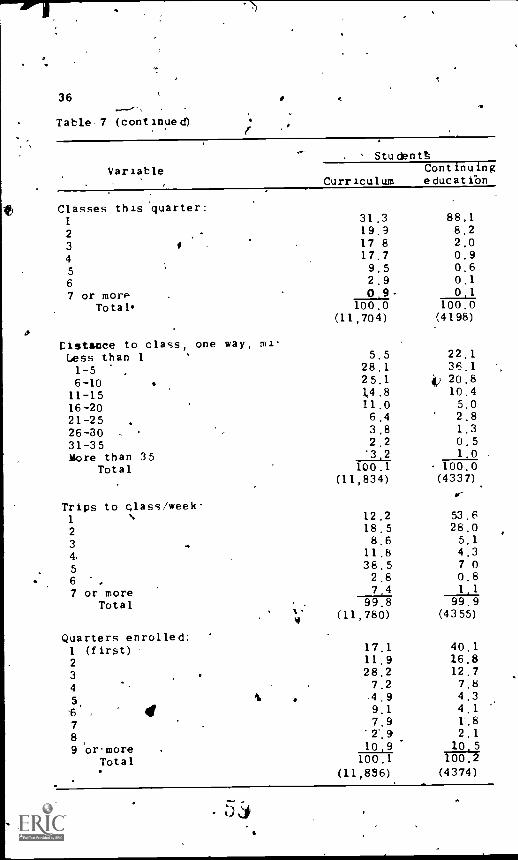
36
Table 7 (continued)
410
StudenttVariable Continuing
Curriculum educatiOn
Classes this 'quarter:1
31.3 88,1
2 19.9 8.2
3 t 17 8 2.0
4 17.7 Q.9
5 9.5 0.6
6 2.9 0.1
7 or more 0,9- 0.1
Totals 100.0 100.0
Eistsace to class, oneLess than 1
way, mi.
(11,704)
5.5
(4198)
22.1
1-5 ,28.1 36.1
6-10 25.1 4, 20.8
11-15 0.8 10.4
16-20 11.0 5.0
21-25 6.4 2.8
26-30 3.8 1.3
31-35 2.2 0.5
More than 35 '3,2 1,0
Total 100.1 - 100.0(11,834) (4337)
Trips to class/week1
12.2 53.6
2 18.5 28.0
3 8.6 5.1
4.11.8 4.3
5 38.5 7 0
6 2.8 0.8
7 or more 7,4 1,1
Total 99.8 99.9
4(11,780) (4355)
Quarters enrolled;1 (first) 17.1 40.1
2 11.9 16.8
3 28.2 12.7
4 7.2 7.8
5. 4.9 4.3
*6 if 9.1 4,1
7 7.9 1.8
8 2,1
9 or.more 10,9 10 5
Total 100.1(11,836)
100.2(4374)

37
gait (53%) of the curriculum students were enrolled in tech-nical programs; an additional 19% in vocational programs. An
equally large proportion of continuing education students(57%)were enrolled in occupational extension fourses.
Approximately 60% of the curriculum group attended mostof their classes during the day. The remainder attend atleast one-half of their classes after 5:00 p.m. These pro-portions were reversed for continuing education students.
Virtually all curriculum students atiended classes ontheir institution's main or branch campus. This was not thecase for continuing education students; about two-thirds re-ported that the majority of their classes were held at theresidence or work site, or at some other off-campus location.
About 60% of the curriculum students attended classes 15or fewer Otours/week, and slightly more than half (51%) ofthem were-enrolled in one or two classes. Contrasted to cur-riculum students, the-continuing education group attendedclasses considerably fewer bours per week and were enrolledin fewer courses. About 60% attended class 5 or lever hours/week, and 9 out of 10 were enrolled in a single course.
Students tended to live or work close to their institu-tional site. Almost 60% of the curiviculuL students traveledless than 11 miles, and only 5% traveled more than 30 milesto attend class. In contrast, almost 60% of the continuingeducation students traveled 5 or fewer miles-to class andonly 6% 113e d or worked more than 20 miles away, Despite the.greater travel distances, curriculum students made consider-ably more trips to class each week, averaging four trips as,compared to the typical continuing education student's singletrip (Table 7) .
Both groups of students were continuous learners, Qnly17% of the curriculum students, and 40% of the continuing edu-cation students were enrolled for the first time during thequarter in which they were surveyed.
Choice of Institutions
Sixty-one percent of the curriculum students, in con-trast to 21% of the continuing education students, indicatedthat they would have attended another institution if theirinstitution had not existed (Table 8). ,However, the institu-tion had been the overwhelming first Choice among all stu-dents: 78% of curriculum and 94% ot continuing educationstudents'. Among those .Curriculum students who would havepreferred another type of postsecondary educational institu-tion, thelr first choice would have beeh either a public uni-versity (53%) or another community college or technical
9
4

38
Table 8. Weighted percentage distribution of curriculum andcontinuing education students enrolled in the NorthCarolina Community College System, 1979, by wouldhave attended another 'institution had this onenot existed and this institution wap first choice
VariableStudents
ContinuingCurriculum education
Would have attended anotherinstitution had this onenot existed.YesNo
Total
Th is inst itut Ion wasfirst choiceYesNo, other CC /TISo, private 2 yr collegeNo, private trade of professional'schooltio, public university';), private universityNo, other not listed
Total
461.438,6100.0
(11,836)
21.478,6100.0(4332)
78.2 93.85.0 1.7-0.9 0.41.1 0.5
11,6 1.71,6 0.21,7 1,8
100,1 100,1(11,796) (4225)
institutei(23%). Continuing education students who wouldfather have attended,a different institution varied consider-ably In their preferences (see also Appendix Table 1).
3purces of Influence and First Information
The impact of sources that influenced the student's de-cision to attend his/her institution differed. Among curric-ulum students, 32% cited a friend or family member as themost influential factor; followed -by 22% who cited institu-tional sources--recruiter, literature, or media (Table 9).Institutional sources, predowinately recruiters, influenced39% of the continuing education students. The second mostinfluential set of factors)for this group was friends an.01,family members, Employer, and counselors from other agenciesranked third, followed by influence of a student who was en-rolled at the institution.
,rte,

39
Table 9. Weighted percentage distribution of curriculum andcontinuing education students enrolled in the NorthCarolina Community College System, 1979, by sourceof most influence to attend and source of first in-formation. /bout program
VariableStudents
ContinuingCurriculum e ducat ion
Source of cost influence toattend'Recruiter or other institutional 11.3 25.1personnel
#Literature from institution 8.8 7,3Radio, TV, newspaper 2.3 6,8Employer 6.1 7.0Personnel, 4 yr college 1.9 0,7.
High school personnel 4.8 0,7Mother 7.5 2 5
Father 4,0 0,7Spouse -"-?- 9,5 6.8
Chlti 0,8 1,9Otter relative 4,2 5,2Student at this institution 9,0 1
Friend, not student 6 4i
6.9Social service agency 1 3 2 5
Other not listed 22,1 16,9Total ,..
100,0 100.1(11,726; (4314)
Source of first informationabout prograr-Recruiter or other institutional 19 0 27.0personnel
. Literature from institution 25.1 10.9Radio, TV,(newspaper 4,0 12,6Employer 4,4 6.5Personnel, 4 yr college 1,5 0.6High school personnel 6,6 1.2Mother 1.3 1.4
Father 1,3 0.3
Spouse 1,3 2.2
Child 0.2 1.0Other relative 3.5 5,1Student at this institution 13.0 10.7Friend, not _student 5,9 6 9Social service agency 1.0 2,3Other not listed 12,i 11 4
*Total-
100 2 100,1..,, (11,787) (4330)
4,
0
-40
The choice of an institution often i8 predicated on thestudent's first source of'information about its program of-ferings. Respondents in this study first learned of the pro-gram or course in which they enrolled from a variety ofsources. ,Contact with institutional sources accounted for amajority of the enrollments among curriculum students 4%)
and continuing education students,(38%). Whereas, mediasources were far more important for continuing education stu-dents (13%) than they were for curriculum. students (4 %) the
latter group'(25%) compared to the former (11%)i
was rela-tively more influenced by literature from the institution.A student enrolled in the institution also was a common sourceof Joitial information, accounting for 13T of curriculum and11% of continuing education students. Friends who were notstudents and family members were firsl sources of informatiog.,for about 13% of curriculum and 17% of continuing education `
students. Ilioreiformal personal contacts, such as employers,and high school counselors, provided first information forabout 13% of the .curriculum and 11% of the continuing educa-tion students.
Sources of Income. Sources and Amountof Financial Aid, and Expenses
A majority of the respondents in this study supportedthemselves through employment, and about three out of fourhad working spouses (Table 10), Multiple sources of incomewere common
Forty-three percent of the curriculum students who re-sponded to the question reported receiving some type of finan-cial aid The Veterans Administration was the most frequentlyreported source, followed by Basic Educational Giants (Table10). All other sources combined accounted for 34% of the re-sponses among students reporting financial aid. Slightly lessthan one-half of the curriculum students receiving financialaid, and reporting the amount, received less than $1000 dur-ing the 1978-79 school year. Detailed accounts of the sourcesof financial aid and the amount of financial aid received,as related to program, agp, sex, race, marital status, stu-dent's education, primary income, and occupation of head-of-household appear in Appendix Tables 2 and 3, respectively,
Curriculum students (89%) were more likely than continu-ing education students (59%) to report some cost of books arYdmaterials, but 64% had expenses of less than $50 for .thequarter (Table 10), tour out of 10 continuing education stu-dents reported they had no expenses for books or materials;an additional 51% of this group noted that their expenseswere less than $50 for the quarter. A small proportion-of.the students ("n of curriculum and 3% of continuing education)reported having to rent special housing to attend the insti-tution ip which they were enrolled,

41
Table, 10. Weighted percentage distribution of curriculum andcontinuing education students enrolled in theNorth Carolina Community College System, 1979, bysources of income, sources and amount of financial
aid, cost of books and supplies, and rent while
attending
Variable
StudentsContinuing
Curriculum education
Sources of incomesEmployment
Parents
Spouse
63.5(6834)
19.1(2943)79.9
53.6(2335)
3.6(198)73.20
(2073) (1126)
ether relative 1 0 1.5(148) (53)
Savings 10.8 7.3
(1383) (284)
Petireyent 15.3 22.1(2071) (1017)
Welfare 1.7!_45
3.1
ether
(289)11 3
11wiIi.?
(143)7.8
(1623) .-0 (3E6)
Sources of financial aida,bCE TA 3.1
(568)
BECG 13.4(2443)
SECC 0.6(122)
Edbcational loan 1 6
(230)
Scholarship 2,4(343)
Social security educational 3.4
benefits(r)-4.9Veterans Administration educa-
tional benefitsN
(2829)
NCSIC 0.5(90)
Work-study 2.2(399)
Vocational Rehabilitation 0.9
(15;8)4Not receiving aid(5504)

e 42
Table 10 (continued)
VariableStudents
Cont InuinCurriculum education
Amount of financial aid,1978-79 school yearb:Not receiving aidUnder $200$200-399
60.42.7X4,74 7
$400-699 4,3$700-999 6.1
$1000-1499 1 4.5$1500-1999 3,4$2000r2999 5.2$3000 or over 8,8
Total 100.0(11,657)
Cost of books and supplies,for this quarter:No expense 10.7 40.8Under $25 25 0 39,4$ 25-49 28.0 11 5
S 50-74 19 8 4.3$ 75-99 7.7 1,5$100-149 5.0 1.3$150-199 1 8 0.4$200 or more 2,2 0.9
Total 100.2 100.1(11,896) (42§2)
Rent while attending$
,
No 90.7 97 4Yes, $49 or less/month 1 1 0.8Yes, S50-99/month 2,9 0 6'res,"$100-149/month 2.7 0 2Yes,' $150;200 /month 2.0 0.1Yes, sore than $200/month 0,7 0,8
Total 100.1 99.9(11,828) (4327)
aMultiple responses precluded overall totals,
bCurriculum students only CETA = Comprehensive Employ-ment and, Training Act; BEOG = Basic Educational OpportunityGrant; SEOG - Supplemental Educational Opportunity Grant. andNCSIG = North Carolina Student Incentive Grant.
Ph
.4

43
Ediicat ion and Employment Plans.
Sixty percent of the curriculum students as compared toof the continuing education students' planned to enroll ,in
a degree prOgram after completing their current courses orprograms (Table 11) Almost two out of five curri,culum stu-dents thought that they would Work toward a four-year collegedegree, with another 24% unsure about this Possibility, Con-siderably fewer continuing education students answek:ed "think,so" (10%) or "don't know" (15%) about plans to _pursue ,a fourlyear college degree,
A majority of all' the respondents either probably ordefinitely planned to work in North Carolina upon completionof their current program or course .(Table 11). Continuingeducation students, however, were lour times as likely ascurriculum students (23% vs, 6%) to state they definitely,would not seek employment within North Carolina, This may bedue to the larger proportion of continuing education studentswho-were retired or homemakers_ These categories included61% of the continuing educatibn students who did not plan towork in North Carolina, Curriculum students who listed otherplans were most likely to indicate that they would be em-ployed in another state (Table 11).
Value Orientation Toward Education
The respondents were asked to rink order the five mostinportant reasons for continuing their education (Table 12)4"To be able to. earn more money" was ranked first by curricu-lum students, followed by the desire "to get a better job,"The' third through fifth highest rankings were "to gain a gen-eral education," to learn things of interest," and "to toe-come more cultured," Continuing education studetfts ranked"to learn things of interest" as their primary reason forcontinuing their education, followed by the desire "to earnmore money," The third through fifth highest rankings bythis group were "to contribute more to society," "to gain ageneral education," and "to become more cultured."
Curriculum and (continuing education students agreed intheir rankings of tie four least important reasons for con-
, t inning their 'education These were: to improve their so-cial life, improve reading and study skills, pressure fromparents or spouse, and the lack of anything better to do,Additional analyses of value orientation -toward,education of -
curriculum and continuing education students, as related toage, sex, race, marita,k,,status, educational attainment, pri-
. Mary income', and occupinion head-of-household appear in Ap-pendix Table' 4,
2

44,
Table 11. Weighted percentage distribution of curriculum andcontinuing education students enrolled in theNorth Carolina Community College System, 1979, byplans to enroll in A degree program, plans forfour-year college degree, and employment plans
VariableStudents
C riculumContinuingeducation
Plan to enroll in degree programupon completing present program/course:Yes 0,2 27.9No 39,8 72,1
Total 100.0 100.0(11,798) (4284)
91Plan to work toward 4 yrcollege degreeAlready have degree 7 1 15.2
,Think so 38.9 9.5
Don't know 24.3 14.8
Don't think so 18.2 20.6Definitely not 11 5 40.0
Total 100,0 100.1(11,785) (4282)
Plan to work in North Carolinaafter completing program/courseDefinitely yes 46.4 43.6
Think so 27.2 12,9
Don't know 16.7 11 8
Don't think so 4.3 8.5
Definitely not 5 5Total 100 1
_222.100.0
(11,759) (4160)
Work plans if not in NorthCarolinaWork in other state 42.1 5.6
Military service 4 7 1 4
Marriage, homemakAg' 8,2 22,4
Retirement 10.7 38.4
OtherTOtal
4
-100.1 -3,310 1
(2, 527) (1874)

45
Table 12. Distribution of curriculum and continuing education'students enrolled 'in the North Carolinamunity College System, 1979, by rank order andraw score of reasons for continuing education andinstitutional characteristics influencing decisionto attend
Variable
dentsContinuing
Curriculum educationRaw Raw
'Rank scorea Rank scorea.
5 224.07 3 163.731 430.28 2 ,170.88
126.45 5 142.473 i 241.05 4 154.782 397.21 7 123.739 69.23 9 75.758 72.16 8 107.074 235.97 1 265.667 90.20 6 135.76
10 62.37 11 41.9311 28.99 10 47.03
1 468.51 1 330.345 129.19 9 36.058 80.13 8 36,552 395.10 2 294.993 333.17 3 237.136 127.31 6 92.694 206:38 4 190.479 71.47 7 69.957 98.84 5 93.74
Reasons for continuingeducation:Contribute more to societyEarn more moneyBecome more cultured 6
Gain' general educgtionGet better jobImprove reading & study skillsImprove social lifeLearn things of interestMeet interesting peopleParents/spouse wanted me to goNothing better to do
Institutional characteristicsInfluencing decision to attend:Programs availableFinancial assistance! availableJob placement servideaLocationLow costOpen-door admissionsQuality of instructionStudent-centered instrud*-ionOther reasons
allay score is the weighted frequency times the convertedrank value; each'first choice multiplied by 5, each secondchoice by 4, each third b6 3, and so on; raw score values arein tens of thousands; e.g., 224.07 s 10,000 r 2,240,700.

46
Institittional Characteristic's That InfluencedDecision to Attend4 AVOIS
Stucle,nt rankings of institutional characteristics thatcost influenced tb 'bir deargi to attend showed virtually nodifferences betIken curricul and continuing education stu-dents, othe than the import e of avaiplble , financial aid(Table 12). Both groups agreed in their top four rankings ofthe cberacteristics that influenced them most. These were:"educational programs or' courses available," "location (near-
, ness to home or work)," "low cost," and "quality of instruc-tion." ,The fifth most influential characteristic for curric-ulum students was "financial assistance available." For con-tinuing education students, this response as "other reasons."Student-centered instruction and job plac nt services wereranked relatively low by both groups.. Additional analysesof institutional characteristics that most influenced Curric-ulum and continuing education students to attend, as relatedto age, sex, race, marital status, educational attainment,primary` income, and occupation head-of-household, appear inAppendix Table 5.
Evaluation and Importance of Support Servicesand Use of a Standard Name
Two sets of questions- -those Baling with the students'evaluation of institutional support services and those con-cerrre4 with the students' opiitions about the choice of namefor tt4ir institution- -are tiKated in this section. Thesequestions were added to the survey instrument after pretest-ing and should be considered experimental because no reliabil-ity information is available.
Evaluation and Importance ofSupport Services
In evaluating the quality of support -services offered bytheir institations, continuing education students, were farmore likely than curriculum students to respond "don't know"
(Table 13) . More than one-half of the continuing educationstudents answered "don't orshen ask d to evaluate thequality of child care,-tu n aid, stipends health care,Job counseling, job placem , academic counseling, personalcounset9g, recreation facilities, and eating facilities.More than half of the curriculum students gave an evaluationof "gOod" to parking, study areas, and library resources.These were also the support services they felt were most im-.portant to them (Table 13),
Adequate parking was'considered important by 40% of thecurriculum students, followed by Library resources (34%) and
r

.1
fr
47
Table 13, Weighted Perceintage distribution of .curriculum andcontinuing education students enrolled in theNorth Carolina Community College System,- 1979, byevaluation of iridividual 'support cervices and im-portance of support services
VariableStudents
s/ContinuingCurriculum. educat ion
, .
Evaluation of support servicesTransportation
Good 39.2 44.7Improve 19.8 12.2Don't know 41,0 43,0
Total 100,0 99,9a (10,622) (3233)
1-arking -
Good 54,0 56,8Improie 41.4 23,1
t,Don't, knob .4 7 20,2Total 1017,1 100.1
(10,974) (a312)Child care
Good 12.7 13.7Improve 12.6 9.4Don't know 74,7 77,0
Total 100.0 100.1(10,339) (2852)
Tu*tion aid.Good 39.0 20.7Improve 20.1ain't know 40,9 69,8
Total , 100.0 100.0(10,617) (2830)
Stipendg:Good 25.4 15,3Improye 21,7 10.1Don't know 111 74,6
Total 100.0 100,0 ev
Health care(10,589 ), (2903)
Good 18 4 18.0Irrprqve 15 4 8.9
EI Don't know 0 2 73 1
iPtal 00,0 0.Cr
(10,8251 (2
4
5)

r
k4
e
I'
Ili
Table 13 (continued) A
.06,
Variable.Students'
Continuingcurriculum education
Job c4nselingGood ---"------.,ImproveDon't know
Total14.
34.6
4232 04
23.4.10.7_65 9
100.0(10,589)
100.0(2903)
Job 'placement:Good 29.9 19.2Improve 25.1 13.1Don't know ill.
45.1 67.7Total 100.1 100.0
(10,625) (2895)Acasiemic counseling.
Good 46.8 26.8Improve 23.7 8.7Don 't know 29.6 64.5
Total 100,1 100.0(10,580) (2885)
Personal counseling*,Good 43.9 32.4Improve 22.3 9.5Don't know 33.8 58.2
Total r 100.0 100.1.(10,622) (3007)
RecreatiOn gracil it les ;Good 32.1 26./Improye 4 `. 40.2 15.1bon ' t know 27.7 58.2
Total. 100.0 100.0(10,579) (2917)
Study areas.Good 32.1 26.7Improve 40.2 15.1Don't knots 27.7 58.2
Total 10.0 100.0% (10,57) (2917)
Library resources. :Good 68.8 40.7Improve 17.3' 12.0Don't know 9 13,9 47,3
Total 100.0 100.0
NO4. .
-.r
:-
(10,731) (2937)
I.

r
49
Table 13 (continued)inued)
Variableil ,Students
CurriculumCoat inuingeducation
Eating facil it iesGood l'
33.6 30. 9
Improve %. 47.9 18.8
Don 't know 18.4 50.3
Total 99.9 100 .0-
(10,808) (2997)
Importance of serviceaTransportation 19.4 184.0
(2500) (855)
Parking 40.1 25.2(4413) (1030)
Ch ild care 7.3 5.7
1 (999) (235),,
Tuition a id 22.0 8.1
(3246) (364)
St ipends 15.6 5.9.(2337) (278)
Health care 9,2. 7.5(1241) (348)
Job counsel ing 23.3 8.6
1(3020) (400)
Job placement 27.6 A9 4
(3753) (462)
AcadeLic counsel ing 26 3 9.3
(3327) (443)
Personal counsel ing 21.7 12.2(2858) (604)
Recreation facilities 16.4 7.5(2399) (402)
Study areas 29.1 12 .6
(3732) (642)
Library. resources 34 .4 13 .3
(4466) (625)
Eating facilities , 24.6 11.3(3337) (i65)
aNfuliipPe responses precluded 'overall totals.
le
1 ,i _,,: ,

50 .
study areas (29%) (Table 13). An even smaller proportion ofcontinuing education students considered any of the listedservices important. One out of four checked parking facili-ties as important, followed by transportation (19%) and li-brary resources (13%). For further analyses by program, seeAppendix Tables 6 and 7.
Opinions of and Feelings AboutUse of a Standard Name forAll Institutions
4
Thirty-frve percent of the curriculum and 27% of thecontinuing education studentl-preferred that all institutionsin the North Carolina Community College System be designatedcommunity colleges. Theftlext most popular choice for bothgroups (17% and 14%, respectively -Was to use no standardnape (Table 14) However, more than ours- fourth of the cur-riculum and more than one-thi d oft_he continuing educationstudents expressed no opinion hbut using a standard name forall institutions within the N
When asked.for the f lings that supported their choices,the largest proportiod o h groups sail, that it did notmatter what the Institut re called Table 14). Aboutone in five students it'lt that the institutions were basi-cally the same. SiXteen percent of the Curriculum studentsfelt that a standard name mould help to give all institutionsthe same status, and 14% felt thai it would help students id,transferring to other institution (Table 11). For furtheranalyses by program, see Appendix Tables 8 and 9.
Students Bethg Served in CurriculumProgram Area
In this section, selected demographiclsocioeconomic,acadenic, and attendance characteristics of students within,the curriculum program area are examined. Such An examina-tion will 'give some indications of the many similarities anddifferences that exist among curriculum students whilrenrollin specific curriculum programs; i.e., college-transfer, gen-eral 4education, special credit, technical, and "vocational".Those characteristics not dealt with in this section appearifi Appendix Tables 0-14.
wDemograllic Characteristics -
Demographic characteristics dealt with in this sectionare age, sex, race, marital status, and veteran status.Ata relating to these characteristics appear in Table 15.

.
51(
Table 14. ftighted percentage distritution of curriculum andcontinuing education students enrolled in theNorth Carolina Community College System, 1979, byopinions about a standard name for the institutionsin the System and fee'ings about a standard name
variableSt u de Iks
CqptinuingCurr ic ul um e ducat ion
Opinions about standard naTe aNo standard name 1E,5 14 .0
Community col lege 35,2 27.2Technical institute 8 9 13.3Technical col lege 12 8 8 2./
No opinion 26 6 37.5Tot a 1 100 0 100.2
/11,787) (4228)
Feelings about standard naneSchools are nasicart: the sa -re 19 5 19 8Cive all schools the ace status 16 2 11,8Would 'E 1i. ,tadents tra -N.s fer 14 4 E 7
School- on- hasically Different 9 F , 7 9Con't want nare changed 7 1 10.3Coesn ' t 7 atter 33 2 43 6
Total , MI 100 3 100 1
(11,735) (4180)
40 1As mentioned earlier im the discussIon of Table 1, con-Z_ iderable differences were observed in the median ages Cf thestudents enrolled in the different curriculum *programs, WheneLamining these programs in terms of age categories, the same15hInomenon persisted TN, college-transfer gro,up clearlywere younger students-54% of this group were under the ageof 23 (Table 15). The technical p 'rogram had the next largestproportion (423) of younger students. By far the "oldest"student group in the curriculum program area was in the spe-cial credit program, where 165 were 50 or older.-
Sexa
Males and females were unequally distributed throughoutall of the curriculum programs. The vocational program was
. the only bne in which the enrollment was predominately male(6 7%). Females were most predominant in the special credit
a

.
.
Table 15. *sighted perc tage distribution of curriculum students enrolled cs,
in the Northnrolina
Community College System, 1979 by program,age, sex, race as marital status, and veteran status
VariableCurriculum program
Collegetransf r
General Specialeducation credit Technical Vocational
I'
Age, ir22 or less 54.4 24.8 22.6 41.8 36.723-29 20.8 27.8 22.8 29.7 .31.530-39 14.9 27.7 27.1 19.1 18.540-49 6.9 13.2 12.0 7.6 7.550-59 2.0 1.4 5.2 1.6 4.7
..
60-69 1.0 5.0 8.9 0.2 0.870 or more _Q..2 0,0 1,4 0 2
Total 160.6 9.9 100.0-LI100.1 Trg
(1470) c292) (470) (7090) (2507)
Sex:Male*Female
45.7 30.9 30.8 44.2 66.6
ia.1 69,1 t.21 .
Total . 100:0 100.0 1-610TA._LJ_16676
_11.1.66:I
#(14611 (296) (469) (7097) . (2507)
Race:Black 13.6 17 8 9 6 23.0 28.1American Indian 0.4 0.9 0.9 1.7 1.5White 83.5 80.2 S8.4 74.2 9.5Asian 1.2 5 0.5 0.4 2
Other 1,3 'g ' 0,6 0,7- 0,7 '
Total 100.0 100 0 100.0 100.0 100.0(1460) (292) (464) (7051) (2476)
.1.

Table 15 (continued) 1P
e A VariableCurriculum program
College-transfer education
General Specialcredit Technical Vockt tonal
Marital statusr,,Single/engagedllarriedWidowedSeparatedDivorced
Total
58.234.7
1.12.9\__,__,3 2
2.9\
29.853.06.85.3
..___,_5 3
100.0
31.256.5
2.11.7ELI
48.342.3
1.33.9
4,._3ItCT
40, 549.5
1.13.8
-_1.1100.0TOCT.I r0A76
(1469) (296) - (468) (7086) (2503)
Military veteran:Yes 15.2 22.1 10.3 27,4 _ 35,0No ii__,_4 8 77 9 8.,__.9 7 . 7_,_2 6 _611)
Total TGOCI 01:11.0 11:::-) 1140-.T) 00,0(1466) (294) (468) (7080) (2502)
1
4.
IV
ei
7 t )
.
,.
p

54
and gen ral'education progr ts, with propor ions of 69% ineach.
'tollege-transferand rogr s each had ap-
proxiaa ely 54% female enrollme ts ( ble )
Race4 .
Racial groups also were unequally distributed within thespecific curriculum programs. Minority groups made up only12% of the special credit group, 17k of the college -trgroup, and 20% of the general educatioR group. Convey y,
minority students represented between 216% and 31% of the tortal enrollment sin the occupation-oilented programs Ob-viously, the traditionally ,"liberel arts" curriculums wereless attractive to sinoritor students than were the technicaland vocational programs (Table 15) ,
Marital Status
As might be expected, those students most likdly to besingle were in the college-transfer program,. In fact, nearly601 of these students were single (Table 15) Between 4O)and 503 of the technical and vocational students reportedthat they were single. The largest proportion of marriedcurriculum, students was represented in the general educationor special credit programs Coe-tenth of the students ineach of these two programs indicated that they were eitherdivorced or separated.
veteran Status
The largest proportion of military veterans in the cur-riculum program area ways in the occupation- oriented- programs!-35% of the vocational students and 27% of the technical stu-dents had prior military experience. only WI of the generaleducati,. 153 of the college-transfer, and 10% of the spe-cial credit students indicited that they had set,rved in the
military (Table 15)
. Socioecbnomic and Academic' Characteristics
The socioeconomic characteristics of curriculum studentstiscussed in this section arc. student's education, father'seducation, mother 's education, st udent 's income, parents' in-come, primary income, occupation head-of-household, and stu-dent's employment status. The academic characteristic isprior full-time enrollment in a four-year college/university.Data pertaining to these characteristics, by curriculum pro-gram, appear in Table 16.
IS '''. Y :.'fj

Tab 16. Weighted percentage distribution of curriculdm students enrolled inthe North Carolina Community College System, 1979, by prograa, stu-dent's education, father's education, mother's education, student's1978 income, parents' 1978 income, primary 1978 income, occupationhead-of-household, student's employment status, and prior full-timeenrollment in a four-year college/university
Variable
Student's education.Less than 7th grade7th-8th grade9th -llth gradeHigh school graduateGEDHigh school + 1 yr .High school + 2-3 yrCollege graduateGraduate work
Total
Father's education:Less than 7th .grade7th-8th grade9th-llth grade.High school graduateGEDHigh school + 1 yrHigh school + 2-3 yrCollege graduateGraduate work
Total
(
Curriculum studentsCollege-transfer
Generaleducation
Special ---
credit Technical Vocational
0.0 0,0 0.0 0.2' 0.60.2 0.9 0.1 0,4 1.81,7 0.6 4.4 0,8 8.2
34.7 43,4 29,0 39.4 52.6 '
4.0 7.9 3.0 8.0 13.223.5 22,0 13.8 18.6 , 9,128.3 23.7 23.4 27.3 10.35.0 1..4 17.9 0 4.5 3.3
2_4ITY7T
_11roo7o
_LIloisr
__LIIwo _Id10.2
(1445) (291) (458) (6917) (2404)
9.7 21,3 14.5 16.2 18.810.2 16.1 12.6 14.6 19.016.3 15.5 14.71 18.6 21.927.1 23.3 28,9 26.6 24 03.5 1.7 1.2 2.2 1.73.8 3.9 2.3 3.6 2.3
10.0 9.9 7.5 6,7 4.411.8 7.2 13.9 8.6 5,4
LI 1,1 4,4 2 41010. 100.0 10670
__1..1-04 -fel(1432) (294) (446) (6814) (2323)

Table 16j(continued)
4
Variable
Mother's education:Less than 7th grade7th-8th grade9th -11th grade
'HighschoolduateGED
igra
y High school + 1 yrHigh school + 2-3 yrCollege graduateGraduate work
Total
Curriculum studentsCollege- Ge1eral Specialtransfer education credit Technical Vocational
' illb
5.0 9,0' 7.3 7.8 10.98.5 12.4 11.6 11.2 45.2.
19.0 , 21.0 20.1 22.1 25.4
35.1 31,7 33.6 37.4 33.3
1.5 1.7 2,5 2.1 2.3
8.0 5.7' 3.2 4.9 ' 3.0
10.9 10.4 5.3 6,6 4.0
8.6 6.8 13.2 6.1 4,5 li
__La __22. __I.2. __LI100,0 100.1 100,0 100.1 100.1
(1436) (294) (446) (6E64) (2351)
7
Student's income, 1978:ims than $2,000 25.4 12.8 9.7 22,5 23.5
$2,000- 2,999 11,3 6.9 2.0 6.9 5.4 -
$3,000- 3,999 7.9 4,9 I 2.7 6.1 4.8
$4,000- 4,999 5.3 2.1 1.0 4.4 4.4
$5,000- 5,999 "4.7 3.2 1.7 4.8 5.5
$6,000- 6,999 4.6 6.6 3.4 4.5 4.0
$7,000- 7,999 :0.8 3.6 3..4 4.2 4.7
$8,000- 9,999. . 4.3 117.8 7.4 9.2
$10,000-11,999 3.7 6.9 IL 8.2 7.6 7.7-
E12,000- 14,999 5.0 14.0 , 14,8' 9.5 10.3
$15,000-19,999 7.4 12.9 14.8 9.9,--1 11.6
$20,000-24,999 6.6 8.9 12.6 7.1 4.5
$25,000 or sore LI .
4 2
Total 100.0_11.2100.0
..;82011010.1
-_§...2100.2 .
99.8
(1300) (277) (450) (6464) (2258) .

Table 16 (continued)
VariableC
Curriculum studentsCollege-transfer
Generaleducation
Specialcredit Technical Vocational
Parents' income, 1978:Less than $2,000 3.4 2.8 1.2 4.9 8.0$2,000- 2,999 2.1 4.6 1.9 3.5 5e3$3,000- 3,999 3.4 3.1 3.9 3.5 6,2$4,000- 4,999 2.8 6.7 2.4 3.6 4.8$5,000- 5,999 2.3 3,5' 1.3 4.0 . 3.9$6,000- 6,999
'
3.1 1.8 4,2 4.4 4,9$7,000- 7,999 3.4 6.8 1,5 4.9 7.0$8,000- 9,999 6.3 9,5 7.4 7,1 6,1$10,000-11,999 7.6 9.1 7,3 8.8 10.3112,000-14,999 9.5 17.8 7.9 12,5 9,915,000-19,999 13.0 10.6 8.8 11.7 9.0$20,000-24,999 16.1 8.6 7,9 10.5 5.8$25,000 or more 1 9.3 24,0 15.6 10.1Parents deceased 5,8 20,3 E.11
Total 100.0 100.0__5,1100.2 100.1
(126 (240) (364) (5793) 11913)
Primary income, 1978Less than $2,000 7.0 7.1 , 1.8 9.5 13.9$2,000-,`2,999 6.6 5.2 0.7 4.6 4.9$3,000- 3,999 5.4 2.0 1.6 4.4.-- 4.1
$4,000- 4,999 4.0 . 1.8 0.8 3,.4- '4.4
$5,000- 5,999 4.3 2.6 1.8 4.6 5,5$6,000- 6,699 3.8 6.4 2.6 4.8 4.1
$7,000- 7,999 4.4 4.0 3.4 , .8 5.2
18,000- 9,999 6.1 _ 51 . 7.8 8.1 9.4
$10,000-11,999 6.4 8.2 4 7.0 9.1 9.7$12,000-14,999 9.0 16.3 15.3 12,6 ,12 3
P.7

Table 16 (continued) ti
Variable
Curriculum studentsCollege-transfer
Generaleducation
Specialcredit Technical Vocational
Primary incomw,1978 (contd.)'$15,000-19,999$20,000-24,999$25,000 or moreParents deceased
Total
13.012.917.2
_Q.1ta6.2
15.810.714.7
LLLI
15.2'14.8/7.20,0
, 13.210.010,3,90.2
13.8
.69
99.9 100.0 100.1(1466) (294) (466) (70.72) (1:71:1:
Occupation bead-of-household:'Professional/technical 15.2 13.6 21,2 10.1 7.4
Manager/owner 15.5. 14.3 22.9 11.0 6.2
Sales 1.9 3.8 4.0 1.3 0.5
Clerical 10.7. 8.5 12.9 9.3 5.2
Crafts 11.8 11.0 7.4 15.2 22.6
Operative 4.1 6.8 3.4 7.4 9.6
Transportation 2.7 1_7 2.1 3.3 2.8
Labor, nonfarm 3.6 2.4 2.8 1.5 5.7
Farm owner/manager 2.2 2.6 0.7 2,3 2.8
Farm worker 0.8 1.2 0.2 0.8' 1.2
Service 5.4 7.0 1,6 9,6 6,2
Domestic . 0.2 0.4 0.1 0,7 0.8
Student, retired 6.4 6.7 5.0 7.2 9,5
Homemaker . 1.6 1.0 1.4 2,1 2.5
Other not listed 17.9 19,2 ii 5 16 4 ill100.0 100.2 160.2 100.2 100 2
(1445) (287) (451) (6964) (2424)
.
co

Table 16 (continued)
VariableCurriculum students
College-transfer
Generaleaneducati
Specialcredit Technical Vocational
Student's employmentstatus:.Full time 34.1 44.0 110.1 of 41.0 406Part time " 34.8 17.1 10.2 , 24.9 14.8
Homemaker 4.6 12.9 10.9 ;5.2 5.8
Retired 2.1 5.6 5.7 1.7 4.6
Unemployed .2.1..± _aa.1 _12.1 - _21.1Total 100.0 100.0 D30.6
.__.273loo.1 1-66.1
(1461) (296) (464) (7050) (2483)
tiPrior full -time en- -
crollment in 4 yrcollege/universityYes 21.9 20.4 50.5 19.4 12.7
No 7_,_81 79.6 49,5 80.6Total 10076 ' 100.0 100.0 100.o,
_EZ.1loo.0
(1472) (295) (468) (7086) (2503)
r.
vik

&rents
Students' in spec 1 credit programs had higher educa-tional attainments t n did students in the other curr ulumprograms (Table 16)/ In fact, 18% of the special cred t re= .
spondents had coll degrees and an additional 9% ha some.",
graduate work. St dents with the next Tighest educe °nal.attainment levels re in college-transfer programs followed,by general educati and technical students, Those with thelowest educational a tainment levels weip in vocational pro-grams, where 76% had as high school education or less,
These same educatio at attainment patterns held truewhen examining such back ound factors'as father's and moth-er's ffilucational levels, Parents of special credit and
'Plt
college transfer students d the highest educational attain-ment levels and those of vo
\
ational students had the lowest(Table 16).
Income -- Student. Parents ana Primaryk
With -in he curriculum pr gram area, students in college-transfer, to nical, and voca tonal programs reporte'd t).Vbwest 1978 incomes: Nearly o -half of the college-transferstudents had a 1978 -Income of le than $5,000, while approx-imately 40% of,the technical and vbpational students reported AN.1978 incomes of less than $5,000. Conversely, over 60% ofthe special'credit students had incomes above $12,000, as didnearly 50% of the general education students ,(Table 14.
1
Examination of the 1978 incomes of curriculum students'parents revealed several differences according to tps programin which the student was enrolled. The data in Tabl' 16 in-dicate that the parents of at least one-half of uthe college-transfer students (60%) and the technical students (50%) had1978 incomes of $12,000or more, Conversely, the parents ofat least one-half of the general education (54%), specialcredit (52%) , and vocational (65%) students had 1978 incomesof less than $12,000.
Primary income was used to examine he current sociOeco-'Ionic status of the respondents based o the 1978 income ofwhomever contributed over 50% of the st dent's financial sup-port, Curriculum tudents with the hig est,.4wrimary meIpwere in special credit r
it programs; nearly % reported imaryincomes of $12,000 or more, Fifty-seven percent of generaleducation students were in this income range as were 52% ofthe college-transfer students. Proportions of technical (46%)gand vocational (39%) students in this income range Were some-what lower. Clearly, the occupation-oriented students were"from lower socioeconomic environments than were the "liberalarts"-oriented students 16).

N4%
61
Occupation Reatdoef-Household
rl '-'111 occupations of heads-of-household of curriculum stu-dents differed considerably (Table 16). Special credit stu-dents _reported most frequently that their household head'soccepition was is the professional/technical or manager/ownercategory. College-tfaangfer and general education studentsalso were well Fepresented in these two occupational catego-rtes, 'It. appears_that the clientele in the liberal arts pro-
-grias were from wbite-collar backgrounds, while those in Vie-occupation-oriented programs were more representative of blue-collar occupations., f
Ammimmmli
Student's Employment StatusPA
Special credit students as compared to studentsin other curriculum programs .were more likely to be employ
9 full time, Approximately of the neral education, tech-. and vocational s grits were e loyed This
< true for only one-third of the tpollege-transfer students.Pah-time emplciymentowas greatest among college-transferOstu-dents and least among s.pecial credit students (Table 16)The largest proportions of homemakers andret,irees were in akgeneral education, and special credit programs, whereas thelargest .proporlions of ttunemployed were in the vocational(33%)', technical (27%), a d college- transfer (24i) programs.
-s .
Prior Full -Time
s-
nroliment in a 1.Four-Year College /University 4
Fifty percent of the special crestit students reportedtDior enrollment as a fulf-tract student a ,founr-year col-le'ge/university (Table 16) This proportion ell to 22% incollegeltransfer, 20% in general education, 19% in technical,and 13% in trocational programs e,
;I AtterApncee Characterist4fis
° OPSelected attendancilharacteristicsof curriculum stu-fdents. were: (1) ,time of ends e; (2) location of classes; 1
13) distance to clatis, one Tray.; jrf) would'hav -attended an-other institution had this-,one notsex-isted; (5 this institu-tion was first choice ; (6) source` of most influe e in
programto attend" (7) ssource of first- formatio bout programIn which 'tprolle-d; ttv Sources of fine ial aid; (9r) amount offinancial aid; 410)* exAnses of book and supplies this quar-ter; (11) plans to work toward a four2year college degree; and
. (12) plans to work ih Nojth Carolina upon completion ,of pro-gram% . .
*IX
rV
4

62
Time of At LOcat ion pfClasses, and Distance to Class
Almost threes-fourths (71%) of the college - transfer; '67%of the technical, and 63% of the vocational students attendedclasses during the diy (Table 17) General education stu-dents' class attendince was fairly evenly divided between; dayand eiening The reverse wee true for special credit stu-dela-74% attended classes.in the evening.
A majority of theecurriculum students attended classeson their institution's meal-campus, However, almost one -thirdof the special.credit students had the major Part of t65ircourse work at.some off-campus ite other than their resi-dence, work site, or a branch us (Table 17). Twelve per -
vikcent of the vocational students ttended classes at some un-s specified of,ACCimpus location.
4
Although most of the curriculum students traveled fewerthan 16 miles to class (one way), there were some noticeablevariations among these Students (Table 17). For example, agreater proportion of. the special credit and general educa-tion students traveled fewer than six miles to cuss. Theoccupation-oriented (technical/vocalonal) students tended totravel substantially greater distaves to c1 014.ses--27% of theformer and 31% of the latter traveled between 16 and 35 miles
- one way as compared to 22% of the college-transfer, 23% of the..pedal credit, and 19% of the general educatim. group.
Choice of Institutions
.When asked if they would have attended another institu-tion had their institution not existed, 73% of the college- '
transfer students, 66% of .the technical, and 58% of the gen-_eral education students responded'affIrmatively (Table 18).In response to the creestion--Was this institution your firstchoice for continuing your edgration?--the present institu-tion was consistently 'the firstchoice from among all otherforms Of postsecondary educational institutions for stddedtsin all curriculum programs. Nearly 9 out of 10 special creditand 7 out of 10 college-transfer students indicated that theinstitution in which they were enrolled was their first choice(Table 18). Of those curriculum students who would have pre-
. ferred another institution, the most commonly cited Choice wasa public four-year college/univers4ty--exoept the xocationalstudents, whose alternate choice win another community 'col-lege or technical institutes e
.
ces of Most Influerice to Attend4 d Fir§t Information About Program
Curriculum studer4s 40 different programs were inflif-...enced to attend .the institution by a variety of sources
`
a

.0..
Table AR. Weighted percentage distribution of curlOculum students enro1141d inthe North Caiwblina Community College'System,li979, by program, timeof class attendance, location of classes, an istance to class
VariableCurriculum students
College-transfer
Generaleducation
Specialcredit
SP:Technical/ VocatioWal
Time of attendance.Day 71,2 58.5 26.2 66.7 62.8Evening 28.8 49,5 73,8 33,3 37,2
`Total 100.0 100.0 100.0 100.0 100.0a '4147). (295) (468) (7097) (2512)
Location of classes:/
44
gain campus 95.8 93.3 60.3/
90.0 78.7Residence/work 0.8 0.0 4.3 0.8 3.1'
Branch campus 0.6 1.6,. 2.9 4.5 6.5Other off-campus site 2 8 5,1 , 32,5 4,7 11,8
Total 100.0 - 100.0 100.0 100.0 100.1(1468) (296) (466) (7083) (2495)
lit
Distance to class, oneway, mi:
...0 ,
Less than 1 5.9 1.5 6.7 3.9 9.1
,1-5 29 0 37.5 33.2 27.4. , 24.3
6-10 28.6 28.7' 26.9 25.3 20.811-15 ' 14.2. 13.8 10.2 16.0 15.316-20 8.7 8.2 16.0 10.3 11.121-25 6.2 4.0 2.7 7.0 7.628-so 2.3 1.2 4.4 4.931735 2d'9 0.5 0.4 2.3 2.9'ore than 35 3.6 2,8 4,0
Total 10g.11loo.o 100,1 100.1 /-----100.0
(1469) * (296) (469) (7092))
(250q)'
tva

64
Table 18 Weighted percentage diitribution' of curriculumstudents enrolled in the North Carolina CommunityCollege System, 1979, by program and choice ofinstitutions
Curriculum studentsGenvra1
Variable ' College-transfer
educe- Specialtion credit
ge ch-nical
Voca
Nould.have at,tended anotherinstitution hadthisa2ne notexislid:Yes
p
'72.9 58 .e 45.2 66 .2 53.9No 27,1 ' 42,0 54,2 33,8 46,2
Total 100.0 100.0 100 .0 100.0 /00.1(1472) (297) (467) (7097) (2503)
Th is institutionfirst choiceYes 6,9.2 -74.7 87 7 75.5 84. 5
No, another CCor TI
2 4 4.0 1.3 5.7 7.2
No, private 0 8 0.3 A. , 0,2 1.0 0.92 yr collegeNo, private 0.4 .4) 5 0.7 1.1 1 6
trade/profes-sional school
rNo, public 4 yr 22.1 16.6 6 9 13',4 3.5coflege/uh i-vereity
o
No, private 4 yr 3.1 '2 8 '1,8 1,7 0.2-
c011ege/uni-yersit,
Another type ofschool not
2.0 1.1 1.6 1.6 2.1
1 istedTotat 100 0 100.0 0 FT 100 0 TUITI
(1473) (294) (465) (7068). (2496)
0
,
(Table 19) In all programs except special credit, "other"sources not listed in the survey instrument were considered
-^ the major influences. -5W-6-IaT Credit- student-s clued InstItu-tional recruiters or other personnel as the most influentialand indicated "other- as secOtd. College-transfer studentsindicated their mothers as the second most influential source;
A

65,
general education and technical studentsi, other "students; andvocational students, institutional recruiters, The thirdmost influential sour6es. were institutional recruiters forcollegertransfer students, spouse for general education and IPtechnical students, and institutional literature for specialcredtt and vocational students.
Curriculum students obtained fArst information about theprofram in which they enrolled from a nurber of sou ces(fable 19) Across all curriculum programs, the riaj r sourceof first inforration was institutional literature The sec-ond most frequent source was a recruiter or other institu-tional personnel. The third most common source of first in-foraation for students in all curriculum progirams exceptcollege-transfer was other students at the institutionCollege-transfer students listed as third the unspecified'other' sources not included in the survey instrument Thefonrth source for all except college- transfer students was'other', for college transfer students this source was otherstudents High school persOrxnel were fairly good sources offirst information for college-transfer, technical, and voca-tional cit_idents, nut leas sy tor special credit and generaleducation. st ur-ents
Sources and Anount of Financialaid and Expenses
The extent to which curriculum students ref,orted,recetv-financial a Id differed greatly by progran (Table 20)
The larger plopoitton (53:) of the'students receiving suchaid wer vocational students as compared to 5O: of the tech-nical students, 37". of the general eduCatton students, and35: of the college-transfer students. 0nly 7: of the spec talcredtt students reported receiving financial atd. The mostfrequent sources of financial aid In all curriculum prograr-sexcept special credit were eterans administration educationalbenefits and Eras lc Educational Gpportunity Crants
. Not only were technical and ,vocational students Bore1 tkely than other curriculyam students to, rece lye f financialaid, they also received larger amounts of aid-(Table 20). As
th'e data indicate, 22: of the technical and vocational stu-dents received i:1,500 or more for the'1978-7) school year ascum red to 11", of the college-transfer students (See also,Appen Tatles 2 .and 3.)
Although student expenssiis for books and supplies werepredicated somewhat on tie n be r of classes Id whichtpeywere enrolled fdr the quarter, comparisons can be+ made be-tween stucielhts in the various curriculum programs, Fifteenpercent of the college-transfer students reported spendingover 5100 in the spring quarter, 1979, for books and supplies,

Table 19. Weightelipircentage distribution of curriculum students enrolled fa'the North Carona* Community College System, 1979, by program, sourceof most influence to attend, and source of first information aboutprogria
Variable
I Curriculum studentsCollege-transfer
Generaleducation
Specialcredit Technical Vocational
Source of most influence toattend:Institutional personnel(recruiter.,.etc.%)Institutional literatureMediaEmployer4 yr college/universitypersonnelHigh school personnel
(MotherFather .
SpouseChildOther relative'Another studentFriend, not studentSocial service agencyOther not listed
e
.
'9,6
5.31.8'
A
6.11014 8.47.70.64.57.06,70.7
.22.1100.0(1454)
.!
'
10.0
6.7.
0.85.91.9,
2.74.1 '
3.114,31.84.515.04.0
"1.1_ai2
Mii
$'
,,"3.3
22.7.
9.54.78.43.1
0.82.40.98.70.5
6,47.70..4
11ZI
8.
8.91,75
6.21.4
5.8' 8.5
4.09.60.84.3
10.16,31,4
Za....t
10.43.55.30.8
4 57 53
100
8,25,72.2
21 5160.2(465)
1007/(7043)
100.0(2469)
0
*Source of first informationabout`program:Institutional personnel 21.0 21,1 18.5 18,9 18.0
(recruiter, etc.)%
lostitutional literature . 23.3 ' 28.9 21.1 27.3 22,3
a

Table 19 (continued)
VariableCurriculum students
College-transfer
Generaleducation
Specialcredit Technical Vocational
Source of first informa-tion (contd.)*Media 2.3 0.8 8,0 3.2 4,9Employer 1,6 1,7 8.2 4.3 3.74 yr college/university 3,0 3.6 2,5 1,0 0.9personnel, .
High school personnel 8,6 4,5 1,2 7.9 i. 6.5Mother 1,7 1,4 0.7 1,3 v 1.8Father 2.3 1.6 1.1 1,1 1,4Spouse 1,4 2.1 0.9 1,2 1.4Child 0.1, 0,3 0,0 0.1 0,3Other relative , 4.2 2,0 2.6 3,2 4.Another student 8,9 16,7 16,3 12.6 13.4Friend, not student 5,6 4,0 6.2 5.7 6,6Social service agency 0.3 0.6 ,0.5 1.0 1'.6
Other not listed 15,5 10.8 12,4 11,2 12,4Total 99.8 100 1 100.2 100.0 100,1
(1466) 1096) (466) (7079) (2480)
ti

Table 20. Weighted percentage distribution of curriculum students enrolled inthe North Carolina Community College System; 1979, by program, source ,
of f inanCial aid, amount of financial aid, and cost A, 'books ansupplies this quarter
Variable..
purrarulum studentsCollege- General i.Specialtransfer educationj\credit Technical Vocational
'
Source of financial aidaCLTA D 0.2 $.1
(6) (1)
6E00 12,6 10,2
AgoGb . 0.4 0.4(236) (49)
Educatioloal
Scholarship
SSEBb
loan
i
(12)0,8(12)
, 4,0
(80)
3.7(77)
4
(3)
0.0(0)
1.0' 3.1 6:7(8) (343) (210)
0.6 16.7 14.6
(15) (16001 (536)
0,1(2) (81) ' (24)
0.9 .2 0.8(3) ) (35)
0.1(3) (227 (32)
1,9(1)
wil0.9
1.2f
3.9 . 3.5
0.8
(9) (7)(L72.9 (1:89.2VAEBb
V8), (14) a822)13,5 " 25,7 0.0(ln (718)
.,' ,NCSIV -.L
',IV
(15)
Mort -study 2.8(46)
. vocab 0.49)
None 65t0(900)
0.1 0.0 0:5(1) (1)* (61)
1.6 0.1 2.9(8) (2)
(2_ 0.2 0.0 .g7.)8'(2) (0) (68) ..
63.5 93.'0 49,7(166) , (147) v. (3030)-
,Amount of financial, aid'.
None . 67.5 63.9 94,8 p 52`.0
Less tban $200 a 1.6 0*7 3,1
I 200- 399-..
.1
4 .4 4 , 4.6 0.0 5.
41
0.3(12)1,8
(46) _
1.9, *.
(59)46.8(991)
52.92,95,7

..
Table 20 (continued)
- VariableCurriculum students
.oliege-transfer
Generale ducat ion
Specialcredit Technical Vocational,
Amount of financial aid(contd.) T.
$400- 899$700- 999
$1000-1499$1500-1999$2000-2999$3000 or more
Total
4,66.33.22,92,75_1
4,0 ,3.52.93.61.4
12.6
1.40'.5
. 1.6L 9.2
0.30.5
4,87.75.34,16.810.5
5.05.9
4 5.24.36.211 91
100.1 100,1 100.0 99.9 100.0(1259) (295) ' (463) (6990) (2474)
Cost 6f boots and supplies'It \
this quarter r
None 7,9 1.8 24.8 5.2 . 18 4
Liesa than/ $2 24.4,, 28.9 -t45.8 18.2 29.2$ 24- 49 2946 33.6 20.4 31.5 '411ir 22.3
$ 50- 74-.1te5.s.15
22.0 6. 5 24.3 13.4
$ 75- 99 8.2 6.7 1,6 10.2 4.9
5100-149 4.3 3.6 0:5 5.8 6.5$150-199 0:8 2.2 0.4 2.0 2.7$200 or more 111 1_,_3 1,2 2,8 7-
Total 100.1 1(0.1___2.1.100.1, 100.0
___,__2
16C1(1466) (296) (466), 40(7085) (2493)
re-ponses precluded overall totals.
bCETA = Comprehensive Employment and ;raining Act;BEOG - Basic EducationalOpportunity Grant; SEOG - Supplemental Educational Opportunity Grant; SSEBsocial security educational benefits; VAEB - Veterans Administration educationalbenefits; NCSIG - North Carolina gtudent Incejtive Grant; and VOCR = VocationalRehabilitation,'
("i

70
compared to 12% of cational and 11% of technical students(Table 20), Spec credit sj.hdents vent fewer dollars onschool expenses than did the students 'lb all other curricu-
lum prd'grams. 4 f
Oft
Education and Employment Plans
Major differencewere ob;erved between curriculum pro-gram -enrollees in terms of their plans to pursue a four-yearcol lege degree Perhaps the most interesting finding wasthat 24% of tile special credit students already had a college
degree (Table 21) . And, 6% of the college-transfer students,4% of Vhe technical students, and 5% of the vocational stu-dents also had completed a four-year college degree. Three-fourths of -the college-transfer Students, 68% of the general
education students, and 41% of the technical students indi-
cated a desire to continue working toward a four-year college
degree The smallest proportions of, curriculum students as-piring to such a degree were in special credit (25%) and vo-
cat tonal (18%) programs.
Special credit, technical, and vocational students we refirmer in their plans,to work in North Carolina after comple-
tion of ,their educational programdthan were the collegsctransfer or general education students (Table 21), lb e
college-transfer students were least 1.kely to give a Ai-nite -yes," they planned to work in North Carolina, this-group also had the smallest proportion of responses indicat-ing a definite -no," Apparently, these students,were some-wha unceftain about their future work plans. Over 75% of
the upat ion-oriented students 146dicated a-relatively strong
c0111111 efft to being employed in North Caroll,nt upon comple-tion of their program.
Students Being Served in ContinuingEduc a t ion Program Area
Selected demographic, socioecgoomic, academic, and atten-dance characteristics of students enrolled in the vaiious con-tinuing education programs are examined in this section. (An-
alyses related to additional characteristics within these
categories appear in Appendix Tables 15-19%) The specificprOgrams discussed are academic extension, fundamental educa-tion and occupat Iona 1, ex tens ion Data re arding recreation4xtension programs were be leted from the because
only. 10 of the survey respondents Imdicat they were en=
rolled in recreation extension.

'Table 21. Weighted percentage distribution of curriculum students enrolled inthe North Carolina Community College System, 1979, by program, plansto work toward a four-year college degree, and plans to work in NorthCarolida upon completion of educational program
VariableCurriculum students
College- General Specialtransfer education credit Technical Vocational
Plans to work toward a 4 yrcollege degree.Already haveThink soDo not knowProbably notDefinitely not
Total ,
Plans to work in NorthCarolina upon completionof educational program:
5.6 0.875.2 67.79.2 13.27.1 8.02.9 10.3
100.0 100.0(1460) (297)
Yes _. 35.2 40',5Think so 32.0 30.1Do not know 24.6 16.3Don't think so 4.8 3.2Definitely not '3.4 LI
Total 100.0 10.0(1454) (294)
23.7 4.1 4.6 i25.1 41.2 17.717.0 28.2 29.219.3 17.6 26.915.0 8,8 ALI
100.1 99.9 160.0(465) (7074) (2489).
'52.1 46.4 49.416.9 % 29.4 25.e
' 15.4 15.7 15.74.3 4.4 3.5
11,4 4.1 A21100.1 100. 418(462) (7057) .(2492)

72
Demographic Characteristics
Selected demographic characteristics discussed in this
section are: age, sex, race, marital status, and veteranstatus.
Age11111r/
The uungest continuing education students were in funda-mental edUation--56% were under the age of 30 as contra*ted ,
to 31% of the occupational extension and 22% of the academicextension students (Table 22):-./1 larger percentage of the
academic extension students (27%) 'were 60, or older than were
under 30 (23%).
Sex
The proportions'of malet'and females enrolled in continu-
ing education programs varied greatly among specific programs
(Table 22) linly 18% of the academic extension respondents 1 .
were males as compared to 31% of the occupational extension
respondents The smallest proportion of females (55%) was infundamental education programs,
Race
Nonwhite 'students made up a relatively small proportion
of the enrollment in academic extension programs, whereas 21%
of the occupational extension students were nonwhite, as were
over 50% of the fundamental education students (Table 22).
Maiital StatusI-IC
Little difference was observed between academic and oc-cupational extension students in terms of marital status; the
majority we;e Married and approximately 15% indicated theywere widowed (Table 22), However, fundamental education stu-dents were more often single or engaged, A relatively largeproportion (9%} of this group were either separated or di-
vorced, 4,
Veteran Status
An overwhelming majorPity of the continuing edUcationstudents were not military veterans (Table 22), The largestproportion of veterans (13%) were enrolled in fundamental
education,
(j ,

Mit
73
Tab 1g 22. Weighted percentage distribution of continungeducation students enrolled in the North CagolinaCommunity College System, 1979, by program, age,sex, race, 'marital status, eand veteran status
Variatm ble
C,ontknuing education studentsAcademic Fundamentalextension education
Occupationalextension
Age, yr40
22 or less 7.7 33.8 10.9
23-29 14,8 21.5 19,7
30-39 19,5 15.7 22.1
40-49 16.1 10.2 12.6
50-59 14,9 6.9 13.0
60-69 13.7 6.7 10.7
70 or more 13.3 4 11.0
Total 100.0__5100.2 " 100.0
(1338) (723) (2256)k
Sex 11111
Male 17.7 45.2 30.6
Female 82.3 54,8 69,4
Total 100.0 100.0 100.0
(1345) (732) (2297)
RaceBlack kf 10.1 52.1 18.9
American Indian 2.8 2.1 1.2 ,White 86.5 44.6 79.4 -1
Asian 0,3 0.4 0,2
Other 0.3 0.8 0.4
Totfrl 100.0 100.0 100.1
(1329) (728) (2254)
Marital status.Single/engaged 12.3 46.0 14.3
Married 67.4 38,2 63.9
Widowed 13.5 7.0 14.6
Separated 2.6 4.1 2.7
Divorced 4.7 4,5
Total . 100.16 100,0 100.0(1354) (731) (2276)
Military veteranYes 6.2 12,9 .11.3
No 93,8 87,1 88,7
Total 100.0 100,0 100.0
(1328) (728) (2275)
I
Q --J

74
Socioeconomic and Academic Characteristics
The socioeconomic characteristics of continuing educa-t.tion students discussed in -this section re (1) Student'seducation, (2) father's educatiol, (3) mother-'s-- education,(4) student's income; (5) parents' income, (6) primary income,(7) occupation head-of-household, and (8) student'Eiamploy-ment status. The academic characteristic is prior fult*ctimeenrollment in a fodr-year college /university.
Education--Student and Parents
Academic extension students reported higher levels ofeducational attainment thn students in the other two continu-ing education programs (Table 23). Twenty-two percent of theacademic extension students had at least a tour-year collegedegree as,ocompared to 16% of occupational extension and lessthan 1% of fundamental education students. At the other. ex-treme, 37% of the fundamental eckication students had lessthan a ninth -grade education as compared to 14% of eitheracademic or occupational extension students.
The educatiobal levels of parents and students were simi-lar for the academic and occupational extension groups (Table23). Holiever, the parents of fundamental education studentshad relatively little formal education; over 60, of these stu-dents indicated that their fathers' had no more Than an eighth-grade education.
,Income--Student, rents, and Primary 41
Academic extension students typicilly reported the high-est student incomes for 1978, followed by occupational exten-%sion and then fundamental education.students (Table 23):Twenty-six percent of the academic extension students reportedincomes o over $20,000, compared to 21% and 5%, respectively,of occup ional extension and fundamental education students,Fundtmen al education students had markedly less income, asevidenced by the fact that over 50% reported 1978 incomes ofless than $4,000.
Although t large proportion of the continuing - education'respondents indicated their parents were deceased (Table 23),an obvious difference 'existed with regard to- 1978 parentalincomes when observed by program in which the student was en-rolled. The parents of fundamental education students typi-cally had much lower incomes that parentg o' academic or oc-cupational extension students. Thirty-five percent of thefundamental education students reported 1978 parental incomeAof less than $5,000.

75. _
Table 23. Weighted percentage distribution of continuing
ati
education students enrolled in the North Carolina1Community College System, 1979, b program, stu-dent 's education, father's educ ion, mother'seducation, student's 1978 :income, parents' 1978tdcome, primary 1978 income, occupation headzof-household, student's ettployment status, and priorfull-time enrollment a four-year college/
1 university .r.Continuing education students
Academicextension
Fundamentaleducation
'Occupationalextension'
Student's education:Less than 7th grade7th-8th grade9th-llth grade
6.87.1
13,0t
19.61'7.1
54,3
----8,06.4
13.3High school graduate 29.8, 4.7 34.7GED 2.0 1.8 3.6High school 1 yr as .8.7 ' 1.5 6.3High school . 2-3 yr 11.2 0.6 11.5College graduate 14. 5 0.5 10.9Graduate work 7.0 0.0 5 5.-
100.1 100.1 100.Total'(1310) (700) (2175)
Father's education-%less than 7th grade 29.7 43.9 28.947th-8th- grade - 20.6' 17.2 18.99th-llth grade 11.7 12.8 15.2High school graduate 19.0 18.8 22 3GED 1 1 1.6 1.4High school', 1 yr - 2.8.8 r 0.9 2.5High school 2-3 yr 5.4 2.9 3.7College graduate 6.7 3.5 4.5Graduate work 3.0 0,6 2,7
Total 100.0 100.2 . 100.1(lre3) (652) . (2017)
Mother's education:Less-than 7th grade 24%4 35.2 23.3-7th-8th grade9th -llth grade
18.016.8
14.622 1
17.019.1
High school graduate 24.5 18.4 26.3GED 0.9 2.6 0.8High school , 1 yr 3.0 1.5 3.5High school , 2-3 yr 7.1 3.1 4.2-College graduate 3, 5 2.2 4.5Graduate work 1.3 ' 0.5 go 1.3
Total 100.1 100.2 100.0(1202) (664 (2022)

76
Table 23 (continued)
VariableContinuing education students
Academicextension
Fundamentaleducation
Occupationalextension
St e nt's income, 1978:iLe s than $2,000 11.1 31.3 14,9
$2,000- 2,999 4.6 13.0 5.1
$3,000- 3,999 3.8 7.5 4.7
$4,000- 4,999 3.1 4.7 3.2
$5,000- 5,999 2.4 7.2 i 3.3
$6,000- 6,999 4.2 4.4 3.8
$7,000- 7,999 4.0 3.7 4.4
$8,000- 9,999 6.5 4.7 sr 7:2
$10,000-11,999 9.3 6.8 7.6
$12,000-14,999 12.0 7.5 11.0
$15,000-19,999 lild. 4.5 .13.7
$20,000-24,999 105 2.9 9.6
$25,000 or more 15.4 1,8` 11,5
,-- Total l0a.0 100.0 100.0(1205)` (653) (2026)
Parents' income, 1978:Less than $2,000 5.1 5.2
$2,000- 2,999 3.4 761 3.1
$3,000- 3,999, 2.7 . 7.6 / 3.9
$4400- 4,949 2.7 6.1 2.7
$5,0d0- 5,999 3,2 4.1 2.8
$6,000 6,999 3.9 6.4 3.5
$7,000- 7,999 4.0 4.3 4.5
$8,000- 9,99 5.2 4.9 6.2
$10,000-11,999 6.0 6.6 4.8
$12,000-14,999 6.1 5.4 6.0
$15,000-19,999 6.4 7.5 8.0
$20,000-24,999 4.8 2.1
$25,000 or more 7:2 5.5 10.0
Parents deceased 22.5. 19.7 11.tTotal 100.2 100.0 100.0
--s.)
(890) (554) (1'609)
Primary income, 1978,Less than-$2:000 9.5 24.8 12.9
$2,000- 2,999 4.3 12.8 5.2
$3,000- 3,999 /3.5 7.0 4.4
$4,000- 4,999 3.0 5.2 3.1
$5,000- 5,999 2.4 7.8 i.3
$6,000-46,999 3.8 4.9

77L-
Table 23 (continued)
VariableContinuing education students
Academic Fundamental Occupationalextension education extension
Primary income, 1978(contd.) :$7,000- 7,,999 __$8,000.69,999
' 644
.
0
$10,000-11,999 9.5$12,000-14,999 12.4$15,000-19,999 13.8$20,000-24,999 10.9$25,000 or more 16.4Parents deceased 0.2, Total 100.1
(1274)
Occupation head -of-household'
;
Professional/technical 13.7Manager/owner 13.8Sales 1.1
Clerical.' 6,1
Crafts 11.5Operative 5.5Transportation &1 7
-Labor, nonfarm 1.5Farm owner/maniger 3.3Farm worker 0.5Service 3.2Domestic 0.6Student) retired 18.0
Homemaker 3.16
Othiis not listedotal
If al100.2
4.95.07.38.45.83.12.4
4.57.67.9
11.314.5'9.711.90.0
logo(22T4)-
3.0 12.43.1 9170.0 _./7 1.45.7 5.9
9.1 7.117,1 13.7
5.9 1.94,1 3.11.6 2.42.5 1.0
10.1 7.02.6 1.39.4 15.3
. 4.3 2.6
-'21....§100.1
_1121100.2
(1294) (713)
Student's employmentstatps: a.
F,u111 time 38.0 47.1
Part time 9.0 12.3
Homemaker 27.6 6.8
Retired 20.6 11.0Unemployed f
,__2_,Z .21...2
Total 99.9 100.1(1319) (730) .
re
(2173)
,48.210.013.714.7
_1211100.1(2260)

78
Table 23 (continued)
VariableContinuing education students
Academic Fundamental Occupationalextension education extension
'Prior flail-time enro'l-sent
..in 4 yr college/
university:Yes d 29%5 1, 23.7No 70.6 98,4 76-3 .
Total 100.1 100.0 100.0(1347) (729) (2286)
, w ,
The current socioeconomic status of continuing educationstudents was approiimated by calculating the 1978 primary, in-comes of the respondents (Table 23). These data indicatedclear socioeconomic diTferences between the three groups.Forty-one percent of the academicextension group had primaryAncomes of over $15,000 as did ?611, of the occupational extvi-sion group; only 11% of the fundamental edudationrespondentsreported 1978 primary incomes of this amount,
Obse ations of all three of these income measures--student's parents', and primaryindicated,that academic ex-tens udents had the highest socioeconomic status, funds-men al education 4tudents the lowest, and that occupationalextension students fell somewhere in between.
Occupation Head-of-Household
Academic, and occupat nal extension students were fromfamiliesin which the hem of-household was more likely to bein a white-collar occupati a i.e"., professional/technical ormanager/owner (Table 23). Titenty-seven percent of thtaca-demic extension and 22% of the occupational extension Itu-dents reported white-collar occupations for their heads-of-household. This was in contrant to 6% of the fundamentileducation students; the ii heads-of-household typically werein blue-collar occupations. A relatively large proportion ofthe academic and occupational extension respondents indicatedthat their heads-of-,househoLd were in the "student" or "re-tired" category.
1'
Student's Employment Status
The largest proportion of full-time and part-time es-ployed students were in fundamental education (59%) and

It
occupational extension (58%) . . Ho
Lion of unemployed students also'lion, with nearly 23% unemployedtime, 43% of the academic extensionhomemakers or retirees,
largest propor-enial educa-At the same
were either
Prior Full-Time Enrollment at aFour-Year College/University.
79
With regard to the academic characteristics, prior full-Lim enrollment at a four-year'college/university, 30% of theacademic extension students indicated that they had been soenrolfed, as had 24% of the occupational extension fitudents(Table 23). However, less than 2% of the fundamental educa-tion students reported such enrollment.
Attendance Characteristics
Selected attendance charlitteristics of continuing educa-tion students discussed in this section Ire: (1) time of at-tendance; (2) location of classes; (3) distance to class, oneway; (1) would have attended another institution had this onenot existed; (5) this institution was first choke; (6)source of most infLuence in decision to attend; (7) source offirst informatitm about program in which enrolled; (8) ex-penses for books and supplies this quarter; (9) plans to en-
' roll in a degree progfam; (10) plans to fork toward a four-year college degree; and (11) plane to work in North Carolinaupon completion of 'program!
Time of-Attendance. Location ofClasses, and Distance to Class
Approximately 60% of the students in all three continu -/'ing education programs attended evening classes. In ,the caseof academic extension students, 61% attended classes/at someoff-campus site other they the residence, place of work, or abranch campus (Table 24). Approximately one-third of thefundamental education and occupational extension students at-tended classes on the main -campus.
Continuing education students traveled short distancesto class. This statement can be qualified somewhat by look-ingat students within specific programs (Table 24). For ex-
' ample, 29% of the #undamental education students traveledlepti than one mile to class as cdspared tO 23% of occupational.Sit-ensign and 18% of ac'ademic extension students. In fact,over three-fourths of the continuing education students inall three programs traveled 10 or fewer miles to class. .
ti

.
80
Table 24. Weighted percentage distribution of continuingeducaeton students enrolled in the North CarolinaCommunity College System, 1979, by program, timeof attendance, locatickn of classes, and distanceto class
VariableContinuing education students
Acaderac Fundamental Occupationalextension education extension
Time of attendance'Day 39.6 39.8
Evening 60.6 60.2 61.8
Total 100.0 100.0 100.0(1346) (729) (2289)
Location of classes*'aim campus 18,3. 37.2 31.1
Residence/work 7,2 9'8 12.4
Branch campus 13 4 8.4 7.5
Other off-campus site 61,2 44,6 49.1
, Total 100.1 100.0 100.1
(1335) (725) (2261)
Distance to class, oneway, mi
.
Less than 1 18,0 29.0 22.6 '
1-5 36.6 36.9 35.7
6-10 24.2 18,4 19.6
.11-15 10.7 8.6 10.6
16-20 s 5.1 3.7 5.3
21-25 3.7 1.7, 2.7
26-30 1.1 0.9 1,4
31-35 ,gore than 35
0,20,4
0.5. 0.3
0.71.5
Z' o ti 1 100.0 100.0 100.1(1346) (728) (2294)
Choice of Institutions
When asked if they would pave attended another institu-
tion had,their institution not existed, a large majority oil*
the students in all three continuing education programs re-
sponded negatively. In response to the question - -las thisinstitution your first choice for continuing education7--aliost ,94% of these students responded affirmatively (Table
?5).

JTable 25. Weighted percentage distribution of continuing education
students enrolled in the North Carolina Community College aSystem, 1979, by .program and choice of institutions
Variable
Would have attended anotheripstitution had this one
Continuing education studentsAcademlc Fundamental Occupationalextension education extension
not existed:YesNo
Total
14.285 9
33.067.0
22.577,5
100.0(1327)
100.0(729)
100.0(2256)
41-This institution first choice.'Yes 93.9 93.1 93.9No, another CC or TI 1.7 1.9 1.7No, private 2 yr college 0.4 0.3 6.4Ito, private trade or, profes-sional school
0.2 1.4
No, public 4 yr college/university
1.6 0.5 2.Q
No, private 4 yr college/university
0.1 0.4 0.3
No, another type of schoolnot listed
2%2 2.5 1.4
Tptal 1567T 100.1 To1:77(1282) (729) (220 5)

82
Source of Most Influence to Atand Source of First informationAbout Program
Students in all three continuing education programs in-dicated that recruiters or'other institutional personnel hadthe greatest influencts. on their decision to attend (Table 26).The second most influential source was "other than listed" in.the survey instrument. Third in influence were other stu-dents for academic extension students, social service e.gen-%cies fo,r fundamental education students, and employers foroccupational extension student.
The larger proportions of students in all three continu-ing education programs reported that recruiters or other in-stitutional"personnel also were their sources of first infor-mation about the program in which they enrolled (Table 26).The second most frequent sources of first information were,for academic extension students, another student; for occupa-tional extension, students, mass media; and for fundamentaleducation students, a friend who was not a student. Thethird most frequent sources of first information were massmedia for academic extension students, social service. agen-c les for fundamental education students, and institutionalliterature for occupational extension students.
Expenses_
The cost of books and supplies for the spring quarter,.1979, was less than $z,g_ for over 65% of the continuing educa-tion students (Table 27). Fundamental education studentspaid the least and academic extension-students .paid the mostfor books and supplies:
Education and Employment Plans
Over 60% of the fundamental education students &Aimedto enroll in a degree program at some later date. This wasin contrast to 20% of the academic extension and 24% of theoccupational extension students (Table 28). The proportionswho planned tO work toward a four-year college degree weremuch smaller in all categories. Twenty-one percent of theacademic extension and 16% of the occup ;tional extension stu-dents already had s four-year college degree. Almost two-thirds of the fundamental education group planned to work inNorth Carolina, as did well over 50% of thetoccupational and42% of the academic extension groups. Thirty-eight percentof the academic extension students planned to be homemakers'or retirees, as did 26% of the occupational extension stu-dents. These plans sere consistent with the relatively olderage of academic and occupational extension students.

Table 26. Weighted percentage distribution of continuing education studentsenrolled in the North Carolina Community College System, 1979, by'program, source of most:influence to attend, and source of firstVformation about program
VariableContinuing education students
Academicextension
Fundamentaleducation
Occupationalextension
Source of most influence to attend:Institutional personnel (recruiteretc.)Institutiodal literature
$
27.4
p8.2
22.5
1.5
24.6
8.2
Media 6.6 .1.9 8.0
Employer 1.5 4.2 10.54 yr College/university personnel t. 0.5 0,7 0.8
High school personnel 0.2 3.0 0.4
Mother 2.3 6.7 1.6
Father 0.2 2.3 0.5Spouse 7.1 8.7 6.2
Child 2.1 1.9
Other relative 6.7 1 t.79 4.5
Another 09dent 13.2 5.7 7.8
Friend, no, student 7.2 9.1 6.1
Social service agency 1.0 10.3 1.4
Other ttot listed 15.7 16.7Total 99.9 99.9
_11,1100.1
Source of firstprogram:
information about
(1328) (724) (2252)
Institutionaletc.)
personOnl (recruiter, 28.4 29.0 25.8
Institutional literature 11.5 3.2 12.3
*Media 12.6 6.0 14.1
Employer 1.1 2.9 10,1

1
--.
Table 26 (continued) co
'VariableContinuing education students
Academicextension
Fundamentaleducation
Lccupat ion alextension
.Source of first information (contd.)`' . /4 'yr college/uAvers it y personnel, 0.2 2-,3t..., 0 5High school personnel 0.1 6 4 0.6Mother 1 , 5 2 5 1 2
`Father 0.1 0 8 0.3Spouse 2,6 2,5 1.9Child . 0.8 1 6 0,9Other Relative 6,7 4 0 4,5Another student 14,7, 9.8 8 9Friend, not student 7.3 10 4 5,9Social service agency 0.8 9.8 1.2Other not listed 11,7 8,7 12.0
Total 100 1 99.9 100.2,(1332) "8(729) (2259)

85 s
Table 27. Weighted percentage, distribution of continuingeducation students enrolled in the North CarolinaCommunity College System, /1979, by program andcost of books and supplie4 for this quartei\
Cost of books andsupplies for this
quarter
Continuing education studentsAcademic Fundamental Occupationalextension education extension
None 28.2 60,81,1L 42.3
Less than $25 37.0 34.0 4 41.9
$25- 49 19.4 3.3 9.4-
$50- 74 6.7 1,0 3.9
$75- 99 3.3 0.0 0.9
$1150-149' 2.5 0.4 0.9
$150-199 1.1 0.3 4 0.1
$240 or more 1.9 ) 0.3 0.6Total 100.1 100.1 100.0
(12941 (725) , (2254)
Value Orientation Toward Education=
There were noticeable differences among continuing edu-cation students in terms of why they decided to cont inuetheir education (Table 29). Academic extension students in-dicated that their four major reasons were to learn thibgs ofinterest, to become more.cultured; to meet people, and td con-tribute more to society.- At the same time, occupational ex-extension students wanted to learn things of interest, earnmore money, contribute more to society, and gain a general
education. In contrast to these two groups, fundamental edu-cation students were seeking to gain a general education,earn more money, get a better job, and' ontribute more to so-
ciety. Clearly, the value orientations of these groups dif-fered-, with each motivated by a characteristic cluster ofgoals.
COmparisons Between Curriculum and Continuing;Education Students larolleb;:in theqNorthCarolina Community College System. 1979,and North Carolina's Projected 1979
Adult Population A
. One of the primary objectives of the NCCCS, as set forthin the Report of the Commission. on Goals (1977, p. 11), is"to make educaTon accessible to all North Carolina adultsregardless of age, sex, socioecodOmic status, or ethnic back-ground," The System's effectiveness in meeting this objec7tive was measured by comparing selected demographic end,
t
I

A
Table 28. Weighted percentageAndistribution of continuing education studentsenrolled in the North Carolina Community College System, 1979, by a)
program,_plans to enroll 4n a degree program, plans to work towarda four-year college degree, and employment plans after education
VariableContinuing education students
Academic Fundamentalextension* education
Occupationalextension
Plan to enroll in i degree program.Yes 19.4 60.5 24.4
80 6 39 4 75 6Total 100.0 99.9 16670
Plan to work toward a(1308) (721) , - (2245)
4 yr college degree:Already have a:" 20.9 0.4 \IS:8Think' so 5.9 23,8 \ ,-8
Don't know 9.7 25.6 , 14.8PrObably not 18.7 23.1 21.0Definitely dot 44,8 27 0 6.()
Total 100.0 99 . 9 00. 0
(1305) (728) (2239)
Employment plans after education:
V
Probably or definitely work in, North Carolina'
41.7 64.3 , 59.0
Work in another state 2.0 6.3 1.9Military service 0.4 2.6 0."3 I
Marriage, homemakerRetirement
15.023.1
3.58.3
9.316.7 4
Other 17.9 15.0 12 9Total 100,1 100.0 100.1
(1235) (729) 12168)r,
1

Table 29. Value orientationeloward'education of continuing educatiop studentsenrol ed in the North Carolina Community College* System, 1979, by,program, rank omder of responses, and raw scores t(RS)a
Reasons to coetinue ethication
To con ribute tore to societyTo ea more Money
. To come more culturedTo gait!, A'general education
. To get 'a better JobTo improve my reading & study skills.
improve my social life. To earn more things of interestTo 'meet interesting peopleMy parents or spouse *anted me toThere was nothing better to do
H.
lContinuing education students'
Academic Fundamental Occupationalextension ebucation extensionRangy RankRSRank Rank RSb
..
. .40.28 4 25.17 3 98.3927,18 2 34.96 2 108.54r 53.26 7 13.19 5 75.88
6 9.06 1 36.40 ',. 4 89.1884..16.81 3 32 52 7 74.33
10 14.49 ' 5 24.26 9 '36.99'51' 34,4 8 10.66 8 61 571 87.75 6 20.-95 1 156.573 52,86 10 7.25 6 75.59
i 11 12.17 ,. 9 7.62 11 22.15f. 9 16.11 11 4.97 10 25,95
aRS (raw'score) is "the weighted frequency times the' convetted rank vklue;each first choice multiplied by 5, each second by 4, each third by 3, and so on.
b Raw score values are in tens' of thousands, e.g., 40;2814 10,000 = 402,800.
1

88
0-
Sihcloeconomic characteristics of students with those of theState's adult population, Because nine years Had elapsedsince the 1970 U.S. Census report, 1979 adult population pro-jections were developed to use as a comparison base in thissurvey of student enrdllments. As noted,earlier, these pro-
. jections were calculate by R, David Mustian, Professor ofSociology, North Carol i tate University.
_ The demographic chara ter ist ics compare d were age, sex,and race; the socioeconomic eharacteristics were student'seducation, primary' income, an thoccupat ion he a d=of -gousehold.
_1511ferences between, these stuaent 0taracteristics and corre-sponding characteristics of the adult population were tested
, statistically through the chi-square goodness-of-fit testwith significance of the differences set at the .05 level.
race.
*Age
Demographic Comparisons
Dargraphic characteristics compared were age, sex, and
Although the age distributions of curriculum studentsclosely paralleled the age distributions in the projected1979 adult population, enrollments in curriculum programswere skewed toward the younger age groups (Table 30). Ap-proximately 39% of the,curriculum students surveyed wereunder 23 years of age, more than double the proportion ofthis age category in the North Carolina adult population.Adults 40 years of age and older were seriously underrepre-sented among curriculum students, comprising 13% of the stu-dents and 49% of the North Carolina adult population. Chi-square analysis revealed that these/differences are statis-tically significant (.05 level).
The observed differen between age distributions amongcontinuing education. e and the adult population
ft*** minor and not stat significant (Table 30) .Continuing Cducat I st presentee& slightly smallerproportion 'of the -q2 We group and a slightly larger pro-portton of adults who...ivere over 69 years of age than might beexpected trim examiciNg the adult 'population, but the differ-,- ences were too' slight to be attributed to anything other than
:chance. In terms of age distribUtions,. the North Carolina1979 projected .adult population appeared to be well repre-eented continuing education programs, while older adultswere serrously underrepresented in the curriculum programarea

89.1
Table 30. Weighted percentage distribution of curriculum and'continuing education students enrolled in theNorth Carolina Community College System, 1979, andthe projected 1979 adult population of North Caro-lina, by age, sex, and race
VariableNorth Carolinaadult popula-
tiona
StudentsContinuing
Curriculum education
Age, yr. -LJ18-22 14.9 39.1b 13.1
23-294. 17,-1 28.0 18,5
30-39 19.3 19.9 20.540-49 14,5- 8.3 ,13.3
50-59 14,1 2.7 12.7
60-69 . 11.2 1.8 11.070 and older 8.9 0,3 10,9
Total 100.0 o .100.1 100.0. (4,057,951) (11,774) (,327)
Sex-Male 47.4 46,4 28.8c
Female 52,6 53'6 71,2Total 100.0 100.0 100.0
(4,057,951) (11,835) -P(4,384)
Race:White 78,9 76.5 76.8
Blatk 20.1 20.9 20.8
Other 1,0 2,6 ' 4
Total 100.0 100.0 11).0(4,057,951Y' (11,743) (4,320)
aIn this and succeeding tables, the North Carolina adultpopulation figures are projeetions for 1979 made by R, DavidMustian, Professor of Sociology, North Carolina State Uni-vers'ity at Raleigh,
b,2. 25,46, df = 605 level,
eN2 = 7.34, df = ; ,05 level,

k
90
Sex
When the distribution of burriculum students was cosi-pared to that of, the State's projected 1979 adult' populationin tOrlifit of sex, it was observed that 54% of curriculum tu-dents were females and that,fnmales represented 53% of .theadult population (Table 341.).. This slight differende is notstatistically significan't,.. However, the ratio of males, (29%)to fakales (71%) in continuing education programs did notmatch that in the adult population. This difference is sta-tistically significaq (.05 level) Thus, while curriculumprogram enrollments reflected a proportional representationof the North Carolina projected 1979 adult population interms of sex, males were cOnsiderably underrepresented incont inuing education 'pro grants
Race
\
The proportion of students enrolled in the NCCCS in 1979who were white and nonwhite matched the 1979 projected NorthCarolina racial distributions. This was true for both cur-riculum and continuing= education stAnts Twenty-one per-cent of the students were black as compared to a projected20% for the Statar's adult. population, The institutions maybe enrolling a slightly highei proportion (3%) of other non-White -racial groups than exist in the Nortb Carolina adultpopulation (1%). Hope of tfie racial distributions differedsignificantly when the State aj1 student populations werecompared (Table 30).
Socioecopo ic Comparisons
As stated earlier, soot onomic-comparisons between1979 NCCCS student enrollments and the North Carolina pro-jected 1979 adult population were by Student's educatidn,primary income, and occupation head-of-household
',Student's Education P.
Differences were noted- between the educational attain-ments of North Carolinsin. projected 1979 adult population andstudents enrolled in the NCCCS, 1979 (Table 31) However,theme differences were statiatically significant (05 level)only when Curriculum eprOfients were compared to allt adultpopulation.
Adult's with a grammar school education were underrepre-sented in curriculum programs. Those adults comprised one-third of the State's adult population but less than one-tenthof the curriculum studsn't enrollments. High school graduates
A

91
Table 31. Weighted percentage distribution ofctirriculum andcontinuing education students enrolled in theNorth'Carolina Community Chllege System, 1979, andthe'projected 1979 adult population of North Oaro-lino, by student's education, primary income, andoccupation head-of-housebold
North CarolinaVariable adult pOpula-
tiod
a StudentsCdntinuin&
Curriculum education
Student's educations:Grammar school or less 24.9 0.8b 17.2Some High school 30.4 2.8 18.7High schoOl 24.6 47,8 '32,11-3 yr postsecondary 9.5 40.3 16.3College graduate 8.4 15.8or more
Total 100.0 100.1 100..1
(3,035,274) (11,515) (4,186)
Primary income, in1978 dollarsLess than $4,000 6.1 17.2c 24.1d$ 4,000- 6,999 7.2 , 12.0 11.0$ 7,000- 9,999 15.1 ' 12.6 11.
$10,000-14,999 21.0 /1.2 19.
$15,000-24,000 22.0 23.9 22.2'$25,000 or.more 29,4 13,0 11.9
Total 100.0 99.9 100.0
occupation hea"d-of-household*
(1,530,280) (10,747) (3,894)
Professiooal/technieal 11.0 15.9 17.6
Owner/manager 7.4 16.6 15.3Sales/clerical 20.1 14.6 10,8
Crafts/foremen 14.5 20.2 20.7Operative 26.3 13.2 14.2Labor, nonfarm 5.0 5.1 4.2Service' 10.9 10.6 11.5Farm . 4,8 3,9 3,5
Total ; 100.0 100.1 100.0(2,604,823) (8,339) (2,746)
aProjOCtionS based on North Carolina's 1970 adult popu-lation 25 years of age or older.
by? 71,96; df - 4; .05 level.
c,2 12.74: df = 5; .05,1evel.
ci)( - 18,97; df = 5; .05 level..
J
1 '

92
. were overrepresented; 98% of the curriculum students as com=pared to 25% of the adult population. And, 99% of the cur-riculum students ,reported education beyond high school, whileprojections suggested that only 20% of North Carolina's adultpopulation had completed this level of formal education.
!Similar differences existed between the adult populationand continuing education students, although of less magnitude,and none veils statistically significant. Persons who had notcompleted high school were underrepresented, forming 36% ofthe continuing education enrollments and 55% of the adultpopulation. Those4
in continuing education programs buteducation beyond high school were
OverrepreSente.donly 20% in the adult population. It appears that the NCCCSis serving a clientele that is better educated than the gen-eral adult population of North Carolina.
imary Income
Income comparisons' were made in termeof 1978 dollars,the year fot which students in the survey were asked to re-port their family income (Table 31). Distributions for cur-riculum and continuing education enrollments were based .uponprimary income, i.e., that of the family - -own or parental- -which the student identified as the major source ,of support.
Curriculum enrollments wee overrepresentative of adults'from the lower-income categorieV 17% of the curriculum,sta-dents repprted 22..1978 income of less than $4,000 compared toa 6% projection for the 'adult population. At the kipper range,29% of the-adult population was estimated to have $143 annualincome pf $25,800 or more be only 13% of the curriculum stu-dents were in that income category (Table 31).
Continuing education students also had 1pwer incomesthan the adult population. Twer`y-four percent of these stu-dents reported less than $4,000 1 1978; only 12% had incomesof $25,000 or more.
In both c rricu and continuing education programareas there a are to bit a serious overrepresentation ofstudents in 1 wer- ncome levels and a serious underrepresen-tation of students in higher-income levels, Yid -range incomecategories- -from $7,000 to $24,999--were fairly well repre-sented;
Chl-square analysis indicated that the ibprimary incomesof both curriculum and continuing edtication students differedsignificantly (.05,1evel) from that of the State's projected1979 adult population. - 4
1 '-

1
I'
t
93
Occupation Head-of- Household
When the distributions of occupational categories in theState's projected1979 adult population were compared to thoseof Students in,the NCCCS, 1979,'several differences were ap-parent (Table 31). The largest occupational group representedamong curriculise students was crafts/foremen (20%), while op- .
eratives (26%) was the largest occupation!' group representedin the adult population. Those groups 'Rost underrepresentedamong curriculum program enrollments were sales and clericalworkers, operatives, and farm workers, The professional/technical, owner/eanager, and crafts/foremen groups wereoverrepresented.
The largest proportion of continuing education studentsreported a crafts/foremen ocsupation for their heads-of-household (21%), a larger pr7:4.ortion than found in the NorthCarolina adult population (15%). Also overrepresented amonginrollments we re the professional/technical, owner/manager,and service classifications. The continuing education en-rollments were underrepresintative of the sales/clerical, op-.erative, nonfarm labor, and farm occupations.
Chi - square analysis indicated no significant differencesbetween the occupational distributions in either. curriculumor continuing education enrollments,in the NCCCS, 1979, andthat of the State's projected 1979 adult population.
Profile Changes in the Curriculum StudentPopulation. Between 1968, 1974, and 1979
The profile changes that occurred among the curriculumstudent population between the years 1968, 1974, and 1979 aredescribed inmthis section in terms of selected demographic,socioeconomic, and attendance characteristics.%
Demographic Characteristics
The selected demographic characteristics used in describ-ing.the pebfile changey were: kge, sex, race, marital status,location of institution, and persidence while enrolled,
The ?feces.. is serving an increasingly Cider curriculumstudent poptilaTion. Between 1968 and 1979, the proportion ofthese? students who were 19 or younger decreased from 49% to18%, *bile the proportion who were o'ver,_25 years of age in-creased from 19% to 47% (Table 32) .

,
06
94
Table 32. Weighted, percentage dist bution of curriculum .
-studenSs enrolled in th orth Carolina Com-mudity Chlege System, 8, 1974, and 1979,by ate, sex, race, marital status, location ofinattXuAion, and residence while enrolled
Variable Curriculum students1968 1974 1979
Age, yr:17 or less t 0.8 0.3 0.4
18 . 19.7 7.6 6.1
140, ", 28.4 14.6 11.924-.22 24.8 21.7 20.7,23-25 7.5 13.3. , 13.626-29 5.7 , 13.8 14.4
3(1.- 8.3 17.0 19.9
40-449 3.8 ' 9.2 8.3
50 or more 2,2t 2 5 4 8
Total 99.9 100.0 100.1(11,149) . (6,431) (11,774)
Sex.Male ... 67.8 60.8 46.4
Female 32.2 39'2Total 100.0 100.0
.536, 100.0
. (q,122) (6,992) (11,835)% .
Race-Black 12.3 16.e e0.§American Indlin 0.8 0.7 1.4
White 86.8 82.2 76.5Other 0.0 0.8 "1 2
Total 99.9 99.9 100.0(11,055) (6,920) (11,743)
Marital status: r .
Single/engaged 68.7 43.8 45.0
Married 28.1 5.0 45.1
,Widowed. r 0.8 0.8 1.5
Separated 1.0 ( 2.1 3.5Divorced 1,4 2,2 4,9
Total 100.0 99.9 100.0(11,131)(6,934) (11,822)
Location of institution:in home county 62.2 66.4 69.8Not in home county 37.8 33 6 30 2
Total 100,0 100.0 100.0(11,081) (6,921) (11,835)

.
,
95
Table 32 (continued)
Variable
1
Curriculum students1'968 1974 11,79%
Resid ce while enrolled:With arents . t 57.2 34,2 '31.3With pouse 24.6 49.8 . 43.6Roane] g studebt 10.6 1.3 0.8Other 7 5 14 7 24 3' Total 99,9 100'.0 . 100.0 *
(11,048) (6,759) (11,833)
Sex
Female enrollments continued to increase among the cur-riculum student population. The proportion of females en-rolled was 32% in 1968 and 54% in 1979 (table 32) .
R
Race
There appeared to be a trend in the directiork of asteady increase in nonwhite enrollmtats in curriculum pro-grams, "Proportional enrollments of nonwhite-curriculum stu-dents increased from 13% in 1968 to 18% in 1974 to 23% in1979 (Table 32) .
. 4
Marital Status
Althoulkh the proportion of single curriculum studentsdeclinedsfrod 69% in 1968 to 44% in 1974, it increased veryslightly (to 45%), in 1979. There also was a slight decrease ,in the proportion' of married students in 1979 as compared to1974, although there were still far more ,married4tudntsthan in 1968 (Table 32) . The trend toward a larger propor-tion of separated and divorced Curriculum students continuedbetween 1,968 and 1979,
..(
4i.
Locat io4 of Ins t itUt ion
Between 1968 and 1979, curriculum students increasinglyenrolled in the institution that was in their home county,4n fact, in 1979 almost three-fourths of those surveyed fit-ted that description (Table 32).
.4
1 1 1.1.. '
414 4

96
Residence While Enrolled
Observations of curriculum student residence patternsrevealed some dramatic changes between 1968 and 1979, Theproportion of students living with parentti declined from 57%in 1968 to 31% in 1979, Although the proportion who livedwith their spouses increased between 1968 and 1974, it de-clined somewhat during the subsequent five years,- Coupledwith these changes was a relatively large increape 'in -theproportion of students living in "other" types of residentialarrangements not specified in the survey instrument, from 8%in 1968 to 24% in 1979, and a 9 percentage point decrease inthe proportion of boarding students (Table 32)
Socioeconomic Charao.teristics
Selected socioeconomic characteristics used in describ-ing profile changes were: (1). student's education (2) par-ents' education, (3) student's income, (4) parents' income,and (5) student's employwnt status.
Education -- Student and Parents
There appears to be a trend toward declining curriculum'program enrollments among the educationally diisadvantaged.In 1968, '7% of the curriculum students were tot high schoolgraduates. By 1979 this proportion had decreased to lessthan 4%, This change las accompanied by an increase in theproportion of 43tudentewho had attained education beyond thehigh school, Twenty-four percent of the curriculum-studentsin 1968 reported some postsecondary education, compared to49% in 1979 (Table 33)
The educational level of curriculum students' parentsalso increased considerably over the past years. The propor-tion of fathers who had some postsecondary education was 11%in 1968 and 23% in 1979. At the same time, the proportion offathers who had less than a ninth-grade education decli edfrom 37% to 30%, A similar trend was observedin4the reported educational levels of students' mothers.
Income -- Student and Parents
No clear, consistent trends were-observed in the changes( in curriculum etudent incomes between 1968 and 1979, How-ever, the 310,000 or more income group increased from 1% in1968 to 16%in 1979, There was a noticeable decline, from76% to q9%, in the lowest income_ group between 1968 and 1974,4'altbougH this proportion increased slightly in the subsequentfive years (Table 33)

97
Table 33. Weighted percentage distribution of curriculumstudents enrolled in the North Carolina Community-College System, 1968, 1974, and 1979, by student'seducation, parents' eitucation, student's income,parents' income, and itudent's employment status
Variable Curriculum students1968 1974 1979
Student's education-Grammar school or less 1.0 1.3 0.8Some high school 4.9 4.1 2.8High school graduate 64.0 45.4 40.0GED 5.2 7.7 7.8Some postsecondary to collegegraduate
N24.0 3'9.6 / 46.4
Graduate wprk ilT more 0,3 1.9 2-2Total 100.0 100.0 100.0
(11,054) (6,879) (11,515)
Father's education.Less than 7th grade 15.8 19.0 15.97th-8th grade 21.5 19.3 14.9Some high school 26.6 19.2 18.3High school/graduate 24.9 25,0 28.5Some_ postsecondary to collegegraduate
8.8 15.0 19.2
Graduate work 'or more 2.5 2,6 3,4Total 100.1 100,1 100,1
(10,810) (6,756) p1,309)
Mother's education.Less than 7th grade.7th-8th gradeSome high schoolHigh school gradua:Some postsecondary to collegegraduate
8.315.831.931.710.6
9.015,522.435,016,2
8.111.722,039,818.2
Graduate work or more 1,8 1,8 2.1Total 100.1 99.9 99.9
(10,871) (6,,796) (11,391)
Student's income, in 1967dollafs-Less than $3,000 76.0 38.6 40.4
3,0.00-5,999 17.1 22.5 22.8$ 6,000-7,499 3.8 8.3 10.0$ 7,500-9,999 2,0 19.0 10.9$10,000 or more 1 /.2 11 5
Total 100,1 99.9_11,2'00,0
(10,334) (6,486) (10,747)
3'

98
srTable 33, (continued)
Variable Curriculum students1968 1974 1969
Parents' income, in 1967dollars -Less than-$3,000 17.5 -15.9 18.7
$ 3,000-5,999 34.9 23.3 23.8
$ 6,000-7,499 16.6 8.6 11.1
S 7,500-9,999 , 15.7 18.1 1112
$10,000 or more 16.2 28.8_ 27,2
Parents deceased 0.0 ,_5 3
Total 99.9 100.0_81100.1
' ( 9,944) (5,932) (.9,572)t
Student's employment status:Full time 21,4 45;5 43.1
'Part t ire ._ 32.6 25.4 21.8
Unemployed and other- ,_46 0 29 2 35.1
Tata). 100.0 100.1 100.0(11,079) (6,805) (11,754)
The incomes of parents of curriculum students increasedsubstantially between 1968 and 1974. However, between 1974and 1979, the proportion who *armed less than '$6,000 increasedfrom 39% to 43%, while the proportion with mid-range incomesdecreased somewhat (Table 33). The proportion of parents re-ported to have incomes of $10,000 or more was 16% in 1968 and
27% in 1979.
Smployment Status-Student,
In 1968, only 21% of ofurriculum students were employedfull time; by 1974, this p °portion was 45%, By 1979, theproportion of full-time employed curriculum students had de-
creaseg to 43% (Table 33) In this same five -yeas period theproportion of part-time employed curriculum students also de-
clined, while the proportion of unemployed, retired, or"other" students increased, but not to its 1968 peak of 46%.
Overall, there were fewer working curriculum students in 1979
than in 1974. 0
Attendance Characteristics
Several of-the attendance characteristics of curriculumstudents changed considerably between the years 1968 and 1979.
Among these were: (1) program in which enrolled, (2) time of
12t

99
attendance, (3) hours in class/week, (4) distance to clasti,(5) choice of institution, (6) plans to work toward a four-year college degree, (7) plans to be employed in North Care-lina upon completion of program, and (8) other employmentplans.
Program in Which Enrolled
Noticeable trends emerged when the curriculum enroll-ments were examined by program. In 1068, 24% of the curricu-lum students. were in college-transfer programs. However, themovement over the past decade has been toward more occupationoriented programs (Table 34). The 1974-1979 period alsoshowed an increase in- special credit enrollments ancras de-cline in genqral education enrollments.
Time of 'Attendance. Hours in Class /Week,and Distance to Class
The proportion of curriculum students who attended mostof their classes during the day, declined from 84% in 1968 to60% iq 1979 (Table 34). There/also was evidence of an in-crease in the proportion of part-time curriculum students.For example, 27% of these students were in attendance for 15or fewer hours per week in 1968 as compared to 61% in 1979.During the same time, the proportions of students in atten-dance for more than 15 hours per week declined steadily (from73% to 40%).
The distance students traveled to attend classes haschanged. While the changes from 1968 to 1974 indicated thatstudents traveled fewer miles to clasei, it appeared that from1974 to 1979 students were traveling_pbmewhat farther, al-though twe diffsrential was ininor,(Table 34).
Choice of Institutions0
In 1968, 70% of the curriculum students indicated thatthey would have attended another institution if theirs hadnot existed, but this proportion decreased to 59% in 1974,a d increaped slightly to 61% in 1979. It appeared that
arly 4 out of 10 of the 1979 curriculum students would haveceived no postsecondary education had it not been for the
NCCCS (Table 34). ...
Plans for Further Educationand Employment
A smaller proportion of curriculum students planned towork toward a four-fear college degree in 1979 than in 1974.
A

.4"
100
p
Table 34.' Weighted percen,tage distribution Of curriculumstudents enrolled in the North Carolina CommunityCollege System, 1968, 1974,J;4 1979, by programin which enrolled, time ofet ndance, hours inclass/week, distance to clu.ral?(, would have at-tended another;institutio f theirs had not ex-
Visted, plans to work toward a four -year collegedegree, plags to IA employed in North Carolinaupon completion of program, and other employmentplans
Variable 44irriculum students1968 1974 , 1979
Program in 'Pilch enrolled:College-transfer 23.7 15.2 11.2General education 0.0 7.5 2,8Special credit 0.0 10.4 14.4Tecbnical 47.3 47.0 52.3Vocational 29 0 19 9 19.3
Total 100.0 Tor(71 99,9(11119.;4 (6,937) (11,888)
Time of attendance:Day 83,7 65.4 60.2Evening 16,3 34,5 39,8
Total 100.0 99.9 100.0(11,111) (6,924) (11,843)
Hours in class/week15 o less 27.0 52.0 61.416-20 26.0 17.2 14.621-25 17.2 10.4 8,726 or more 29'8 20,4
Total 100.0 100,0 106.0c10,937) (6,937) (11,836)
Distance traveled to class,one way, ml:Less than 11-15
6.066,4
6.5,
68.75.5
687016-25 13.9 16.3 17.426-30 5,7 3.7 3,831 or more -8 0 4,7 5 4
Total 100.0 99.9 TUrT(11,108) (6,789) (11,834)
1
4
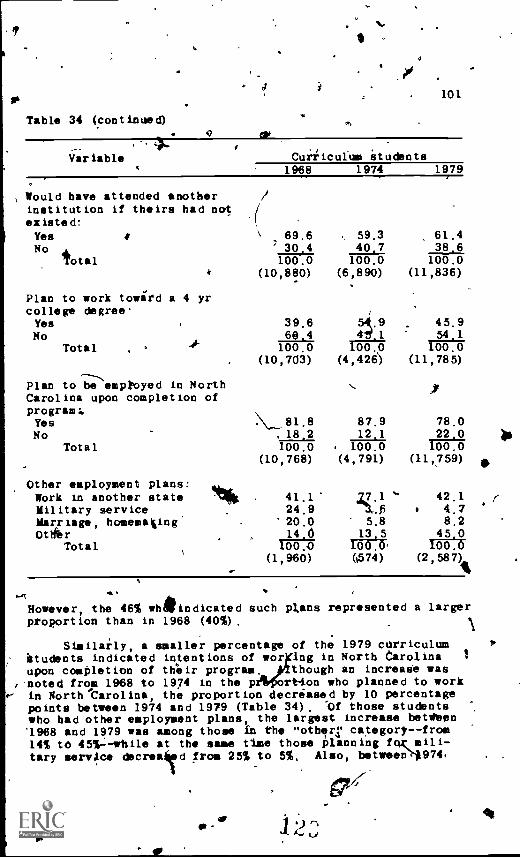
111
Table 34 (continued)
Variable4
101
Would have attended anotherinstitution if theirs had notexisted:YesNo
Total
Plan to work toward a 4 yrcollege degree.YesNo
Total
--,..
Plan to be emptoyed in NorthCarolina upon completion ofprogram:.YesNo
Total
Other employment plans:Work in another stateMilitary serviceMarriage, homemating.Ottfbr
Total
Curriculum students1968 1974 1979
69.6 , 59.3 , 61.4' 30,4 40,7 38.6100.0 100,0 100.0
(10,880).
(6,890).
(11,836)
39.6 54(.9 _ 45.960 4 11.1
100.0 100:6_ILI
(10,703) (4,426) (11,785)
\____81.8 87,9 78.0. 18.2 12,1100,0 100.0
.21,11100.0
(10,768) (4,791) (11,759)
41.1 27.1 '.. 42.124.9 11..$ 4.720.0 5.8 8.2
JA J1 13.5 _il.11(10:0 100.0, 100.0
(1,960) (574) (2,587)lk
However, the 46% whindicated such plans represented a largerproportion than in 1968 (40%) .
Similarly, a smaller percentage of the 1979 curriculumStudents indicated intentions of wor ng in North Carolina i
upon completion of their program, though an increase wasr noted from 1968 to 1974 in the p rtion who planned to work
*- in North Carolina, the proportion decreased by 10 percentagepoints between 1974 and 1979 (Table 34). Of those studentswho had other employment plans, the largest increase betften'1968 and 1979 was among those in the "others' category--from14% to 45V-while at the same time those planning for, mili-tary service decreafTd from 25% to 5%. Also, betweee1974,
(7/er 12
t.r

012
and 1979, the proportion of curriculums is w,ko incciAt eda desiie to find employment outside of North Carolinacreased by 35 percentage points.
Profile Changes in the Continuing EducationStudent Population Between
1969, 1974., and 1979414
In this section are described profile changes that wereobserved among continuing education students between 1969,1974, and 1979 4n terns of selected demographic, socioeco-nomic, and attendance characteristics.
graphic _Characterist ics
Thedographic characteristics used in describing pro-file changes among continuing education students were: (I)age, (2) sex, (34, race, (4) marital status, (5,) location ofinstitution,, and (6) residence while enrolled.
The NCCCS clearly is serving increasing numbers of 9lder,qontipuing education students (Table 35). While the propor-tion*of those under 20 years of age decreased by 5 percentagepiiints between 1969 and 1979, a corresponding increase wasnoted in the proportion of students aged 30 and above, i.e.,from 57% to 68%.
Sex
Between 1969 and 1979, the proportion of females en-rolled in continuing education programs increased (Table' 35) .While 40% of all continuing education students in 1969 weremale, thie proportion had decreased to 29% in 1979.
Race ,
In 4169, 80% of the continui* education enrollment waswhite (Table 35) , By 1974 this proportion was 68%. However,by 1979 the proportion of white continuing educiltion studentswas 77%.
-Marital StatusWhile the proportion of single continuing . education stu-
dents remained fairly consistent between 1969(alid 1979, a

103
Table 35. Weighted percentage distribution of continuingeducation students enrolled in the North CarolinaCommunity College System, 1969, 1974, and 1979,by age, sex, race, marital status, location ofinstitution, and residence wile enrolled
Variable
Age!, yr:19 or less20-2526-2930 or more
Continuing education students1969
11.220.911.556.5
Total
Sex.
100.1(9,390)
Male 40.4Female 59,6
Total 100.0(9,473)
Race:Nonwhite 20.1White
Total (9,3114Y
Marital status:Single/engaged 18.6Married 72.2Widowed 4.0Separated 2.3Divorced 3.0
Total 100.1(9,446)
.Institution in home county.Yes 77.5No 22,5
.
1974 1979
8.3 6.020.4 15.111.0 10.460.4 68,4100.1 99%9
(2,886) (4,327)
31.4 28.868,6 71,2100.0 100.0
(2,890) (4,384)
AP
32.3 23.3
(4,320)
18.8 18.067.8 61.57.9 13.32.8 2.8 .
2,6. 4.499.9 100.0
02,890) (4,371)-
77.4`22 6 1
Total 100.0 100.0 100.1(9,346) (4,346)
Residence while enrolled:With parents 29.8 9,8 10.5With spouse 54.7. 68.8 59.1Other 15 5 21.4 30.4
.Totil 100.0 100.0 100.0
(9,154) (2,765) (4',326)
19
.

1/3
104
steady decreasefrom 72% to 62% over the 10-year period --was
noted in the proportion of married students (Table 35) . An
increase was observed in the pfoportion of widowed, separated,and divorced continuing education students.
Location of Institution IP
Another enrollment trend Orkerved was that in 1979 alarger proportion of continuing education students were at-tending institutions in their home county than was the casein 1969 (Table 35r: In 1969, 78% of those surveyed lived inthe same county in which their institution was located; by
1979 this figure had increased to 85%.
Residence While Enrolled
The nontinuing education strident profile chinged interms of student residence patterns between 1969 and 1979
(Table 35) . In 1969, 30% of these students indicated that
they were living with parents, t this proportion had ditin-ished to 11% by 1979. The proportion living witA theirspouse increased sharply between 1969 and 1974--from 55% to69%then declined to 59% id 1979. There also was a consid-erable increase over the 10-year period in the proportion of
continuing education students who reported a "non- traditional"living arrangemeot (16% to 30%) .
r
Socioeconomic CharaCteristics
The socioeconomic characteristics used in describingprofile changes among continuing education students were:(1) student's education, (2) parents' education, (3) stu-
'dent's income, (4) parents' income, and (5) student's.employ-sent .status.
EducationStudent and Parents
The data in Table 36 indicate a trend toward increasesin enrollments among continuing education students in thehighest and loweetreducational categories. The proportion ofthese respondenat with some four-year college training in-creased steadily from 20% in 1968 to 32% in-1979. During thesame tine, the percentage of students with a grammar schooleducation or lesp increased ;rom 14% to 17%, and enrollmentsdeclined among those with some higb school or a high scbOoleducation. civerall, 1979 continufng education students werea more highly educated populationhthan were their 1969 coun-terparts.

105
Table 36°. *sighted percentage distribution- of continuingeducation students enrolled in the North Carolina
- Community College System, 1969, 1974, and 197Y, bystudent's education, father's education, mother'seducation, student's income, parents' income, andstudent's employment status
Variable Continuing education students1969 1974 1979
Student's education.Grammar school or less 14.0 14.4 17.2Some high school <27.3 20.6 18.7High school graduate 35.0 35.0
029.2
A GED 4.0 3,2 2.9At least 1 .yr postsecondary 19.6 26.8 32.0
Total 99.9 100.0 100.0(9,274) (2,819) (9,186)
Father's education.Grammar school or less 46.6 55.2 50.3Some high 'school 23.2 1.5.2 13.9'High school graduate 17.8 17.7 20.5GED 1.9 0.6 1,3At least 1 yr postferondary 10.6 14,0
Total 100.1_11.21100,1 100.0
(7;493) (2,571) (3,871)
Mother's education'Grammar school or less . 38.1 44.6 42.2Some high school 28.0 19.6 18 8High school graduate 22.2 22,7 24.7GED 1.8 0.4 1.1At least 1 yr postsecondary 10.0 12,8 13-.3
Total 100.1 100.1 100.1(7,479) (2, 577) (3,897)
Student's income, in 1968dollars.Less than $3;000 35.1 27.9 31.5$3 ,000-4, 999 26,6 14,8 13.5$5,000-7,499 . 23.3 16.6 16.5$7,500 or more 14,9 40.7 38,5
Total 99.9 100.0 100.0(6,853) (2,409) (3,894)
1
.

106
Table 36 (continued)
1
Variablealb
Continuing education students1969 1974 1979
10
Parents' incomea. Less than $3,000 25.3 28.0 27.7
.$3,000-4,999 21.2 16.3. 19.5$5,000-7,499 23.8 17.9 16.9$7,500 or more 29 7 37.8 35 8
Total TOC:3 100.0 'MI(5,063) (1,538) (2,009)
Student's employment status'Full timePart timeOther
Total
65.3'9.4
25.3100.0
(9,328)
49:511.2
392100.0
(2, 745)
45.110.0
91-0 Tai
(4,320)
aPercentages based on those who indicated a parentalincome
TIpe level of education of parents of co- ntinuing educa-tion students was slightly higher in 1979 than in 1969. Theproportion of students whose fathers had a grammar schooleducation or less rose froa` 47% In la9 to 55% in 1974 andthen declined to 50% in 1979. At the same tine, tbe propor-tion of those whose fathers had at least some postsecondaryeducation rose 4lightly from 11% in 1969 to 14% in ,1979. The
same basic trend held true for mothers' educational attain-ment (Table 36).
IncomeStudent and Parents
The income levels of continuing education students ap-peared to have increased greatly between 1969 and 1979.(Table36) , Representation in the highest income group increasedfrom 15% In 1969 to 39% in 1979, _Along with this was a some-what less extreme decrease in the proportion of lower-incomestudents. There also vas a shift in parents' incomes. 'Theincreases were in 'the lowest and highest income categories,
.accompanied by a ,decrease i2 the middle-income ranges, .Theevidence indicated a trend toward enrollment; by continuingeducation students from nigher socioeconomic, backgrounds,although within the past five years this trend diminishedsomewhat,
11.
1 9 r

4107
Employment Status--Student
Tiers has been a clear trend toward decreased enroll-Rents of full -lime employed persons in coptinuing educationprograms (Table 36) In fact, 'th.is Vooport ion decreasedfrom 65% in 1969 to 45% in 1979. The proportion of studentsesployed part time remained relatively constant over the 10-year period; however, the "other" .employment category in-creased from 25% in 1969 to 45% in 1979. The "other" employ-ment category represented the howesakers, retirees, or theunemployed.
Attebdance CharaCteristics
Considerable changes have occurred among the continuingeducation students in terms of attendance patterns and char-acteristics, Attendance characteristics examined in thissection are (1) time of attendance, (2) distance to class,(3) continuing enrollment in the NCCCS, and (4) choice of in-stitutions.
Time of Attendance andDistance to class
In 1969 only.14% of the continuing education studentsattended classes during the day, This proportion was 39% in1979 (Table 37)
There were indications that continuing education stu-dents traveled shorter distances to class in 19f9 than in1969. In factrthe proportion of those who traveled lessthan one mile to class increased by nearly percentagepoints over the 10-year period (Table 37).
Continuing Enrollment in the NCCCSand Choice of Institutions
Another profile change among Continuing education stu-dents pertains to continuing enrollment in the NCCCS, Ofthose Surveyed in 1969; 58% were enrolled for their firstcourse; by 1979 only 40% were enrolled for their first course(Table 37). Clearly, a such larger proportion of continuingducation students (42% compared to 60%) were returning totake additiobal courses in 1979 than was the case in 1969.
The trend between 1969 and 1979 indicated that continu-ing educatiiin students were less likely to attend anotherinstitution in order to meet their education needs (Table 37),The percentage who would have looked elsewhere had their

I
-.,
108A
.
Table 37, iteighted percentage distribution Of continuing:"`education students enrolled in the North CarolinaCommunity College System, 1969, 1974, and 1979,
by time of attendabce, distance to class, enrolled,in; first course, and would have attended' anotherinstitution had theirs-not existed
Variable Continuin, education students1969 1974 1979
Time of attendanceDay 14,2 . 29,3 38.8
Evbning '85.8 70.7 61,2
Total 100.0 100,0 100.0
Cistance. to ,class,mi
one way,
(9,108) (2,886) I (4,374)
Less than I 11,5 24,3 22,1
1-15 77,1 67 3 67.3
16-25 7.8 6,4 7.8
26-30 2.0 6.8 1.3
31 or more 1.6 1.1 1.5
Total 100.0 k 99,9 100.0(9,32) (2,833) (4 337)
Enrolled in first course/
Yes 58,1 54.,5 40,1
No 41,9 45.5 59. 9
Total 100.0 100.0 loo.ro(9,2591 (2,533) (4,292)
Would have attended anotherinstitution had theirs not
.
ex istedYes 27,8 20.6 21,4
Na 72,2 79.4 ___,_78 6' '
Total 100,0 100.0 INA(9,134) (2,795) (4,332) I
/last-U4{1°n not existdd decreased from 28% to 21% over the10-year period although this 21% figure also prevailed in 1
1974. I ..
/i

II,
I .
)Enrollment Changes as Compared to Changes in the
Adult Population of North CarolinaBetween 1974 and 1979
410.9
The extent to which the NCCCS is succeeding in servd,pga cross section of the community can be evaluated only whendemographic and socibeconosic characteristics of the commu-nity are taken into account in the analysis. Similarly,changes in the overall representativeness of students musttake into account population changes. It would mean little,for example, to say that a larger proportio f one group ofadults was represented in 1979 enrollments than '1974 en-rollments unless there was information about whet r thisgroup also had increased or decreased proportional y inNorth Carolina's adult population.
,The changes in the State's adult population and in cur-riculum and continuing education enrollments in the NCCCS be-tween 1974 an'd 1979 are examined in this section in terms ofdemographic (age, sex, and race) and socioeconomic (student'seducation, student's income, and occupation head -of- household),characteristics. .
Demographic Characteristics.
Adult population projections for 1979 indicated a smellincrease since 1974 in the proportion of relatively younger(23-39 years of age) adults and relatively older adults (60or more years of age) . This matched somewhat the increasednumber of older adults enrolled in the NCCCS. The greatestproportional decline for curricula program enrollments wasan adjusted 5 percentage points in the 22 or less age cate-gory; continuing education enrollments in this age group de-clined by almost 6 percentage points. In general, enroll-ments increased in the 30 and over age categories for curric-ulum programs and the 40 and over age categories for continu-ing education programs, once age changes in the projectedNorth Carolina 1979 adult population were taken into consider-ation. Changes in enrollment patterns over the past fiveyears have brought the NCCCS enrollments closer to adult pop-ulation values (Table 38).
Sex
Between 1974 and 1979 there was a slight increase in theproportion of females in the State's adult pop)lation. Terewas a large increase in the percentage of female curr,icurumenrollments and a small increase in the proportion of femalesin continuing education during the same period. After ..
'''....-
131

Table 38. Weighted percentage distributieducation students enrolled inCollege System, 1974 and 1979,tion of North Carolina,a 197)44port tops' changes 4ee r the fiveIndexb
on of curriculum and continuingthe North Carolina Communityas compared to the adult popula-
and 1979, by age, sex, race, pro--year period, and Representation
VariableStudents
Curriculum Continuing education1974 1979 Change 1974 1979 Change
AIA4_11.or.less:
Student enrollments, 44:3 38,1 - 5.2 19.4 13,1 - 6.3NC adult population 15,5 14,9 0.6 15.5 14,9 - 0.6Representation index - 4,6 - 5.7
23-29:Student enrollments 27,1 28,0 0.9 20.3 la.s - 1,8NC adult population, 15,3 17,1 1.8 15.3 17,1 1.8Representation Index - 0.9 N- 3,6
30-39:Student enrollments 17.0 .19.9 2.9 21.,3 20.6 -0T8.NC adult population 17.6 19.3 1.7 17.6 19,3Representation Index 1.2
. .2.5
40-49:Student enrollments 9.f 8.3 - 0.8 16,4 13.3 ;3,1NC addlt population 18.0 14.5 - 3.5 18.Q 14.5 3.5Representation Index 2,7 0.4
50-59'Student enrollments 24,--i 2,7 0.6 12.7 12.7 0.0NC adult population 1 15.2 14.1 - 1.1 15.2 14,1 - 1.1Representation Index I ,,,... 1.7 1.1
0

Table 38 (continued)
Variable
1
StudentsCurriculum Continuing education
1974 1979 Change 1974, 1979 Cbente
Age. yr (contd.)60-69:Student enrollments 0.3 1.8 1.5 6.7 11.0 4 3- .
NC adult population 10.7 11.2 0.5 10.7 11.2 0.5Representation Index 1,0 3.8
70 pr more'Student enrollments 0.1 0.3 0,2 3.5 10,9 7,4NC adult population 7.8 8,9 1,1, 7.8 8,9 1,1Representation Index - 0,9 6,3
MaleStudent enrollments 60,8 46.4' -14.4 31.4 28,8 - 2,6NC adult population 47,9 47,4 - 0.5 47,9 47.4 - 0,5Representation Index -13.9 - 2,1
Female:"Student enrollments 39.2 53.6 14,4 68.6 , 71.2 2,6NC adult population 52,1 52.6 0.5 52.1 52.6 0,5Representation Index 13.9 2.1
RaceWhite:Student enrollments 82.2 76,5 5.7 67.7 76.8 9.1NC adult population 79.7 78,9 - 0.8 79.7 78.9 - 0.8Representation Index - 4.9 9,9
1

Table 38 (continued)
Variable
Race (contd.) :Nonwhite'Student enrollmentsNC adult populatiodRepresentation Index
StudentsCurriculum Continuing education
1974 1979 Change 1974 r 1979 Change
17.8 23.5 5.720.3 21.1 0.8
4.9
32.3 23.2 - 9.120.3 21.1 0.8
- 9.9
a1n thii and subsequAt tafrom the 1970 U.S. Census;rPopul
b Iti\this and subsequent tabrollments'-,N.C. adult populatioin proportional enrollments whic
les, population figures for 1974'were takention figures'for 1979 are projections.
es, the Representation Index - student en-A positive number indicates an increase
takes population changes into account A
negative number indicates a decrease in proportional enrollments which takes
population changes into account.
l,'

113
adjustment for adult population Clianges, female curriculumenrollments appeared to have increased by 14 percentagepoints (Table 38).
Race
In 1979 nonwhite students were less underrepresented incurriculum programs and less overrepresented in continuingeducation programs than they were in 1974, even after takinginto account the growth in the State's minority populations.An adjusted increase of 5 percentage points brought minoritycurriculum enrollments close to adult population values, asdid an pverall decline of 10 percentage points in continuingeducation enrollments (Table 38).
Socioefilnomic Characteristics
Socioeconomic characteristics that were compared in-cluded'stddent's education, student's income, and occupationhead-of-household.
Studeitt's Education
Between 1974 and 1979 enrollments in the NCCCS,,grewslightly more representative of the State's adult populationin educational attainment. During this five-year period,there was a projected decrease in the proportion of adultswhose eddcational attainment was a grammar school educationor less. These persons were less underrepresented in 1979curriculum.programs than they were in 1974, but those withsome high school education or a high school diploma decreasedamong enrollments at the same time they were increasing inthe general adult population. Enrollments of students withsome postsecondary education increased faster in curriculumprograms than similar increases in the adult population wouldwarrant (Table 39).
Continuing education enrollment changes offset thesetrends somewhat. A Urger proportion of persons with a gram-mar school education or less were in continuing educationprograms in 1979 than in 1974, for an overall change of 15percentage points. The proportion who had some high schoolor a high school diploma decreased among continuing educatione lilrollments while their proportion increased in the State's
t population for respective adjusted losses of 8 and 9tentage points. There also was a slight tendency for more
students who had completed a four-yearicollege degree to en-roll in continuing education programs (Table 39).
13J r

Table 39. Weighted percentage distribution of curriculum and continuingeducation students enrolled/in the Nbrth Carolina CommunityCollege System, 1974 and 1979, as compared to the adult popula-tion of North Carolina, 1974 and 1979, by education, proportionalchanges over the five-year period, and Represedtation Iddex
Student's education
Grammar school or less'Student enrollmentsNC adult populationRepresentation Index
Some high school'Student enrolldentsNC adult populationRepresentation Index
High school graduate:Student enrollTentsNC adult popdlationRepresentation Index...,
1-3 yr postsecondary:Student enrollmentsNC adult populationRepresentation Index
College graduate or more:Student enrollmentsNC adult populationRepresentation Index
StudentsCurriculum Continuing educ tioa
1974 1979 Change 1974 1979 angel-
1.3 0.8 0.5 14.4 17.2 (2.837.1 24.9 -12.2 ' .37.1 24.9 -12.2
11.7 15.0
,
_
4.1.
2.8 - 1.3 20.6 18.7 - 1.9,24.4 30.4 6.0 24.4 30.4 6.0
- 7.3 - 7.9
53.2 47.8 - 5.4' 38.1 32.1 - 6.021.6 24.6 3.0 21.6 24.6 3.0
- 8.4 - 9.0
34.8 40,3 5.5 15.2 16.3 1.18,4 9.5 1.1* 8.4 9.5 -1.1
4.4 0:0
6.7 8.4 1,7 11.6 15.8 .4,28.4 10.6 2.2 8.4 10,6 2.2
0.5 - 2.0
II

115
In summary, curriculum programs continued to serve."disproportionate enrollment of persons who had a.high schooleducation, or better, but this trend was complicated by in-creased proportions of students in the lowest educationalcategories and a decreased entbllment of those who had cos+
-pleted some high school.' While continuing, educativn-enroll-ments showed similar changes, the programs continued to pro-vi ducat,ion for adults in'the lower educational attainment
tego ies.
Student's Income
Before comparing student incomes, with those of the gen-eral adult polation, it was qecessary to adjust all Incomesto 1969 dollar values. While this allowed comparisons baSedon 1910 U.S. Census figures, it must be rememberA that theincome figures showp in Table 40 would need to be almost
. doubled to represeq 1979 dollar values.The most striking profile change between 1974 and 1979
was the increased enrollment of slaudents in the lowest incomecategory (less than $4,0130)0 These students were overrepte-
tsented in both curriculum and continuing education enrollmentsin 1974rand over the five-year period this 61,,errepresenta-tion increased by .14 percentage points and 8 percentage points,respectively, among curriculum and continuing education en-rollments (Table 40). However, these changes were accom-panied by a decrease in enrollmeqts iron what would today bethe $4,000-7,999 income group (in 1969 dollars) . While thepercObtage, of students in this categoryipas close to theState's adult Dorm, there was an overall, decrease in this
/middle-inbome group of 12 percentage &points among curriculumand 10 rcentake points among continuing education enroll, -*pevents. The most affluent group--those with repoited incomesof $12,000 or more--continued to be underrepresented in 'bothprogr areas' in 1979. In fact, el3rolfme4ts I thisths
tegory declined by an adjusted 5 percentage pointsamo h curriculum and continuing education students(Table 41)-- The NCCCS seemed to be serving middle-incomeadults p ately the same proportions as they appearedin the pr cted11979 adult population. Lower-income adultswere consi bl overrepresented among enrollments and upper-income adults 'were underrepresented (Table 40)
Occmpat ion Head-of-Household.
While most occupational groups were well representedamong the students'. household heads, changes that occurredbetween 1974 and 1979 tended to indrease the differences Iwo-tween these occupations and occupat ional. 'distributions of' the
13- t

41.
Table 40. Weighted percentage distribution of curriculum and continuingeducation'students en lled in he North Carolina communityCollege System, 1974 an as compared to the adult popula-tion of North Carolina, 1974 and 1979, by student's incoroe,a,,pro-portional changes olgr the five-year period, and RepresentationIndex
Student 's income1969*'dollars
StudentsCurriculum Continuing educe ion
Change 1974 1979 Ch nge1974 1979I./-
Under $4,000:Student enrollments 22.9 29.9NC adult population
.. Representation Index
21.1 14.1
$4,000-$/,999: .Student enrollments 40.1 30.2NC adult population 30.7 32.3Representation Index
$8,000-$11,999:
dif
Student enrollmentsNC adult populatiorkRepresentat ion Index
28,026,2
21,5'17.1
$12,000 or more:Student enrollments 9,1 18.3NC adult population 22.1/ 36.5Representation Index
I7.0 34.3 35.7 l\i
- 7.0 201 14.1 - 7.14 .0 8.
- 9.9 '36.1" 27.5 - £3.6
1.6 30.7 32.3 1.6-11.5 -10.2
- 6.5 22,5. 2a,2._ 2.2- 9.1 26.2 17.1 - 9.1
2.6 6.8*
9,2 7.1 16.5 9.414.4 22.1 36.5 14.4
- 5.2 - 5.0
aIncome categories adjusted to 1969 dollars for both 1974 and 1979.

qP
117
State's adult Population (Table 41). The most skilled occu-pational categories--professional/technical and owner/man-ager--vere somewhat more overrepresented in 1979 than theywere in 1974 among both curriculum and continuing educationenrollments. Curriculum enrollments showed a proportionaldecline in representatibn among the crafts/foremen, operative,nonfarm labor, and farm occupations. In continuing educationprogram enrollments there were slight decreases in the repre-sentation of students with operative, nonfarm labor, and farmbackgrounds. The occupational groups that were most underrep-resented in 1979 were crafts/foremen, sales/clerical, and op-eratives. In fact, proportional enrollments representing theoperative occupational category were almtist half those of thepercentage of North Carolina workers this group represented.Adjusted losses in representation for the operative occupa-tional categoty were 3 percentage points in curriculum pro-grams and 4 percentage points in continuing education pro-.grams (Table 4l).
Summary and Anal sis of Riiationah-ips
,,,, Using as a guide the resea h questions previously statedle-thapter 1, a summary and analy- s of the relationships re-vealed in this study are presented.
N,Students Being Served by the Nortii-CArolina
Community College System, 1979
The profile;-of curriculum and continuing education stu-dents presented here in response to Research Question 1 andthe subprofiles presented in the next section in response to
9 Research Question 2 represent a statistical averaging of stu-dent characteristics. They may not reflect the true diversity
" of the students, but they may offer useful generalizations.41.
The Typical Curriculum Student
The typical curriculum student is a 25-year-old, whinemarried or single female who is head of her household. Sheworks full time or part time in a white-collar occupation atwhich she earns less than $4.00 per hour. If married, her1978 family income was about $12,000.
This student enrolls in one or two courses per quarterand attends classes on the main campus during the day. Sheis a B-average high school graduate and most likely is en-rolled in a technical program.
6
"

Table-41, Weighted percentage distribution of curriculum and continuingeducation students enrolled ;n the North Carolina CommunityCollege Systecro 1974 and 1979, as compared to the adult popula-tion of North Carolina,1974 and 1979, by occupation head-of-household, proportional changes over the five-year period, andRepresentation Index
Occupat ionhead-of-household
Professional/technical:Student enrollmentsNC adult populationRepresentation Index
On:ter/manager:.Student enrollmentsNC adult populationRepresentation Index
Sales/clerical:Student erollmentsNC, adult populationRepresentation ,Index else
Crafts /foramStudent IlmentsNC adult populationRepresentictllom Index
OperativeStudent en oXlmentsNC adult,Re pre "..5,t14 t n Index
" StudentsCurriculum Continuing education
1974 1979 Change 1974 1979 Change
13,4 15.9 2,5 13.7 17,6 3.910.2 11,0 0,8 10,2 11.0 0,8
1.7 3,1
13,3 16',6 3.3 12.8 15.3 2.56..7 7.4 P.7 6.7 7,4 0.7
2`.6 1.8
12.2 14.6 2,4 10.2 10.8 0.619.4 20.1 0.7 19.4 20.1 0.7
1.7 - 0.1
20.8 20.2 - 0.6 17.0 20.7 3.713.4 14.5 1,1 13.4 14.5 1.1
- 1.7 2,6
- 2.6 17.5 14,2 - 3,3
25.9 26.3 0,4 23.9 26.3 0,4- 3.4 - 3.7

Table 41 (continued)
Occupation !
head-of-houSeholdStudents
Curriculv Ccn-inuing education1974 1979 'Change 1974 1979 Change
Labor, nonfarm:Student enrpllmenti 6.0 5 1 0.9 7.8 '4.2 - 3.6NC adult pOulation 4,9 5.0 0.1 .9 5.0 0,1Representation Index - 0.1 3.7
Service: 4drStudent enrollments 8.6 10.6 2.0 , 9.0 11.5 2.5NC adult population 10.7 10.9 0.2 10.7 10.9 0.2Representation Index 1.8 2,3
+Farm:Student enrollments 5.6 3.9 - 1,7 7.2 3.5 - 3.7NC adwlt population 4.3 4.8 0.5 4.3 4.8 0.5Representation Index - 2.2 - 4,2
Unclassified:Student enrollments 4.4 0.0 0.0 4.8 0.0 0.0NC adult population 4.5 0.0 0.0 4.5 0.0 0.0Representation Index 0.0 0.0
4 11,7

a
A u
..,
120 .
' *
The Typical Continuing NEckicatiOn StudentIl
The typical continuing education student most likely isa 38-year-old, married, white female hoAives with her,spouse. Her 1978 sulkily income was between $10,000 and$12,000. She is a igh school graduate whose parents haveless than'an eight iirade education.
This continuing educat on student is very likely to beenrolled in an occupational extension program, attending oneclass a week in the evenin at an ofircampus site. She mostlikely is employed full tire, and travels five or feeer.milesto class one way, a trip she makes once a week.
Descriptions of Studentsby Educational Program
The College-Transfer Student
The typical college-transfer student is a 22-year-old,single or married white Motile who lives with her parents inthe county in which her institution is located. Her 1978 in-come was less than $5,000, but her parents' 1978 income wasbetween $15,000 and $20,000.
This student may have some postsecondary experience ina four-year college and is almost certainly a B-average highschool graduate. She is likely to be employed either fulltime or part tire, to attend classes on the main campus dur-ing the day, and to enroll in four or more courses per quar-ter. ,
.1.
Tlie Genetal, Education Student.
The typical general education student is a married, 29-year-old white female who lives with her spouse in the bountyin which her institution ism located. This student works fulltime and bet family income for 1978 was over $12,000.
This student most likely has some foul -year college ex-perience and almost certainly is a B-average high school grad-uate. She is equally likely to attend day or evening classes,and the one to three courses in which she is enrolfbd are al-most always held on the institution's main campus.
The Special Credit Student
The typical special credit student is a 3-year-old,married, white female who lives with her spouse in the same
112

I
121
county in which her institution is located. She probablyworks full time and the family income was over $20,000 in1978.
7'sChances are good that she is a college graduate who
maintained a B average in high school. She attends her onespecial credit class in the evening on the institution's maincampus. V
The Technical Student
The typical technical student is a 24-year-old, single,engaged, or married white female. If single, she lives withber parents; if married, she lives with her spouse. In eithercase, she resides in the same county in which.her institutionis located. She probably works full time to supplement berspouse's or parents' income, and her primary income was be-tween $10,000 and $12,000 in 1978.
The Vocational Student
The typical vocational student is a 25-year-old, married,white male, and probably not a military veteran. Re liveswith his spouse, works full time, and his 1978 family incomeprobably was between $9,000 and $11,000. His head-of-household most likely works in a crafts/foremen occupation.
Although probably a B-average high school graduate, hischances of having less than a high school education aregreater than those of students in other curriculum prograas.Re typically attends class for approximately 20 hours perweek on the main campus during the day.-
. The Academic Extension Student
The typical academic extension student is a 44-year-old,married, white female who lives with her spouse in the samecounty in which her institution is located. She probably isa-homemaker or a retiree, but may be working full time. To-gether, she and her spouse had a 1978 income of between$12,000 and $15,000.
This typical academic extension student probably cos-pleted at least high school, where she maintained a B aver-age. She is enrolled in one course that meets once a week inthe evening at some off-campus center.
, The Fundamental Education Student
The typical fundamental education student is a 28-year-old, single or engaged black female who lives with her
`.1

122
parents. She works full tithe and hkd a primary income of lessthan $6,000 in 1978.
This student has less than a high school education andmay not have finished the ninerrgrade. If she did attendhigh school, she maintained a C average. She is enrolled in'One or two courses which she attends in the evening at someoff-campus site.
The Occupational Extension Student
The typical occupational extension student most likelyis a 38-year-old white female who is married and lives withr spouse in the county in which her institution is located.
She works tull time and her 1978 nista)? income was between$10,000 and $12,000.
She probably graduated from high school with a B averageand may have some four-year college experience. She is en-rolled in one course which meets once a week in the eveningat some off-campus site.
Extent to Which Students Are Repretentative ofthe Projected 1979 Adult Population
of North Carolinaa'Students in curriculum programs were not representative
of the adult population in terms of age--older adults wereunderrepresented in these programs. However, continaOng edu-cation program enrollments of all majorage groupings in the State's a It population,
Curriculum students tended to represent a proportionalcross section of the adult male and female population of theState. However, a higher proportion of females were enrolledIn continuing education than were in the adult population.In terms of race, both curriculum and continuing educationstudents were representative of a cross section of the State'sadult population,
Adults with less than a high school education were under-represented among both curriculum and continuing education stu-dents. Adults with more than a high school education wereoverrepresented among curriculum students but less so amongcontinuing education students. Adults in the lower-incomecategories also were overrepresented among both student groups.The most overrepresented occupational categories among 'curric-ulum students were professional/technical, owner/manager, andcrafts/foreraen; among continuing education students, profits-sional/technicar. Underrepresented in both student groupswere operatives and sales/clerical occupational categories.

123
Group(s) Not Being Served by the North CarolinaCcemunity College System, 1979
When compared to the proportions represented in the pro-jected 1979 North Carolina adult population, adults 40 yearsof age or older were underrepresentethamong curriculwstu-dents. However, this sip group made significant gains be-tween 1974 and 1979.
Females were overrepresented and ales increasinglyunderrepresented among curriculUm students. White adults werewere overrepresented among this group in 1974 and slightlyunderrepresented in 1979 among both curriculum and continuingeducation students, although the latter group made some gainsbetween 1974 and 1979.
Although the lowest educatiienal level category--lessthan a ninth-grade education - -among curriculum and continuingeducation students was more representative of the State'sadult population in 1979 than 1974, it still remained seri-ously underrepresented. The highest studen't income categoryamong both curriculum and continuing educati*' students wasincreasingly underrepresentative of the 1979 adult-Vopulatio
In 1979 the occupational groups designated sales/cleri-cal and operatives were slightly underrepresented among cur-riculum students; the latter group became increasingly under-represented between 1974 and 1979, while the former made smallgains. Amon-g continuing education students these two occupa-tional groups retained underrepresented )and even decreased,
Changes in Student Profiles, 1968 1979
Demographic shifts in profiles during the past decade in-cluded a continuing increase in the median age of curriculumand continuing education students. Curriculum enrollmentsshowed a steady growth in the proportions of female and blackstudents while contrinuing education showed a decline in malestudents and a decrease to the original 1969 proportions ofnonwhite students, The increase in the proportion of married 1curriculum and continuing education students between 1968 and1974 was slightly offset by )a reversal in the trend between1974 and 1979. Also noted was an increasing proportion of
Lseparated and divorced curriculum students and widowed students in both groups. An increasing proportion of curricustudents maintained "non-traditional" types of residence pat-terns, and there appeared to be a trend toward a larger pro-portion of continuing education students who attended theinstitution ib their home county.
Socioeconomic shifts in profiles duCring the decade, werein students' educational levels, income, and employment status.The 19/9 curriculum students were 'better educated than their
1 is

,
124
/
1974 counterparts and tended to be from backgrounds in which .
the parents were better educated than in 1968. Likewise, anincreasing proportion of college graduates entered continuingeducation programs during the decade and the proportion ofenrollees fro. the lower educational categories increased.Curriculum and continuing education students' incomes in-creased substantially between 1968 and 1974, but seemed Itosplit into two trends between 1974 and 1979; i.e., there wereslight increases in the lowest income categories in bothstudent groups.
Changes in attendance characteristics quribg the decadewere in program in which enrolled, time of attendance, andnumber of quarters enrolkvd. College-transfer, general educa-tion, and vocational program enrollments declined, while spe-clal credit and technical program enrollments increased. Atthe same time, the proportions of curriculum students who at-tended-classes in the evening and continuing education stu-dents who attended classes during the day increased. Also,a' larger proportilon of curriculum students were attendingclasses for fewer hours per seek, An increasing proportion ofcontinUing education students could be classified as "contin-uing students", i.e., had enrolled for more than one quarter.
StudiArts Least Likely to Continue Their Education inthe Absence of North Carolina Community College
System Institutions
Curriculum students as compared to continuing educationstudents were more likely to have continued their educationhad the institution in which they were enrolled not existed.Among curriculum students, those most likely to seek educa-tional opportunity elsewhere were college-transfer and techni-cal students. Those least likely to have attended elsewherewere in special' credit programs. Significantly, only 58% ofthe general education students indicated that they would haveattended some other institution. Few of the continuing educa-tion students indiCated that they would have attended else-where, Of those who did., the largest proportion were in fun-damental education programs.
Additional analyses were undertaken (1) to determine therelationships between whether or not students-would have con-tinued their education in the absence of tbpir institutionand selected demographic (age, sex, race, marital status) andsocioeconomic (student's education, primary income, and occu-cation bead-of-household) characteristics of curriculum andontinuing education students, and (2) to identify any sub-
*group differences that might be present in .the curriculum andcontinuing education populations as related. to these charac-teristics. The large amount of data generated in these

125
analyses precluded their presentation in the body of this -re-port. Rather, they appear, for the reader's convenience, inAppendix Table 1.
Students Least Likely to Attend a North CarolinaCommunity College System Institution as the
Distance to Class Increases
Three- fourths' of the curriculum students traveled 15 orfewer miles one way to class; 88% reported that they mademore than one trip to class each week. Within curriculumprograms, there were many variations in distances traveled;for example, 9% of the vocational students traveled less thanone mile to class. Special credit and general education stu-dents made significantly fewer trips to class per week thandid students in the other curriculum programs.
Eighty-nine percent of the continuing education studentstraveled 15 or fewer miles one way to class, with 54% report-ing that they made only one trip each week. Fundamental edu-cation students traveled considerably fewer miles to class,yet made *ore trips than did other continuing education stu-dents.- Nearly 90% o the academic extension students madeonly one trip per week to class.
The Laplidations of these attendance patterns in a dayof energy shortages are interesting and suggest that distancewas a paramount factor in deciding to enroll. On the onehand, enrollments could deCline as people conserve gasoline.Om the other hand, curriculum enrollments could remain stable,or increase, as the local institution becomes an increlsinglyattractive alternative for those who would attend another,perhaps more distant, institution.
Students Who Selected North*Carolina CommunityCollege System Institutions as First Choice
Over Other Forms of PostsecondaryAlp" Education
Seventy-eight percent of the curriculum students indi-cated that their institution was their first choice for fur-thering their education, as did over 90% of the continuingeducation students. Among the few who indicated a preferencefor some other tYpe of institution, the largest proportionwould have preferred a public four-year college/university,or a different NCCCS institution. It appears that the NCCCSattracts its own clientele and does not compete with otherpostsecondary educational institutions.

126
Twenty -three percent of the curriculum and continuingeducation students enrolled in the NCCCS in 1979 had beenfull-time students at a four-year college/university, a sub-stantial increase over the proportions who had ne so in1974. As the market surplus of baccalaureate I1;duates per-sists, and as retraining demands increase in the marketplace,this)end toward attracting. increasing numbers of personswho have attended four-year colleges/universities should con-tinue.
t
Recruitment Strategies That Influenced Students toAttend North Carolina Community College System
Institutions and Source of FirstInformation About Program
Institutional recruiters and other personnel and insti-tutional literature appear to be increasingly effective ininfluencing students' decisions to enroll in the North Caro-lina Community College System. While institutional litera-ture seemed more effective with curriculum students, recruit-ers and other institutional personnel were more influentialwith continuing education students.
As could be expected, parents and high school personnelwere more common sources of first information about the pro -grass for curriculum students, particularly those in thecollege-transfer program, than for continuing education stu-dents. Employers were the most influential group for techni-cal and occupational extension students, Parents, friendswho were not students, and social service agencies exerted 4considerable influence on fundamental education students'decisions to attend.
One-fifth of alt students indicated that the traditionalinfluences were not factors in their decisions to attendthese institutions. Of those listing that they were influ-enced to attend by someone other than themselves, institu-tional recruiters and other personnel were most frequentlycited by both curriculum and continuing education students.
The students first learned of the program in which theyenrolled from t variety of sources. Nonetheless, the insti-tutions' recruiters, and other personnel, the institutions'literature, and media coverage were the key sources of firstinformation that the respondents used to make this decisioh.
Curriculum Students Who Received.Financial Aid andthe Source and Amount of That Aid
The largest proportions of curriculum students who re-ported they were receiving financial aid were in technical'

127
and vocational programs. Nearly one-half of these respon-dents received some type of financial assistance. Curriculumstudents who received the least financial aid were in generaleducation and special credit programsprograms in which thestudents -were more likely to be older, part time, and finan-cially stable.
Basic Education Opportunity Grants (BEOG)4 and VeteransAdministration educational benefits vele the principal sourcesof finandial aid for curriculum students, with techniqal andvocational students being the chief recipients. In fact,over 10% of the students in these two programs received aidin excess of $3,000 for the 1978-79 school year.
bA more detailed analysis was undertaken to determine if
there were differences in the sources and amounts of finan-cial aid received by students in the variois curriculum pro-grams in terms of selected demographic (age, sex, race, andmarital status) and socioeconomic (student's education, pri-mary income, and occupation head-of-household) characteris-tics. The larger amount of data generated in these analysesprecluded their inclusion in the body of this report. Rather,they appear in tabular form in Appendix Tables 2 and 3, re-spectively.
The findings indicated that the availability of finan-cial aid is encouraging low-income students to attend NCCCSinstitutions. The Tact that the principal recipients ofBEOGs and Veterans Administration educational benefits wereenrolled in technical and vbcational programs indicated thatstudents who were receiving financial aid were using i tofurther their education in occupation-oriented areas.
d
Employment Status of Students
Sixty-five percent of the curriculum students were work-ing at least part time. Of those who did work, the majorityworked full time--40 or mere hours per week. Nearly one-halfof the curriculum students who worked earned less than $4 perhour. Special credit, technical, and vocational students werelikely tobe employed full time, while college-transfer stu-dents were more likely to be employed part time. Almost 75%of the curriculum students were empldyed.
Forty-five percent of the continuing education studentswere working full time; only 10% were employed part time; andalmost one-third were retirees or 'homemakers. Academic ex-tension students were loess likely to be employed full timethan other continuing education students, as nearly 44% ofthis group were retirees or homemakers.
4.
J

A
128
Clearly, a atrity of the students enrolled in the
NCCCS, 1979, were w rking and at4ending school, many of them
working full time.
Students Who Plan to Work Toward aFour-Year College Degree
A large proportion (39%) of the curriculum students in-
dicated that, upon completion of their current programs, theyintended to continue their education at a four-year college/
university. College-transfer students were the most likelyto plan a four-year college degree, followed by general edu-
cation students. As expected, less than 10% of the continu-ing education students planned to pursue this level of educa-
tional attainment'.
The fact that nearly one-fourth of the special credit
students and 15% of the continuing education students
reported that they already held the baccalaureate was a strongindication that an increasingly large number of adults are,
enrolling in NCCCS institutions for retraining and to pursue
special interests.
Students igho Plan to Work in North Carolina Upon
Completion of Their Educational Program
A majority (78%) of the curriculum students indicated
that they planned to be employed in North Carolina upon com-
pletion of their educational programs. Among those curricu-lum students who had other plans, 42% planned to work in an-
other 2I)Ae. These figures represent only a slight decrease(one percentage point) from 1974 in the proportion of curric-
ulum students who planned to be employed in North Carolinaafter completing th 414. educational programs and a major de-
crease (from 71% to 42%) in the proportion who planned towork in another state.
Approximately one-half of the continuing education stu-dents indicated a desire to work in North Carolina; and for
those who did not, retirement, "other," and marriage andhomemaking were the most common alternatives.
Major Reasons Students Were ContinuingTheir Education N
The students' value orientation toward education seemed
to match the stated emphasis of the NCCCS on technical, voca-
tional, and occupational programs. Curriculum students gave
"to be able to earn more money" and "to get abetter job" as
their top reasons for continuing their edifation, thus/

O
----7129
fl t.
rn a vocational-monetary orientation. Continuing edu-catililli udeets, on the other hand, brought balance to the .
total p °gram' by indicating an tappovement-learning orienta-tion, in thit .their primary reason for continuing their edu-cation wis "to learn more things of interest." '
Additional .analytes were undertaken to determine difIN
.
erences id-tlip value!orientations toward education of ,curric-ulum andllpontinting education students iq terms of selecteddemographic (age, sex, race, add marital statue) and socioeco-
,onomic (student's edtication, primary income, adit occupation' bead-of-househOld), characteristics. These analyses werequite detailed'and hence did not lend themselves to coverage
- /n the main body of this repori. However, ill related infor7---majion ia presented in-Tabular form in Appendix Table 4. -'
4.
The student value qrientations toward education revealedin this study appeared to supportVe stated mission and pur-poses thearCCCS and' showed a rellsonable balance betweenvoca -monetary and isprovement-learning orientationsaating students. The NCCC5 'has maintained emphasis onlechnital, vocational, and occupational course offerings,with 66% of all'enrollees concentrated in these occupition-orivipked areas. ,
InstitutiOnal Cbarac1ristics That InfluencbStudents to Attend North Carolina eCZmMunity
-College SyStem Institutions
Institutional ch'arac'teristics that exerted 'the most in-flUence on students' decisions llo attend were in accvd withlegislative intent. "4Students id both curriculum and continu-ing education prOgrams overwhelmingly ranked the followiqgchar4ateristics as most influential in their decis-ions to at-tend q. (1) prdgrams available, (2). locat an of -institution,(3,) low cost, and (4) quality of instructiOn. k-
Additional analyses were undertaken to determine dif-ferenqes between curriculum and continuing education studentsin their ripkings of institutional characteristics that in-fluenced th-em to attend an,NCCCS institution in terms of se-lected demdgraph411 (age, sex, race, and marital stafeus) asocideconomic (eradent's education, primary income, and occpation head-of-househiold) characteristics. The results oftheie analyset appear in tabular form in Appendik Table 5.
41 udent Evaluations of Support Services and theSupport Services that Were Most Important_
When asked td evaluate the support ervices availableA at
their tnstitstApns, curriculum student4 ave highelgratings
:
4)
VP
;-1* * ti y

"-
130
to library r ounces, parking, and academic counseling. Theyappeared to ha the least information on child c re, healthcare, and stipenls, but designated parking,sfatine facilities,recreation facilities, lind study area as support servicesthat were in most need of isiprdvement.
Continuing education students rated parking, transporta-tion, and library resources most highly, While indicatingthat they had Little infontation on child care, health care,and stipends. fn fact, continuing education students ap-peared to know less about all student support services thandid curriculum stuants. Continuing education students desig-nated arking, eating facilities, recreation facilities, andstudy teas as the suppoit services in most need of improve-ment.
en as a to i)i.dercate which of the support servicesv
were' pgrtant t hem, curriculum stude ts indicated parting,followed by library resources and study teas. Continuingeducation s udents rated parking as the ost important ser-\vice, followe by transportttion and library resources,
as
Students' ,Opinions of and Feelings About theUse of a Standard Nape for All North.
Carolina Community College .System Institutions
1'verall preference for a standard institutional 'nameamong curriculum students was community college,falthoughmore than one-fOurth of these students indicated that theyhad no opinion on the matter. Continuing education studentsmost commonly had no opinion on the use of a standard name,although community college was their second choice. Whenasked what feelings supported their lepini9p a the use of astafidard name for all NCCCSinstitulions, curriculum and mon-
atinuing education students rhdicated that, first, it does notmatter what the institutions are called and, second, that theinstitutions are all basically the same.
a
4
or
a

131
CHAPTER 4
CONCLUSIONS AND IKPLICATIONS
The major conclusions and implications drawn from theoverall findings of this study of students enrolled in theNorth Caroline Community College System, 1979, are presentedin this chapter. These interpretations are" offered to policy-makers, administrators, and instructors of the NCCCS for thepurpose' of facilitating discussions that may lead to strength- .
ening educational' programs and support services for theirstudents. T
Conclusion 1: The emerging majority of NCCC,S stu-dents appear to be part -time adult learners withfamily and job responsibilities.
The typical NCCCS student is no longer the 18 to 22-year -old, full-time, degree-oriented learner who recentlygraduated from high school. On the contrary, the adultlearners enrolled in the NCCCS are increasingly likely bemarried female members of the labor force, who are past the"traditional" age for schooling. In kee4ng with the demandsof,sdult responsibilities, these students are more likely toattend lcasses during the evening, frequently enrolling in asingle class or attending classes 10 or fewer hours per week.
These older, married, part -time students have been amajor force in the community college movement in North Caro-lina over the past decade. They currently make up a majorityof the student population, and in all likelihood their num-bers will increase during the coming years.
Institutions of the NCCCS, when planning curriculum and-continuing education programs, should be alert to the uniqueneeds and demands oflothese adult learners. In the past, edu-twcational administrators and instructors have been oriented
ard preparing youqg students for adult life. The findingsof this study suggest that the sometimes marginal status ofthe older, part-time adult learner nay need to be reevaluated;new institutional and curricular designs may need .to be im- -
pigmented within a framework of adult development and life-long learning.
Faculty should be prepared and trained to deal with amature, part-tiap clientele in a manner different from thatemployed with inexperienced 18 to 22-year-old students. Therole of "teacher" in the teaching/learning relationship mayneed to be reexamined.
Older learners tend to be more independent than theiryounger counterparts and have a wealth of experiences upon

132
which they Cae-ntraw. They alio posSess a varied yet predict-able readiness rolearn and s^protlfem-oriented frame of ref-
erence. Thus, the future instructor nay function more as aresource or facilitator in the learning process and lets as a
transmitter of knowledge, These instructors will almost cer-tainlyJind it'necessary to understand the principles ofadult development so that learning can be made more relevantto the challenges of the adult life cycle.
Programs and their constituent courses need to be mademore flexible, reflecting the'unique needs and interests ofadult learners and recognizing relevant prior life experi-ences that have rdsulted in significant learning. Schedulingcourses at convenient times and in accessible locationsshould be high priorities for institutional Planners. Undersuch a framework of adult development, the administrator maybecome further obligated to select, train, and supervise a
o staff that is committed to the education of mature students.Stud01 services will need to be broadened to help this di-
verse population cope with the many responsibilities of adult
life. Foi example, strident services may play a more impor-tent role in helping adult students.adjust to midliie 4areerchanges and life crises such as separation and divorce, re-tirement, and death.`
(any of the support'services currently being offered in
North Carolina's community/technical colleges and technicalinstitutes were developed in an earlier era in response tothe needs of the then prevalent "college-age". student.. Ifthese institutions are to develop support services that meetthe needs of the current heterogeneous, mature student envolr-ments, such services might well be based upon a comprehensivemodel of adult development. The assumption that all adultstudents have the same types of needs has no place in such a
model. In fact, as ,,ple adult moves through the life cycle,he/she faces a broad range, of challenges called "develop-mental tasks." A positive goal for any NCCCS student services.division,therefore could be to help these mature students,through support Services, to face these developmental tasksso that they may experience further growth and development.The large proportion of "dOn't,knoi% responses to questionsregarding support services indicated that the, institutionsneed to Provide an effective means of disseminating informa-tion to theiestu'dents, particularly the part-time students,who currently appear to be receiving little information about
the support ,services tieing offered.
'4.inderlyinuthis developmAntal Ariel! of student supportservices is thdwassumption that there will be no single pro-gram or service in which "one size fits An increas-ingly.heterogeneous adult learner population will4requireequal heterogeneity of its student services program under aninstitutional commitment to a model of adult development and

133
the concept of-lifelong learning, In this way, support ser-vices can become more responsive to, individual needs, '
Conclusion 2: Evolving enrollment trends in!icatethat North Carolina Community College System stu-dents are interested primarily in "putting learningto work,"
In 1979, 65% of the curriculum students were employed'either full time or part time, as were over'5b% of the con-tinuing education students. Nearly three out of four curric-ulum students were enrolled in technical or vocational pro-grams, and over 50% of the continuing education group was en-rolled in occupational extension programs, all of which maybe Classified as occupation oriented pursuits,
Curriculum students indicated a vocational-monetary ori-entation, placing the desires "to earn more money" 'and "toget a better job" it the -top of their reasons for continuingtheir education "To.earn more money" was ranked second bycontinuing education students, Approximately one out of fourstudents in the survey noted that job counseling and Job,placement services were.important to them, These facts high-light the emerging working /learning orientation of theseadult students, and changes over the past decade indicatethat an occupational orientation among students is even moreprevalent today than it was 10 years ago,
There is every reason to expect that the community/tech-nical colleges and technical institutes will continue to playa major role in North Carolina's economic development throughproviding occupational training for the State's adult popula-
(ji
t on. However, this optimism should be tempered with recog-ition of several potential difficulties,
\Technological advances in industrial and service occupa-
tions will require community/technical colleges and technicalinstitutes to develop new programs for. training and retrain-ing labor force members. This could lead to a dilemma: theneed to invest in curriculum development and costly techno-logical equipment in the face of changing (decreasing) enroll-ments and a faltering economy, To defray the capital costsof such changes, the NCCCS may need to consider opening re-gional centers or regional institutions, A sharing of re-sponsibility might lessen the financial burden placed uponindividual institutions,' However, the notion of regionallybased centers,for costly or experimental programs brings up asecond, problem,
, .
Most NCCCS students have not had to travel great, dis-tances to attend class, due in part to The 'proximity of theseinstitutions to their homes and work places, The establish-ment of regional centers May require provisions for student
. _

134
housing. The provision of student housing calls into ques-tion the community-based philosophy of the NCCCS, and couldprovide financial and accessibility problems for the maturemarried students who are now in the majority.
Community/technical colleges and technical institutes
also may need to consider the grdwin-g tendency to upgrademany occupational programs--for example, nursing--to a four-
year college degree level, As enrollments decline at four-year colleges/universities, competition for students couldaccelerate unless lines of communication and program articu-lation are developed between North Carolina's tystsms of pub-lic two-year and four-year postsecondilary, educational insti-
tutions.
Societal changes in recent years have brought about adecided increase in occupation-oriented program offerings in
NCCCS institutions, Enrollments technical programs haveincreased, whereas most other cur lupa 'programs show an en-
rollment decrease. Likewise, a majmority of conttnuing educa-tion students are enrolling in occupational extension. Thesefindings suggest movement toward a unidimen,sional rather than
a cosprehe.nsive role for NCCCS institutions. However, thistrend away from the traditional -liberal arts" programs may
be- offset by an accompanying diversification within other
programs.
Acapemic extension may be serving students who do notwish to enroll in college-transfer or general education pro-
grams. Special credit enrollments may be reflecting studentswho prefer to design their own liberal arts education', And,
technical and vocational curriculum programs also may be ab-
sorbing intortheir curriculums some of the liberal arts func-
tions. Thelchanges in enrollment patterns do not s %ggest
that the community/technical colleges and technical institutes
are :becoming simply Job-training institutions Rather, theymay suggest that the various aspects of comprehensive educa-tion are being synthesized within programs.
If the institutions are to continue to meet the diverse
-nee of the total adult population, considerations of theliber 1 arts curriculumparticularly the college-transferfunction -- should remain at the forefront. If this functionis eliminated, those students who choose the ldcal institu-
tion for the first two years of a four-year college degreewill be denied this opportunity. For those students who can-not afford or'do not wish to spend four years at a seniorcollege/university, elimination of the transfer functioncould mean curtailment of their educational aspirations,
This information raises two question (1) Can the' in-stitutions of the NCCCS continue to claim to be "all thingsfor all people'?" or (2), Is it time to redefine the'mission

135
and scope of these institutions? Perhaps in this era ofscarcities, when institutions of higber education are beingforced to "tighten the -belt," it is unreasonable to expectthat NCCCS 'institutions scan continue to offer programs andservices that meet the needs 'ot "all the people," If theseinstitutions can no longer continue to offer such comprehen-sive programs, then a reexamination and a redefinition oftheir- mission and philosophy may be in order,
Conclusion 3: A new pattern of integrating workingand continuing learning appears to be emerging amongstudents enrolled in-the North Carolina CommunityCollege System.
Responses to the survey instrument regarding employmentstatus of NCCCS students were considered of sufficient inter-est to repeat some statistics here. The data indicated that65% of the 11,794 curriculum students were employed, 43% fulltime and 22% part timeca Qnly 25% were unemployedthe remain-der were accounted for by homemakers and retirees. Among the4,320 continuing education students, 55% were employed, 45%ull time and 10% part time--only 14% were unemployed. The
reisaining 31% lie'lhomemakers and retirees. Nonetheless; 11%of the kurriculum program area survey respondents reportedhaving been enrolled for nine or more quarters, and alsostshalf had been enrolled for four or more. Special credit pro-grams were most Likely to include new students, Althoughcontinuing education courses typically are only one quarterin length, more than one in five of the continuing educationstudents had been enrolled for four or more quarters, and 10%had been enrolled nine or more quarters. In fact, only 40%of the continuing education students reported that they wereenrolled for the fiirst time in the 'quarter during which thesurvey was made, Academic extension had the greatest propor-tion of continuing students of the three continuing educationprograms.
Students' value orientations toward education also sug-gested a desire for continuous learning experiences. Thethird and fourth most important reasons identified by curric-ulum students for continuing their education were "to gain ageneral education" and "to learn things of interest," Con-tinuing education students indicated "to learn things of in-terest" as their primary reason for continuing their educa-tion and "to contribute more to society" as their third mostimportant reason. All these reasons suggested a continuingself-improvement- value orientation toward education.
'Currently enrolled students - 'demonstrated a positive in-' terest lip continuous learning, since many had been enrolled
beyond the time,require7t to complete a single program orcourse. With the accompanying emphasis on technical _programs,
40

P
136
these adults support the argument that the community/techni-cal colleges and technical institutes have the potential forcontinuously training and retraining workers for North Caro-lina's labor market. As students in all programs begin todevelop such a-continuous learning orientation, there mayk bea need to reevaluate the distinctions between curriculum andcontinuing education program areas. The term "continuingeducation" may be taking on new meaning, as the majority ofall students were involved in some type of continuous learn-ing venture.
Funding patterns may need to be changed as differencesbetween continuing education and curriculum program areas di-minish. The whole notion of full -time equivalent studentsmay cease to be functional as increasingly large segments ofthe student population undertake pait-time, and often inter-rupted, continuous learning, projects. Such a shift in orien-tation is in keeping with knowledge about the characteristicsof these mature students and about theories of adult develop-ment. Institutional programming wil ed to be chanted toaccommodate this new orientation, ogram designs-1111 needto be made more flexible and to be ased on an understandingof the developmental needs of coati wing adult learners.Such flexibility and understanding will allow for continuity,sequence, and integration of subje matter is 'programs while,in accordance with their individual needs, alloying studentsto start and stop their learning a different points. The
need to recognize prior learning ex riences becoWes evenmore important tinder such a framewo
Conclusion 4 Students enrolle in the North CarolinaCommunity College System percei e their local institu-tion as a major vehicle for educational opportunity.
Two out of five curric_41um and four out of five cont inu-ing education students said 14aat they would not have attendedanother institution If theirs had not existed. In addition,83% of the curriculual" and 96% of the continuing educationstudents listed the community/technical college or technicalinstitute in which they wet*, enrolled as their first choiceof institutions for continuing their education.
When these preferences are examined in light of the ma-turity of the students and the fact that the majority traveled10 or fewer miles' to attend class, North Carolina's community/technical colleges and technical institutes appear to be fill-ing an important educational need that could not be met aseasily or as well by other typep of postsecondary educationalinstitutions.
The findings of the study indicated that well overthree-fourths of the curriculum and more than one-fourth of
8

137
the continuing education students were attending classes ontheir institution's main campus. And, most students lived orworked near the place where they attended classes. Only 28%of the curriculum students and 10% of the continuing educa-tion students traveled more than 15 miles one way to attendclasses. As the cost of fuel continues to escalate, commu-nity/technical colleges and technical institutes may need togive-more attention to the importance placed on transporta-tion to and from classes.
With the demographic changes that are occurring amongNorth Carolina adults, such as the aging of the population,it appears that NCCCS institutions will continue to play amajor role in providing educational op0Oiiunities for theseNorth Carolinians. This aging of the adult population alsowill be reflected in the enrolImentS in the System. Due tothe demands of work, civic, and family responsibilities,these older adult learners are likely to continue to selectthe community/technical colleges and technical institutes astheir first choice for continuing their education.
Again, program flexibility anA ease of access to NCCCSinstitutions will continue to be key influences in students'decisions to attend, particularly the more mature studentpopulation. lo the years ahead, predicted energy crises andgrowing transportation problems will mean that ready a§cpessto continuing education facilities may become a critfiler fac-tor for students of all ages. State, national, and eTeofor-eign policies in these areas may have a tremendous effeetupon the demand for educational opportunities. For example,if automobile usage is curtailed because of rising gasolinecosts and shortages, or governmental restrictions, it willbecome necessary to take education to the people through off-campus centers, satellite institutions, or alternate types ofinstructional modes and new scheduling arrangements. Such ac-tivities may be necessary to provide mhndated services andcould prove to be a key f for in institutional survival.
Concl sion 5. In ge eral, North Carolina CommunityCollege System institutions are serving an incre*s-ingly representative cross section of-the State'sadult population, even though there are exceptionsin specific programs. ,'
When the characteristics of curriculum and continuingeducation students were compared to those of North Carolina'sprojected 1979 adult populatjon, the community/technical col-leges and technical institutes seemed to be serving a broadcross section of that population, This genefalization istrue for most, but not all, population characteristics.
-r

I
*38
In curriculum program areas, the enrollment patterns areincreasingly. representative of the State's adult population in
terms of age, sex, and race distributions, although older agecategories still are underrepresenied in the enrollments.However, both the higher and lower socioeconomic levels arebecoming overrepresented in curriculum enrollments, while con-tinuing education program area enrollments match the State'sadult age and racial distributions more closely than theyhave in the past. Females are increasingly overrepresentedin the continuing education program area, as are white-collarworkers and college graduates. Adults with less than a gram-mar school education still are underrepresented in continuingeducation, yet enrollments are approximating the State'sadult population more closely than they have in the past.
To limit analysis to the broad curriculum and continuingeducation program areas would be to ignore clear distinctionsamong the types of carriculums within each program area,,While overall enrollments suggest a "melting pot,- specificprograms actually are more representative of the "salad bowl,"which combines different elements while maintaining theirdistinctive characteristics,
For example, males and females were almost equally rep-resented in curriculum-program area enrollments, but 70% ofspecial credit and general education students were females,while 67% of the vocational students were males, Again, spe-
credit and general education programs attracted olderadults, the younger adults were- enrolled in college-transferand technical programs.
A smaller proportion of minority students were noted incollege-transfer, Keneral education, and special credit pro-grams, with a concomitantly lirger proportion observed in vo-
cationUl programs. The technical and vocational programsalso included a larger proportaon of the socioeconomicallydisadvantaged, while the liberal arts programs were dominatedby the more affluent students
Similar glistinction,s existed in continuing education pro-grams. Fundamental education students were the youngest ofthe continuing education groups. Females were overrepresentedin academic extension programs, but much less so in.fundamen-tal education. Ten percent of the academic extension stu-dents were black, as opposed to 52% of the fundamental educa-'tion students. Academic extension students represented thehigher socioeconomic groups, fundamental education students,the lower,
It appears that the community/technical college and tech-nical institutes are meeting their egalitarian commitment to
. the open-door policy of equal educational opportunity for allNorth Carolina adults when overall enrollments are considered.

139
However, when looking at specific, programs, enrollments are-not always representative of the State's adult population.For example, by definition, fundamental education studentsare expected to represent the disadvantaged adult population.,Likewise, young adults who are beginning their careers areexpected to be the largest audience for college-transfer pro-grams.
As more -reverse transfer" students and adults with acollege education enroll in programs, either to upgradeskills or to learn new skills, the question must be askedwhether or not these individuals are occupying "slots" in theprograms that might be filled with more economically and edu-cationally disadvantaged persons whose enrollment would havemore survival value to the enrollee. Such potential inequi-ties in educational opportunities deed to be examined as thewell-educated adult begins to compete with the disadvantagedor less well educated for enrollment in such high-demand pro-.grams.. The disadvantaged adults may typically view the localinstitution as their only vehicle for upward mobility. Todeny them this opportunity would be counter to the stated
. mission and philosophy of the NCCCS. New entrance policiesmay need to be formulated that are based more equitably ontest scores or grade-point average and a realistic appraisalof individual educational needs.
Meeting the unique needs of differing adult groupsshould not be equivalent to matching a Meritocratic socialhierarchy. Institutions of the NCCCS may need to continuerecruitment and programming efforts that will enable them toexpand rather than simply maintain the opportunity structure.
Conclusion 6: Institutional marketing strategies arehaving considerable influence on potential students'decisions to attend community/technical colleges andtechnical institutes and are providing primary sourcesof information about programs in which students haveenrolled.
Nearly one-fourth of all the influence on curriculumstudents' decisions to enroll was direct institutional market-ing: institutional recruiters or other personnel, institu-tional literature, and the media.' Another 9% of this influ-ence case kroi other students at the institution (indirectmarketing). Continuing education students were influenced byinstitutional marketing efforts (both direct and indirect) toan even greater degree thin were curriculum students' Nearly40% of these respondents indicated that they were influencedby either institutional 'Recruiters or other personnel, insti-tutional literature, or the media, while another 9% were in-fluenced by other students.
-'411=1

140
The marketing strategies being used by NCCCS institu-tions not only influence students' decisions to attend, blitalso provide exposure for the institutions' program offerings.One-fourth of the curriculum students cited institutionalliterature as the first source of information about the pro-gram or course in which they enrolled,. Another 19% indicatedthat recruiprs or other institutional personnel were thefirst source; other students also were the first source ofinformation for a considerable proportion of the respondents.
Among continuing education-students, 58% indicated thatinstitutional personnel, literatuYe, or media sources pro- .
vided their first knowledge of the program in which they en-rolled, Other students provided Information for another 11%,All in all, it appears that direct or indirect marketing ef-forts of the institutions were an effective means of provid-ing information about programs available,
Theocommunity/technical colleges and technical institutesare assuming a more direct and effective role in marketingprograms than they have in the past, As enrollments declinein some programs and grow in others, a continuous marketinganalysis will be needed to apprise the community of educa-tional opportunities available. However, successful market-ing management requires that all educatiopal programs be vig-orously promoted, Not all groups that are potential clien-tele of the NCCCS are'receiving information or are influencedto attend by the same forces, Therefore, successful market-ing techniques must be predicated on continuous marketing re-search and efforts to locate those target groups to whomavailable programs are not being marketed successfully,
Not all of the target groups for whom programs are de-signed reqtfire the same type of information, so it becattisimperative that institutions use consumer analysis techniquesip undertaking a process of continuous differential marketing,This procedure allows institutional marketers to design moreappropriatestrategies based on an awareness of subgroup dif-ferences. Managers will find it necessary to utilize a vari-eity of promotional' techniques.
Because of changing needs in the educational marketplaceand a shift in the naure of NCCCS target audiences, commu-nity/technical college technical institutes may find 1%-necessary to design marketing strategies that create a differ-ential advantage with relevant target groups. Particularly,with the older student, there are often other forms of educa-tional activity in the community that also could meet theirlearning needs and interests, The NCCCS institution must se-lect and design marketing strategies for those programs whichappear to give it the greatest advantage in the educationalmarketplace,

141
By utilizing a systematic marketing management processbased on marketineresearch, the institutions will be more ef,fective in analyzing the needs and interests of potential
markets,arkets, in locating new student markets, and in tar-geting programs at more specific audiences. In the face ofreduced resources and economic uncertainties, such an educa-tional marketing management process, with_its emphasis onquality and efficiency, will become increasingly important inthe years ahead.
Conclusion 7. Institutional characteristics that mostinfluenced students' decisions to attend were the edu-cational programs available, the location of the insti-tution in relation to home and work, and the low cost.
When students were asked what institutional characteris-tics most inf14§nced their decisions to attend an NCCCS in-stitution, "programs available" was the overwhelming responseof students in both program areas. Curriculum and continuingeducation students liXewise consistently listed "location"and "low cost" as the second and third most important charac--teristics.
Based on these findings, it appears that NCCCS institu-tions may need to continue to offer relevant programs, at lowcost, which are easily accessible to the people of North Caro-lina. Despite such-factors as rising costs, the increaseddemand for specialized retraining services, and a oommitmentto serve the adult population of North Carolina, the institu-tions need to maintain these important characteristics.
The targeting of programs to meet the needs and inter-ests of specific groups will become a critical step in theyears ahead. Particularly with rising costs, a changing mar-ket, and other uncertainties, institutional personnel need toanalyze the student market carefully in order to narrow the 4
focus of program offerings. Concerted efforts-to design anddevelop high-quality programs aimed at specifically identi-fied needs and interests in the educational marketplace arebasic to efficiency of operation and maximum utilization ofavailable resources. 4.
In the years ahead, program offerings must continue tobe accessible to relevant cVient groups. Institutions mayneed to consider the use of such non-traditionaj delivery
lipsystems as television and radio that allow st ts to learnat home or in specifically located receiving s ions, frans-portation services--carpool centers%buses, or.other means--could be enlarged and publicized. Such sOWices are particu-larly important for handicapped students or those who cannotafford to own or operate a private vehicle. Finally, insti-tut ions may wish to continue and enlarge upon their movementtoward offering more programs in non-traditional 4ettings
7

142 7or
as the lea ez' homes, the workplace, branch campuses,or other off -ca s sites.
Assuming NCCCg institutions TS-11 continue to offe Vv-.
cost programs to those adult-Aro Carolinians who o erwisewould be denied acociass to postse ndary education ef in d-ings of this study suggest that s groups,of s udents arebetter able to pay' for their educ tion than are others.Should it Become necessary in years ahead to alter fundingpolicies, it may be important to consider the student's abil-Lty to pay.
I
r1
e.
1:.., 4
10
4
go.

.0
-c>
. REFERENCES
143
Astin, A. W. 1978. Foul' Critical Years. JoSep,-Bass, Inc.,San Francisco.
Bolick, G, M. 1969. Socio-Economic Profile of Credit Stu-dents in the North Carolina Calamity College- System.HEW Project lio 8-C-033. Department of CommunityColleges, Raleigh, North Carolina.
Boone, E. J., R. W: Shearon, and E. E. White (eds.). 1980.Serving Personal and Community Needs Through AdultEducation. Jossey-Bads, Inc, San Francisco.
Sorg, W. R, ind M. D. Goll 1976 Educational Research:An Introduction David McKaf Company, Inc,, New, York.
Brewer, F. B. 1973 The thirteenth year. Change; (1) :
32a-32d,\
Carelgie 4mmissigp on Higher Education. 19:70. The OpenrDoor. 'McGra42%111 Book Company, Inc., New York.
Cohen, A. 1977. The social equalization fantasy. Commun.Coll. Rev. 5 (2).174-82. '
Cohen, A. M., and J. Lombardi. 1979. Can-the communitycollege survive success'? Change, 11(1):24-27.
Calburii, G. A. 1980. Courses 'by newspaper: No longer aneiperigent, pp. 41-46. In New Directions for Continu-ing Education, No. 5. Jossey-Bass, Inc., San Francisqp.
Comfort, R. 1978. A new operating milieu: The buyer'smarket. Lifelong Learning: The Adult Years, 8(1):12/-13., 2'7, 31. .
Commission on Goals for the North Carolina CommunitimmgollegeSystem 1977. Total Education: The Duty of 11111State.State Boarird of Education, Raleigh, North Carolina.
Cross, K. P. 1971. Beyond the Open poor. Jo ey-Bass;'Inc.,Washington, D.C.
Closs, K. P. 1974. Planning Non-Traditio- nlp -regrams.Josaw-Bass, Inc., San Francisco.
Cross, K. P. 1977.San Francisc
nt on Learning. JOssey'-BaSs;
4

144 `
Excellence in Education: The North Carolina Community College/System of Community Colleges and Technical Institutes.n.d. Department, of Community Colleges, State Board ofEducation, Ra Leigh, North Carolina.
Glass, J. C., Jr., and R. F. Harshberger 1974. The full-time middle-aged adult student in higher education.J. Hisgpes,...Freitic 45(3) 211-218.
Gleazer, E. J., Jr. 1978. Education folitteachable moments.Commun. Jr. Coll. J. 48 (8) :12 -17. 9-
Hillway, T. 1964. Introduction to Research. Houghton-Mifflin Company, Bostdh, Massachusetts.
Karabel, J. 1974., Protecting the portals: Class and thecommunity college. Soc. Policy, 5(1):12-18.
Kelm, W. A. 1979. Atlying good Sense to marketing. Commun.Jr. Coll . J. 50 (3) :10-13
Knowles:1M. 1978. The Adult 'Learner: A Neglected Species.Gulf Publishing Company, Houston, Texas.
Kotler, P. 1975. Marketing for Nonprofit Organizations.Prentice-Hall, Inc, Englewood Cliffs, New Jersey.
Lombardi, J. 1978. Resurgence of Occupational Education.Topical Paper, No. 65, ERICClearinghouse for JuniorColleges, Los Angeles.
Lombardi, J. 1979. The Decline of Transfer Education.Topical Paler, No. 70,. ERIC Clearinghouse for JuniorColleges, Los Angeles.
Luskin', B., and J. Zegirell 197)3. %Community colleges in thefront of -telecourse development. Commun. Jr. Coll, J.,4,8(6) 8-9, 44-45.
McNamara, W. 1980. The grayingof higher education. Change,12 (1) :16-17.
Mouly, G. J. 1970. The Science of Educational. Research.Van Nostrand Reinhold Company, New' York.
1976-78 Educational Guide- -North Carolina Comm.unity Colleges/Technical Irrstitutes. 1977. State Board of Education,Raleigh,, North Carolina. to
X978 -80 EduCational Guide. 1979. State Board of Education,Raleigh, North Carolina.

145
North Carolina Community College System Report, 1963-1970.1970. State Board of Education, Raleigh, North Caro-
, lina
North Carolina Department of Community Colleges. 1977., Total Education' The Duty of the State, State Boardof Education, Raleigh, North Carolina,
O'Banion, T. 19,72 Teachers for Tomorrow. University ofArizona Pres4, Tucson.
O'Keefe, M. 1977. The Adult; Education and Public Policy.Aspen Institute f9r Humanistic Studies ProgramEducation for a Changing Society, Cambridge, Massa-.chusetts,
Phillips, C, 1970. A study of selected socioeconomiccharacteristics of noncredit students in the NorthCarolina Community College System. Unpublished EdDdissertation, Duke University, Durham, North Carolina,
Roueche, J. E and J. J. Snow, 1977, Overcoming LearningProblems. Jossey-Bass, Inc., San Francisco.
4
Shearon, R, W., R. G. Templin, .Jr,, and D. E. Daniel, 1976.Profile of Students in North Carolina 'Immunity Col-leges and Technical Institutes, Vol. 1, Technical Re-port. Occupational Research Unit, State Department ofPublic Education, Raleigh, North parolina.
SStewart, B. F., and B. Duffy. 1979, Telenetworking, Commun,
Jr. C911. J 50(3).21-23.
Templin, R. G., Jr., D. E. Daniel, and R. W. Shearon. .1977.Are community colleges truly the "people's college"-,Commun. Coll. Rev. 4:7-14.
Vaughan, G. B. 1979, The challenge of criticism. Commun.Jr, Coll, J,, 50(2).8-11.
11,
Vavrek, M. 1976. Marketing: It's OK--we're OK. AdultLeadership, 25(4).101-102, 118.
hpe-<ling, L. S., and D. Park, Jr, 1974, Curriculum compre-hensiveness and tracking. The community college's com-
I mitment to failure. Commun. Coll? Rev, 2:10 -20.
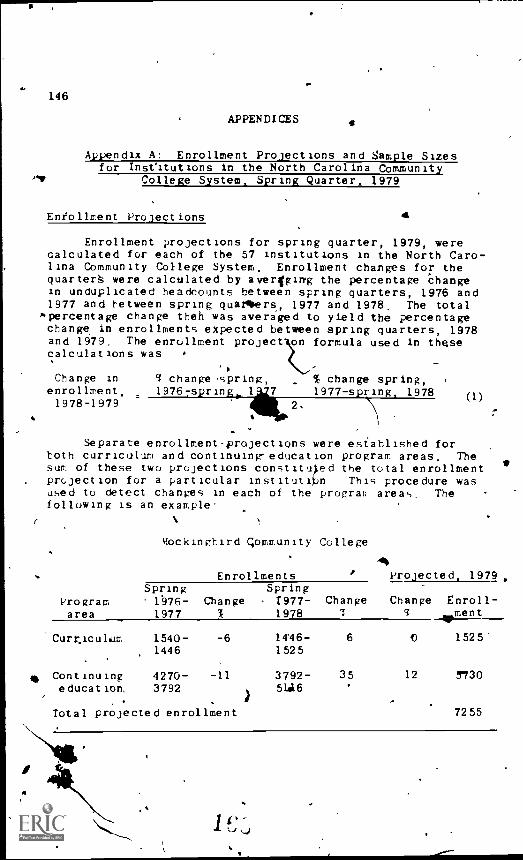
ti
r
196
APPENDICES
Appendix A: Enrollment Projections and Sample Sizesfor InsCitutions in the North Carolina Community
College System, Spring Quarter 1979
Enrollment Projections 4
Enrollment projections for spring quarter, 1979, werecalculated for each of the 57 institutions in the North Caro-lina Community College System. Enrollment changes for thequarter§ were calculated by averaging the percentage changein unduplicated headcounts between spring quarters, 1976 and1977 and between spring quarters, 1977 and 1978. The total
',percentage change theh was averaged to yield the percentagechange, in enrollments expected between spring quarters, 1978and 1979. The enrollment project on formula used in thesecalculations was
Change in 4 change spring, % change spring,enrollment, 19767springo 1 7 1977-spring, 19781978-1979 2. \\
Separate enrollment-projections were established forLoth curriculum and continuin education program areas. Thesum of these two projections constituted the total enrollmentprojection for a particular institatibn This procedure wasused to detect changes in each of the prograr areas. Thefollowing is an example'
(1)
Mockingbird qommunity College
40Enrollments Projected. 1979
Spring SpringProgram ' 1976- Changearea 1977 %
sCurrjculum 1540- -61446
Continuing 4270- -11education, 3792
)
Total projected enrollment
1977- Change Change Enroll1978 I 3 moment
...
14'46- 6 C 1525-1525
3792- 35 12 173051.16
7255

.
147
Sample Select tyr Drocedure
. The major aims of this study were (1) to provide a pro-file of the students enrolled in al{ 57 institutions of theNCCCS and.(2) to provide each of the partitipating institu-.ions with a profile of the students in its respective pr6-
44"n'grams by program area (curriculum and continuing educk.tion)
It was .realized that to ensure a representative and ac-cura.te picture of the students in any 4iven institurion withinthe system, A sample of sufficient size must be taken. It
further intended that all institutions participating in dstudy should Tedeive equally precise and accurate infor-
ma ion about their students teased on time considerations,r:.ources available to conduct the study, and the generalize of the project, it was further intended that all insti-4
trans should receive data that are, at a minimum, accurateto within 13.5% of an estimated population value. This ac-curacy should have a 68 probability oflbeing true.
In collaboration 1th Charles H. Proctor professor ofStatistics, North Carol1 a State University, a formula forsample size was selected at would allow the desired degreeof precision, account for t effects of sampling cltisters orclasses, and adjust for vaiations in institutional enroll-ments. The following is the proceduYe used
Given that the research design called for !luster sam-pling from all 57 institutions, a research design effect of2 was utilize to inflate the sample sizes obtained from the.formula
7
P z (2)
where p is the population parameter., z is the z-cGre,equiva-lent of"the desired degree of precision, p is the estimatedsane proportion, q 1-p; Ind n is sample s.ize.
In addition, a finite population correction was used toadjust sample sizes based on the enrollments of the institu-tions, since the samples were not drawn,from "infinitelylarge" populations This correction formila is:
;1r
N )
(3) ,
where c1isthe uncorrected sample size
'
S2
is the corrected'sample ,size, and N is the population from which the sample
was drawn

14S
As a result of the adjiIsted sampl sizes, institutionsthat participated in the susvey could xpect (1) information .
that was comparabl to the informatio obtained by the otherinstitutions in to s of precision; (2) information that ac-counted for the e fects Introduced by sampling whole classes;and (3) a sample size that reflected the size of the enroll-ment in their institution,
Shen the data from all the participating institutionswere combined to produce an overall profile of the studentsenrolled in the ti CCCS It was anticipated that the resultinginformation would be accurate and precise, with an expectederror of less than 4% When these data were pooled, pro-cedures were employed'to account for differences in the sizesof institutional enrollments and their potential impact onthe total system profile.
Projected Eprollment and SampleSize,_ by Participating
Projectedenrollment
Projectedsample
Institution, 1979
InstitutionAnson Technical College 3,41:0 359Asheville-Buncombe Technical College 6,6"26 , 377Beaufoit County Community Collecg. 2,530 345Bladell Technical College 1,278 304Blas Ridge Technical College 4,631 368Caltwell Community College 5,105 371Cape Fear Technical Institute 9,3N 383Cartaret Technical College 2,730 349Catawba Valley Technical College 10,149 385Central Carolina Technical College 7,255 379
Central Piedmont Community College 24,478 394Cleveland County Technical College 3,259 356Coastal Carolina Community College 8,664 382College of Albemarle 3,712 361Craven Community College 3,321 357Davidson County Community College 5,0,667 373Durham Technical Institute 4,220 365Edge.cosbe Technical Institute 2,359 342Fayetteville Technical Institute 10,097 385Forsyth Technical Institute-- 10,064 385
,
Gaston College 9,239 383Guilford technical Institute 13,458 389Halifax County Community College 2,832 / 351Haywood Technical College 1,669-1 322Isothermal Community College 1,949 331
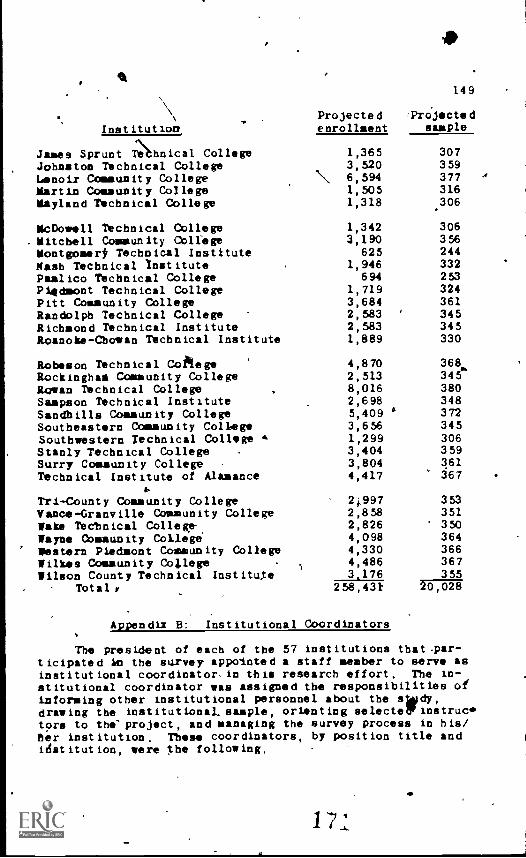
149
InstitutionProjecte denrollment
,Projectedsample
James Sprunt Tehnical CollegeJohnston Technical CollegeLenoir Community CollegeMartin Community Collegegayland Technical College
1,3653,5206,5941,5051,318
307359377316306
McDowell Technical College 1,342 306Mitchell Community College 3,190 356Montgomert Technical Institute 625 244
Nash Technical 3natitute 1,946 332
Pamlico Technical College 694 253Pi4dmont Technical College 1,719 324
Pitt Community College 3,684 361Randolph Technical College 2,583 ' 345Richmond Technical Institute 2,583 345Roanoke-Cbovan Technical Institute 1,889 330
Robeson Technical College 4,870 368..
Rockinghag Community College 2,513 345Rowan Technical College 8,016 380Sampson Technical Institute 2,698 348Sandbills Community College 5,409 ' 372Southeastern Community College 3,656 345Southwestern Technical College 4 1,299 306
Stanly Technical College - 3,404 359Surry Community College 3,804 361
Technical Institute of Alamancea.
4,417 367
Tri-County Community College 2;,997 353Vance-Granville Community College 2,858 351Wake Technical ColleKe. 2,826 350Wayne Community College 4,098 364
Western Piedmont Community College 4,330 366Wilkes Community College 4,486 367Wilson County Technical Institute 3,176 355
Total r 258,43t 1711713711
Appendix B: Institutional Coordinators
The president of each of the 57 institutions that .par-ticipated in the survey appointed a staff member to serve asinstitutional coordinator, in this research effort. The in-stitutional coordinator was assigned the responsibilities ofinforming other institutional personnel about the sdy,drawing the institutional, sample, orienting selectellinstructors to the' project, and managing the survey process in his/Ber institution. These coordinators, by position title andidst itut ion were the following,
17 ,1
A

150
Jinny liorg Dean of StudentsAnson Teeth ical College
......,.
Olin R. Mood, Vice-President, InstructionaAsheville-Buncombe Technical College
Alice Stevenson, Admissions CounselorBeaufort County Community College
Vincent Revels, Vice-PresidentBlacien Technical College
ry ices
Jacqueline L. Bedcingfield, RepstrarlBlue Ridge Technical College
Candace Tippett, Research and Planning AssistantCaldwell Community College and Technical Institute
Matthew C. Donahue, Dean of Curriculum ProgramsCape Fear Technical InstituteGuy F, Gibbs, Dean of Student AffairsCartaret Technical CollegeBruce B. Bishop, Dean of Student Services andAdministrative Ass istant
C.Awtawba Valley Technical College
F, Hubert Garner, Dean of Student ServicesCentral Carolina Technical College
Jack Cozean, Assistant to Vice-President, Career ProgramsCentral Piedmont Community College
June D. Peacock, Administrative AssistantCleveland Technical College
John Gay, Dean of Student AffairsCoastal Carolina Community Coltlege
G. John Simmons, Jr., Dean of Student ServicesCollege of the AlbegarleRobert McClanahan, Dean of StudentsClifpford Swath, Chairman'of CounselorsCraven Community College
Ray Stallings, CounselorDavidson County Community College
Thomas C. Gilchrist, Coordinator of Student ActivitiesDurham Technical Institute

Hartwell Fulkler, Dean of InstructionEdgecombe Technical Institute
Richard Folsoa, Recruiter and Job Placement OfficerFayuaville Technical Institute
Jean R. Perkins, Coordinator for Institutional DevelopmentForsyth Technical Institute
Milton Hagen, Director of Research and Persont?1Gaston College
A. P. Lochra, Dean of Student ServicesGuilford Technical Institute
Harriette Crump, Director of Institutional ResearchHalifax Community College
Walter L. James, Dean of Student ServicesHaywood Technical College
Marilyn Shore, CounselorIsothermal Community College
Debra Morrissey, Recruiter/Placement OfficerJames Sprunt Technical College
Pam Swinson, Staff DevelopmentJohnston Technical College
W. Preston erson, Associate Dein for Student AffairsLenoir Community College
Tom Ward, Associate,Dean for Degree and Diploma ProgramsMartin Community College
Louise Hembree, Learning Laboratory CoordinatorMayland Technical College
duce Shepherd, Director of Student PersobnelMcDowell Techntcal College
Donald Shoemaker, Director of Institutiohal ResearchMitchell Community College
Phillip H. KiaseLl, Director of Student ServicesMontgomery Technibel Institute
Robert Semple, Admissions OfficerNash Technical Inatitute
Larry H. Prescott, Dean of Student ServicesPamlico Technical College
e
151

1 524
Robert L. Somers, Director of Educational/StafrDevelopmentPiedmont Technical College
Ed Boyd, Dean of Student ServicesPitt Community College
John L. Roberson, Dean of .Student ServicesRandolph Technical Collegel
J. C. Lamm, Director of Student ServicesRichmond Technical Institute
Robert Sessoms, Dean of StudentsRoanoke -Chowan Technical Institute
Max H. Lippard, Administrative AssistantRobeson Technical College
4Jack R. Garber, Dean of Student AS -fakrsRpckingham Community College
p
Eddie N. Myers, Director of Admissions and RecordsRowan Technical College r
George Rose, Director of PlacementSampson Technical College
George C. Lewis, Director of ReearchSandbills Community College
Dan Moore, Dean for Student DevelopmentSoutheastern Community College
Richard 0. Wilson, Director of Student ServicesSouthwestern Technical College
Robert Washer, Vice-President 'for StudentdtervicesStanly Technical College
James M. Reeves, Dean of Student PersonnelSurry Community College
Ben Wolverton, Director of Student Personnel ServicesTechnical Institute of Alamance
John Bandy, Director of Student ServicesTri -County Community College
Frank H. Mipdigan, Dean of Student AffairsVance - Granville Community College
Phares S. Nye, Director of Institutional Planning anWake Technical College
." A

153
Ed Wilson, Associate Vice-President for Instructional Services. Wayne Community College
'Wein R. Chapman, Dean of Planning and DevelopmentWestern Piedmont Community College
Bob Paisley, CounselorWilkes Community College
Marvin Joyner, Dean of Resource DevelopmentWilson County Technical Institute
ndix C: Procedures for Drawin tbe am le
The institutional coordinator was re sible for draw-ing the sample for bis institution and con cting the instruc-tors whose classes were drawn in the saapli process. A
, copy of tbe completed sampling worksheet was orwarded to theresearch team at Nortb Carolina State University, where thesampling process was checked for accuracy. The following pro-cedvre was used in selecting the 'sample from each institution.
ROW TO DRAW THE SAMPLE OF CLASSES
Preparing the total class list:
1. Secure's copy of your institution's class report forthis quarter, which shows all curriculum classes with enroll-sent per class. If this list is not available, call NCSUproject staff.
2. Secure a list of all Continuing education classesThat will be in operation during the seventh week of thespring quarter, with enrollment per class, If Easter holidaysfall during the seventh week, include continuing educationclasses tbat would be .in operation on these days, Mere theynot holidays--these classes will meet again in tbe eighthweek. If you cannot get exact enrollment4 for these classes,ask Continuing Education to give you in estimate or average.
3. Combine the curriculum anc continuing educationclass list'S' into one TOTAL CLASS LIST, with enrollment perclass. Do not retype the listsjust combine them so youcan work with one TOTAL CLASS LIST.
4. Add eorqllments per class for all classes to getDUPLICATED HEADO4UNT for your institution.
5. Number all classes on your TOTAL CLASS LIST from "1"to however many classes you have.

11
154
Figuring the number of classes for your sample:
6. Use the following information to calculate the num-ber of classes your sample will include. A Sampling Work-sheet is attached.
a. Number of classes on TOTAL CLASS LIST'b. Desired sample size (Sampling Worksheet):c, DUPLICATED nEADCOUNT (from step 4):
Use these figures In the following equation'
No, of classes _ (Total number of classes) x (Desired .sample).in sample (Duplicated headcount)
If your answer is not a whole number, round ak to the nexthighest whole number. For example, If your answer were "6.13"you would round up to "7,"
Choosing the classes for your sample'
7. Now calculate your SAMPLING GAP:
Samplin (Total number of classedgap =(Number of classes in sample)'
If your answer is not a whole number, round uk to the nexthighest a)lole number,
8. Select a starting point on your TOTAL CLASS LIST,Using the table of random numbers attached to. this handout,(a) choose a 2-digit number if there are 99 or fewer classes;(b) choose a 3-digit number if 'there are 100 or more classes.
Pick a corresponding random number (appropriate numberof digits) by closing you? eyes and placing your finger onthe random number table. Write the number you have chosen onthe Sampling Worksheet.
9. Look at the coitmon on your list in which you numberedyour classes from "1" to however many there are. Find thecrass that has the same number as the number you chose., Thisis your first class your sample. Write the class name on
the Sampling Worksheet
If the random number you picked is larger than the total
number of classes, subtract the total Dauber of classes from
the random number. The resulting number will identify thefirst class in your sample. For example, if you had 382classes and the number you chose was "975," you would begin,
with the class numbered: -

$7.55
975 random number picked. - 382 number of classes
593 still too large, so subtract- 382 steinTry first cass in your sample.
10. Add the SAMPLING GAP (step 7) to the number of yourfirst class. This will be the second class in your sample.Continue adding the SAMPLING GAP until you have selected asmany classes as your sample requires (step 6).
a. You probably will reach the end of your classlist before you have selected all of theclasses you need. When this happens, justsubtract the total number of classes from yournumber. This will start you back near thebeginning of your list.
b. Just to demonstrate, assume that in the exampleabove the SAMPLING GAP was "23." You wouldkeep adding "23" and choose:
Class 2342572803033264349372395 too big, so subtraqi
46382 number of classesbegin at this point at top oflAst
c. This process should cycle you through your en-,tire TOTAL CLASS LIST. '
SAMPLING WORKSHEET
1. Duplicated headcount (curriculumplus continuing education)
2. Total number of classes:
3. Desired sample size
4. Number of classes in sample:,
(
1 '7:

., 156/ 4
5 Sampling tap))
1
Randon, nun ber -,elected
\ unter
1
2
4
7
es
9
10
11
12
13
14
15
16
17
18
1920
CL ASSES SELECTEE FCR SAIFLE
Class
11
1
f
1-
IP,
Time/Ca Locat ion
..,1.
4

a
Institution
Anson TC:20.9.441e-BuncoMbe TC1.1fort County CC
6.1 Bladen TCBlue Ridge TCCaldwell CCCape Fear TICartwret TLSCatawba Valley TCCentral Carolina fC
Central Piedmont CCCleve/and County TCCoast,a4 Carolina CC 41"--"ICollege dT AlbemarleCraven CCDavidson County CCDurham TIEdgecombe TIFayetteville TIForsyth TI
rc_ "4
Gaston ColterGuilford TIHalifax CC0a1;od TCIso ermal CC NaFf
'
SURVEIY RESPONSE RATES
Usable NonrespondentscActual returnsb Absent Refused241111Ple N f
,/for
(271) d 271 --430 378 88408 329 81310 255 82375 281 75
402 33? 84356 286 80
338 209 80380 951 92392 340 -87
452 344297 264
7689
377 338 90409 330 81.353 295 84415 336 81374 310 MO335 280 84343 253 74394 320 81
ti.
. 368 309 ' 84.356 306 86373 357 96314 264 84402 ' 296 74
--56814792
3
Q3
821
3
r6
--4
5.
01 0
-30
65 4e -026 2 -149 4 1
103 5 033 0 ....0
37 2 076 0 7322 36 0
77 6 463 0 -149 6 065 25, 073
I2 0 1
.-,
40 19 050 0 018 ,l 346 0 ' -4
106 0 0
1-.4 11114P1 (I

6 Usable,,---7 Actual returnsb Absent
Institution EqiE2it!4
, N C 4James Sprdpt it 339 197
Johnston TC 298 282
Lenoir CC' 411 329Martin CC, 28E' 23e
Mayland TC 302 288
McDowell TC.' 352 310
Mitchell CC 321 268Montgomery TI 236 206
Nash TI 277 229Pamlico TC 236 186
Riedmont TC 283 230
Pitt CC. 289 258Randolph TC 326 257Richmond TI 336 293
RoanZ,zChowan TI 341 279
Robeson TC 372 -322
Rockingham gc 380 -274
Rowan TC 333 25Sampson TC 362 517Sandhills CC 340 268Southeastern CC 356 010266
Southwestern TC 338 242
Stanly TC 359 %.-----1,
281
Surry CC 391 267
TI of Alamance 32'8 269
'58 411g6f'80 0
95 /11
)68 4084 5187 2283 3279 5081 -47
'....J
317 6887 4182 61
, 87 5072 10577 78
88 4579 ,.69
75 9072 75,78 7368 10682 29
ft
NonrespondenRefused Uni4c1Ounted
for
740
1
6
2
1
,
-20
1
0
-1
-12 1 0
8 0
15 -1
0 0
8 2
0 0. 1 0
1 -1
1 0
0 0
0 -1
2 2
0 0
3 0
0 0
21 0
7 , 2
18 0'30 0
4

...
lir
InstitutionI'
Actualsamples
Usablereturnsb,
Nonfespondentscbl'Absei Refused Unaccounted
forN fs/ Tri-County CC 261 204 78 49 6 -2
Vance-Granville CC 378 264 70A 99 14 -1Wake TC . 361 309 86 051 1 , Ogp ' '
Wayne ,CC , 318 297 93 24 0 // 3"'"N
Wes'tern Piedmont CC 343 262. 76 71 10 0
Wilkes CC 411 340 83 66 4 -1
Wilson County TI 434 430 99 3 1 0
dotal 19,922 16,408 i=82 3,153 366 5
'Actual sample = number of students enrolled in sampled cifasse's at ti* of.survey; excludes clisses that Fred ended or been cancelled and/students who haddropped from class after registration but prior to administration of survey in-'strument
4
bUsable Aeturns = number'of student responses on tape record; % = usablereturns divicred by number in actual sample; F - mean percentage.
cAbsent number of stlIdents enrolled 19 sampled classes l'ut not in classf during survey inStrument administration; refusea number of enrolled studentspresent at timeof survey,administration but refusing /to complete survey in-.strument; unaccounted for discrepancy between tallies of (usable returns +absent + rsAusal) aild actual sample; minus numbers - actual sample greater thansum of (usable retuYns+ 'absent +*refusal)--due to miscount of completed ques-tionnaires, mechanical error, questionnaires damaged and hence not scannable,or unnuted removal of watctaged questionnaires;_ nod, pcsttive_Ombertactualsample smaller than sum of (usable returns + absent + refusal)---due to miscount.
dAdministration information unavailable from Anson Technical Coll num-ber of usable returns used to estimate ,sample size to allow inclusion with otherinstitutions in calculating total enrollments.
411 1
co+

160
Appendix E: Pretest Findings and Reliabilityof Survey Instrument Responses
4W. The initial draft of the survey instrument was pretested''
with 161 students at Central Carolina Technical College andWilkes Community College during January, 1979. The survey in-strument was readministered orally. to 53 of these same studentswithin 1 to 8 days after they had completed it toroth(' firsttime. Because the reliability of most questions had beenthoroughly examined prior t% the 1974 student survey, themajor purposes of the pretest were to evaluate (1) the impactof the rewording and change to an optical scan format, (2)student willingness io divulge personal information, and (3)the amount of time and effort required to qpmplete the que-s-tionnal. The pretest sample of students included bothcollege- ransfer and remedial adult classes. Students andtheir idstructors completed an evaluation of the survey in-strument
ftem ReliabilityItem reliability was estimated by calculating the per-
centage of usable responges during pretesting. Questions'that were unanswered or were answered unacceptably (eg.,two responses given when only one was auillowed) by less than95% of the respondents were .
.411P% . .
Usableresponses
Question number and consent % Changegi,,,r .: ., 21. Plan to 'enroll in degree program 86 Rewrote
26 Highest grade completed, student 81 Rewrotend parents
27, GEAD sere 78 Rewrote'32.. Amount of financial aid 86 None36 Income, student and parents 68 None38. Hours worked' per week for wages 94 Rewrcite39. Wages per hour . I 93 Rewrote40. Occupation head-of-household 88 Rewrote43. Employment plans 81' Revote044 Reasons for cont inulng e ducat ion 89 None45 Influence of institutional. 88 None
characteristics ..
Sae students expressed unwillingness to divulge finan-cial information about themselves or their parents; othersnoted that they did not know thod.r parents' income or the
. highest grade completed by mottitr or father. To lessen stu-dents' concern -about sharing private information, the quest-tiDn recirsting social security number was 1eleted from the

161
final survey instrument. The social security number was in-tended to be used to identify students who completed the sur-vey instrument more than 'once The question on "occupationalcategories!' was shortened from 61 to 48 response c))oices. A -410
majority of the other item revisions were simple editorialcbanges, such as moving the -does not apply" resppnse to thefirst position in questions including this type of answer,it was assumed that if the question dd, not apply to the re-spondeRt (e.g., GED score), he/she might not read the completerange of responses after scanning the stem.
Questions 44 and 45 asked the respondent to choose andrank in order of importance reasons for continuing his/hereducatien and the institutional characteristics that most in-fluenced him to attend, The first and second responses, bythe 33 students who completed the questionnaire twfce werecompared to estimate thequestions' reliability over time.Kendall's Taub, a test comparing rink orders, was'used tomeasure reliability. The rink prder of responses to eachquestion (f4st, second, third, etc.) was calculated for thefirst and second administration of the question. The twosets of rant orders were compared using the formula
nub = S
r1
Lv (Nrl) - Tx 1 (N 1)2-14
J 2ZIN I
(4)
where S is the number of concordant pairs (those receivingthe same rank. both times) is the number of Discordantpairs (those receiving different ranks); Tx = It(t -1) - -t is
Ole number of tied obsery Lions in each grpup b f ties on thex-variable end: and Ty = It(t-1), t being the number of tiedobservations in each groU of ties on the y-variable end,For question 44, Taub = .954; for question.45, Taub = .730,
,Student Reactions,
Respondents were asked to indicate any questions theydid not want to answer. The fpllowing were uindici4ed by more
.than of the test group.'
Unwillingto answer
Question number s1
nd content 3
26, Hight grade.lompleted, student and parents 5
32, Amount of financial aid. r 2r
36. Income, student and parents , 16
39. Wages per phour 6
40. Occupat ional category * 4
1

6
V
162
In addition to the test group's comments on the questionsin the survey instrument, one group of contin ing educationstudents refused to complete the survey instrument, remarkingthat -they did not see how it could benefit them; that they hadenrolled to learn a subject, not to act as "guinea pigs."This reaction did not lead to a change in the wording of thesurvey items, but did argue for a thorough orientation ofcontinuing education students during the actual survey.
1
Instructor Reactions
Instructors reported that their student did not appearto have difficulty in completing theAnst ent, but notedquestions that needed to be rewordet(6., Their suggestions werein line with those indicated by es imating student itemabirity. StUdents took from 10 to 55 minute. to complete, thesurvey instrument. those requiring the longest time were inadult basic education (ABE) classes.
Validation of Survey Instrument
Content and face validity of the survey instrument wereestablished by two separate groups of evaluators: the Ad-visory Council ofthe Office oiReseafch, North Carolina De-partment of Commubity COleges, and the project's-researchteam.composed of graduate students who bad research interestsand/or work experience in the Community College System. Thosepersons who were part of the 1974 survey team also were includedin the project's research team. Evaluators were asked tojudge (1) the correctness and completeness of cattgories anddescriptors it questions and response choices and (2) the de-gree to *bleb they would expect students to understand thequestions. Particular care was taken to establish face valid-ity that would elicit usable information from continuing edu-cation students.
4011The sources of financial aid for dents had umAargone
some changes since the 1974 survey, refore, the Directorof Student Personnel Services, North Carolina,Lepartment'ofCommunity Colleges, was requested to4review for correctnessthe categories listed in Ube question on financial aid.
The question asking respondents to indicate head-of-bousehold's occupation was new, replacing earlier instructionsto describe the, job and its duties. This change, was necessaryunder the opt1Cal scan format employed in the 1979 instrument.'The response choices (occupational categories) for this ques-tion were derived from the 1970 U.S. Census, Volume 1, '
1.

163
Characteristics of the Population,Part 35, North Carolina,table 170, pp. 665-671. All intermediate occupations
tbat included 0.1% or more of the employed North Caro-lina pdpulation in 1970 were selected for a total of 133categories. These were collapsed into 59 categories, and twocategories--"buraemaker or housewife" and "other"--were added`for a total of 61 categories. During the reliability checkof the survey instrument draft, these categories were fur-ther collapsed to a total of 48. Face and content validityof this question were estimated by the same procedures ofreview used with the other questions.
ReliabilitS? of SurreyInstrument Responses
Part 1 Nonresponses/Incorrect Responses
The following is an enumeration qj nonresponses to ques-tions and nonpermissible responses, or cases in which two ormore answers were given to a question when only one answerwas allowed Questions allowing more than one response (suchas rank4eg, or choose-all-that-apply) cannot be evaluated in .
the sane manner as forced-cboice questions. Percentage valueswere calculated from nonresponses only. Numbers were takenfrom the unweighted data on
Total curriculum students:Total continuing education students
4otal "program unknown" students'.Grand total
11,8884,415 .
105
ContinuingCurriculum.( . education
Question Nonresponse Nonperi Nonresponse Nonper-number ti % pissible N % missible
0.0 0 0 0.0 00.0 0 0 0.0 03.7 0 97 2.2 1
0.0 0 0 0.0 00.6 4 67 1.5 2
0.4 0 31 0.7 01 1- -1-7-- .. 79 1.8 160.5 2 43 1.0 1
0.3 7 38 0.9 30.6 4 83 1.9 1
0...4 2 77 1.7 1
1.5 7 216 4.9 1
0.4 2 36 0.8 1
1 02 03 4414 , 05 776 1 53'7. 128
/ 8 649 38
10 7611 5012 17713 52

164
Questionnumber
Curriculum
Continuingeducation
Nonresponse Non per-s ib le
Nonresonse Nonper-missible
14 105 0.9 3 60 1.4 0
15 34 0.3 0 43 1.0 0
*16 78 0.7 0 74 1.7 0
17 47 Q.4 6 64 1,4 5
18 60 .0,5 0 86 1.9 2
19 54 0.5 1 88 0.2 1
20 51 1.
122. '2.8 1
21 89 7 1 131 3.0 0
22 104 0.9 58 88 2 13 ,
23 66 0.6 35 72
1i13
24 50 0.4 2 93 2,1 0
25 90 0.8 2 ' 188 ° 4.3 2
26Y 301 2.5 72 205 4.6 2.4
26F 559 4.7 20 ' 538 12.2 6
261I 476 4.0 21 .4. 512 11.6 r 6
, 27 2036 17.1 l', 2 598 13.5 0
28 87 0.7 7 141 3.2 7
29 205 1.7 1 247 5.6 3
-30 0 0.0 0 0 0,0 0
31 0 0.0 0 0 0-.0 0-32- 228 1.9 3 , 241 5.5 0
33 81 0.7 1 133 3.0 0
34 101 0.8 0 t- 208 4.7 0
35 97 0.8 22 125 2.8 13
36Y 1133 9.5 3 521 11.8 0
36P '2311 19.4 5 1352 30.6 4
3738.
87, 0.7110 0.9
471
tO .97
l 43
2.216,.1
39 247 2,/ 7 251 5.7 0
40 237 2.0 80 20,5 4.6 20
41 100 0.8 3 133 3.0 0
42 128 1.1 1 254 5.8 ' 1.
43. 102 0.9 23 270 6.1 3
44Ie 0 0.0 0 0 0.0 0
45 0 0.0 -0 0 0.0 0
46: Rate quality of service .A 1260 10,6 6 1181- 26.7 1
B 907 .6 7 1100 24.9 3
C 1548 13 0 1 1563 35,4 0
D 1267 4 1584 35.9 1
E 1416. .L 1 1529 34.6 1
F 1448' 12.2 1 1458 33..0 2
G 1296 10.9 3 1510 34.2 2
R 1260 =10.6 3 1520 34.4 0
Of
1L

o
v.k165
* ContinuingCurriculum *ducation '
Questionnumber
Nonresponse
service
Nonper-aissible
Nonresponse" Nonper-missibleN % N %
46: Rate Quality of (contd) .
I 1305 11.0 3 1530 34.7 0J 1263 10.6 3 1406 31.8 2
K 1308 11.0 1 1497 33.9 1
L 1228 10.3 4 14 55 330 0* _II . 1154 9.7 3 1474 3S,A " 4
N 1075 n 9.0 5 1418 324 047 ( 93 0.8 . 8 185 4.2 2
48 115 1,0 ) 38 216 4-:9 19
Part II Tally of Conflicting Responses
Ibis section gives the number and plarcentage of curriculumand continuing education students vho gItve conflicting responsesoc different questions. Question numbers are those used in thest,rvey instrument.
z Q19 Not. currently married; ye-t-living with spouse andchildren, if any.
Curriculum' 30=0.3% Continuing education: 17=0.44
Q4R x Q31,Continuing education program code, arid claimsfinancial aid. 9
Curriculum None Continuing education 489f11.14
Q8 z Q35: Single, Isloed, or divorced, and spouse bead-of-h.Tusehuld.
4hk. Eurriculum 11=0.1% Continuing education: 14=0.3%
Q15 x Q26Y: Never enrolled full time in college, and reportscollege graduate or postgraduate work.
CurricuIum 93=0.84 Continuing ducation 36=0.94
Q15,x Q26Y Enrolled full time in college, and less than high. school education. -
Curriculum 11=0.1% Continuing education- 11z0.3%
Q15 x Q41. N r enrolled full time in college, and has coltdegree.
Curricu unit 32=0.31 Continuing education:- 33=-138%"..
Q17 x Q18 Not moved or moved for other reaspns, and paysspecial rent to attend clasges.,
Curric.ulum 600.51% Continuing education 123=2.6%.

166
Q26Y x Q28: Less thalghth-grade education, and reportedhigh .sch grade averrage.
Currisulua 57=0.5% Continuing edAation 156=3.8%
Q2U x Q29 Less than high school education, and reportedhigh school rank upon graduation.
Curriculua 72=0.63 Continuing education:. 199=5.0%
Q26Y x Q28 High school education tor more, anerked "didnot" attend high school,"
Curriculua )24=0,2% Continuing education 5=0,1%
Q26Y x Q29 High school education or more, and marked "did' not graduate from high school,"
Curriculum: 224 =2.O% Continuing education. 34=0.8%
Q26Y x Q27 GED certificate, and marked -did not take GED"or a below passing score,
Curriculum 61=0,6% Continuing" education: 17 - 0.5%
Q30 a Q8 Listed spouse as income source and self as single,widowed, or divorced.
Curriculum 28=1.4% Continuing education: 13=1:2%
Q31 x Q32:'Marked "nottteceiving,.financial aid' and liste0amount of aid.
Curriculum 63=1,2% Continuing education 42=1.13 Ik
Q31 x Q32 Reported source of financial aid, but under`Zmount of financial aid" marked "not receiving," ,
Curriculum 371=6 5% ContinOing education: 178=4.6%
Q35 x Q36P Marked parent head-of-household, Legit underparents' income marked "no long*r living,"
Carric.rium 14=0 1% Continuing education 9=0.3%
Q37 x "438 Employed full. time or part time, a'nd marked "nota wage earner."
Curricaltim 150=1.33 Continuing education: 64=1.5%
Q37 x Q39 Employed full,time or part time, and on "hoursworked per week" 'marked "not a wage earner."
Curriculum' .308=2; n Continuing eduCation. 125=3.03
Q38 x Q39 Marked ''not a wage earner" and reko ted hourly wage,Cureiculum -72=0,63 Continuing educati n: 29=0.7%
Q41 x 426Y Reported having college. degree, and marked edu-.cational level belipw college degree.
. Curriculum 37-0.3% Corftirruing education 40=-1,03*
Q42 a Q43 Marked plan to work in.North Carolina, but listed"other" work plans,
Curriculum- 499=4.3% Continuing education 389=8.4%.


168
NORTH CAROLINASTATE BOARD OF EDUCATION
Dporonerd of Codwyrunsty toflerpn RA/.118
1979 STUDENT PROFILE QUESTIONNAIRE
I s I suety or st,clents n No-8 CaooIou Cogfelu^ r, ConegN and Tetnnca1et ' 0 7(0.. de we, rcaortarr abca,' stude, nteretts lend
f he, 100004 ,,ler .0,W and temeKey 00r Oates curricul., andattn. on trudterts atto Now now Cochrnur cce and
"...1 70660 Otr. oa' 'an years.eate tad .446 ant at cat.h. ', A^twe, each ant on Dr,*,' C 'Ct Met
es 00 e40;,,4 ' ^ Irte c compel...My yct. eve, '0 moa0e/e orar,eee, toast ..e.fi or! arty., C enc. ern, and lark." to,,' her. htefe, -here I
4- anong s*et e6seyrs * CO ecsn',.te s4.1,0187ANT no, r'syee s o oe ,rod D -arc^ ,6711.4 'It a N..n.roer 2
e 0-ych7 y do -cr -.re , Pent do'af ^ T.mit ,n^a 60Ate rh40P
E x Joyt.E 0 Can too tIll p.m tO ohnswo, 1101 ourwfuses8005e7
71 No
4 Pograrn Code
9 Worm do you attend *sort * or moral,of your daft&
0 oar, 5 00 p
30 who. do y01.0 Mend 7000 mots,'of your classIs7
0 -a0 Jen, et e-0 ,a-4. ca^ put
it How many ',Dory Per ...elf re youn
0o
00
5
0 2'0 750
2530
".66 3'2
12 Now many datereett 041mi tee youtaicog thus quarter, 2.6ETh
T ' 0.01 00i0.0 000i0ao'cs 0®4000:® ®io0 0 09'0 0 0'
3 ®'0 00000
4
00 00000 14
5 Agt re, ry
2 7 ass 5...-noe 15
0000 0'0000 0
0 00'¶6
,'
'-' 00 17
0 Os-)
mcr. -.I a.. a-1.0,1
C0
6 ter
3 07 Pate 56, firsurnunuf
o 4' 3
0'
000 00®What t your duitancer to crest each
0 0 2' 250 0 25 35
s 03 35 - .s0 '6 0 o e 35 - s0440.. many n pedo you Mil. 10 ChMel.C33
0000000Hey, you eye' peen enrolled asfull 13ue:1.N V low tea,CO.ele or uniers te
0 0-0,1 aou I '00 tare yetero
0Dd lOU ea,te 10 change retdenceorder to attend school'
00
- lc1 1 3
8 Mt',. Status0 : _-_ Lt..
a-,
1111111,1111111111111111111111111111,111111111111

IS De yslu IWO41 lo aar not foe birdwoolonoe Pomo Teronweil la orderus mood Ito nwerowoon7
0 ^.0.0. $49 or hoe t molth0 yes 60-9 a month0 yes slos-supa0 ..s sisoszo s "florid,0 yet more then 200 . month
'4l Mars do you Irv. s,d. wweelwe at
Pm retool 7
O vs rrnth DOntsO rot onv 400usa end ChriCtrarn
any
O rye err, cm lien wt no, pourO .. *et, Othfil 'Mate..0 bool with "Ian 10 not nnaturos
0 r ve Vy TrysailO rye with "r shdil0 star raudance not stand ha,.
21
Mow many quenan Inetushno dswsmarter henuir been .strew stOno mahout'''.
O ',I CD cD a® 00 CPCO
/Our you contokete your ormail Manos worsen do you Men to .moll tenMoms worsen it a low date? ,1f
1.0., 0.1. 01,Cateca ^tt toicuril
0 r",
22 in Wenner, to ourself *Met onoother meson or worm wee menerfluentui ri your clactoon to mend
rftertutuard Choose ON
O ec s, eacoe 0, some 00.4Of.
0 ,,f bur O,
- -evryscaroe
O C 0.<O CC,' of son,. of+e 14^4i 4 ,emf ,01 eq. ,r v.
O dc 10'00 1104, D
00 '. "r0 ^ , Po 1.
00 00',. I yP
0 tor a se r* upe-r, 'a
r.ocar .., ro0 orri- .0 ye
1 1 1 1 1 1 1 1 1 1 1 1 1 1 1 1 1
160. did you first lam of Ow P.o9rones me in stud your nowowedod? lOsoose
0 racruitar taaavar or some otha0Orionnim from V,. whoa
0 ',WM.,. from this ineviution0 wade TV new.poptr0 lanoloyer0 teacher Of 6001101/1 O..10.,11
at co1149. or unrv.','Y'''0 hoot, school teach., count/Nor
or co.&0 mother0 fart.,0 hosband or ant.0 oh to0 SOM. Other f11.Q student n th s ',Md Non0 ',arc! .110 not student0 WC M Sef1KA &at,
oral Rerr r tat or eft0 oths" nor tte0
24 W0.1417 V041111.41 attended .nobler
oduarbOnal Vi. ifthis comers...rune cot technicaltowsitut* pad not *meted?
0,11 0 no
26 Pim that iismtutuen your fir? choptot corflnylng your Ildue.tIon,
Qyh 1 .114 0,0 ce0 No ovO, d 'ether vane merrirlea
arohns,sorni-^, ,,, Co Pg. orCO ^IT AY
0 40 f..' ..wendedCe na.er caliepe
0 No *ca, rsrne nays atendadDr ata 'rad< or ao'est 0".1 schoo
0 No woud .the' bane esrdsdOut C4 ate college u- ye fey
0 't r. wo, d ns ,ervs runded .O ..t. 4 .. college o ve s y
0 No woo a rartne 'van. .'1e.90-De Of IC.001 not 1110
Who set th lushest ge.de in school yOuy 1 h.v. compete& your father IF l
het cant:Alt.& your moths, IM) hascorrunstatl, Oe.1.,tVIe' .01 erk
E t, e roi arr. ^ot iure
. n war,.^9-- ; so.
ft. 0.0 q .11,Ve
arc oo
eq.
dra...14 no
009004009009000000
169
27 Moot vv.. yor_er final soon on ffprGED exam?
0 ad not take GED0 below 2250 225 249
0 250.2740 275 or et..
2 What wee parer cod. .rein In If*school! (Emmet.)
0 A 190-1031 0 below C itaadv;7010 B I80 -891 0 ad not Wend0 C 170-791 hiph`school
2 What me your school unit upongroduato& (Emrrute)
0 ,00e 1 3 0 .owtr 1 30 T call 1 3 0 to not gleduite
30 Whit are your CtirrIII sourest OfIncome-Wu lc r" at apply
O 0a t t S,,C3,0*,e,.00 ,uttwo n, fs
0 oe .1.110 4, "9,O et remerri Soc Sect, . VA rc0 we0 oth
31 Mut ars your corunt Koran off.n.ncul 'v. k al ''"m too,
0 CE
0 pas ed..rcst O,. ouoo".,-gu- 8E0C,
0 0,cole menu td..icstg SEOC
0 ed,or on oar0 to vora0 KK a Sec. ,e^"10 v l'1 ad" t .-
0 4 C t,de-r -cer, g'a'it
01,: tr O. or '4',O 1 ' e'en' tstro-0 ^, rc . -p ' aor aid
32 What I the amount of firuncial aid,tuct n Ito Int question) you willrun,. rifcet10 durne Ms 1978 1979school yYr, E tic
0 'c. ' 0 $1 00G S' 499r -anc reel 0 91 500-51 999
0 trite 9200 0 92 000-92 9990 9200-9399 0 53 000 a mu,
000 0 5400 _s699O 0 9700-9999000
2-1 1 1 1 1 1 1 1 1 1 1 1 1 1 1 1 1 1 1 1 1 1 1 1 1 1 1 1 1 1

170
13 How mutt, chat you pond on booksna mmarMas.thls Quartet for MI of -
H:sur 01001 'Er '-ae. ye vet 0.1 5-S9h-
-2 10. $25 0 S130-614.9S25 Se/ O S 50-S$5,-, $'1 0 S20C D '.`ore
34 Do your Pe01011porestrhy proyoe11110 one-1111 of your support=
36 Who s Thoolht Of II the h:1 Ofracy' fa h, of 14.3hotof
, 0 -er_ 'e e
mw The 1010 cerh for youand you, spoon ff(011, 0,0,tc., 33. .00 duet's/a the pest
'978 ' hone na .0, Pfntl^tom ft'
S.
s
i. w5: EYY"
r-srg 3 3s< 0 3
0 3s 3 49-9. 3 0Se 5 ear,
S S ;95 9 '3s 4 YrY J D
3 3
4rar
40 Wthch category bekset ia the beat thleCrip0on of Me OCCuplf011 01 $00haw try the h1111 of your household?
Rona he 41,t't Chscne 0 :meg° .\0 ecro..,^tur0 took 'et 00010090/ 00 ni
C11 es t motor prOductor,
0 c6:1°/:1,1'711t 000' 'f.11 100'
0 C,er" g SC. Cl 60 ,o ^01e
C Cyst DO ah
(01s.- -9 0,
e ^ hGtk 7 0,,t:[0,1,resi ^ 40110'.
O a s
O sr -0°0 .0 .) r Oct TII J'.Kr Cat010e 01,6
e PC; a 'let, all 116,36,00 ht. ^00
O to te S
0 1 rev a - "tg.r1Ita
0
1. e .
3- a lef..."' .
0 -
0O'0
41111
AS
0 -a.d ar e ;,,a c a ra
a- a s a
.38 1- ,,e p "0...,5 a 0
0
0 0
390 h-t
5
sf0
SA 4'
SE1
nags
3 To
5-s .45.4 yri
ar,ur
S 5,=-.
.,r1
,r
le
CONT ar ,E111, 4h, 701 NE,' -11..11Mho
0 ma, :toffs Coc-Dot for
I' frn ty'll 0 .000f 0, rcr,y, II D'esfrar
-11,00 :Or 0 Ste,.010-Ir "100C?0,
0 Th ^..'!-, cg *04^,D, C-no,mre ' sander 5I'er ear- 11
y ess eh,sah, we C ag cr, D D 0s
Cf, ith rc "e'hei.e
O 1,', 0 0. fhb- re er."0, or'
0 D'' cc Sec 616 Cl, a
sh,gap.ng C era
e, ..,gracca hypiff f et0, Via a C 5-00 lr'
0 0'. CP ^. es Keag-05Cs ; 3113, If -;
gr sc t le ce hattre
sa s oar 7.1
0 0' e: ,ar ,e rea,0,, c 51 to ;0111
0 ...014 laOa c ate
O PA al P age -
9 as vac. b-,
0 5, *sad c e ra
O 'n.
41 Do .ou p TO svo, lowlHatfour aim to' g dares'
00O
a
41 you 0 to To be mpEoydNurtr Ceronna eta, yr,
' t s v ft3,7, duClion
.
t_
PLEA* TURN TO THE NEXT PAGE
1111111111111111111 I-I 11111111111111 1111.1111 11111
1ley
Y.
"

43 Choose the response brio. 444e, bestdescratres your employment plant aftersducetton
O an, te , -a" '
'7) ee",e "er ea,
0 'a , yr,
0 a , age " a ;
O
e.
44 why ON you clettarb r.or04.4 youefirducabon,
0000
000000000®0000®QC:000'D-
00000
Pa
45 Venal nes aoo, t< s cornreen.r. coney.'ecrtY c ,net nllyenc.d Nv "01' n
0..01 %attend" t ---1'
41
00000a a In.
00000' a .1%. a,c0 is a.. abe0 0 (1"..) 0 0 S I00000,,_ 0
0000,-1:000000000000000 - -10000r")
j 414 Som. revretes are import o sOultsclown prate a0 '4Y bro., Mar
.h LP P 01-rgli"
T her, er e Kc
00C) e000-.000
000000
GOO000 -0,000001) ."'N.00000000",000-
CC
O
O0
7 The ,hst I, oh, h ,h, Coo nocollege 1.1tem ,m\''Pr..444r
4 .:0',Vpri Tc.. ca ns ," 00 n 0,4^, I,,^rd no r 100J d he ,rd ,o,
st ,t 0,0 ""
Q
4$ .44ch Ilatemtnt ben descr,bet your feel,nos.boat trung one standard name'
'as 'a -h "' S
0 +-,"0
itft
4 -1111111111111111j1111111111111111111111111111111

4
172
Appendix G Weight iv Procedures
The data collected were weighted to take into considera-two the Variation in size of enrollment at the individual
institutions, the probability of a student being selectedin the sample based on the number of classes in which he/she
was enrolled, and each individual's response to every vari-
able (case weight) ,
Institutional.Weights
Because the data frpm all 57 NCCCS institutions were glom-
bined to develop a statewide profile, it was necessary toweight the data to account for variations in the size of en-
rollments at the institutions and hence the contributioarthat
each made to the total system profile.
The following formula was utilize-41Lp calculate institu-
tional weights
A
Institutional weight -Institutional enrollmentInstitutional samPle size '
(5)
where institutional enrollment was based Nactual curricu-lum enrollment plus projected continuing education enrollment
for the spring quarter, 109, and institutional Sample size
was khe number As students drawn from that lost tution, At
the time of the analysis, actual continuing edu ation enroll-
ments for the iddividual institution's were not available.Therefore, for purposes of the study, projected continuingeducation enrollments Vere calculated by the research teas.(Subsequent analysis indicated that, new 'eights calculated
using the actual curriculum and actual continuing educationenrollments made no difference in the distribution of re-:
spotless on any variable.)
The range of institutional weights was reduced to theleast common denomOator to obtain more manageable figures.The largest instfVdtional weight was assigned to CentralPiedmont CommunAty College (26) and the smiviaest to liontgom-
ery Technicil College (1) ; mean institutional weight was 5.6.
Student Weights
The probability of being selected in the population sam-ple was proportional to the number of classes in which theindividual studept was enrolled, because the sampling units
were intact classes selected from institutional class lists.To equalize the probabilities of inclusions in the class

173'
lis_ts,, integer heights were applied to the responses toeither of two.quettions in the survey instrument,
. .'"I Student weigfits were assigned as follows to the responsesto Question-12: -Y,Row many different classes are you taking
41 this quarter (AI*, GED, or Learning Laboratory count as one) 7".Alesptnse toQuestion 12
Studentweight
502 253 174 135 106 97 7
If She studeit failed-to respond to Question.12, their) the re- j-kspouse to CitiestiOn 11: "How many hours per.week are you inclass (c5ntact hours)?" was usecl. to determine student weight,
,Response to Studen tQuestion 11 weight
2
4
1
1121 -
3
50
95 7
/ 6 67 6
Student weights were calculated as follows:
1 100Student weight Number of cusses this quarter
2
Cast 1Ne ish t s
(6)
To account for differences in sire of institutional en-rollments and tbe probability of a student being included inthe class sampling more than once, individual student re-sponses to each variable on the survey instrument were as-signed a case weight calculated as follows:
r
Case weight = (Institutional weight) (Student weight), (7)
where institutional weight is that derived from equation (5)aid student weight is derived as shown in equation (6).

174
am*
r
e
1
1
i .4
ss
Appendix fl Related Informationt-
r
I
1 ',, 11
I%
X' o
N1
4

Appendix Table 1. Weighted percent ge distribution of curriculum and continuing edu-cation students nrolled in he North Carolina Community CollegeSystem, 1979, CI would h attended another educational insti-tution iftheits ad no xisted, by age, sex, race, marital status,-7- educational att nme. , and occupation head-of-household
Variable
11-4959
or less- 29
-39
60-6970 os over
-...% Totalx
, yr: r
Sex:YaleFe 'aleTotal
Rice:!SlackAmerican IndianWhiteAsianOtherTotal
(4, Students
CurriculumContinuingeducation
Yes No N i Yes No
76.5. 61.6
47.043.331,417.2
15....261.4
23,538.453.056.768,682.8
;3.7
5,6713,024
, 2,003767205478
38.330.48
24.919.112.38.5§..4
61.769.475.180.987,791.521,E78.3
628799830573512494411
TNT38,6'.11,725Y 21.7
64.4 35.6 5,520 .24.9, 70.1 1,320
ILI 11.a 6.263 LL ,2 112.161.4 38.8 11,784 21.4 78.6 4,292
72.4 27:6 2,800 26.8 73,2 1,00261.3 38.7 189 17.9 82.1 f9t.
58,0 41,7 -20.1 79.9 3,10471.3 28.7
.8,56757 34.5 65,5 - 10
88 2 11 8 79 ?ILI 79.9 246176 1674 11,692 TITS 78.5 4 317
. ,
I.
I

rAppendix Table 1 (continued)
StudentsContiquing
Variable Curriculum education
-IYes No N Yes No' N
Marital status';Single
0 Married -
Widowed .
SeparatedDivorcedTotal
76.1 23.9 6,152 32.5 67.5 85849,2 50.8 4,54,5 20.4 79.6 2,59842.8 57.2 126 6.6 93,4 507
53.9 46:1 431 28.1, 71.9 12951,0 49,0 516 IL ,2 73.0% 18961.5 38.5 11,770 Ti2. 711.5 TigY
Highest grade completed ..*
.48.9 51.1Less than 7th 48 35' 8,0 92.0 419
.439 56.17th-8th 65 13.9 86.1 334
.350 65.09th-11th 288 25.9 74.1 839
High school 61.2 38.8 4,787 21.0 79.0 1,146
GED 54.6 45.4 1,008 34,4 65.6 127
High school 4- 1 yr 68.2 31.8 2,157 21.0 79,0 266
High school + 2-3 yr 68.4 31.6 2,627 26,5 73.5 389
College degree 543.# 50.13
.. 71390 24,8 75.2 394
28 4Graduate Bork 114 211 22A. 206
Total 61.1 ag./ .rrTur 21.6 78.4 47720
Primary income:Under $2,000 70.5 29.5 1,316 15.2 84.8 579
$ 2,000-2,999
(2
71.1 .28.9. 598 19.4 80.6 255
$ 3,000-3,999 74.3 25.7 563 20.1 79.9 165.'
$ 4,000-4,999 66.1 33.9 p482 22.9 77.1 139$ 5,000-5,999 69.0 31.0 .541 27.0 73.0 165
$ 6,000-6,999 62.7 37.3 507 19.4 80,6 156
$ 7,Q00-7,999 .. 1 ,j J .61.7 38.3 509_ 24.0 76.0 171
$ 8,000-9,999 0 ' 56.3 43.7 842 23.8 76.4 287

Appendix Table 1 (continued)
Variable
StudentsCont inuing
Curriculum educationYes No N Yes No
Primary income (contd.):$10,0 - 11,999$12,0 14,999$15,00 9,999'$20 ,000- , 999
$25,000 or overParents deceasedTotal
op
Occupation head-of-household:White collarBlue collarUnskilledFarmTotal
56.6 43.4 93360,0 40.0 1,23157,3 42.7, 1,34854.5 45.5 95260.9 39.1 1,05774.5 25.5 1661.4 38.6 17),/03
61,0 39,0 3,39959.9 40,1 3,03464.8 35,2 1,37665 6 34,4 50261,4 38,6 8,311
22.825.618.725:424,540.121.S
27.225.822.913 4r
77..2 30174.4 40081.3 46374.6' 33475.5 34859 9 6
78.2 N7749
72.8 1,14074,2 94577,1 455
6 174Y7717

Appendix Table 2 Weighted percentage distribution of curriculum students enrolled in theNorth Carolina Community College System, 1979, by source of financial'ail! as related to age, sex, race, aiiital stat0s, student's education,primary Jocose, and occupation bead-of -household
Variable Source of financial aida
CITA BEOG SEOG EDLO SCHOL SSEB VAEB NCSIG WRKST VOCR NONE
Age, yr ..
i
College -transfer.-
o
k
22 or less 34.1 70.7 81.33 57.1 80.4 100.0 20.6 35.1 50.3 18.5 55.623-29 43.4 19.9 18,7 18.4 8.2 0.0 45.8 62,7 43.7 43.1 16.5
i 30-39 22.5 5.2 0.0 24.5 6.8 0,0 20.7 2,2 0,0 38.5 16.8
40-494 0,0 3,2 0.0 0.0 4.7 0,0 10,9 0.0 0.0 0.0 7:5
50-59 0.0 1.0 0.0 0.0 0.0 0.0 2.0 0.0 6,1 0.0 4.2
60-69 0.0 0.0 0 0 0.0 0.0 0.0 070 0,0 0,0 0,0 1.4
ID or MOP! IS S _IS __IS __IS _!W1Total
__IS100,0 100.0 100.0
__IS100.0
_IsUM D,1
_!1S400,0
__QA100:0 IWO 100.1 100 1 .100.0
.(6) (236) (12) (12) (80) (77) (195) (15) (46) (9) (898)
General education22 or less 100.0 52.5 14.9 0.0 0.0 100,0 12.0 100.0 40.9 64,8 24.823-29 0.0 32.0 29.1 0,0 0.0 4.0 40.9 0,0 28,1 35,2 2.530-39 0.0 13.6 56.0 0.0 100.0 0.0 27.5 0,0 18,8 0.0 29.040-49 0.0 1.9 0.0 0,0 0.0 0.0 12.2 0.0 12.2 0.0 15.650-59 0.0 ,0,0 0.0 0.0 0.0 0.0 4.4 0.0 0.0 0.0 0t60 -69 0.0 0.0 0.0 0.0 0.0 0.0 3.0 0.0 0.0 0,0 670 or more -g 0,0
- AA.Total
_IS1/KOD
__12.2.Itio.10
__QDYY11 0.0
__LI100-.0
__IS100.0
__222 __ILI166.0 100,0
__IS1-6b10
_22Rio:0 100.1
(1) (49) (3) (0) (1) (9) (q8) (1) (8) (2) (161)
Special credit22 or less 15.1 62.7 43,5 100.0 74,7 44.0 32.2 100 0 0.0 0.0 21.323-29 7-.5 20.1 0.0 0.0 19.4 0.0 37.7 0.0 0.0 0.0 23.630-39 69.0 17.2 56.5 0.0 5.9 40.0 23.8 0.0 '100.0 0.0 27.740-49 1.8 0.0 0.0 0.0 0.0 0.0 6.4 0,0 0.0 0.0 11.7
C. +J
41

Appendix Table 2 (continued)4
Variable-
Source of financial aid!TETA BROC MOO !DLO SCROL SSEB VANE NCSIG WREST VOCB NOWT
4ge, yr (contd.)50-5960-4970 or oremTotal
22 or 1 ss23-29,30-3940-4950-5960-6970 or moreTotal
22 or less23-2930-3940-4R59-5960-6970 or more
6.60.0
0.00.0
0.00.0."0.0
0.00.00 0
0.00.00.0
0.056.00,0
0.00.0
__LugtOo.-16
(14)
'11:041.429.614.13.40.5
_21J2100.0(1805)
_41.1.1
25.411.95.20.20.0
0.0,0,00.0
0.00.0.
0.00.00.0
5.48.8
100.0(8)
36.435.022.24.9
0.00 0
run-(325)
38.1)35.819.75.11.30.0
100.0(15)
61.422.59.4/9
0.0:
100.0(2)
58.426.912.12.7
0.0
ITIrT(77)
23.367.39.50.00.00.00 0
100.0(3)
Technical34.3---gr'332.827.15.6
0.0
106.0. (3)
23.012.53.1
0.0
-Virg(224)
100.0(7)
99,20.70.0/0.10.00.0
100.0(1)
63.325.67.43.70.00.0
100.0(2)
(5:)91 29.4"41.6
5-,6
0.40.0
100.0(0)
36.619.827.510.85.30.0
__LIroox(67)
26.042.919.18.99.00.00,0
100.0(417)
48.126.617.66.11.40.1
99.9(1587)
62'423.510.9'2.40.40.00.0
100.0(176)
Vocational
100. 0
(365)
97`..ft
0.9-0.50.30:40.0
100.0(59)
1
66.13.4
24.06.50.00.0
0-9-,9
(292)
601333.15.30.00.80.0
iooA(3002)
41.924.18.156,86.51.60 5
T(761(975)
53.526.716.13.70.00.00.0
56.726.916.40.00.00.00 0
100 0(210)
99.9(533)
100.1(24)
100.0.(34)
IWO(32)
_g _s100:0(109)
99,9(709)
__(1,12
16676(12)
10(Y.0(46)
99.$(59)
2-.

t.4
Appendix Table 2 (continUed)
Variable Spurce of financial aide
CE TA BEOG SEOG EDLO SCHOL SSEB VAEB NCSIG WREST VOCE NONE
College-transfer.
Sex .
ftw
Male 33,0 33.4 36.8 37.1 45.7 35.7 75.8 35.9 23.8 19.3 41.4
p, Female 67,0 66 6 63 2 62 9 54 3 64 3 24.2 64 1 76 2 80 7 58 6
1---Total 100.0 100.g 100.0 100.0 100.0 100.0 100.0 100.0 100.0 100.0 100.0
(6) (235T (12) '(12) (80) (76) (197) (15) (46) (8) (894)
MkleFftaleTotal
) 0.0191.9_t0-6.6
(1)
Male 69.0Female 31.0Total 100.0
(8)
Male 15.5Female 84,5Total' 100.0
Male 41.1Female 58 9Total 100.6
(208)
General education30.7 0.0 0.0 0.0 74.6 75.4 0.0 47.3 35.2 14.5
E2-1 1.112-12 0,0 100,0 25.4 _ILI. 121S _A2-1 _§.±-ii _§.§-A
1-60TO 10 . a 0.0 100.0 100 .0 166.0 100.0 10-6-6 1-60 A 100.0
(49) (3) (0) (1) (9) (78) (1) (8) (2) (164)
Special credit32.9 0.0 0.0 25.3 3.4 46.3 0.0 79!7 0.0 31.5
67,1 lau 100,0 74,7 ss_s_ 53 7 loos - zoo_ 0,0 _ail
100.0 100. l00.0 100.0 1-6676 100.0 'two 166%6 0.0 100.0
(15) (2) (3) (3) (7) (14) (1) (2) (0) (416)
Technical19.9 30.5 37.E---/T1T- 29,0 87,0 26.2 27.1 59.7 33.2
80,1 ss_s 62,4 _2Ela 71,0 13,0 73,8 _ILI i(1.2 66.8
100.0 t66.6 100.0 160.6 100.0 100.0 100.0 166-. 6 6070 100.0
(1603) (80) (179) (225) (369) (1816) (59) (295) (67) (3019)
Vocational36.7 59.7 30.0 82.4 55.1 96.5 60.4 67.4 72.9 60.1
_ 40,3100.070.0 _11.2 _21.1 11-1 39 9
1-066 100.0 100.0 1W. 1-66J6 I6C 6 16C6 6 166-Tb 100. 6
(534) (24) (35) (32) (107) (711) (12) (48) (59) (987)
co0

Appendix Table 2 (continued)
Variablel\
Source of financial aida-ZETA BEOG S OG SB VBN VO R NO
4
Race:\ College-transfer
Black 34.1 49.6 40.6 24.0 9.8 8.8s" 12.5 53.0 29.4 0.0 8.3A. Indian 22.5 0.3 0.0 -0. 0.0 0.0 1,4 0.0 0.0 0.0 0.2White 43.4 49.0 59.4 76.0 83,1 90.4 84.4 36.4, 69.0 100.0 89.0Asian 0.0 0.8 0.0 0.0 5.7 0.0' , 0.3 10.6 1.6 0.0 1.0at her 0 0 0 4 0 0' 0 4 1 4 0 7 1 4 0 0 o o 1 5Total 100.0 100.1 100.0 100.0 l00 ,0 99.9
__222100.0 100-.0 100.0 100.0 100.0
(6) (234) (12)1 (12) (80) (76) (194) (15) (44); (6) (892)
General educ LionBlack 0.0 67.2 29.1 0.4 0.0 0.0
Illil
24.8 0.0 33.2 .106.0 8.2A. Lndian 0.0 1.6 0.0 0.0 0.0 4.3 0.6 0.0 0.0 20.0 0.9White 100.0 31.2 70.9 0.0 100.0 95.7 72:3' 100.0 66.8( ?0.0 90.2Asian 0:1I 0.0 0.0 0.6 0.0 0,0 0.0 0.0 0.0 (0.0 0.7OtherTotal
12..12 __LSI146.0
0.0 0.0 0 0 _LS1.00.0
___11,21.00,0 loom
__.12.12.
0.0 oo.o 100.0 100.1 100.0 100.0(1) (49) (32 (0) (1) 4 (9) (75) (1) (8) (2) (164)
Special creditBlackAs. Indian
0.00.0
39.90.0
0.00.0
0.0 0.0 0.00.0 0.0 0.0
15.50.0
09.0.0 0.00.0
0.0.0.0
9.90.9
White 100.0 52.0 100.0 100.0 80. 84,4 84.5 160.0 100.0 0.0 88.3Asian 0.0 0.0 0.0 0.0 ,19 o.o 0.0 0.0 . 0.0 0.0 0.4Other 122 8,1 0,0 11,Q .0 15.6 0,0 0.0 0.4Total 100.0 100.0 100.0 100.6 100.0 100.0
. _2,2100.0 Moo.° 100.0 0.0 99.9
(7) (15) (2) (3) (3) (7) (14) (1) (2) (0) (412)
(- 2I'

a
Appendix TablJ 2 (continued)
Jr."COts3
Variable Source of financial'aids,CETA BEOt SEOG EDLO aCHOL SSEB VAEB MCSIG WREST VOCE NONE
TechnicalRace (contd.)Black 31,61 54.4 .46.2 8.3 7.9 30.0 22.3 18.* 32.9 24.8. 13.9
A. Indian, 11,1 2.8 3:2 2.3 1.0 1.5 2.2 4.7 1.0 6.0 1.0
White 42.2 49.1 87.8 88.4 67.7 74.4 73.5 63.3 68.4 84.0
Milan 0.0 0.5 0.0 0.0 1.2 0.0 0.0 2.5 1.7 0.0 .0.5
Other 0.8 0_2.21001,
1,4 La 0 8
Total 100,0 99.9 100.0 roo.o -44:g 16) A 106.1_
loo.o too.° 1000(340) (1599) (80) (180) (227) (368) (1000) (60) (295) ' (68) (2996)
VocationalBlack. 56.8 60.2 58.9 35.8 15.7 41.0 29.1 84.1 40.0 31.2 16..3 .
As.,Indtan 1. 3.4 13.4 0.0 0,0 1.5 0.8 0.0 0.0 5.2 1.0 4
White 40.9 35.3 27.7 64.2 84.3 61.8 69.6 35.9 60.0 63.6 82.0
Asian 0.0 0.6 0.0 0.0 0.0 0.0 0.0 0,0 0.0 .0f0 0.3
Other 0.6 0.0 0,0 LI_21.2Total 1-61YA: 100.1 100.0
__Lc1100.0 100.0 IIMJ.6 loom
_21.2100.0
_LQ __LA100.0 1-60.0 100.1
(205) (526) (24) (32) (32) (106) (704) (10) (43) (58)._PP
(981)
College-transferMarital status:Single 100.0 73.8 81.3 65.2 83.5 Ap0.0 32.4 71.5 53.8 65.3 57.5
Married 0.0 14.8 9.3 32.1 1,4.5 0.0 59.1 5.1 38,0 17.1 35.6
Widowed 0.0 1.0 0.0 0,0 0.0 0.0 1.2 0.0 . .0.0 0.0 1.3
Separated 0.0 3.1 9.3 2.7 1.4 ,0.0 1.0 0.0 1.3 17.7 3.5Divorced 0 0 7 3 2,6 Lc! 20Tdtal 100.0
(6)
100.0(236)
_J1J299.9(12)
100.0 100.0 100.0,(12) (80) (76)
MOTO(196) (15)
__L2100.1 160.15
(46) (9) (898)
J
4

Appendix Table 2 (continued)
Variable
Vaiital status-Tattd )
,MarrleS gledi
. WidowedSeparated-DivorcedTO
Source of financial Aida
CETA -BEOG 40C EDLO S-CHOL SSEB VAEB_ NCSIG WREST 'VOCR NONE ) ,
General educationa
1000.0 64.0 14 90 20 5 0 00 1,,L 0 0
SiWeWarned'f.olowed
SeparatedDivorcedTotal
SingleMarried'WidowedSeparatedDivorced
- Tota.1,'
0,0 0.0 100.0 17 3 100.0020 Iocr.o o.o . 77.6 0.00.0 0.0 . 0.0 E) ,o 0,0
illt
O 410,1 85.1 0.0 0.0 . 0-.1) .3 0.0O _2121 _J1.1 _40.0 Cf.9 __IIA'17__LA _J1J2
oo.0 IIJUTY 5076 o.o loo.0 '1-60076 ri5v15. 1-6676(1) (49) (3) (0) (1)' (9) (T6). (1)
..11.
. Special credit12 4 71 9 43.5 1000 94.1 44.0 ' 24,5 100.0 0.0 0.0 30.2
69.00 64 80 0 35/20.0 0,0
18.8 0.0
_112loo.o 106-.0
(8) ,(2)
28.3 '
49.7'9.35.8
-_ 122/00:1(164)
' 82.2 6' 0 0 0 0 0.0 56'.0' 69 1 0.0 0.0 0,0 56.90.0 0.0 6.0 0.0 0.0 0.0 , 6.4 0.0" 0.0 0.0 2.30 0 2.3 56 5 0 0 0.0 . O. 0.0 0.0 20.3 0.0 1.6
___LA 24.0 0,0 o_12 5.9 0 12,2 _J2.12 lia , 0,0 '--i..9.tO0 Y 100.0 100.0 100.0' 100.0' 100.0 10 100.0 109.0 0.0 100.0
(8) (11) (2) (3) (3) (7) (1) (2) 4,(0) (415) .
..
Technical43,0 66.9 64 6 39 5 6I,2 -§7.8 62 .60.4, 49.7 53.829.8 16 9 19.0, 46.1 27,2' 0,9 ,2, 28.31, 31_8 38,42 1 0.9 3,6' 1.8 1.1 0 7
. 5,3 1.0 . 4.3 1147:7- . 7 3 8 0 5.7 5.4 "O. 3 5' 6.1 5..7 6.8 2.9
_ILI 8.O 4 6 __E-2 _.12 0 4 _12 6.6 __±/1 '7'5' __LI,100.1 100 0 .100.0 100 6 100.1 -gV-§ 160.0 00-.41--.4002 100.1 166.2(341) (1601), (81) (179) (226) (371) 812) (60) (297) (68) (3015)
t
.4 .
2 ,
11.

Apperft Table 1, (continued)
0-
Nariable Source of financial aide
CE TA BEOG SEDB EDLO SCHOL WEB VAEB NCSIG WREST VOCR NONE
Marital status(cpntd )
Vocatiodal
Single 53,0 67,9 42.1 42,7 49.4 98.0 1.9.3 82,5 60 8 43 1 41.3
Married 265 20.5 44,5 35.8 35 2 1.7 74,0 0.0 31,0 22.5 48.2
Widowed 2.8 2.2 .0 0.0 0.0 0 AO 0 0.0 0,0 0,4 1.2
Separkted 7.3 4.2 4 8 12.9 1 0 0.4 2.6 0.0 0.0 17 0 3.9
DivorcedTotal
3 §.1 6 4 0 1 8.206.0
0
10000 0' 100.1 100.1 100.0 lt)0.0 too.' .100.0117
o o 10 0 100
(207) (533) (24e (35) (32) (107) (710) (1 c46) (59) (987)
V College-transfer
Student'seducat ionLess than 7thgrade
0.0 0.0 0 0 0.0 0,0 0.0 0.0 0.0 0.0 0.0 0.0
7th-8th 0 0 0.8 0.0 0 0 0.0 0.0 0.0 0.0 0.0 0.9 0.2
9th-llth 0 0 1.5 0.0 0.0 0 0 0.0 0.0 9,1 0 0 10.1 2.1
High sch of .78 3 31.5 58 9 82.9 27.8 26.0 29,2 16.6 41.6 6.2 34.5
GEL 0 0 4.3 10.0 0.0 1.3 2 4 11.6 0.0 4.6 17.7 2.7
'HS 1 0.0 28 6 16.1 14.4 33.4 28.9 22.2 11,0 18,5 53,0' 23.2
HS 2-3 yr 21.7 32.4 15,0 2,7 27,1 40.7 33.9 63.5 1 32.8 13 0 27,1
College 0 0 0,9 0.0 0.0 4,7 2.1 2.7 0.0 2.5 0.0 6,7
Graduate work 0,0 8 0 0 (LI 0,._4 12,L 0,11 6
Total 100.0 100 0 100,0_LI
100,0 IT)00 10M 1(TO-(71- 100 2 10.0 100.0 100:1
(6) (230) (11) (12) (80) (75) (191) (°14) (44) (9) (887)
General education
Less Ulan 7thgrade
0 0. 0,0 0.0 0.0 0.0 0 0 0,0 0.0 0.0 0.0 0.0
7th-8th 0.0 0,0 0,0 0.0 0 0 0.0 0.0 0 0 0.0 0,0 1.4
9th-l1th 0.0 0 0 0 0 0.0 0 0 2.4 0,0 0 0,0 0.0
I

or'
Appendix Table 2 (continued)
VariableCE TA BECC atm
Student's edu-cation (contd.)High school 0 0 56.8 29 1GED , 0.0 5.9 0,0HS - 1 yr 100.0 9.0 0.0HS - 2-3 yr 0.0 26.3 70 9College 0.0 2.0 0.0Gralduate work .O
Total_jm100.0
_J121100.0' 1 0.0
(1) (46) (3)
Less than 7thgrade
0.0 0 0 0.9
7tb -8th 0.0 0 0.0'9th-llth 4.8 0 0 0.0
High school 69.0 14.9 0.0,GED 20.9 0,0 0.0HS 1 yr 0 0 64.7 0.0HS - 2-3 yr 5.4 20.4 100,0College 0.0 D.0 0.0.Graduate work 0.0Total
__Lo100.1
_jm.100.0 100.0
8) (14) (1)
Less than 70grade
1.6 0,3 5.0
7th-8th 0,9 1.1 0.09th -11th 2.0 1,2 0.0
Source of financial aidaEDLO SCHOL SSEJ
0.0 0 0 21 00 0 0.0 0.00.0 100.0 0.0'0.0 0,0 79.00.0 0,0 0.00.0 __21,2 __m0.0 100.0 100-.0
(0) (1) (9)
Special credito:6---' o.o d.o
0.00.0
59.40.0
38.3,2.30.0
2_2 ALI __2,2100.1 100.0 100.0
( (3) (3) (7)
Technical
0.0 0 00.0 0.00.0 G.00.0.- 0.0
81.1 19.43.4 0.015.6. 0.0
1,0 1.4
0.0 0.01 0 0.2
211,
VAEB NCSIC WRKST VOCR NONf
30 4 0 0 20 1 100.0 -48 013 8 0.0 29.6 Q.0 5.821.7 0.0 27.4 0\0 22.728.6 100.0 10.1 0.0 21.33.0 0.0 12,8 0.0 0.6m _m LI 0.0 __Id99.9 100,0 L00.0 100.0 -99.9 -
(100) (1) (7) (1) (462)
0.0 0.0 o.c1 o.o o.o
0.0 .0.0 0,0 0.0 0.214.,,A 0.0 0.0 0 0 4.527.1 0.0 0.0 0.0 28.08.9 0.0 0.0 0.0 2.9
24.8 0.0 0.0 0.0 12.624.6 100.0 100.0 0.0 23.9,0.0 0.0 '0.0 0.0 18.9
__2,2 0.0 __(1.2 0.0 _2111:100.0 100 0 100.0 0.0 100.1(14) (1) (1) (0) (408)
0.4 5.6 0.8 4.4 0.1
n0.4 0.0 0.0 0,0 0.11.7 0 0 1.7 0.0 0,3.
,-.
on_(A

Appendii Table 2 (continued)
Variable
Student's edu-cation (contd.)High schoolGEDHS. 1 yrHS 2-3 yrCollegeGraduate workTotal
Less thanhan 7thgrade7th-8th9th -11th
High school'`ozpHS 1.yrHS 2-3 yr
41011egeGraduate workTotal
Source of financial aid&
(ETA BEOG SEOG EDLO SCHOL SSEB VAEB Halt WRIST -VOCR
)NONE
36 712 5'22.021.12.5
42.09 2
18 626.60.8
'31.344.2
if 21.2428.3
03.0
20.4 24 19 0 2 3
21.3 19,244.2 46.82.6 5.1
.51.1
2 419.3'23 32,5
39.114.314.625.13./
25 50 6
, 25 742.60,0
34 06.420 334 41,8
42 422 017 2'13 20,9
39.14.5
20.218,55.9
0-Tr5 1-(51715
(:2E 0.0 Id _2.2100.6
0 7 _1.2.roo,1
100.0 Y607ro.-1 6 00.1 100..0 100.1
(334) (1541) (77) (176) (222) (360) (1768) (54)_ (290) (65) (2967)
4 Vocational0.0 0,4 .0.0 0,0 0.0 0,0 0,0 0.0 0,0 7.9 0.8
1.9 0.8 r 4.41.0 0.0 0.0 '2,5 1.5 0.0 0,0 3.2 1.6
12.4 5.2 0.0 0.0 0.0 1.8 7.9 0.0 0,9 34.8 8.4
43.2 ,63,8 66.3 37.7 77.9 53.0 48.2 53.6 60,0 ,30,4 52.6
15 7 10.5 13 6 12 7 9 5 10 1 22 3 26 4 15 4 10 3 /9 8
17.0 9.6 17.8 15,6 4.2 18.6 6.0 .20.0 17 6 7,2 9.4
6 7 8,2 2.4 28 7 8,4 16 1 12.4 0.0 6.2 5.8 10.3
2.5 0.7 0.0 3,1 0 0 0.0 1.5 0.0 0.0 0.4 '5.3
6 o 2.2 22 122 0 ° 1 7-§r5loo,o
__(2,2110.00 . 100.0 100.1
_2.1100.1 100.-0
_9.2100,1 00
(19,A) *(312) j323) (33) (28) (106) (890) (9) <45) (5 (954)

4
Appendix Table 2 (continued)
Variable Source of financial aidsCE TA BE06 SEOG SCHOL "SSEB VAEB NCSIC WRKST VOCR NONE
College-transferPrimary incomeUndies' $2,000 24 4 22..6 24 0 28 6 10 4 19 7 4.0. 8 5 14 2 0.0 4.0$ 2,000-2,999 0.0 13 7 19 9 26 6 15.7 13 5 2 0' 23.3 15 3 0.0' 5.6
S 3,000'-3,999 0.0 6 9. 0 0 0.0 8 5 16.9 8.6 , 8 9/ 5,8 0 0' 3 7S 4,000-4,9,99$ 5,000-5,999
0 049.8
10,17,5
8,60.0
0 00.0
5.62.3
14,3 7.4'9.40,, 7,6
18.50.
8,30 0
8 4 2 00.0 3 3 a.
$ 6,000-6,999 0.0 8.3 27 0 0 0 3 0 1.7 4.3 2.4 4 5 18.3 3 2
$ 7,008-7,999 0 0 3.9 0.0 9 1 4.4 3.5 7.8 ' '.4 1.8 0.0 4.3$ 8,000-9,999 0 0 8.2 0 o .0 0 7,1 0 0 1,6 5 3 2.,0 7,7 .5.8
$10,000.-11,999 13 0 7 5 5.2 2 9 2.6 8.6 8 7 30.7 11 8 57.0 5.4.
512,000-14,999 12 7 5,2 14.9 0.0 11 1 3.8' 10.8 0.0 7 5 0 0 9,4
515,000-19,999 0,0 2 2 0 0 0 0 8.6 2 4 13 9 0 0 3 9 0.0 15.8$20,000A-24,999 0.0 2 0 0 0 0.0 9.7 0.0 4.3 0.10 8.1 8.6 16.0525,000 or * 0.0 2 0 0.0 33 8 14.0 6.3 11.0 0.0 16.8 0.0 21.4over
4arents not 0 0 0.0 a.ao 0,0 0,0 0,0 0.0 0,0 0.0 0.0 0.1"1 iv1nRTotal rcaTT TUT799 9 100,1 100.0 100.0 100.0 1-657 100.0 100.0 100.1
(5) (217) (11) (11) (75) (71) (188). (12) (41) (7) (82'8)
General educationUnder $2,000- 0,0 34 4 100.0 0.0 0.0 27.3 4 0 100.0 31 7 0 0 3'3S 7,000-2,999 0,0 19 9 0.0 0.0 0.0 42 9 3 2 0 0 21 '8 0 0 3.7$ 3,000-3,999 0.0 2 1 0'0 0,0 0.0 4.7 0 9 0.0 0 0. -
0 0 2.2
-$ 4,000-4,999 100 0 4.3 0 0 .,0.0 0 0 0 0 3 9 0 0 0.0 "0 0 0 9$ 5,000-5,999 0 0 6,9 0 0 0 0- 0.0 9 6 2 7\ 0 0 4 9 b I) 2.3
2'
e
co

F.Api...endix Table 2 (continued)
yiriable
Primary income(contd.)$ 6,000-6,999S 7.0X -7,999$ 8,000-9,999$10,000-11,999$12,000-14,999 -$15,000-19,999$20,000-24,999525,000 oroverParents not. livingTotal
Under $2,000$ 2,000-2,999$ 3,000-3,999.$ , 000-4 999$ 5,000-5,999$ 6,000-6,999
.$ 7,000-7,999$ 8,090-9,999SI0,000-11,994112,000-14,999
Source of financial aids'CE TA BEOG SEOC EDLO SCHOL SSEB VAEB Ncrsic WREST VOCII NONE
0 0 0 80,0 9 60.0 600,0 7.80 0 6.50.0 0.00.0 1 6
O 0 40.0
0.0 0 0
100,0 99.9(1) (45)
5.4-2.722.2O 70,00 00.00.0O 00.0
0,0 0 0 0 0 0 00 0 0.0 0,0 15 5oó oo oo 0.00.0 0,0 0 0 0.00.0 0.0 0.0 0.00 0 0 0 0. '0.00 0 0 0.0 0.00.0 0 100 0 0.0
0.0. 0.0 0.0 0.0
100.0(3)
0.0(0)
100.0tl
10 .0
(9)
Special credit65.2 43.5 0.0 5.9 8.15.8 56t.5 3 4 0.0 20,30.0 0.0 0.0 0.0 0.01.8 0.0 0 0. 0.0 0 07.0 0.0 0.0 0 0 0.08 1 0.0 0 0 0.0 3-.9
0.0 0.0 0 0 0 0 0.04 6 0.0 0.0 0,0 0 01.8 0 0 0 0 0.0 0.05 8 0 0 0 0 19 4 0 0
2
14.2 0,0 0 0 0,0 4 0
4.3 0 0 0 0 35 2 2.82,8 0.0 18 0 5 6'
.14,7 0,0 0 0 0.0 6.721,5 0,0 7,3 64.8 1.5.5
8.310.59.0
0.00.00,0
0.0.0 0
0.00.00 0
21.712.418.8
0.0 0.0 0.0 0.0 0.0
100.0 100.0 100.1 100.0 99,E(77) (1) (8) (2) (157)
5.3 100.0 79.v 0 0 1.4
3.4 0.0 20.3 0.0 0,4
13.0 0.0 0.0 0 0 1.414 6 0 0 0.0 0.0 0 8
0 0 0.0 0.0 1,9
0.0 0.0 0 0 0,0 2.77,8 0.0 0.0 0 0"8.8 0 0 0 0 0,0 8.324.6 0.0 0 0 0.0 7 213.6 0.0 0 0 0.0 15.2

Appendix Table 2 (continued)
Variable 'Source financial aide
CETA BE(X SEOG
rimary income(contd,)$151,00-19,999$20,000-24,999$25,000 orover
Parents notlivingTotal
69.00 00 0
0.0
0 00 00 0
0.0
0 90.00 0
0 0
100 0 115-0-7 100 0(8) (1s) (2)
'Under $2,OD0 _12 2 29 67' 47 1
$ 2,000-2,999 1378 11 9 7.7
$ 3,000-3,999 7 8 '7 7 5.8
$ 4,000-4,999° 1 8 6 7.9 11.4 8
$, 5,000-5;999 9 3 7 6 9 5
o$ 6,000-6,999 .3 5 6 6 64$ 7,000-7,999 13.9 6 0 2.4
$ 8.,000-9,999 6 9 6 8 - 3,3
$10,000-11,999 6 7 4 7 =''1.5
¶12,000-14,999 3-0 6 7 3 6
515,000-19,99'9 2 4 '2 5 1 3
$20,000-24,999 0 3 0 8 3.6
4
of
EDLG SCHOL SSEB VAEB NCSIC WREST VOCR NONE
4
0 0 0.0 0.0 0.0 0.0 0 0 0,0 15 4
0 Cr 0,0 0.0 0.0 0 0 0 0 0 0 15.9
96.6 74.7 67.8 7,8 0.0' 0.0 0 0 26 0
`N0.0 0 0 0.0 0,0 9.0 10 0 0 0- 0.0
100.0 100.0 100.1 100 2 100.0 100.0 0 0 175-f(3) (3) (7) (14) (1) (2) (0) (399)
Technical15.6 22.0 24 7 3 6 26'.3 28,9 20.2 4.9
4 8 6 9 16,5 1.8 16 7 8 0 6.3 2.8
4 1, 6.1 10 7 2.9 8 8 6.1 4.9 3.7
7.0 9,9 8.5 2.7 2 $ 3,5 3.4 2 6
2 5 2 8 5.0 5 2 10.6 4.1 6 6 3,6
3 2 6 44.2 4,8 g2 6 7 2 0 4.4
2.3 0 3 2.6 5 5 0.0 4 7 6.4 3.8
8.2 ,5 1 3 4 8,1 ,0 8 10 5 18 7 9 0
9 6 76 5 2 12,5 6,6 9 2 ,8 7 Et. 9
.21 1 15'2 8 0 15 2 3 5 4 3 12 7 13.1
10 4 11 p 4,8 18,4 0.0 6 4 2.9 14.7
6.3 6,6 2.7 12,5 5.6 3.8 3.7 12.2
21_41"

t
Appendix Table 2 (continue)
Variable .
9
,,, , ASource f financial aides .."......-_
CE TA BEOG SEOG ED S OL SSEB VAEB WRKST VOCR NONEt ,
wpcsIc
Primary indlsMe 1, ,,,
Kcontd.) 10
$25,000 or.over
41 7 1.2 3 0 5 0 4.9 3,2 6 7 9.2 3,7 3.7 16.1
Parents not d.o' 0.1 0.0 0.0 ¶0 0.5 0.0 1.3 0.0 0.0 0.35living
.
Total 100.1 TUTY 100,0 100.1 loq.o 100 .0 99.9 ruTT 99.9 TUTY PITT(311) 41443) (77) (167) (212) (336) (1747) (53) (265) (62) (2815)
VocationalUnder $2,000 41.3 37.5 20.0 26 0 4.8 31.5 5.5 15.4 24.8 33.2 9.2$ 2,000-2,999 12.2 9'.1 9.7 3.3 16.4 12.2 4.0 0.0 3.3 6.8 3.2$ 3,000-;999 7 2 9,6 5,7 1.9.6 3.5 11.9 2.9 20.6 11.6 3.6 3.3$ 4,000-4,999 5.8 7.8 10.6 e.2 0.0 3.3 4.6 19.1 3.6 0.0 3.8$ 5,0d0-5,999 5.4 7.1 0.0 14.9 15.4 10.1 7.4 11.0 3.1 22.6 .3.5$ 6,000-6,999 10.2 5 4 6.7 0.0 1. 1,2 5.6 0.0 2.0 2.7 2.8$ 7,000-7,999 2,6 6.8 14.6 0.0 0'.0 0.9 4.6 0.0 15.6 0.0 5.0$ 8,1500-r9,999 6 6 8.0 31.1 6.7 6.6 6.2 11.0 9.2 2.4 0.7 9.6310,000-11,999 1.6 3.8 1.7 1.6 4.5 5.9 14.6 6.3 1.9 8.0 9.5$12,000-14,999 3.8 1.4 0.0 5.4 .41.1 6.7 13.5 18.4 24.4 8.6 14.8$15,000-19,999 0.7 1.6 0.0 10.3 4.4 6.7 17.3 0.0 .3 14.8 15.8$20,000-24,999 0.0 0.0 0.0 8,0 0!0 0.0 4 8 0.0 .9 5.4 8.1$25,000 or 2.5 1.5 "( 0.0 4.2 2.4 0.0 4.1 0.0 .0 3.8 11.2over .Parents notliving
0.0 0 3 0.Q 0.0 0.0 3,5 0.2 0,0 0,0
---9.99
0.0 0.3
Total .--Iri 99.9 100.1 100.2 100.2 100.1 u557 ro7u ITITY ructrt179) (481) (21) (31) ^(30) (91) (674) (10) -(41) (49) (882)

Appendix Table 2 (continued)
1,1
VariableCETA
Occupation bead-of-household:
or
White collar 25.3Blue collar 74.4Unskilled 0.0Farm (222Total -1130.0
(3),
White collar 100.0Blue collar °0.0Uiskilled 0.0FarmTotal
__12,2.
100.0( 1 )
Whit collar 92.381 collar 5.3Un killed 2 4Farm
100 0(5)
B!oc -SE-00
Source of financial aid+EDLO SCHOL SSEB
College - transfer
55.1/ 70.5 73.133.3 24.0 15.911.7 5.5 3.6
_2-2 !LI100.1 too.o
LS
(9) (64) (46)
34.223.634.67 5
71-4-'3
56.029.10.014'9
General education0.0
° 0.00.00.0
100.0%0.00.00.0
26.9'73.10.00,0
100.0 0.0 100.0 100.000.0( 3 3 ) ( 3 ) ( 0 ) (1) (5)
Special credit20.1 56.5 96. too.o 90.938 7 0.0 0.0 9.1
37.6 0.0 0. 0.0 0.043.5 0. _OS 0.0__1.t
1.004 100.0 100.0 14676 100.13
(8) (2) (3) (2) . (4)
1.
VAEB liesre MEAT VOGT NON!
52.225.920.61 4.
49.2)16.930.2
55.028.910.16 0
0.0100.00.0
61.024.810.23 9
1-15r Es -01-74" [00.0 100.0(114) (12) (33) (3) 1694)
56.5 0%0 73.9 0.0 57.123.0 '0.0 26.1 100.0 28.315.2 0.0 0.0 0.0 9.8
100.0 __(1,(2, __L.8__2,2100.0 100.0
__0,2.10.0 1-(NY:6 1-6676.
(54) (1) (5) (1) (132)
,50.5 0.0 100.0 0.0 76.436.6 0.0 0.0 0.0 16.812.9 0.0 0.0 0.0
0040
1(22.J2t00.0
_12.2O1
0,0.5.6
0 0 100.0
(11) (1) (1) (0) (337)

Appendix Tablg 2 (continued)
Variable Source of financial Rice!CETA BEOG SEOG EDLo SCHOL SSEB vas NCSIC WRKST WCA WON!
OccupationH -o -H (contdWhite collarBlue collar
)
27 945 2
32.037.3
38 79.9
Unskilled 20.1 23.1 38.0Farm 1-Total 100.0 9V-9
_12.±100 0
(172) (1004) '(53)
White collar 17.2 18.2 27.4Blue collar 40.3 33.9 53.5Unskilled 34 9 39,2 .6 7Farm IA LI L1.1Total 100.0 100.0 99:4
(104) (311) (9)
Technical
37.1 4872 51.3 34.22.2.0 27.9 26.7 39.739.4 20.1 18.1 .22,2
1.2 a21.2r00.6 100.0 ,100.-0(128) (166) (225) (1281)
45.721.827,8
_21.2 __Id _lid16676 140,6' 16C6 1071(37) (192) (42) (2298)
40 1 37 4 49.634.6 30.2 32,218 2 11.3 15.0
Vocational39,9 37.2 47.1 10.4 7.1 55.6 28.8 36.930.8 52.9 20.9 69.7 51.1 25 1 43.1 45,021.3 4.3 15.9 15.9 41.8 12.7 26.2 13.1E.2 5.5 _ILI '__02.02. 6.6 LI 5.9
100 0 99.9 1-66:6 116576 I-070 100.0 99 9 100.0(22) (24) (58) (449) (7) (100) (38) (720)
aCETA = Comprehensive Employment and Training Act; BEOC = Babic Educational OpportunityGrant, SEOG = Supplemental Educktional Opportunity Grant; DLO - educational loan; SCHOLscholarship, SSEB - social security educational benefits; VilEB - Veterans Administrationeducational benefits; NCSIC - North Carolina Student Incentive Grant; WREST = work-study;VOCE - Vocational Rehabilitation; NONE - not receiving aid,

Appendix Table 3. Weighted percentage distribution of curriculum students enrolledin the North Carolina Community College System, 1979, by amountof financial aid receivedas related to program, ape, sex, race,maFltal status, student's education, prioaryt n head-of-household
income, and occupa-
Variable
Amount of financial aid. 1978-79 school year, $
None
Lessthan 200- 400- 700-/200 399 699 999
1000-1499
2500-1999
2000-2999
3000or
more
College-transferAge, yr: )
22 or less 56.4 64.8 69.6 48.5 59,4 62,3 34.7 45.5 29.123-29 --ro.3 27.4 17.9 27.0 18.4 19,3 51.6 21.6 45.836-39 15.3 2.0 3,5 18.7 18.9 18,4 7,5 20.1 10.240-49 7,4 0.0 .8.9 5.8 0.7 0.0 4.9 9.8 14,950-59 2.1 5.8 '0.0 . 0,0 2.5 0.0 1,3 , 3.1 0.060-69' -"- 1,4 0.0 0.0 0,0 0,0 0,0 0.0 0.0 0,070 or more 0.0 0 0 0,0 0,0 0.0 0,0 0.0 0.0Total 99.9 100 0 99.9 100.0 99,9 100,0
__2.,1100.0 100.1 100.0
(905) (41) (85) (67) 1105) (60) (40) (51) (77)
General education
22 o' less 25,0 24.4 26.8 21.9 64.5 21,3 12.0 5.4 20,523-29 22.8 19,2 60.7 58.8 31.2-- 14.1 23.1 33.6 32.230-39 , 29,0 56.4 4.9 19,4 4.4 62,6 32.9 15'.7 30.940-49 16.0 0.0 7.6 0.0 9,..0 0.4 12.1 17.9 8.4
50-59 0,4 0,Q 0.0 0.0 0.0 0.0 0.0 4.5 7.960-69 6.8 0.0 0.0 0.0 0.0 0.0 0.0 22.9 0.070 or more...,Total
0.0DRTT)
0 0 0 0 __Q-0 0.0 -0.0TUTT
(10URTT
_0_-(1U5i:W
0.0TIRTT) MFT UTFT 99.9,
(164) (6) (15) (13) (17) (13) (13) (11) (37)

Appendix Table 3 (continued)
Amount, of financial aid, 1978-79 school year. $
WariableNone
Lessthan200'
200-.399
S,eecialAge, yr (conts1).22 or less 21.0 0.0 100.023-29 .23.3 2.9 0.030-39 .-'28.4 0,0 0.040-49 11.7 97,1 0.050-59 '5.4 0.0 0,060-69 t 8.7 0 0 0.070 or more 1 5 0 0 0 0total 100,0 100.0 100.0
(421) (2) (1)
t 3000400- 700- 1000- 1500- 2000- or699 999 1499 1999 2999 more
\....
Nscredi
33.8 31.53,3 45 28.1- 23.30.0 0.04.8 0.00 0 \ 0.00 0 \00
100.0 10 K0(12) (7),
22 or NOWs23-2930-39.40-4950 -59
60-6970 or more
1
47.42-7.3
17.36,4.
1.50.1_0 0
53.220.8
, 18.77.30,00.00 0
Technical53 22.6 3
13 5
6,20,8
' 0.00 0
52.225.815 54.81.7o.00 0
47032.212 77 50.60 o'0 0
Total 100.0 100 0 100.0 100 0 100,0(3125) (2%7) (399) (417) (713)
vocational22 or Ness (0.5 52.7 49 9 49.8 50:123-29 26,7 34.1 32 0 31 7 32.830-39 17 9 10.3 16 1 12.1 12:4140-49 6.9 2.8 2,1 2 1 4,350-59 6.1 0.2 0.0 4.3 0.4
,
50..5 67.8 95.9 48.40.0 32 2 4.1 43.02.1 0.0 '0.0 8:64.5. 0 .0 0,0 0.00,0 0.0 0.0 0.0
42 8 ,00
0.000
0.000
0.00 0
99.9 100.0 100.0 100.0(7) (4)
.(41(5)
X 4 33 0 27.5 11.037\.s5 31.9 35.0 40.318.9 27.% 24.4 29.86.3 .N4.6' 9.4 16 00.8 2\6 ,2.7 2.60.1 o.b 1.1 0.40 0 0 1 0 0 0 0
100.0 100 0 100.1 100.1(438) (313) (448) (882)
28 2 32 6 19.1 10.343.9 35.7 37.9 42.819 6 24.1 25.8 24,4.7.2 4.8 12.1 16.11.1 2.9 5.1 6.0
211
2

Appendix Table 3 (continued)
Variable
Amount of financial aid, 1978-79 school year $
None
Lessthan200
200-399
400-699
700-999
1000-1499
1500-1999
2000-2999
3000or
more
Age, yr (contd.)60-69 1.5 0.0 0.0 0.0 0.3 0,0 .0,0 0.0 0,470 or more 0,5 0.0 0,0 0,0 0.0 0,0 o.6 0,0 0.0Total 100.1, 100.1 1..11371 100.0 99,9 %OD.° 100.1 100.0 100.0
(1093) (82) (141) (157) (215) (139) (102) (171) (3.45)
College-transferSexMale 42.8 38.2 38.0 45,8 /2,1 34,8 58.0 74,4 72.8Female 57 2 61 8 62 0 54 2 57 9 45 2 42 0 25 6 27 2Total 100,0 100.0 100.0 100.0 100.0 100.0 100.0 100,0 100,0
(901) (41) 85) (67) (104) (60) (40) 4,51) (78)
General educationMale 14.4 21.8 62,2 , 35,2- 24.4 69,3 63,0 71.7 76.3Female 85,6 78 2 37 4 64 8 75* .6 30 7 37 0 28 3 23 7Total 100,0 100.0 100,0 100.0 100.0 100.0 100.0 100.0 100,0
(167) (6) (15) (13) (17) (13) (14) (11) (37)
Special creditMale 31.8 2,9 100 0 13.6 58,1 0.0 29.0 20.0 35.5Female 68,2 97,1 0.0 86,4 1122 100 ,0 71,0 80,0 64,5Total 100:0 100,0 100,0 100.0 100 0 100.0 100.0 100.0 100:0
(420) 1(2) (1) - (12) (7) (7) (4) (4) (5)
TechnicalMale 34.4 49.5 35.1 33.5 33,1 52.8 61.8 68,1 81,5Remale 65 6 50 5 64 9 66 5 66 9 47 2 38 2 31 9 18 5Total 100.0 100,0 100.0 100.0 100.0 100,0 100.0 100.0 100.0
(3143) (208) *(396) (420) (721) (441) (314) (493) (831)
2 1_1_ 1

1.,,r
Appendix Table 3 (continued)
Variable
Amount of financial aid, 1978-79 school year, $
None
,Lessthan 200- 406- 700-200 399 699 999
1000-1499
1500- 2000-1999 2999
3000or
more
Sex (contd.):MaleFemaleTotal
63.2_16,8_t00.0-(1107)
Voc:yhal
70.529.5
72.1 82.927,9 17,1
91.98,1
.
68.1 55.9 57.2 .37.1
31,9 44,1 42,8 62,9,100.0 100.0 100;0 100.0 100.0(82) (141) (159) (214) (138)
100.0 100.0(103) (172)
100.0(343)
College-transferRace- ,...!
Black 8.3' 25.2 25.1 38.3 25.4 38.3 24.2:: 9.7 7.9
American Indian 0.3 0.0 3.4 0.0 0.0 1.1 0.0* 0.0, 0.6
White 90.0 72.9 70.1 59.5 64.6 60.6 70.3 86:1 84.0.
Asian 0.5 0.0 1.3 2.2 2.0 0.0 0.0 1.7 7.5
Other 144t,0 8 1,9: 0.0 _g_ 8.0 '0.0 2 5 4.099.9
__o100.0 99.9 lo6.6 100.0 100.0
_5,5160.0 100.0 100.0
,(899) (40) (85) (67) (104) (60) (40) (50) (77)
General education
Black 8.4 34.3 67.8 70.3 73.9 34.1 24.0 14.6 8.1
American Indian 0.9 0.0 0.0 0.0 4.6 0.0 4.4 0.0 0.0
White 90.0 65.7 32.2 29.7 21. 66.9 71:6 85.5 87.3
Asian 0.7, 0.0 0.0 b.() o. 0.0 0.0 0.0 0.0
Other IS 0,0 0,0 0.0 0,0 0,0 0,0 4,6
Total 106.0__(1,9_
100.0 100.0 1p 0.0 100.0 100.0 100.0 100.1 100.1
(167) (5) (14) (13) (17) -(13) (13) (10) (37)
21 '..)

a
\
f
,
*
,F
ifppeedix Table 3' (continued)
1.....ri'
s
cc--s
Variablea*
Amount of 'financial. aid.3
1978-9. school year. $Less*that% 200i 400- 700- 1000- 1500-
None ZOO 399 699 999 1499 19992000-2999^
30#0or
more
Race (contd.):BlackAmerican IndictWhiteAsianOtherTotal
.
4BlackAmerican IndianWhiteAsianOther'total
r".,....Black ..
American IndianWhiteAsianOtherTotal
.,
..
)? Spec!aI credit
.
0.00.0
100.00.00 0
-
0,00.0
100.00.0
00.0(5)
15.71.9
80.00.41,2
00.
9.9 ' 2.9 0.0 16.7 12.9 1.3 0.00.9 0.0 0.0 0.0 0.0 0.0 0.0
88,4 97.1 100,0 80.3 52.4 98.'7 36.90.4 o 0.0 0,0 34,7 0.0 0,0
63 1_21.1 _2122 _LI _s _222laX)0.0100.0100.1.100.0100:000.0(416) (1) (11) (7) (7) (4)
- Technical
00.0(4)
22.83.573.50.00 2
15.4 36.0 47.3 41.5 45.1 30.0 26.31.1 0.7 .3.5 3.7 1,8 2.0 0.9
82.6 63.2 48.7 53.7 52,1 66.5 72.60.4 0.0 0.2 0,9 0.4 0.0 0,2
9,A Ad 0, 0 6 1 5 0 0__12_1166705 16676 1-66705 100,4 w . oo.o oo.o(31;1) (208) (396) (414) (718) (441) (313)
Vocational
oo.o(488)
6.21.3
72.30-.0
_01.1ITRIA(165)
166T6(825)
17.813.9.
80.80,0
_LI1-605-.4
(344)
19.5 55,6 45.5 4.6 49,1 38.8 44.11.1 0.7 2.9 2.0 4,1 ' 0.8 3,8
78.7 4 .7 50.7 37,4 44.6 60.3 46.3N 0.3 Q \0 0.0 0,0 1,4 0.0 0,8
L1.1 0.9 J1.21 0.Q ib0_JI.._. __.0:1g _
100.1 100.0 100.0 FR IA 1-60571 99.0 to .0
(1097) (81) (137) (155) (212) (138) (101)liv
9 ,
to

4
Appendix Tabl, 3 (continued)
i'A
VariableNone
Marital status:.Single 58,7Married 34.3Widowed 1.5Separated 3.5'Divorced 2.0Total 100.0
(903)
SingleMarrie'dWidowedSeparatedDivorcedTotal
6
9,39.35.9
100.1'fte (167)
Mmount of,d5fin ancial aid, 1978-79 school year, $
Lest%
than 200- 400-- 700-200 399 . 6S9 999
10411149
1500-1999
2011,-2999
College-transfer
67.9 76,4 62.2 61.4 69.0 63,3 49.530,5 15.3 26.5 27.9 28.1 25.2 45.50.0 0 0.0 0.0 1.1 1.3 3,60,8 0.g 6,0 1.3 1.8 0.0 1,4
7 5 1.2 9.4 0 0 _11.11-6071
0.01mA oo.o 100.0 100.0 00.0 1-6CO(41) (85) (67) (105) (60) (40) (51)
General education24.4 26,8 44,7 -77.3 32.1 22.9 10.066.8 162.3 32,1 11.6 59.1 77.1 85.60,0 0.0 t 0,0 7,7 0.0 0.0 0.018.8 4.9 23.2 3.3 0.0 0.0 0.0
s.1 0.0 0.0_22,2100,0 100.1 100,0 99.9
__LI100.0
_21.2I00-.0 000
(6) (15) (13), (17) (13) , (14) (11)
SingleMarriedWidowedSeparated.DivorcedTbtal'
29.857.42.21.68 9
2,997.10.00.00 0
rory(2)
Special credit50.545.23,40.9
TUF)5(7)
67.8 95.932,3 4.10.1r 0.00.0 0.0
0rurr r613-.15
(4)\ 1(4)
100,00.0,0.0
0.00
85.212.30.00.02 5
115TiS(12)
42.846.70.00.010 5
(419)
oo.o(1)
100.0(7)
3000or
more
32;064,70.00.9
10676(78)
24.368.95.00.0
100:0(37)
48.439,90.00.011 7
150.6(5)
fir

Appendix Table 3 (continued)
Variable
Amount of financial aid. 1978-79 school year. $
None
Lessthan 200- 400- 700-200 399 699 999
1000-1499
1500-1999
2000-2999
3000or
more
Technical 0Marital status (contd.):Single 53.3 52.4 61.8 56.5 63.1 42.9 40.2 34.6 15.3Married 38.8 36.9 24.7 31.2 23.3 48.3 50.2 75.2Widowed 1.4 0.7 6.5 0.5 1.6 0.7, 0.1
.56.81,6 1.7
Separated 2.8 -4.8 7.0 6.7 4.6, 2.7 5.1 3,1 4.7Divorced. 3 7 5.2 5 9 Ed 7 5 5 5 4 4 3 9 3 2Total ' 00.0 100.0 99.9 100.0 100.1 100.1 100.0 100.0- 100.1
( 137) (208) (399) (418) (718) (441) (314) (494) (828)
VocationalSingle 42.1 64.4 53.8 62.3 56.9 27.6 41.3 21.6 16.2Married 47.6 24.5 38.9 33,1 27.5 49.1 42.2 70.5 77.1Widowed 0,9 0.0 1.1 0.5 2.7 0.0 '4.3 0.5 0.7Separated 4.1 3.7 2.3 1.4 6.6 2.2 6.8 5.2- 2.1Divorced 5 3 1 4 3 9 2 7 6 3 11 2 5 5 2 2 3 9Total 100.0 100,0. 100.0 100.0 100.0 100.1 100.1 100,0 100.0
(1106) (82) (140) (159) (213) (139) (103) (171) (3411
2:
.

Appendix Table 3 (contimusA,
Variable
Amount of financial aid. 1978-79 school year. $Less 3000than 200- 400- 700- 1000- 1500- 2000- or
None 200 399 699 '999 1499 1999 2999 more
Colleje- transferStudent 's education:
OO
Less than 7th 0.0 0.0 0.0 0.0 0.0 0.0 0.0 0.0 0.0
7th-8th 0.2 0.111k, 0.0 0.0 0.0 0.0 0.0 0.0 0.0
9th-lirth '1.8 0.0 4.9 0.0 0.0 0.0 2.9 0.0 1.3
High school 34.9 44.6 29.9 35.8 22.3 51.1 23.9 36.7 32.3 /
GED 2.6 0.9 6.3 3.5 9.6 2.5 7.9 12.9 8.5
HS + 1 yr 0.22.9 33.0 32.7 20.0 27.9 11.1 27.5 31.9 18.9
HS + 2-3 yr 27.4 21.5 25.8 38.0, 40.2 29.4 37.9 16.3 ,26,0
College degree 6.4 0.0 0.3 2.7 0.0 6.0 0.0 0.0 8.2
Graduate work 3.a 0.0 0.0 00 00 00 00 0,_1,Tot1 100.0 100.0 100,1 1C0). 100.1 100.0 -9179 100.1
(896) (39) (85) (64) (103) (56) (39) (51) (78)
General education .Less than 7th 0.0 0.0 0.0 0.0 0.0 0.0 0.0 0.0 0.0
7th-8th 1.4. 0.0 0.0 0.0 0.0 0.0 0.0 0.0 0.0
9th -11th 0.0 0.0 0.0 0.0 0.0 0.0 , 0.0 0.0 4.9 s
High schoo1. 47.0 21.8 26.3 80.5 40.5 66,8. 29.3 17.3 28.0
GED 5.8 0.0 0.0, 0.0 20.3 7.8 36.6 11.2 13.1
HS + 1 yr 22.8 66.0 13.7 20.2 2.8 2.3 19.4
HS, + 2-3 yr 22.2 12,2 8.3 16.6 25.5 5.3 24.0 69.1 30.5College degree 0.6 0.0 4,3 0.0 0.0 .0.0 7.1 0.0 4,2
Graduate work , 2 ,0 2 0,9 0 0.0 OSTotal r 9g.9 100.0 100.0 100.1 100,0 100.1 100.0 99.9 100.1
(165) (6) (15) (13) (14) (13) (14) (11) (37)
2 :. '

Appendix Table 3 (continued)
Variable
ft
Less than 7th7th-8th9th-l1thHigh school .
GEDHS + 1 yrHS .4. 2-3 yrCollege degreeGraduate work
---,,,1*2tal
Amount of financial aid, 1978-79 school year. $
None
Lessthan_200
200- 400-399 609
700-.999
1000-,1499
Special credit,
0:0 0.0 0.0 0.0 0.0 0.00.1 0.0 0.0 0.0 0.0 0.04.5 0.0 0.0 1.9 0.0 0.0
28.4 4 97.1 100.-0 2.5 87.5 43.22.8 0.0 0.0 10.4 0.0 8.912.7 2.9 0.0 25.2 2.1 .43.223.7 0.0 0.0 50.3 10.5 4.718.8 0.0 0.0 '9.7 0.0 0.0
0.0 0.0 02.02__1.210.0 100.0
_21.2 _22,2100.0 100.0 100.1 100.0
(413)* (2) (1) (12) (7) (6),
Technical1
Liss than 7th 0.1 0.0 0.7 0.2 0.0 0.07th-8th
.
0.3 2.9 2.8 0.0 0.3 0.49th-llth 0.4 1.0 2.0 0.4 0.6 1..0
High school 39.1 51.0 48.0 39.6 41.1. 39.2GED 4.5' 4.1 9.3 10.5 12.0 '10.7HS + 1 yr 20;1 20.3 11.9 16.2 122,2 ' 18.6
HS + 2-3 yr 28.6 18.1 23.6 30.0 21.9 26.6College degree 5.8 2.4 2.1 2..3 .1.7 3.3
Graduate work la O.?. 07 0.9 01Total . N.. 100,0 100.1 100.X 100.1 1076
__1,2100.1
'(3083) (197) (385) (411) (692) (420)
1500-1999
0.00.03.30.00.063.133.60.00.0
100.0(4)
0.10.63.841.76.3
14.626.85.8
__2.2.-4470(308)
2000-29$9
3000or
more
0.00.00.0
0.00.026.9
15.9 6.o0.0 0.0
73.1 52.811.0 20.30.0 0.0
_21.2 _21.2.1-6C05 10.0
(4)
0.5
. (5)
0.40.4 0.10.8 1.537.5 32.29.5 17.1
16.6 16.229.5 28.44.5 3.3
_21.6 i3,240-79 10.1(488) (814)

iJ
\eik Appendix Table$ inued)(continued)O
Variable
Amount of financial aid. 1978.79 school year, $
' None
Lessthan 200- 400- 700-200 399 699 999
.
1000- 1500- 2000-1499 1.999 2999
3000or
more
Vocational
Studeni's,edu-Cation (contd.):Less than 7th 0.8 2.0 0.2 0.0 1.1 0.0 0.0 0.3 0.4
74h-8th 1.5 3.11 1..2 2.0 0,.4 2.9 2.1 1.2 1.4
9th-l1th 9.2 15.4 10.5 4.5 2.2 6.3 10.9 5.9 6.4
High school 52.2 52.5 71.1 53.2 71.9 46.6. 37.9 39.5 49.1up 9.6 4.7 4.2 16.0 9.9 23.9 20.9. 28.3 21.5fi& + 1 yr 9.7 5.6 5.5 11.4 8.6 7.9 12.1 - 10.7 7.6
HS +,2-3 yr 10.5 15.3 4.6 9.6 5.4 10.7 15.3 13.4 10.6
College degree 4.8 1.4 1.8 3.3 0.2 1.3 0.0 0.9 2.3
Graduato.work LI 0.0 0.9 '2,2 '_21,2 22.2 2.11Total 100.0
_:(12100.0 100.0 100.0 99.9
__la99.9 100.1 mo.1 100.1
(1063) (75) (134) (153) (211) (132) (97) (165) (337)
College-transferPrimary income:Under $2,000 3.9 17.1 19.7 12.6 20.7 15.9 5.6 6.6 3.6$ 2,000r2,999. 5.0 6.9 8.8 12.8 16.3 7.9 17.2 10.0 1.0
$ 3,000-3,999 3.8 7.8 .1.0 11.8 2.5 5.1 6.8 16.4 17.8
$ 4,000-4,999 1.8 1.2 12.7 13.1 5.0 6.6 5.4 .11.0 3.0
$ 5,000-5,999 3.5 8.9 3.3 6.7 4.4 3.9 20.7 6.6 1..5
0 8,000-6,999 3.3 4.8 6.3 4.5 9.0 3.8 2.7 3.3 1.5
$ 7,000-7,909 4.6 0.0 4.6 1.0 2.6 9.1 6.0 2.0 7.9
$ 8,000-9;999 5.6 3.7 5.8 3.5 8.2 2.5 5.2 11.6 10.6
$10,000-11,999 5.4 8.8'' 9.2 8.6 5.4 12.7 (6.9 7.3 11.1
$12,000-14,999 9.1 3.2 9.9 6.3 69 10.7 7.3 4.1 19.6
9.i

?
Appendix Table-3 (continued)
4
Variable
Amount of financial aid, 1978-79 school year. $
None
lies , 3000than 200- 400- 700- 1000- 1500- 2000- or2Q0 399 699 999 1499 1999 2999 more
Primary ncocm (contd.) :$15,000-19,999 15.6 4.0 8.3 7.0 9.9 4.7 9.5 7.8 ,8.4$20,000-24,999- 17.2 ,11.2, 2.9 0.8 7.8 1.0 0.0 0.0 4.8$25,000 or over 21.2 22.5 7.7 11.4 1.3 16.2 6:8 13.4 8,4Parents deceased 0 I 0.0 -Q2 0.8Total 100.1 100.1 100.2 100.1
_(2.2-100.0 100.1
__12.gL00.1 100.1 100.0
1841) (37) (79) (65) (101) (52) (36) (48) (75)
General educationUnder $2,000 3,3 .0.0 17.2 31.6 25.4 21.6 1.7-4 0.0 8.4$ 2,000-2,999 3.8 12.2 8.1 21.1 14.3 5.3 0.0 0,0 6.5$ 3,000 -3,999 2.5 0.0 0.0 4.2 0.0 0.0 8.4. 0.0 0.0$ 4,000-4,999 1.0 ,0.0 0.0 0.0 2.5 "1.8 0.0 0.0$ 5,000-5,999 2,6 '0.0 0.0 0.Q 12.8 0.0* 0.0r-7-3.1 3.6$ 6,000-6,999 4,0 19.2 54.7 6.2 0.0 0.0 0.0' 6.1 4.6$ 7,000-7,999 2.8 12.2 4.6 0.0 10.6 30,4 10.6 0.0 0.6$ 8,000-9,999 516 18.8 0.0 0.0 18.1 0.0 0.0 6.9 3.9$10,000-11,990 7.1 0.0 3.5 21.1 0.0 12.9 0.0 31.9 9.4$12,000-14,999 15.5 0.0 5.8 3.2 1P.6 Q,0 46.4 27.4 ,23.7$16,000-10,999 20.9 0.0 0.0 4.2 0.0 7.8 22.2 0.0w 8.9$20,000-214,999 12.0 0.0 0.0. 8.3 4.7 20.2 10.7 6.7 10.8..$25:000 or over 18..9 37.6 6.1 0.0 0.0 0.0 0.0 18.0 11.6Parents deceased 0.0 0-0 0.0Total 100.0 100.0 100.0
_11.299.9 160.0 100.0 100.0 100.1 99.9
(160) (6) (14)- (11) (15) (13) (13) (11) (37)
,00

.
'Appendix Table 3 (continued)
,
Variable
Amount of financial aid, 1978-79 school year, $
None
Lessthan. 200- 400-200 399 699
700-999
1000-1499
1500-1999
2000-2999
3000or
more
Special credit
Primary income (contd.):Under $2,000 1.4 0,0 0.0, 19.7 10.5 0.0 4.6 0.0 33.2
$ 2,000-2,999 0.4 2.9 0,0 1.9 0.0 0.9 0.0 95.9 0.0
$ 3,000-3,999 1.4 0.0 0,0 4.8 1 21.4 8.8 0.0 0.0 0.0
$ 4,000-4,999 0.7 0.0 0.0 0.0 2.1 0,0 3.3 0.0 Z6.9
$ 5,000-5,999 1.9 0.0 Q,0 0,0 8.0 0.0 0.0 0.0 0.0
$ 6,000-6,999 2.7 0.0 0.0 3,5 0.0 0.0 0.0 0.0 0.0
$.7,000-7,999 0.0 0.0 0.0 0.0, 0,0 29.0 0.0 0.0
$ 8.,000-9,999 8.2 0.0 , 0.0 2.0 0.0 4.7 0.0 0.0 0,0
$10,000-11,999 7.1 0.0 0,0 0.0 10.5 0.0 0.0 4.1 31.3
12,000-14,999 15.0 97.1 109.0 5.5 31,7 0.0 0.0 0,0 8.8
415,000-19,999 15.9 0.0 0.0 2.5 0.0 0.0 0.0 0.0 -0.0
$20,000-24,1999 15,7 0.0 0.0 0.0 0.0 85.7 0.0 0.0 0.0
$25,000 or over' 28.4 0.0 0.0 60.0 12.9 0.0 83.1 0,0 0.0
Parents deceased 2.2 22.(1. 0.0 2.2Tot a1 1-66.6 100.0 100.0 99.9
__2.2106-.1 100:1 100.0 10 6.0, 106.0
(403) (2) (1) (12) (7) (7) (4) (4) (5)
0 Technical
Under $2,000 5.3 14.8 25.0 21.8 22.1 17.2 11.2 7.9 2.7
'$ 2,000-2,999 2.9 4.6 9.5 , 8.9 10.1 5.8 9.9 7.2 ' 1.4
$ 3,000-3,999 3.8 3,0 '.3.9 4.8 9.7 4.9 4.2 4.2 3.7
$ 4,000-4,999 2.8 1.7 /4.4 6,3 7.9 4,5 )6.7 4.0 3.8
V5,000-5,999 3.8 5.7 8.3 7.1 7.1 5.5 3.8 5.7 4.8
$ 6,000 -6,999 4.5 7.8 7.9 6,1 5.4 3.2 5:4 2.8 3.5
$ 7,000-7,999 3.9 8.4 5.8 4.3 6,5 8.9 5.9 3.9 5.7
$ 8,000-9,999 8.7 81 8.3 8.9 10.3 5.4 5.8 7.3
$10,000-11,999 8.9,9.010.7 8.2 7.1 7.5 8.8 11.2 9.4 11.6

Appendix Table 3 (continued)
Variable'
Amount
None
Lesstban200
1Primary,income (contd.)412,000-14,999 12.8 10.7$15,000-29,999 14.5 '15,9$20,000-24,999 12.1 7.3$25,000 or over 15.9 0.6Parentsdeceased ...._._0 3 _2.2Total 100.0 100,0
(2935) (187)
Under $2,000 9,6 37.0$\2,000-2,999 3,3 9.4
$\-3-Mbo-3,999 3.3 4.9$ 4,000-4,999 3,4 7,3$ 5,000-5,999 3.9 2.8$ 6,000-6,999 2,9 1,4
$ 7,000-7,999 5,2 12.1$ 8,000-9,999 9,5 6.2$10,000-11,999 9 6-, 0.0$12,000-14,999 15.0 15.1$15,000-19,999 15e3 3,5$20,000-24,999 8c0 0,0$25,000 or over 10,6 0.3Parents deceased 0 5 0.0Total 100.1 100.0
(981) (66)
of financial aid, 1978-79 school year. $
200- 400- 7b0- 41000- 1500- 2000-399 699 999 1499' 1999 2999
3000ormore
7,7 14,4 5.5 12.5 14.3 13.810.7 6.0 5,7 8.5 10.5 17.43.5 4.1 2,3.. 6.7 6.5 12,50.9 3.0 1,5 5.3 4,8 5.7
__2.2100.0(392)
onal
__221002(653)
_(2.a.100.1(369)
Voca
.28.2 24. 30,87.0 16.3 9.73.7 6.9 10,75.6 8.1 4,58.3 9,9 4.34.0 5,5 .5.59.3 3,6 5,53.6 10,0 9.816,0 4.8 .9.6
9.1 2.5 2,73.7 3.0 5.80.2 0,0 0.00.5 4.8 1,10.8 0 0 0.0___,
100.0 100.0 100.0(126) (142) (195)
2 *)
16.617,713,77,6
__2,2100,1(412)
__2,1100.1(298)
_WI100.1(471)
__M.100,1(803)
19,4 23,4 10.25.9 7.7 5.5
5.2 1,9 4.94.3 7.9 4.59,4 9.9 5.87.4 1,8 6.03.4 1.5 6.19,7 .7.1 9.67.8 5.9 8,3
10.3 7.7 11.912.9 22.6 17,32.3 1.5 4.10,4 1,2 5,9
4.42.03,83,27.67.04,1
12.6'14.513,916.16,44.4
1.,2
100.1__Lsi10.1
__2,010
100.1-_21,2too .1
(132) (97) (160) (329)

Appendix Table 3 (continued).
Variable.
Occupation bead-of-household:White collarBlue collarUnskilledFarmTotal
White collarBlue collarUnskilledFarmTotal
White collar0. Blue collar
' UnskilledFarmTotal
Amount of financialopid. 1978-79 school-year, $
None
Leasthan 2O0- 400- 700-
, 200 399 699 9991000-1499
1500-1999
2000-2999
3000ormore
College-transfer
62.3 52,8 47.5 73.4 31.2 51.6 55.7 54.2 50.3
24.1 22.0 28.7 18.4 .35.7 31.4 23.0 29.7 18.19.7 22.2 20.7, 3.6 25.4 9.8 21.3 12.5 30.53 9 3 0 3 2 IA L6
100.0 10676 166:1 100.0 166.0 16676 16676 -1-6(Tc6
(701) (32) (57) (44) (68) ' (36) (25) (30) (42)
General education57.4 84.9 23:3- 52.3. 21.2 . 64.9 85.4 77.7 39.228.2 15.1 9.6 5.1 49.9 0.6 2.8 22.4" 35.49.7 '0:0 34.5 35,2 21.7 10.7 8.5 0.0 25.4
__LE.100.1
SS ELI T)3 LA .21
1076__LI
too.I 0.9 1-6676 11W-0--
(135) (4) (10) (11) (11) (9)
Special credit76.7 100.0 0.0 76.0 46.6 97.616.6 0.0 100.0 7,7 53.4 0.05.6. 0.0 0.0 '1633 0.0 2.4
a ,z __LI IS106J-0 1-66:r 166.0
(9) (6) (26)
95.4 51.3 .100.06.0 48.7 0.0 .--
0.0 0.0 0.0,
__LI100.0(340) ,
IS _SS100:6
(1),
__ES100.-0i)
1
LS -__2.S.1-6d.t)
(4)
__LE100.0
(4)
QS bt''-
100.0(1)
100.0(4)
16676(3)
11Y1570'(3)

Appendix Table 3 (continued)
Variable
Amount of financial aid, 1978-79 school year, $
None
Lessthan 200-,200 399
400-699
700-999
1000-1499
1500-1999-
2000-2909
3000ormore
Technical
Occupation bead-of-household (contd.):White collar 48.8 38.7 28.7 36.8 30.2 37.3 35.9 35.8 37.9
Blue collar 32.6 34.2 34.7 40,3 36.5 35.8 34.0 40.4 39,9
Unskilled . 15.4 21.8 32.7 18,6 ,24.6 21.9 26.2 19.8 17,4
Farm 5 2 __Lk :ti1 4 9 IA. '__LiTotal
_la10-00 Trg I:WI
__.1...i1-6671- 1974 441
__LI115V6 16676 100:6
(2376) (153) (269) (286) (463) (286) (217) (328) (572)
qi.
Vocationai
White collar -35.9 23.4 25.7 9,2 19.7 19.2 16.9 6.2 13.3
Blue collar 44.9 34.4 55.6 35.1 38.2 '60.6 56,9 64.1 67.0
Unskilled 14.0 32.8 15.,1 46.6 31.4 17.2 16.9 23.2 16.6
Farm __Li __1.2. 10.7 _AaTotal
_A...1100.1 99.9 100.1
__/.116671 100.0
__LI116(GI
_/..1IWO ___6_,11-0-6.6 160:I
(794) (61) 5) (90) (122) (87) (59) (113) (202)
_/
0*4
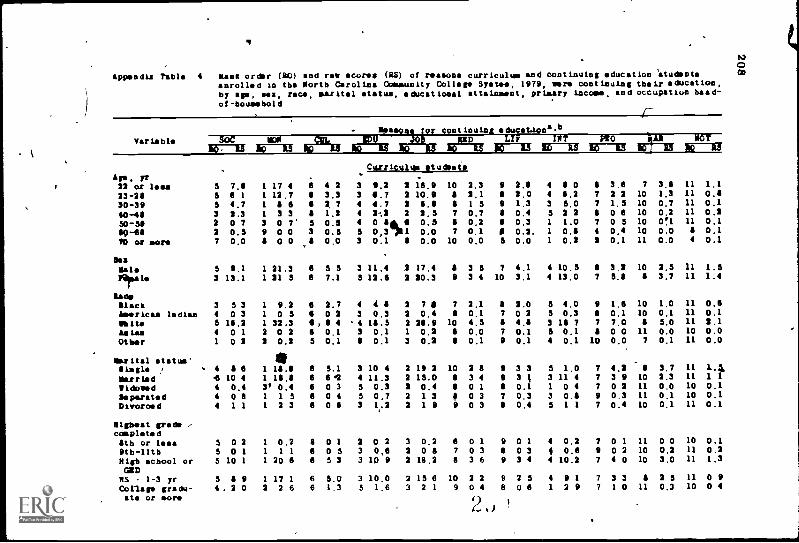
lippendix Table 4 Rang order (AO) and rev scores (10) of reasons curriculum and continuing education tudentonrollod in tbo Mortb Carolina Comeunity Collor* Syston, 1979, were continuing teals education,by 1489, SOX, rOCO, marital status, oducatioaal attainaent, prisary income, and occupation bead-of-bousebold
1Sae
-mcom mRa-sons for contitinuins ducat.Lon,b
Variable E- W15 eu"; wuri.rs gisig jt aAMi
Alps, yr22 or lee.23-2930 -3940-4950-5860-6970 or more
flex
MaleAral*
LiftB lackAmericas IndianN olteUlnaOther
Marital status'Ilisels
MarriedW idowedSeparatodDivorced
Nighest graftccepleted8th or less9th -11thNish school orGADRS 1-3 yrCollets gradu-
NcoO
.Curriculum atusitate
5 7.9 1 17 4 6 4 2 3 9.2 2 16.9 10 2.3 9 2.8 4 8 0 8 3.6 7 3.8 11 1.1
5 6 1 1 12.7 8 3.3 3 6.7 2 10.9 8 2,1 9 2.0 4 6.2 7 2 2 10 1.3 11 0.95 4.7 1 8 6 6$ 7 4 4.7 2 6.8 8 1 5 9 1.3 3 5.0 7 1.5 10 0.7 11 0.13 2.3 1 3 3 8 1.2 4 2-.2 2 2.5 7 0.7 9 0.4 5 2 2 8 0 6 10 0.2 11 0.22 0 7 3 0 7' 5 0.5 4 0 II& 6 0.5 9 0.2 8 0.3 1 1.0 7 0 5 10 Ofl 11 0.12 0.5 9 0 0 3 0.5 5 0,3181 0.0 7 0.1 0 0.2, 1 0.8 4 0.4 10 0.0 8 0.17 0.0 9 0 0 8 0.0 3 0.1 8 0.0 10 0.0 5 0.0 1 0.2 2 0.1 11 0.0 4 0.1
5 9.1 1 21.3 6 5 5 3 11.4 2 17.4 8 3 5 7 4.1 4 10.5 9 3.2 10 2.5 11 1.53 13.1 1 21 5 6 7.1 5 13.6 2 20.3 9 3 4 10 3.1 4 13.0 7 5.8 8 3.7 11 1.4
3 5 3 1 9.2 6 2.7 4 4 8 2 7 8 7 2.1 I 2.0 5 4,0 9 1.6 10 1.0 11 0.64 0 3 1 0 5 6 0 2 3 0.3 2 0.4 9 0.1 7 0 2 5 0.3 8 0.1 10 0.1 11 0.15 16,2 1 32.3 6 , 9 4 ° 4 18.5 2 28.9 10 4.5 9 4.8 3 18 7 7 7.0 8 5.0 11 2.14 0 1 2 0 2 6 0.1 3 0.1 1 0.2 8 0.0 7 0.1 5 0.1 9 0 0 11 0.0 10 0.01 0 2 2 0.2 5 0.1 8 0.1 3 0.2 8 0.1 9 0.1 4 0.1 10 0.0 7 0.1 11 0.0
4 9 6 1 19.8 6 5.1 3 10 4 2 19.2 10 2 8 9 3 3 5 1,0 7 4.2 8 3.7 11
4 10 4 1 18.9 6 61 4 11.3 2 15.0 8 3 4 9 3 1, 3 11 4 7 3 9 10 2.3 11 1 1
4 0.4 3, 0.4 6 0 3 5 0.3 2 0.4 8 0 1 9 0.1 1 0 4 7 0 2 11 0.0 10 0.1
4 0 8 1 1 5 6 0 4 5 0.7 2 1 3 11 0 3 7 0.3 3 0.8 9 0.3 11 0.1 10 0.14 1 1 1 2 3 6 0 6 3 1.2 2 1 9 9 0 3 8 0.4 5 1 1 7 0.4 10 0,1 11 0.1
5 0 2 1 0.2 8 0 1 2 0 2 3 0.2 6 0 1 9 0 1 4 0.2 7 0 1 11 0 0 10 0.15 0 1 1 1 1 6 0 5 3 0,6 2 0 8 7 0 3 8 0 3 i 0.6 9 0 2 10 0.2 11 0.2
5 10 1 1 20 6 6 5 3 3 10 9 2 16.2 8 3 6 9 3 4 4 10.2 7 4 0 10 3.0 11 1.3
5 6 9 1 17 1 6 5.0 3 10.0 2 15 6 10 2 2 9 2 5 4 9 1 7 3 3 8 2 5 11 0 94. 2 0 2 2 6 6 1.3 5 1.6 3 2 1 9 0 4 8 0 6 1 2 9 7 1 0 11 0.3 10 0 4
ate or more
4)

....
.
.F.r....rg
raf-. .r. iitgtgtn1
OQ
...
4
8 O
72
2't- gr
4.00
.4...
"7,
II.
OPC4.10, 00,4n. ::
.1,;,LL.'
Sc.,. 4...i.
4,2!--
/1'Ii
l..1
4.1
Re
;04
4
II, n
ap A
pr0.
.111
°0 t)
0a41
1,
0o
-0 0
IIv
."a
r.0.
--0
0C
LO 1
-110
^0
2-
-4,7-
"I
...08
i-
.4
ag2
0-m
4044
it: t
Wo
a
mm
m(4
,00
a04)
aliM
m04
0
...80
010"
"000
01 m
a 0
1
00"m
04M
a,M
0
CA
LJO
%
.111
"AW
M
00.-
0u0, ora
00.4
0.0.
400
".04
.4hU
".0.
1UO
m"
WM
CO
NW
U,
mW
0m0
Mos
00 "
0 4
mu
1.0
(.1
1.0
(..)
m,
CA
MM
"040
40U
4W
0"10
m00
"."0
404W
04".
UM
MO
OM
N
OU
.11.
,1M
OM
.0
Wa.
.04W
W".
""."
"I W
ON
O
M 1
.)
aaa)
"Cal
0m
Oa
1711
.00C
010*
0101
010'
0101
0101
0,
0"04
.U
UC
OM
0.0.
30.3
10O
Ip (
A a
(A .1J
tAM.u.....
,a.
cAMOu.......,,
P ..U.
N.UU.
cs
"..
001-.042
00.-.0U
01$
"""m
uum
" O
W,M
OM
mm
mC
-4,m
.m00.4.4ra
Ora
uoraouu-J
cm-4-4.
"mra-Ju
O.
000rau
oomou
-4u
000...Juu
P"raraZ
n0.--4mm
.-.
.-.
......
ura0-4.4
Johu-Jrau
mu
""cm-Jmuw
mo.4.4.4
u.4.4.4.4
-out4.4
wo,
"wouraraw
C".
"-.
OM
OIs
+U
/...
1;-
-/..
.
00 WM
a0M
01-1
,110
.00
.0N
al..)
0,1
OtD
OP
....^
,00
".0
0,..U
0d,W
WO
W.-
.1...
..a
womm-4
0.-v:1w-4
w-4
co wwwww a
csomoo
-4.-mow
it
ww-4..
0.-s
mU
alh
0
0010
ma
00M
ON
MN
00s-
.10
01.1.-.""
...
-.....
-4ra
lou.arammra
mramw
woomm
MW
MU
J00
010U
trel
lW
V r
r J
V r
1010
010
0.1M
MM
10...
r r
WW
IOas
-.10
al0
Wm
oILW
ahM
aat"
/...
.4
...,
/...0
MO
DU
b-.0
.10.
OM
NU
MW
M.W
0100
1 01
OW
...O
WN
OM
Ilk0.
1M0
Oa
MW
OM
JWLA
-41.
044
00M
m0
MJU
Mc
JILI
CA
-00
%IC
CA
VO
MM
-4-4
M-4
-4,1
...!
00,1
-4.4
,1
...-
00-0
--.
,...
....
00.
0,..,
--_
..,,
00.0
-5w
o...5
-..0
-...
..p. r C) P
r Orr
000.
000
W00
00W
."4
ea e
aea
ea
00"0
4010
"NU
M
ea e
a ea
a.
00-4
."0
Col
"000
0010
0-00
1,1-
10
alga
aaa
aaa
0000
000
WO
OM
0000
0ba
p-.
ea e
aO
-W
-aW
0000
0..0
MU
m.,0
011)
-4C ."00
0000
001"
110
040,
1,W
aaaa
aaaa
014-
--
a aa
a...
..00
00062000
...robes
0-J010-4
60Z
1
D
M
J 0 Vpi
N E

ISt,
Appendix Table 4 (continued)
Reasons for continuing ducatioo,bVariable SOC NOW CUL ZOO JOB IttlY 101,1/Rs INT PIO Pik NOT
1W-IN E111111" .2711 117-0 E-1171 W-Fg
Iligbet gradecompleted'$t,b or less 2 1.6 11 1.9 7 1.9 3 2,5 9 1 3 8 2 1 4
9th-l1tb 5 2.6 1 3.8, 7 2.0 3 3.2 4 3 2 9 1 7 6
Nigh *Owe! or 3 5.1 2 5 6 4 4.4 6 4,3 7 3,9 9 2.2 8
GAM1111 1-3 yr 4 2 5 2 2 9 7 1.9 5 2 2 7 2.2 9 0 8 8
College gradu-its or sore
3 2 6 8 2,1 2 2.6 4 2,6 7 1.4 11 0.4 8
Pr 'Sart IMICOIMIBader 15,000 - 2 4 1 4 3.5 8 3.0 3 4.0 9 2.8 7 .3,0 5
1 5,000-9,999 3 2.6 2 3.4 6 2.2 5 2,8 4 2.6 9 1.3 6
110,000 - 14,919 3 3.2 2 1.4 5. 2.4 4 2.6 6 2 3 ,9 '1,3 8
$15,000 or sore 5 4 7 3 5.0 2 5.0 4 4 9 7 3.4 10 1.4 8
Parents deceased 7 0.0 6 0.0 11 0.0 12 0.0 1,0.1 8 0.0 3
°cocaina ton Welk d-of -bouseboId:Visite collar 3 4 6 2 4 9 4 4.4 5 4,2 7 3.8 9 1.4 1Blue collar 5 3,5 2 5.1 6 2.9 4 3,8 3 4,0 9 1.7 6
Qiskillsd 3 1.9 1 2,4i 6 1,2 4 1 8 5 1,6 6 1 0 9
Pars -2 0 6 3 0.5 4 0.5 5 0,5 9 0,3 7 0,3 8
2,5 1 3 22 0 2 3.73 0 1 8.9
1,3 1 4 71 3 1 5.2,,
3.5 . 1 5 21.6 \1 4.41.4 l 4.62,4 1 9,40.0 4 0,0
2.3 1 8,11,13 1 5;40,9 2 2.30,3 1 0.6
550C to be able to contribut sore to society, MOPcultured, LOU to gain general education, JOB to ptskills, LI/ - to ialprOINI my social life; INT - to learnPAZ ay parent or spouse Tasted so to gb , and NOT the
b15 (raw score) la tb weighted frequency tins theeach second by 4, ach third by 3, and so on Rae score
to be able to arn sore money;
5 2 1 11 0.4 10 1.46 2.1 10 0.1 11 0.15 4, 4 11 1,3 10 1.5
6 2 2 10 0.6 11 0.65 2.3 9 0.7 10 0.6
6 3.2 11 0.8 10 4.47 1 11 0.6 10 0,8_17 2.0 10 0.7 11 0.78 4.5 9 1.7 11 1,05 0.0 9 0.0 10. 0,0
6 3.8 10 1.3 11, 1,07 2 2 10 1.2 11 1.07 1,1 11. 0.3 10
046 0,5 11 0.1 10 0,1
CUL to become orebetter job, UP to improve y Tootling and tudy
ore things of interest, PLO to beet interesting people;re was nothing better to do.
converted rank.vlue; each first choice ultiplisd by 5values are in 100,000the
)

66
e
4
Appedix Table 5, Rank' order (20) sad ray ig.pres (28) for itutional cbaractristics that soot influencedcurriculum and continupg educatiOn stu ate enrolled is the Nortb Carolina,Consunity CollegeSystes, 2979, 1a thelr'decisions to attend, by age, sex, race, Ratite' status, educational.ittalisest, primary incase, and oocupatioe bead-of-bousebold
711(b),n..
Age, yr-11 at less13-2916-3940-4050-5060-6970 or sore
Dele
lace*Slackhnerisaa_lodian01111Aglaia
Other
Marital states:SingleMarried'WidowedSeparatedDivorced
Nigfest gradeNumpleted6th or less .`
Otb-llthNigb school orGED / ..
--
69 1-3 yrCollege grade-ate or more
Enstitutiosa1 cbaractristice tbatASST
influeergsdecision to atten bST PLAC COST , UST mix113- 0
1 17,9 6 4.5 81 13.0. 5 44.5 61 9.3 6 1.4 61 4.1 6 0.6 ,.., 91 1.3 7 0.3 91 0.6. 6' 0 1 92 0.1 9 0.0 6
Fesata, 1 25.4 6 5.4 8
1 31.2 5 7.1 8
a
1 4 4 4.5 71 4 0.3 71 .7 6 7.6 91- 0.2 7 0.1 91 0.3 7 0.1 9
1 20.5 6 ,5.5 6 '
1 21.3 5 5.8 91 07 6 0.2 91 1.; 4 0.7 71 17 5 0.8 9
I1 0 3 4 91 1.3 5' .4 71 21,9 5 7.1 7
1- 18 1 8 4,2 91 3 9 8 0 4 9
U Ap -RS so sy---as- sa g---Er sr-irOurriculma stedOnre fa.
,,
4,0 2 15.02.4 2 10,41.1 2 6.70.4 2' 3.40.1 2 1.10.0 3 0.50.0 6 :0.1
3.8 2 17.44.2 3 31.9
.41.
1.6 2 7.30.2 1 0'.55.0 2 30.90.0 3* 0.10.0 2 0.2
4., 5 2 16.92.8 2 18.50.1 2 0.60.3 2 1.30.3 2 1.0
0.1 2 0.20 3 2 0.94 3 2 16.3
*2.6 2 15 60.4 2 3 0
3 13,0 5 5,0 4 7.4.. 9 3.3 7 4,13 9.4 6. 3.3 4 5.3 9 1, .8 7 1.73 6,5 5 2.6 4 4.3 9 1.0 7 1.73 2.4 5 1.1 4 1.9 8 -0.5 7 0.73 0.6 5' 1).4 4 0.6 6 0.2 6 0.34 0.4 6 0.2 2 0.7 7 0.1 5 0.23 70.1 4 0.1 1 0.1 5 0.1 7 0.0P.
3 15.3 6 5.6 4 J1.6 9 j 3.3 , 7 4.53 16.0 5 6.9 4 10.6 9 3.9 7 5.4
4110.
3 6.1 6 3.0 5 3.2 9 1.5 6 2.03 0.3 6 . 0.2 5 0.2 9 0.1 0.13 26.2 5 9.2 4 16,7 8 5.4 7 7.52 0.1 5, 0.1 . 4 0.1 6 , 0.0 6' 0.1'3 0.2 I, 6 0.1 4 0.1 6 0.0 5 0.1
413(115.6, '5 5.6 4 8.6 9 3.6 7 4.9 .3 14.4 6 5,7 4 9.6 6 , 2.9 7 4.13 0.4 ' 5 0.2 4 0.4 6 0.1 7 0.13 1.1 6 0.4 5 0.6 9 0.3 6 0.33 1.7 8 0.6 4 1.1 6 0.3 7 0.5
3 0 2 7 ' 0 1 5 0.1 8 0.1 6 0,13 0.73 14 6
46
0.38.2
44
0.68.9
99
0.23.3
6 .3118 .0
P
3 14 2 5 4.9 4 8,3 8 2.8 .7 4.03 2.9 6 0 8 4 3 3 7 0 5 5 1,0
1
41.

4,
&
0 tOr .011a 001 &W10100 calo/Mg qp 40 .,:q47itel."'.1 g 00' 1 0 Or 0
svcar-- .01.1,!,L0-g2sr:.
,-gqe. o.
a. 0 h5. g '3 1 roo or 0 0 0, 0 .r - opoor.. & - 2 2"gMr
Is 1 ID .0!Z°
or SO 10 or or W or or r
SOor 0 GO 0 Of 0000M W qp
O C SO CO 10 0
O LI CO CO Or, tO 0 CO J C
0 0 0 Or or 0 0 bi 0. . .
PO or CA, CO or 0 0 SO Or 10
OD 010 ID sa CO CO 0 0 Co
0 0 0 Or or10 or r M
SOW &&&&&SO Oh 0 to Or
Op co co ID to uo co to
0 orO
000000 0W r W J a CO
0 O 0 0 CD CD 0 0 0
o o r o r r r 0000004O o to r 0 0 0 0 Or 0 & 0 qp
SO or or DO 14 SO SO
SO SOor 0 63 CO & 008000
. . . .W 0 0 Ma r r qp &
Or 10 1.3 1.3 W W 4.1WWWWW\ .
Cor 0 0 00 sa CO
1
10 6.1 10 o ca
c. 0 1.3 0 0
10 10 10 41 10 CO 10
0000a , & & 10
rr as CA, & W a 0 ID Or ID CD 40
0 0 CO CO OS W 0 0
0 0 or 0 161a W O a o
or0 0 .1 SO SO
. . .US or CO 0
0 0 0 0 SOor r01J SO
a1, a as
um 0 000 0 0 0
CO 43
SO 0 CO or 0 or Co a La
1.. 1.. 1.. 1..
oror
0 M O0 Oorr 0
-10 1.3 0141. 0 0
& U Ut J CO 0 U. U a
0 Or1:13 01 0
0 10 IN W a0 & & 0 0
0 0 00 10 0 0 .1
0 Or 0 0 0 Or Or 10 10
2 10 0 10 0 0 W & or La
SO .1 0 .1 CO .1 0 .1 .1
O.Or Or
10 & 10 0 & CO 0 010 ta CD 0 0 10 0 0 ID
ro Ca Ca Ca 63 J W W W W
or or0 La si W o r ai cn 00000 0 0 tD 0 Or
Ot CO 01 0 Of 0 ao
0 Or W &&
0 & 10 10 0U W
as as a ai a a a1,
00. 043 W CP
or or sp W to 0 41&&&&& talra&COOSO Ca qp
0 SO & CO OS1.W W& r J 0 SO CO Co or
/
4,
ao J CO J 0 .../ 0 ...1 CO J J J 40 tO OD tO CO th 0 0 0 01
0 0 Or & Or 00 & Or & 0 0 0 0 Or Or Or 0 0 Or 10 0 67- Or Or. . . .
& 0 0 0 1.1 0 0 ID Or 0 -.I o 0 0 0 DI & 10 10 0 0 0 0 0 1.3 & &
0 0 0 0 0 0 0 .4...,colle
0000 10 # 00.10W #.0663. . .
411 0 ID 0 or 0 0 or 0 0 UP
4
o 000 0 Or 10 tdLa W r &
o La Or Or 0
0 0 0 0 0
ziz

Appeadis Table 5 (oomilemed)
VariableI tit tiooal c saacteristice that influenced decia.iom to atte
1.4. 1/1sr-p- g-Kr I, 1I3 155-113-a. 90 93 10 13
ignest gradecompleted:9th or less9th -11thig2 school orGRDXS 1-3 yrCollodi grads-'ate
Primary lacer'°oder $5,000$ 5,000-9,929210,000-14,919$15,000 of overParents deceased
Occupation bead-of -botimebold'Vbite collarBlue collarUnskilledfarm
1
1
1
1
1
1
1
1
1
1
1
1
1
2
4.76.010.3
5.2X.2
7.65.75.7
11.00.1
10.27.43.21.0
99
2
2
9
99e-
9
99
0.20.61.1
0.40.2_
1.20.20.50.60.0
0.51.20.60.1
9 0,71.0
S 1,1
9 0 49 0.1
1.29 0.6
0.57 2.09 0.0
6 0.79 0.9
0.6S 0.1
2
2
2
2
22
2
2
5
2
2
2
1
4,54.99.3
4.94,9
-
1.IS.15.19.50.0
8.56.32.51:1
333
3
?
23
3
3
2
3333
3,43.67.6
4.04,1
1.24.14.17 80 0
7.15.32 10 6
5
5
5
6
6
667
6
6
55
1.31 92 9
1 5
1 3
2,51.71.62:70.0
2 5
2.11 00.4
4
4
4
4
-4
44443
4444
2 313 26 2
3 23.5
4.03,03.58 50.0
5 94.21.80 6
6
7
7
7
7
67784
77
7
1,31 5
2 2
0.21.0
2.3(1.11.21.70.0
1.81 5
0.70.2
7
6
6
5
5
7
6
5
5
6
S
6
6
Lk...
2 8
1.81.5
2.2.1.61n1.62.20.0
2 82.1080.3
\F1DD
sP2OG edocatioaal progr or oottrees available, A33T financial assistance was available; PLAC job
plrommest services; LOCA loca on (meanies' to boles or 'pork), COST low cost, ADIS opeo-door admissions policy,
11162 quality of instruction; student-centered instruction and activities, and OTBS other reasons.
NIS (raw score) is tbe,weigteacb second by 4, each tbird by 3,
402
dgrequoncy tises.tbo converted rank value, *sob first choice multiplied byd so on. Raw score valuers are in 100,000tbs
14? 4
0

Appendix Table 6, Weighted percentage distribution of curricurum students enrolled inthe North CArolina Community Colleke System, 1979, by program,evaluation o3 support services, and importance of support services
Curriculum students-Responses,
Transportation.:
GodCOald improve'Don't knowTotal
College-transfer
Generale ducat ion
Special,acre dit
TechwicaI Vocational
Evaluation of services
42.7 43.4 35.5 38.7 40.4
20.6 13,9 10.6 21:6 1.521.1 ---- 42,7 39,8166X) 100.0
_1221110.0 100.0
_ZE.L100.0
(1355) (265) (403) (6448) (2151)
43.6 57,2 53.0 53.3 64.553.4 41,3 39,6 43,3 29.6
-1-6671
1,5 . _14.1100.0
_2.11-6676
. 1.2'1-0( 100.0
(1387) (275) (420) (6655), (2237)
Parking: .'.1
GoodCould improveDon't know , __LITotal
.
i
Cbild care:GoodCould improveDon't knowTotal
Tuition aid: ,
GoodCould improveDon't knowTotal
I
A
40111A4(14,7 5.810.2 11(2.9
----- ZI.1 _El .±100.0 1(10.1
..1 (1345) 4.260),..41 319.11410
e ruuTr(135*
r
6.2 12,,8
9.1 12.674 5_Lla
1-00.1-
(390)
Wr4(6280)
, ...,
-40' ,
37,§20.r.
42 3
245.8
_f2.Z.10.0(402)
42,622.7
.2±.Z100.0(6455)
rDro(171)2
,
16.616,367 1
1 ur75
(2064)
37.2, , 22.5
.1.(2.2100.0(2130)

tr,
Appendix Table 6 (continued)
ResponsesCurriculum students
College-*
,General Special Technical....-
Wicationaltransfer education credit 0
Stipend*:GoodCould improveDon't knowTotal,
25.0' 22.7 13.720.3 20.7 7,1
aa ad t,/0_G 100.0
(1356) (265) (401)
Wealth care:Good 18.5 16.9 8.8Could improve 14.5 .15.3 7.9Don't knowtotal
_ELI16111
f1.11 Ji.a.1100.0100.0
(1346) -4264) (391)
Job counseling:.Good 30.0- 32.5 22.6Could improve 22.5 22.0 12.6Don't know 44.5 45.6 64,9Total 100.0 100.0 100.0
(1357) (269) (400)'
Job placement:Good 22.7 23.3 19.0Could improve 24.0 23.6 i12.7Don't know _11.1 _ILI :11.1Total 100.0 WO4 A 100.0
v27.7 , 27.124,4 24.4
iLl 11211 16(6430) (2119 ) -
19.4 22.215.9 19.764.7 _112.1100.0 100.6(6350) (2088)
36.8 39.225.0 25.338,2 35.5100.0 100.0(6449) (2114)
32.6 34.426.5 29.9
_t1.1 35.71-665 100.0
(1366) (266) ' (397) (6469) (2127)

Appendii Table 6 (continued)4 t-
Responses
Curriculum stOdentsCollege-transfer
Generaleducation
Specialcredit
Technical Vocational
Academic counselGoodCould improveDon't knowTotal
52.8,
30.6
_IL2100.1(1374)
51.2'- 31.4
1121
30.813.2
1E.2
50.325.424 ..1
42.719.937 3 UP.
-WW(2106)
100:0(268)
100.0(398)
16070(6434)
Personal counseling:m Good 44.6 47.9 26,5 46.3 47,8
Could improve 25.0 23,4 12:0 25,7 20,4
Don't know 12.1 28 8 61,5
-Total 100.0 rg 100.0_Zia106.0
_ILI- 106.6
(1371) (272) (402) (6445) (2132)
Recreation facilities:.Good 34.9 29.1 27.8 30.6 38.0
Could improve 44.1 .35.3 20,9 44,2 39.6
Don't know ELQ 35.8 11-1 25.2 P-21
Total 10.0 100.0 10C GO 100.0 1665.)5 .
(4767) (271) (402) (6408) (2131)
Study and reading areas:Good 67,4 68,0 40.5 70.7 69,3
Could improve 23.5 21.7 13.9 20,2 18,3
Don't know .1 9,.....2 44 515-A 9 0 ' 12 3
Total 100.1 100:1 WW7W Wrg - WW1(1372) (273) ' (405) (6473) (2133)
2

Appsndlx Table 6 (continued)
Responses
e
Coilege-transfer
Curriculum students , . ..
Geniral S15ecial Technical Vocationaleducation credit
Library resources:GoodCould improveDon't 'know 7'Total
69,323_17 5
66,126,3_LI100.0(273)
40,59,450a100,0(400)
73.718.87 5
73,213.213 6
99.9(1376)
100.0(6529)
100.0(2153)
Bating facilities: .4Good 34.2 42.7 20.7 5,2 36.0Could improve 47.9 , 41.6 27.4 .6 48.5Don't know 17,8 15,7 51,9 1 2 15 5Total 99,9 100.0 100.0 10 0 100.0
(1381) (274) (470) (712 ) (2523)
Importance of support servicesaTransportation 22.4 , 18.5 18.6 18.8 20,0
(367) (58) (69) (1461) (545)Parking 47.1 37.4 45.0 40.1 32.7
(668) (104) (194) (26)9) (768)Child care 5.4 5.8 6.4 8.6
(106) \ (19) (44) (581) (249)Tuition aid 26.2 21.9 10.8 26.0 17.2
(59) (79) (74) (2040) (586)St ipends 16.1 13.1 6.4 17.9 16.1
(280) (57) (46) (1451) (503)pealtb care 8)4 9.1 4.9 9.7 11.2
(130) (30) (29) (724) (328)Job counseling 19.6 16.8 15.5 27.0 21.6
(337) (53) (84) (1994) (552)
2

Appendix Table 6 (continued)
ResponsesCurr students
College- General Special Technical Vocational
transfer education credit
Job placement
Academic counseling
Personal counseling
Recreation facilities
Study and reading
Library resources
Eating facilities
areas
18.0 17.1 , 15.8 33.5 27,3
(302),, (60) (97) (2586) (708)
38.21" 33.9 16.0 30.3 15.2
(638) (110) (99) (20.49) (431)
24.9 20.1 13.1 24.9 17.8
(418) (74) (84)- . (1780) (502)
22.8 8.9,-- 10.6 17;1 16.4
(428) (4-0) (65) (1426) (440)
35.1 33.1 16.3 32.9 24.2
(557) (102) (97) (2345) (611)
43,1 41.8 20.2 38.8 27.1
(696) (136) (128) (278) (723)
24.3 (17 .4 16.1 26.2 27.7
(455) (69) (60) (2011) (742)
a1 frequelacies and percentages related to this variable reflect only those stu-
tents who indicated that a service was important to them.- Multiple responses precluded
frequency and percentage totals,

Appendix Table 7. Weighted percentage distribution of continuing education studentsenrollid in the North Carolina Community College System, 1979,by progtaa, evaluation of support services, and importance ofsupport services
ResponsesContinuing education students
Academic Fundamental Occupationalextension education extension
Transportation:GoodCould improveDon't knowTotal
Evaluation of servicesv
40.2 "i 49.0 45.511.5 '18.2 10.
3 3.2 9 213 60.0 . 100.1 -1()0.0
(904) (641) (1681)
Parking:Good 54.3Could'improve 25.2D012 t know 7 5Total. 100.0
(944)
Child care:Good 11.0Could improve fa 9.9Don't knowTotal IWO
(794)
56.4 57,918.5 23st425 0 18 799.9 100.0
(626) (1735)
15.910.973.2
V00.0(591)
14.28.7
77.1100.0
(1460) 0

Reponses
Appendix Ti ible 7 (continued)
Continuing education studentsAcademic Fundamental Occupationalextension education /extension
kTuition'aid:Good 17.9 22.6 21.3
Could improve 6.2 15.0 9.3
Don't know 75 8 EA ELIATotal 99-. 9 , I 100.0 100.0
(777) (598) (1449)
Stipends:Good 13.9 21.4 14.2
Could improve 7.-3 16.5 9.3
Don't know'78.8
. _1L _a._Total 100.0 106A -1-65-.16
(812) (607) (1460)
Health care:Good 12.7 29. 17.1
Could improve 8.3 12.1 8.2
TDootaln't know _zis
lt-801 0.0 .9
i 1844) , (611)
Job counseling:Good 17.7 32.8
Could improyer 8.7 17.0
Don't know,
'_LlE _222Total 106.0 100.1
(801) (613)
212
100.0(1484)
___,---
23.19.8
_EL2100.1(1482)

Appendix Table 7 (continued)
ResponseContinuing education students
Academicextension
Fundamentaleducation
Occupationalextension
Job placement:Good 14.2 30.2 18.1Could improve 9.7 20.9 12.3Don't know 76,1 49,0 69.6Total 100.0 100.1 100.0
(804) (608) (1477)
Academic counseling:,Good 18.9 45.3 24.7Could 4i'2';ove 6.3 14.9 7.9Don't know 12.2, v 5Total
.21.E100.0 100.1
_fl.160.1
(808) (613) (1458)
Personal counseling:Good 24.7 52.2 30.0Could improve 8.4 12.6 9.1Don't know 66.9 §.2 ALP_Total 100.0 100.1 00.1
(834) (619) (1457)
Recreation facilities: ,
Good - 26.9 32.8 24.7Could improve 12.0 25.1 13.6Don't know 61.1 42 .1 61 7Total 100.0 100.0 100.0
(833) (608) (1470)

:4
Appendix Table 7 (continued) tt.7N.7
N
ResponseCopt inuiRg education, students.
Academic fundamentalextension e ducat ion
Occupationalextension
Study and reading areas:Good 31.0 64.7 ' 38.9
Could improve 12.6 18.2 9.2
Don't know __61..1 17.1 51.9# Total / riv 76IWO 100.0
(828) (632) (1493)
Library resources:
Good 32,5 57.8 39.4
Could improve 12.5 18.1 10.0
Don't know 0 24,1 50 6
Total_..55
100.0 100.0 100.0(818) (608) (1505)
Bating facilities: .
Good 25.4 39.9 30.8
Could improve .17,2 24.2 17.9
Don't know 5 4 1 § . g 51 3
Total_7
100 .0. .
pyoJI IN . 1
(848) (614) (1528)
Importance of support servicesa
Transportation 14.3 37.3 15.3(218) (236) (401)
Parking 23.2 26.8 25.9(267) (176) (586).
Child care 4,01 9.7 5.6
(50) , (62) (123)
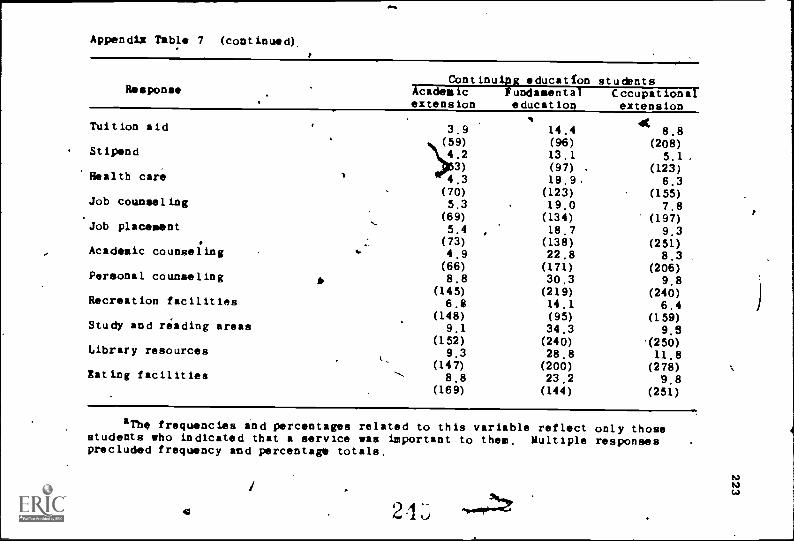
ON,
Appendix Table 7 (continued),
ResponseContinuipg education students
Academic Fundamentalextension education
Cccupationalextension
Tuition aid
Stipend
Health care
Job counseling
3.9(59)
\i):.23)
4.3(70)
5.3
14,4(96)13,1(97)19,9
(123)19.0
8.8(208)
5.1(123)6.3
(155)7.8
(69) (134) (197)Job placement 5.4 18.7 9.3
._ (73) (138) (251)Academic counseling . 4.9 22.8 8.3
(66) (171) (206)Personal counseling * 8.8 30.3 9.8
(145) (219) (240)Recreation facilities 6.8 14.1 6.4
(148) (95) (159)Study and reading areas 9.1 34.3 9.3
(152) (240) '(250)Library resources
L.,9.3
(147)28.8(200)
11.8(278)
Rating facilities -.. 8.8 23.2 9.8(169) (144) (251)
am, frequencies ind percentages related to this variable reflect only thosestudents who indicated that a service was important to them. Multiple responsesprecluded frequency and percentage totals,
2`1

Appendix,Table 8. Weighted percentage disleribution of curriculum students enrolled inthe North Carolina Community College System, 1979, by program,preference for using a standard name for the institutions in theSystem, and feelings about a standard nail*
ResponsesCurriculum students
College- General. Specialtransfer education credit
Technical Vocational
Preference for standard nameNo standard name 24.1 12.0 25.0 13:8\ 14.2
Community colleges 40.7 39.9 , 36.2 36.7\ 26.7Technical institutes 1.0 12.5 5.1 9.4 14.4.
Technical colleges 3.2 13.4 5.3 16.5 13.7No opinion 21.L .± a1,11 31 0
Total_a?...2 _IL
100.1 iti6T6 , lim5-.2
1°°1ro-a!5.
(1462) (295) (465) (707 ) (2493)
Feelings about a standard nameCommunity colleges and technical 11.7 22.5institutes are basically thesame .
16.9 20.8 21.6
Would help give all thesame status
11.6 16.1 16.6 18,6 12.2
Would help students to transfer 10.9 \ 20.1 10.5 17.7 9.5Community colleges and technicalinstitutes, ars' basically differ-ent t
17.9 , 3.9 9.6 8.5 8.6
No change wanted 10.4 8.2 10.9 4.8 9.3
Does not matter what institution 37.5 29.2 , 35.6 29.9 38.8is called ,
Total 100.0 100.0 100.1 IUUTT 07376(1461) (295) (461) (7041) (2477)
gib
2 1 u

*
dix Table 9: Weighted percentage distribution of continuing education studentsenrolled'ip the North Caro#ina Community College System 1979, byprogram, preference for using a standard name for the MEgOtutionsin the System, and feelings about a standard name
- -
1144nie..
4'No standard nameCoamunity collegesTechnical iAstitutesTechnicalsollogesNo opiniofTotal
Feelingsommunity colleges and taqhnica4indtitutes are,ba sically thesameWould help give all thesame -status
stAients to. transferolleges*and technical,are basically dif-
Preference
-7
Continuing education studentsAcademic Fundamentalextension
for standard name
Occupationaleducation extension
Would'Coma PtiJnstitferent
No change wantedDoes Min matter whatis calledTotal'
institution
about
14.325.513.3
4 , 7.839,1100.9(1282)
a standard name16.9
11.3
5.97.2,
7.950.8
100.Q(1270)
.12.1 14!It24.0 28.8-14,3 L3:0
9.9 7.939,8 36 1100.0 100-.0
(124) (2213)
20.5:
.1
-- -23,8
9,6
4,49.2
12.5
7.78.0
10.2 11,542.8 40.1
100,0 ,
(719)100:1(2181)
21

Appendix Table 10. Wekghted percentage distribution of curricula, students enrolled in
a-4 the North Carolina Community College System, 1979, by program,
urce of-income, parents provide over one-half of support, head-of-/--3ouselvld, hours worked/week, wages/hour, and employment plans
Variable
Source of income a tb:
College-CurriculumAtucients
General Special 'Technicaliptransfer education cretit
. .
Vocational
Employment 67.0 57.4 70.7 64.2 .>
ii (895) (183) (349) (4240)
Parents 430.1 12,9 11.7 21.2(602) (53) (46) (1819)
Spouse 18,6 34.1 28.9 18.5(194) (79) (140) (1243)
Relative 1.4 0,8 0.6 1.1(26) (8) (5) (82)
Savings 13.5 13.1 13.1 10.6(240) (30) (53) (828)
Ret ireeent \_./,.. 11,4 19.0 7.9 16.4(195) (6 (23) '1249)
vlie/fare 0.8 11)6 0.1 r 2.3(13) ( ) (2) (196)
Other 9.4 11,7 6,4 111.8(1,39) (33) (26)- (96)
Parents provide over one-.half of support:Yes 34.6 . 13.0 13.6 23.8No 654 87,d 86.4 7Total 100.0 .
(1466)/00.0(294)
100.0(466)
100.0(7072)
21,
54.7(1177)
13.0(423)17.0(417)0.9(32)7.8
(212)19.6(544)2.0(72)14.7(465)
.18.313...._1 7
.1000.0(2489)

.
Appendix Tjble 10 (continued)
Variable,. Curriculum students
College-transfer
Generaleducation
Specialcredit
Technical Vocational
Head-of-household:Father 42.7 21.0 19.1 30.8 , 22.2Mother 7.9 6.0 2.9 9.6 9.5Self 27.8 38.3 37.5 39.2 4-9.8Spouse , 19.2 33.5 39.7 17.9 . 14.6Other relative. r.4 0.6 0.7 1.4 2.3,0t6er 1.0 0.7 0,2 1,1 . 1,6Total 100.0 100.1 100.1 100.0 100.0
(1457) _.(294) (464) (7075) (2479)
Hours worked/week:Less thin 5 2.2 2.7 3.0 2.3 3.35-9 3.0 2.7 0.6 3.3 1.910-19 t 12.2 5.6 1.8 8.3 4.720-29 14.5 6.2 6.0 9.7 6.130-39 10.7 9.2 8.4 7.3 6.740=44 22.8 27.7 43.3 28.8 26.64 5 -4 9 2.8 3.4 5.5 4.5 8.350 or more 1.6 5.0 3.1 3.3 3.3Not wage earnerTotal
30,2 _az.,110(0-
_ZL11-166T6
32.7ruu7T
_22,1rwo100.0(1455) (297) (106) (7074) (2485)
Wages/hour:Less than $3.00 18.1 11,3 3.0 14.5 11.1$3:P0-3.49 18.7 14.1 8.8, 15.1 9.6$3.50-3.99 8.9 8.1 8.8 7.5 7.1$4.00-4.49 5.1 8.3 9.0 6.0 6.2
2 f,
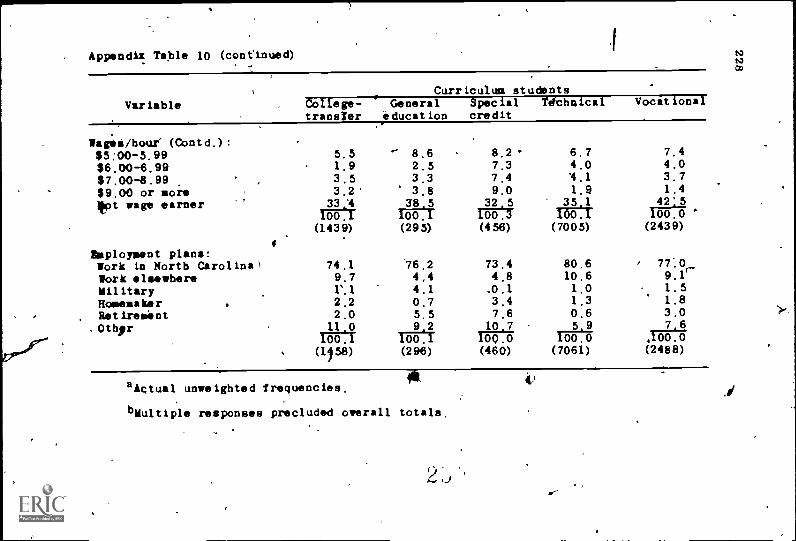
.
Appendix Table 10 (continued)- :
Var tableCurriculum students
College-transfer
Generaleducation
Specialcredit
Tdchnical Vocit ional
Magee/hour (Cont d. ) :
=5:00-5.99W6.00-6.99W7.00-8 . 99$9.00 or moreipt wage earner
5.51 . 93 . 53 2
3_,.._3'4
"-- 8.62 . 53.33 8
3._i_8 5
8.27.37,49,0
3_2 5
6 . 74.0A 11 . 9
3.___5 11071
7.44.03 . 71 , 4
4,2 51-907I 1151:1- UTI:173 1-0-. 0 '
i(1439) (295) (456) (7005) (2439)
Employment plans:Work in North Carolina 1 74.1 76.2 73.4 80,6 77. 0_Work elsewhere 9.7 4,4 4.8 10.6 9.1'Military 1%1 4.1 _0,1 1.0 1 . 5Homemaker . 2.2 0 . 7 3.4 1,3 1.8Rat irement 2.0 5.5 7.6 0.6 3.0Othor I. 1 0 9,2 1,_0 7 7...6
W071 1V071 100) __LI100 .0 ,M. 0
(1158) (296) (460) (7061) (2488)
aActual unwe ighted frequencies.
bMultiple responses precluded overall totals.
is v.1

Appendix Table 11. Weighted percentage distribution of curriculum students enrolled inthe North Carolina Community College System, 1979, by program, highschool average, high school rank, and GED score
Vkr iable
High school average:_A
BCBelow CDid not attendTotal
High school rank:Upper 1/3 of classMiddle 1/3 of classLover 1/3 of classDid not graduateTotal
score:Did not take225-249Less than 225Total
Curriculum studentsCollege- General Special Technical Vocationaltransfer education credit
O18,2 19.9 27.6 15.6 8.656.1 54.1 57.2 55.7 50.224.0 24.9 14.6 % 26.2 35,70.9 1.0 0.5 1.4 3.2
Id 0 2 _I0d
00.1 6LIO(1460)9V rurr
(297100. 13-.1(468) 80 42489)
4.. -
.
36.0 38.0 48.4 32.2 20,Q52.7 45.2 43.3 52.5 51.2' 5.2 8.4 3.2 6.3 7.76.0 8.4 5.1 _La ILA
100.0 100.0 100.0 104.0 100(1443) (295) (462) (7018) (2464)
. 96,7 94.4 .99,3 92.3 87,02.6 4.8 0.7 6.9 10.6
__IA LI. LI _ALE LA100.1 100.0 16671 100.0 160 6(1262) , (241) (414) (5910) (2020)
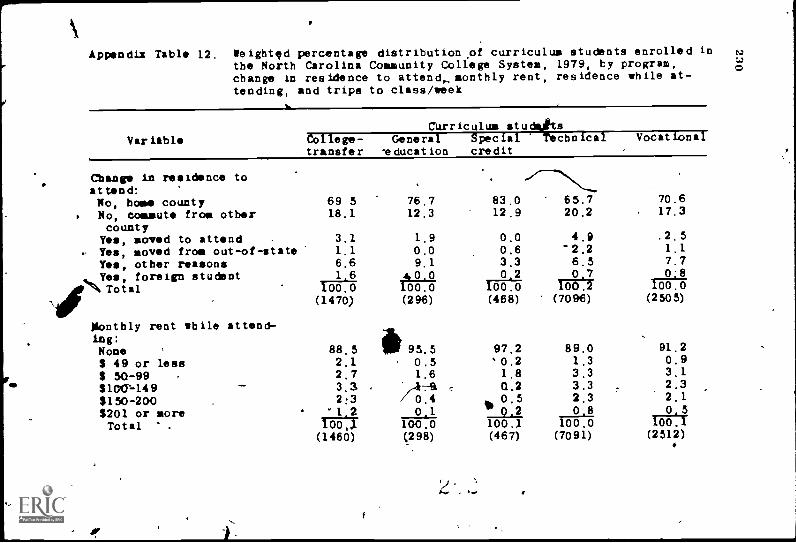
Appendix Table 12. Weighted percentage distribution of curriculum students enrolled inthe North Carolina Community College System, 1979, by program,change in residence to attend, monthly rent, residence while at-tending, and trips to class/week
VariableCurriculum atudts
College-transfer
General Special conical'education credit
Vocational
in ide tChange residence toattend:No, hose countyNo, commute fro,. othercountyYee, moved to attend .
.., Yes, moved from out-of-stateYee, other reasons
,,_ Yee, foreign studentTotal
Monthly rent while attend-ing:None '$ 49 or less$ 50-99 .
9100,-149_
9150-2009201 or soreTotal .
69 518.1
3.11.16.6
____,,_1 6
100.0(1470)
88.52.12.73.32:3
:1 2
76.712.3
1.90.09.1
c
83.012.9
0.00.63.3
____,_o2100.0(468)
97.2'0.21.8Q.20
lb .5Q2
65.720.2
4.9-2.26.5
1
70.617.3
. 2. 5
1.17.7
___,__0.8
100.0(2505)
91.20.93.12.32,10,1
100. 1(2512)
100.0(296)
*95.50.51.6
0.40.1
100.2(7096)
89.01.33.33.32.3
._0 8
100,1(1480)
100.0(298)
100.1(467)
100.0(7091)

Appendix e
t
12 (continued)
table
attending:
..
)
Curriculum studentsCollege-transfer
45.733.63.32.60.87,24,5
_2../100.2(1462)
Generaleducation
25.649.59.3.
1.40.49.14.6
_,0110(3.1
(297)
Specialigredit
12.356.54.72,10,111.42,1
1.___O 9
100.2(468)
Technical
34,841.04,72.41.09.64.42,1
M.1(7095)
Vocational
28e146.34.02.20.8 4
8.33.121
Reside ce whileParen aSpoCbil nRelativeBoardSelfFriendsOtherTotal 0 .1
(2511)
Tripe to class/week:1 14.3 17,9 51.1 4,0 3.82 11,4 21.1 46,9 17.5 11,33 6,6 11.9 4,0 9.3 11.14 6.5 10.9 2,8 14,5 14.65 45,1 26,3 3.1 42,7 51.76 4,5 5.1 0.5 . 3.4 1.77 or more 11,6 __LETotal 100.0
__Li1T)0.1
__LI10(471-
_11.1100.1 166.0
(1461) (295) (470) (7057) (2497)

Appendix Table 13. sighted percentage distribution of curriculum students enrolledNorth Carolina Community College System, 1979, by program,
hours in clase/weet,,plasses this quarter, quarters enrolled, andplans to enroll in degree program
Curriculum studeptsVariable College- General , Special Technical . Vocational
transfer education creditV
11.3 5.522.6 10.924.9 18.118.5 14.711.3 1b+1'7.2 25.7
EA _ILIINA IWO(7090) -(2512)
Sours in class/week:1-5 .22.2 30.4 80.56-10 19.3 28.1 14.611-15 26.1 28.2 2.316-20 24.2 11.7 0.921-25 5.9 1.3 0.426-30 1.6 0.7 0.431 or moreTotal
Classes this quarter:
__la10070(1489)
La LI100.1(298).
100.6(487)
1 '20.7 32.52 17.7 25.83 18.4 15.54 23.5 11.75 14.6 3.8
,6. 5.3 0.5
7 or soreTotal
L...§ __2..1100.116676
(1455) (294)
Quarters enrolled:
83.9 15.7 A 41.110.3 71.8 22.2
22.5 16.320 22.8 18.30.8 12.4 .. 8.f0.4 3,9 1.1
2A100 0
__1.4.. 100.1
_211-0.6
(467) (7018) (2472)
1 (first) /11.1 19.1' 40.3 12.7 15.52 / 9.1- 14.5 25.1 8.9 11.53 31.8 20.8 8.1 29.3 38.74 7.2 9.0 8.8 6,1 8.8

f \NAppenakTable 13 (continued)
VariableCurricults4'studFnts
College-transfer
Generaleducation
Specialcredit
Technical Vocational
Quarters enrolled '(contd.):5 :6
7,
8
6.213.97.73.5
8.54,76.51,9'
2,75,71.02.3
5,29.7
10,93.4
4.47.54.91.8
9 AS, 13.7Total
__2.100.0
_liL16676 ittio §37 __Z.12.
1-60.1
Plan to' enroll inprogram:,
Yes
degree
(1471)
87.4
(298)
82,2
(467)
48,1
(7100)
61,7
(2500)
45.9No 12,6 17 8 51,9 38,3Total r 100,0 100,0 100.0 100.0
_ki.2Ib0.I
S1465) (298) (467) (7075) (2493)
0-7.0+

Appendix Table 14, Value orientation toward education and institutional characteris-tics that most influenced curriculum students to enroll in the
1111Nortb &rolina Community College System, 1979, by program, rankorder (RO) of responses, and raw scores (RS)a,
Curriculum studentsCollege- General Special Technical Vocational
Responses transfer education credit
RO RSb RO, RSb RO RSb RO RSb RO RSb
T-o contribute more to society
To earn sore money
To become more cultured
To gain general ducat
To, get a better job
To improve ay reading andstudy skills
To improve ay social life
To learn more tbings of .
...interest
To meet interesting people
My parents or spouse wantedoS to F
\
The.Ire was nothing better to do
Reason continued education3 '29,32 4 6.92 5 31,1.4 117.67 5 39.01
1 43.34 1 10.49 1 47.311
1 243.74 1 85.RN
6 15.95 6 4.53 6 26,19 6 59.91 6 19.87
4 28.6g 3 6.96 3 34,04 3 128,A2 4 42,94
2 39.96 '2 8,41 4 33.52 2 227.17 2 70.15A
10 6.77 7 2.29 10 7.74 8 37.84 9 14.60
8 8.63 9 1.41 8 13,55 9 33.70 8 14.1)7
5 24.56 5 5.31 2 46.47 5 112.20 3 47.42
7 10.28 8 1.93 7 19,13 7 40.64 7 18.18
8.29 10 1.15 9 8.15 10 32.64 10 12.14.9..
11 s. 3.30 il 0.59 11 4.13 11 13,21 11 7,77
I)

Appendix T-a-bIi14 (continued)
Curriculum studentsCollege- General Special Technical
Responses transfer education creditVocational
RO RSb RO RSb RO RSb Ro RSb RO RSb.
Institutional characteristicIducational programs or 2 44,23 2 11.56 1 65,75 1 255,68courses Available 4
- 1 91.29
Financial assistance available 7 9.18 6 2.79 8 4.00 5 79.41 5 33.80
Job placement services 9 2.98 9 0.72 9 3.46 7 52.58 7 20.40
Location (nearness to hose 1 50.15 1 11.82 2 51.56 2 212.05or `work)
2 69.52
Low cost 3 43.57 3 9.56 3 51.10 3 175.06 3 53.87
Open-door admissions policy 5 i7.29 5 4.24 5 21.46 6 62.33 6 21.99
Quality of instruction 4 22.30 4 4.83 4 40.91 4 100.19 4 38.14
Student-centered instruction 8 9.18 8 1.85 7 12.59 9 33.19and activities,
Other reasons 6 12,55 7 2,01 6 14,47 8 50.72
9
8
14.66
19.10
aRS (raw score) is the weighted frequency tines the converted rank value;first choice multiplied by 5, each second by 4,-esch third by 3, and so on.
each
bRew score values are in tens of tbouSands.

Appendix Table 15. Weighted percentage distribution of continuing education studentsenrolled in the Nortb,Carolina Community College System, 1979, byprogram, source of income, parents provide over one-half of sup-port, head-of-houmehoLd, hdurs worked/week, wages/hour, and eel-
-, ployment plans
VariableContinuing education students
Academicextension
Fundamentaleducation
Occupationalextension
Source of incomeaav ,
Employment 46.3 57.1 58.4Parents 2.1 10.8 2.7Spouse 36.2 13.5 25.2Relative 0.7 2-,6 1.7Savings 8.0 6.8' 7.14
.Retirement 26.5 17.5 21.0Welfare 2.5 7.3 2.4Other
Parents provide over one -ball of support:
5.7 15,6 7.1
Yes 3.0 12;8'N-,-,,,
4.1NoTotal 1,
21.2 ILI _ILI16CGO100.0 100.0
(1274) (719) ( 4)
Head-of-bousehold:Father 5.7 16.8 , 7.6Mother 1,9 10.4 2.7Self 31.0, 44.6 42.8Spouse 56.7 20.5 40.5Other relativeOther.
1.9 3,8
__122
1.3x'5 3.1
Total 100.0 99.9 TorY(13011 (723) (2239)

Appendix Table 15 (continued)
VariableContinuing education gitudents
Academicextension
Fundamentaleducation
Occupationalextension
Hours worked/week:Less than 5 2.1 1.85-9 3.1
e61.5 2.2
10-19 2.1 2.1 2.720-29 3.6 6.0 3.6'30-39 7.8 10.6 6.840-49 27.7 34.8 38.150 or'more 2.6 4.4 5.2Not wage earner 21,2 38.0Total 99.9 100.0
_12..±1-00716
lages/bour:
(1329) (726) (2258)
Less than $3.00 8.1 23.2 9.3$3.00-3.49 7_6 , 14.7 8.7$3.50-3.99 6.67/ 7.3 7.7$4.00-4.49 M 4.1 4.8 5.5$4.50-4.99 2.8 2.9 6 4.4$5.00-5.99 6.4 5.4 7.2$6.00-6.99 4.1 1.8 4.8$7.00-8.99' 2.1 2.3 , 4,7-$9.00 or more 3.7 0.0 4.5Not:wage earner 112 37 5 43Total 99.9 99.9
...1
r06Tr(1268) .
(715) (2171)
2 --
4

Appendix Table 15 (continued)
Continuing education studeptsVariable Academic Fundamental
extension education
Plan to work in Nprtlikarolina after_
completing educational program:341,8Definitely yes __... 45.7
Don't knowThink so a S_
\ 'I--41.7
Th _-- L 20.815.1
Don't think so, 8.7 5,5Definitely not 3._3 7 13 0Total 16 1001
. (1266) (731)
.Occupational- extension
47.5.01 11.9
11.09.1
X20 51g0.0
(2159)
a$ultiple responses precluded totals.
co,4
U

.e
Appendix Table 16. Weightedenrolledprogram,
likariable
percedtage distributionpf continuing education studentsIn the North Carolinsi Mut unity College System, 1979, byhigh school avevirge, high school rank, .and GED sco4re
a
*coral/fang education' studentsAtadesic Fundamental Occupationale e ducat ionAtension extension
High school average:A
BC
Below C
23.0'517z13.6
1.0
3.22t,2
o, 33.65.8
r,18v3'46:121.0
1.6-Did not attend 10 -6 0 N 3Total 100.0
rucr(732 ,,,,191
(130'8) (721) / (2228)
High school rank:Upper i/3 of class 40.0 2.4 31.9Middle 1/3 of class 35.8 8,0 39.9Lower 1/3 of classDid not graduate 2222$.001
1.8
_11. 1
4.6,23,7
100.1100.0(1276) (712) (21681
GED score:Did not take 98.9 91,8 96,0225-20 0.9 2.4 3.1Less an Z25 ,0.2 8 0 9Total 100.0
_____,___5
100.0 100.0(1166) (696)i, (1933)
a

Appendix TJle 17. Weighted percentenrolled in theprogram, changewhile attending,
age distribution of continuing education studentsNorth Carolina Community College System, 1979, byin residence to attend, monthly rent, residenceand trips to class/week
Variable PIO
Continuing education studentsAcademicextension
Fedamentaleducation
Occupationalextension
Change in residence to attend:No, home countyCoNo, commute her countyYes, moved to attend.Yes, moved from out-of-stateYes, other reasons
88.18.50.5
(2):5.
82.26.41.90.97.7
;84.19.17°0.20.15..6
Yes, foreign student 0.5 1.0 0.4Total 100.2 100.1 . 100.1 40
(1330) (728) (2278)
Monthly, rent while attending:None 97.9 94.9 97.8.'$ 49 or leSs 0.5 2.6 0.5$ 50-99 0.2 1.8 0.6$100-149 0.3 0.4 0.2
$150-200 0.0 0,1 0.2$201 or moreTotal T04U MO GI 1__2,E0071
Residence _while attending:
(1335) (720) (2262)
Parents rAk 6.6 21.3 10.0'Spouse 65.2 35.0 61.7Children 4.7 6.4 4.511,
Relative 1.3 5.1 1.6
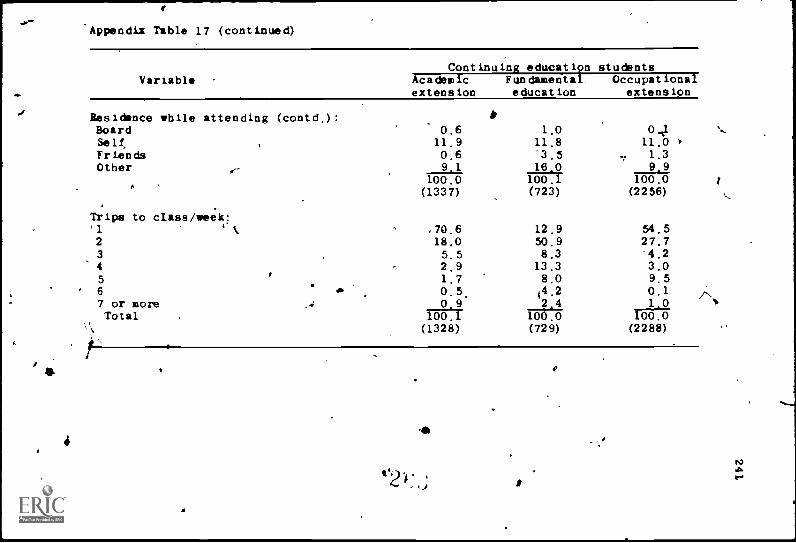
AY.
4.
'Appendix Table 17 (continued)
VariableContinuing education students
Academic Fundamental,extension education
Occupationalextension
Residence while attending (contd.): #Board 0.6 1.0 0.41 '....
Solt 11.9 11.8 11.0 +Friends 0.6 "3.5 ., 1.3Other -- 9.1 LEJil 9.9
,,
100.0 100.1 100.0 t
(1337) (723) (2256)....
Trips to class/week:'1 .70.6 12.9 54.52 18.0 50.9 27.73 5.5 8.3 '4.24 2.9 13.3 3.05 1.7 8.0 9.5
' 6
7 or moreTotal
411. 0.5,
210-2
(4.22 4
0.1
LI100. 1 loo.o 1-66:6
(1328) (729) (2288)
4
4
'a
S
Nrr

Appendix Table 18. Weighted percentage distribution ot.continuing education studentsenrolled in the North Carolini Community College System, 1979, byprogram, hours in class /week, classes this quarter, and quartersenrolled
VariableContinuing education students
Academic Fundamental Occupationalextension education extension
Hours in class/week1-56-1411-1516-2021-2526-3031 or moreTotal
Classes this quarter:1
234
5
67 or more
'Total
75.916.543.22.60.20.8
I00.1(1335)
87.78.32.90.70.3
.010 .0
(1276)
Quarters enrolled:1 4,41I , 31.42 41., A 16:73 15.8,
r
I
34.842.013.73.90.81,8
80.328.23.7'3.51.20.9
3,1100.1
__Z.1MCI(726) (2266)
80.6 90.010.6 7.64.7 1.03.8 0.30.2
0.96
'to
0.1 0.10 # 0,1
100.0 100.0(705) (2208) .=
39.218.512'.8

Appendix Table 18 (cosibtuld)
VariableContinuing education students
Agadismicextension
Fundamentaleducation
Occupationalextension
Quarters enrolled contd.) :4
56
'7
Total \4".
8.85.24.72.42.5
_ILI100.0(1312)
a-..
8,46004.4'1.81.6.
7.13.73.71.51,9 ,
__LI100.1(2249)
__ILAfifitG1
, (721)
4g
15c

Appendix Table 19. Institutional charact ristics that most iafluenced continuingeducation students to nroll in the North Carolina CoamunityCollege System, 1979, y program, rank order (RO) of responses,and raw scores (RS)a
Institutional chafficteristicContinuing education students
/-Academic Fundamental Occupationalextension education extension
;317- RO RSb RO RSb
Educational prograas or courses available 1 86.51 1 51.35 1 192.23
Financial assistance available 8 5.51 9 8.54 8 21.99
Job placement services 9 4.10 8 10.67 9/ 21.72
tLocation (nearness to home or work) 2 78.83 2 42.20 2 173.66
Low cost . 3 67:70" 3 28.15 3 141.17
Open-door admissions policy 6 25.44 5 18.25 6 48.89
Quality of instruction *11 4 58.04 4 22.93 ' 4 109.40
Student-centered instruction and 7 21.58 7 12.51 7 35.83activities
Other reasons 5 26.30 6 14.37 5 55I
aRS (1,:aw score) is the Weighted frequency times the converted rank value; eachfirst chorce ult.iplied by 5, each second by 4, each third by 3, and so on.
b Rat score values are in tens of thousands.,