DSD-INT2016 Mathematical modeling of the influence of a navigable sea channel in the Northern part...
26
ОПЫТ ПОСТРОЕНИЯ СПЕЦИАЛИЗИРОВАННЫХ ИНФОРМАЦИОННЫХ СИСТЕМ (СИАС).… 1 Modelling.… Mathematical modeling of the influence of a navigable sea channel in the Northern part of the Gulf of Ob on the hydrodynamic and thermohaline regime of the Ob estuary Boris Arkhipov, Russian Academy of Sciences, Russia
-
Upload
delftsoftwaredays -
Category
Software
-
view
35 -
download
0
Transcript of DSD-INT2016 Mathematical modeling of the influence of a navigable sea channel in the Northern part...

ОПЫТ ПОСТРОЕНИЯ СПЕЦИАЛИЗИРОВАННЫХ ИНФОРМАЦИОННЫХ СИСТЕМ (СИАС).…
1
Modelling.…
Mathematical modeling of the influence of a navigable
sea channel in the Northern part of the Gulf of Ob on the
hydrodynamic and thermohaline regime of the Ob
estuary
Boris Arkhipov, Russian Academy of Sciences, Russia

ОПЫТ ПОСТРОЕНИЯ СПЕЦИАЛИЗИРОВАННЫХ ИНФОРМАЦИОННЫХ СИСТЕМ (СИАС).…
2
Modelling.…
Research team
Arkhipov B. V. RAS, manual, calculation,
report
Solbakov V. V. RAS, calculation,
Shapochkin D. A. RAS calculation,
Stanovova, A.V., VNIRO, data preparation
Panchenko E. D., MGU data preparation
Lumens, M. H., MGU, data preparation
Fingert, E. A., MGU, data preparation
Consultants: Knizhnikov A. Yu. Head of
Russian part of WWF(World Wildlife Fund)
Alabyan, A. M. MGU
Fig.2. Map of the Kara sea
Fig.1. Location of the sea channel in the Northern
part of the Gulf of Ob (length 50 km, width 400 m,
average depth 4-5m)

ОПЫТ ПОСТРОЕНИЯ СПЕЦИАЛИЗИРОВАННЫХ ИНФОРМАЦИОННЫХ СИСТЕМ (СИАС).…
3
Modelling.…
Spatial area and
time interval of
simulation
Hydro-
physical
processes
Computer model,
approximation,
technology, recourses
Input data
?
Fig.3. The various components of the modeling process
.
When addressing the
impact of the channel
on the intrusion of
salinity inside the Gulf
of Ob, the researcher is
faced with several
questions, requirements
and constraints within
which it needs to make
a decision.
The first of these problems is the choice of mathematical and computer models.
For the simulation was used a Delft3D three-dimensional model of the hydrodynamic and
thermohaline processes. Previously were used different models to study processes in the Kara sea
and the bays, as developed by the authors of this work and other specialists (particulary model of
Princeton University – POM). At this stage, Delft3D was chosen for the following reasons: high
technology (detailed development of pre and post processing, good interface, graphical
representation of results, etc.), ability to use different coordinate systems (Cartesian, spherical), the
possibility of considering different approaches for the approximation of vertical coordinates (σ –
system, z – system), different models of vertical turbulent mixing, etc. The developers have kindly
given us a license and we started modeling

ОПЫТ ПОСТРОЕНИЯ СПЕЦИАЛИЗИРОВАННЫХ ИНФОРМАЦИОННЫХ СИСТЕМ (СИАС).…
4
Modelling.…
Fig.4.
1) minimum local area: the Northern boundary
runs along the Cape Drovyanoy, South border is South
of the channel, for example in the area of Tambey,
2) local area: North border passes through Cape
Drovyanoy, South and Eastern boundaries are held in
the mouth areas of the rivers (the Ob, Taz)
3) global scope, covering various parts of the
Kara sea,
4) combination of local and global regions.
1001
80
x мt с
мgHс
the Courant condition

ОПЫТ ПОСТРОЕНИЯ СПЕЦИАЛИЗИРОВАННЫХ ИНФОРМАЦИОННЫХ СИСТЕМ (СИАС).…
5
Modelling.…
Data
The databank (DB) was created for the determining of BC and verification. DB is created
on the basis of public sources and consists of the following parts.
1) DB "Rivers" for river discharge from the Ob, Nadym, Pur, Taz, Yenisei, Pyasina. Data
sources for the database "River“ (a) Reference books, Hydrological annual editions,
other published materials, (b) Data Bank ArcticRIMS http://rims.unh.edu/ , c) Data
Bank https://gmvo.skniivh.ru, etc.
2) the DB "Hydrology" in salinity and temperature, sea level and currents of the Gulf of
Ob and the Kara sea. Sources of data include:
a) The Levitus data Bank
b) Various publications, journal articles, handbooks, reports and descriptions of
expeditions, etc.,.
3) the DB "Meteo" – meteo data.
a) GMS (Bugrino, Varandey, Maresale island Golomyanny, Dixon, Ust-Port, Tambey, a Wood
Cape, Cape Stone, 60 let VLKSM, Seyakha, Talibiyah, Vorkuta, Salekhard).
b) Open databases of the World's centers of the weather (Data Bank ArcticRIMS;The European
Centre for Medium-range Weather Forecasts NCEP).
c) Receive wind and meteorological data from weather maps, which in particular contain the
pressure field in the form of isobars

ОПЫТ ПОСТРОЕНИЯ СПЕЦИАЛИЗИРОВАННЫХ ИНФОРМАЦИОННЫХ СИСТЕМ (СИАС).…
6
Modelling.…
The work is divided into two stages. The first
phase involves the model verification. The
second stage consists of prognostic calculations
of the intrusion of salinity in the Ob Bay with a
navigable channel and without it.
For verification were selected time frames:
1st time interval, covers the expedition of RV "Dmitry Mendeleev" from 15 August
to 15 October 1993 (nineteen ninety-third year),
The 2nd time interval, covers the expedition of RV "Ivan Kireyev" from 8
September to 7 October 2005 (two thousand fifth year)
3rd time interval, covers the expedition of NIS OTA_777 in the period from 29 July
to 17 August 2010 and 18 September 7, 2010 (two thousand and tenth year)
4-th time interval covers the period of setting the ABS to measure currents in the
summer and autumn months of 2012 (AARI).
For carrying out predictive calculations, we have analyzed the flow of rivers
from 1936 to 2012. Some years was selected as "extreme" with minimal flow. Was
additionally carried out calculations with the combination of minimum flows and
storm surge. The approach gave estimations of the penetration of salinity without
the channel and with channel possible 1 in every 50 - 100 years.

ОПЫТ ПОСТРОЕНИЯ СПЕЦИАЛИЗИРОВАННЫХ ИНФОРМАЦИОННЫХ СИСТЕМ (СИАС).…
7
Modelling.…
The comparison of simulation results with currents observations of AARI
(September 2012) in the area of Sabetta
-1
-0.8
-0.6
-0.4
-0.2
0
0.2
0.4
0.6
0.8
1
-1 -0.5 0 0.5 1
-1
-0.75
-0.5
-0.25
0
0.25
0.5
0.75
1
-1 -0.75 -0.5 -0.25 0 0.25 0.5 0.75 1
Tidal
harmonic
u v
Obs Mod Obs Mod
K1 0.05 0.07 0.02 0.08
O1 0.03 0.03 0.03 0.03
P1 0.02 0.03 0.02 0.03
Q1 0.02 0.02 0.03 0.03
K2 0.06 0.05 0.05 0.06
M2 0.25 0.29 0.29 0.40
N2 0.01 0.03 0.03 0.04
S2 0.08 0.04 0.13 0.06
Модуль
00.2
0.4
0.6
0.8
1
14.8
15.8
16.8
17.8
18.8
19.8
20.8
21.8
22.8
23.8
24.8
25.8
26.8
27.8
28.8
29.8
30.8
31.8
1.9
2.9
3.9
4.9
5.9
6.9
7.9
8.9
9.9
10.9
11.9
12.9
13.9
14.9
15.9
16.9
17.9
18.9
19.9
20.9
21.9
22.9
23.9
24.9
25.9
26.9
27.9
28.9
29.9
30.9
1.1
0
Дата
Ско
ро
сть
теч
ен
ий
, м
/с
Наблюдения Модель
Fig. 5. Comparison of the non-tidal component of the
current velocities station 17797 horizon -2,2 m, a, b
– components in the module

ОПЫТ ПОСТРОЕНИЯ СПЕЦИАЛИЗИРОВАННЫХ ИНФОРМАЦИОННЫХ СИСТЕМ (СИАС).…
8
Modelling.…
The scientific expedition 49 of the RV “Dmitry Mendeleev” from 15 August to 15
October 1993 (IO RAS)
Fig.7. Map of Stations, of 49 expedition of the RV “Dmitry Mendeleev”
from 15 August to 15 October 1993 (Gordeev V, Beeskow B., Rachold V.
Geochemistry of the Ob and Yenisey Estuaries: A Comparative Study. Die
"Berichte zur Polar- und Meeresforschung“, 565/2007 )
Fig. 6. Contours of salinity on the longitudinal
section of the Northern part of the Gulf of Ob
19-27 September 1993 (Bourenkov, Vasilkov,
1994)
ОПЫТ ПОСТРОЕНИЯ СПЕЦИАЛИЗИРОВАННЫХ ИНФОРМАЦИОННЫХ СИСТЕМ (СИАС).…
9
Modelling.…
72ºN 71ºN 70ºN 69ºN 68ºN
Тамбей
Fig. 8. Comparison of fields of salinity on the section along the Gulf of Ob was obtained
in 49 voyage of RV “Dmitry Mendeleev” in the simulation on thin curvilinear grid with
cell size 110m (b) (near Tambey a value of about 9 psu).
Comparison of observation and simulation for the 49 expedition of the RV “Dmitry Mendeleev” from 15
August to 15 October 1993 (Bourenkov, Vasilkov, 1994)
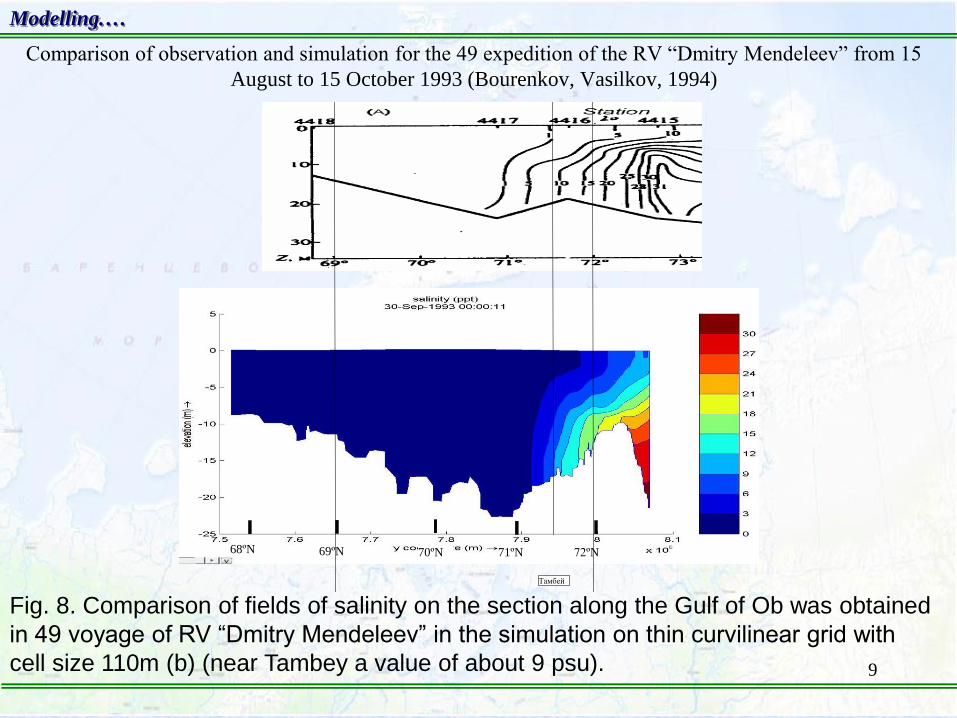
ОПЫТ ПОСТРОЕНИЯ СПЕЦИАЛИЗИРОВАННЫХ ИНФОРМАЦИОННЫХ СИСТЕМ (СИАС).…
10
Modelling.…
The scientific expedition of RV OTA_777 (OAO "southern shipping company")
29 July (clearing from ice, flood period) to 17 August and from 18 September to 7
October (autumn period of low water, the beginning of freezing) 2010.
Fig.9. The distribution of salinity in surface and bottom layer in summer polovodny
period: a,b - from 29 July to 17 August 2010,Mr. from 18 September to 7 October,
2010, d – cut in the same periods [S. A. Lapin, 2011, Okeanologiya, 2011, Vol. 51,
No. 6, pp. 984-993. Hydrological Characterization of the Ob’ Inlet in the Summer and
Autumn Seasons ]
а б в г
д

ОПЫТ ПОСТРОЕНИЯ СПЕЦИАЛИЗИРОВАННЫХ ИНФОРМАЦИОННЫХ СИСТЕМ (СИАС).…
11
Modelling.…
72ºN
71ºN
70ºN
69ºN
68ºN м. Каменный
Сеяха
Тамбей
Новый
Порт
Яптиксале м. Трехбугорный
Fig. 10. Comparison of fields of salinity on the section along the Gulf of Ob
obtained in the expedition of 2010 of NIS OTA_777 (a) and in simulation on
curvilinear grid of 40×112 with a minimum width of 1 cell is 460 m .
72ºN 71ºN 70ºN 69ºN 68ºN
27-Sept-2010 00:00:00
а
б

ОПЫТ ПОСТРОЕНИЯ СПЕЦИАЛИЗИРОВАННЫХ ИНФОРМАЦИОННЫХ СИСТЕМ (СИАС).…
12
Modelling.…
Fig. 11. Comparison of currents outside of the channel (point 23.90) and inside the
channel (point 23,70, depth of 14m) in the calculations on the fine curvilinear grid. At
point (of 23.90) located outside of the channel hodograph velocity has an ellipsoidal
shape. At point (23,70), located within the channel, the velocity is mainly directed to
the North-South, and the hodograph of the velocity has a linear form.
100 см/сек
10 см/сек
100 см/сек

ОПЫТ ПОСТРОЕНИЯ СПЕЦИАЛИЗИРОВАННЫХ ИНФОРМАЦИОННЫХ СИСТЕМ (СИАС).…
13
Modelling.…
THE RESULTS OF THE FORECAST (SCENARIO) MODELING
Fig.12. Runoff from 1936 to 2012 have been considered. A comparison of the total
runoff (Ob, Nadym, Pur, taz) of 1956 to the runoff of the 1967, 1968, 1969гг (a), 1969
to the runoff of the 1970, 1971, 1972 (b), 1973, 1974, 1975 (c) 1976, 1977, 1978(d)

ОПЫТ ПОСТРОЕНИЯ СПЕЦИАЛИЗИРОВАННЫХ ИНФОРМАЦИОННЫХ СИСТЕМ (СИАС).…
14
Modelling.…
Fig. 13. The dependence of runoff for the interval from March 1 to may 20 from
minimum flow rate

ОПЫТ ПОСТРОЕНИЯ СПЕЦИАЛИЗИРОВАННЫХ ИНФОРМАЦИОННЫХ СИСТЕМ (СИАС).…
15
Modelling.…
72ºN
71ºN
70ºN
69ºN
68ºN м. Каменный
Сеяха
Тамбей
Новый
Порт
Яптиксале м. Трехбугорный
Fig.14. The distribution of salinity in the section along the Gulf of Ob in pre-flood
period of 1969 without the channel according to the simulation on the fine
curvilinear grid 48×130 with a width of 1 cell in the region of the trench 110 m wide
trench 440m (4 cell)
72ºN 71ºN 70ºN 69ºN 68ºN
72ºN 71ºN 70ºN 69ºN 68ºN

ОПЫТ ПОСТРОЕНИЯ СПЕЦИАЛИЗИРОВАННЫХ ИНФОРМАЦИОННЫХ СИСТЕМ (СИАС).…
16
Modelling.…
72ºN
71ºN
70ºN
69ºN
68ºN м. Каменный
Сеяха
Тамбей
Новый
Порт
Яптиксале м. Трехбугорный
Fig.15. The distribution of salinity in the section along the Gulf of Ob in pre-flood
period of 1969 with the channel according to the simulation on the fine
curvilinear grid 48×130 with a width of 1 cell in the region of the trench 110 m
wide trench 440m (4 cell)
72ºN 71ºN 70ºN 69ºN 68ºN
72ºN 71ºN 70ºN 69ºN 68ºN

ОПЫТ ПОСТРОЕНИЯ СПЕЦИАЛИЗИРОВАННЫХ ИНФОРМАЦИОННЫХ СИСТЕМ (СИАС).…
17
Modelling.…
72ºN
71ºN
70ºN
69ºN
68ºN м. Каменный
Сеяха
Тамбей
Новый
Порт
Яптиксале м. Трехбугорный
Fig. 16. The distribution of salinity in the section along the Gulf of Ob in the flood
period of 1969 without the channel according to the simulation on the fine
curvilinear grid 48×130 with a width of 1 cell in the region of the trench 110 m wide
trench 440m (4 cell)
72ºN 71ºN 70ºN 69ºN 68ºN
72ºN 71ºN 70ºN 69ºN 68ºN

ОПЫТ ПОСТРОЕНИЯ СПЕЦИАЛИЗИРОВАННЫХ ИНФОРМАЦИОННЫХ СИСТЕМ (СИАС).…
18
Modelling.…
72ºN
71ºN
70ºN
69ºN
68ºN м. Каменный
Сеяха
Тамбей
Новый
Порт
Яптиксале м. Трехбугорный
Fig. 17. The distribution of salinity in the section along the Gulf of Ob in the flood
period of 1969 with the channel according to the simulation on the fine curvilinear
grid 48×130 with a width of 1 cell in the region of the trench 110 m wide trench 440m
(4 cell)
72ºN 71ºN 70ºN 69ºN 68ºN
72ºN 71ºN 70ºN 69ºN 68ºN

ОПЫТ ПОСТРОЕНИЯ СПЕЦИАЛИЗИРОВАННЫХ ИНФОРМАЦИОННЫХ СИСТЕМ (СИАС).…
19
Modelling.…
Pre flood (spring) Post flood (summer, autumn)
1 psu 2 psu 3 psu 10 psu 18psu 1 psu 2 psu 3 psu 10 psu 18psu
coarse curvilinear mesh 40×112 with a width of 1 cell in region the trench 460 m
trench width 1380 m (3 cells)
1 psu 2 psu 3 psu 10 psu 18psu 1 psu 2 psu 3 psu 10 psu 18psu
1969 8 12 15 50 37 20 17 25 34 36
a thin curvilinear mesh with number of cells 48×130, with the width of 1 cell in region the
trench 110, the trench width 440m (4 cell)
1 psu 2 psu 3 psu 10 psu 18psu 1 psu 2 psu 3 psu 10 psu 18psu
1969 8 5 5 8 11
Table 4. The increase in distance (km) of intrusion of salinity at the onset of channel

ОПЫТ ПОСТРОЕНИЯ СПЕЦИАЛИЗИРОВАННЫХ ИНФОРМАЦИОННЫХ СИСТЕМ (СИАС).…
20
Modelling.…
Table 2. Position (km) of salinity isolines, obtained in the calculations,
possible one at fifty or one at hundred years
72ºN
71ºN
70ºN
69ºN
68ºN м. Каменный
Сеяха
Тамбей
Новый
Порт
Яптиксале м. Трехбугорный
Pre flood (spring)
With out surge With surge
With out
channel
With
channe
l
With
out
channel
With channel
196
9
coarse curvilinear mesh 40×112 with a width of 1 cell in
region the trench 460 m trench width 1380 m (3 cells)
1
psu
7620 7612 7580 (68.6 ºN, south cape
Kamennyi) 7572
2
psu
7735 7723 7666 (68.8ºN south cape
Trehbugornyi) 7653
3
psu
7755 7740 7689 7666 (69ºN cape
Trehbugornyi) 7675
10
psu
7844 7794 7781 (70ºN south Seyaha)
7766
18
psu
7977 7940 7910 (north Seyaha,
71,1ºN)
7896

ОПЫТ ПОСТРОЕНИЯ СПЕЦИАЛИЗИРОВАННЫХ ИНФОРМАЦИОННЫХ СИСТЕМ (СИАС).…
21
Modelling.…
Pre flood (spring) Post flood (summer, autumn)
With out surge With surge
With out channel With channel With out channel With channel With out channel With channel
1969 a thin curvilinear mesh with number of cells 48×130, with the width of 1 cell in region
the trench 110, the trench width 440m (4 cell)
1 psu 7611.5
7609
2 psu 7722 7717
3 psu 7745 7740
10 psu 7788 7780
18 psu 7945 7934
Table 3. Intrusion distance (km) salinity based on the calculation results (fine mesh 1969)

ОПЫТ ПОСТРОЕНИЯ СПЕЦИАЛИЗИРОВАННЫХ ИНФОРМАЦИОННЫХ СИСТЕМ (СИАС).…
22
Modelling.…
Вынос соли
-8.0E+11
-6.0E+11
-4.0E+11
-2.0E+11
0.0E+00
2.0E+11
4.0E+11
6.0E+11
8.0E+11
01
.01
08
.01
15
.01
22
.01
29
.01
05
.02
12
.02
19
.02
26
.02
05
.03
12
.03
19
.03
26
.03
02
.04
09
.04
16
.04
23
.04
30
.04
07
.05
14
.05
21
.05
28
.05
04
.06
11
.06
18
.06
25
.06
02
.07
09
.07
16
.07
23
.07
30
.07
06
.08
13
.08
20
.08
27
.08
03
.09
Дата
М, кг
без траншеи
с траншеей
Вынос соли
-6.5E+11
-6.3E+11
-6.1E+11
-5.9E+11
-5.7E+11
-5.5E+11
-5.3E+11
-5.1E+11
01.0
4
08.0
4
15.0
4
22.0
4
29.0
4
Дата
М, кг
без траншеи
с траншеей
Вынос соли
7.0E+11
7.1E+11
7.2E+11
7.3E+11
7.4E+11
7.5E+11
7.6E+11
7.7E+11
7.8E+11
15
.07
22
.07
29
.07
05
.08
12
.08
Дата
М, кг
без траншеи
с траншеей
Fig. 18. Integrated advective
arrival/departure of salinity
through the cross sectional
area of bar
ОПЫТ ПОСТРОЕНИЯ СПЕЦИАЛИЗИРОВАННЫХ ИНФОРМАЦИОННЫХ СИСТЕМ (СИАС).…
23
Modelling.…
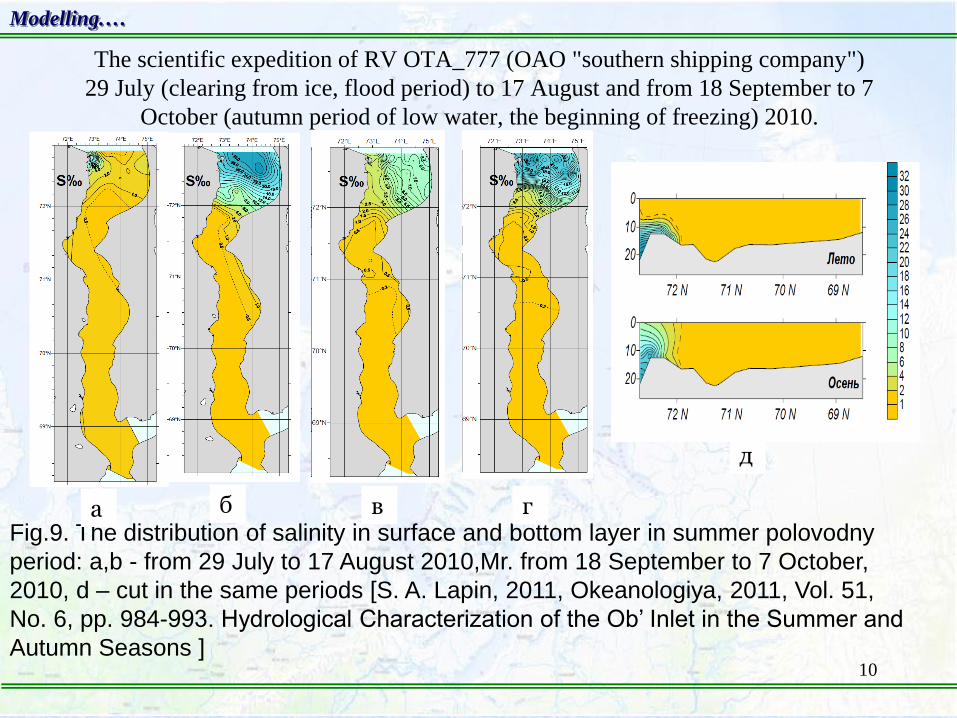
Conclusions
1. Conducted verification calculations of the process of intrusion of salinity in
the Ob Bay for the period of the 49 flight of the RV “Dmitry Mendeleev” 15 August to
15 October 1993 . for the period of the expedition of RV "Ivan Kireyev" from 8
September to 7 October 2005, [3], for the expedition of NIS OTA_777 in the period
of September 18-October 7, 2010, in the period August –September 2012[4,6],
setting of ABS in the Northern part of the Gulf of Ob for the measurement of
currents.
2. Verification calculations were conducted on 2 grids: curvilinear mesh of
39×74, the width of 1 cell in the field of 703m trench, trench 2 cells, the width of the
trench 1407м; curvilinear grid 48×93, the width of 1 cell in the region of the trench
110, the trench 4 of the cell, the trench width 449м. A comparison is conducted of
the calculated data for the two networks. The results showed some stability during
the transition from coarser to finer grid. The range of penetration of salt in the
calculations on coarse grid more than the calculations on a fine grid.
Results shows not bad coincidence of calculations with observations.

ОПЫТ ПОСТРОЕНИЯ СПЕЦИАЛИЗИРОВАННЫХ ИНФОРМАЦИОННЫХ СИСТЕМ (СИАС).…
24
Modelling.…
4. A comparison is coducted of the data obtained in the variants without
channel to channel. The results show on the rough curvilinear grid with cell size
703m and channel width 1407м contour psu 3 moves inward of the bay by about
50 km, and the salinity in the area of Tambey growth of 5-6 psu. Thin curvilinear
grid with a minimum cell size of 110m and width of the channel 440m contour psu
3 moves inward of the bay by about 2-5 km, and the salinity in the area of Tambey
increases to 3-4 psu. I.e. the effect of the channel has decreased in 2-2,5 times
with the decrease of its width by 3-4 times.
5.The calculations show that the main factors influencing the penetration of
salinity in the Ob Bay, are the river flow and wind surge from the Kara sea and
also, to a lesser extent, tide. The most deep penetration of salinity inside of the
bay occurs when there are the combination of minimum rivers flows and surges
from the Kara sea. Other factors such as thermal processes, the formation and
melting of ice, the water exchange through the sea surface although providing
some additional influence, but are of secondary importance.

ОПЫТ ПОСТРОЕНИЯ СПЕЦИАЛИЗИРОВАННЫХ ИНФОРМАЦИОННЫХ СИСТЕМ (СИАС).…
25
Modelling.…
7. For the scenario (prognostic) analysis, the total runoff of the main rivers (the Ob,
Nadym, PUR, Taz) for the period from 1936 to 2012. Based on this analysis, selected key
years (candidates to the extreme), in terms of minimum runoff in such years are 1956 and
1969гг, and from the point of view of the minimum flow 1954. For these years, as for several
others, have carried out calculations of the penetration of salinity in the Ob Bay.
8. From the results of the scenario (forecast) calculations follows that in pre flood (spring)
period maximum penetration of salinity due to the river flow fluctuations occur in 1969. It
is seen that in normal conditions (no channel), 1 psu contour is located on the coordinate 7620
km (68.5 ºC.Sh., 20km North of M. Stone), 3 psu – 7755км (69,7 ºC.Sh. 10km to the North of
Yaptiksale), and 10 psu – 7844км (70.6 per ºC.Sh. 40km North Seyahi). The appearance of the
channel in the calculations on coarse grid shifts to the South the contour 1 psu on 7-18 km 3
psu – 8 - 15 km and 10 psu – 9 - 57км depending on the year. In the calculations on a fine grid
shift decreases and reaches a maximum for 1 psu – 10 km, 3 psu – 5 km, 10 psu – 12 km, 18
psu 11 km. From the results it follows that the farther from the channel region is the contour,
the less affected by his influence.
9. Calculations of salt water intrusion in 1969 in a joint account runoff and surges show
that the contour 1 psu was on the coordinate 7580км (without the channel) and 7572км
(channel) (68.6 ºC.Sh., 20-30 km South cape Stone), 3 psu – 7689 (without the channel) and
7675км (channel) (69,2 ºN cape Trehbugornyi), 10 psu – 7781 (without the channel) and
7766км (with channel) (70,2 ºN Seyakha), 18psu - 7910 (no channel) and 7896км (channel)
(71,1 ºN). These distances can be taken as an estimate of penetration of salinity in the Ob Bay
in the presence of channel possible one in every 50 - 100 years.

ОПЫТ ПОСТРОЕНИЯ СПЕЦИАЛИЗИРОВАННЫХ ИНФОРМАЦИОННЫХ СИСТЕМ (СИАС).…
26
Modelling.…
10. Comparison of results of calculations of integral receipt of salinity inside the
Gulf of Ob to the channel without the channel provides that the construction of the
channel leads to an increase in revenues of salinity inside the Gulf of Ob by about
5%, the duration of the period of time exceeding the maximum value of the
background state is approximately two weeks.
11. From the results pertaining to the flood period, it follows that when the
increase in flow of salt water pushed into the bar area (and bar) in the presence of
channel as well as in its absence, i.e. any accumulation of salty waters in southern
areas of the Ob Bay is not happening. The system behaves like a "coarse" dynamic
system: when you change a parameter there is a shift in balance, but a qualitative
restructuring of the system occurs.