Drying Characteristics of Saskatoon Berries under Microwave and
141
Drying Characteristics of Saskatoon Berries under Microwave and Combined Microwave-Convection Heating A Thesis Submitted to the College of Graduate Studies and Research in Fulfillment of the Requirements for the Degree of Master of Science in the Department of Agricultural and Bioresource Engineering, University of Saskatchewan, Saskatoon. Thesis Submitted By Lakshminarayana Reddy © Lakshminarayana Reddy, All rights reserved. March 2006.
Transcript of Drying Characteristics of Saskatoon Berries under Microwave and

Drying Characteristics of Saskatoon Berries under
Microwave and Combined Microwave-Convection Heating
A Thesis Submitted to the
College of Graduate Studies and Research
in Fulfillment of the Requirements for the
Degree of Master of Science
in the Department of Agricultural and
Bioresource Engineering,
University of Saskatchewan, Saskatoon.
Thesis Submitted By
Lakshminarayana Reddy
© Lakshminarayana Reddy, All rights reserved. March 2006.

i
PERMISSION TO USE
In presenting this thesis in partial fulfillment of the requirements for a
postgraduate degree from the University of Saskatchewan, I agree that the
Libraries of this University may make it freely available for inspection. I further
agree that permission for copying of this thesis in any manner, in whole or in part,
for scholarly purposes may be granted by the professor or professors who
supervised my thesis work or, in their absence, by the Head of the Department or
Dean of the College in which my thesis work was done. It is understood that any
copying or publication or use of this thesis or parts thereof for financial gain shall
not be allowed without my written permission. It is also understood that due
recognition shall be given to me and to the University of Saskatchewan in any
scholarly use which may be made of any material in my thesis.
Requests for permission to copy or to make other use of material in this thesis in
whole or in part should be addressed to:
Head of the Department
Department of Agricultural and Bioresource Engineering
57 Campus Drive
University of Saskatchewan
Saskatoon, Saskatchewan S7N5A9

ii
DEDICATION
Dedicated to my lovable Amma (mother)

iii
ACKNOWLEDGEMENT
I thank my parents, brothers and all family members for their support.
My thanks to all, who inspired and helped me in fulfilling the thought of pursuing
M. Sc. education abroad. Mr. Ramachandra, Dr. Ranganna and dearest friends
Arun and Nagaraj for their moral support.
My special thanks to my supervisor Dr. Meda, who has been a mentor and has
supported right through the M. Sc. program.
I thank Dr. Panigrahi for his financial assistance and his constant support.
Mr. Wayne Morley was instrumental in technically guiding in the electronics
assembly and development of the microwave drying system. My special thanks
to him.
I thank Mrs. Grace Whittington, Riverbend plantations, for providing us with
saskatoon berries for the research work.
My thanks to all the graduate advisory committee members who have constantly
helped in framing the research study.
Thanks to Mr. Bill Crerar and Mr. Louis Roth for helping in instrumentation work.
Finally, thanks to all my co-graduate students and Department of Agricultural and
Bioresource Engineering.
Special thanks to all the members of saskatoon kannada community for making
me feel this place the same as home.
Thanks to NSERC and Department of Agricultural and Bioresource for funding.
iv
ABSTRACT
The study on dehydration of frozen saskatoon berries and the need for dried
fruits has been strategically identified in the prairies. Our motivation was to find a
suitable method for dehydration in order to extend saskatoon berry shelf life for
preservation. Microwave, convection and microwave-convection combination
drying processes were identified to finish-dry saskatoon berries after osmotic
dehydration using sucrose and high fructose corn syrup (HFCS) sugar solutions.
Osmotic dehydration removes moisture in small quantities and also introduces
solutes into the fruit that acts as a preservative and also reduces the total drying
time.
Due to the very short harvesting season of saskatoon berries, an accelerated
process like microwave combination drying can bring down the moisture to safe
storage level, immediately after harvest. Untreated and osmotically dehydrated
berries were subjected to convection (control), microwave and microwave-
convection combination drying conditions at different product drying
temperatures (60, 70 and 800C) until final moisture content was 25% dry basis. A
laboratory-scale microwave combination dryer was developed, built with
temperature and moisture loss data acquisition systems using LabView 6i
software. Thin-layer cross flow dryer was used for convection-only drying and for
comparison.
Drying kinetics of the drying processes were studied and curve fitting with five
empirical equations including Page equation, was carried to determine drying
constant, R2 and standard error values. The microwave-combination drying
method proved to be the best for drying saskatoon berries. Dehydrated product
quality analysis by means of color changes, rehydration ratio measurements and
observed structural changes with scanning electron microscope technique were
the factors in drying method selection for saskatoon berries.

v
This research was instrumental in the modification and development of a novel
drying system for high-moisture agricultural materials. Microwave-convection
combination drying at 70oC, yields good results with higher drying rates and
better end-product quality.

vi
TABLE OF CONTENTS
PERMISSION TO USE ---------------------------------------------------------------------------i
DEDICATION--------------------------------------------------------------------------------------- ii
ACKNOWLEDGEMENT ------------------------------------------------------------------------ iii
ABSTRACT ---------------------------------------------------------------------------------------- iv
TABLE OF CONTENTS ------------------------------------------------------------------------ vi
LIST OF TABLES----------------------------------------------------------------------------------x
LIST OF FIGURES------------------------------------------------------------------------------- xi
LIST OF SYMBOLS AND GLOSSARY ---------------------------------------------------- xv
CHAPTER I - INTRODUCTION----------------------------------------------------------------1
1.1 Introduction----------------------------------------------------------------------------------1
1.2 Objectives -----------------------------------------------------------------------------------3
CHAPTER II – LITERATURE REVIEW------------------------------------------------------4
2.1. Saskatoon Berries ------------------------------------------------------------------------4
2.1.1. Fruit Composition -------------------------------------------------------------------6
2.1.2. Production and Post-harvest Technology -------------------------------------8
2.1.3. Freezing vs. Drying --------------------------------------------------------------- 11
2.2 Fruit Pretreatment ----------------------------------------------------------------------- 12
2.2.1. Chemical Pretreatment ---------------------------------------------------------- 13
2.2.2 Osmotic Dehydration-------------------------------------------------------------- 13
2.3 Fruit Preservation Techniques ------------------------------------------------------- 16
2.3.1 Dehydration / Drying -------------------------------------------------------------- 16
2.3.2 Introduction to Agri-Food Material Drying ------------------------------------ 17
2.4 Electrical Properties of Foods -------------------------------------------------------- 18
2.4.1 General Principles – Dielectric Properties ----------------------------------- 19
2.4.2 Influence of Moisture Content--------------------------------------------------- 21
2.4.3 Influence of Density --------------------------------------------------------------- 22
2.4.4 Influence of Temperature -------------------------------------------------------- 22
2.4.5 Importance of Dielectric Properties -------------------------------------------- 22

vii
2.4.6 Dielectric Measuring Systems -------------------------------------------------- 23
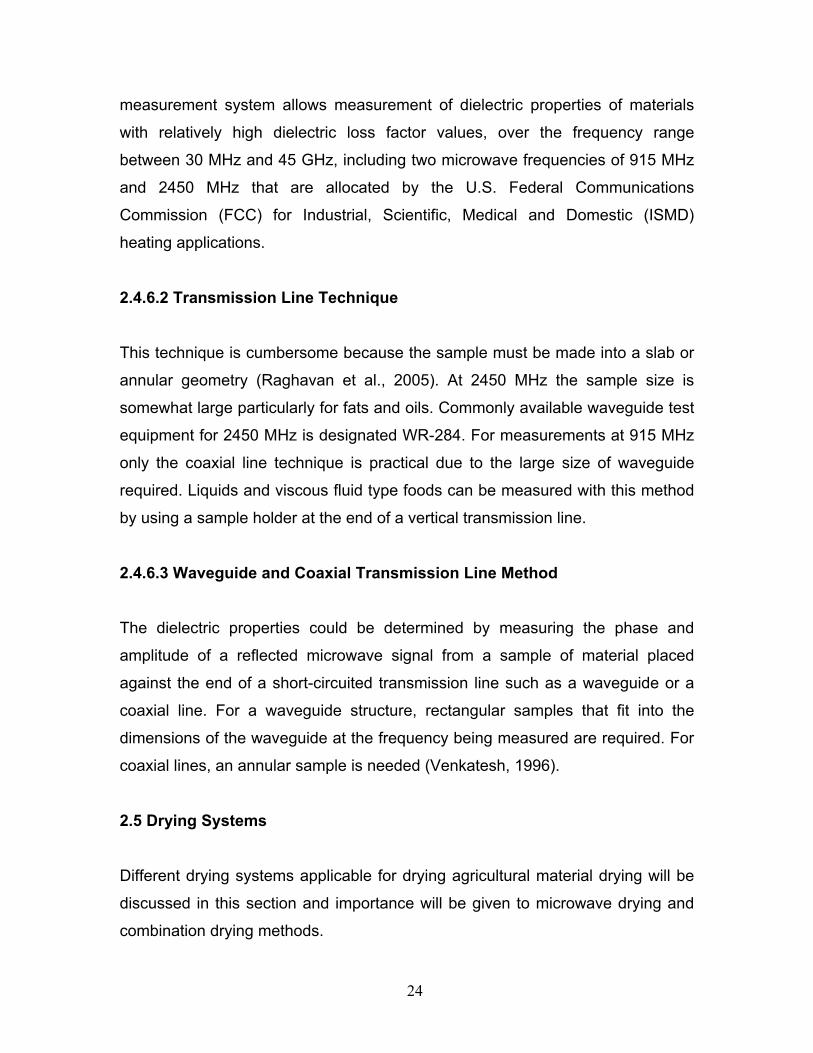
2.5 Drying Systems -------------------------------------------------------------------------- 24
2.5.1 Hot-air Drying ----------------------------------------------------------------------- 25
2.5.2 Cabinet Dryers---------------------------------------------------------------------- 25
2.5.3 Tunnel Dryers ----------------------------------------------------------------------- 25
2.5.4 Microwave Heating ---------------------------------------------------------------- 26
2.5.5 Infrared Drying ---------------------------------------------------------------------- 28
2.5.6 Microwave-Hot-Air Combination Drying -------------------------------------- 29
2.5.7 Microwave-Infrared Drying------------------------------------------------------- 30
2.5.8 Microwave-Vacuum Drying ------------------------------------------------------ 30
2.5.9 Freeze Drying ----------------------------------------------------------------------- 30
2.6 End-product Quality Analysis--------------------------------------------------------- 31
2.7 Berry Drying Studies-------------------------------------------------------------------- 31
2.8 Summary of Chapter II ----------------------------------------------------------------- 33
CHAPTER III – MATERIALS AND METHODS ------------------------------------------ 34
3.1. Experimental Plan and Procedure-------------------------------------------------- 34
3.1.1 Chemical Pretreatment -------------------------------------------------------------- 35
3.1.2 Osmotic Dehydration----------------------------------------------------------------- 35
3.1.3 Saskatoon Berry Drying ------------------------------------------------------------- 36
3.1.4 Microwave and Microwave-Convection Drying ----------------------------- 37
3.1.5 Convection Drying ----------------------------------------------------------------- 37
3.2 Analytical Procedures ------------------------------------------------------------------ 38
3.2.1 Berry Sample Preparation ------------------------------------------------------- 38
3.2.2 Moisture Content Determination------------------------------------------------ 38
3.2.3 Total Soluble Solids (TSS) Measurement------------------------------------ 39
3.2.4 Dielectric Properties Measurement and Sample Preparation ----------- 39
3.3 Dehydrated Product Quality Analysis----------------------------------------------- 42
3.3.1 Color Measurements -------------------------------------------------------------- 42
3.3.2 Rehydration Test ------------------------------------------------------------------- 43
3.3.3 Micro-structural Analysis --------------------------------------------------------- 43
3.4 Modeling of Drying Process----------------------------------------------------------- 45

viii
3.4.1 Moisture Ratio Determination --------------------------------------------------- 45
3.5 Statistical Analysis ---------------------------------------------------------------------- 47
3.5.1 Chemical Pretreatment ----------------------------------------------------------- 47
3.5.2 Osmotic Dehydration-------------------------------------------------------------- 47
3.5.3 Drying Experiments---------------------------------------------------------------- 48
Chapter IV – DEVELOPMENT OF A MICROWAVE DRYER SYSTEM ----------- 49
4.1. Configuration of Microwave-Convection Oven ---------------------------------- 49
4.2. Microwave and Convection System Instrumentation -------------------------- 50
4.3. Convection Air Temperature Controller Installation ---------------------------- 51
4.3.1 Airflow Rate Measurement------------------------------------------------------- 55
4.4 Data Acquisition Module Integration ------------------------------------------------ 55
4.4.1. Temperature Data Acquisition ------------------------------------------------- 56
4.4.2. Data Acquisition Software------------------------------------------------------- 57
4.4.3. Online Weight-Loss Measurement-------------------------------------------- 57
4.5. Standard Reference Material (Water) Testing----------------------------------- 60
4.6 Summary of Chapter IV ---------------------------------------------------------------- 62
CHAPTER V – RESULTS AND DISCUSSION ------------------------------------------ 64
5.1. Chemical Pre-treatment Experiments --------------------------------------------- 64
5.1.1. Effect on Osmotic Dehydration ------------------------------------------------ 66
5.2. Osmotic Dehydration (OD) Experiments------------------------------------------ 68
5.2.1. Effect on Moisture Loss and Solid Gain ------------------------------------- 69
5.2.3. Effect on Dielectric Properties-------------------------------------------------- 73
5.3. Drying Characteristics ----------------------------------------------------------------- 75
5.3.1. Drying Time------------------------------------------------------------------------- 76
5.3.2. Effect of Drying Mode ------------------------------------------------------------ 79
5.3.3. Effect of Osmotic Dehydration on Drying------------------------------------ 81
5.4. Modeling of Drying Process---------------------------------------------------------- 83
5.4.1. Evaluation of Thin-layer Drying Equation ----------------------------------- 83
5.4.2. Data Analysis----------------------------------------------------------------------- 83
5.4.3. Quality Analysis-------------------------------------------------------------------- 89
5.5 Summary of Chapter V----------------------------------------------------------------- 93

ix
CHAPTER VI - CONCLUSIONS------------------------------------------------------------- 94
6.1 Conclusions ------------------------------------------------------------------------------- 94
6.2. Recommendations for Future Work------------------------------------------------ 96
References---------------------------------------------------------------------------------------- 97
APPENDIX -------------------------------------------------------------------------------------- 104
Appendix A1. Microwave Combination Drying at 60, 70 and 80oC------------- 105
Appendix A2. Microwave drying at 60, 70 and 800C------------------------------- 107
Appendix A3. Convection drying at 60, 70 and 800C ------------------------------ 109
Appendix A4. Temperature trends during microwave drying at 60oC.--------- 115
Appendix B1. Microwave drying of fresh blueberries ------------------------------ 116
Appendix C1. Dielectric properties of saskatoon berries ------------------------- 117
Appendix D1. Scanning Electron Microscope images of saskatoon berries - 121
Appendix E1. Digital Images of Experimental Setup ------------------------------ 122

x
LIST OF TABLES
Table 2.1 Nutrient values of berries grown in Western Canada -----------------------7
Table 2.2 Physico-chemical characteristics of five saskatoon cultivars--------------7
Table 2.3 Saskatchewan statistics for Horticulture products (2001 Census of
Agriculture) ----------------------------------------------------------------------------8
Table 2.4 Canadian Statistics for Horticulture products (2001 Census of
Agriculture) ----------------------------------------------------------------------------9
Table 2.5 Number of acres of fruit crops planted in the Province of Saskatchewan
in the year 2004 -------------------------------------------------------------------- 10
Table 2.6 Major fruit processing and research centers in the Province of
Saskatchewan ---------------------------------------------------------------------- 10
Table 3.2 Drying models fitted for the drying data--------------------------------------- 46
Table 4.1 Measured output power of the microwave system------------------------- 61
Table 5.1 Moisture content and Total soluble solids of osmotic dehydrated
berries after chemical pre-treatment ------------------------------------------ 65
Table 5.2 Solid gain and Moisture loss during osmotic dehydration from 6 to 36 h
duration ------------------------------------------------------------------------------- 69
Table 5.3 Drying time and drying rate for untreated saskatoon berries ------------ 77
Table 5.4 Drying time and drying rate for osmotic dehydration of saskatoon
berries with sucrose (60% and 24h)------------------------------------------- 81
Table 5.5 Co-efficient of determination and standard error values for different
equations----------------------------------------------------------------------------- 84
Table 5.6 Rehydration ratio of Microwave dried berries with and without osmotic
dehydration -------------------------------------------------------------------------- 90
Table 5.7 Rehydration ratios of sucrose osmotic dehydrated berries at different
drying conditions ------------------------------------------------------------------- 91
Table 5.8 Hunterlab colorimeter parameters of untreated and sucrose pretreated
berries under microwave, convection and combination drying
conditions ---------------------------------------------------------------------------- 92
xi
LIST OF FIGURES
Figure 3.1 Stages of Saskatoon berry drying / dehydration process --------------- 34
Figure 3.2 Open-ended coaxial probe and adjustable platform---------------------- 41
Figure 3.3 Photograph of SEM system with computer --------------------------------- 44
Figure 3.4 Functional components and operating principle of Scanning Electron
Microscope (SEM) ----------------------------------------------------------------- 45
Figure 4.1 Front panels of the microwave drying system (left panel to set
microwave power and run-time and right panel to set and monitor
convection temperatures) -------------------------------------------------------- 51
Figure 4.2 Teflon block fabricated to insert fibre optic temperature probes in to
the microwave cavity -------------------------------------------------------------- 52
Figure 4.3 An assembly of fibre optic temperature sensors and signal conditioner
for temperature measurement -------------------------------------------------- 52
Figure 4.4 Aerial view of the convection fan and the belt pulley arrangement --- 53
Figure 4.5 Flowchart of the convection heating system explaining the working
operation of the convection heating circuit----------------------------------- 54
Figure 4.6 Temperature data acquisition flowchart explaining the step-by-step
procedure adapted in temperature data acquisition ----------------------- 55
Figure 4.7 Temperature data acquisition main screen of LabView 6i program --56
Figure 4.8 Ohaus balance mounted on top of the microwave system to record
online weight loss data ----------------------------------------------------------- 57
Figure 4.9 Weight-loss data acquisition flowchart indicating the step-by-step
procedure adapted in temperature data acquisition ----------------------- 58
Figure 4.10 Sample holder connected to a weighing scale by nylon string ------- 59
Figure 4.11 Weight-loss data acquisition snap-shot of LabView program--------- 59
Figure 4.12 Sample holder with saskatoon berry dried samples with temperature
sensors ------------------------------------------------------------------------------- 60
Figure 5.1 Saskatoon berries brix levels (TSS) after Chemical Pre-treatment and
6 h Osmotic Dehydration with high fructose corn syrup ------------------ 64

xii
Figure 5.2 Frozen berry cut section of the berry skin under SEM ------------------- 67
Figure 5.3 SEM of saskatoon berry osmotically dehydrated with 50% high
fructose corn syrup (HFCS) solution for 24 h without chemical pre-
treatment ----------------------------------------------------------------------------- 67
Figure 5.4 SEM of saskatoon berry osmotically dehydrated with 50% sucrose
solution for 24 h without chemical pre-treatment--------------------------- 68
Figure 5.5 Moisture loss during the 36 h osmotic dehydration in sucrose solution
at 40, 50 and 60% concentrations --------------------------------------------- 70
Figure 5.6 Moisture loss during 36 h osmotic dehydration in high fructose corn
syrup (HFCS) solution at 40, 50 and 60% concentrations --------------- 70
Figure 5.7 Solute gain during 36 h osmotic dehydration in sucrose solution at 40,
50 and 60% concentrations------------------------------------------------------ 71
Figure 5.8 Solute gain during 36 h osmotic dehydration in high fructose corn
syrup solution at 40, 50 and 60% concentrations -------------------------- 72
Figure 5.9 Osmotic dehydration effects on dielectric properties after 12 and 24 h
durations at 50% high fructose corn syrup Concentration --------------- 73
Figure 5.10 Osmotic dehydration effects on dielectric properties at 40, 50 and
60% high fructose corn syrup concentrations and respective
frequencies (915 and 2450 MHz) ---------------------------------------------- 74
Figure 5.11 Drying temperature trends at combination P1, P2 and P3 levels (60,
70 and 80oC respectively) and its effect on drying time ------------------ 78
Figure 5.12 Drying temperature trends at microwave P1, P2 and P3 power levels
(60, 70 and 80oC respectively) and its effect on drying time ------------ 79
Figure 5.13 Drying of untreated berries at 70oC under Microwave, Convection
and Combination drying conditions -------------------------------------------- 80
Figure 5.14 Microwave drying of osmotically treated and untreated berries at
70oC ----------------------------------------------------------------------------------- 82
Figure 5.15 Midilli equation drying curve fit for sucrose osmotic dehydration
combination drying at 60oC ------------------------------------------------------ 85
Figure 5. 16 Modified drying equation drying curve fit for sucrose combination
drying at 80oC----------------------------------------------------------------------- 86
xiii
Figure 5.17 Midilli equation drying curve fit for sucrose osmotic dehydration
microwave drying at 70oC-------------------------------------------------------- 87
Figure 5.18 Midilli equation drying curve fit for sucrose osmotic dehydration
convection drying at 70oC-------------------------------------------------------- 88
Figure 5.19 Sharma’s equation drying model curve fit for combination drying
method at 60oC --------------------------------------------------------------------- 89
Figure A1 Microwave combination drying of untreated saskatoon berries at 60,
70 and 800C temperatures and corresponding weight loss plotted
against time (min) ---------------------------------------------------------------- 105
Figure A2 Microwave combination drying (weight loss, g) of sucrose osmotic
dehydrated saskatoon berries at 60, 70 and 800C temperatures and
corresponding weight loss plotted against time (min)------------------- 106
Figure A3 Microwave drying (weight loss, g) of untreated saskatoon berries at 60,
70 and 800C temperatures and corresponding moisture loss plotted
against time (min) ---------------------------------------------------------------- 107
Figure A4 Microwave drying (weight loss, g) of sucrose osmotic dehydrated
saskatoon berries at 60, 70 and 800C temperatures -------------------- 108
Figure A5 Convection drying (weight loss, g) of sucrose osmotic dehydrated
saskatoon berries at 600C temperature ------------------------------------ 109
Figure A6 Convection drying (weight loss, g) of high fructose corn syrup osmotic
dehydrated saskatoon berries at 600C temperature--------------------- 110
Figure A7 Convection drying (weight loss, g) of untreated saskatoon berries at
600C temperature ---------------------------------------------------------------- 111
Figure A8 Convection drying (weight loss, g) of sucrose osmotic dehydrated
saskatoon berries at 700C temperature ------------------------------------ 112
Figure A9 Convection drying (weight loss, g) of untreated saskatoon berries at
700C temperature ---------------------------------------------------------------- 113
Figure A10 Convection drying (weight loss, g) of untreated saskatoon berries at
800C temperature ---------------------------------------------------------------- 114

xiv
Figure A11 Microwave drying product temperatures of high fructose corn syrup
treated saskatoon berries at 600C product temperature and
corresponding air temperature (oC) plotted against time (min) ------- 115
Figure B1 Blueberries disintegrated structure after low power microwave drying
---------------------------------------------------------------------------------------- 116
Figure C1 Dielectric properties of frozen saskatoon berry syrup ------------------ 117
Figure C2 Dielectric loss factor variation of saskatoon berry syrup after osmotic
dehydration with 40, 50 and 60% sucrose sugars solutions----------- 117
Figure C.3 Effect of high fructose corn syrup Concentration on Osmotic
Dehydration------------------------------------------------------------------------ 118
Figure C4 Dielectric loss factor (ε") variation with frequency of Fresh saskatoon
berries------------------------------------------------------------------------------- 118
Figure C5 Dielectric properties of fresh whole, cut and syrup of berries--------- 119
Figure C6 Dielectric constant (ε’) variation with frequency of frozen saskatoon
berries (whole and crushed)--------------------------------------------------- 119
Figure C7 Dielectric constant and Loss factor variation with frequency of water
---------------------------------------------------------------------------------------- 120
Figure D1 Scanning electron microscope image of osmotically dehydrated
berries with 50% sucrose solution ------------------------------------------- 121
Figure E1 Frozen saskatoon berries------------------------------------------------------ 122
Figure E2 Thawed saskatoon berries placed in polycarbonate sample holder. 122
Figure E3 Panel to switch between preset and modified settings ----------------- 123
Figure E4 Front panel with temperature controller and setup to monitor
convection and microwave run-time----------------------------------------- 123
Figure E5 Inverter technology built in the Panasonic microwave-convection
system ------------------------------------------------------------------------------ 124
xv
LIST OF SYMBOLS AND GLOSSARY
MC Moisture Content (%)
RH Relative Humidity (%)
m/s Airflow Rate Unit
brix Total Soluble Solids Unit
MR Moisture Ratio
k Drying Constant (h-1)
W Units of Power (Watts)
V Voltage Unit (Volts)
P1, P2 and P3 Microwave Power Levels (In-built)
MC/min Drying Rate Unit
Saskatoons saskatoon berries
OD Osmotic Dehydration
COR Coefficient of Rehydration
SEM Scanning Electron Microscope
MW Microwave
RF Radio Frequency
DAQ Data Acquisition
HP Hewlett-Packard
I/O Input / output
HFCS High Fructose Corn Syrup
ε' Dielectric Constant
ε” Dielectric Loss Factor
L Lightness Indicator
a and b Chromacity Coordinates
ΔEab Total Color Difference
TSS Total Soluble Solids (brix)
MHz Unit of Frequency (Mega Hertz)

xvi
δ Loss angle of dielectric
FSA Food Standard Agency
EU European Union
SSR Solid State Relay
GLOSSARY OF TERMS
Equilibrium MC Moisture content of the material after it has been exposed to
(EMC) a particular environment for an infinitely long period of time.
Relative Humidity Defined as ratio of vapor pressure of water in the air to the
(RH) vapor pressure of water in saturated air at the same
temperature and atmospheric pressure.
Osmotic - Two-way counter flow of fluids from food material into an
Dehydration (OD) osmotic solution through a semi-permeable membrane.
U-Pick Harvesting operation for fruits where consumer picks fruits of
desired quality and quantity on the farm.

1
CHAPTER I - INTRODUCTION 1.1 Introduction
The technique of dehydration is probably the oldest method of food preservation
practiced by humankind. The removal of moisture prevents the growth and
reproduction of microorganisms causing decay and minimizes many of the
moisture-mediated deteriorative reactions. It brings about substantial reduction in
weight and volume, minimizing packing, storage and transportation costs and
enables storability of the product under ambient temperatures. These features
are especially important for both developed and developing countries in military
feeding and new product formulations.
Saskatoon berries (Amelanchier alnifolia), also known as saskatoons are grown
primarily in the Prairie Provinces of Canada and the plains of the Unites States.
Up to nine varieties of saskatoons are reported according to their habitat,
flowering and ripening time, growth form and size, color, seediness and flavor for
production (Turner, 1997). Certain varieties were more likely to be dried fresh like
raisins for winter use, while others were cooked to the consistency of jam before
being dried. The berries are an excellent source of vitamin C, manganese,
magnesium, iron and a good source of calcium, potassium, copper and carotene.
Because the edible seeds are consumed, the berries are also higher in protein,
fat and fibre than most other fruits (Turner et al., 1990).
The length of saskatoon berry harvest ranges from 1 to 4 weeks. Many
producers are not able to harvest and sell their entire crop during the short
harvest season. Freezing on the farm has increased market flexibility for
consumers, producers and processors by extending the length of time
saskatoons are available. Frozen saskatoon berries are marketed for direct
consumption and for processed product manufactures.

2
A sharp rise in energy costs has promoted a dramatic upsurge in interest in
drying worldwide over the last decade. Advances in techniques and development
of novel drying methods have made available a wide range of dehydrated
products, especially instantly reconstitutable ingredients, from fruits and
vegetables with properties that could not have been foreseen some years ago.
Longer shelf-life, product diversity and substantial volume reduction are the
reasons for popularity of dried berries, and this could be expanded further with
improvements in product quality and process applications. These improvements
could increase the current degree of acceptance of dehydrated berries
(saskatoons, blueberries etc.) in the market. Microwave and microwave-
combination drying could be a possible alternative to freezing of fresh berries.
Freezing and storage of frozen berries is a cost and energy-intensive process
involving cold storage costs for the whole bulk of material.
A very scant data currently exists on processing (drying, processing, packaging
etc.) of fresh saskatoons to extend the shelf life. Even though drying of
horticultural crops (fruits, vegetables and spices) has been reported, there is not
much literature reported on drying / dehydration of saskatoon berries. Therefore,
the overall objective of this study was to develop an integrated drying system
suitable for berries (saskatoons, raspberries etc.) and in particular, to study the
drying behavior of saskatoons and to compare the drying characteristics under
microwave, convection and microwave-convection drying methods with respect
to drying, shrinkage and rehydration characteristics obtained by these drying
schemes.
3
1.2 Objectives
The specific objectives of this research were:
1. To modify, instrument and eventually develop the microwave-convection
combination drying system for real-time weight-loss and temperature
monitoring along with data acquisition.
2. To evaluate osmotic dehydration as a pre-treatment for drying and study
its effect on dielectric properties, drying rate, and final berry quality.
3. Drying studies under microwave and microwave-convection combination
and convective (thin-layer) conditions using the newly developed dryer
and study the quality and sensory evaluation (rehydration, color, etc.)
characteristics.

4
CHAPTER II – LITERATURE REVIEW
The Canadian production and processing situation for berries (strawberry,
cranberries, blueberry, saskatoon berry, etc.) has become commercial in last two
decades with increasing production and processing facilities. The following
review will present the post harvest technology aspects for saskatoon berries,
drying methods and effect of drying on quality factors of fruits.
2.1. Saskatoon Berries
Saskatoon berry (Amelanchier alnifolia) is the main species from which fruiting
cultivars are derived. Other commonly used species include: A. arborea (Downy
serviceberry), A. asiatica (Asian serviceberry), A. canadensis (shadblow
seviceberry) and A. laevis (Allegheny serviceberry). Saskatoon berries are very
versatile berries from the rose family (Rosaceae). They have long been treasured
as a wild fruit and now with the growth in U-Pick saskatoon berry (saskatoons)
orchards, the very best berries are available on the consumer market. The North
American species of Amelanchier are variously called by the common names of
saskatoon berry, serviceberry, juneberry, and shadberry.
Over the past two decades, however, there has been increasing interest in
utilizing the cultivated production of this tasty berry as a unique Western
Canadian fruit crop. Today, there are 100 to 200 hectares of cultivated
saskatoons in production on the Canadian Prairies. Another 200 to 400 hectares
have been planted, but are still too young to produce significant quantities.
Consumers are attracted to the unique, subtle flavor of the “wild” fruit product
made from saskatoon berries, and market survey indicates the potential for
acceptance of saskatoon berry products is Worldwide. The berry orchards are
found all over western North America. Nearly 250 producers now boast orchards
covering nearly 1,000 acres, harvesting thousands of pounds of the native fruit

5
and rapidly establishing a sophisticated new commercial segment of diversified
Saskatchewan agriculture. Two years ago, production for the berry business
revealed an output of two million pounds. There is a growing percentage of
agricultural revenues as the fruit industry now includes ten processing plants and
300 full and part-time employees. A total of 240 Saskatchewan farm operations
reported growing saskatoon berries on 916 acres. This was 31% of the Canadian
total production area. Saskatchewan ranked second for saskatoon berry area
after Alberta with 1,525 acres. Of these provinces, Saskatchewan is the largest
processor of the berry (Mazza, 1982).
Processors use saskatoons to produce products such as syrups, jams, jellies,
fillings, sauces, chocolates, muffins, liquors and wines. Processors require
berries that have been cleaned, graded and frozen. The capacity to freeze
berries, store-frozen berries and ship frozen berries throughout the year is
essential in selling to this market. Fresh saskatoons have a short shelf life, even
when refrigerated, but freeze very well and can maintain their quality for up to
two years. Slow freezing produces microscopic cracks in berries through which
the pigment-laden juice escapes (Sapers et al., 1985). Most of the freshly
harvested berries are flash frozen within two hours, which has allowed sales to
be extended year-round. Prior to packaging and/or processing all leaves and
twigs are totally removed from the berries. Handling techniques of fresh berries
are presently being standardized and grading / sorting criteria being regularized.
Presently, approximately 10-12% of saskatoon berries are sold fresh, but
significant portions are frozen or canned. Lower quality fruit is used in jams and
purees, where appearance is critical. Purees can be added to yogurt, ice cream
and fruit smoothies. It is also anticipated that saskatoon berries will be used to
enhance color and flavor of a variety of products, from specialty cheeses to
nutritious snacks. Its dark color with its high nutritional content and associated to
anthocyanin content will make it an attractive fruit to consumers. Combination of
osmotic and air drying technology in blueberries has produced shelf-stable
6
berries that maintains a pleasant chewy texture (Mazza et al., 1993). Little data
currently exists on processing (drying, processing, packaging etc.) of fresh
saskatoons to extend the shelf life and stability for packaging and distribution.
Researchers explain that a shortage of fresh saskatoon markets, however, is the
biggest limiting factor for further growth in the industry. While the demand for the
berries in their processed form may be great, there is significant demand for the
fresh form. This is not surprising considering both taste and nutritional value are
at their highest immediately following harvest. To date, saskatoons are not sold
in large supermarkets as fresh fruit because flavor, structural integrity and quality
of the fruit degrade rapidly within days of being picked.
Saskatoons are a rich source of vitamin C and are also known for their
antioxidant qualities. Crude extracts of Amelanchier utahensis are being studied
for use as cancer therapy drugs. Dried saskatoons can also be used in
nutraceutical industry and extraction (Mazza, 1986).
2.1.1. Fruit Composition
The nutritional value of saskatoon berries on a dry weight basis is listed in Table
2.1. Saskatoon berries contain higher levels of protein, fat, and fiber than most
other fruit. Panther and Wolfe (1972) reported negligible ascorbic acid content
and that an ascorbic acid oxidizing enzyme system was present in the berries.
Total solids content ranges from 20 to 29.4% fresh weight with 15.9 to 23.4%
sucrose and 8 to 12% reducing sugars (Mazza, 1979; Mazza, 1982). Wolfe and
Wood (1971) found that the sugar content increases slowly as the fruit matures
and then accelerates markedly before ripening. Their results also indicated that
fructose content decreased rather markedly (25%) after the fruit ripened while the
glucose content remained unchanged. Berry pH values range from 4.2 to 4.4 and
titratable acidity values (% malic acid) from 0.36 to 0.49% (Mazza, 1979; Green
and Mazza, 1986).

7
Table 2.1 Nutrient values of berries grown in Western Canada
Per 100g Saskatoons Blueberries Strawberries Raspberries
Energy (Ca) 84.84 51 37 49
Protein (g) 1.33 0.42 0.7 0.91
Carbohydrate (g) 18.49 12.17 8.4 11.57
Total Lipid (g) 0.49 0.64 0.5 0.55
Total Fiber (g) 5.93 2.7 1.3 4.9
Vitamin C (mg) 3.55 2.5 59 25
Iron (mg) 0.96 0.18 1 0.75
Potassium (mg) 162.12 54 21 152
Vitamin A (IU) 35.68 100 27 130
Source: Saskatoon berries, SFGA, Conducted by POS Pilot Plant, assistance of Native Fruit Development Program (February 2003); Other fruit--USDA National Nutrient Database for Standard Reference, Report 15 (August 2002) Table 2.2 Physico-chemical characteristics of five saskatoon cultivars
Cultivar 10 Berry
wt pH Titrable acidity
Total Solids
Soluble Solids SS/Ac Anthocyanins
(g) (% malic acid) (% dry wt) (% sucrose) mg/100g Honeywood 12.7 3.8 0.54 25.6 18.7 34.7 114
Northline 8 3.9 0.45 25.1 16.1 35.5 111Porter 7.8 3.8 0.56 22.7 16.3 29.5 108Regent 6.8 4.4 0.29 20.8 14.8 52.8 72Smoky 10.1 4.5 0.25 27 16.3 66.2 68
Source: Saskatoon berries, SFGA, Conducted by POS Pilot Plant, assistance of Native Fruit Development Program (February 2003); Other fruit--USDA National Nutrient Database for Standard Reference, Report 15 (August 2002) The predominant acid in saskatoon berries is malic (Wolfe and Wood, 1972) and
the predominant aroma component is benzaldehyde (Mazza and Hodgins, 1985).
There are at least four anthocyanins in ripe saskatoon berries; cyanidin 3-
galactoside accounts for about 61% and 3-glucoside for 21% of total

8
anthocyanins (Mazza, 1986). A detailed list of all the physico-chemical
characteristics of five saskatoon varieties is listed in Table 2.2.
2.1.2. Production and Post-harvest Technology
Commercial saskatoon berry production is practiced in horticultural orchards and
marketed in consumer and processor markets including farmer’s market. The
saskatoon berry is well known in the Prairies; however it is relatively unknown in
other areas. As a result, the present market for saskatoons tends to be in the
Prairies. Production statistics for the province of Saskatchewan and Canada is
listed in Table 2.3 and Table 2.4. In Saskatchewan, the number of acres growing
berries and grapes in 2001 was 542 that are more than twice when compared to
1991 statistics. The long-term market opportunity for saskatoons lies in reaching
consumers in other locations. The majority of saskatoons growers operate as U-
pick or market garden enterprises. However, the greatest portion of the berries
produced in Alberta is sold to processors. New entrants to the industry are likely
to start out as U-pick operators. As they become established with larger acres, a
larger portion of the crop is likely to be sold to processors rather than as fresh
berries.
Table 2.3 Saskatchewan statistics for Horticulture products (2001 Census of
Agriculture)
(Saskatchewan) 1981 1986 1991 1996 2001
Total number of farms 67,318 63,431 60,840 56,995 50,598
Total berries and grapes (Ha) 8 120 225 443 542
Total vegetables (Ha) 595 491 422 477 397
1. Conversion factor: 1 hectare equals 2.471 acres. 2. Conversion factor: 1 square meter equals 10.76391 square feet. Source: Statistics Canada, Census of Agriculture.

9
Table 2.4 Canadian Statistics for Horticulture products (2001 Census of
Agriculture)
(Canada) 1981 1986 1991 1996 2001
Total number of farms 318,361 293,089 280,043 276,548 246,923
Total berries and grapes (Ha) 31,458 40,470 45,759 57,523 69,165
Total vegetables (Ha) 117,216 116,573 122,594 127,697 133,851
1. Conversion factor: 1 hectare equals 2.471 acres. 2. Conversion factor: 1 square meter equals 10.76391 square feet. Source: Statistics Canada, Census of Agriculture
2.1.2.1. Saskatchewan Fruit Sector
Fruit handling and processing is an emerging industry in Saskatchewan. The
industry has grown out of a maturing U-Pick based industry, which began in
1980. As recently as fifteen years ago, fruit processing facilities were virtually
non-existent in the province. It is now a well diversified industry supplying fresh,
frozen and processed fruit products to the wholesale and retail trades, and
expanding export markets of frozen and processed fruit products in Europe.
In keeping with recent developments, the fruit production industry is ensuring that
they receive proper on-farm food safety training, and thirteen of the major fruit
processors in the province now have federally inspected plants. There are
approximately 30 fruit processors in the province in total including two wineries
established through the Cottage Winery Policy of the Saskatchewan Liquor and
Gaming Authority and based predominantly on Saskatchewan grown fruits.
In 2004, there were approximately 550 fruit growers in the province and an
estimated 1,800 acres planted to fruit crops (Table 2.5).

10
Table 2.5 Number of acres of fruit crops planted in the Province of Saskatchewan
in the year 2004
No. Fruits Planted Acres 1 Saskatoon berry 1200 - 1300
2 Strawberry 250
3 Dwarf Sour Cherry 125 -150
4 Apple 100
5 Raspberry 80 - 100
6 Chokecherry 80 -100
7 Blue Honeysuckle 20
8 Black Currant 15
Source: Canada's Fruit Industry, Government of Canada, http://ats.agr.ca Table 2.6 Major fruit processing and research centers in the Province of
Saskatchewan
No. Food Processing / Research Centre City 1 Berryview Farms Lloydminster 2 C and V Orchards Weyburn 3 Dawn Food Products (Canada) Ltd. Saskatoon 4 Gramma Beps Swift Current 5 Harvest Pie Pangam 6 Heavenly Hills Orchard Blaine Lake 7 Last Mountain Berry Farms Southey 8 Nature Berry Air Ronge 9 Parenteau's Saskatoon Berry Langham
10 Prairie Berries Inc. Keeler 11 Riverbend Plantation Saskatoon 12 Saskatchewan Food Development Centre Saskatoon 13 Saskatchewan Food Centre Saskatoon 14 University of Saskatchewan (Ag Eng. College)Saskatoon
Source: Canada's Fruit Industry, Government of Canada, http://ats.agr.ca
Producers and processors originally focused on four major crops: saskatoon
berry, strawberry, chokecherry and sea buckthorn. The industry is now rapidly

11
expanding production to include a number of new crops. With recent
developments in the domestic fruit program at the Department of Plant Sciences,
University of Saskatchewan, the industry is now also focusing on dwarf sour
cherries, blue honeysuckle, dwarf apples and black currant. There are 10 major
processors marketing frozen and processed fruit and fruit products in
Saskatchewan (Table 2.6) and approximately 70 people employed in the fruit
processing industry.
2.1.2.2. International Market Access for saskatoon berries
A retail chain in the United Kingdom marketed Canadian saskatoon berries this
past winter. Shortly after introducing saskatoons to the market, the importer and
the retailer were advised by the U.K. Food Standards Agency (FSA) that
saskatoons could not be sold in the United Kingdom until they had been
approved as being safe for consumption under the European Union (EU) Novel
Foods Regulations (Regulation 258/97).
On December 10, 2004, a committee of EU member states declared that the
berries are not novel. This means that the EU market is currently open to
Canadian saskatoon berries and Canadian exports of the berry can resume.
Canada will continue to monitor the situation in the coming months to ensure that
exports of saskatoon berries are able to enter the European Union without
mishap.
2.1.3. Freezing vs. Drying
The frozen fruit and vegetable industry uses much energy in order to freeze the
large quantity of water present in fresh product. As pointed out by Huxsoll (1982),
a reduction in moisture content of the material reduces refrigeration load during
freezing. Other advantages of partially concentrating by osmotic dehydration
(OD) or sugar infusion fruits and vegetables prior to freezing includes savings in

12
packaging and distribution costs and achieving higher product quality because of
the marked reduction of structural collapse and dripping while thawing. Further
drying of the product can be performed for preservation or utilization for product
preparations.
The advantages of drying of fruits and vegetables as against freezing are:
• Large energy consumption for freezing and also to maintain the fruit in
frozen condition till it is either consumed or processed,
• As the bulk volume is not reduced due to freezing more storage space is
required that again adds to the storage costs,
• Drying reduces the moisture content of the produce that has an impact of
lowering the microbiological activity in the fruit, and
• Drying without freezing the product itself will avoid the energy
consumption for freezing and in new product development.
The saskatoon berry is a very new commercial fruit, yet several food processors
are already using wild and cultivated berries in their food products. There seems
to be considerable potential for expansion of production and processing of
saskatoon berry as many processors and distributors have reported they would
use large quantities of this unique fruit if they had an assured supply at a
reasonable price.
2.2 Fruit Pretreatment
Fruit pretreatments including chemical pretreatment, freezing, thawing and
osmotic dehydration can influence the dehydration or drying rates as well as
maintain an overall quality of the final product.

13
2.2.1. Chemical Pretreatment
Waxy layer in the skin makes it difficult to dry the product. Dehydration of small
fruits; such as grapes, blueberries, cranberries, cherries and gooseberries, is
restricted by the outer surface (cuticle) which plays a major role in the control of
transpiration and in protecting the fruit against weather in clemencies or attacks
from insects and parasites (Somogyi and Luh, 1986; Somogyi et al., 1996).
According to Kostaropoulus and Saravacos (1995) and Grabowski et al. (1994),
the drying time of surface pretreated grapes (immersed in ethyl oleate, etc) was
reduced by about half. Venkatachalapathy and Raghavan (1997) found a positive
effect using a combination of ethyl oleate (2%) and NaOH (0.5%) for microwave
drying of grapes. However, the convective drying rate of the strawberries was
improved by only about 10% as a result of this pretreatment. Salunkhe et al.
(1991) had reported that alkaline dipping facilitates drying by forming fine cracks
on the fruit surface that was determined by Ponting and McBean (1970) that, pre-
treating with ethyl esters of fatty acids would be the effective treatment for fruits
with waxy surface layer. Tulasidas et al. (1993) reported that pre-treating with
ethyl oleate could improve the drying rate. Venkatachalapathy (1997) used an
alkaline solution of 2% ethyl oleate and 0.5% sodium hydroxide (NaOH) as a pre-
treatment for strawberries and blueberries. The above authors have also dried
osmotically pretreated cranberries.
2.2.2 Osmotic Dehydration
The use of osmosis allows both ways of decreasing water activity in food to be
applied simultaneously. The permeability of plant tissue is low to sugars and high
molecular weight compounds; hence the material is impregnated with the osmo-
active substance in the surface layers only. Water, on the other hand, is removed
by osmosis and cell sap is concentrated without a phase transition of the solvent.
This makes the process favorable from the energetic point of view. The flux of

14
water is much larger than the counter current flux of osmoactive substance. For
this reason the process is called osmotic dehydration or osmotic dewatering.
The food produced by this method has many advantageous features:
• It is ready to eat and rehydration is not needed,
• The amount of osmoactive substance penetrating the tissue can be
adjusted to individual requirements,
• The chemical composition of the food can be regulated according to
needs, and
• Mass of raw material can be reduced by 20% to half.
The osmotic dehydration does not reduce water activity sufficiently to hinder the
proliferation of microorganisms. The process extends, to some degree, the shelf
life of the material, but it does not preserve it. Hence, the application of other
preservation methods, such as freezing, pasteurization, or drying is necessary.
However, processing of osmotically dehydrated semi products is much less
expensive and preserves most of the characteristics acquired during the
osmosis.
2.2.2.1 Osmo-active Substances
Osmo-active substance used in food must comply with special requirements.
They have to be edible with accepted taste and flavor, nontoxic, inert to food
components, if possible, and highly osmotically active. Sucrose, lactose, glucose,
fructose, maltodextrins and starch or corn syrups are commonly used in osmotic
dehydration of fruits and vegetables. Glucose and fructose give a similar
dehydration effect (Sarosi and Polak, 1976). In other publications it is reported
that fructose increases the dry matter content by 50% as compared with sucrose.
Starch syrup makes it possible to have similar final water content in dehydrated
material as that obtained with sucrose but at a much lower influx of osmoactive

15
substance into tissue (Lenart and Lewicki, 1990). The dextrose equivalent of the
syrup affected strongly the ratio between water loss and solids gain.
2.2.2.2 Product Characteristics
Osmotic dehydration is a complex process of countercurrent mass transfer
between the plant tissue and hypertonic solution. This leads to dehydration of the
material and changes in its chemical composition as well. Hence, it must be
expected that the properties of the material dehydrated by osmosis will differ
substantially from those dried by convection.
The flux of osmoactive substance penetrating the osmosed tissue changes its
chemical composition. It has been shown that the content of sucrose increases in
cell sap during osmotic dehydration (Hawkes and Flink, 1978; Dixon et al., 1976),
and the sucrose flux is increased by the presence of sodium chloride (Islam and
Flink, 1982). On the other hand, use of starch syrup gives only a small influx of
sugars to the material (Contreras and Smyrl, 1981).
As it has been stated previously osmotic dehydration cannot be treated as a food
preservation process. It is a pretreatment that removes a certain amount of water
from the material; to achieve shelf stability a further processing of the product is
needed. Hence, the interaction of osmotic dehydration with further processing is
important for quality assurance. Use of osmotic dehydration practically eliminates
the need to use preservatives such as sulfur dioxide in fruits (Ponting et al.,
1966).
In osmotic dehydration, pieces of fruit or vegetable are immersed in a aqueous
solution. Sucrose or mixtures of sugars are normally used for fruits. Because the
cell membranes only allow very limited transfer of sugars into the tissue,
equalizing the concentrations of dissolved substances inside and outside the fruit
takes place by movement of the water from the inside to the outside. The

16
material may also lose a portion of its own solutes (vitamins, volatiles, minerals,
etc.).
Osmotic dehydration can be used as an effective method to remove water from
fruit and vegetable tissues while simultaneously introducing solutes in the
product. For dried vegetables, which will be applied in savourily instant foods,
NaCl is the preferred osmotic solute. With the osmotic dehydration technique
shelf stability cannot be obtained. This requires a further decrease of the water
activity. Further moisture removal by evaporation at intermediate moisture
content after osmotic dehydration is necessary to reach final moisture content for
achievement of shelf stability.
2.3 Fruit Preservation Techniques
Fruits are high moisture foods with higher respiration rate and prone to
microbiological deterioration. Harvested fruits are to be processed to extend its
shelf life. In this section, we discuss about the different fruit preservation methods
and in particular the saskatoon berries.
2.3.1 Dehydration / Drying
Dehydration is a means of preserving the safety and quality of foods at the
forefront of technological advancements in the food industry. It has greatly
extended the consumer acceptable shelf life of appropriate commodities from a
few days and weeks to months and years. The lower storage and transportation
costs associated with the reduction of weight and volume due to water removal
have provided additional economic incentives for widespread use of dehydration
processes. The expanding variety of commercial dehydrated foods available
today has stimulated unprecedented competition to maximize their quality
attributes, to improve the mechanization, automation, packaging, and distribution
techniques and to conserve energy.

17
2.3.2 Introduction to Agri-Food Material Drying
It is well known that processes may affect (partially or totally) the quality of a
product. Indeed, various changes in physical, chemical and / or biological
characteristics of foodstuffs may occur during processing, storage and
distribution. These changes alter the physical aspects such as color and
structure. They can also develop undesirable biochemical reactions such as
deterioration of aroma compounds or degradation of nutritional substance
(Achanta and Okos, 1996). All the fore-mentioned physical and biochemical
changes certainly cause reduction in product quality and in process efficiency as
well (Chuy and Labuza, 1994). Particularly when dealing with high-value foods,
the choice of the right method of preservation can therefore, be the key for a
successful operation.
The term drying refers generally to the removal of moisture from a substance. It
is the most common and most energy-consuming food preservation process.
With literally hundreds of variants actually used in drying of particulate solids,
pastes, continuous sheets, slurries or solutions, it provides the most diversity
among food engineering units operations (Ratti and Mujumdar, 1995). Air-drying,
in particular is an ancient process used to preserve foods in which the solid to be
dried is exposed to a continuously flowing hot stream of air where moisture
evaporates. The phenomenon underlying this process is a complex problem
involving simultaneous mass and energy transport in a hygroscopic, shrinking
system. Air-drying offers dehydrated products that can have an extended life of a
year but, unfortunately, the quality of a conventionally dried product is usually
drastically reduced from that of the original foodstuff.

18
2.3.2.1 Equilibrium Moisture Content
The moisture content remaining in a dry material, when the drying rate drops to
zero at specified conditions of the drying medium is called the equilibrium
moisture content. It is in equilibrium with the vapor contained in the drying gas,
and its magnitude is a function of the structure and type of the subject food and
of the prevailing drying conditions. The equilibrium moisture values predicted by
the static and dynamic moisture sorption do not always agree over the whole
range of relative humidity of the drying air.
2.3.2.2 Energy Requirement
The general case of drying of food materials involves energy inputs to meet the
following energy requirements:
• Removal of free water through sublimation or evaporation,
• Removal of water associated with the food matrix,
• Superheating of water vapor sublimed or evaporated as it passes through
the food, and
• Internal energy changes, i.e., the supply of sensible heat to the foodstuff
as it changes temperature.
The energy of superheating the vapor and changing the internal energy of the
food can usually be neglected inasmuch as the supply of sensible heat is usually
minimal, on the order of the magnitude of the heat of vaporization / sublimation.
The energy required to remove water from the food matrix will thus be given by
the sum of the first two items.
2.4 Electrical Properties of Foods
Measurement of dielectric properties of agricultural material is essential for
understanding their electrical behavior (Nelson, 1973) level of mechanical
19
damage (Al-Mahasneh et al., 2000) and also for the development of indirect non-
destructive methods for determining their physical characteristics, including
moisture content and bulk density. Venkatesh et al. (1998) found that corn
samples chopped to different degrees showed a difference in dielectric response
at similar bulk densities and moisture contents which indicated that some of the
response was due to the chopping or size reduction. They also reported that the
results were not conclusive, since slight differences in moisture content and
composition as well as measurement errors might have existed and could have
had some effect on the results. They explained that the cross-sectional moisture
and material gradients in the single grain kernels had an effect on the dielectric
response of those kernels. The dielectric properties of a food depend upon its
composition. It is beneficial to conduct dielectric properties measurements for
each product that is to undergo a dielectric heating process.
The high frequency range is very large and it can be subdivided into kHz high
frequency (10 kHz to 1MHz) and MHz frequency (1 to 300MHz). It is the latter
range, which is used here when speaking about high frequency heating. The
microwave frequency, which is located above high frequencies, is designated as
between 300 MHz and 300 GHz, and microwave heating is defined as the
heating of a substance by electromagnetic energy operating in frequency range
mentioned above (Risman, 1991). Dielectric properties are of primary importance
to evaluate the suitability and efficiency of microwave heating of the osmotically
pretreated products. Furthermore, dielectric properties give insight in expected
heat dissipation, temperature-time profiles and heating homogeneity.
2.4.1 General Principles – Dielectric Properties
The dielectric properties of usual interest are the dielectric constant (ε’), dielectric
loss factor (ε”) and penetration depth (Dp). ε’ and ε” are the real and imaginary
parts, respectively, of relative complex permittivity (εr).

20
The dielectric properties are often defined by the complex permittivity equation
(Nelson, 1973):
εr= ε’ – jε” (2.1) Where,
εr= Complex permittivity,
ε’= Dielectric Constant (Real part), and
ε”= Dielectric Loss Factor (Imaginary part).
Values that can be presented are those of the dielectric constant, ε’, and the
dielectric loss factor, ε”, respectively, the real and imaginary parts of the complex
relative permittivity, ε = ε’ - jε” (Nelson, 1973). Values for the loss tangent, tan δ =
ε” / ε’ (where δ the loss angle of the dielectric) can be calculated from the ε’ and
ε” values. The dielectric constant, loss factor, and loss tangent (sometimes called
the dissipation factor) are dimensionless quantities.
Many molecules are dipolar in nature; that is, they possess an asymmetric
charge center. Water is typical of such a molecule. Other molecules may become
“induced dipoles” because of the stresses caused by the electric field. Dipoles
are influenced by the rapidly changing polarity of the electric field. Although they
are normally randomly oriented, the electric field attempts to pull them into
alignment. However, as the field decays to zero, the dipoles return to their
random orientation only to be pulled toward alignment again as the electric field
builds up to its opposite polarity. This buildup and decay of the field, occurring at
a frequency of many millions of times per second, causes the dipoles similarly to
align and relax millions of times per second. This causes an energy conversion
from electrical field energy to stored potential energy in the material and then to
stored random kinetic or thermal energy in the material.

21
2.4.2 Influence of Moisture Content
The amount of free moisture in a substance greatly affects its dielectric constant
since water has a high dielectric constant, approximately 78 at room
temperature; that of base materials is of the order of 2 (Mudgett et al., 1974).
Thus, with a larger percentage of water the dielectric constant generally
increases, usually proportionally.
A few rules of thumbs are (Mujumdar, 1995):
• The higher the moisture content, usually the higher is the dielectric
constant,
• The dielectric loss usually increases with increasing moisture content but
levels off at values in the range of 20 to 30% and may decrease at still
higher moisture, and
• The dielectric constant of moisture usually lies between that of its
component.
Since drying is concerned with removal of water or a solvent, it is interesting to
note that as these liquids are removed the dielectric loss decreases and hence,
the material heats less well. In many cases this leads to self-limitation of the
heating as the material becomes relatively transparent at low moisture content.
At low moisture contents, below the critical moisture content, we are dealing
primarily with bound water; above it we encounter primarily free water. The
dielectric loss of bound water is very low since it is not free to rotate under the
influence of the electromagnetic field. This is seen in an analogous situation with
ice, which has a dielectric loss factor of approximately 0.003 and that of water is
approximately 12.
22
2.4.3 Influence of Density
The dielectric constant of air is 1.0 and that is for all practical purposes,
transparent to electromagnetic waves at industrial frequencies. Therefore, its
inclusion in materials reduces the dielectric constants, and as density decreases
so do the dielectric properties and heating is reduced (Nelson, 2001). Density
variation causes reduction of pore space and increase in dielectric constant and
loss factor values.
2.4.4 Influence of Temperature
The temperature dependence of a dielectric constant is quite complex, and it
may increase or decrease with temperature depending upon the material. In
general, however, a material below its freezing point exhibits lowered dielectric
constant and dielectric loss (Nelson, 2001). Above freezing the situation is not
clear-cut, and since moisture and temperature are important to both drying and
dielectric properties, it is important to understand the functional relationships in
materials to be dried. Wood, for example, has a positive temperature coefficient
at low moisture content; that is, its dielectric loss increases with temperature.
This may lead to runaway heating, which in turn will cause the wood to burn
internally if heating continues once the wood is dried.
2.4.5 Importance of Dielectric Properties
Dielectric properties are of primary importance to evaluate the suitability and
efficiency of microwave (MW) heating of the osmotically pretreated products.
Furthermore, dielectric properties give insight in expected heat dissipation,
temperature-time profiles and heating homogeneity. The aim of dielectric
properties measurement after osmotic dehydration and chemical pretreatments
were to evaluate:

23
Effects of osmotic dehydration and chemical pretreatments on dielectric
properties of berries,
Effect of chemical pretreatment on osmotic dehydration, and
Measure and report dielectric properties of saskatoon berries before and
after osmotic pretreatments.
2.4.6 Dielectric Measuring Systems
Many measurement techniques for measuring permittivity are available; their
advantages and limitations determine the choice of the measuring system.
Measurements of the dielectric properties are performed by numerous methods
employing various sizes and shapes of materials (Westphal et al., 1972). At
frequencies of interest for dielectric heating below 200 MHz, impedance bridges
and resonant circuits have traditionally been used to determine the
characteristics of capacitive sample holders with and without a dielectric sample
from which the dielectric properties are calculated. At frequencies above 200
MHz and into the microwave region, transmission-line and resonant techniques
have been useful.
2.4.6.1 Open-ended Coaxial Line Probe Technique
The coaxial probe is a convenient and broadband technique for lossy (low
dielectric loss factor) liquids and solids (Venkatesh, 1998). It is non-destructive
and little or no sample preparation is required for liquids or semi-solids. In the
case of a solid material under test, the material face must be machined at least
as flat as a probe face, as any air gap can be a significant source of error. It
operates at frequencies between 45 MHz and 26.5 GHz. The technique assumes
the material under test to be non-magnetic and uniform throughout. It should be
noted that the accuracy in the coaxial probe measurements is dependent on both
frequency and dielectric constant, with the best attainable accuracy being 5% in
the real part of the permittivity and ±0.05 in loss tangent. Therefore this dielectric
24
measurement system allows measurement of dielectric properties of materials
with relatively high dielectric loss factor values, over the frequency range
between 30 MHz and 45 GHz, including two microwave frequencies of 915 MHz
and 2450 MHz that are allocated by the U.S. Federal Communications
Commission (FCC) for Industrial, Scientific, Medical and Domestic (ISMD)
heating applications.
2.4.6.2 Transmission Line Technique
This technique is cumbersome because the sample must be made into a slab or
annular geometry (Raghavan et al., 2005). At 2450 MHz the sample size is
somewhat large particularly for fats and oils. Commonly available waveguide test
equipment for 2450 MHz is designated WR-284. For measurements at 915 MHz
only the coaxial line technique is practical due to the large size of waveguide
required. Liquids and viscous fluid type foods can be measured with this method
by using a sample holder at the end of a vertical transmission line.
2.4.6.3 Waveguide and Coaxial Transmission Line Method
The dielectric properties could be determined by measuring the phase and
amplitude of a reflected microwave signal from a sample of material placed
against the end of a short-circuited transmission line such as a waveguide or a
coaxial line. For a waveguide structure, rectangular samples that fit into the
dimensions of the waveguide at the frequency being measured are required. For
coaxial lines, an annular sample is needed (Venkatesh, 1996).
2.5 Drying Systems
Different drying systems applicable for drying agricultural material drying will be
discussed in this section and importance will be given to microwave drying and
combination drying methods.

25
2.5.1 Hot-air Drying
The most common drying method employed for food materials to date has been
hot air drying (Mujumdar, 1995). But there are many disadvantages for this
method. Among these are low energy efficiency and lengthy drying time during
the falling rate period. This is mainly caused by rapid reduction of surface
moisture and consequent shrinkage, which often results in reduced moisture
transfer and, sometimes, reduced heat transfer (Feng and Tang, 1998). Due to
the low thermal conductivity of food materials in this period, heat transfer to the
inner sections of foods during conventional heating is limited (Feng and Tang,
1998). Several investigators of drying have reported that hot-air drying, hence
prolonged exposure to elevated drying temperatures, resulted in substantial
degradation in quality attributes, such as color, nutrients, flavor, texture, severe
shrinkage, reduction in bulk density and rehydration capacity, damage to sensory
characteristics and solutes migration from the interior of the food to the surface
(Bouraout et al., 1994; Yongsawatdigul and Gunasekaran, 1996; Feng and Tang,
1998; Maskan, 2000).
2.5.2 Cabinet Dryers
Cabinet dryers are small-scale dryers used in the laboratory and pilot plants for
the experimental drying of fruits and vegetables. They consist of an insulated
chamber with trays located one above the other on which the material is loaded
and a fan that forces air through heaters and then through the material by cross
flow or through flow.
2.5.3 Tunnel Dryers
Tunnel dryers are basically a group of truck and tray dryers widely used due to
their flexibility for the large scale commercial drying of various types of fruits and

26
vegetables. In these dryers trays of wet material, stacked on trolleys, are
introduced at one end of a tunnel (a long cabinet) and when dry are discharged
from the other end. The drying characteristic of these dryers depends on the
movement of airflow relative to the movement of trucks, which may move parallel
to each other either concurrently or counter currently, each resulting in its own
drying pattern and product properties.
2.5.4 Microwave Heating
Throughout history there has been one way to heat materials: apply heat to its
surface. About thirty years ago, industrial engineers began developing
microwave-heating techniques that avoid some limitations of conventional
heating. With microwaves a form of radio waves (neither nuclear nor ionizing
radiation) passes through the material. The molecules in the material then act
like miniature magnets attempting to align themselves with the electrical field.
Under the influence of this high frequency alternating electrical field, the particles
oscillate about their axes creating intermolecular friction, which manifests itself as
heat.
2.5.4.1 Advantages of Microwave Heating
In conventional heating the heat source causes the molecules to react from the
surface toward the center so that successive layers of molecules heat in turn.
The product surfaces may be in danger of over heating by the time heat
penetrates the material. Microwaves, however, produce a volume heating effect.
All molecules are set in action at the same time. It also evens temperature
gradients and offers other important benefits. Heating and drying with microwave
and dielectric energy is distinctly different from conventional means, whereas
conventional methods depend upon the slow march of heat from the surface of
the material to the interior as determined by differential in temperature from a hot
outside to a cool inside, heating with dielectric and microwave energy is, in effect,

27
bulk heating in which the electromagnetic field interacts with the material as a
whole. The heating occurs nearly instantaneously and can be very fast, although
it does not have to be. However, the speed of heating can be an advantage, and
it is often possible to accomplish in seconds or minutes what could take minutes,
hours and even days with conventional heating and processing methods.
A list of advantages of microwave and dielectric heating includes the following
(Mujumdar, 1995):
• Process speed is increased,
• Uniform heating may occur throughout the material. Although not always
true, often the bulk heating effect does produce uniform heating, avoiding
the large temperature gradients that occur in conventional heating
systems,
• Efficiency of energy conversions. In this type of heating, the energy
couples directly to the material being heated. It is not expended in heating
the air, walls of the oven, conveyor or other parts. This can lead to
significant energy savings. Also, the energy source is not hot and plant-
cooling savings may be realized,
• Better and more rapid process control. The instantaneous on-off nature of
the heating and the ability to change the degree of heating by controlling
the output power of the generator means fast, efficient and accurate
control of heating,
• Floor space requirements are usually less. This is due to the more rapid
heating,
• Selective heating may occur. The electromagnetic field generally couples
into the solvent, not the substrate. Hence, it is the moisture that is heated
and removed, whereas the carrier or substrate is heated primarily by
conduction. This also avoids heating of the air, oven walls, conveyor or
other parts,
• Product quality may be improved. Since high surface temperatures are not
usually generated, overheating of the surface and case hardening, which

28
are common with conventional heating methods are eliminated. This often
leads to less rejected product, and
• Desirable chemical and physical effects may result. Many chemicals and
physical reactions are promoted by the heat generated by this method,
leading to puffing, drying, melting, protein denaturation, starch
gelatinization and the like.
Applying microwave energy to drying could eliminate some of the problems
associated with conventional hot air drying methods. However, microwave drying
has also been associated with physical damage to the products e.g. scorching,
over heating or charring and uneven temperature distribution. Such physical
damage is the result of local temperatures rising continuously even though the
loss factor of material being dried decreases with the reduction in moisture
content. Alternatively, combination of microwave with hot-air convection flow or
vacuum can reduce the localized heating by creating a high temperature
environment in the product surface surroundings and remove surface moisture
driven by microwaves more efficiently.
2.5.5 Infrared Drying
Infrared energy has the ability to penetrate an object apart from conversion of
electromagnetic energy into heat. The depth of penetration of infrared is a
function of its wavelength. As a general statement, the shorter the wavelength,
the greater is its penetration power. Infrared increases surface temperature; this
in turn increases surface evaporation. For biological materials, however, infrared
heater temperatures greater than 830oC should be avoided as this can char the
product and cause surface damage (Sheridan and Shilton, 1999). At high
infrared heater temperature, the surface of the biological material loses moisture
and fat, resulting in the formation of a crust.

29
Based on wavelength / temperature of emission, infrared energy can therefore be
divided into three regions:
• Short wave or near infrared: 0.72 to 2 microns (3870 to 1180oC)
• Medium wave or middle infrared: 2 to 4 microns (1180 to 450oC)
• Long wave or far infrared: 4 to 1000 microns (<450oC)
2.5.6 Microwave-Hot-Air Combination Drying
In recent years, microwave drying offered an alternative way to improve the
quality of dehydrated products. Usually, drying is not induced by dielectric
heating alone, but most microwave drying systems combine microwave and
conventional heating. The heating may take place in separate operations or
simultaneously. Microwave drying, like conventional drying, is caused by water
vapor pressure differences between interior and surface regions, which provide a
driving force for moisture transfer. It is most effective at product moistures below
20% (Mudgett, 1989). Therefore, essentially for economic reasons, it has been
suggested that microwave energy should be applied in the falling rate period or
at a low moisture content (where conventional drying takes a long time) to finish
drying. And also because of the concentrated energy of a microwave system,
only 20-35% of the floor space is required, as compared to conventional heating
and drying equipment. However, Microwave drying has been used in drying of
herbs (Giese, 1992), potato (Bouraout et al., 1994), raisins (Kostaropoulos and
Sarvacos, 1995), apple and mushroom (Funebo and Ohlsson, 1998), diced
apples (Feng and Tang, 1998), carrots (Prabhanjan et al, 1995; Litvin, Mannheim
and Miltz, 1998; Lin, Durance and Scaman, 1998), blueberries (Ramaswamy and
Nsonzi, 1998) and banana (Maskan, 2000). Microwave application has been
reported to improve product quality such as better aroma, faster and better
rehydration, considerable savings in energy and much shorter drying times
compared with hot-air drying alone.

30
2.5.7 Microwave-Infrared Drying
Moisture accumulation at the food surface during microwave heating is a well-
known problem. Crispy surfaces become soggy and surface color development,
if desired, becomes difficult. Suggestions for the reduction of surface moisture
often point to increasing the surface temperature by one of two ways - addition of
an infrared source and/or hot air. Microwave-only heating results in surface
moisture build-up due to enhanced (pressure-driven) flow of moisture to the
surface and the cold ambient air’s inability to remove moisture at a high rate.
When absorbed mostly on the surface, infrared can reduce surface moisture and,
beyond a threshold power level, it can reduce the surface moisture to lower than
its initial value. Hot air also can reduce surface moisture and increase surface
temperature, but not as effectively as infrared heat, perhaps due to a much lower
surface heat flux for hot air compared to the infrared energy.
2.5.8 Microwave-Vacuum Drying
Low boiling points are developed due to low pressures during microwave-
vacuum dehydration, where the thermal damage was practically non-existent
according to Erle and Schubert (2000). As long as there is enough water in the
tissue, this boiling point can only be exceeded minimally due to dissolved
substances.
2.5.9 Freeze Drying
Vacuum freeze-drying is the best method of water removal with final products of
highest quality compared to other methods of food drying (Genin and Rene,
1995). Freeze drying is based on the dehydration by sublimation of a frozen
product. Due to the absence of liquid water and low temperatures required for the
process, rate of the deterioration and microbiological reactions would be very low
which can gives a final product of excellent quality (Mui et al., 2002). The solid

31
state of water during freeze-drying protects primary structure and the shape of
the products with minimal reduction of volume. Despite of many advantages,
freeze-drying has always been recognized as the most expensive process for
manufacturing a dehydrated product.
A longer shelf-life, product diversity and substantial volume reduction are the
reasons for popularity of dried fruits and vegetables, and this could be expanded
further with improvements in product quality and process applications. These
improvements in process selection could increase the current degree of
acceptance of dehydrated foods in the market.
2.6 End-product Quality Analysis
Color and rehydration ratio are very important quality attributes of the dehydrated
products. Processing steps such as slicing, cutting and drying always promote
the color changes, which lead to reduction in visual and organoleptic quality of
the dried product.
Rehydration ratio of the dehydrated product, i.e. the ratio of weight of processed
food after rehydration to the weight of dehydrated processed food without water
(g dehydrated product / g dehydrated product), can be determined as described
by Ranganna (1986). The moisture content of both dehydrated and fresh berries
can be determined by oven drying (AOAC, 1990).
2.7 Berry Drying Studies
According to Kostaropoulus and Saravacos (1995), Grabowski et al. (1992) and
Masi and Riva (1988), the drying time of surface pretreated grapes (immersed in
ethyl oleate, etc) was reduced by about half. Venkatachalapathy and Raghavan
(1997) found a significant effect using a combination of ethyl oleate (3%) and
NaOH (0.5%) for microwave drying of grapes. However, the convective drying
rate of the strawberries was improved by only about 10% as a result of this

32
pretreatment. In another study, surfactant pretreatment of basil leaves increased
the drying rate by a factor of 14 (Rocha et al., 1993).
One of the most useful pretreatments for drying of fruit is osmotic dehydration
(Beaudry, 2001). Osmotic dehydration is the incomplete removal of water from a
food product by means of an osmotic agent (usually either sugar or salt solution).
The main advantage of this process is its influence on the principal drying
method, shortening of the drying process, resulting in lower energy requirements.
Considering that heat is not applied in this stage, osmotic dehydration offers
higher retention of initial food characteristics such as color, aroma, nutritional
constituents and flavor compounds (Beaudry, 2001).
It was determined by Ponting and McBean (1970) that, for fruits with a waxy
surface layer, the most effective treatment is with ethyl esters of fatty acids,
especially oleic acid. Saravacos et al. (1988) and Tulasidas et al. (1993) used
ethyl oleate (EO) as a pretreatment and found that it can improve the drying rate
with only a minor effect on product quality. Beaudry (2001) tested different
concentrations and time periods of dipping for cranberries and concluded that
those have no significant influence on subsequent osmotic dehydration.
Harrington et al. (1978) found that application of ethyl oleate reduced the
incidence of cracking in drying cherries and increased the drying rate. Rahman
and Lamb (1991) and Rahman and Perera (1996) pretreated fresh cherry with
different chemicals and reported ethyl oleate to be the best for drying as a
pretreatment.
Tulasidas et al. (1993) reported that microwave convective combination drying
could be used for drying grapes into high quality raisins at a considerably
reduced drying time. Yang and Atallah (1985) studied the quality of intermediate
moisture low bush blueberries by four methods and reported that microwave-
assisted convection drying achieves the desired moisture level with in the least

33
time. Reddy and Meda (2005) reported that drying of saskatoon berries in
microwave-combination condition could be an effective preservation method for
the short harvest seasoned fruit crop. Dielectric properties of saskatoon berries
were measured to observe the effects of osmotic dehydration (Reddy et al.,
2005) and reported that solute uptake due to osmotic dehydration increased
dielectric loss factor values.
Yang et al. (1987) have studied the combined process of osmotic dehydration
and freeze drying to produce a raisin type blueberry product and reported that
the product exhibited good flavor, texture and overall quality and long shelf
stability.
2.8 Summary of Chapter II
This chapter essentially summarized various topics and aspects related to:
• Production, physico-chemical characteristics study of saskatoon berries,
• Dielectric properties measurement principles and techniques,
• Chemical pretreatment for berries / fruits,
• Osmotic dehydration technique and effect on drying methods,
• Drying techniques for agri-food / high moisture plant materials, and
• Development of microwave-convection drying system.

34
CHAPTER III – MATERIALS AND METHODS
In this section, we explain the experimental plan, analytical techniques, modeling
studies for drying data, end-product quality analysis and finally validate the data
for statistical significance.
3.1. Experimental Plan and Procedure
To meet the proposed research objectives, research outlines stated in Figure 3.1
were followed in our experimental drying process. This involved procurement of
North-line saskatoon berries of 2005 harvest, from a producer in Saskatoon
region and storing them in the freezer (-150C).
Frozen Saskatoon Berries
Chemical Pretreatment
Osmotic Dehydration
Microwave / Convection / Combination Drying
End Product Quality Analysis
Statistical Data Analysis
Figure 3.1 Stages of Saskatoon berry drying / dehydration process

35
Fresh berries were U-picked during the harvesting season. The next step was to
chemically pre-treat the berries prior to osmotic dehydration to verify the effect of
chemical pretreatment. Chemically pretreated berries were subjected to osmotic
dehydration using two solutes of three different concentrations. As a standard
practice for control treatment untreated berries were also used in the drying
process. The important and final step of our experiments was drying of untreated
and osmotic dehydration berries under microwave, convection and combination
drying methods. A quality change due to drying was analyzed by measuring the
color changes and rehydration-ratio after drying. All experiments were conducted
during summer and winter 2005. These drying steps are detailed in the following
sections of this chapter.
3.1.1 Chemical Pretreatment
To study the effect of chemical pretreatment on osmotic dehydration ethyl oleate
mixture was used. Chemical pretreatment tests were performed using a solution
of 2% ethyl oleate and 0.5% NaOH (mass basis) in distilled water. Liquid ethyl
oleate was previously kept in a freezer at –20oC, and granular NaOH at ambient
temperature. After thawing, the berries were wiped with soft tissue and dipped
into the prepared solution for different time period of 60,120 and 180 s
separately. All experiments were done at room temperature (230C). The
chemically pre-treated berries were then kept ready for osmotic dehydration
experiments.
3.1.2 Osmotic Dehydration
Osmotic dehydration was carried out with two osmotic agents: sucrose (solution),
commercially available fine granulated sugar with 990 brix, and high fructose corn
syrup (HFCS) of 700 brix. The effect of these two osmotic agents with respect to
dipping time was compared. Three concentration levels of sugar solution were
used in this study to compare the effect of the concentration of the osmotic

36
agents on osmotic dehydration. The sugar solution with 40, 50, and 600 brix
concentration were prepared and the chemically treated and untreated (thawed
but without treated with chemicals) saskatoon berries were immersed in the
osmotic reagents for a duration 6, 12, 18, 24 and 36 h, respectively.
Optimal chemical and mechanical pretreatments were determined, different
factors of osmotic dehydration were tested. These factors and their levels were
studied as below:
• Type of Sugar agent (Crystal sucrose and Liquid High Fructose Corn
Syrup)
• Concentration of sugar agent (40, 50 and 600 brix)
• Time of osmotic dehydration (6,12, 18, 24 and 36 h)
Different concentrations of sugar solutions were prepared and equivalent weight
of berries were added. The solution was mixed and known weights of berries
were collected after every 6 h and washed with tap water to remove the solute on
the berry surface during each sampling.
For simplification, only two counter-diffusions are usually assumed to take place
in osmotic dehydration process, with one being the water diffusing out from the
inner cell to the surrounding solution and the other being the solute diffusing from
the surrounding solution into the cell. Water Loss (WL, kg/kg fresh material) and
Solute Gain (SG, kg/kg fresh material) are two main parameters to consider in
this process. Both diffusion processes are interdependent.
3.1.3 Saskatoon Berry Drying
Drying is an important step in the preservation of saskatoon berries, to reduce
the M.C. from 75% (60% after osmotic dehydration) to 25% (or lower) in a very
short time after harvest. The experiments conducted under different drying
conditions are listed in Table 3.1.

37
The following parameters were measured and maintained in our experiments:
• Product temperature: 60, 70, and 800C (Microwave power levels: P1, P2
and P3),
• Airflow rate: 1 to 1.4 m/s,
• Relative humidity: 14-18%, and
• Final moisture content: 25%
Table 3.1 Experimental design indicating various treatments, drying modes and
power levels.
Microwave Combination (MW + Convection)
Convection Pre-treatment Condition
P1 P2 P3 P1 P2 P3 P1 P2 P3
60% Sucrose (24H)
3 3 3 3 3 3 3 3 3
60% HFCS (24H)
3 3 3 3 3 3 3 3 3
Untreated 3 3 3 3 3 3 3 3 3
Note: Convection air temperatures were higher (150C) to maintain product
temperatures of 60, 70, and 800C.
3.1.4 Microwave and Microwave-Convection Drying
For all the microwave and microwave combination drying studies, a Panasonic
Microwave-Convection oven NNC980W (Panasonic Canada Ltd, Ontario
Canada) that was developed into a stand-alone drying system was used. The
dryer system features and modifications are detailed in Chapter IV (Development
of dryer).
3.1.5 Convection Drying
For convection-only drying, a cross flow dryer in the bioprocessing laboratory that
was developed for thin layer drying of both high and low moisture agricultural

38
materials (Adapa et al., 2002) was successfully used. This dryer had the
following features and capabilities:
• Convection air temperature from 25 to 1500C,
• Relative humidity adjustment from 5 to 75%,
• Airflow rate from 0 to 2 m/s,
• Measurement of air (T-type thermocouples) and product temperatures
(Infrared sensor),
• Online moisture loss measurement, and
• Ability to record moisture loss, air temperature, product temperature, air
flow rate, and relative humidity during drying using a computer with
LabView 6i data acquisition software.
3.2 Analytical Procedures
3.2.1 Berry Sample Preparation
Frozen berries (North line variety) of 2004/05-harvest season were procured from
Riverbend Plantations, Saskatoon. Prior to all experiments, frozen berries were
taken out of cold storage and thawed at room temperature for 2 h, until the
produce temperature was equilibrated. Initial moisture content and total soluble
solids (TSS) content were 76% and 15.80 brix, respectively. Prior to individual
drying experiments, the whole fruit samples were taken out of cold storage and
thawed for 2 h. The moisture content of each sample was measured individually.
3.2.2 Moisture Content Determination
Saskatoon berry samples of 5 g were dried in a vacuum oven at 700C and 25 psi
for 7 h to assess their initial moisture contents. This experiment was carried out
in three replicates. The initial moisture content (MC) of the saskatoon berries was
determined as 76% dry basis (d.b.) according to AOAC Standards (1990).

39
3.2.3 Total Soluble Solids (TSS) Measurement
Saskatoon berries were manually crushed and the fruit syrup was extracted
through cheesecloth. Digital hand held pocket Refractometer (PAL-1, 0-530 brix,
and PAL-2,50-930 brix, ATAGO Co. Ltd, Japan) was used to determine the brix
level of the fruit syrup. PAL-1 had a measuring range of 0 to 53o brix and PAL-2
from 53 to 950 brix. For all measurements, 0.3 ml of the fruit extract sample was
used.
3.2.4 Dielectric Properties Measurement and Sample Preparation
In order to better understand the interaction of microwave and fruit samples, the
dielectric properties measurement was necessary. Also, from modeling point of
view this information might be useful. Measurement of the dielectric properties
was performed with an open-ended coaxial probe connected to HP 8510B
Network Analyzer setup in bioprocessing laboratory. The analyzer generates a
microwave signal through the coaxial probes. The material is tested by bringing
in contact the flat surface of the probe with the material under test. The fields at
the end of the probe “fringe” into the material and change as they come in
contact with the material. The network analyzer detects the magnitude and phase
shift of the reflected signal and calculates the reflection coefficient. Then
graphically computer controlled software calculates the dielectric properties from
these data and displays it as a function of frequency.
The coaxial probe (Figure 3.2) is a convenient and broadband technique for lossy
(materials with high dielectric loss factor values) liquids and solids. It is non-
destructive and little or no sample preparation is required for liquids or semi-
solids. In the case of a solid material under test, the material face must be
machined at least as flat as a probe face, as any air gap can be a significant
source of error. It operates at frequencies between 0.045 and 26.5 GHz. The

40
technique assumes the material under test to be non-magnetic and uniform
throughout.
The HP 8510 is a high performance microwave Vector Network Analyzer (VNA)
system. It consists of a HP 8510B, a Test Set (e.g. HP8515A S-Parameter Test
Set), and a Microwave Signal Source (HP 8341B). This Agilent VEE (Vector
network analyzer driver) controls the HP 8510 "system" as a whole. That is,
commands issued through the HP 8510 driver also control the test set and the
signal source. The open–ended coaxial probe technique was used to measure
dielectric properties of grain samples.
This method was selected for the following reasons:
• It allows simple sample measurement and data analysis,
• The instrumentation is commercially available, and
• Dielectric properties can be obtained over a wide frequency range in a
single measurement and with adequate accuracy for thermal calculations
(Engelder and Buffler, 1991).
An HP software program provided the permittivity based on the measured
reflection coefficient (Engelder and Buffler, 1991). For coaxial probe
measurements, the HP dielectric probe kit (HP 8510B) is utilized, which consists
of the probe, related software, and calibration standards. The calibration consists
of measuring three known standards with the probe (usually open air, short
block, and distilled water at room temperature). The calibration process removes
systematic errors from the measurement. The operating frequency range of the
system was set to 0.5 MHz to 5 GHz. All the measurements were taken at room
temperature (230C) and constant bulk density. The menu driven software was
installed on the personal computer and the control algorithm based software
computes the complex permittivity of the material under test from the S-
parameter information, which was relayed from the vector network analyzer
(VNA).

41
To reduce cable flexure and probe motion errors during measurements, a fixture
was developed which securely clamps the probe and its cable in a vertical
position (as shown in Figure 3.2). The fixture is equipped with a small table on
which the calibration standard or material under test is placed. This table is
mounted to a manually operated vertical position translator, which allows the
operator to raise the material under test up to the probe tip with high positional
precision and with the proper contact pressure.
Figure 3.2 Open-ended coaxial probe and adjustable platform
All dielectric measurements were performed at room temperature (230C).
Measurements for dielectric properties were performed using the HP Network
analyzer system on fresh and frozen saskatoon berries for the following different
fruit conditions:
• Whole berry,
• Cut berry,
• Berry paste, and

42
• Berry juice / Syrup
Osmotic dehydration process that involves loss of moisture and solid gain can
affect the dielectric properties of the fruit. As the drying experiments involved
drying of untreated and osmotically dehydrated saskatoon berries under
microwave conditions, measurement of dielectric properties before and after
osmotic dehydration revealed the effect of osmotic dehydration on drying
characteristics and microwave absorption characteristics of the material.
3.3 Dehydrated Product Quality Analysis
Quality analysis by measuring color changes and rehydration ratio were carried
out to explain the effect of the drying process and conditions on final dried
product.
3.3.1 Color Measurements
The color measurements were done using Hunterlab Color Analyzer (Hunter
Associates Laboratory Inc., Reston, Virginia, U.S.A.). The chromacity of
convection, microwave and microwave combination dried berries was determined
by measuring their respective L, a and b coordinates. After initial calibration
against standard white and black surface plates, three replication measurements
for each sample were taken. L being the lightness indicator and a and b are the
chromacity coordinates. Color difference values ΔL, Δa and Δb were calculated
according to the following equations:
ΔL = L-Lt (3.2)
Δa = a-at (3.3)
Δb = b-bt (3.4)
Where L, a and b are the measured values of the specimen and Lt, at, bt are
values of the target color. The target colors in this experiment are L, a and b of
43
the fresh saskatoon berry fruit. The total color difference ΔEab is measured using
the L, a, b color coordinates and as defined by the Equation 3.5 (Minolta, 1991):
ΔEab = [(ΔL)2 + (Δa)2 + (Δb)2]0.5 (3.5)
3.3.2 Rehydration Test
Rehydration tests of dried samples were performed by the method recommended
by Annon (1991). A sample of the dry material was weighed into a 500 ml beaker
containing 150 ml of distilled water. The beaker was placed on a hot plate and
covered with a watch glass, the water was brought to the boiling point in 3 min
and sample was added to the boiling water and boiled for an additional 5 min.
The sample was transferred to a 7.5 cm Buchner funnel covered with Whatman
No. 4 filter paper. Water was drained out until there were no more drops from the
funnel. The sample was then removed and weighed. Rehydration ratio was
calculated as the ratio of mass of rehydrated sample to that of the dehydrated
sample. The coefficient of rehydration (COR) is calculated by equation 3.6.
)M(M)M-(100 MCOR
fndh
inrh
−=
100 (3.6)
Where,
COR = Coefficient of rehydration,
Mrh = Mass of rehydrated sample (g),
Mdh = Mass of dehydrated sample (g),
Min = Initial moisture content of the sample before drying (%), and
Mfn = moisture content of the dry sample (%).
3.3.3 Micro-structural Analysis
The Phillips Scanning Electron Microscope (SEM 505, Phillips, Holland
Electrons Optics, Eindhoven, and Netherland) was used to visualize the
microstructure of the samples and study specimens that require higher

44
magnifications and greater depths of field that can be attained optically.
Saskatoon berries were observed for physical changes that occurred after
osmotic dehydration treatment and drying experiments. The digital image of
scanning electron microscope equipment is shown in Figure 3.3.
Samples were prepared in the following manner. The samples were kept free
from moisture and other contaminants as possible and then they were pinned
down to a sample holder using a conductive carbon tape that contained
adhesive on both the sides. The samples were first dried in vacuum drier at 1080
pascals pressure and 31.50C. With the sample conductively tied to the holder, a
non-conducting sample needs to go through one more preparation step.
Figure 3.3 Photograph of SEM system with computer

45
Figure 3.4 Functional components and operating principle of Scanning Electron
Microscope (SEM)
3.4 Modeling of Drying Process
Many researchers have adopted empirical models due to the consideration for
simplicity and accuracy. The simple type of drying model assumes that rate of
exchange in moisture content is proportional to the difference between moisture
content and Equilibrium Moisture Content (EMC) of the material. This section
deals with five identified drying modes reported in the literature and adapted to
our work.
3.4.1 Moisture Ratio Determination
Moisture ratio was determined in order to compare each set of data, e.g., berries
at 600C and different drying treatments (microwave, convection and
combination). Moisture ratio was calculated using following equation:

46
ei
e
MMMMMR−−
= (3.7)
Where,
MR = Moisture Ratio,
M = Average moisture content, % (d.b. at drying time t),
Mi = Initial moisture content, % (d.b.), and
Me = EMC, % (d.b.).
Based on extensive review of literature, the drying models listed in Table 3.2
were developed and adapted for our research. The moisture content data at
different microwave, combination and Convection temperature (power levels)
were fitted against drying time, using the various models given in Table 3.2.
Table 3.2 Drying models fitted for the drying data
Model No. Name Drying Models References
1 Page Eqn. MR=exp(-k tn) Liu and Bakker-Arkema (1997)
2 Modified Drying Eqn. MR=a+exp(-k tn) Agrawal and Singh (1977)
3 Wang and Singh MR=1+at+bt2 Wang and Singh (1978)
4 Sharma et al. MR=a*exp(-bt)+c*exp(-dt) Sharma et al. (2005)
5 Midilli Equation MR=a*exp(-k(tn))+b*t Midilli et al. (2002)
Where,
MR = Moisture Ratio (Equation 3.7),
k = Drying constant, min-1
t = Drying time, min
a, b, c, and d = Constants

47
3.5 Statistical Analysis
3.5.1 Chemical Pretreatment
One-way ANOVA was performed to verify if there was significant difference in
solute uptake between control treatment and 3 chemical pre-treatment levels.
Factors for analysis were:
• 1 control treatment – Untreated berries
• 3 treatments – 60, 120 and 180 s chemical pretreatment duration
• 3 replications
3.5.2 Osmotic Dehydration
Three-factor Randomized Complete Block Design (RCBD) was used to verify the
effect of solutes, solute concentrations and time effect on solute uptake and
mass loss.
RCBD: After the experimental units are blocked, treatments are assigned at
random within each block such that each treatment occurs once in every block.
During the conduct of the experiment where the order of processing the material
may make a difference, units are processed by block and in a completely random
order within each block.
Model for RCBD is shown below:
Yij = µ + τi + βj + εij (3.8)
Where,
Yij = Observed value for the jth replicate of the ith treatment (where i=1 to t and j=1
to b),
µ = Grand mean,
τi = Treatment effect for the ith treatment; the treatment effects may be either
fixed or random,

48
βj = Block effect for the jth block, and
εij = Random error associated with the Yij experimental unit.
For osmotic dehydration there were 3 treatments (i=3) and 3 replications (j=3).
The treatments were:
• Solutes – sucrose and high fructose corn syrup,
• Solute concentrations - 40, 50, and 60%, and
• Time - 6, 12, 18, 24, and 36 h.
3.5.3 Drying Experiments
Two-factor RCBD was used to verify the effect of 2 treatments and 3 replications
on drying time.
The treatments were:
• Drying modes – microwave, microwave-convection, and convection
drying, and
• Power level – 3 levels (60, 70 and 800C product temperatures).

49
Chapter IV – DEVELOPMENT OF A MICROWAVE DRYER SYSTEM
For this research study, dryer development was a major contribution and majority
of the research time and effort was dedicated for the equipment modifications,
installation of sensors, tools, data acquisition system and other accessories to
modify domestic microwave-convection oven into a laboratory scale microwave-
convection combination dryer system. This section explains the above mentioned
points in detail. Modification of the oven with necessary instrumentation and
installation of measurement systems (temperature, weight-loss, etc) along with
data acquisition system capabilities were carried out.
4.1. Configuration of Microwave-Convection Oven
A commercially available Microwave-convection oven Panasonic (NNC980W)
(Panasonic Canada Ltd, Ontario Canada) was used for development into a
stand-alone drying system. The system controls the microwave power output in
continuous mode rather than as a duty cycle. The dimensions of the cavity were
0.24 x 0.41 x 0.42 m. From the ceiling of the oven cavity, a blower fan forced the
preheated air through a meshed inlet into the cavity. A pair of electrical heaters of
1400 W capacity was controlled by a variable transformer in order to supply
heated air at required temperature levels.
The following design and operating features were built-in with a commercial
oven:
• 10 different modes of microwave power (220 – 1000 W),
• Inverter technology for variation of microwave power,
• The dimensions of the cavity are 0.24 x 0.41 x 0.42 m,
• Convection / Hot-air (1400 W) stream which operated independently and
also in combination with microwave at two set-point convection
temperatures,

50
• Convection fan running with a 12 V input voltage and a maximum air flow
rate of 1.5 m/s, and
• Humidity sensor at the outlet of convective air from the dryer system.
The following system modifications were identified to be developed into an
integrated combination dryer system:
• Separate controls for microwave and convection air,
• Temperature controller installation for convection air and fan control,
• Inserting fibre optic probes into the oven and making arrangements for
online temperature measurement using fibre optic sensors and record the
data using LabView 6i software,
• Sample holder design to dry approximately 100 g of berries, and
• Weighing the sample during drying to measure the real-time moisture loss
and record the data using LabView software.
4.2. Microwave and Convection System Instrumentation
There was an option to toggle between preset system conditions and modified
settings. Following were the preset settings:
• Microwave control was from the front panel (set different power levels and
time) both in manual and automatic manner,
• A second panel; convection panel in Figure 4.1, was integrated to the
system having two stopwatches, one for convection and the other one for
microwave. One digital counter with display was added to this circuitry to
count the number of times toggling between microwave and convection,
and
• Convection fan operation during convection / combination / manual mode
was continuous.

51
Figure 4.1 Front panels of the microwave drying system (left panel to set
microwave power and run-time and right panel to set and monitor convection
temperatures)
4.3. Convection Air Temperature Controller Installation
In manual control setting for convection air temperature adjustment and control,
an OMEGA CN9000A temperature controller was installed (Figure 4.1). In this
temperature controller, a set point for temperature setting temperature from room
temperature to 1500C. Once the set point temperature was reached, a solid-state
relay (SSR) circuit switched off the connection stream, which was in connection
with the temperature controller and heater filament system.
Microwave Panel
Convection Panel
Temp Controller

52
Figure 4.2 Teflon block fabricated to insert fibre optic temperature probes in to
the microwave cavity
Figure 4.3 An assembly of fibre optic temperature sensors and signal conditioner
for temperature measurement
Signal Conditioner
Fibre Optic Temp Probes

53
Figure 4.4 Aerial view of the convection fan and the belt pulley arrangement
Based on the set of preliminary experiments, it was observed that the voltage
supply to the heater was of 1400 W (maximum) all the time. The fan and heater
units switched off automatically when the set point temperature was reached.
This was not a favorable condition in continuous drying systems where fan must
be running all the time to maintain constant airflow rate. To overcome this
problem, a rheostat and voltmeter in series with temperature controller was set-
up. By varying the rheostat the resistance varied in the circuit causing a change
in voltage supply to the heater that was displayed on the voltmeter. This circuit
helped to supply a known voltage to the heater to attain the set point temperature
and maintain the same throughout. Convection fan was supplied with constant
voltage of 12 V to run continuously even when the heater went off maintaining a
constant airflow rate.
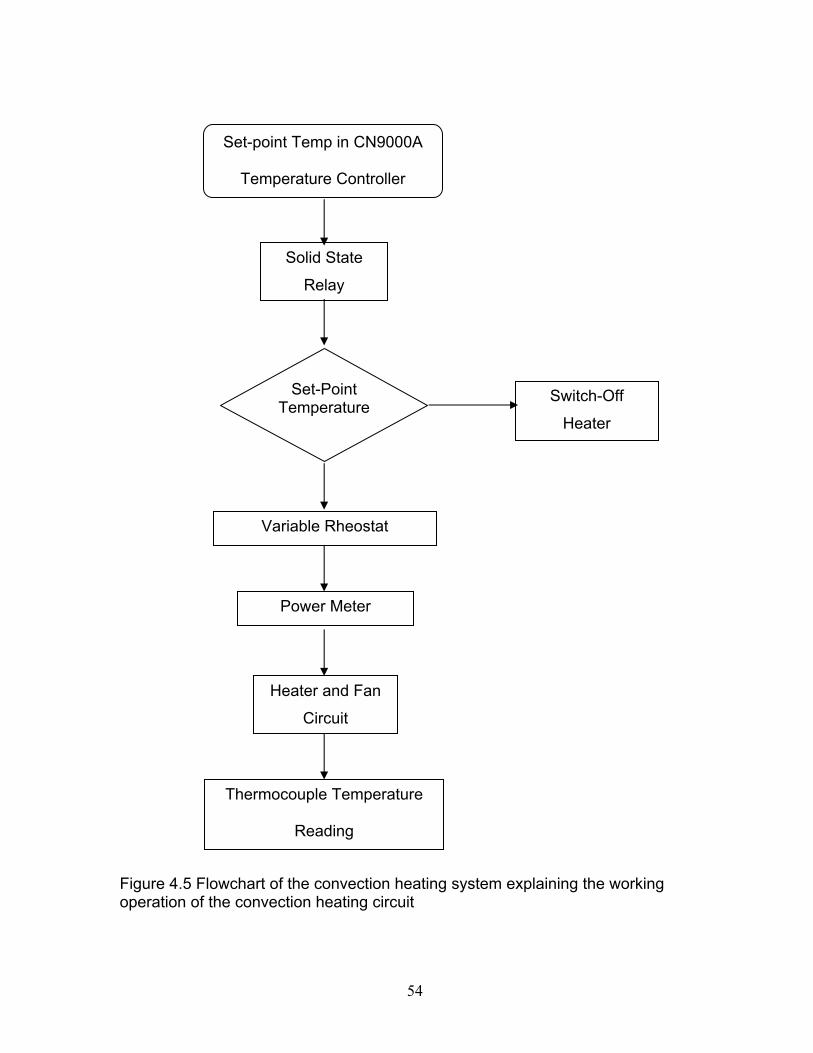
54
Figure 4.5 Flowchart of the convection heating system explaining the working operation of the convection heating circuit
Set-point Temp in CN9000A
Temperature Controller
Solid State
Relay
Set-Point Temperature
Variable Rheostat
Power Meter
Heater and Fan
Circuit
Switch-Off
Heater
Thermocouple Temperature
Reading

55
4.3.1 Airflow Rate Measurement
Airflow rate measurement was carried out using a hot-wire anemometer at
different spots in the microwave chamber. Airflow variation at the sample holder
position was 1 ± 0.1 m/s around the sample holder location.
4.4 Data Acquisition Module Integration
Data acquisitions for temperature and weight loss were performed
simultaneously during drying using an IBM laptop (Pentium II) with programs
written in LabView 6i.
Figure 4.6 Temperature data acquisition flowchart explaining the step-by-step
procedure adapted in temperature data acquisition

56
4.4.1. Temperature Data Acquisition
The Fiso four channel sensor and signal conditioner (UMI 250, Fiso Canada, -50
to 2500C, 0.010C accuracy) to computer modules are a family of complete
solutions designed for data acquisition systems based on personal computers
and other process based equipment’s with standards I/O ports.
The module converts four analog input signals to engineering units (shown in
Figure 4.6 and Figure 4.7) and transmits in ASCII format to any host with
standard RS-485 or 232C ports. The maximum number of channels for
temperature measurement was limited to four. The unit was interfaced to a
personal computer via an RS 232 serial port or USB post from the DAQ card.
Figure 4.7 Temperature data acquisition main screen of LabView 6i program

57
4.4.2. Data Acquisition Software
In order to get continuous temperature time data LabView 6i module software
was used for data acquisition. Data acquisition hardware was connected to
LabView through the Fiso UMI Signal conditioner module for temperature data
and through serial I/O port for weight loss data.
4.4.3. Online Weight-Loss Measurement
Ohaus Adventurer (Ohaus, Ontario, Canada, 2004, 0.1g accuracy) 800 g
balance was mounted on top of the microwave oven and a sample holder
specifically designed for drying of 100 g of sample, made of polycarbonate, was
hooked on to the balance hook located below that read data.
Figure 4.8 Ohaus balance mounted on top of the microwave system to record
online weight loss data
This scale was connected to the laptop computer via Serial I/O post to record the
data at specific intervals using serial communication VI (LabView software
Ohaus balance

58
program) and finally written onto a Microsoft Excel (2003). There was slight
variation in the data acquisition pattern due to convective air movement.
Figure 4.9 Weight-loss data acquisition flowchart indicating the step-by-step
procedure adapted in temperature data acquisition
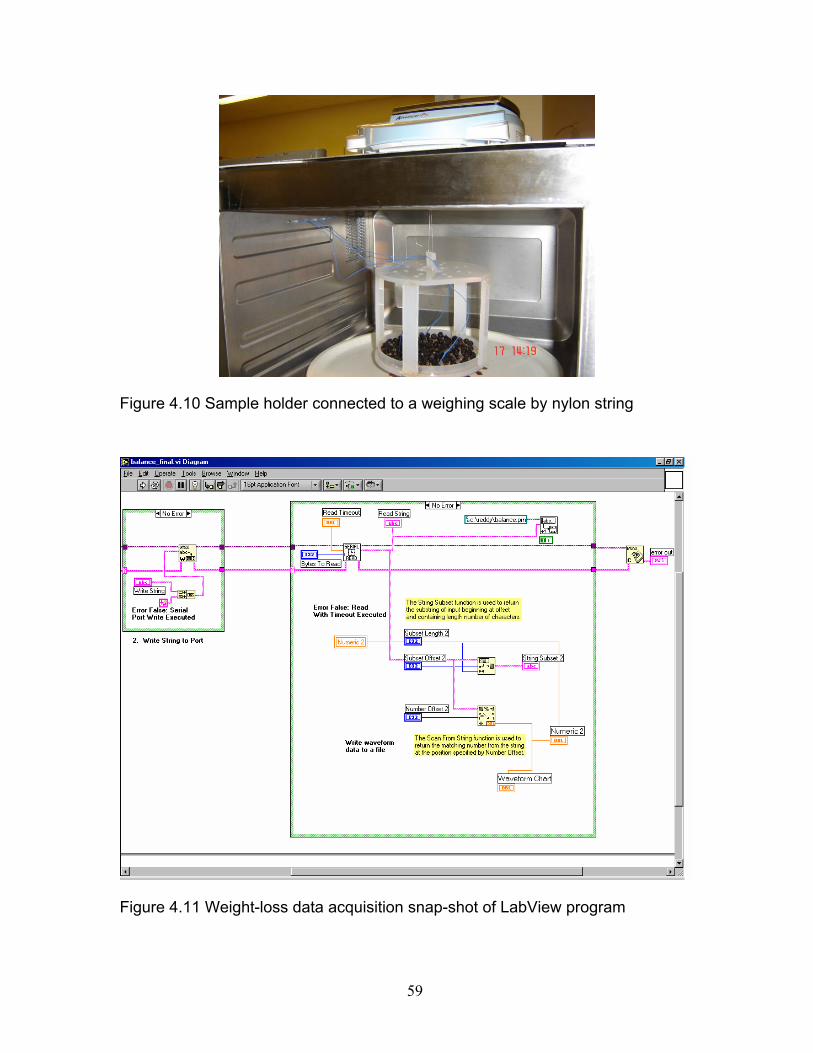
59
Figure 4.10 Sample holder connected to a weighing scale by nylon string
Figure 4.11 Weight-loss data acquisition snap-shot of LabView program

60
Figure 4.12 Sample holder with saskatoon berry dried samples with temperature
sensors
4.4.3.1. Weight-loss Calibration
Airflow movement surrounding the sample holder would cause change in weight
measurement. To overcome this problem, the Ohaus balance was calibrated to
acquire data after the sample holder stabilized with the air movement. Berries of
known quantity (100 g) were placed in the sample holder with convection air flow.
LabView program acquired data on the laptop and this weight was berry weight
with error factor due to air movement. Final weight of the berries was
predetermined and it was possible to calculate actual berry weight by deducting
the error factor value.
4.5. Standard Reference Material (Water) Testing
The measurement of power output of the microwave oven was determined
calorimetrically (Khraisheh et al., 1997) i.e. the change of temperature of a
known mass of water for a known period of time. The basic equation is:

61
( )t
TmCpΔ
Δ=
187.4MWabs (4.1)
Where,
MWabs = power absorbed by the sample (W),
m = Mass of sample (g),
Cp = Specific heat of the material (kJ/kg-C),
∆T = Temperature rise in the water load (oC), and
∆t = Heating Time (s).
Table 4.1 Measured output power of the microwave system
POWER LEVEL (Settings in Microwave)
MEASURED POWER (Watts)
P10 1000
P9 751
P8 682
P7 689
P6 628
P5 500
P4 392
P3 295
P2 (Pulsating) 295 (7 sec off and 14 sec on)
P1 (Pulsating) 295 (14 sec off and 7 sec on)
Water into two one-liter beakers weighing 2,000 ± 5 g were placed in the center
of the oven, side-by-side in the width dimension of the cavity, and touching each
other. The beakers initially should be at ambient room temperature and the initial
water temperature should be 20°C ± 2°C (Buffler, 1993). The oven was run at all
inbuilt microwave power levels for 2 min and 2 s, the beakers were removed and

62
the final temperatures recorded. Absorbed power is calculated from a simplified
formula of Equation (4.1):
( )21 ΔTΔT35P +×= (4.2)
Where,
ΔT1 and ΔT2 are the temperature increases of the water in the two beakers (oC).
Power measurement was repeated for three times, with the final oven power
being the average of the three readings (Table 4.1). If any individual
measurement was more than 5% away from the average, the complete test was
repeated.
NOTE: The water in each vessel should be well stirred before measuring both
the starting and final temperature. A small object, such as a plastic spoon or the
handle of a wooden spoon works well.
4.6 Summary of Chapter IV
An existing domestic microwave oven developed into an integrated laboratory-
scale drying system. The following lists the specifications of the developed
functional system:
• System Feasibility – The developed drying system can be used for drying
of varied agricultural / food materials under microwave, convection and
microwave-convection combination drying conditions,
• Microwave Power Control – Different output power levels of microwave
can be selected depending on the power requirement to dry a product,
• Convection Power Control – Output temperatures in the oven can be set
in the temperature controller (room temperature to 200oC) that is
maintained by the variable rheostat and the solid-state relay circuit,
• Temperature Measurement – Installed fibre optic temperature probes with
signal conditioner will measure online product and the drying environment
temperature that is recorded on the laptop with a LabView program, and

63
• Weight Measurement – Weighing scale mounted on top of the oven was
connected to the sample holder that acquired product weight loss data
online and this data was transferred to the laptop (connected through
serial port) with LabView program.

64
CHAPTER V – RESULTS AND DISCUSSION
In this chapter, drying experiments results obtained using the developed
laboratory-scale microwave drying system (discussed in detail in Chapter IV) will
be explained. Data obtained from chemical pre-treatment, dielectric properties
measurement, osmotic dehydration and final-drying experiments will be
presented with statistical analysis.
5.1. Chemical Pre-treatment Experiments
To assess the effect of ethyl esters (ethyl oleate) and NaOH on osmotic
dehydration (OD), untreated sample brix (TSS) measurement was used as a
control, as explained in Chapter 2.2.3.
15
18
21
24
40 50 60
HFCS Conce ntra tion (brix )
Sask
atoo
n be
rry
TSS
(brix
)
Untreated Pre treatment 60s
Pre treatment 120s Pre treatment 180s
Figure 5.1 Saskatoon berries brix levels (TSS) after Chemical Pre-treatment and
6 h Osmotic Dehydration with high fructose corn syrup

65
Another factor to assess the effect of chemical pre-treatment was by observing
the berry surface under a scanning electron microscope (before and after
treatment) for any physical changes that might occur on the fruit surface (waxy
layer / epithelial tissues) of fresh and chemically pre-treated osmotically
dehydrated berries. Figure 5.1 shows different sugar concentration (40, 50 and
60%) effect on untreated and chemically pre-treated berries for 60, 120 and 180
after 6h of osmotic dehydration. The solute gain increases with increase of sugar
concentration of the solution; fruit brix of untreated berries is higher than pre-
treated samples. Pre-treatment after 180 s showed higher brix values for all
three-sugar concentrations. One-way ANOVA on the results shows chemical pre-
treatment had no significant (P=0.753) effect on osmotic dehydration process on
saskatoon berries. Data for both high fructose corn syrup and sucrose osmotic
dehydration results is presented in Table 5.1.
Table 5.1 Moisture content and Total soluble solids of osmotic dehydrated
berries after chemical pre-treatment
Osmotic Agent
Chemical pre-treatment (sec)
Sugar Content (Brix)
Moisture Content (% wb)
Treatment Final Initial Initial Final Sucrose (P1)60 19.1 15.8 76 73.1
(P2)120 18.6 15.8 76 74 (P3)180 20.2 15.8 76 73
HFCS (P1) 60 16.9 15.8 76 72.7 (P2) 120 19.8 15.8 76 73.8 (P3)180 20.1 15.8 76 73.15 Untreated 19.5 15.8 76 73.8
Frozen berry surface layer sections were observed under SEM before and after
osmotic dehydration. Figure 5.2 shows a section of the fruit with waxy skin layer
and a spot on the fruit where the surface layer is peeled off exposing the
epithelial cell. Black color seen inside the cells was mainly water and other
cellular constituents. These spots were more than at least five on a single whole
berry. The damage of the fruit might have occurred during the freezing process
or after freezing during storage. After freezing when packed in polythene bags,

66
berries stick to each other, which might have left scars during their separation
while thawing. From observation under SEM after osmotic dehydration, Figure
5.3 and Figure 5.4 showed white spots within the cell and were assumed as
sugar crystals / molecules.
Preliminary Experiment with Blueberries: In summer 2005, a series of
microwave drying experiments were conducted with fresh blueberries available in
the market as a comparative study for saskatoon berries. Blueberries have
similar physical and chemical properties to that of saskatoon berries. Even at low
power microwave heating, the berries tend to burst open due to the enormous
heating capability of the microwaves from material core. Results from the study
are presented in Appendix B1. This study suggests that frozen berries physical
state favors osmotic dehydration and drying but fresh berries should have a pre-
treatment step before dehydration.
5.1.1. Effect on Osmotic Dehydration
Solute uptake was assessed by measuring the brix values after each stage of
osmotic dehydration (Table 5.1), shows that pre-treatment had very minimal or
no significant effect in increasing the osmotic reaction for both sucrose and high
fructose corn syrup. One of the reasons for this could be immediate freezing of
the fruit after harvest, which can disturb the integrity of berry structure. This can
be seen in Figure 5.2, when a whole berry is observed under Scanning Electron
Microscope (SEM), the epithelial layer with wax coated is disturbed and the
epithelial cells are being exposed. These spots were more than one on a single
fruit, which might as well help during osmotic dehydration process for the two-
way diffusion process.

67
Figure 5.2 Frozen berry cut section of the berry skin under SEM
Figure 5.3 SEM of saskatoon berry osmotically dehydrated with 50% high
fructose corn syrup (HFCS) solution for 24 h without chemical pre-treatment
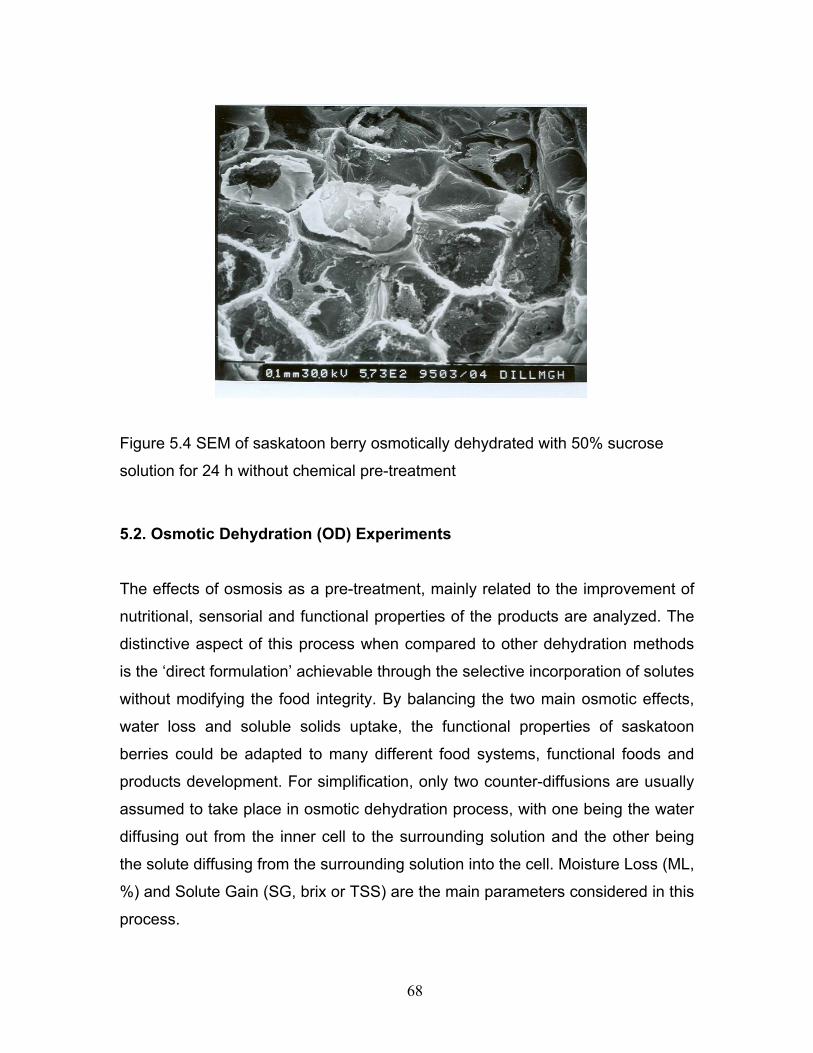
68
Figure 5.4 SEM of saskatoon berry osmotically dehydrated with 50% sucrose
solution for 24 h without chemical pre-treatment
5.2. Osmotic Dehydration (OD) Experiments
The effects of osmosis as a pre-treatment, mainly related to the improvement of
nutritional, sensorial and functional properties of the products are analyzed. The
distinctive aspect of this process when compared to other dehydration methods
is the ‘direct formulation’ achievable through the selective incorporation of solutes
without modifying the food integrity. By balancing the two main osmotic effects,
water loss and soluble solids uptake, the functional properties of saskatoon
berries could be adapted to many different food systems, functional foods and
products development. For simplification, only two counter-diffusions are usually
assumed to take place in osmotic dehydration process, with one being the water
diffusing out from the inner cell to the surrounding solution and the other being
the solute diffusing from the surrounding solution into the cell. Moisture Loss (ML,
%) and Solute Gain (SG, brix or TSS) are the main parameters considered in this
process.

69
5.2.1. Effect on Moisture Loss and Solid Gain Table 5.2 Solid gain and Moisture loss during osmotic dehydration from 6 to 36 h
duration
Solute Gain (SG, brix) Moisture Loss (ML, %)
Sucrose 6h 12h 18h 24h 6h 12h 18h 24h
40 19.5 21.1 22.1 23.0 75.3 73.7 73.3 71.4
50 21.0 23.1 26.0 26.7 75.0 71.6 70.3 68.0
60 23.7 28.4 27.6 30.5 74.4 69.0 67.1 63.1
HFCS 6h 12h 18h 24h 6h 12h 18h 24h
40 22.3 24.8 25.0 27.2 74.1 72.1 71.1 68.5
50 23.8 28.4 28.9 32.1 71.4 69.8 66.7 64.9
60 24.7 30.4 31.9 34.8 70.6 66.8 63.7 60.6
Figure 5.5 and Figure 5.6 shows the evolution of water content from saskatoon
berries during osmotic dehydration process using different concentrations of
sucrose and high fructose corn syrup solutions. It can be seen that solute gain
increases along with the increasing osmotic solution concentration in the range of
40-60% (Figures 5.7 and 5.8). Rate of ML and SG in sucrose solution during the
initial phase (6 h period) was very slow for all concentrations and then highest
rate of two-way diffusion was observed in the second phase (12 h period) of the
osmotic dehydration process. After the second phase osmotic dehydration
process follows a straight-line trend till the end of 24 h period. The diffusion rate
after 24 h reduces very much and there is very less solute uptake during the next
12 h period. Table 5.2 shows the mean values of ML and SG for the 36 h osmotic
dehydration process and both the factors had significant difference (P<0.05) with
time, sugar solution concentration and interaction effect of time and solution
concentration.

70
60.00
65.00
70.00
75.00
80.00
Initial 6 12 18 24 36
Time (h)
Moi
stur
e C
onte
nt (%
d.b
.)40% 50% 60%
Sucrose C t ti
Figure 5.5 Moisture loss during the 36 h osmotic dehydration in sucrose solution
at 40, 50 and 60% concentrations
55.00
60.00
65.00
70.00
75.00
80.00
Initial 6 12 18 24 36
Time (h)
Moi
stur
e C
onte
nt (%
d.b
.)
40% 50% 60%
HFCS
Figure 5.6 Moisture loss during 36 h osmotic dehydration in high fructose corn
syrup (HFCS) solution at 40, 50 and 60% concentrations

71
5.2.2. Effect on Solute Gain
15.00
20.00
25.00
30.00
35.00
Initial 6 12 18 24 36
Time (h)
TSS
(brix
)
40% 50% 60%
Sucrose
Figure 5.7 Solute gain during 36 h osmotic dehydration in sucrose solution at 40,
50 and 60% concentrations
The kind of sugar utilized as osmotic substance strongly affects the kinetics of
water removal and the solid gain. By increasing the molar mass of solutes
(HFCS), a decrease of solute gain and an increase of moisture loss were
obtained, thus favoring weight loss and the dehydration aspect of the entire
process. Glucose that has low molecular weight has a more profound effect on
water activity depression than polysaccharides like sucrose (Argaiz et al., 1994).
Therefore, when compared to sucrose medium, high fructose corn syrup
revealed an effective water removal rate.
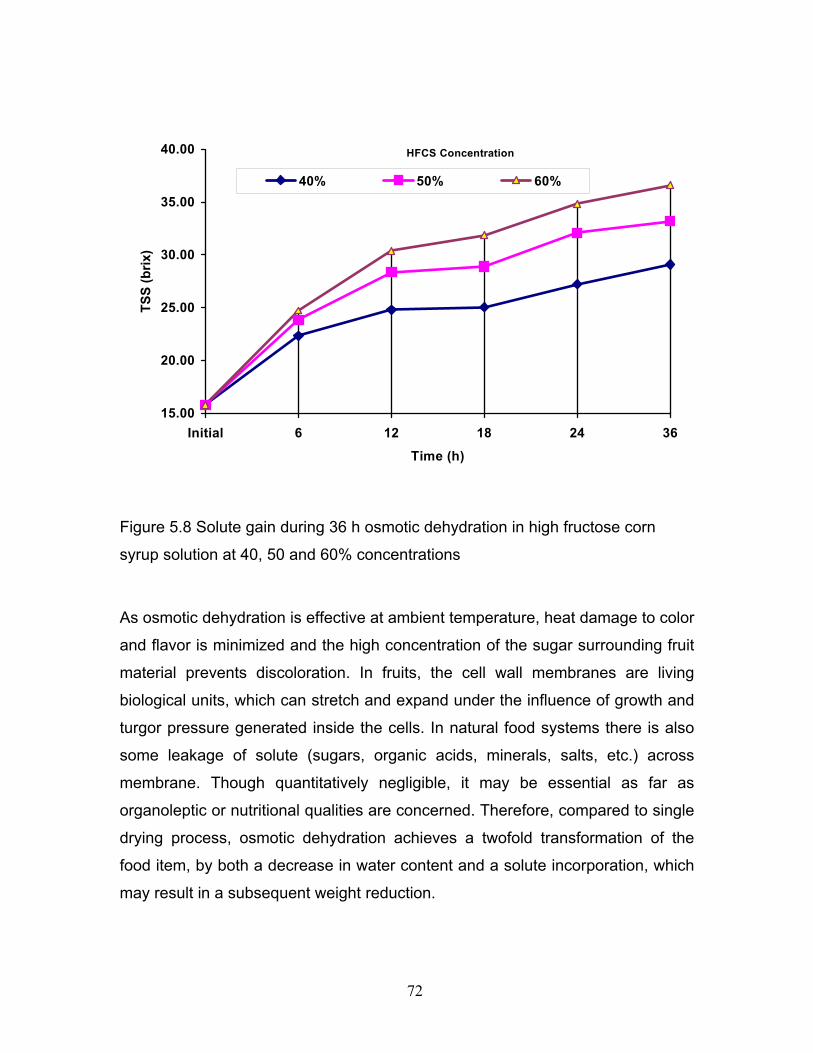
72
15.00
20.00
25.00
30.00
35.00
40.00
Initial 6 12 18 24 36
Time (h)
TSS
(brix
)
40% 50% 60%
HFCS Concentration
Figure 5.8 Solute gain during 36 h osmotic dehydration in high fructose corn
syrup solution at 40, 50 and 60% concentrations
As osmotic dehydration is effective at ambient temperature, heat damage to color
and flavor is minimized and the high concentration of the sugar surrounding fruit
material prevents discoloration. In fruits, the cell wall membranes are living
biological units, which can stretch and expand under the influence of growth and
turgor pressure generated inside the cells. In natural food systems there is also
some leakage of solute (sugars, organic acids, minerals, salts, etc.) across
membrane. Though quantitatively negligible, it may be essential as far as
organoleptic or nutritional qualities are concerned. Therefore, compared to single
drying process, osmotic dehydration achieves a twofold transformation of the
food item, by both a decrease in water content and a solute incorporation, which
may result in a subsequent weight reduction.

73
5.2.3. Effect on Dielectric Properties
Loss of moisture can reduce the dielectric constant value and also solute gain
with increase in dielectric loss factor values that affect the microwave absorption
in microwave environments. So measurement of dielectric properties prior to
microwave drying yielded useful information on energy absorption and
dissipation levels for berries.
5.2.3.1. Effect on Dielectric Constant
The dielectric constant decreased with increasing solute concentration in the
berry. The lower the moisture content, the lower the dielectric constant (Figure
5.9 and Figure 5.10).
0
10
20
30
40
50
60
70
80
915 2450 915 2450
12 24Time (h) and Frequency (MHz)
Die
lect
ric c
onst
ant a
nd L
oss
fact
or
Dielectric constant
Dielectric loss factor
Figure 5.9 Osmotic dehydration effects on dielectric properties after 12 and 24 h
durations at 50% high fructose corn syrup Concentration

74
This was expected, since water being a strong polar solvent in most foods, the
molecules reoriented in response to changes in field polarity. Therefore, water
component of the food contributed to the dielectric constant response. As
discussed in Chapter 2.3.2.2 the higher the ash content (mostly composed of
solutes), the lower will be the dielectric constant. Solutes bind with water
molecules and decrease their ability to reorient themselves in response to the
changing electromagnetic field direction and this lowers the dielectric constant.
5.2.3.2. Effect on Dielectric Loss Factor
0
10
20
30
40
50
60
70
915 2450 915 2450 915 2450
40 50 60Frequency (MHz) and Solution Concentration (%)
Die
lect
ric c
onst
ant a
nd L
oss
fact
or
Dielectric constant Dielectric loss factor
Figure 5.10 Osmotic dehydration effects on dielectric properties at 40, 50 and
60% high fructose corn syrup concentrations and respective frequencies (915
and 2450 MHz)

75
The moisture content-dielectric loss factor relationship reported in the literature is
complex. Funebo and Ohlsson (1999) indicated that dielectric loss factor peaked
at moisture content between 44 and 67% at 2800 MHz. Dielectric loss factor of
maple syrup also decreases with increasing moisture content (35 to 98%) at 240
MHz. From Figures 5.9 and 5.10, it can be observed that increasing solute
concentration and decreasing moisture content in the berry, resulted in an
increase in dielectric loss factor values. For the two-step drying approach, further
reduction of moisture was achieved under microwave conditions, as the sugar
infused berry favors improved distribution of microwaves within the material and
reduced drying time and energy.
5.3. Drying Characteristics
Drying of osmotic dehydration pre-treated and untreated saskatoon berries were
done under:
• Microwave-only,
• Convection-only and
• Microwave-convection combination conditions.
The dryer system described in Chapter IV was used for microwave and
combination drying whereas Thin-layer cross flow dryer discussed in Chapter
2.3.2.1 was used for convection drying studies. Drying is a crucial step in
preservation of saskatoon berries, in bringing the M.C. from 75% (60% after
osmotic dehydration) to 25% (or lower) in a very short time after harvest.
Combined microwave-hot-air-drying was more effective in reducing the moisture
content of saskatoon berries without damaging the quality attributes of the
finished product. No similar work has been reported on saskatoon berry drying.
The development of combined microwave-hot-air-drying system to produce high
quality dried saskatoons in relatively short time could make significant
contribution to the saskatoon berry industry.

76
Sugar infused into saskatoon berries during osmotic pre-treatment reduced
drying rates during the second drying period as compared to untreated berries,
and also osmotic dehydration reduced the total energy consumption on top of the
preferential sensory characteristics of the final product. One energy-efficient
drying technology was osmotic dehydration in combination with the above-
mentioned drying operations. Such a hybrid technology was particularly
advantageous when drying berries because a significant fraction of moisture was
removed non-thermally with simultaneous infusion of desirable solutes. On the
other hand, thermal drying after osmotic dehydration was necessary to reduce
moisture content to its final value.
5.3.1. Drying Time
Drying rate is defined as the amount of water removed and time is shown in
Figures 5.11 and 5.12 for berry samples during different drying conditions at 60,
70 and 80oC. It is apparent that drying rate decreases continuously with
improving drying time. The results indicated that diffusion was the most likely
physical mechanism governing moisture movement in the berry samples. The
results were generally in agreement with some literature studies on drying of
various food products. Microwave drying alone without hot air conditions has
higher drying rates and lower drying time than convection-only drying but
combination drying is far more efficient. The drying time in microwaves can be
reduced by 1.15 times at 60oC and 2.36 times at 70oC drying temperature when
compared to convection drying.
Drying time varied from 26 to 200 min (Table 5.3) for the range of experimental
parameters. The drying time in general decreased with the increase in
microwave power level and further reduced the drying time during combination
drying. The decrease being more with the increase in power level, in comparison
to the increase in temperature indicating that the effect of microwave power level
was more significant than temperature in reducing the drying time.
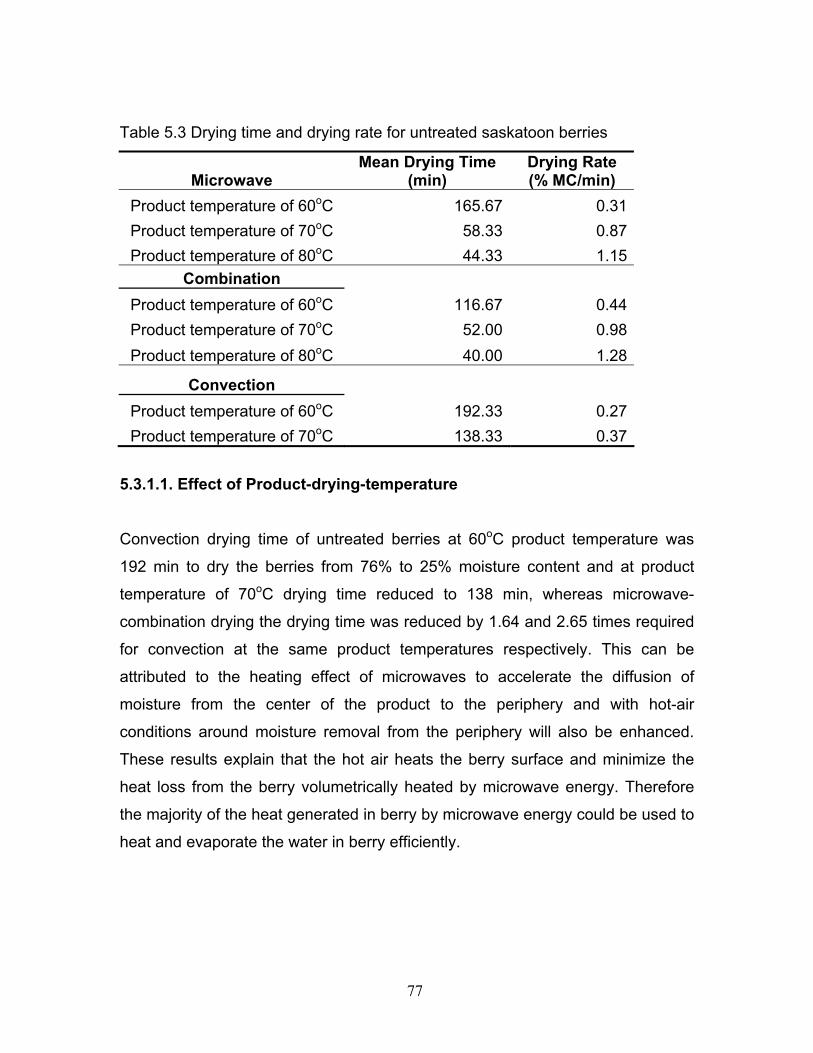
77
Table 5.3 Drying time and drying rate for untreated saskatoon berries
Microwave Mean Drying Time
(min) Drying Rate (% MC/min)
Product temperature of 60oC 165.67 0.31 Product temperature of 70oC 58.33 0.87 Product temperature of 80oC 44.33 1.15
Combination Product temperature of 60oC 116.67 0.44 Product temperature of 70oC 52.00 0.98 Product temperature of 80oC 40.00 1.28
Convection Product temperature of 60oC 192.33 0.27 Product temperature of 70oC 138.33 0.37
5.3.1.1. Effect of Product-drying-temperature
Convection drying time of untreated berries at 60oC product temperature was
192 min to dry the berries from 76% to 25% moisture content and at product
temperature of 70oC drying time reduced to 138 min, whereas microwave-
combination drying the drying time was reduced by 1.64 and 2.65 times required
for convection at the same product temperatures respectively. This can be
attributed to the heating effect of microwaves to accelerate the diffusion of
moisture from the center of the product to the periphery and with hot-air
conditions around moisture removal from the periphery will also be enhanced.
These results explain that the hot air heats the berry surface and minimize the
heat loss from the berry volumetrically heated by microwave energy. Therefore
the majority of the heat generated in berry by microwave energy could be used to
heat and evaporate the water in berry efficiently.

78
0
10
20
30
40
50
60
70
80
90
0 10 20 30 40 50 60 70 80 90 100 110 120Time (Min)
Tem
pera
ture
(0 C)
Combination P1 Combination P2 Combination P3
Figure 5.11 Drying temperature trends at combination P1, P2 and P3 levels (60,
70 and 80oC respectively) and its effect on drying time
As shown in Figure 5.11, in combination drying of untreated berries the drying
time reduced as the product drying temperature increased. The temperature
trend in Figure 5.11 and Figure 5.12 shows that, the temperature rises in the first
few minutes and then it tends to stabilize after the moisture content of the
produce reduced. In the initial stages of drying, the moisture content is very high
due to which higher microwave absorption was expected and observed. During
combination drying, because of the higher drying rates the temperature stabilizes
faster than in microwave drying.

79
0
10
20
30
40
50
60
70
80
90
0 20 40 60 80 100 120 140 160Drying Time (Min)
Tem
pera
ture
(0 C)
Microwave P1 Microwave P2 Microwave P3
Figure 5.12 Drying temperature trends at microwave P1, P2 and P3 power levels
(60, 70 and 80oC respectively) and its effect on drying time
5.3.2. Effect of Drying Mode
The drying time was reduced by nearly 45% with the combination mode
compared to hot air drying, for untreated and treated berries. Microwave drying
also reduced the drying time considerably over hot air drying in both the cases.
The moisture content in the sample at different intervals was plotted against time
(Figure 5.13 and Figure 5.14) as moisture curves for treated and untreated
respectively. The curves indicate the higher drying rate with microwave-only and
combination mode over hot air drying at any given time. The hot air drying
method had a short constant rate period followed by a falling rate period. This
was also reflected in the slight case hardening of the product. Microwave and
combination drying had only a falling rate period in both cases. Combination
mode had a higher falling rate indicating a higher rate of mass transfer, which
resulted in a shorter drying time over hot-air and microwave drying. In general,
the time required to reduce the moisture content to any given value was

80
dependent on the drying conditions, being highest at microwave P1 (60oC) and
lowest at combination P3 (80oC).
25
35
45
55
65
75
0 20 40 60 80 100 120 140 160Time (min)
Moi
stur
e (%
db)
Convection Microwave Combination
Figure 5.13 Drying of untreated berries at 70oC under Microwave, Convection
and Combination drying conditions
The drying rates were higher in the beginning of the drying process and gradually
reduced as the drying process progressed. This was because of more radiation
absorbed in the center and driving out moisture faster than the diffusion rate from
the outer surface, causing moisture buildup towards the product surface after a
few min. The drying rates increased with increase in microwave power, other
conditions remaining the same and thus reducing the drying time.
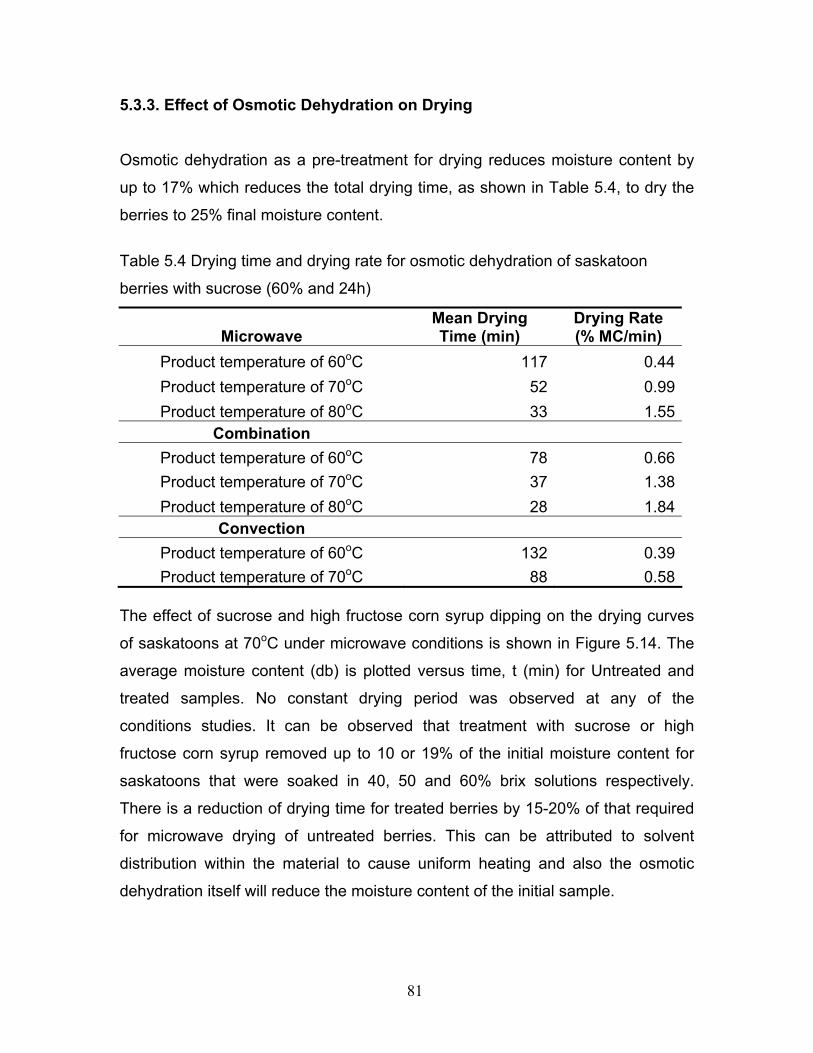
81
5.3.3. Effect of Osmotic Dehydration on Drying
Osmotic dehydration as a pre-treatment for drying reduces moisture content by
up to 17% which reduces the total drying time, as shown in Table 5.4, to dry the
berries to 25% final moisture content.
Table 5.4 Drying time and drying rate for osmotic dehydration of saskatoon
berries with sucrose (60% and 24h)
Microwave Mean Drying Time (min)
Drying Rate (% MC/min)
Product temperature of 60oC 117 0.44Product temperature of 70oC 52 0.99Product temperature of 80oC 33 1.55
Combination Product temperature of 60oC 78 0.66Product temperature of 70oC 37 1.38Product temperature of 80oC 28 1.84
Convection Product temperature of 60oC 132 0.39Product temperature of 70oC 88 0.58
The effect of sucrose and high fructose corn syrup dipping on the drying curves
of saskatoons at 70oC under microwave conditions is shown in Figure 5.14. The
average moisture content (db) is plotted versus time, t (min) for Untreated and
treated samples. No constant drying period was observed at any of the
conditions studies. It can be observed that treatment with sucrose or high
fructose corn syrup removed up to 10 or 19% of the initial moisture content for
saskatoons that were soaked in 40, 50 and 60% brix solutions respectively.
There is a reduction of drying time for treated berries by 15-20% of that required
for microwave drying of untreated berries. This can be attributed to solvent
distribution within the material to cause uniform heating and also the osmotic
dehydration itself will reduce the moisture content of the initial sample.

82
25
35
45
55
65
75
0 10 20 30 40 50 60Time (min)
Moi
stur
e (%
, d.b
.)
Sucrose HFCS Untreated
Figure 5.14 Microwave drying of osmotically treated and untreated berries at
70oC
Secondary motivations for applying combined osmotic and microwave
dehydration as a pre-treatment were:
• Possibility to produce unique (new) products with better taste,
• Improved flavor characteristics and/or increased nutritional value,
• Prevention of oxidation of the product and color stabilization,
• Improvement of the texture of the product such as higher final bulk volume
of the product compared to heated air dehydration or microwave
dehydration without osmotic pre-treatment,
• Due to shrinkage and weight loss after drying, storage and transport costs
are reduced drastically, and
• Dried saskatoon berries after osmotic dehydration have various industrial
applications such as bakery foods, nutraceutical industry etc.
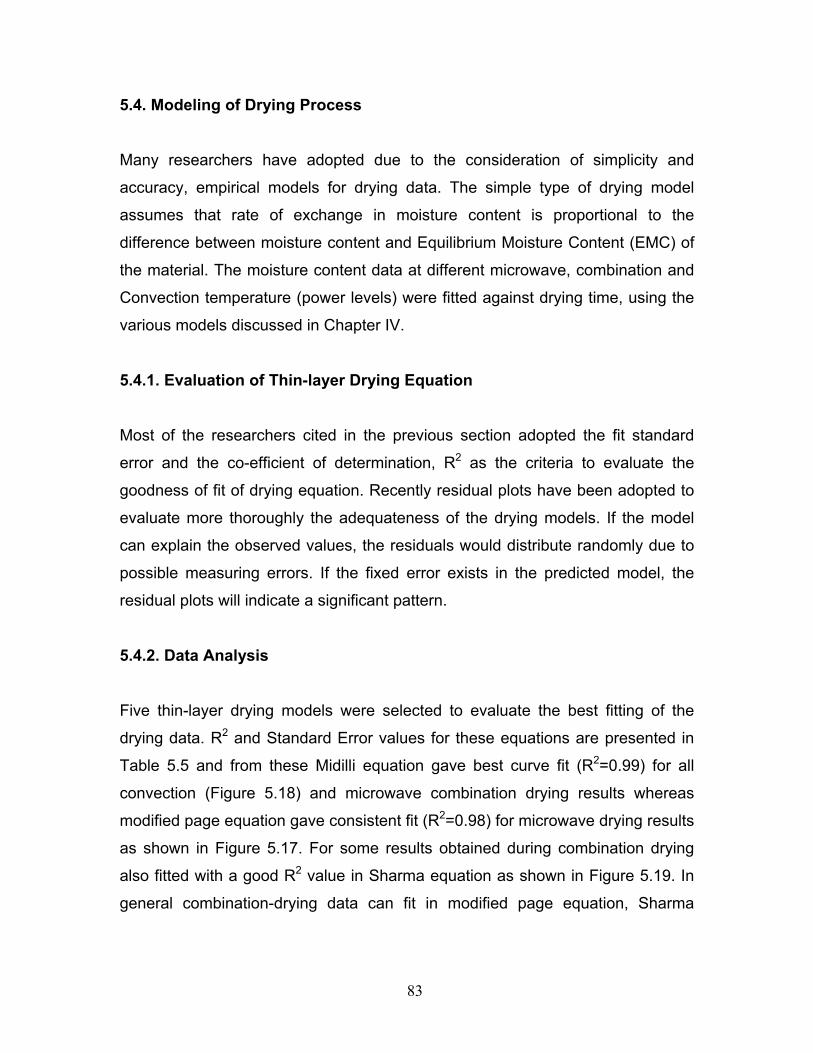
83
5.4. Modeling of Drying Process
Many researchers have adopted due to the consideration of simplicity and
accuracy, empirical models for drying data. The simple type of drying model
assumes that rate of exchange in moisture content is proportional to the
difference between moisture content and Equilibrium Moisture Content (EMC) of
the material. The moisture content data at different microwave, combination and
Convection temperature (power levels) were fitted against drying time, using the
various models discussed in Chapter IV.
5.4.1. Evaluation of Thin-layer Drying Equation
Most of the researchers cited in the previous section adopted the fit standard
error and the co-efficient of determination, R2 as the criteria to evaluate the
goodness of fit of drying equation. Recently residual plots have been adopted to
evaluate more thoroughly the adequateness of the drying models. If the model
can explain the observed values, the residuals would distribute randomly due to
possible measuring errors. If the fixed error exists in the predicted model, the
residual plots will indicate a significant pattern.
5.4.2. Data Analysis
Five thin-layer drying models were selected to evaluate the best fitting of the
drying data. R2 and Standard Error values for these equations are presented in
Table 5.5 and from these Midilli equation gave best curve fit (R2=0.99) for all
convection (Figure 5.18) and microwave combination drying results whereas
modified page equation gave consistent fit (R2=0.98) for microwave drying results
as shown in Figure 5.17. For some results obtained during combination drying
also fitted with a good R2 value in Sharma equation as shown in Figure 5.19. In
general combination-drying data can fit in modified page equation, Sharma

84
equation and Midilli equation with good R2 value as shown in Figure 5.15, Figure
5.16 and Figure 5.19.
Table 5.5 Co-efficient of determination and standard error values for different
equations
Modified Page Equation Sharma’s Equation Midilli Equation
R2 Std. Error R2 Std. Error R2 Std. Error
Microwave _P2
0.988 1.159 - - - -
Microwave_P1
(Sucrose OD)
0.9851 1.219 - - - -
Microwave_P2
(Sucrose OD)
0.97 2.04 - - - -
Microwave_P3
(Sucrose OD)
0.976 1.398 - - - -
Combination_P1
(Sucrose OD)
- - 0.997 0.503 0.9996 0.1875
Combination_P2
(Sucrose OD)
0.959 2.082 0.994 0.826 0.9933 0.842
Combination_P3
(Sucrose OD)
0.9708 1.675 0.9993 0.248 0.9999 0.129
Combination_P2
0.9893 1.041 - - 0.987 1.253
Convection_P2 0.998 0.729 - - 0.9769 2.222
Convection_P1
(Sucrose OD)
0.953 2.42 - - 0.9986 0.421

85
Figure 5.15 Midilli equation drying curve fit for sucrose osmotic dehydration combination drying at 60oC
For combination drying data of saskatoon berries after osmotic dehydration,
Midilli equation fitted very well with R2=0.999 Standard Error = 0.129.
0 20 40 60 80Time (min)
25
30
35
40
45
50
55
60
65
MC
(% d
b)

86
Figure 5. 16 Modified drying equation drying curve fit for sucrose combination drying at 80oC For combination drying data of saskatoon berries after osmotic dehydration,
Modified drying equation fitted with R2=0.986 and Standard Error = 1.273.
0 10 20 30Time (min)
25
30
35
40
45
50
55
60
65
MC
(% d
b)
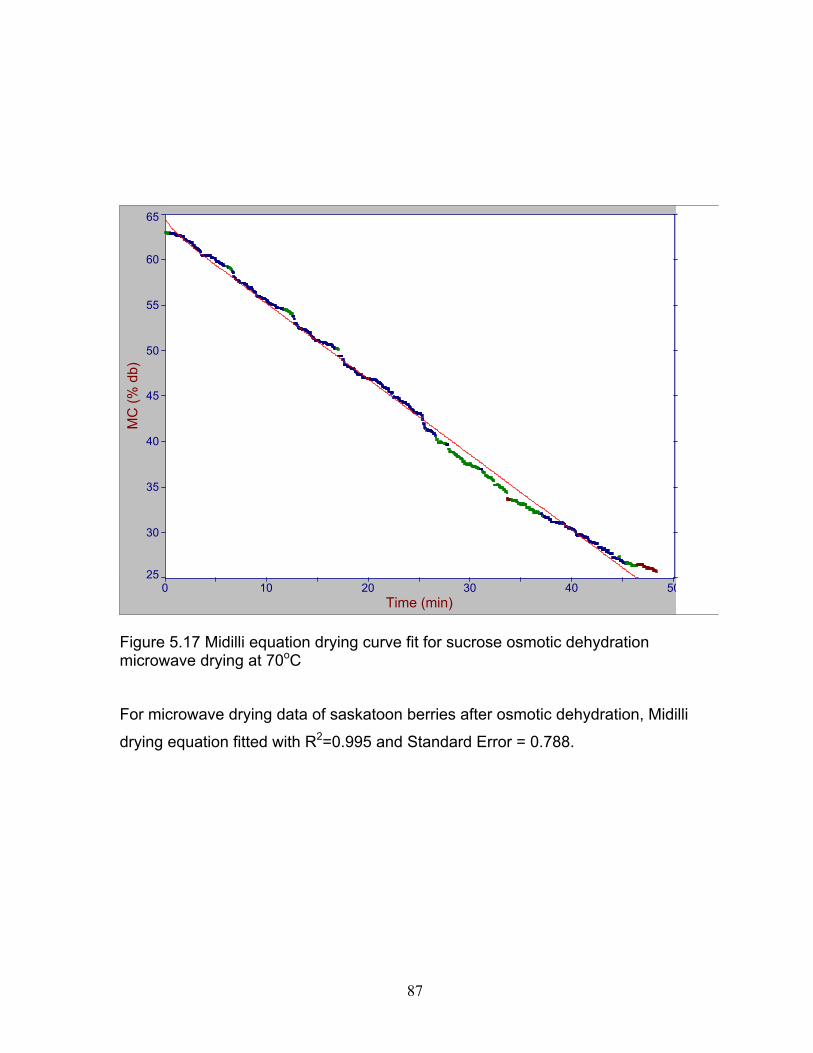
87
Figure 5.17 Midilli equation drying curve fit for sucrose osmotic dehydration microwave drying at 70oC
For microwave drying data of saskatoon berries after osmotic dehydration, Midilli
drying equation fitted with R2=0.995 and Standard Error = 0.788.
0 10 20 30 40 50Time (min)
25
30
35
40
45
50
55
60
65
MC
(% d
b)

88
Figure 5.18 Midilli equation drying curve fit for sucrose osmotic dehydration convection drying at 70oC
For convection drying data of saskatoon berries after osmotic dehydration, Midilli
drying equation fitted with R2=0.995 and Standard Error = 0.782.
0 20 40 60 80Time (min)
20
25
30
35
40
45
50
55
60
65
MC
(% d
b)

89
Figure 5.19 Sharma’s equation drying model curve fit for combination drying method at 60oC For combination drying data of saskatoon berries, Sharma equation fitted with
R2=0.998 and Standard Error = 0.579.
5.4.3. Quality Analysis
Dehydrated saskatoon berries were analyzed for the quality changes that might
have occurred due to all the different treatments. Rehydration ratio and color
changes were the two main quality parameters considered.
0 2000 4000 600Time (min)
35
40
45
50
55
60
65
70
75
MC
(% d
b)

90
5.4.3.1 Rehydration Ratio
Changes in the original dimensions and shape occur simultaneously and water
diffusion affects the rate of the moisture loss during drying. Researchers have
pointed out that the volume change process is one of the main sources of error
for drying simulation models of biological products. There is significant volume
shrinkage during the drying process of high moisture content products such as
vegetables (Hatamipour and Mowla, 2002).
Table 5.6 Rehydration ratio of Microwave dried berries with and without osmotic
dehydration
Treatments Rehydration Ratio
1 Untreated
At product temperature of 60oC 0.24
At product temperature of 70oC 0.22
At product temperature of 80oC 0.21
2 Osmotic dehydration with Sucrose
At product temperature of 60oC 0.42
At product temperature of 70oC 0.40
At product temperature of 80oC 0.39
3 Osmotic dehydration with HFCS
At product temperature of 60oC 0.47
At product temperature of 70oC 0.47
At product temperature of 80oC 0.46 Untreated saskatoon berries dried under microwave at 60oC had a rehydration
ratio 0.24 that reduced with increasing the product temperature to 70oC and 80oC
and a highest of 0.24 rehydration ratio was during microwave drying at product
temperature of 60oC as shown in Table 5.6. In general, the rehydration ratio
decreased with increase in product temperatures during drying. As Potter and

91
Hotchkiss (1995) reported, increasing temperature cause distortion of cells and
capillaries in plant tissue, which may lead to textural changes, thus lowing water
absorption and adsorption characteristics affecting rehydration ability and
rehydration ratio. osmotic dehydration with sucrose and high fructose corn syrup
increases the rehydration ratio by around twice that of untreated berries. High
fructose corn syrup osmotic dehydration berries after drying had significantly
(P<0.05) higher rehydration ratio when compared to sucrose. Drying method did
not have a significant difference in changing the rehydration ratio (Table 5.7).
Table 5.7 Rehydration ratios of sucrose osmotic dehydrated berries at different
drying conditions
Treatments Rehydration Ratio
1 Microwave dried
At product temperature of 60oC 0.42
At product temperature of 70oC 0.40
At product temperature of 80oC 0.39
2 Combination dried
At product temperature of 60oC 0.43
At product temperature of 70oC 0.40
At product temperature of 80oC 0.40
3 Convection dried
At product temperature of 60oC 0.43
At product temperature of 70oC 0.43
At product temperature of 80oC 0.42 5.4.3.2 Color Analysis
Hunter lab colorimeter values of dried saskatoon berries are shown in Table 5.8.
The Hunter ‘L’ measures lightness and varies from 100 for perfect white to zero
for black, approximately as the eye would evaluate it. Hunter ‘a’ measures
yellowness when positive and greenness when negative and ‘b’ measures

92
yellowness when positive and blueness when negative. The hunter ‘L, ‘a’, ‘b’
values for saskatoon berries decreased with the increase in drying temperature
during all drying modes. The total color difference was minimal for convection,
but for microwave and combination drying the values were around 4 to 5.
Table 5.8 Hunterlab colorimeter parameters of untreated and sucrose pretreated
berries under microwave, convection and combination drying conditions
Sample ΔL Δa Δb ΔEab
Untreated Microwave P1 -0.96 -1.41 0.67 1.83Convection P2 -1.21 -1.38 0.01 1.84Convection P3 -2.46 -2.23 -0.84 3.42
Sucrose Pretreated Microwave P2 -1.92 -2.00 -0.65 2.85Microwave P3 -3.86 -3.29 -1.72 5.36Convection P1 -0.62 -2.20 -0.46 2.34
Convection P2 -2.52 -1.56 -0.88 3.09
Combination P2 -2.29 -2.37 -0.83 3.40
Combination_P3 -3.32 2.79 0.11 4.34
Table 5.9 revealed that greatest color difference with all treatments was obtained
at the highest power level. The greater heating should have lead to faster
darkening, with some possibility of occurrence of imperceptible burnt spots.
Microwave dried berries at 60oC product temperature gave least total color
difference of 1.83.

93
5.5 Summary of Chapter V
The laboratory scale microwave combination dryer was successfully developed
for drying of saskatoon berries under both microwave and microwave
combination conditions. Microwave combination drying resulted in lowered drying
time and also with increase in microwave power levels, drying time was reduced
significantly. Osmotic dehydration as a pretreatment to drying reduced up to 15%
moisture from the berries and also introduced solutes.

94
CHAPTER VI - CONCLUSIONS 6.1 Conclusions
Production of saskatoon berries as a commercial crop has gained importance in
North America and is being exported to other countries for consumption and
processing because of its nutraceutical value and consumer acceptance. This
also calls for new post harvest techniques for shelf life extension and processing
in the manufacture of new saskatoon berry products. Freezing is the only post
harvest technique reported till date to preserve the berries for year-long
consumption. So microwave and microwave combination drying technique study
after osmotic dehydration was explored in this study as a post harvest
preservation technique for saskatoon berries.
i. The microwave-convection combination dryer system was developed and
successfully tested. The obtained temperature and moisture loss recorded
was accurate enough with minimal errors.
ii. The developed drying system with the modified settings can be used for
drying / dehydration studies of other agricultural / food materials (e.g.
blueberries, beef etc.).
iii. The data obtained from drying of untreated and treated saskatoon berries
showed that microwave and microwave combination drying proves to be a
faster way of bringing moisture content to safer levels and also preserve
the product quality.
iv. The reported drying characteristics of saskatoon berries dried under
microwave, microwave-convection conditions were reasonable and were
in closer proximity to the reported literature.
v. Microwave drying of saskatoon berries at product temperatures of 60oC
and 70oC after osmotic dehydration retained their quality attributes in the
same range, but drying time required at 70oC product temperature was
reduced to half.

95
vi. Osmotic dehydration of saskatoon berries with high fructose corn syrup
sugar solution had 3% less moisture after 24 h period compared to
sucrose sugar solution treatment and this difference was significant.
vii. Drying after osmotic dehydration reduced the drying time in all drying
conditions studied because of the structural changes that may have
occurred at the surface (semi-permeable membrane) giving rise to higher
diffusion rates.
viii. Microwave drying had relatively higher drying rates than convection and
this was due to the higher dielectric loss factor value in osmotic
dehydrated berries that favor microwave absorption.
ix. Microwave combination drying was efficient with time and energy
consumption by upto 20% than microwave-only.
x. LabView programs were developed for real-time temperature and weight-
loss measurement and acquisition.

96
6.2. Recommendations for Future Work
i. Drying studies with fresh saskatoon berries during the harvesting season
can add more value to this research in developing a new post harvest
technique for saskatoon berries,
ii. Drying characteristics study at very low microwave power levels and to
compare the quality characteristics of the final product is suggested,
iii. Control of microwave power to the lowest possible wattage with a variable
rheostat and solid-state relay circuit and the temperature data can be
acquired from Fiso signal conditioner. Installation of a filament transformer
to the magnetron circuit to keep the filament to continuously run is a
prerequisite,
iv. Sample holder rotation system on the horizontal axis with 180o turn on
either side could improve the microwave distribution with in the material
and more even drying of the berries, and
v. Modeling of drying data heat and mass transfer simulation using FEM-Lab
or advanced simulation software is also suggested.

97
References
Achanta, S. and M. R. Okos. 1995. Predicting the quality of dehydrated foods and biopolymers- research needs and opportunities. Drying Technology. 14 (6): 1329-1368. Adapa, P.K., S. Sokhansanj and G.J. Schoenau. 2002. Performance study of Re-circulation cabinet dryer using a household dehumidifier. Drying Technology. 22(8): 1673-1689. Al-Mahasneh, M. A., S.J. Birrell, C.J. Bern and K. Adham. 2001. Measurement of corn mechanical damage using Dielectric properties. Transactions of ASAE, 2001 Annual International meeting. Paper Number: 10-1073. Annon. 1991. From duff to puff. Food Manufacture. 10 : 47-48. AOAC. 1990. Official Methods of Analysis, Association of Official Analytical Chemists, Inc, Virginia. 2: 69-81. Argaiz, A., A. L. Malo, E. Palou and J. Welti. 1994. Osmotic dehydration of papaya with corn syrup solids. Drying Technology. 12(7): 1709-1725. ASAE Standards. 1992. S352.2. Moisture measurement - Grain and Seed. In ASAE Standards, 39th edition. ASAE Standards.1999. D293.2. Dielectric properties of grain and seed. In ASAE Standards, 2003. Beaudry, C. 2001. Evaluation of drying methods on osmotically dehydrated cranberries. Unpublished M.Sc. thesis. Montreal, QC: Department of Agricultural and Biosystems Engineering, McGill University. Bouraout, M., P. Richard and T. Durance. 1994. Microwave and convective drying of potato slices. Journal of Food Process Engineering, 17, 353-363. Buffler, C. R. 1993. Microwave cooking and processing: Engineering fundamentals for the food scientist. Van Nostrand Reinhold. New York. Chuy, L. E., T. P. Labuza. 1994. Caking and stickiness of dairy-based food powders as related to glass transition. Journal of Food Science. 55 : 1231-1239. Contreras, J. E. and T. G. Smyrl. 1981. An evaluation of osmotic concentration of apple rings using corn syrup solid solutions. Canadian Institute of Food Science and Technology. 14 (310).
98
Dixon, G. M., J. J. Jen and V. A. Paynter. 1976. Tasty apple slices result from combined osmotic dehydration and vacuum-drying process. Food Process Development. 18 (113). Engelder, D. S. and C. R. Buffler. 1991. Measuring dielectric properties of food products at microwave frequencies. Microwave World. 12(4): 6–15. Erle, U., H. Schubert. 2000. Combined osmotic and microwave-vacuum dehydration of apples and strawberries. Journal of Food Engineering.49:193-199. Feng, H. and J. Tang. 1998. Microwave finish drying of diced apples in a spouted bed. Journal of Food Science. 63: 679-683. Feng, H, J. Tang, R.P. Cavalieri. 2001. Dielectric properties of dehydrated apples as affected by moisture and temperature. Transactions of ASAE, 45(1): 129-135 Funebo, T. And T. Ohlsson. 1998. Dielectric properties of some fruits and vegetables. Journal of Microwave Power and Electromagnetic Energy, submitted. Funebo, T. and T. Ohlsson. 1999. Microwave-assisted air dehydration of apple and mushroom. Journal of Food Engineering, 38, 353-367. Genin, N. and F. Rene. 1995. Analyze du role de la transition vitreuse dans les procedes de conservation agro-alimentaries. Journal of Food Engineering. 26 : 391-408. Grabowski, S. and A.S. Mujumdar. 1992. Solar-assisted osmotic dehydration. pp. 367-404. In: Drying of Solids, A.S. Mujumdar (Ed.). International Science Publisher, NY. Grabowski, S., A.S. Mujumdar, H.S. Ramaswamy, and C. Strumillo. 1994. Osmo-convective drying of grapes. Drying Technology. 12(5): 1211-1219. Green, R.C. and G. Mazza. 1986. Relationships between anthocyanins, total phenolics, carbohydrates, acidity and color of saskatoon berries. Canadian Institute of Food Science and Technology. 19:107-113. Harrington, W.O., C.H. Hills, S.B.Jones, A.E. Stafford and B.R. Tennes. 1978. Ethyl oleate sprays to reduce cracking of sweet cherries, Horticultural Science. 13: 279-280. Hatamipour, M. S. and D. Mowla. 2002. Shrinkage of carrots during drying in an inert medium fluidized bed. Journal of Food Engineering. 55 (3) : 247-252. Hawkes, J. and J. M. Flink. 1978. Osmotic concentration of fruit slices prior to freeze dehydration. Journal of Food Processing and Preservation. 2 (265).
99
Huxsoll, C. C. 1982. Reducing the refrigeration load by partial concentration of food prior to freezing. Food Technology. 5 (98-102). Islam, M. N. and J. M. Flink. 1982. Dehydration of potato. II. Osmotic concentration and its effect on air drying behaviour. Journal of Food Technology. 17 (387). Kostaropoulos, A.E. and G.D. Saravacos. 1995. Microwave pretreatment of sun-dried raisins. Journal of Food Science. 60: 344-347. Khraisheh, M. A., T. J. R. Cooper, and T. R. A Magee. 1997. Microwave and air drying I. Fundemental considerations and assumptions for the simplified thermal calculations of volumetric power absorptions. Journal of Food Engineering. 33 (207-219). Lenart, A. P. P. Lewicki. 1990. Osmotic dehydration of apples at high temperature. In International Drying Symposium’ 89 (A. S. Mujumdar and M. Roques, eds.(, Hemishpere Publishing Co., New York, 501. Lewicki, P. and A. Lenart. 1990. Energy consumption during osmo-convection drying of fruits and vegetables. Pp. 354-366. In: Drying of Solids, A.S. Mujumdar (Ed.). International Science Publisher, NY. Maskan, M. 2000. Microwave/air and microwave finish drying of banana. Journal of Food Engineering, 44, 71-78. Masi, P. and M. Riva. 1988. Modeling grape drying kinetics. Preconcentration and Drying of Food Materials. 203-214. Mazza, G. 1979. Development and consumer evaluation of a native fruit product. Canadian Institute of Food Science and Technology. 12(4):166-169. Mudgett, R.E., E. C. To, D.I. Wang. 1974. Dielectric Properties of food materials. Journal of Microwave Power. 9: 303–315. Mazza, G. 1982. Chemical composition of saskatoon berries (Amelanchier alnifolia Nutt.). Journal of Food Science. 47:1730-1731. Mazza, G. and M.W. Hodgins. 1985. Benzaldehyde, a major aroma component of saskatoon berries. Horticultural Science. 20:742-744. Mazza, G. 1986. Anthocyanins and other phenolic compounds of saskatoon berries (Amelanchier alnifolia Nutt.). Journal of Food Science. 51:1260-1264.
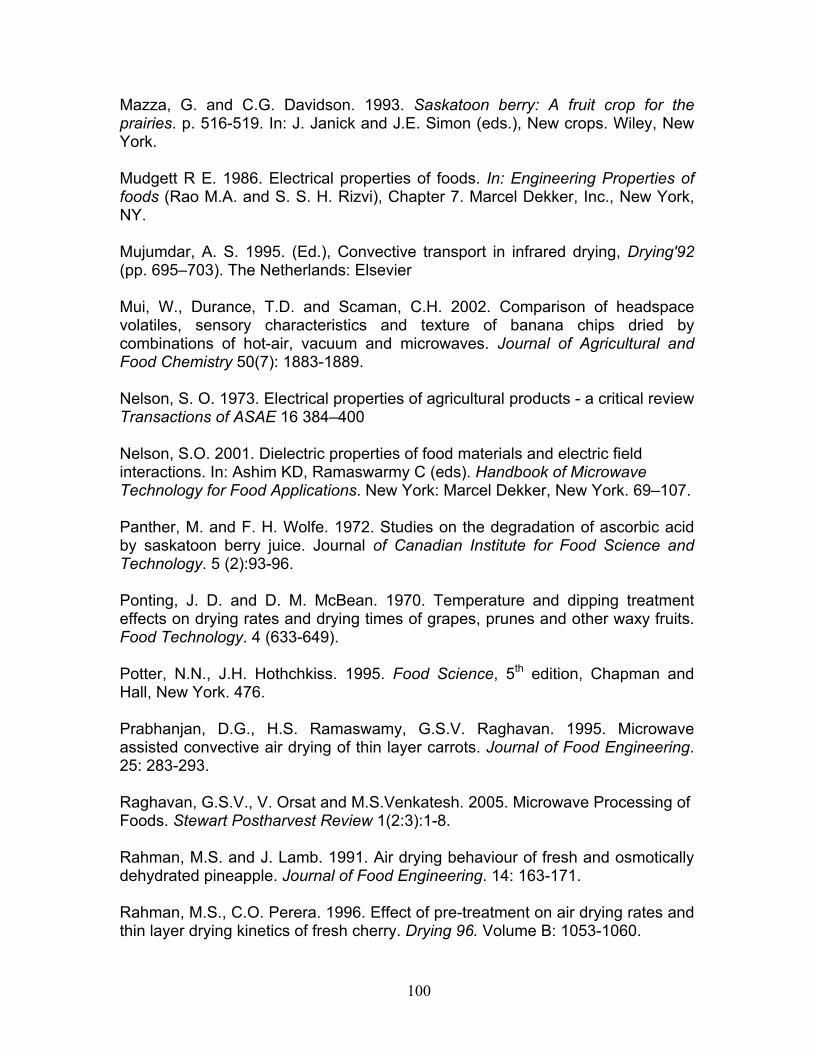
100
Mazza, G. and C.G. Davidson. 1993. Saskatoon berry: A fruit crop for the prairies. p. 516-519. In: J. Janick and J.E. Simon (eds.), New crops. Wiley, New York. Mudgett R E. 1986. Electrical properties of foods. In: Engineering Properties of foods (Rao M.A. and S. S. H. Rizvi), Chapter 7. Marcel Dekker, Inc., New York, NY. Mujumdar, A. S. 1995. (Ed.), Convective transport in infrared drying, Drying'92 (pp. 695–703). The Netherlands: Elsevier Mui, W., Durance, T.D. and Scaman, C.H. 2002. Comparison of headspace volatiles, sensory characteristics and texture of banana chips dried by combinations of hot-air, vacuum and microwaves. Journal of Agricultural and Food Chemistry 50(7): 1883-1889. Nelson, S. O. 1973. Electrical properties of agricultural products - a critical review Transactions of ASAE 16 384–400 Nelson, S.O. 2001. Dielectric properties of food materials and electric field interactions. In: Ashim KD, Ramaswarmy C (eds). Handbook of Microwave Technology for Food Applications. New York: Marcel Dekker, New York. 69–107. Panther, M. and F. H. Wolfe. 1972. Studies on the degradation of ascorbic acid by saskatoon berry juice. Journal of Canadian Institute for Food Science and Technology. 5 (2):93-96. Ponting, J. D. and D. M. McBean. 1970. Temperature and dipping treatment effects on drying rates and drying times of grapes, prunes and other waxy fruits. Food Technology. 4 (633-649). Potter, N.N., J.H. Hothchkiss. 1995. Food Science, 5th edition, Chapman and Hall, New York. 476. Prabhanjan, D.G., H.S. Ramaswamy, G.S.V. Raghavan. 1995. Microwave assisted convective air drying of thin layer carrots. Journal of Food Engineering. 25: 283-293. Raghavan, G.S.V., V. Orsat and M.S.Venkatesh. 2005. Microwave Processing of Foods. Stewart Postharvest Review 1(2:3):1-8. Rahman, M.S. and J. Lamb. 1991. Air drying behaviour of fresh and osmotically dehydrated pineapple. Journal of Food Engineering. 14: 163-171. Rahman, M.S., C.O. Perera. 1996. Effect of pre-treatment on air drying rates and thin layer drying kinetics of fresh cherry. Drying 96. Volume B: 1053-1060.

101
Ramaswamy, H.S. and F. Nsonzi. 1998. Convective air-drying kinetics of osmotically pre-treated blueberries. Drying technology, 16(3-5): 743-759. Ranganna, S. 1986. Hand Book of Analyses of Quality Control for Fruits and Vegetables, Tata McGraw Hill Publishing Co. Ltd., New Delhi. 931-932. Ratti, C., and Mujumdar, A. S. 1995. Infrared drying, (Ed.), Handbook of industrial drying. 567–588. Reddy, L. N., V. Meda and M.D. Pickard. 2004. Combined convection, microwave and infrared processing of agricultural materials. Presented at Annual ASAE meeting, Aug 1-4, Montreal, QC, Canada. Reddy, L. N., V. Meda and B. Shrestha. 2005. Dielectric properties of saskatoon berries (Amelanchiar alnifolia) at different pretreatment and osmotic conditions. In Proceedings of CSAE/ASAE Intersectional meeting. Sept 29-30, Winnipeg, MB, Canada. Reddy, L. N. and V. Meda. 2005. Osmotic Dehydration and Combination Drying Technique for Prairie fruits. In Proceedings of International Microwave Power Institute, July 13-15, 2005, Seattle, WA, USA. Risman, P.O. 1991. Terminology and notation of microwave power and electromagnetic energy. Journal of microwave power and Electromagnetic energy, 26, 243 – 250. Sapers, G.M., S.B. Jones and J.G. Phillips. 1985. Leakage of anthocyanins from skin of thawed, frozen highbush blueberries (Vaccinium corymbosum L.). Journal of Food Science. 50: 432–436. Sarosi, H. and A. Polak. 1976. Possibilities of application of osmotic drying in the food industry. Tudomanyos Kozlemenyck, Elelmiszeripari Foiskala. 6 (63). Sharma, G. P., R. C. Verma and P. Pathare. 2005. Thin-layer infrared radiation drying of onion slices. Journal of Food Engineering, 67, 361-366. Sheridan, P. and N. Shilton. 1999. Application of far infra-red radiation to cooking of meat products. Journal of Food Engineering. 41: 203-208. Somogyi, L,P. and B.S. Luh. 1986. Dehydration of foodstuffs. Commercial Fruit Processing 353-405. Somogyi, L.P, H.S. Ramaswamy and Y.H. Hui. 1996. Processing Fruits: Science and Technology – Biology, principles and applications 14-24.

102
Tulasidas, T.N., G.S.V. Raghavan and E.R. Norris. 1993. Microwave and convective drying of grapes. Transactions of ASAE 36(6): 1861-1865. Turner, N.J., C. L.C. Thompson, M.T. Thompson and A.Z. York. 1990. Thompson Ethnobotany. Royal British Columbia Museum: Victoria. Pp 253-257. Turner, N.J. 1997. Food plants of Interior First peoples. UBC Press: Vancouver. 139. Venkatachalapathy, K and G.S.V. Raghavan. 1997. Osmotic and Microwave drying of blueberries. Proceedings of the 32 Microwave Power Symposium, Ottawa, Canada. International Microwave Power Institute, USA. Venkatesh, M. S. 1996. M. Sc. Thesis: Cavity perturbation technique for measurement of dielectric properties of some agri-food materials. McGill University, Quebec, Canada. Venkatesh, M. S., E. St-Denis, G. S. V. Raghavan, P. Alvo and C. Akyel 1998. Dielectric properties of whole, chopped and powdered grain at various bulk densities. Journal of Canadian Agriculture Engineering. 40 (3): 191-200. Venkatesh, M.S. and Raghavan, G.S.V. 2005. An Overview of Dielectric Properties Measuring Techniques, Canadian Biosystems Engineering, 47, 715-730. Westphal, W. B. and A. Sils. 1972. Dielectric constant and loss data. Report: Air Force Materials Laboratory, Air Force Command, Dayton, Ohio. 72-79. Wolfe, F. H. and F. W. Wood. 1972. Non-volatile organic acid and sugar composition of saskatoon berries during ripening. Journal of Canadian Institute for Food Science and Technology. 4: 29-30. Yang, C.S.T. and W.A. Atallah. 1985. Effect of four drying methods on the quality of intermediate moisture lowbush blueberries. Journal of Food Science. 50: 1233-1237. Yang, A.P.P., C. Wills and C.S.T. Yang. 1987. Use of combination process of osmotic dehydration and freeze drying to produce a raisin type low bush blueberry product. Journal of Food Science. 52: 1651-1653. Yongsawatdigul, J. and Gunasekaran, S. 1996. Microwave-vacuum drying of cranberries: Part II. Quality evaluation. Journal of Food Processing and Preservation, 20, 145-156. http://www.agr.gov.sk.ca/docs/statistics/crops/horticulture/fruitveggies040226.pdf

103
http://www.devonian.ualberta.ca/pwatch/saskat.htm http://www.prairieplant.com/wp-s-chart.html http://www.saskchamber.com/documents/259Action_Saskatchewan_Special_Feature_11.pdf http://www.saskatoonberries.com http://www.infrareadyproducts.com. Infraready Products Ltd., Saskatoon, Canada.

104
APPENDIX
This section includes all the additional data for drying, dielectric properties,
preliminary studies, scanning electron microscope images and also digital
images of microwave dryer system with individual instrumentation. Temperature
trends explained in Section 5.3.2 are presented at other drying conditions.

105
Appendix A1. Microwave Combination Drying at 60, 70 and 80oC
Drying data (weight loss, g) for untreated and osmotically dehydrated berries at
different product drying temperatures (60, 70 and 80oC) under microwave-
convection combination conditions with respect to time are shown in this part of
the appendix.
30
40
50
60
70
80
90
100
110
0 20 40 60 80 100 120
Tim e (m in)
Wei
ght L
oss
(g)
Combination 60C Combination 70CCombination 80C
Figure A1 Microwave combination drying of untreated saskatoon berries at 60,
70 and 800C temperatures and corresponding weight loss plotted against time
(min)

106
40
50
60
70
80
90
100
110
0 10 20 30 40 50 60 70 80 90
Tim e (m in)
Wei
ght L
oss
(g)
Combination 60C Combination 70CCombination 80C
Figure A2 Microwave combination drying (weight loss, g) of sucrose osmotic
dehydrated saskatoon berries at 60, 70 and 800C temperatures and
corresponding weight loss plotted against time (min)

107
Appendix A2. Microwave drying at 60, 70 and 800C
Drying data (weight loss, g) for untreated and osmotically dehydrated berries at
different product drying temperatures (60, 70 and 800C) under microwave
conditions with respect to time are shown in this part of the appendix.
0
20
40
60
80
100
120
0 20 40 60 80 100 120 140 160Time (min)
Wei
ght L
oss
(g)
Microwave 60C Microwave 70CMicrowave 80C
Figure A3 Microwave drying (weight loss, g) of untreated saskatoon berries at 60,
70 and 800C temperatures and corresponding moisture loss plotted against time
(min)
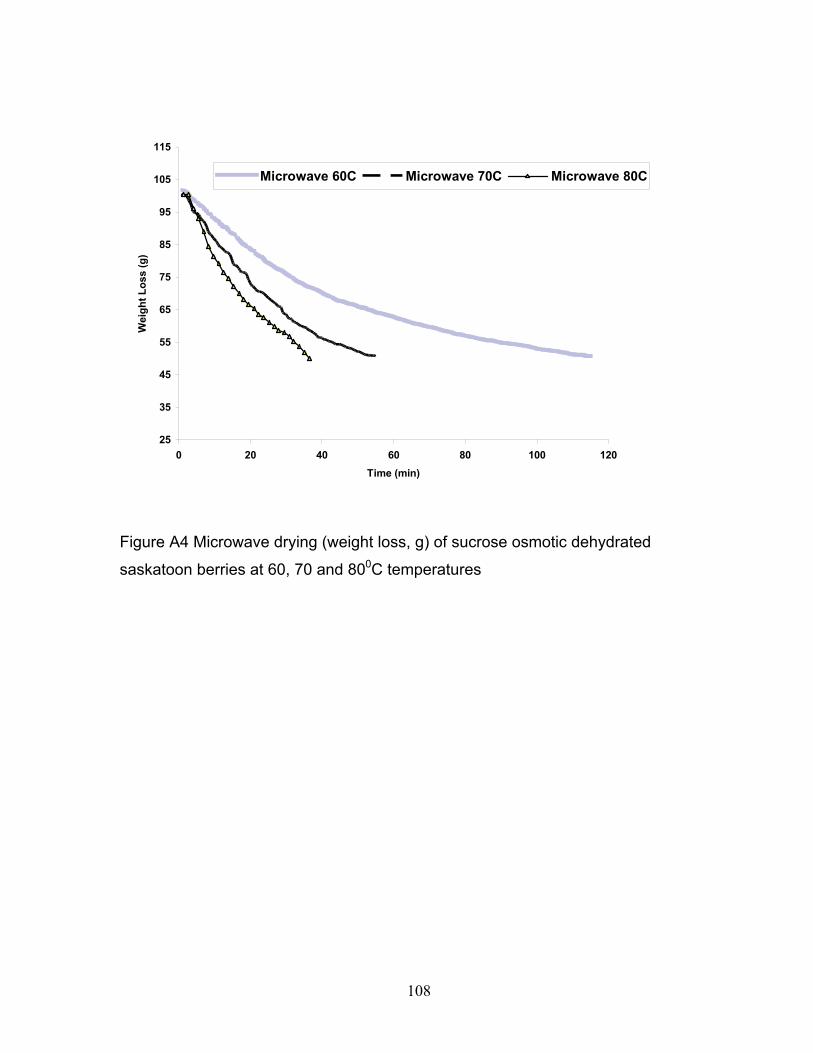
108
25
35
45
55
65
75
85
95
105
115
0 20 40 60 80 100 120Time (min)
Wei
ght L
oss
(g)
Microwave 60C Microwave 70C Microwave 80C
Figure A4 Microwave drying (weight loss, g) of sucrose osmotic dehydrated
saskatoon berries at 60, 70 and 800C temperatures

109
Appendix A3. Convection drying at 60, 70 and 800C
Drying data (weight loss, g) for untreated and osmotically dehydrated berries at
different product drying temperatures (60, 70 and 800C) under convection
conditions with respect to time are shown in this part of the appendix.
0
20
40
60
80
100
0 10 20 30 40 50 60 70 80 90 100 110Time (min)
Air Temperature(C)Product Temperature (C)Relative Humidity(%)Weight Loss(g)
Figure A5 Convection drying (weight loss, g) of sucrose osmotic dehydrated
saskatoon berries at 600C temperature

110
0
20
40
60
80
100
120
0 10 20 30 40 50 60 70 80 90 100 110 120Time (min)
Air Temperature (C)Product Temperature (C)Relative Humidity (%)Weight Loss (g)
Figure A6 Convection drying (weight loss, g) of high fructose corn syrup osmotic
dehydrated saskatoon berries at 600C temperature
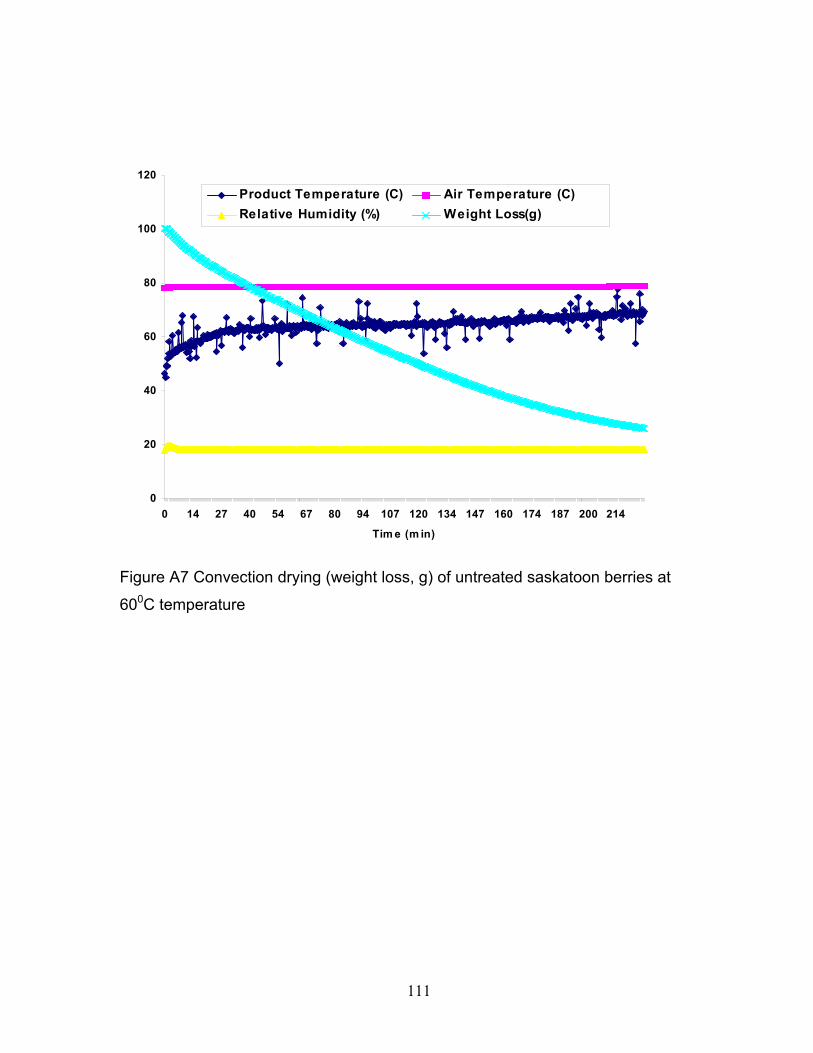
111
0
20
40
60
80
100
120
0 14 27 40 54 67 80 94 107 120 134 147 160 174 187 200 214
Tim e (m in)
Product Temperature (C) Air Temperature (C)Relative Humidity (%) Weight Loss(g)
Figure A7 Convection drying (weight loss, g) of untreated saskatoon berries at
600C temperature

112
0
20
40
60
80
100
120
0 7 14 20 27 34 40 47 54 60 67 74
Time (min)
Air Temperature (C) Product Temperature (C)Relative Humidity (%) Weight Loss (g)
Figure A8 Convection drying (weight loss, g) of sucrose osmotic dehydrated
saskatoon berries at 700C temperature

113
0
20
40
60
80
100
120
0 14 27 40 54 67 80 94 107 120
Tim e (m in)
Product Temperature (C) Air Temperature (C)Relative Humidity (%) Weight Loss (g)
Figure A9 Convection drying (weight loss, g) of untreated saskatoon berries at
700C temperature
114
0
20
40
60
80
100
120
102 94 86 80 73 67 62 56 51 46 42 39 35T ime ( min)
Air Temperature (C) Product Temperature (C)Relative Humidity(%) Weight Loss
Figure A10 Convection drying (weight loss, g) of untreated saskatoon berries at
800C temperature

115
Appendix A4. Temperature trends during microwave drying at 60oC.
Temperature variation at microwave power level P1 (refer Table 4.1) with time at
different locations of the sample holder.
0
10
20
30
40
50
60
70
80
1 21 41 61 81 101 121 141 161 181
Time (min)
Air Temperature (C)
Product Temperature1 (C)
Product Temperature2 (C)
Product Temperature3 (C)
Figure A11 Microwave drying product temperatures of high fructose corn syrup
treated saskatoon berries at 600C product temperature and corresponding air
temperature (oC) plotted against time (min)
Note: Product temperatures are at three different locations on the sample holder.

116
Appendix B1. Microwave drying of fresh blueberries
Fresh blueberries in microwave environment and rupture due to high power
treatment.
Figure B1 Blueberries disintegrated structure after low power microwave drying

117
Appendix C1. Dielectric properties of saskatoon berries
0
10
20
30
40
50
60
70
80
0.5
1.0
1.4
1.9
2.3
2.8
3.2
3.7
4.1
4.6
5.0
Frequency (GHz)
Frozen e' Frozen e"
Fresh e' Fresh e"
Figure C1 Dielectric properties of frozen saskatoon berry syrup
10
12
14
16
18
20
22
24
26
28
0.5
1.0
1.4
1.9
2.3
2.8
3.2
3.7
4.1
4.6
5.0
Frequency (GHz)
ε"
40% 50% 60%
Figure C2 Dielectric loss factor variation of saskatoon berry syrup after osmotic
dehydration with 40, 50 and 60% sucrose sugars solutions

118
0
5
10
15
20
25
30
35
40
40 50 60
Sugar Solution Concentration (Brix)
Sask
atoo
n B
errie
s B
rix6h 12h 18h 24h 36h
Figure C.3 Effect of high fructose corn syrup Concentration on Osmotic
Dehydration
0
2
4
6
8
10
12
14
16
18
0.5
1.0
1.4
1.9
2.3
2.8
3.2
3.7
4.1
4.6
5.0
Frequency (0.5 - 5 GHz )
ε"
Whole berry Crushed
Figure C4 Dielectric loss factor (ε") variation with frequency of Fresh saskatoon
berries
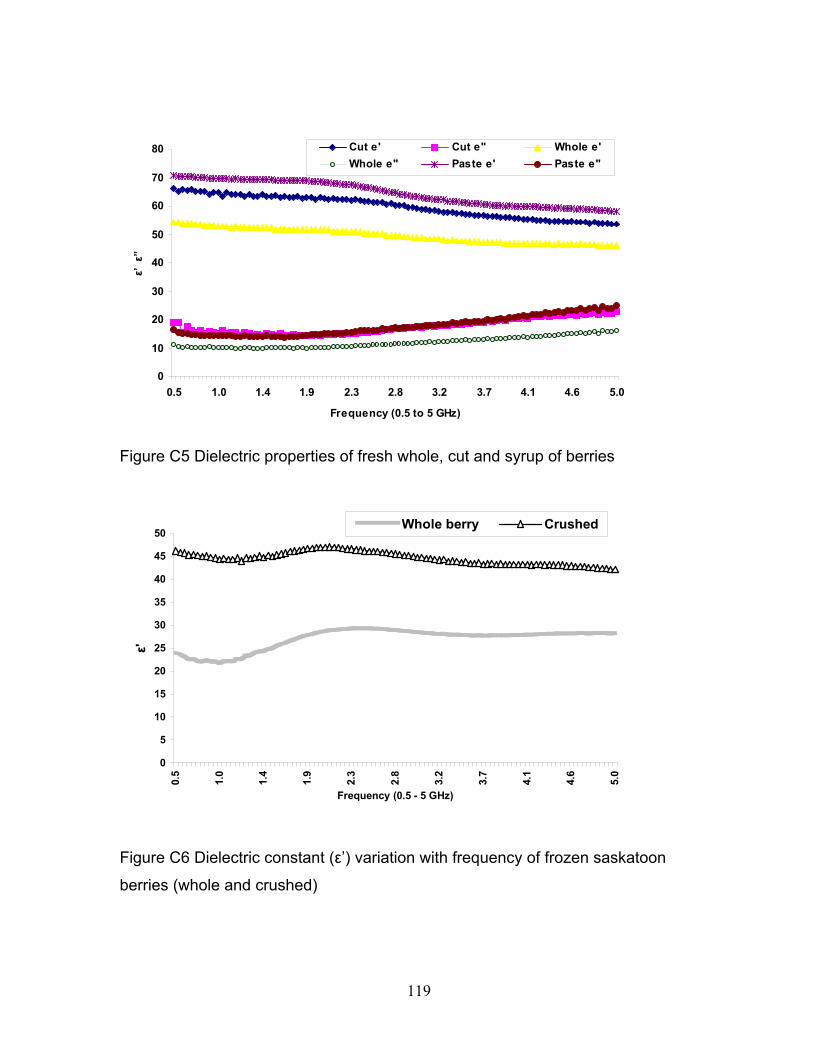
119
0
10
20
30
40
50
60
70
80
0.5 1.0 1.4 1.9 2.3 2.8 3.2 3.7 4.1 4.6 5.0
Frequency (0.5 to 5 GHz)
ε’ ε
”Cut e' Cut e" Whole e'Whole e" Paste e' Paste e"
Figure C5 Dielectric properties of fresh whole, cut and syrup of berries
Figure C6 Dielectric constant (ε’) variation with frequency of frozen saskatoon
berries (whole and crushed)
0
5
10
15
20
25
30
35
40
45
50
0.5
1.0
1.4
1.9
2.3
2.8
3.2
3.7
4.1
4.6
5.0
Frequency (0.5 - 5 GHz)
ε'
Whole berry Crushed

120
0
10
20
30
40
50
60
70
80
90
0.5 1.0 1.4 1.9 2.3 2.8 3.2 3.7 4.1 4.6 5.0Frequency (GHz)
Die
lect
ric P
rope
rtie
sε' ε''
Figure C7 Dielectric constant and Loss factor variation with frequency of water

121
Appendix D1. Scanning Electron Microscope images of saskatoon berries
Figure D1 Scanning electron microscope image of osmotically dehydrated
berries with 50% sucrose solution

122
Appendix E1. Digital Images of Experimental Setup
Figure E1 Frozen saskatoon berries
Figure E2 Thawed saskatoon berries placed in polycarbonate sample holder.

123
Figure E3 Panel to switch between preset and modified settings
Figure E4 Front panel with temperature controller and setup to monitor
convection and microwave run-time
CN9000A Temperature Controller

124
Figure E5 Inverter technology built in the Panasonic microwave-convection
system