Dry Run Creek - cedarfalls.com
68
Water Quality Improvement Plan for Dry Run Creek Black Hawk County, Iowa Total Maximum Daily Load for Connected Impervious Surface Prepared By: Jason Palmer and Mindy Buyck Iowa Department of Natural Resources Watershed Improvement Section 2011
Transcript of Dry Run Creek - cedarfalls.com

Water Quality Improvement Plan for
Dry Run Creek Black Hawk County, Iowa
Total Maximum Daily Load
for Connected Impervious Surface
Prepared By: Jason Palmer and Mindy Buyck
Iowa Department of Natural Resources Watershed Improvement Section
2011

This page left blank intentionally

Dry Run Creek Total Maximum Daily Load Table of Contents
Final TMDL - 3 - [August, 2011]
Table of Contents
List of Figures 5 List of Tables 6 General Report Summary 7 Technical Elements of the TMDL 10 1. Introduction 12 2. Description and History of Dry Run Creek (segment No. IA 02-CED-0390) 14
2.1. Dry Run Creek 15 Hydrology. 15 Morphometry & Substrate. 18
2.2. The Dry Run Creek Watershed 18 Land Use. 18 Soils, climate, and topography. 18
3. Total Maximum Daily Load (TMDL) for Flow 20 3.1. Problem Identification 20 IDNR staff followed the SI protocols to determine the cause of the Dry Run Creek biological impairment. The SI procedure relates impairments described by biological assessments to one or more specific causal agents (stressors) and also separates water quality (pollutant) impacts from habitat alteration impacts. 21
Data sources. 22 Interpreting Dry Run Creek data. 22
3.2. TMDL Target 23 General description of the pollutant. 23 Selection of environmental conditions. 23 Water body pollutant loading capacity (TMDL). 24 Decision criteria for water quality standards attainment. 24
3.3. Pollutant Source Assessment 24 Existing load. 24 Water Quality Target. 24 Identification of sources. 24 Allowance for increases in pollutant loads. 24
Table 3.1 Reductions in flow based on revised CIS percentages 25 3.4. Pollutant Allocation 26
Wasteload allocation. 26 Load allocation. 26 Margin of safety. 26
3.5. Reasonable Assurance 26 3.6. TMDL Summary 26
4. Implementation Plan 27 4.1. General Approach & Reasonable Timeline 27
General approach. 27 Timeline. 27
4.2 Best Management Practices 28 5. Future Monitoring 30
5.1. Monitoring Plan to Track TMDL Effectiveness 30 5.2. Idealized Plan for Future Watershed Projects 30 The ideal monitoring plan for Dry Run Creek would involve water chemistry sampling, biological sampling, habitat sampling, and continuous sampling for storm peak flow (Table 5-1) at select sites in the watershed. 30

Dry Run Creek Total Maximum Daily Load Table of Contents
Final TMDL - 4 - [August, 2011]
6. Public Participation 32 6.1. Public Meetings 32 6.2. Written Comments 32
7. References 33 Appendix A --- Glossary of Terms and Acronyms 35 Appendix B --- General and Designated Uses of Iowa’s Waters 41 Appendix C --- Modeling Equations and Methodology 43
C.1 Model Set-up and Development 43 Model Development 43 Model Inputs 43 Calibration. 46
C.2 Validation of the Dry Run Creek Model 47 C.3 Assessing the effects of impervious surface 50
Appendix D --- Public Comments 54 Appendix E --- Water Quality Data 1

Dry Run Creek Total Maximum Daily Load List of Figures
Final TMDL - 5 - [August, 2011]
List of Figures
Figure 2-1 The location of the Dry Run Creek Watershed relative to the Iowan Surface Ecoregion 14
Figure 2-2 Historic stage height of the Cedar River at Cedar Falls depicting a general seasonal trend of wet springs and summers and dry autumns and winters. 15
Figure 2-3 Relationship between flow and stage over time 16 Figure 2-4 Response of stream stage to rain events 16 Figure 2-5 Sampling locations and permitted point source dischargers in the Dry
Run Creek Watershed 17 Figure 2-6 Land uses in the Dry Run Creek watershed based on 2006 aerial
photography 19 Figure C-1. SWAT subbasin delineation for the Beaver Creek Watershed. 44 Figure C-2. SWAT subbasin delineation for Dry Run Creek Watershed. 45 Figure C-3. Yearly flow calibration for Beaver Creek. 47 Figure C-4. Monthly flow calibration for Beaver Creek. 47 Figure C-5. Yearly flow validation for Dry Run Creek. 49 Figure C-6. Monthly flow validation for Dry Run Creek 49 Figure C-7 Comparison of water yields from rural subbasins in Beaver and Dry
Run Creek Watersheds 50 Figure C-8 Comparison of rural and urban subbasin water yields in Dry Run
Creek Watershed. 51 Figure C-9 Duration curve depicting differences in flow between modeled existing
conditions and modeled scenario of 10 percent connected impervious surface. 52

Dry Run Creek Total Maximum Daily Load List of Tables
Final TMDL - 6 - [August, 2011]
List of Tables Table 3-1. Qualitative scoring guidelines for the BMIBI and FIBI. 20 Table 3-2. Reference criteria for assessing biological integrity. 21 Table 3.2 TMDL LA calculations for specified storm event 26 Table 4.1 Average runoff reductions for each practice as compiled by the Center
for Watershed Protection and Chesapeake Stormwater Network. 29 Table 5-1. Idealized monitoring plan for Dry Run Creek. 31 Table B-1. Designated use classes for Iowa water bodies. 42 Table C-1 SWAT parameter and final calibration value 46 Table C-2. Key parameter comparison for the two watersheds. 48 Table C-3 Resulting flow reductions from decreasing impervious surface to 10
percent. 53

Dry Run Creek Total Maximum Daily Load General Report Summary
Final TMDL - 7 - [August, 2011]
General Report Summary What is the purpose of this report? This Water Quality Improvement Plan serves multiple purposes. First, it is a resource for guiding locally-driven water quality improvements in Dry Run Creek (DRC). Second, it satisfies the Federal Clean Water Act requirement to develop a Total Maximum Daily Load (TMDL) report for all federally impaired waterbodies. As an impaired waterbody, Dry Run Creek is eligible for financial assistance to improve water quality. This document is meant to help guide watershed improvement efforts to remove Dry Run Creek from the federal 303(d) list of impaired waters. What’s wrong with Dry Run Creek? Dry Run Creek has an impairment of its biological uses. This impairment is based on data from biological sampling at two sites along the stream (Segment No. IA 02-CED-0390). The biological data collected at the sampling sites included fish species richness, abundance and health that were used to develop a Fish Index of Biotic Integrity (FIBI) and benthic macroinvertebrate species richness and abundance data that were used to develop a Benthic Macroinvertebrate Index of Biotic Integrity (BMIBI). The 2005 FIBI scores from DRC watershed sites 1 & 4 (Table G-1) were significantly lower than the FIBI reference biological impairment criterion (BIC) used to determine aquatic life use support status (Table G-1). Benthic macroinvertebrate sampling at the same sites also uncovered a community with BMIBI scores well below the ecoregion BMIBI BIC. Table G-1 Index of Biotic Integrity scores for benthic macroinvertebrates (BMIBI) and fish (FIBI) from the DRC watershed
Site Year BMIBI
BMIBI Biological Impairment
Criterion (BIC) FIBI
FIBI Biological Impairment
Criterion (BIC)
DRC 1 1999 48 70 50 44
DRC 1 2005 42 70 44 44
DRC 4 2005 38 70 38 65
In general the benthicmacroinvertebrate community in DRC is comprised of pollution tolerant organisms, no sensitive taxa and very few EPT taxa were collected in the biological sampling. The benthicmacroinvertebrate community is a good indicator of overall stream health/quality. In the case of DRC it is used as an integrator of overall stream and water quality. Water quality sampling can often miss spikes in harmful compounds, especially in flashy, event driven systems. Using the invertebrate community as a stream quality indicator indicates that the DRC watershed has chronic water quality and stream habitat problems which have a negative impact on overall stream health.

Dry Run Creek Total Maximum Daily Load General Report Summary
Final TMDL - 8 - [August, 2011]
What is causing the problem? Despite some data limitations, the evidence was sufficient to identify the following primary stressors, all of them are capable of causing a biological impairment in the DRC watershed:
Elevated levels of bedded sediments Reduced macro and micro habitat availability Excessive storm water inputs and hydrologic alterations
All three of these primary stressors are tied to the hydrologic alterations and pollutant delivery from increased urban stormwater inputs to the stream system. The increased frequency and magnitude of storm water flow from urbanized sections of the DRC watershed have significant impacts, direct and indirect, on stream biota. Increases in stream flow velocities directly impact biota through increased hydraulic scour of benthic surfaces. Organisms exposed to these shear forces may be dislodged and transported downstream, experience stresses that reduce reproduction and feeding efficiency, or may suffer from direct mortality. Increased in-stream velocities also have indirect impacts on stream biota. Large increases in stream velocity can scour periphyton, which mainly grows on the upper surfaces of benthic substrate, reducing food available for organisms in the scraper feeding guild. Rapid increases in stream velocities can exert pressures on more than just the biota in the stream system. Increases in peak velocity will result in changes in channel geomorphology. Typical reactions include channel incision (bed degradation) followed by channel widening (streambank sloughing/erosion). These channel adjustments are a direct response to increased flow and are predictable and constant across landscapes (Lane, 1955; Schumm, 1999; Simon, 1989). Channel and floodplain modification and changes in discharge caused by changes in watershed land use may alter physical features of the stream network. This includes, peak discharge, lateral and longitudinal connectivity, sediment transport characteristics, and the retention and accumulation of woody debris and organic materials. Additionally alterations to the stream (channelization) preformed in order to increase the drainage capacity of this system will have long lasting impacts on the system. Stream channelization removes stream meanders, increases stream gradient, shortens stream length, and decreases in-channel water and sediment storage capacity. The result of this activity is a channel that conveys water downstream in an extremely efficient manner, placing further hydrologic pressures on in-stream features downstream of the reach. Impacts associated with storm water runoff are not limited to direct hydrologic effects. Increased storm water runoff is consistently associated with an increase in pollutant loads. Storm water pollutant loading is likely impacting the biological community in DRC. The degree to which the impairment can be attributed to storm water pollutant loading cannot be determined. Neither the additive nor synergistic impacts of the array of chemicals present in DRC can be quantified. The complicated web of interactions that occur among and between metals and chemicals, and the organisms in DRC cannot be untangled. It is likely that the combined effects of the pesticides, metals and other chemicals are having an adverse impact on biota attempting to inhabit this system.

Dry Run Creek Total Maximum Daily Load General Report Summary
Final TMDL - 9 - [August, 2011]
Depending upon the causal mechanism, primary stressors can manifest as short-term acute impacts or long-term chronic impacts to aquatic biota. To restore the biological condition of the stream to unimpaired status, the TMDL and implementation plans need to address each of the primary stressors and multiple causal pathways that occur in the watershed. What can be done to improve Dry Run Creek? The existing loads, loading targets, a general listing of BMPs needed to improve water quality, and a monitoring plan to assess progress are established in this TMDL. Ideally, the TMDL would be followed by the development of a watershed management plan. The watershed management plan should include more comprehensive and detailed strategies to better guide the implementation of specific BMPs. Other ongoing tasks required to obtain real and significant water quality improvements include continued monitoring, assessment of water quality trends, assessment of WQS (biological community) attainment, and adjustment of proposed BMP types, locations, and implementation schedule based on measured results. A full discussion of this can be found in Section 4 of this document. Who is responsible for a cleaner Dry Run Creek? Everyone who lives, works, or plays in the Dry Run Creek watershed has a role in water quality improvement. Due to the nature of the problem and the complicated issues at play in tracking and isolating pollutants and pollution related to storm water discharges in DRC it is not likely that the management of individual point sources will have much impact on DRC. Because of this, success in DRC may only be achieved when all municipal, and university departments responsible for storm water regulation, design and maintenance come together with development companies, commercial and industrial interest groups, and community based watershed interest groups to organize all current and future storm water regulation, design, improvement and public education into one centrally focused plan. Everyone in the watershed has a roll to play, from the home owner spraying herbicide on their yard to the facilities manager responsible for the maintenance of dozens of parking lots. Everyone must pay attention to what makes it into the storm water system and how that water is handled.

Dry Run Creek Total Maximum Daily Load Technical Elements of the TMDL
Final TMDL - 10 - [August, 2011]
Technical Elements of the TMDL
Name and geographic location of the impaired or threatened waterbody for which the TMDL is being established:
Dry Run Creek located in Black Hawk County Hydrologic Unit Code: HUC 12 070802050401 IDNR Waterbody ID: IA 02-CED-0390 Section 18 T89N R13W (Mouth) Section 23 T89N R14W (confluence with Unnamed tributary)
Surface water classification and designated uses:
Class A1 Primary Contact Recreation Class B (WW-2) Aquatic Life
Impaired beneficial uses: Class A1 Primary Contact Recreation Class B (WW-2) Aquatic Life
Identification of the pollutant and applicable water quality standards:
Biological targets are based on the Fish Index of Biotic Integrity (FIBI) and Benthic Macroinvertebrate Index of Biotic Integrity (BMIBI). Stream segments having FIBI or BMIBI scores below the 25th percentile of reference sites are considered impaired. Measurements from the monitored Dry Run Creek stream segments are compared to stream reference sites within the same ecological region. These biotic index targets are set for scores equaling or exceeding the 25th percentile of regional reference sites.
Quantification of the pollutant load that may be present in the waterbody and still allow attainment and maintenance of water quality standards:
The TMDL is based on attaining Connected Impervious Surface of less than 10%.
Quantification of the amount or degree by which the current pollutant load in the waterbody, including the pollutant from upstream sources that is being accounted for as background loading, deviates from the pollutant load needed to attain and maintain water quality standards:
See table 3.1 in document
Identification of pollution source categories:
Increased frequency and magnitude of stream flow due to increased connected impervious surface area
Wasteload allocations for pollutants from point sources:
Since the TMDL is targeting CIS and the resulting storm runoff flows associated with CIS, there is no WLA assigned.

Dry Run Creek Total Maximum Daily Load Technical Elements of the TMDL
Final TMDL - 11 - [August, 2011]
Load allocations for pollutants from nonpoint sources:
See table 3.2 in document
A margin of safety: Explicit MOS of 10%
Consideration of seasonal variation: None
Reasonable assurance that load and wasteload allocations will be met:
Availability of technical and financial assistance for conservation practices and watershed improvement grants. Funding made available to local stakeholder groups on an annual basis provides an opportunity for local citizens and landowners to seek their own solutions with technical guidance from state and local government agencies
Allowance for reasonably foreseeable increases in pollutant loads:
None
Implementation plan: Although not required by the Clean Water Act, a general Implementation Plan is included in this report to assist managers in removing this stream from the 303(d) Impaired Waters List

Dry Run Creek Total Maximum Daily Load Introduction
Final TMDL - 12 - [August, 2011]
1. Introduction The Federal Clean Water Act requires all states to develop lists of impaired waterbodies that are not meeting water quality standards (WQS) and designated uses. This list of impaired waterbodies is referred to as the state’s 303(d) list. In addition to developing the 303(d) list, a Water Quality Improvement Plan, or Total Maximum Daily Load (TMDL) report, must also be developed for each impaired waterbody included on the list. DRC was first added to the Section 303(d) Impaired Waters List in 2002 following biological sampling in 2000 as part of the Iowa Department of Natural Resources (IDNR) stream biocriteria project. It was determined that the Dry Run Creek biological community was impaired based on assessment of the fish and benthic macroinvertebrate communities. Benthic macroinvertebrates are animals that are larger than 0.5 mm and lack backbones. These animals live on rocks, logs, sediment, debris and aquatic plants during some period in their life. They include crayfish, mussels, snails, aquatic worms, and the immature forms of aquatic insects such as stonefly and mayfly nymphs.
Because the cause (stressor) of the poor condition of the biological community was unknown, a method called Stressor Identification (SI) was used to determine the existing stressors in Dry Run Creek. The process involves “critically reviewing available information, forming possible stressor scenarios that might explain the impairment, analyzing those scenarios, and producing conclusions about which stressor or stressors are causing the impairment” (U.S. EPA 2000). The SI determined that excess storm water run off from connected impervious surface (CIS) was the cause. A TMDL is a calculation of the maximum amount of a pollutant a waterbody can receive without exceeding the water quality standards. The TMDL is allocated to permitted point sources (wasteload allocations), nonpoint sources (load allocations), and an allowance for a margin of safety to account for uncertainty in the TMDL calculation. The TMDL calculation is represented by the following general equation: TMDL = LC = WLA + LA + MOS
Where: TMDL = total maximum daily load LC = loading capacity
WLA = sum of wasteload allocations (point sources) LA = sum of load allocations (nonpoint sources) MOS = margin of safety (to account for uncertainty) One purpose of this Water Quality Improvement Plan for Dry Run Creek, located in Black Hawk County in central Iowa, is to serve as the TMDL for CIS and the resulting stormflow. The second purpose of the plan is to provide local stakeholders and watershed managers with a tool to promote awareness of water quality issues, guide watershed improvement efforts, and assist the development of a Watershed Management Plan and subsequent funding applications for water quality improvement projects.

Dry Run Creek Total Maximum Daily Load Introduction
Final TMDL - 13 - [August, 2011]
The water quality parameters addressed by this plan are CIS and the resulting stormflows, which are adversely affecting the biological community in Dry Run Creek. The plan outlines a phased approach to TMDL development and implementation. A phased approach is helpful when the origin, interaction, and quantification of pollutants contributing to water quality problems are complex and difficult to fully understand and predict. The TMDL includes an assessment of existing pollutant loads to the stream and a determination of how much of a specific pollutant the stream can tolerate and still meet water quality standards and support its designated uses. The allowable amount of pollutant the stream can receive is the loading capacity, also called the target load. The TMDL also includes a description of potential solutions to the water quality problem. This group of solutions is generally defined as a system of best management practices (BMPs) that will improve water quality in Dry Run Creek with the ultimate goal of supporting all designated uses. These BMPs are outlined in the implementation plan in Chapter 6. A water quality monitoring plan designed to help assess water quality improvement and BMP effectiveness is provided in Chapter 7. This Water Quality Improvement Plan will be of little value to real water quality improvement unless a Watershed Management Plan is developed and watershed improvement activities and BMPs are implemented. This will require the active engagement of local stakeholders and the collaboration of several state and local agencies. Completion of the TMDL should also be followed by several other actions, including:
collection of water quality data as part of an ongoing monitoring plan, evaluation of collected data, and modification of the targets and/or implementation plan (if necessary).
Monitoring is a crucial element in assessing attainment of water quality standards and designated uses, determining if water quality is improving, degrading, or remaining unchanged, and assessing the effectiveness of implementation activities and the possible need for additional BMPs.

Dry Run Creek Total Maximum Daily Load Description and History of the Waterbody
Final TMDL - 14 - [August, 2011]
2. Description and History of Dry Run Creek (segment No. IA 02-CED-0390) The surface watershed of DRC is located near the center of the Iowan Surface ecoregion, in western Black Hawk County (Figure 2-1). The Iowan Surface (47c) ecoregion is a geologically complex region located between the bedrock-dominated landforms of the Paleozoic Plateau region and the relatively recent glacial drift landforms of the Des Moines Lobe (Prior 1991; Griffith et al., 1994). Dry Run Creek is a third order stream which flows to the Cedar River. At the confluence with the Cedar River in Cedar Falls, DRC receives flow from 15,248 surface acres.
Figure 2-1 The location of the Dry Run Creek Watershed relative to the Iowan Surface Ecoregion
Dry Run Creek Total Maximum Daily Load Description and History of the Waterbody
Final TMDL - 15 - [August, 2011]
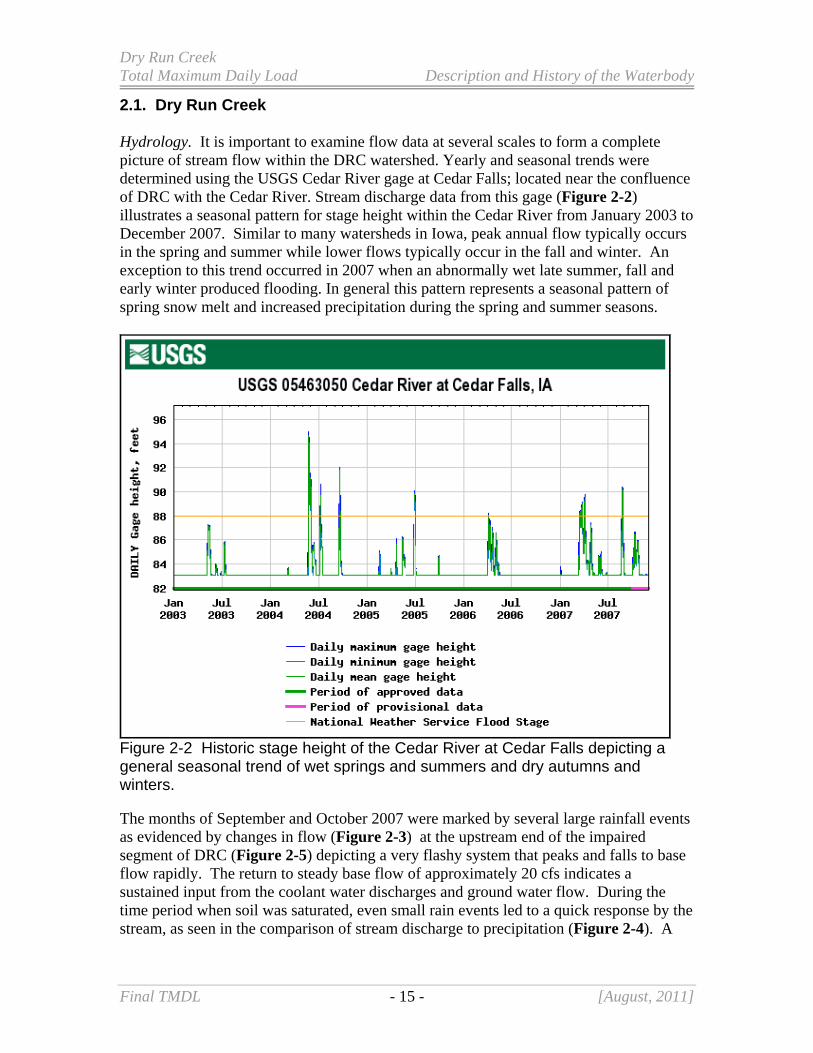
2.1. Dry Run Creek Hydrology. It is important to examine flow data at several scales to form a complete picture of stream flow within the DRC watershed. Yearly and seasonal trends were determined using the USGS Cedar River gage at Cedar Falls; located near the confluence of DRC with the Cedar River. Stream discharge data from this gage (Figure 2-2) illustrates a seasonal pattern for stage height within the Cedar River from January 2003 to December 2007. Similar to many watersheds in Iowa, peak annual flow typically occurs in the spring and summer while lower flows typically occur in the fall and winter. An exception to this trend occurred in 2007 when an abnormally wet late summer, fall and early winter produced flooding. In general this pattern represents a seasonal pattern of spring snow melt and increased precipitation during the spring and summer seasons.
Figure 2-2 Historic stage height of the Cedar River at Cedar Falls depicting a general seasonal trend of wet springs and summers and dry autumns and winters. The months of September and October 2007 were marked by several large rainfall events as evidenced by changes in flow (Figure 2-3) at the upstream end of the impaired segment of DRC (Figure 2-5) depicting a very flashy system that peaks and falls to base flow rapidly. The return to steady base flow of approximately 20 cfs indicates a sustained input from the coolant water discharges and ground water flow. During the time period when soil was saturated, even small rain events led to a quick response by the stream, as seen in the comparison of stream discharge to precipitation (Figure 2-4). A

Dry Run Creek Total Maximum Daily Load Description and History of the Waterbody
Final TMDL - 16 - [August, 2011]
discussion of the impacts of urbanization on the hydrology of this stream network is located Stressor Identification document (SI doc location Appendix XX).
Figure 2-3 Relationship between flow and stage over time
Figure 2-4 Response of stream stage to rain events

Dry Run Creek Total Maximum Daily Load Description and History of the Waterbody
Final TMDL - 17 - [August, 2011]
Figure 2-5 Sampling locations and permitted point source dischargers in the Dry Run Creek Watershed

Dry Run Creek Total Maximum Daily Load Description and History of the Waterbody
Final TMDL - 18 - [August, 2011]
Morphometry & Substrate. Dry Run Creek is a third order watershed with a dendritic drainage pattern (Figure 2-5). The total stream length in the DRC watershed is just over 50 miles. The main channel is 22 miles long, has a sinuosity of 1.34 and a slope of 10.2 feet per mile. The DRC basin has a stream density of 1.26 mi/sq mi and an average basin slope of 0.3 percent. Habitat surveys conducted throughout the watershed indicate that the dominant substrate is comprised of sand and silt. The proportion of this depends heavily on the hydrologic variability of the stream segment. Areas subject to frequent scour from storm events tended to be comprised of mostly sand. There are deposits of gravels and small cobble in certain areas of the stream system. These substrates, where present, were observed to be heavily embedded by sand and silt. The channel bottom and banks were observed to be heavily scoured and armored in the lower sections of the watershed, mostly with in urban areas. 2.2. The Dry Run Creek Watershed Land Use. At the confluence with the Cedar River in Cedar Falls, DRC is a third-order stream draining 15,248 acres in western Black Hawk County (Figure 2-6). Current land use in the watershed is a mix of agriculture and urban. Row crop agriculture dominates the landscape in the upper portions of the watershed. Most of the first order tributaries contain agricultural land in the riparian corridor. Roughly 55 percent of the watershed is currently utilized for row crop agriculture and 4 percent is used as grazed grassland. The central and lower portions of the watershed have been urbanized over the past 100 years with the growth of the Cedar Falls area. Based on the 2002 land cover data 22 percent of the watershed is in urban land use and more than 9 percent of the watershed surface is impervious. Urbanization in the central portions of the watershed was especially rapid over the last decade. Urban development in the DRC watershed was determined on a yearly basis utilizing GIS information from the Black Hawk County assessor’s office. Information from this analysis indicated that certain areas of the watershed have experienced an increase of over 200 percent in urban land use over the last decade. Soils, climate, and topography. The surface watershed of DRC is located near the center of the Iowan Surface ecoregion (Figure 2-1). The Iowan Surface (47c) ecoregion is a geologically complex region located between the bedrock-dominated landforms of the Paleozoic Plateau region and the relatively recent glacial drift landforms of the Des Moines Lobe (Prior 1991; Griffith et al., 1994). The southern and southeastern border of this ecoregion is irregular and crossed by major northwest-to-southeast trending stream valleys. In the northern portion of the region, glacial deposits are thin and shallow limestone bedrock creates karst features such as sinkholes and sags. There are no natural lakes of glacial origin in this region, but overflow areas and backwater ponds occur on some of the larger river channels, providing diverse aquatic habitat and a large number of fish species.

Dry Run Creek Total Maximum Daily Load Description and History of the Waterbody
Final TMDL - 19 - [August, 2011]
Figure 2-6 Land uses in the Dry Run Creek watershed based on 2006 aerial photography

Dry Run Creek Total Maximum Daily Load Implementation Plan
Final TMDL - 20 - [August, 2011]
3. Total Maximum Daily Load (TMDL) for Flow A Total Maximum Daily Load (TMDL) is required for Dry Run Creek by the Federal Clean Water Act. This chapter will quantify the maximum amount of connected impervious surface (CIS) that Dry Run Creek can tolerate without violating the state’s water quality standards. 3.1. Problem Identification Applicable Water Quality Standards. The Iowa stream classification document designates the protected aquatic life use for Dry Run Creek, Black Hawk County as B (WW-2). Class B (WW2) streams are small warmwater streams which support fish primarily composed of minnows and other nongame species. In 1998, the aquatic life use was assessed as “partially supporting” based on a 1992 stream use assessment. DRC was not biologically assessed again until 1999; however on July 25, 1996 a fish kill was reported which affected 0.3 miles of stream and killed over 60 fish. No data which could identify the cause of the kill was available. Biological assessments conducted in 1999 at one site in the stream confirmed that the biological community in DRC did not meet expectations, so the stream was added to the 2002 303(d) Impaired Waters List as “not supporting” its aquatic life use. Additional biological data was collected at two sites in 2005. The methods used to determine support of aquatic life use include calculating a series of biological metrics that reflect stream water quality and habitat integrity from the biological sampling data collected. The metrics are based on the numbers and types of benthic macroinvertebrate and fish species that were collected. The biological metrics were combined to make a fish index of biotic integrity (FIBI) and a benthic macroinvertebrate index (BMIBI). The biotic indexes rank the biological integrity of a stream sampling reach on a scale from 0 (minimum) to 100 (maximum). Table 3-1 shows general qualitative scoring guidelines for the two indexes. Table 3-1. Qualitative scoring guidelines for the BMIBI and FIBI. Biological Condition Rating BMIBI FIBI Poor 0 - 30 0 -25 Fair 31 - 55 26 - 50 Good 56 - 75 51 - 70 Excellent 76 - 100 71 - 100
Biological sampling from reference streams in Iowa’s ecoregions has been used to derive target BMIBI and FIBI scores for each ecoregion (See Section 2, Fig. 2-4). The reference stream BMIBI and FIBI scores shown are the minimum scores for biological integrity that support aquatic life use in ecoregion 52b (Table 3-2). Below these values a stream is considered either partially or not supporting designated uses. The stream is then listed for a biological impairment of undetermined cause based on low FIBI and/or BMIBI scores. The Dry Run Creek BMIBI and FIBI scores are well below the ecoregion 52b biological impairment conditions (Table 3-3).

Dry Run Creek Total Maximum Daily Load Implementation Plan
Final TMDL - 21 - [August, 2011]
Table 3-2. Reference criteria for assessing biological integrity. Ecoregion BMIBI FIBI
47c (Iowan Surface 70 44 non-riffle sites
65 riffle sites
IDNR staff followed the SI protocols to determine the cause of the Dry Run Creek biological impairment. The SI procedure relates impairments described by biological assessments to one or more specific causal agents (stressors) and also separates water quality (pollutant) impacts from habitat alteration impacts. The stressor identification for Dry Run Creek identified increased flow from CIS as the primary cause of the biological impairment. The increased flow causes instability in the substrate that many macroinvertebrates and fish use for breeding and habitat. Additionally, the increased run off from parking lots and construction sites can carry pollutants such as petroleum products (gas and oil), other automobile fluids (antifreeze, power steering fluid, and windshield washer solution), road salts and lawn care chemicals (fertilizers and pesticides). While none of these alone appear to be causing the biological impairment, constant exposure to low levels of several listed pollutants may contribute to an unhealthy macroinvertebrate and fish population. The effects of many of these pollutants in high levels is still unknown much less the effects of constant low level exposure Problem statement. In 2002, the stream was assessed as “not supporting” because the 1999 monitoring assessment revealed poor biological integrity. The FIBI and BMIBI scores for Dry Run Creek from the 1999 sampling and additional biological sampling in 2005 are shown in Table 3-3. BMIBI and FIBI scores from sampling locations in the Dry Run Creek watershed generally indicate poor to fair biological condition based on the ratings in Table 3-1. The shaded columns list the Biological Impairment Criteria (BIC) that are determined from the range of IBI scores sampled from ecoregion 47c reference stream sites. The Dry Run Creek BMIBI and FIBI scores are below the ecoregion biological impairment conditions, which is strong evidence that the biological impairment is consistent across space and time. Table 3-3. Index of Biotic Integrity scores for benthic macroinvertebrates (BMIBI) and fish (FIBI) from the Dry Run Creek watershed.
Site Year BMIBI
BMIBI Biological Impairment
Criterion (BIC) FIBI
FIBI Biological Impairment
Criterion (BIC)
DRC 1 1999 48 70 50 44
DRC 1 2005 42 70 44 44
DRC 4 2005 38 70 38 65

Dry Run Creek Total Maximum Daily Load Implementation Plan
Final TMDL - 22 - [August, 2011]
In general the benthic macroinvertebrate community in Dry Run Creek is comprised of pollution tolerant organisms, no sensitive taxa and very few EPT taxa were collected in the biological sampling. The benthic macroinvertebrate community is a good indicator of overall stream health/quality. In the case of Dry Run Creek it is used as an integrator of overall stream and water quality. Water quality sampling can often miss spikes in harmful compounds, especially in flashy, event driven systems. Using the invertebrate community as a stream quality indicator indicates that the DRC watershed has chronic water quality and stream habitat problems which have a negative impact on overall stream health. Data sources. Full biological sampling was performed at one location in 1999 (Site DRC1) and two locations in 2005 (Sites DRC1 and DRC4), with rapid bioassessment protocol (RBP) sampling at eleven additional sites in 2005. Stream physical habitat was also assessed at all biosampling sites. Water quality samples were collected from ten Dry Run Creek sites from June through December 2005, March through December 2006, and February through September 2007 (Appendix E). Interpreting Dry Run Creek data. According to the Methodology for Developing Iowa’s 2004 Section 303(d) List of Impaired Waters, reference stream FIBI and BMIBI scores shown in Table 3-2 for the watershed ecoregion are considered ‘supporting’ the aquatic life use. Dry Run Creek will be considered no longer impaired when the ecoregion 47c BICs are met/ The primary stressors determined by the Stressor Identification process are tied to the hydrologic alterations and pollutant delivery from increased urban stormwater inputs to the stream system. The increased frequency and magnitude of storm water flow from urbanized sections of the DRC watershed have significant impacts, direct and indirect, on stream biota. Increases in stream flow velocities directly impact biota through increased hydraulic scour of benthic surfaces. Organisms exposed to these shear forces may be dislodged and transported downstream, experience stresses that reduce reproduction and feeding efficiency, or may suffer from direct mortality. Increased in-stream velocities also have indirect impacts on stream biota. Large increases in stream velocity can scour periphyton, which mainly grows on the upper surfaces of benthic substrate, reducing food available for organisms in the scraper feeding guild. Rapid increases in stream velocities can exert pressures on more than just the biota in the stream system. Increases in peak velocity will result in changes in channel geomorphology. Typical reactions include channel incision (bed degradation) followed by channel widening (streambank sloughing/erosion). These channel adjustments are a direct response to increased flow and are predictable and constant across landscapes (Lane, 1955; Simon, 1989; Schumm, 1999). Channel and floodplain modification and changes in discharge caused by changes in watershed land use may alter physical features of the stream network. This includes, peak discharge, lateral and longitudinal connectivity, sediment transport characteristics, and the retention and accumulation of woody debris and organic materials. Additionally alterations to the stream

Dry Run Creek Total Maximum Daily Load Implementation Plan
Final TMDL - 23 - [August, 2011]
(channelization) preformed in order to increase the drainage capacity of this system will have long lasting impacts on the system. Stream channelization removes stream meanders, increases stream gradient, shortens stream length, and decreases in-channel water and sediment storage capacity. The result of this activity is a channel that conveys water downstream in an extremely efficient manner, placing further hydrologic pressures on in-stream features downstream of the reach. Impacts associated with storm water runoff are not limited to direct hydrologic effects. Increased storm water runoff is consistently associated with an increase in pollutant loads. Storm water pollutant loading is likely impacting the biological community in DRC. The degree to which the impairment can be attributed to storm water pollutant loading cannot be determined. Neither the additive nor synergistic impacts of the array of chemicals present in DRC can be quantified. The complicated web of interactions that occur among and between metals and chemicals, and the organisms in DRC cannot be untangled. It is likely that the combined effects of the pesticides, metals and other chemicals are having an adverse impact on biota attempting to inhabit this system. 3.2. TMDL Target General description of the pollutant. Multiple studies have shown a linkage between increased urbanization and alterations in community composition, reduced taxa richness and diversity, and an increase in pollution tolerant taxa in macroinvertebrate communities (Stepenuck et al. 2002; Booth and Jackson, 1997; Jones and Clark, 1987). Studies conducted on 43 southern Wisconsin streams showed that levels of connected impervious surfaces between 8 and 12 percent represented a threshold where minor increases in urbanization were associated with sharp declines in macroinvertebrate communities (Stepenuck et.al. 2002). Additional studies in the same streams showed that number of fish species per site and fish IBI scores were consistently low in watersheds with greater than 10 percent connected impervious surfaces (Wang et. al. 2000). Selection of environmental conditions. Urbanization in the central portions of the watershed has increased significantly over the last decade. Data on urban development in the DRC watershed, determined on a yearly basis utilizing GIS information from the Black Hawk County assessor’s office, showed that certain areas of the watershed have experienced a 200 percent increase in urban land use over the last decade. Sub-watersheds 4 and 8 along the southeastern branch of DRC had the highest percent increase in the watershed over the past decade (Figure 2-6). The increased frequency and magnitude of storm water flow from urbanized sections of the DRC watershed have significant impacts, direct and indirect, on stream biota. Increases in stream flow velocities directly impact biota through increased hydraulic scour of benthic surfaces. Organisms exposed to these shear forces may be dislodged and transported downstream, experience stresses that reduce reproduction and feeding efficiency, or may suffer from direct mortality. Increased in-stream velocities also have indirect impacts on stream biota. Large increases in stream velocity can scour

Dry Run Creek Total Maximum Daily Load Implementation Plan
Final TMDL - 24 - [August, 2011]
periphyton, which mainly grows on the upper surfaces of benthic substrate, reducing food available for organisms in the scraper feeding guild. Increases in magnitude and frequency of peak velocities can destabilize the stream bed resulting in frequent mobilization of benthic surfaces. This reduces colonization potential and in extreme cases may result in the direct burial of organisms. Water body pollutant loading capacity (TMDL). The goal for DRC is to decrease storm event runoff associated with CIS, which is based on attaining CIS of less than 10 percent. The reductions are based on different magnitude storm events with various return periods (or recurrence intervals) that coincide with different stormwater management BMPs. Decision criteria for water quality standards attainment. The decision criteria for water quality standards attainment in Dry Run Creek are based on meeting biological conditions typical of healthy reference streams for this ecoregion. 3.3. Pollutant Source Assessment Existing load. The SI conducted in Dry Run Creek identified increased stormwater run-off and its associated pollutants as the most probable cause of the biological impairment. Since the impairment cannot be tied to one specific pollutant, the use of CIS as a surrogate measure has been targeted. The use of a surrogate in TMDLs is supported by Federal Regulation 40 CFR § 130.2-(i) which states “TMDLs can be expressed in terms of either mass per time, toxicity, or other appropriate measure.” Research has indicated a strong relationship between increased CIS and declining macroinvertebrates and fish populations. Water Quality Target. The TMDL was developed using CIS as a surrogate for increased stormwater runoff and the array of pollutants associated with the runoff. To quantify the effects of CIS on stormwater flows, a SWAT model was developed and ran for existing conditions and for the target of 10% CIS in subwatersheds with higher percentage of CIS. The resulting flows were compared for 24-hour Water Quality storm event (as provided by the Iowa Stormwater Management Manual available at http://www.ctre.iastate.edu/PUBS/stormwater/documents/2C-2RainfallandRunoffAnalysis.pdf) and the target was based on the resulting decrease in flow from current conditions to 10% CIS. The flows associated with these storm events (plus or minus 10 percent to provide a more robust data set) were acquired by identifying storms of this magnitude within the weather data set and comparing resulting model flows for the current land management and a scenario of 10% CIS applied across the watershed for those given 24 hour periods. Identification of sources. The source of the increased storm runoff in Dry Run Creek is the increase of CIS as urbanization continues to expand. Allowance for increases in pollutant loads. There are no allowances for increases in as the implementation plan calls for all new construction to put BMPs in place to allow for infiltration.
Dry Run Creek Total Maximum Daily Load Implementation Plan
Final TMDL - 25 - [August, 2011]
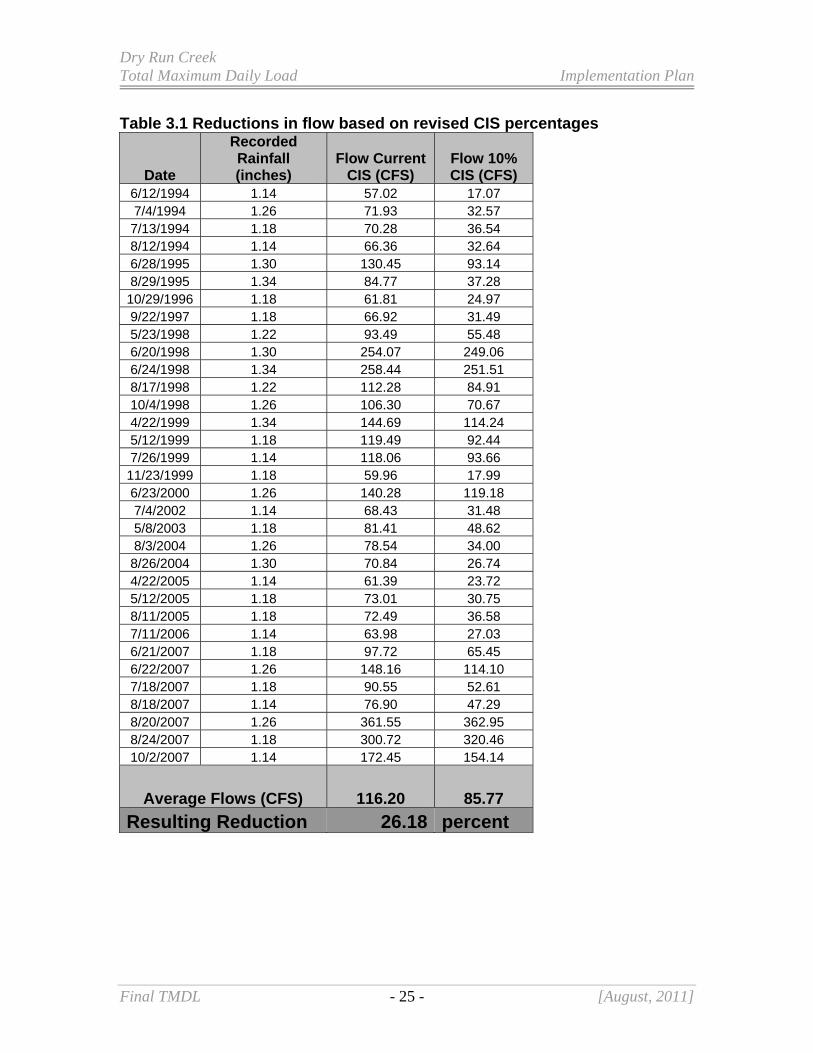
Table 3.1 Reductions in flow based on revised CIS percentages
Date
Recorded Rainfall (inches)
Flow Current CIS (CFS)
Flow 10% CIS (CFS)
6/12/1994 1.14 57.02 17.07 7/4/1994 1.26 71.93 32.57 7/13/1994 1.18 70.28 36.54 8/12/1994 1.14 66.36 32.64 6/28/1995 1.30 130.45 93.14 8/29/1995 1.34 84.77 37.28
10/29/1996 1.18 61.81 24.97 9/22/1997 1.18 66.92 31.49 5/23/1998 1.22 93.49 55.48 6/20/1998 1.30 254.07 249.06 6/24/1998 1.34 258.44 251.51 8/17/1998 1.22 112.28 84.91 10/4/1998 1.26 106.30 70.67 4/22/1999 1.34 144.69 114.24 5/12/1999 1.18 119.49 92.44 7/26/1999 1.14 118.06 93.66
11/23/1999 1.18 59.96 17.99 6/23/2000 1.26 140.28 119.18 7/4/2002 1.14 68.43 31.48 5/8/2003 1.18 81.41 48.62 8/3/2004 1.26 78.54 34.00 8/26/2004 1.30 70.84 26.74 4/22/2005 1.14 61.39 23.72 5/12/2005 1.18 73.01 30.75 8/11/2005 1.18 72.49 36.58 7/11/2006 1.14 63.98 27.03 6/21/2007 1.18 97.72 65.45 6/22/2007 1.26 148.16 114.10 7/18/2007 1.18 90.55 52.61 8/18/2007 1.14 76.90 47.29 8/20/2007 1.26 361.55 362.95 8/24/2007 1.18 300.72 320.46 10/2/2007 1.14 172.45 154.14
Average Flows (CFS) 116.20 85.77
Resulting Reduction 26.18 percent
Dry Run Creek Total Maximum Daily Load Implementation Plan
Final TMDL - 26 - [August, 2011]
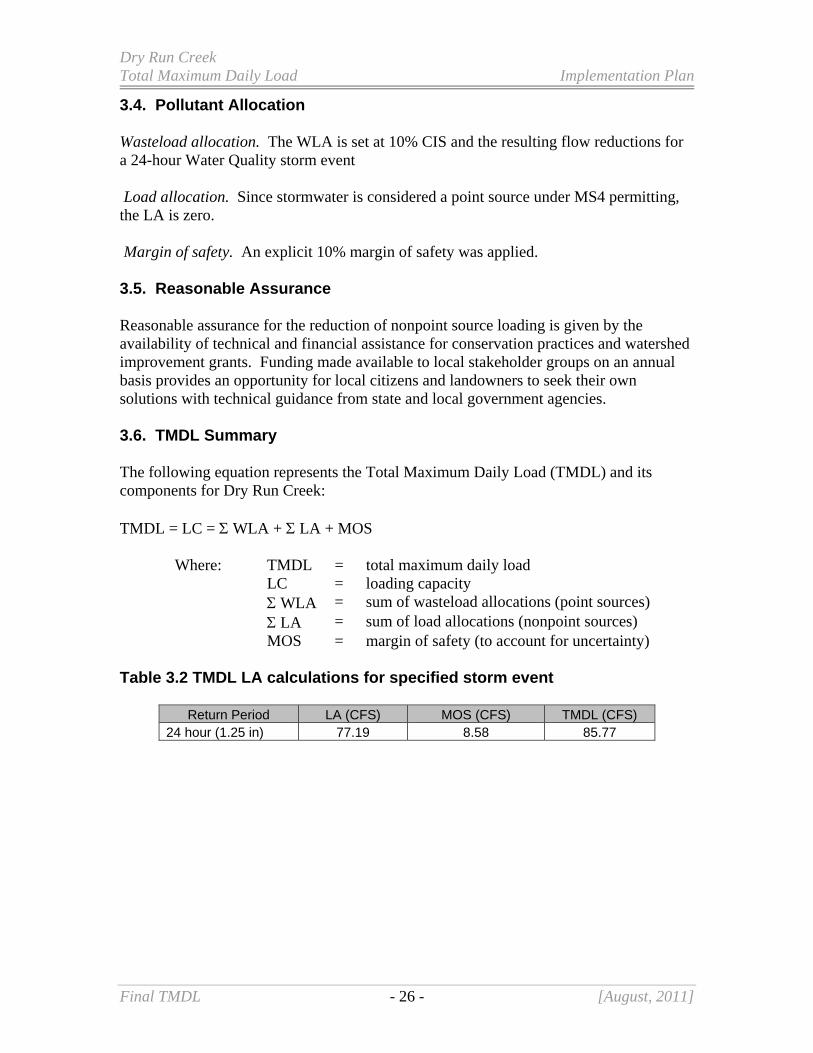
3.4. Pollutant Allocation Wasteload allocation. The WLA is set at 10% CIS and the resulting flow reductions for a 24-hour Water Quality storm event Load allocation. Since stormwater is considered a point source under MS4 permitting, the LA is zero. Margin of safety. An explicit 10% margin of safety was applied. 3.5. Reasonable Assurance Reasonable assurance for the reduction of nonpoint source loading is given by the availability of technical and financial assistance for conservation practices and watershed improvement grants. Funding made available to local stakeholder groups on an annual basis provides an opportunity for local citizens and landowners to seek their own solutions with technical guidance from state and local government agencies. 3.6. TMDL Summary The following equation represents the Total Maximum Daily Load (TMDL) and its components for Dry Run Creek: TMDL = LC = WLA + LA + MOS
Where: TMDL = total maximum daily load LC = loading capacity WLA = sum of wasteload allocations (point sources) LA = sum of load allocations (nonpoint sources) MOS = margin of safety (to account for uncertainty)
Table 3.2 TMDL LA calculations for specified storm event
Return Period LA (CFS) MOS (CFS) TMDL (CFS) 24 hour (1.25 in) 77.19 8.58 85.77

Dry Run Creek Total Maximum Daily Load Implementation Plan
Final TMDL - 27 - [August, 2011]
4. Implementation Plan This implementation plan is not a requirement of the Federal Clean Water Act. However, the Iowa Department of Natural Resources recognizes that technical guidance and support are critical to achieving the goals outlined in this TMDL. Therefore, this plan is included to be used by local professionals, watershed managers, and citizens for decision-making support and planning purposes. The best management practices (BMPs) listed below represent a comprehensive list of tools that may help achieve water quality goals if applied in an appropriate manner; however, it is up to land managers, citizens, and local conservation technicians to determine exactly how best to implement them. 4.1. General Approach & Reasonable Timeline Initiative and action by local landowners and citizens are crucial to improving the overall health of any watershed. This is especially true of the Dry Run Creek watershed because most of the land is a combination of privately and publicly owned land. Watershed work and improvements to the creek should proceed in conjunction with a comprehensive monitoring system that will adequately characterize daily, seasonal, and annual pollutant loadings in the creek as improvements to the watershed are made. General approach. The existing loads, loading targets, a general listing of BMPs needed to improve water quality, and a monitoring plan to assess progress are established in this TMDL. Ideally, the TMDL would be followed by the development of a watershed management plan. The watershed management plan should include more comprehensive and detailed strategies to better guide the implementation of specific BMPs. Other ongoing tasks required to obtain real and significant water quality improvements include continued monitoring, assessment of water quality trends, assessment of WQS (biological community) attainment, and adjustment of proposed BMP types, locations, and implementation schedule based on measured results. Timeline. Development of a comprehensive watershed management plan takes time—perhaps as long as one to three years. Implementation of watershed BMPs could take upwards of five to ten years, depending on funding, willingness of landowner participation, and time needed for design and construction of any structural BMPs. Realization and documentation of water quality benefits and improvement in the biological community may take 10 years or longer, depending on weather patterns, amount of data collected, and the successful location, design, construction, and maintenance of BMPs. Utilization of the monitoring plan as outlined in Chapter 5 should begin immediately to establish baseline conditions, and should continue throughout implementation of BMPs and beyond.

Dry Run Creek Total Maximum Daily Load Implementation Plan
Final TMDL - 28 - [August, 2011]
4.2 Best Management Practices Recently, there has been growing interest in utilizing BMPs that are not only effective but also aesthetically pleasing. Each practice is limited in how much runoff it can reduce, placement and cost. It will require effective planning on the part of watershed improvement groups to research these BMPs and decide on a case by case basis which one is most effective. Table 4.1 provides average runoff reductions for each practice as compiled by the Center for Watershed Protection and Chesapeake Stormwater Network. The following is a list of defined practices that might be of use in the Dry Run Creek watershed. Green Roofs: the roof of a building that is partially or completely covered with vegetation and soil, or a growing medium, planted over a waterproofing membrane. It may also include additional layers such as a root barrier and drainage and irrigation systems. Rain tanks and Cisterns: rain capturing devices and systems. The water can then be used as grey water or outdoor irrigation.
Permeable Pavement: Porous pavement is a permeable pavement surface with or without an underlying reservoir that temporarily stores surface runoff before infiltrating into the subsoil. This porous surface replaces traditional pavement, allowing parking lot runoff to infiltrate directly into the soil. There are several pavement options, including porous asphalt, pervious concrete, and grass pavers. Porous asphalt and pervious concrete appear the same as traditional pavement from the surface, but are manufactured without "fine" materials, and incorporate void spaces to allow infiltration. Grass pavers are concrete interlocking blocks or synthetic fibrous grid systems with open areas designed to allow grass to grow.
Bioretention: Bioretention utilizes soils and plants to remove pollutants from storm water runoff. Runoff is conveyed as sheet flow to the treatment area, which consists of a grass buffer strip, sand bed, ponding area, organic or mulch layer, planting soil, and plants. Runoff passes first over or through a sand bed, which slows the runoff's velocity and distributes it evenly along the length of the ponding area, which consists of a surface organic layer and/or ground cover and the underlying planting soil. Dry Swales: Dry swales are essentially bioretention cells that are shallower, configured as linear channels, and covered with turf or other surface material (other than mulch and plants). The dry swale is a soil filter system that temporarily stores and then filters the desired volume. Dry swales rely on a pre-mixed soil media filter below the channel that is similar to that used for bioretention. If soils are extremely permeable, runoff infiltrates into underlying soils. In most cases, however, the runoff treated by the soil media flows into an underdrain, which conveys treated runoff back to the conveyance system further downstream. The underdrain system consists of a perforated pipe within a gravel layer on the bottom of the swale.

Dry Run Creek Total Maximum Daily Load Implementation Plan
Final TMDL - 29 - [August, 2011]
Table 4.1 Average runoff reductions for each practice as compiled by the Center for Watershed Protection and Chesapeake Stormwater Network.
Practice Average Runoff Reduction
Green Roofs 46 to 60%
Rain tanks and Cisterns 40%
Permeable Pavement 45 to 75%
Bioretention 40 to 80%
Dry Swales 40 to 60%

Dry Run Creek Total Maximum Daily Load Monitoring Plan
Final TMDL - 30 - [August, 2011]
5. Future Monitoring Water quality monitoring is a critical element in assessing the current status of water resources and historical trends. Furthermore, monitoring is necessary to track the effectiveness of water quality improvements made in the watershed and document the status of the waterbody in terms of achieving total maximum daily loads. Also, because the impaired use is for aquatic life, biological sampling is critical to document any improvement in the biological community that may result from implementation efforts within the watershed. Future water quality monitoring in the Dry Run Creek watershed can be agency-led, volunteer-based, or a combination of both. The Iowa Department of Natural Resources (IDNR) Watershed Monitoring and Assessment Section administers a water quality monitoring program that provides training to interested volunteers. This program is called IOWATER. More information can be found at the program web site: http://www.iowater.net/Default.htm. Biological monitoring should be conducted by a professional organization such as the University of Iowa Hygienic Lab (UHL) to ensure accuracy and consistency of methods 5.1. Monitoring Plan to Track TMDL Effectiveness Currently, due to resource limitations, there are no plans for water quality monitoring or biological sampling in the Dry Run Creek watershed. 5.2. Idealized Plan for Future Watershed Projects The ideal monitoring plan for Dry Run Creek would involve water chemistry sampling, biological sampling, habitat sampling, and continuous sampling for storm peak flow (Table 5-1) at select sites in the watershed.

Dry Run Creek Total Maximum Daily Load Monitoring Plan
Final TMDL - 31 - [August, 2011]
Table 5-1. Idealized monitoring plan for Dry Run Creek.
Component Sample Frequency Parameters/Details
Water chemistry sampling*
Bi-weekly-March to October Monthly-November to February
All common parameters listed in Appendix A of the Iowa Water Monitoring Plan 2000
http://www.igsb.uiowa.edu/wqm/publications/plan2000.htm
Benthic Macroinvertebrate and Fish sampling*
Annually Should be done to track improvement in benthic macroinvertebrates and fish and evaluate changes in species susceptible to ammonia toxicity and low DO.
Habitat sampling* Annually
Concurrently with the biological sampling, habitat assessment should take place according to IDNR protocols. Will track improvement in habitat conditions that may be contributing to the impairment such as sedimentation and substrate embeddedness.
Storm Peak Flow* From June to October
Autosampler deployment according to UHL protocols (15 minute intervals)
*Sampling locations should be consistent with those used during SI process found in figure 2-5. While resources may not currently be available to implement this type of monitoring plan, this strategy should be incorporated into the Dry Run Creek Watershed Management Plan discussed in Section 4. Then, as funding becomes available to support watershed improvement efforts, this monitoring plan can be implemented by the local watershed group(s).

Dry Run Creek Total Maximum Daily Load Public Participation
Final TMDL - 32 - [August, 2011]
6. Public Participation Public involvement is important in the TMDL process since it is the land owners, tenants, and citizens who directly manage land and live in the watershed that determine the water quality in Dry Run Creek. During the development of this TMDL, every effort was made to ensure that local stakeholders were involved in the decision-making process to agree on feasible and achievable goals for the water quality in Dry Run Creek. 6.1. Public Meetings A public meeting was held on Thursday, Oct. 19, 2010. The meeting was from 6 to 8 p.m. at Lantz Auditorium (room 137) in McCollum Science Hall on the campus of the University of Northern Iowa in Cedar Falls. 6.2. Written Comments No comments were received during the comment period.

Dry Run Creek Total Maximum Daily Load References
Final TMDL - 33 - [August, 2011]
7. References Biggs, B. J. F., R. A. Smith, and M. J. Duncan, 1999. Velocity and sediment disturbance of periphyton in headwater streams: biomass and metabolism. Journal of the North American Benthological Society 18 (2): 222-241 Booth, D. B. and C. R. Jackson, 1997. Urbanization of aquatic systems: degradation thresholds, stormwater detection, and the limits of mitigation. Journal of the American Water Resources Association 33(5):1077-1090 Gassman, P.W., Reyes, M.R., Arnold, J.G., and Green, C. 2006. The Soil Water Assessment Tool: developmental history, applications and future directions. Transaction ASAE Griffith, G.E., J.M. Omernik, T.F. Wilton, and S. M. Pierson. 1994. Ecoregions and sub-ecoregions of Iowa: a framework for water quality assessment and management. Jour. Iowa Acad. Sci. 10(1): 5-13 IDNR. 2005 (a). Steps for stressor identification. January 28, 2005. Watershed Improvement Section, Environmental Services Division, Iowa Department of Natural Resources. 4p. IDNR. 2005 (b). Methodology for Iowa’s 2004 water quality assessment, listing, and reporting pursuant to Sections 305(b) and 303(d) of the federal Clean Water Act. Iowa Department of Natural Resources, Des Moines, Iowa. [online]. Available at: http://www.iowadnr.com/water/tmdlwqa/wqa/303d/2004/2004FinalMethodology.pdf. May 2005. Jones, R. C. and C. C. Clark, 1987. Impact of watershed urbanization on stream insect communities. Water Resources Bulletin 23 (6):1047-1055 Lane, E. W. 1955. The importance o fluvial morphology in hydraulic engineering. Proceedings of the American Society of Civil Engineers 81: 1-17 MacDonald, D.D., C.G. Ingersoll, T.A. Berger, 2000. Development and evaluation of consensus-based sediment quality guidelines for freshwater ecosystems. Archives of Environmental Contamination and Toxicology 39: 20-31 Prior, J.C. 1991. Landforms of Iowa. University of Iowa Press. Iowa City, Iowa. 153p. Schilling, K.E. and Libra R.D. 2004. Increased baseflow in Iowa over the second half of the 20th Century. Journal of the American Water Resources Association 39:851-860.

Dry Run Creek Total Maximum Daily Load References
Final TMDL - 34 - [August, 2011]
Schumm, S. A. 1999. Causes and controls of channel incision In: Incised Rivers, S. E. Darby and A. Simon (Editors). John Wiley and Sons, Chichester, United Kingdom, pp. 19-33 Simon, A. 1989. A model of channel response in disturbed alluvial channels. Earth Surface Processes and Landforms 14: 11-26 Stepenuck, K. F., R. L., Crunkilton, and L. Wang, 2002. Impacts of urban landuse on macroinvertebrate communities in southeastern Wisconsin streams. Journal of the American Water Resources Association 38 (4): 1041-1051 U.S. EPA. 2000. Stressor Identification Guidance Document. U.S. Environmental Protection Agency. December 2000. U.S. EPA. 2005. Handbook for characterizing causes: Eighth Edition. U.S. EPA. 2006. National Recommended Water Quality Criteria. U. S. Environmental Protection Agency. Wang, L., J. Lyons, P. Kanehl, R. Bannerman, and E. Emmons, 2000. Watershed urbanization and changes in fish communities in southeastern Wisconsin streams. Journal of the American Water Resources Association 36 (5): 1173-1189 Wood, P. L., P. D. Armitage, 1997. Biological effects of fines sediment in the lotic environment. Environmental Management. 21 (2): 203-217

Dry Run Creek Total Maximum Daily Load Appendix B --- General and Designated Uses
Final TMDL - 35 - [August, 2011]
Appendix A --- Glossary of Terms and Acronyms 303(d) list: Refers to section 303(d) of the Federal Clean Water Act, which
requires a listing of all public surface water bodies (creeks, rivers, wetlands, and lakes) that do not support their general and/or designated uses. Also called the state’s “Impaired Waters List.”
305(b) assessment: Refers to section 305(b) of the Federal Clean Water Act, it is a
comprehensive assessment of the state’s public water bodies ability to support their general and designated uses. Those bodies of water which are found to be not supporting or just partially supporting their uses are placed on the 303(d) list.
319: Refers to Section 319 of the Federal Clean Water Act, the
Nonpoint Source Management Program. Under this amendment, States receive grant money from EPA to provide technical & financial assistance, education, & monitoring to implement local nonpoint source water quality projects.
AFO: Animal Feeding Operation. A livestock operation, either open or confined, where animals are kept in small areas (unlike pastures) allowing manure and feed become concentrated.
Base flow: The fraction of discharge (flow) in a river which comes from
ground water. BMIBI: Benthic Macroinvertebrate Index of Biotic Integrity. An index-
based scoring method for assessing the biological health of streams and rivers (scale of 0-100) based on characteristics of bottom-dwelling invertebrates.
BMP: Best Management Practice. A general term for any structural or
upland soil or water conservation practice. For example terraces, grass waterways, sediment retention ponds, reduced tillage systems, etc.
CAFO: Confinement Animal Feeding Operation. An animal feeding
operation in which livestock are confined and totally covered by a roof, and not allowed to discharge manure to a water of the state.
Credible data law: Refers to 455B.193 of the Iowa Administrative Code, which
ensures that water quality data used for all purposes of the Federal Clean Water Act are sufficiently up-to-date and accurate.

Dry Run Creek Total Maximum Daily Load Appendix B --- General and Designated Uses
Final TMDL - 36 - [August, 2011]
Cyanobacteria (blue-green algae):
Members of the phytoplankton community that are not true algae but can photosynthesize. Some species can be toxic to humans and pets.
Designated use(s): Refer to the type of economic, social, or ecologic activities that a
specific water body is intended to support. See Appendix B for a description of all general and designated uses.
DNR (or IDNR): Iowa Department of Natural Resources. Ecoregion: A system used to classify geographic areas based on similar
physical characteristics such as soils and geologic material, terrain, and drainage features.
EPA (or USEPA): United States Environmental Protection Agency. FIBI: Fish Index of Biotic Integrity. An index-based scoring method
for assessing the biological health of streams and rivers (scale of 0-100) based on characteristics of fish species.
FSA: Farm Service Agency (United States Department of Agriculture).
Federal agency responsible for implementing farm policy, commodity, and conservation programs.
General use(s): Refer to narrative water quality criteria that all public water
bodies must meet to satisfy public needs and expectations. See Appendix B for a description of all general and designated uses.
GIS: Geographic Information System(s). A collection of map-based
data and tools for creating, managing, and analyzing spatial information.
Gully erosion: Soil movement (loss) that occurs in defined upland channels and
ravines that are typically too wide and deep to fill in with traditional tillage methods.
HEL: Highly Erodible Land. Defined by the USDA Natural Resources
Conservation Service (NRCS), it is land which has the potential for long term annual soil losses to exceed the tolerable amount by eight times for a given agricultural field.

Dry Run Creek Total Maximum Daily Load Appendix B --- General and Designated Uses
Final TMDL - 37 - [August, 2011]
Integrated report: Refers to a comprehensive document which combines the 305(b) assessment with the 303(d) list, as well as narratives and discussion of overall water quality trends in the state’s public water bodies. The Iowa Department of Natural Resources submits an integrated report to the EPA biennially in even numbered years.
LA: Load Allocation. The fraction of the total pollutant load of a
water body which is assigned to all combined nonpoint sources in a watershed. (The total pollutant load is the sum of the waste load and load allocations.)
Load: The total amount (mass) of a particular pollutant in a waterbody. MOS: Margin of Safety. In a total maximum daily load (TMDL) report,
it is a set-aside amount of a pollutant load to allow for any uncertainties in the data or modeling.
MS4 Permit: Municipal Separate Storm Sewer System Permit. An NPDES
license required for some cities and universities which obligates them to ensure adequate water quality and monitoring of runoff from urban storm water and construction sites, as well as public participation and outreach.
Nonpoint source pollution:
A collective term for contaminants which originate from a diffuse source.
NPDES: National Pollution Discharge Elimination System, which allows a
facility (e.g. an industry, or a wastewater treatment plant) to discharge to a water of the United States under regulated conditions.
NRCS: Natural Resources Conservation Service (United States
Department of Agriculture). Federal agency which provides technical assistance for the conservation and enhancement of natural resources.
Periphyton: Algae that are attached to substrates (rocks, sediment, wood, and
other living organisms). Phytoplankton: Collective term for all self-feeding (photosynthetic) organisms
which provide the basis for the aquatic food chain. Includes many types of algae and cyanobacteria.

Dry Run Creek Total Maximum Daily Load Appendix B --- General and Designated Uses
Final TMDL - 38 - [August, 2011]
Point source pollution:
A collective term for contaminants which originate from a specific point, such as an outfall pipe. Point sources are generally regulated by an NPDES permit.
PPB: Parts per Billion. A measure of concentration which is the same
as micrograms per liter (µg/l). PPM: Parts per Million. A measure of concentration which is the same
as milligrams per liter (mg/l). Riparian: Refers to site conditions that occur near water, including specific
physical, chemical, and biological characteristics that differ from upland (dry) sites.
RUSLE: Revised Universal Soil Loss Equation. An empirical model for
estimating long term, average annual soil losses due to sheet and rill erosion.
Secchi disk: A device used to measure transparency in water bodies. The
greater the secchi depth (measured in meters), the more transparent the water.
Sediment delivery ratio:
A value, expressed as a percent, which is used to describe the fraction of gross soil erosion which actually reaches a water body of concern.
Seston: All particulate matter (organic and inorganic) in the water
column. Sheet & rill erosion Soil loss which occurs diffusely over large, generally flat areas of
land. SI: Stressor Identification. A process by which the specific cause(s)
of a biological impairment to a water body can be determined from cause-and-effect relationships.
Storm flow (or stormwater):
The fraction of discharge (flow) in a river which arrived as surface runoff directly caused by a precipitation event. Storm water generally refers to runoff which is routed through some artificial channel or structure, often in urban areas.
STP: Sewage Treatment Plant. General term for a facility that
processes municipal sewage into effluent suitable for release to public waters.

Dry Run Creek Total Maximum Daily Load Appendix B --- General and Designated Uses
Final TMDL - 39 - [August, 2011]
SWCD: Soil and Water Conservation District. Agency which provides local assistance for soil conservation and water quality project implementation, with support from the Iowa Department of Agriculture and Land Stewardship.
TMDL: Total Maximum Daily Load. As required by the Federal Clean
Water Act, a comprehensive analysis and quantification of the maximum amount of a particular pollutant that a water body can tolerate while still meeting its general and designated uses.
TSI (or Carlson’s TSI):
Trophic State Index. A standardized scoring system (scale of 0-100) used to characterize the amount of algal biomass in a lake or wetland.
TSS: Total Suspended Solids. The quantitative measure of seston, all
materials, organic and inorganic, which are held in the water column.
Turbidity: The degree of cloudiness or murkiness of water caused by
suspended particles. UAA: Use Attainability Analysis. A protocol used to determine which
(if any) designated uses apply to a particular water body. (See Appendix B for a description of all general and designated uses.)
UHL: University Hygienic Laboratory (University of Iowa). Provides
physical, biological, and chemical sampling for water quality purposes in support of beach monitoring and impaired water assessments.
USGS: United States Geologic Survey (United States Department of the
Interior). Federal agency responsible for implementation and maintenance of discharge (flow) gauging stations on the nation’s water bodies.
Watershed: The land (measured in units of surface area) which drains water to
a particular body of water or outlet. WLA: Waste Load Allocation. The fraction of waterbody loading
capacity assigned to point sources in a watershed. Alternatively, the allowable pollutant load that an NPDES permitted facility may discharge without exceeding water quality standards.

Dry Run Creek Total Maximum Daily Load Appendix B --- General and Designated Uses
Final TMDL - 40 - [August, 2011]
WQS: Water Quality Standards. Defined in Chapter 61 of Environmental Protection Commission [567] of the Iowa Administrative Code, they are the specific criteria by which water quality is gaged in Iowa.
WWTP: Waste Water Treatment Plant. General term for a facility which
processes municipal, industrial, or agricultural waste into effluent suitable for release to public waters or land application.
Zooplankton: Collective term for all animal plankton which serve as secondary
producers in the aquatic food chain and the primary food source for larger aquatic organisms.

Dry Run Creek Total Maximum Daily Load Appendix B --- General and Designated Uses
Final TMDL - 41 - [August, 2011]
Appendix B --- General and Designated Uses of Iowa’s Waters Introduction Iowa’s water quality standards (Environmental Protection Commission [567], Chapter 61 of the Iowa Administrative Code) provide the narrative and numerical criteria by which water bodies are judged when determining the health and quality of our aquatic ecosystems. These standards vary depending on the type of water body (lakes vs. rivers) and the assigned uses (general use vs. designated uses) of the water body that is being dealt with. This appendix is intended to provide information about how Iowa’s water bodies are classified and what the use designations mean, hopefully providing a better general understanding for the reader. All public surface waters in the state are protected for certain beneficial uses, such as livestock and wildlife watering, aquatic life, non-contact recreation, crop irrigation, and other incidental uses (e.g. withdrawal for industry and agriculture). However, certain rivers and lakes warrant a greater degree of protection because they provide enhanced recreational, economical, or ecological opportunities. Thus, all public bodies of surface water in Iowa are divided into two main categories: general use segments and designated use segments. This is an important classification because it means that not all of the criteria in the state’s water quality standards apply to all water ways; rather, the criteria which apply depend on the use designation & classification of the water body. General Use Segments A general use segment water body is one which does not maintain perennial (year-round) flow of water or pools of water in most years (i.e. ephemeral or intermittent waterways). In other words, stream channels or basins which consistently dry up year after year would be classified as general use segments. Exceptions are made for years of extreme drought or floods. For the full definition of a general use water body, consult section 61.3(1) in the state’s published water quality standards, which became effective on March 22, 2006 (Environmental Protection Commission [567], Chapter 61 of the Iowa Administrative Code). General use waters are protected for the beneficial uses listed above, which are: livestock and wildlife watering, aquatic life, non-contact recreation, crop irrigation, and industrial, agricultural, domestic and other incidental water withdrawal uses. The criteria used to ensure protection of these uses are described in section 61.3(2) in the state’s published water quality standards, which became effective on March 22, 2006 (Environmental Protection Commission [567], Chapter 61 of the Iowa Administrative Code). Designated Use Segments Designated use segments are water bodies which maintain flow throughout the year, or at least hold pools of water which are sufficient to support a viable aquatic community (i.e. perennial waterways). In addition to being protected for the same beneficial uses as the general use segments, these perennial waters are protected for more specific activities such as primary contact recreation, drinking water sources, or cold-water fisheries. There are a total of thirteen different designated use classes (Table B-1) which may apply, and a

Dry Run Creek Total Maximum Daily Load Appendix B --- General and Designated Uses
Final TMDL - 42 - [August, 2011]
water body may have more than one designated use. For definitions of the use classes and more detailed descriptions, consult section 61.3(1) in the state’s published water quality standards, which became effective on March 22, 2006 (Environmental Protection Commission [567], Chapter 61 of the Iowa Administrative Code).
Table B-1. Designated use classes for Iowa water bodies.
Class prefix
Class Designated use Brief comments
A
A1 Primary contact recreation Supports swimming, water skiing, etc.
A2 Secondary contact recreation Limited/incidental contact occurs, such as boating
A3 Children’s contact recreation Urban/residential waters that are attractive to children
B
B(CW1) Cold water aquatic life – Type 2 Able to support coldwater fish (e.g. trout) populations
B(CW2) Cold water aquatic life – Type 2 Typically unable to support consistent trout populations
B(WW-1) Warm water aquatic life – Type 1 Suitable for game and nongame fish populations
B(WW-2) Warm water aquatic life – Type 2 Smaller streams where game fish populations are limited by physical conditions & flow
B(WW-3) Warm water aquatic life – Type 3 Streams that only hold small perennial pools which extremely limit aquatic life
B(LW) Warm water aquatic life – Lakes and Wetlands
Artificial and natural impoundments with “lake-like” conditions
C C Drinking water supply Used for raw potable water
Other
HQ High quality water Waters with exceptional water quality
HQR High quality resource Waters with unique or outstanding features
HH Human health Fish are routinely harvested for human consumption

Dry Run Creek Total Maximum Daily Load Appendix C --- Modeling and Methods
Final TMDL - 43 - [August, 2011]
Appendix C --- Modeling Equations and Methodology The Soil and Water Assessment Tool (SWAT) is a hydrologic and water quality model developed by the U.S. Department of Agriculture (USDA) Agricultural Research Service (ARS) (Arnold et al., 1998 Arnold and Fohrer, 2005; Gassman et al., 2005). It is a long-term, continuous, watershed-scale, simulation model that operates on a daily time step and is designed to assess the impact of land use and different land management practices on water, nutrient and bacteria yields. The model is physically based and includes major components of weather, hydrology, soil temperature, crop growth, nutrients, bacteria and land management. SWAT was later adapted to run within the Global Information Systems (GIS) platform in a version called ARCSWAT. C.1 Model Set-up and Development Model Development . It is standard practice to calibrate SWAT model flow output to USGS gauging stations within the watershed of interest. However in the case of Dry Run Creek, the gage at the confluence of Dry Run Creek and the Cedar River collects only stage data. There is a further complication in that at this gage flow gets backed up and floods upstream into Dry Run Creek. Therefore, this gage is not a point that can be calibrated to. The ideal solution would have been to choose a watershed with the same landuses as seen in Dry Run Creek that could be calibrated to a gage, find the appropriate curve numbers to calibrate the secondary watershed and apply those to Dry Run Creek. However, Dry Run Creek, with its amount of urban landuse is unique to the Iowan Surface. Therefore, the next option was to use an adjacent watershed, calibrate it to a corresponding USGS gage, use the curve numbers for all non-urban landuses within the Dry Run Creek model and then use standard urban curve numbers as cited within the SWAT model literature. The Beaver Creek watershed is directly north of the Dry Run Creek watershed. This is a typical Iowan Surface watershed with over 80 percent of the land in corn and soybean rotations. Additionally, this model had an advantage of already being in development for a grant research project through the EPA Region 7 TMDL program by the Center for Agricultural and Rural Development (CARD) at Iowa State University. Model Inputs The ARCSWAT interface requires several major input files including: Digital Elevation Map (DEM) at 30 foot resolution, SURGO or STATSGO soils maps, and a landuse cover. A 2007 landuse cover was used which updated the 2002 landuse cover for new construction. The SURGO soils data was used. The model also requires weather data for precipitation and high/low temperature data. This data was acquired from the environmental Mesonet from the Waterloo station. Once the initial data was loaded, the models were set up. During the watershed delineation process, outlets were removed and added in order to create subwatersheds that are similar in size but encompassed either an area dominated by rural landuse or urban landuse. The resulting subbasins for both the Beaver Creek and Dry Run Creek models are provided in figures C-1 and C-2. This was done in an effort to make later comparisons between major landuse categories easier. Slope was divided into five classes

Dry Run Creek Total Maximum Daily Load Appendix C --- Modeling and Methods
Final TMDL - 44 - [August, 2011]
(0-2, 2-5, 5-7, 7-9, and 9-9999). During the HRU definition thresholds were set at 10% for landuse, soils and slope classes. However, the landuse of forest and pastures were retained outside of the filter. The model was run for a weather period of 1990-2008.
Figure C-1. SWAT subbasin delineation for the Beaver Creek Watershed.

Dry Run Creek Total Maximum Daily Load Appendix C --- Modeling and Methods
Final TMDL - 45 - [August, 2011]
Figure C-2. SWAT subbasin delineation for Dry Run Creek Watershed.

Dry Run Creek Total Maximum Daily Load Appendix C --- Modeling and Methods
Final TMDL - 46 - [August, 2011]
Calibration. The Beaver Creek model was calibrated to the USGS gage station 0546300 at New Hartford, Ia. The model was run for the years 1990-2008 and model output from 1994-2008 was used in calibration. It is suggested by the developers of the SWAT model to skip at least the first 3 years of data to allow then model to converge. In this case the first 4 years were used. This approach provided a 15 year output data set. The model was calibrated to yearly and monthly flows. The final calibrated values are listed in Table C-1. The r-square values for these calibrations are provided in figures C-3 and C-4. A Nash-Sutcliffe statistical analysis was also ran for the yearly and monthly Beaver Creek models and resulted in values of 0.76 and 0.79 respectively. Table C-1 SWAT parameter and final calibration value Model Input Parameter Calibrated Value Streamflow Curve Number Corn 67 Soybean 68 Grasses 59 Alfalfa 59 Forest 66 Surface Runoff Lag 4 days Soil Evaporation Compensation Coeff. 0.95 Groundwater Delay 30 days Alpha Baseflow Factor 0.048 days Soil ET method Nitrate Ammonia Fertilizer Rate 152 lbs/ac
Di-ammonium Phosphate Fertilizer Rate 156 lbs/ac
Nitrogen Percolation Coeff. 0.8
Once the Beaver Creek model was developed the Dry Run Creek model was also assigned the same curve numbers with the exception of expansion of the urban numbers. Because runoff from impervious surface was chosen as the surrogate pollutant and this would be what was targeted for future BMPs, a higher level of resolution was needed. SWAT allows for several parameters of urban landuse (transportation, commercial, residential, ect.) to be used that create better resolution. The main categories of urban landuse for Dry Run Creek were: transportation, commercial and residential (low, medium and high). The standard curve numbers provided by the SWAT model were used since these are well documented in literature. Upon a review of the Beaver Creek model it was found slopes were inaccurately calculated. Slopes were recalculated via a re-delineation of the model. However, this resulted in little to no change to subbasin water yields. Since the model was used strictly for determining curve numbers and the resulting curve numbers matched other modeling

Dry Run Creek Total Maximum Daily Load Appendix C --- Modeling and Methods
Final TMDL - 47 - [August, 2011]
efforts in the ecoregion, there were no resulting changes made to the Dry Run Creek model.
Yearly Calibration of Beaver Creek to USGS Gage
R2 = 0.8706
0
100
200
300
400
500
600
0 100 200 300 400 500 600
Cubic feet per second
Cu
bic
fee
t p
er s
eco
nd
Figure C-3. Yearly flow calibration for Beaver Creek.
Monthly Calibration of Beaver Creek to USGS Gage
R2 = 0.8133
0
200
400
600
800
1000
1200
1400
1600
1800
0 500 1000 1500 2000
Cubic feet per second
Cubic
fee
t per
sec
ond
Figure C-4. Monthly flow calibration for Beaver Creek. C.2 Validation of the Dry Run Creek Model

Dry Run Creek Total Maximum Daily Load Appendix C --- Modeling and Methods
Final TMDL - 48 - [August, 2011]
After the Dry Run Creek model was build using these input parameters, methods of assessing the model performance were still needed. Although there was not a properly operating gage to which to validate this and local variation in rainfall would produce high variability in daily flows between Beaver and Dry Run creeks, monthly and yearly flow patterns should be similar. Other annual basin values such as precipitation, baseflow, and evapotranspiration (ET) were compared for model agreement (Table C-2). Additionally, water yields in rural subbasins should also be comparable since these are corrected for area. In general there was good agreement between the models. Table C-2. Key parameter comparison for the two watersheds. Parameter Beaver Creek Dry Run Creek Precipitation 884.7 mm 821.8 mm Surface Q 116.17 mm 155.75 mm Total GW Q* 128.81 mm 125.62 mm Baseflow % 52.60% 44.60% ET 622.6 mm 524.4 mm
*Total GW Q consists of groundwater Q, lateral Q, and tile drain Q. The differences between baseflow and ET between the two models can both be accounted for by the increase in impervious surface percentages. In the Dry Run Creek watershed the impervious surfaces reduce vegetation leading to less ET and at the same time reduce the amount of water that can infiltrate and move as a component of groundwater which decreases baseflow. Comparisons of flow between models yielded r-square values of .78 for yearly and .62 for monthly flows. Surface water yields in rural subbasins were also compared on an annual basis. There was good agreement between the models for this component. A sampling of years is shown below in figure (C-5). Of the years chosen to compare, 1994 and 1999 were considered near average precipitation years while 2003 was a below average year and 2008 was an above average year. Validations were also performed using r-square values for the yearly and monthly flow comparisons (figures C-5 and C-6).

Dry Run Creek Total Maximum Daily Load Appendix C --- Modeling and Methods
Final TMDL - 49 - [August, 2011]
Yearly Validation of Dry Run Creek
R2 = 0.7856
0
5
10
15
20
25
30
35
40
0 100 200 300 400 500 600
Cubic feet per second
Cu
bic
fee
t p
er s
eco
nd
Figure C-5. Yearly flow validation for Dry Run Creek.
Monthly Validation of Dry Run Creek
R2 = 0.6136
0
10
20
30
40
50
60
70
80
90
0 500 1000 1500 2000
Cubic feet per second
Cubic
fee
t per
sec
ond
Figure C-6. Monthly flow validation for Dry Run Creek
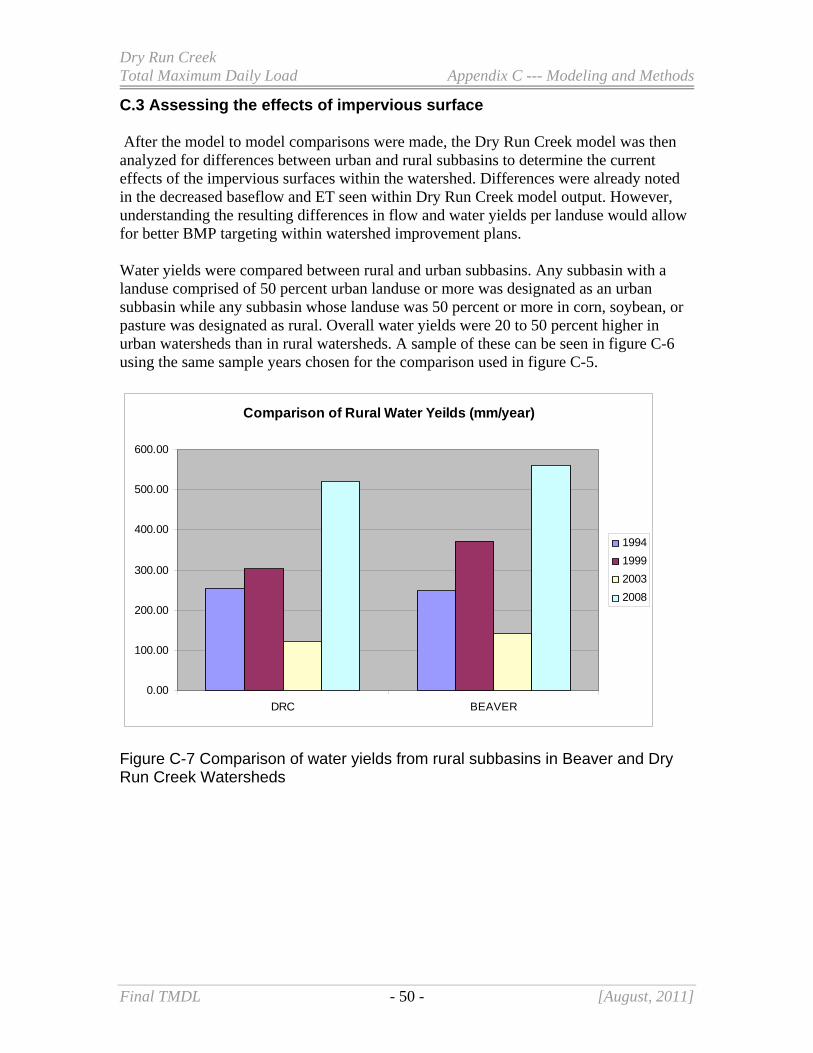
Dry Run Creek Total Maximum Daily Load Appendix C --- Modeling and Methods
Final TMDL - 50 - [August, 2011]
C.3 Assessing the effects of impervious surface After the model to model comparisons were made, the Dry Run Creek model was then analyzed for differences between urban and rural subbasins to determine the current effects of the impervious surfaces within the watershed. Differences were already noted in the decreased baseflow and ET seen within Dry Run Creek model output. However, understanding the resulting differences in flow and water yields per landuse would allow for better BMP targeting within watershed improvement plans. Water yields were compared between rural and urban subbasins. Any subbasin with a landuse comprised of 50 percent urban landuse or more was designated as an urban subbasin while any subbasin whose landuse was 50 percent or more in corn, soybean, or pasture was designated as rural. Overall water yields were 20 to 50 percent higher in urban watersheds than in rural watersheds. A sample of these can be seen in figure C-6 using the same sample years chosen for the comparison used in figure C-5.
Comparison of Rural Water Yeilds (mm/year)
0.00
100.00
200.00
300.00
400.00
500.00
600.00
DRC BEAVER
1994
1999
2003
2008
Figure C-7 Comparison of water yields from rural subbasins in Beaver and Dry Run Creek Watersheds

Dry Run Creek Total Maximum Daily Load Appendix C --- Modeling and Methods
Final TMDL - 51 - [August, 2011]
Water Yields (mm/yr) per Landuse in Dry Run Creek
0.00
100.00
200.00
300.00
400.00
500.00
600.00
700.00
800.00
900.00
Rural
Rural
Rural
Rural
Rural
Urban
Urban
Urban
Urban
Urban
Urban
Urban
1994
1999
2003
2008
Figure C-8 Comparison of rural and urban subbasin water yields in Dry Run Creek Watershed. Scientific literature indicates that a connected impervious surface percentage of greater than 10 percent is a threshold at which both fish and macroinvertebrate populations begin to suffer. SWAT assigns an impervious and connected impervious percentage to each urban landuse and allows the user to manipulate these within the database. To model the effects of modifying the urban landscape to achieve 10 percent connected impervious surface or less, all the urban landuses with the exception of transportation were set to a connected impervious surface percentage of 10 percent. Transportation was set at 50 percent since 10 percent was considered to be an impossible target. Flow duration curves comparing the difference in flows between existing conditions and the decreased impervious surface scenario were built (Figure C-7). These curves show two important differences between the existing conditions and the reduced CIS scenario and the associated flows. The first and most important difference is the reduction of flow at the lower percentiles. This represents larger storm events or periods of increased flows. The reduced CIS scenario results in a significant reduction in flow which is accounted for by the reduced runoff. Additionally, the reduction in runoff results in increased baseflow which are evident at the higher percentile which represents dominant low flow conditions.
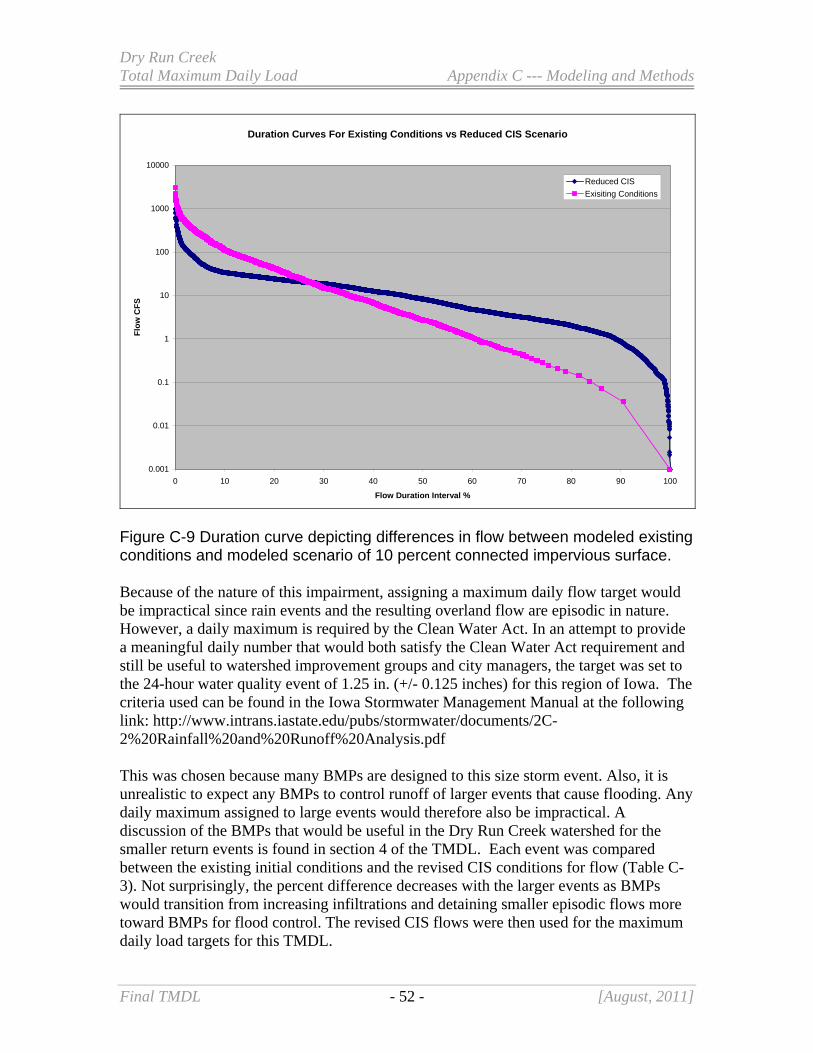
Dry Run Creek Total Maximum Daily Load Appendix C --- Modeling and Methods
Final TMDL - 52 - [August, 2011]
Duration Curves For Existing Conditions vs Reduced CIS Scenario
0.001
0.01
0.1
1
10
100
1000
10000
0 10 20 30 40 50 60 70 80 90 100
Flow Duration Interval %
Flo
w C
FS
Reduced CIS
Exisiting Conditions
Figure C-9 Duration curve depicting differences in flow between modeled existing conditions and modeled scenario of 10 percent connected impervious surface. Because of the nature of this impairment, assigning a maximum daily flow target would be impractical since rain events and the resulting overland flow are episodic in nature. However, a daily maximum is required by the Clean Water Act. In an attempt to provide a meaningful daily number that would both satisfy the Clean Water Act requirement and still be useful to watershed improvement groups and city managers, the target was set to the 24-hour water quality event of 1.25 in. (+/- 0.125 inches) for this region of Iowa. The criteria used can be found in the Iowa Stormwater Management Manual at the following link: http://www.intrans.iastate.edu/pubs/stormwater/documents/2C-2%20Rainfall%20and%20Runoff%20Analysis.pdf This was chosen because many BMPs are designed to this size storm event. Also, it is unrealistic to expect any BMPs to control runoff of larger events that cause flooding. Any daily maximum assigned to large events would therefore also be impractical. A discussion of the BMPs that would be useful in the Dry Run Creek watershed for the smaller return events is found in section 4 of the TMDL. Each event was compared between the existing initial conditions and the revised CIS conditions for flow (Table C-3). Not surprisingly, the percent difference decreases with the larger events as BMPs would transition from increasing infiltrations and detaining smaller episodic flows more toward BMPs for flood control. The revised CIS flows were then used for the maximum daily load targets for this TMDL.

Dry Run Creek Total Maximum Daily Load Appendix C --- Modeling and Methods
Final TMDL - 53 - [August, 2011]
Table C-3 Resulting flow reductions from decreasing impervious surface to 10 percent.
Date
Recorded Rainfall (inches)
Flow Current CIS (CFS)
Flow 10% CIS (CFS)
6/12/1994 1.14 57.02 17.07 7/4/1994 1.26 71.93 32.57 7/13/1994 1.18 70.28 36.54 8/12/1994 1.14 66.36 32.64 6/28/1995 1.30 130.45 93.14 8/29/1995 1.34 84.77 37.28
10/29/1996 1.18 61.81 24.97 9/22/1997 1.18 66.92 31.49 5/23/1998 1.22 93.49 55.48 6/20/1998 1.30 254.07 249.06 6/24/1998 1.34 258.44 251.51 8/17/1998 1.22 112.28 84.91 10/4/1998 1.26 106.30 70.67 4/22/1999 1.34 144.69 114.24 5/12/1999 1.18 119.49 92.44 7/26/1999 1.14 118.06 93.66
11/23/1999 1.18 59.96 17.99 6/23/2000 1.26 140.28 119.18 7/4/2002 1.14 68.43 31.48 5/8/2003 1.18 81.41 48.62 8/3/2004 1.26 78.54 34.00 8/26/2004 1.30 70.84 26.74 4/22/2005 1.14 61.39 23.72 5/12/2005 1.18 73.01 30.75 8/11/2005 1.18 72.49 36.58 7/11/2006 1.14 63.98 27.03 6/21/2007 1.18 97.72 65.45 6/22/2007 1.26 148.16 114.10 7/18/2007 1.18 90.55 52.61 8/18/2007 1.14 76.90 47.29 8/20/2007 1.26 361.55 362.95 8/24/2007 1.18 300.72 320.46 10/2/2007 1.14 172.45 154.14
Average Flows (CFS) 116.20 85.7797879
Resulting Reduction 26.18 percent

Dry Run Creek Total Maximum Daily Load Appendix D --- Public Comments
Final TMDL - 54 - [August, 2011]
Appendix D --- Public Comments No public comments were received during the comment period.

Dry Run Creek Total Maximum Daily Load Appendix E --- Water Quality Data
Final TMDL - 1 - [August, 2011]
Appendix E --- Water Quality Data
2005 Site DRC 1 06/09/05 06/16/05 06/23/05 06/30/05 07/07/05 07/14/05 07/21/05 07/28/05 08/04/05 08/11/05 08/18/05 08/25/05 09/01/05
Ammonia N as N (mg/L) 0.025 0.025 0.025 0.025 0.025 0.025 0.025 0.025 0.025 0.025 0.025 0.025 0.025
E.coli (colonies/100mL) 960 530 5200 590 500 550 6300 140 380 34000 6600 340 130
Nitrate + Nitrite N (mg/L) 3.8 2.9 2.2 9.7 4.9 2.7 1.8 2.3 1.9 1.2 1 1.8 1.8
Total Kjeldahl N (mg/L) 0.3 0.15 0.16 0.49 0.16 0.05 0.54 0.21 0.1 0.62 0.9 0.1 0.2
Total Phosphate (mg/L) 0.03 <0.02 0.03 0.11 0.04 0.07 0.09 0.04 0.03 0.13 0.28 0.05 0.03
Temp oC 17.2 20.4 19.5 18.6 20.6 22.1 19.6 19.5 19.3 17
DO (mg/L) 5.45 6.6 5.6 6.5 7.8 4.8 7 9.2 6.6 7.8
pH 8 8 Chloride (ppm) (test strips)
Site DRC 2 06/09/05 06/16/05 06/23/05 06/30/05 07/07/05 07/14/05 07/21/05 07/28/05 08/04/05 08/11/05 08/18/05 08/25/05 09/01/05
Ammonia N as N (mg/L) 0.025 0.025 0.025 0.025 0.025 0.025 0.025 0.025 0.025 0.025 0.025 0.025
E.coli (colonies/100mL) 210 210 210 160 150 370 580 140 82 3000 1400 200
Nitrate + Nitrite N (mg/L) 1.3 0.9 0.95 2.3 1.3 1 1.2 1 1.1 0.087 0.8 0.92
Total Kjeldahl N (mg/L) 0.05 0.14 0.18 0.3 0.1 0.1 0.19 0.22 0.1 0.34 0.32 0.1
Total Phosphate (mg/L) 0.03 <0.02 0.03 0.06 0.03 0.06 0.05 0.03 0.03 0.09 0.12 0.04
Temp oC 16.6 20.7 17.8 18.1 19.2 20 17.6 18.3 19.5
DO (mg/L) 5.6 5 5.8 6.9 7.1 6.5 7.3 7.2 7.1
pH 7.8 7.8
Site DRC 3 06/09/05 06/16/05 06/23/05 06/30/05 07/07/05 07/14/05 07/21/05 07/28/05 08/04/05 08/11/05 08/18/05 08/25/05 09/01/05
Ammonia N as N (mg/L) 0.025 0.025 0.025 0.025 0.025 0.025 0.025 0.025 0.025 0.025 0.025 0.025 0.025
E.coli (colonies/100mL) 1100 200 500 520 540 730 10000 240 120 42000 11000 160 100
Nitrate + Nitrite N (mg/L) 4.8 4.1 3 11 6.5 3.8 2.1 3.2 2.5 1.3 1.2 2.5 2.6
Total Kjeldahl N (mg/L) 0.22 0.24 0.05 0.56 0.38 0.13 0.55 0.24 0.1 0.62 0.98 0.2 0.2
Total Phosphate (mg/L) 0.05 0.02 0.06 0.11 0.04 0.04 0.12 0.04 0.04 0.12 0.32 0.05 0.04
Temp oC 17.4 22.1 19.5 19.5 21.4 23.2 20 21 19.8 17.9
DO (mg/L) 5.55 5.5 6.5 6.5 7.3 5.6 7.5 9.3 7.8 7.9
pH 7.7 7.8
Chloride (ppm)
Site DRC 4 06/09/05 06/16/05 06/23/05 06/30/05 07/07/05 07/14/05 07/21/05 07/28/05 08/04/05 08/11/05 08/18/05 08/25/05 09/01/05
Ammonia N as N (mg/L) 0.025 0.025 0.025 0.025 0.025 0.025 0.025 0.025 0.025 0.025 0.025 0.025 0.025
E.coli (colonies/100mL) 370 160 240 300 350 410 910 200 110 3400 3100 240 100
Nitrate + Nitrite N (mg/L) 4.3 3.6 2.8 10 5.5 3.5 2.5 3.1 2.6 2.1 2.2 2.5 2.6
Total Kjeldahl N (mg/L) 0.12 0.34 0.05 0.24 0.1 0.1 0.25 0.12 0.1 0.33 0.1 0.1 0.2
Total Phosphate (mg/L) 0.02 0.01 0.04 0.12 0.05 0.06 0.06 0.05 0.03 0.07 0.08 0.06 0.03
Temp oC 16.8 20.5 18.4 18.1 20 20.4 20.2 23 20.6 16.3
DO (mg/L) 5.3 4.9 6.3 6 6.5 6 6.6 8.8 5.9 7.5
pH 8.1 7.3

Dry Run Creek Total Maximum Daily Load Appendix E --- Water Quality Data
Final TMDL - 2 - [August, 2011]
Chloride (ppm)
2005
Site DRC 5 06/09/05 06/16/05 06/23/05 06/30/05 07/07/05 07/14/05 07/21/05 07/28/05 08/04/05 08/11/05 08/18/05 08/25/05 09/01/05
Ammonia N as N (mg/L) 0.025 0.12 0.025 0.025 0.025 0.025 0.11 0.025 0.025 0.07 0.08 0.025 0.025
E.coli (colonies/100mL) 1400 570 4200 630 900 1200 13000 710 1900 21000 21000 110000 6900
Nitrate + Nitrite N (mg/L) 7.4 8.8 7.1 13 11 6.5 2 3.3 2 0.8 0.57 0.92 0.71
Total Kjeldahl N (mg/L) 0.45 0.61 0.9 0.74 0.4 0.22 0.89 0.48 0.34 0.75 1.3 0.4 0.5
Total Phosphate (mg/L) 0.02 0.03 0.05 0.17 0.05 0.09 0.22 0.07 0.03 0.13 0.44 0.1 0.06
Temp oC 17.4 23.3 20.7 19.4 23.1 24.3 18 19.1 22.2 19.4
DO (mg/L) 5.4 5.2 6.6 5.7 6.7 4.7 6.8 8.3 8.1 8.5
pH 8.1 7.5
Chloride (ppm)
Site DRC 6 06/09/05 06/16/05 06/23/05 06/30/05 07/07/05 07/14/05 07/21/05 07/28/05 08/04/05 08/11/05 08/18/05 08/25/05 09/01/05
Ammonia N as N (mg/L) 0.05 0.025 0.025 0.025 0.025 0.025 0.025 0.025 0.025 0.025 0.025 0.025 0.025
E.coli (colonies/100mL) 420 330 550 350 510 340 1100 570 210 5100 2600 660 1400
Nitrate + Nitrite N (mg/L) 9.4 8.5 4.9 16 14 10 4 6.5 3.6 0.84 0.96 0.25 0.15
Total Kjeldahl N (mg/L) 0.52 0.62 1 0.38 0.46 0.3 0.59 0.74 1.9 0.71 0.7 1.1 2.2
Total Phosphate (mg/L) 0.07 0.06 0.08 0.13 0.08 0.12 0.08 0.09 0.21 0.1 0.17 0.26 0.46
Temp oC 17.3 22.2 19.5 18.8 21.7 23.4 19.4 22.5 21.6 21.6 18.6
DO (mg/L) 5 4.3 6 5.7 5.6 3.5 6 6 3.4 6.6 5.5
pH 7.9 7.5
Chloride (ppm)
Site DRC 7 06/09/05 06/16/05 06/23/05 06/30/05 07/07/05 07/14/05 07/21/05 07/28/05 08/04/05 08/11/05 08/18/05 08/25/05 09/01/05
Ammonia N as N (mg/L) 0.025 0.08 0.025 0.025 0.025 0.025 0.025 0.025 0.025
E.coli (colonies/100mL) 130 160 310 130 60 30 400 210 2200
Nitrate + Nitrite N (mg/L) 13 13 13 14 14 14 11 11 5.2
Total Kjeldahl N (mg/L) 0.38 0.52 0.46 0.23 0.55 0.42 0.39 1.1 0.77
Total Phosphate (mg/L) 0.01 0.02 0.04 0.11 0.07 0.13 0.05 0.2 0.1
Temp oC 13.9 17.4 18.1 17.6 17.4 19.4 18.8
DO (mg/L) 6.23 5.5 5.6 6.4 5.8 4.9 6.9
pH 8.1 7.3
Chloride (ppm)
Site DRC 8 06/09/05 06/16/05 06/23/05 06/30/05 07/07/05 07/14/05 07/21/05 07/28/05 08/04/05 08/11/05 08/18/05 08/25/05 09/01/05
Ammonia N as N (mg/L) 0.025 0.025 0.025 0.025 0.025 0.025 0.05 0.025 0.025 0.025 0.025 0.025 0.025
E.coli (colonies/100mL) 970 440 8300 450 410 570 3900 2900 560 12000 8100 160 280
Nitrate + Nitrite N (mg/L) 9.6 10 8 14 13 7.3 1.9 3.4 2.2 0.65 0.47 1.2 1.1
Total Kjeldahl N (mg/L) 0.56 0.42 0.48 0.46 0.45 0.35 0.56 0.55 0.42 0.8 0.9 0.4 0.5
Total Phosphate (mg/L) 0.03 0.07 0.06 0.17 0.05 0.06 0.09 0.08 0.04 0.14 0.26 0.06 0.06
Temp oC 17 22.4 19.5 18.7 21.4 24.6 19.8 21.8 19.8 21.1 18.2
DO (mg/L) 5.2 5 6.4 6.7 6 5.1 5.7 6.7 4.5 6.4 6.7
pH 7.5 7.7
Chloride (ppm)

Dry Run Creek Total Maximum Daily Load Appendix E --- Water Quality Data
Final TMDL - 3 - [August, 2011]
2005 Site DRC 9 06/09/05 06/16/05 06/23/05 06/30/05 07/07/05 07/14/05 07/21/05 07/28/05 08/04/05 08/11/05 08/18/05 08/25/05 09/01/05
Ammonia N as N (mg/L) 0.025 0.025 0.025 0.025 0.025 0.025 0.05 0.025 0.025 0.025 0.05 0.09 0.025
E.coli (colonies/100mL) 340 450 2100 240 250 780 2500 230 600 2200 2700 260 730
Nitrate + Nitrite N (mg/L) 13 12 11 15 14 11 7.7 7.1 5.3 3.5 1.5 2.7 2.6
Total Kjeldahl N (mg/L) 0.25 0.19 0.09 0.32 0.1 0.24 0.43 0.35 0.42 0.4 1.2 0.4 0.2
Total Phosphate (mg/L) 0.01 0.07 0.09 0.1 0.04 0.07 0.07 0.05 0.07 0.12 0.5 0.07 0.08
Temp oC 14.7 18.6 17.8 16.5 18.6 20 18 20.8 21.1 19.2 15.8
DO (mg/L) 6.6 4.8 5.6 5.5 5.5 5.2 6.8 6.8 5.8 5.7 6.2
pH 7.7 7.1
Chloride (ppm)
Site DRC 10 06/09/05 06/16/05 06/23/05 06/30/05 07/07/05 07/14/05 07/21/05 07/28/05 08/04/05 08/11/05 08/18/05 08/25/05 09/01/05
Ammonia N as N (mg/L) 0.05 0.025 0.025 0.025 0.025 0.025 0.025 0.025 0.025 0.025 0.025 0.025 0.025
E.coli (colonies/100mL) 950 530 1200 490 580 520 3600 230 270 29000 6800 110 270
Nitrate + Nitrite N (mg/L) 13 13 11 16 16 11 1.5 5.6 2.2 0.59 0.51 0.63 0.16
Total Kjeldahl N (mg/L) 0.37 0.29 0.31 0.7 0.1 0.17 0.66 0.61 0.34 0.53 0.79 0.2 0.4
Total Phosphate (mg/L) 0.04 0.06 0.07 0.15 0.05 0.08 0.09 0.08 0.04 0.07 0.16 0.07 0.06
Temp oC 16.4 20.8 19.8 17.4 20.4 23.5 18.2 21.3 20.5 17
DO (mg/L) 6 5.2 6.7 6.5 5.6 4.2 6.2 5 7 5.5
pH 8 7.7
Chloride (ppm)

Dry Run Creek Total Maximum Daily Load Appendix E --- Water Quality Data
Final TMDL - 4 - [August, 2011]
2006
Site DRC 1 03/09/06 04/12/06 04/26/06 05/02/06 05/24/06 06/08/06 06/15/06 06/20/06 07/05/06 07/18/06 08/01/06
Ammonia N as N (mg/L) 0.025 0.025 0.025 0.025 0.025 0.025 0.025 0.050 0.025 0.025 0.025
E.coli (colonies/100mL) 220 73 82 270 220 360 880 6900 630 1400 710
Nitrate + Nitrite N (mg/L) 3.4 4.2 5.5 13.0 4.9 4.1 4.8 3.6 2.8 2.3 2.2
Total Kjeldahl N (mg/L) 0.8 0.4 0.2 0.6 0.1 0.1 0.3 0.6 0.1 0.1 0.2
Total Phosphate (mg/L) 0.10 0.03 0.02 0.10 0.03 0.03 0.04 0.10 0.04 0.06 0.03
Ortho-phosphate (mg/L) 0.01 0.01 0.06 0.01 0.02 0.02 0.03 0.03 0.02 0.01
TSS (mg/L) 5 5 17 5 6 6 58 6 5 4
TDS (mg/L) 330 310 340
Temp oC 6 15.7 13 12.3 21.9 20.1 18.2 18.5 16 17.8 19.8
DO (mg/L) 11.6 9.5 9.6 9.2 6.8 6.7 6.8 6.4 10.1 9.3 9.1
pH 7.9 8.2 8.4 8.4 8.2 8.3 8.2 8.2 8.3 8.3 8.4
Turbidity (NTU) 40 4.7 2.3 8.4 3.2 3 3.8 34.7 4 1.4 2
Transp. (mm) 190 >600 >600 >600 >600 >600 >600 >600
Chloride (ppm) 208 34 46 33 33 33 24 23 24
flow rate (CFS) 28 26
Site DRC 2 03/09/06 04/12/06 04/26/06 05/02/06 05/24/06 06/08/06 06/15/06 06/20/06 07/05/06 07/18/06 08/01/06
Ammonia N as N (mg/L) 0.025 0.025 0.025 0.025 0.025 0.025 0.025 0.120 0.025 0.025 0.025
E.coli (colonies/100mL) 280 40 240 60 300 480 260 4000 370 380 160
Nitrate + Nitrite N (mg/L) 3.0 1.0 1.3 3.4 1.4 1.5 1.3 1.1 1.3 1.4 1.4
Total Kjeldahl N (mg/L) 1.0 0.2 0.2 0.3 0.1 0.1 0.1 0.6 0.1 0.1 0.1
Total Phosphate (mg/L) 0.14 0.02 0.01 0.05 0.03 0.03 0.02 0.10 0.02 0.02 0.02
Ortho-phosphate (mg/L) 0.01 0.01 0.02 0.01 0.01 0.07 0.02 0.01 0.01 0.01
TSS (mg/L) 1 2 6 6 3 3 39 2 3 3
Temp oC 5 16.2 14.8 14.9 21.1 20.1 18.6 17.6 19.4 19.5 21.2
DO (mg/L) 10.9 8.8 7.9 8.1 6.1 6.3 6.1 5.8 6.6 6 6.1
pH 7.8 8.3 8.3 8.4 8.3 8.3 8.4 8.3 8.3 8.4 8.3
Turbidity (NTU) 35.8 1.3 0.8 5.8 3.5 1.9 1.4 19.3 2.4 2.5 3
Transp. (mm) 240 >600 >600 >600 >600 350 >600 >600 >600
Chloride (ppm) 135 27 33 33 33 33 27 29 27

Dry Run Creek Total Maximum Daily Load Appendix E --- Water Quality Data
Final TMDL - 5 - [August, 2011]
Site DRC 3 03/09/06 04/12/06 04/26/06 05/02/06 05/24/06 06/08/06 06/15/06 06/20/06 07/05/06 07/18/06 08/01/06
Ammonia N as N (mg/L) 0.025 0.025 0.025 0.025 0.025 0.025 0.025 0.250 0.025 0.025 0.025
E.coli (colonies/100mL) 380 150 50 290 170 450 1200 25000 450 820 1500
Nitrate + Nitrite N (mg/L) 3.6 5.1 6.8 14.0 6.0 5.2 5.9 3.0 3.6 2.9 2.8
Total Kjeldahl N (mg/L) 0.9 0.5 0.2 0.6 0.2 0.1 0.4 1.0 0.2 0.1 0.1
Total Phosphate (mg/L) 0.12 0.04 0.03 0.11 0.04 0.05 0.04 0.15 0.04 0.03 0.04
Ortho-phosphate (mg/L) 0.01 0.01 0.06 0.01 0.02 0.02 0.03 0.02 0.02 0.02
TSS (mg/L) 5 2 23 9 5 7 63 9 5 4
Temp oC 5.2 16.9 12.5 12.4 21.8 18.8 18.2 17.7 20 22.3 21.1
DO (mg/L) 11.4 8.4 9.6 7.5 6.5 6.8 6.8 5.7 7.3 6.3 6.5
pH 8 8.3 8.3 8.1 8.2 8.4 8.2 8.2 8.2 8.3 8.1
Turbidity (NTU) 55.2 4.3 1.7 21.9 5.4 3.3 7.7 55.7 5.2 5.5 3
Transp. (mm) 140 >600 >600 >600 >600 >600 120 >600 >600 >600
Chloride (ppm) 225 48 46 33 33 33 34 27 27
Site DRC 4 03/09/06 04/12/06 04/26/06 05/02/06 05/24/06 06/08/06 06/15/06 06/20/06 07/05/06 07/18/06 08/01/06
Ammonia N as N (mg/L) 0.060 0.100 0.025 0.025 0.025 0.025 0.025 0.120 0.025 0.025 0.025
E.coli (colonies/100mL) 460 290 20 210 220 50 490 4200 150 310 190
Nitrate + Nitrite N (mg/L) 4.8 4.6 5.4 12.0 4.4 4.0 3.9 2.6 3.0 2.7 2.5
Total Kjeldahl N (mg/L) 0.7 0.6 0.1 0.5 0.3 0.1 0.2 0.6 0.1 0.05 0.2
Total Phosphate (mg/L) 0.10 0.05 0.03 0.08 0.03 0.04 0.04 0.13 0.03 0.06 0.03
Ortho-phosphate (mg/L) 0.01 0.01 0.04 0.01 0.02 0.01 0.03 0.03 0.02 0.02
TSS (mg/L) 6 1 12 4 9 6 76 4 2 3
TDS (mg/L) 350 350 360
Temp oC 5.3 15.1 11.5 13.3 19.8 17.6 17.6 17.3 16 17.8 19.2
DO (mg/L) 10.6 8.5 8.9 8 5.7 6.7 6.1 6.6 9.2 8.5 7.9
pH 7.7 8.1 8.4 8.1 8 8.1 8.1 8.2 8.2 8 8
Turbidity (NTU) 28 2.8 1.2 11.9 2.7 4.5 3.3 118 3.8 3.8 2*
Transp. (mm) 200 >600 >600 >600 >600 >600 88 >600
Chloride (ppm) 112 27 39 39 33 33 <33 29* 33 30*
flow rate (CFS) 20 17

Dry Run Creek Total Maximum Daily Load Appendix E --- Water Quality Data
Final TMDL - 6 - [August, 2011]
Site DRC 5 03/09/06 04/12/06 04/26/06 05/02/06 05/24/06 06/08/06 06/15/06 06/20/06 07/05/06 07/18/06 08/01/06
Ammonia N as N (mg/L) 0.025 0.025 0.025 0.025 0.025 0.025 0.025 0.240 0.025 0.025 0.025
E.coli (colonies/100mL) 200 270 100 140 560 2200 2500 25000 3200 10000 7400
Nitrate + Nitrite N (mg/L) 3.2 7.2 14.0 18.0 14.0 14.0 15.0 4.8 9.2 5.4 5.6
Total Kjeldahl N (mg/L) 0.8 0.6 0.3 0.7 0.6 0.4 0.4 1.5 0.3 0.5 0.4
Total Phosphate (mg/L) 0.09 0.03 0.03 0.14 0.03 0.05 0.07 0.27 0.07 0.06 0.05
Ortho-phosphate (mg/L) 0.01 0.01 0.07 0.01 0.02 0.04 0.03 0.03 0.03 0.03
TSS (mg/L) 4 3 28 3 2 9 110 3 7 2
Temp oC 4.6 15.9 10 11.7 21.8 20.3 18.1 18.1 21.1 22.1 24.4
DO (mg/L) 11.8 10.3 10.5 6.7 5.9 6.2 6.1 6.3 6.5 5.4 5.1
pH 7.9 8.4 8.6 8.2 8.3 8.3 8.3 8.4 8.3 8.6 8.2
Turbidity (NTU) 24.3 5 3.6 22.1 3.4 2.3 6.5 66.1 4.9 9.2 3
Transp. (mm) 250 >600 >600 >600 >600 >600 140 >600 >600 >600
Chloride (ppm) 303 82 53 61 53 46 48 48 56
Site DRC 6 03/09/06 04/12/06 04/26/06 05/02/06 05/24/06 06/08/06 06/15/06 06/20/06 07/05/06 07/18/06 08/01/06
Ammonia N as N (mg/L) 0.080 0.840 0.025 0.025 0.025 0.025 0.025 0.025 0.025 0.025 0.025
E.coli (colonies/100mL) 1000 910 30 82 40 520 830 2800 180 82 150
Nitrate + Nitrite N (mg/L) 5.5 9.2 14.0 18.0 14.0 13.0 11.0 7.6 8.2 5.4 6.3
Total Kjeldahl N (mg/L) 1.2 1.9 0.6 0.9 0.4 0.6 0.5 0.9 0.4 0.5 0.5
Total Phosphate (mg/L) 0.15 0.16 0.04 0.08 0.05 0.10 0.08 0.12 0.06 0.06 0.07
Ortho-phosphate (mg/L) 0.07 0.01 0.05 0.01 0.03 0.03 0.02 0.04 0.04 0.04
TSS (mg/L) 13 11 10 12 36 19 44 7 6 6
TDS (mg/L) 410 390 400
Temp oC 5 13.8 10 12.3 20 20.6 18.2 18.9 19.5 23.3 24.2
DO (mg/L) 9.8 9.1 9 7.9 5.6 5.5 5.8 6.1 7.4 6.3 6.5
pH 7.7 8.1 8.4 8 8 8.1 8.2 8.1 8 8 7.7
Turbidity (NTU) 51.6 9.3 2.2 5.89 6.2 20.3 12.3 37.4 5.5 5.5 5*
Transp. (mm) 140 350 >600 >600 380 425 >600 >600
Chloride (ppm) (test strips) 81 41 39 46 39 39 35 35 31

Dry Run Creek Total Maximum Daily Load Appendix E --- Water Quality Data
Final TMDL - 7 - [August, 2011]
Site DRC 7 03/09/06 04/12/06 04/26/06 05/02/06 05/24/06 06/08/06 06/15/06 06/20/06 07/05/06 07/18/06 08/01/06
Ammonia N as N (mg/L) 0.025 0.025 0.025 0.025 0.025 0.025 0.025 0.025 0.025 0.025 0.025
E.coli (colonies/100mL) 10 5 5 50 10 10 5 270 280 45 120
Nitrate + Nitrite N (mg/L) 13.0 17.0 18.0 23.0 20.0 22.0 19.0 19.0 19.0 18 17
Total Kjeldahl N (mg/L) 0.2 0.2 0.2 0.6 0.2 0.1 0.2 0.2 0.1 0.1 0.2
Total Phosphate (mg/L) 0.04 0.01 0.02 0.11 0.02 0.03 0.02 0.02 0.04 0.03 0.04
Ortho-phosphate (mg/L) 0.01 0.01 0.09 0.01 0.01 0.01 0.02 0.01 0.01 0.01
TSS (mg/L) 3 2 1 1 14 1 5 1 1 10
Temp oC 4.5 9 9.1 13.4 14.8 15.5 15.3 15.4 16.6 18.4 18.5
DO (mg/L) 10.2 10.2 8.6 7.3 7.2 6.8 6.5 6.4 6.1 6.2 4.9
pH 7.5 8.1 8.2 7.6 7.9 7.5 7.9 7.7 7.7 7.1 7.5
Turbidity (NTU) 1.6 1.1 0.8 1.96 0.7 2.7 0.7 9.7 2 3.2 7
Transp. (mm) 600 600 600 600 600 600 600 600 600
Chloride (ppm) <31 27 33 33 33 33 33 27 27 <27
Site DRC 8 03/09/06 04/12/06 04/26/06 05/02/06 05/24/06 06/08/06 06/15/06 06/20/06 07/05/06 07/18/06 08/01/06
Ammonia N as N (mg/L) 0.025 0.025 0.025 0.025 0.025 0.025 0.025 0.025 0.025 0.025 0.025
E.coli (colonies/100mL) 40 5 55 55 100 520 780 11000 830 720 390
Nitrate + Nitrite N (mg/L) 3.4 9.4 15.0 19.0 16.0 16.0 17.0 5.4 9.8 7.6 5
Total Kjeldahl N (mg/L) 0.8 0.6 0.4 0.7 0.4 0.3 0.3 0.8 0.4 0.4 0.4
Total Phosphate (mg/L) 0.07 0.04 0.03 0.12 0.04 0.04 0.06 0.10 0.06 0.04 0.05
Ortho-phosphate (mg/L) 0.01 0.01 0.06 0.01 0.01 0.07 0.01 0.03 0.03 0.03
TSS (mg/L) 5 2 19 3 4 2 36 3 2 4
Temp oC 6.1 16.4 11.9 14 21.4 21.2 18 18.9 22.4 23.5 23.7
DO (mg/L) 11.1 9.2 10.5 7.8 6.8 6.7 6.8 5.8 7 6 5.4
pH 7.9 8.3 8.4 8 8.1 8.2 8.2 8.2 8.2 8.2 8.2
Turbidity (NTU) 11.2 5.8 2.1 18.2 2.6 2.2 2.7 39.1 3.3 4 3
Transp. (mm) >600 >600 >600 >600 >600 >600 >600 >600 >600
Chloride (ppm) 303 73 53 53 46 46 48 48 56
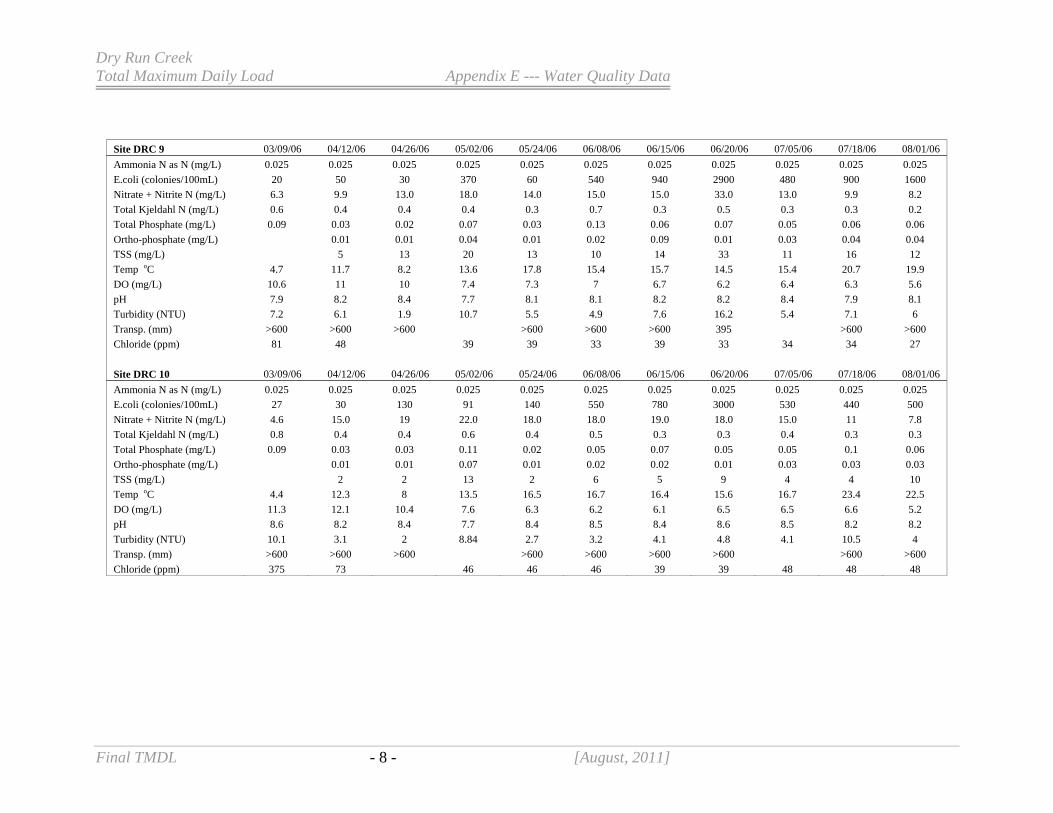
Dry Run Creek Total Maximum Daily Load Appendix E --- Water Quality Data
Final TMDL - 8 - [August, 2011]
Site DRC 9 03/09/06 04/12/06 04/26/06 05/02/06 05/24/06 06/08/06 06/15/06 06/20/06 07/05/06 07/18/06 08/01/06
Ammonia N as N (mg/L) 0.025 0.025 0.025 0.025 0.025 0.025 0.025 0.025 0.025 0.025 0.025
E.coli (colonies/100mL) 20 50 30 370 60 540 940 2900 480 900 1600
Nitrate + Nitrite N (mg/L) 6.3 9.9 13.0 18.0 14.0 15.0 15.0 33.0 13.0 9.9 8.2
Total Kjeldahl N (mg/L) 0.6 0.4 0.4 0.4 0.3 0.7 0.3 0.5 0.3 0.3 0.2
Total Phosphate (mg/L) 0.09 0.03 0.02 0.07 0.03 0.13 0.06 0.07 0.05 0.06 0.06
Ortho-phosphate (mg/L) 0.01 0.01 0.04 0.01 0.02 0.09 0.01 0.03 0.04 0.04
TSS (mg/L) 5 13 20 13 10 14 33 11 16 12
Temp oC 4.7 11.7 8.2 13.6 17.8 15.4 15.7 14.5 15.4 20.7 19.9
DO (mg/L) 10.6 11 10 7.4 7.3 7 6.7 6.2 6.4 6.3 5.6
pH 7.9 8.2 8.4 7.7 8.1 8.1 8.2 8.2 8.4 7.9 8.1
Turbidity (NTU) 7.2 6.1 1.9 10.7 5.5 4.9 7.6 16.2 5.4 7.1 6
Transp. (mm) >600 >600 >600 >600 >600 >600 395 >600 >600
Chloride (ppm) 81 48 39 39 33 39 33 34 34 27
Site DRC 10 03/09/06 04/12/06 04/26/06 05/02/06 05/24/06 06/08/06 06/15/06 06/20/06 07/05/06 07/18/06 08/01/06
Ammonia N as N (mg/L) 0.025 0.025 0.025 0.025 0.025 0.025 0.025 0.025 0.025 0.025 0.025
E.coli (colonies/100mL) 27 30 130 91 140 550 780 3000 530 440 500
Nitrate + Nitrite N (mg/L) 4.6 15.0 19 22.0 18.0 18.0 19.0 18.0 15.0 11 7.8
Total Kjeldahl N (mg/L) 0.8 0.4 0.4 0.6 0.4 0.5 0.3 0.3 0.4 0.3 0.3
Total Phosphate (mg/L) 0.09 0.03 0.03 0.11 0.02 0.05 0.07 0.05 0.05 0.1 0.06
Ortho-phosphate (mg/L) 0.01 0.01 0.07 0.01 0.02 0.02 0.01 0.03 0.03 0.03
TSS (mg/L) 2 2 13 2 6 5 9 4 4 10
Temp oC 4.4 12.3 8 13.5 16.5 16.7 16.4 15.6 16.7 23.4 22.5
DO (mg/L) 11.3 12.1 10.4 7.6 6.3 6.2 6.1 6.5 6.5 6.6 5.2
pH 8.6 8.2 8.4 7.7 8.4 8.5 8.4 8.6 8.5 8.2 8.2
Turbidity (NTU) 10.1 3.1 2 8.84 2.7 3.2 4.1 4.8 4.1 10.5 4
Transp. (mm) >600 >600 >600 >600 >600 >600 >600 >600 >600
Chloride (ppm) 375 73 46 46 46 39 39 48 48 48

Dry Run Creek Total Maximum Daily Load Appendix E --- Water Quality Data
Final TMDL - 9 - [August, 2011]
2007
Site DRC 1 1/11/2007 2/15/2007 3/6/2007 3/20/2007 4/3/2007 4/17/2007 5/1/2007 5/15/2007 5/30/2007 6/13/2007 6/27/2007
Ammonia N as N (mg/L) 0.025 0.025 0.025 0.025 0.025 0.025 0.025 0.025 0.025 0.025
E.coli (colonies/100mL) 130 50 5 310 2800 20 73 210 490 710
Nitrate + Nitrite N (mg/L) 12 8.8 7.5 8.9 6 7.3 7.9 5.5 5.6 5.1
Total Kjeldahl N (mg/L) 0.2 0.3 0.3 0.4 2.2 0.4 0.1 0.05 0.2 0.2
Total Phosphate (mg/L) 0.02 0.01 0.07 0.04 0.65 0.04 0.06 0.04 0.04 0.05
Ortho-phosphate (mg/L) 0.01 0.01 0.03 0.03 0.2 0.02 0.02 0.01 0.01 0.02
TSS (mg/L) 2 0.5 5 5 270 3 7 4 6 15
TDS (mg/L) 400 430 390 290 330 340 330 340 340
Temp oC 1.8 0.3 0.0 3.9 11.2 10.7 14.7 14.8 18.1 19.6
DO (mg/L) 16.3 14.3 15.7 12.0 11.2 12.8 10.5 9.7 9.3 9.4
pH 8.4 8.2 8.2 8.3 7.8 8 7.7 8 8 8
Turbidity (NTU) 2.4 230 1.7 2.9 1.1 2.1 5.8
Transp. (mm) 300 300 300
Chloride (ppm) 44 64 98 55 40 39 37 32 28 28
Chlorophyll A (µg/L) 0.5 3.4 3.1 10 10 3 3 0.5 0.5
Dissolved Inorganic Carbon (mg/L) 2 4 1.4 31 48 47 48 46
Dissolved Organic Carbon (mg/L) 52 47 44 5.6 1.7 1.1 0.8 0.9 0.7
flow rate (CFS) 1.1 2 1.5 36 14 11 40 39
Total Biochemical Oxygen Demand (5 day) 1 1 1 3 1 1 1 1 1
Total Organic Carbon (mg/L) 1.6 3 2.2 24 1.7 1.5 1.5 1.3 1.7
Total Volatile Suspended Solids (mg/L) 0.5 2 1 44 1 1 1 2 3
Site DRC 2 1/11/07 2/15/07 3/6/07 3/20/07 4/17/2007 4/3/2007 5/1/2007 5/15/2007 5/30/2007 6/13/2007 6/27/2007
Ammonia N as N (mg/L) 0.025 0.025 0.025 0.025 0.025 0.025 0.025 0.025 0.025 0.025
E.coli (colonies/100mL) 190 5 30 5 550 50 80 360 390 230
Nitrate + Nitrite N (mg/L) 5.2 3.7 4.5 1.1 2.2 1.5 1.2 1.4 1.4 1.5
Total Kjeldahl N (mg/L) 0.4 0.7 0.4 0.2 1.1
Total Phosphate (mg/L) 0.03 0.08 0.05 0.03 0.26 0.04 0.03 0.05 0.04
Ortho-phosphate (mg/L) 0.01 0.04 0.04 0.01 0.08 0.01 0.02 0.01 0.01 0.01
TSS (mg/L) 0.05 8 2 5 130 3 3 5 4 10
Temp oC 0.3 0.0 4.1 14.9 10.5 17.6 14.8 18.1 18.7 19.3
DO (mg/L) 17.5 14.8 12.8 13.7 11.6 10.1 9.9 7 8.8 9
pH 8.4 8.3 8.3 8.2 7.8 7.8 7.8 7.8 8 8
Turbidity (NTU) 1.9 7 4.6 3.2 138 2.6 2.1 3 3.4 5.7
Transp. (mm) 300 300 300 600 80 600 600 600 600 600
Chloride (ppm) 50 238 90

Dry Run Creek Total Maximum Daily Load Appendix E --- Water Quality Data
Final TMDL - 10 - [August, 2011]
Site DRC 3 1/11/2007 2/15/2007 3/6/2007 3/20/2007 4/17/2007 4/3/2007 5/1/2007 5/15/2007 5/30/2007 6/13/2007 6/27/2007
Ammonia N as N (mg/L) 0.025 0.025 0.025 0.025 0.025 0.025 0.025 0.025 0.025 0.025
E.coli (colonies/100mL) 73 20 10 10 3200 110 270 500 290 600
Nitrate + Nitrite N (mg/L) 12 7.8 9.2 9 6.5 9 7.2 7.8 7.4 6.7
Total Kjeldahl N (mg/L) 0.1 0.4 0.3 0.4 2.1 0.2 0.2 0.1 0.2 0.3
Total Phosphate (mg/L) 0.04 0.05 0.05 0.05 0.65 0.04 0.02 0.04 0.04 0.04
Ortho-phosphate (mg/L) 0.01 0.02 0.03 0.03 0.22 0.02 0.01 0.01 0.01 0.02
TSS (mg/L) 2 5 6 4 280 5 4 7 6 10
Temp oC 1.9 0.4 4.2 11.4 9.2 14.9 14.9 18 19.4 20.3
DO (mg/L) 16.3 15.6 12.4 13.1 11 10.4 10.2 9 7.3 9.5
pH 8.4 8.2 8.2 8 7.7 7.8 7.9 7.8 8 8
Turbidity (NTU) 2.4 4.8 5.5 5 291 4.9 4.1 4.9 5.3 9.9
Transp. (mm) 600 600 600 600 40 600 600 600 600 558
Chloride (ppm) 43 90 57
Site DRC 4 1/11/2007 2/15/2007 3/6/2007 3/20/2007 4/3/2007 4/17/2007 5/1/2007 5/15/2007 5/30/2007 6/13/2007 6/27/2007
Ammonia N as N (mg/L) 0.025 0.025 0.025 0.025 0.025 0.025 0.025 0.025 0.025 0.025 0.025
E.coli (colonies/100mL) 110 20 30 30 5800 30 27 73 210 430 630
Nitrate + Nitrite N (mg/L) 11 8.5 8 9.2 6.6 8.2 8.4 5.6 6.1 5.7 5.6
Total Kjeldahl N (mg/L) 0.2 0.2 0.3 0.3 2 0.4 0.2 0.05 0.1 0.1 0.3
Total Phosphate (mg/L) 0.03 0.02 0.05 0.04 0.56 0.06 0.04 0.04 0.04 0.05 0.05
Ortho-phosphate (mg/L) 0.01 0.01 0.03 0.03 0.13 0.04 0.03 0.04 0.01 0.01 0.03
TSS (mg/L) 4 0.5 5 9 320 5 6 5 7 7 11
TDS (mg/L) 360 400 370 250 340 340 340 340 350 350
Temp oC 2.3 0.2 0.8 3.4 9.1 10.5 13.4 14.9 17.1 17.4 18.6
DO (mg/L) 15.7 15.2 16.2 12.5 11.1 12.6 10.8 9.2 8 8.4 8.9
pH 8.2 8.4 8.0 8.2 7.6 7.9 7.6 7.6 7.8 7.6 7.8
Turbidity (NTU) 2.8 240 2.1 2.3 1.8 2.9 3.8 4.1
Transp. (mm) >600 >600 >600
Chloride (ppm) 37 47 71 38 24 36 36 33 32 32 32
Chlorophyll A (µg/L) 0.5 2.7 5 14 12 2 2 1 0.5 0.5
Dissolved Inorganic Carbon (mg/L) 2 4 12 39 45 47 47 48 47
Dissolved Organic Carbon (mg/L) 50 48 43 5.4 1.1 0.9 0.9 0.7 0.7 0.9
flow rate (CFS) 1 1.3 1.4 87 22 8 11 21 22 22
Total Biochemical Oxygen Demand (5 day) 1 1 1 2 1 1 1 1 1 1
Total Organic Carbon (mg/L) 1.5 2.2 1.9 19 2.1 1.4 1.4 1.6 1.3 1.4
Total Volatile Suspended Solids (mg/L) 0.5 1 2 44 2 0.5 1 1 2 2

Dry Run Creek Total Maximum Daily Load Appendix E --- Water Quality Data
Final TMDL - 11 - [August, 2011]
Site DRC 5 1/11/2007 2/15/2007 3/6/2007 3/20/2007 4/17/2007 4/3/2007 5/1/2007 5/15/2007 5/30/2007 6/13/2007 6/27/2007
Ammonia N as N (mg/L) 0.025 0.025 0.025 0.025 0.025 0.025 0.025 0.025 0.025 0.025 0.025
E.coli (colonies/100mL) 110 45 10 100 20 1400 55 360 260 530 870
Nitrate + Nitrite N (mg/L) 12 9.3 8 9.3 12 7.1 12 12 14 14 12
Total Kjeldahl N (mg/L) 0.2 0.2 0.4 0.4 0.4 2.2 0.3 0.3 0.2 0.4 0.4
Total Phosphate (mg/L) 0.04 0.02 0.06 0.08 0.03 0.72 0.04 0.02 0.03 0.07 0.05
Ortho-phosphate (mg/L) 0.01 0.01 0.03 0.03 0.01 0.26 0.02 0.01 0.02 0.01 0.02
TSS (mg/L) 3 0.5 5 7 2 400 4 3 3 3 11
Temp oC 1.8 0.6 0.2 4.3 10.4 9.3 14.7 14.7 17.2 18.6 20.3
DO (mg/L) 16.2 14.5 14.7 13.0 12.4 10.8 11.4 9.3 9 8.9 9
pH 8.2 8.4 8.0 8.0 8 7.7 7.8 8.1 7.9 8 8
Turbidity (NTU) 3.1 4 6.5 3.5 273 3.6 2.4 3 3.5 8.6
Transp. (mm) >600 >600 >600 600 50 600 600 600 600 508
Chloride (ppm) 43 65
Site DRC 6 1/11/2007 2/15/2007 3/6/2007 3/20/2007 4/3/2007 4/17/2007 5/1/2007 5/15/2007 5/30/2007 6/13/2007 6/27/2007
Ammonia N as N (mg/L) 0.025 0.025 0.025 0.08 0.025 0.4 0.025 0.025 0.025 0.025 0.025
E.coli (colonies/100mL) 110 5 10 10 11000 150 60 180 4100 870 950
Nitrate + Nitrite N (mg/L) 13 9.4 9 9.6 7.2 12 14 12 14 13 12
Total Kjeldahl N (mg/L) 0.3 0.2 0.3 0.4 1.7 1.2 0.2 0.3 0.3 0.3 0.5
Total Phosphate (mg/L) 0.04 0.04 0.07 0.05 0.61 0.18 0.09 0.06 0.07 0.11 0.08
Ortho-phosphate (mg/L) 0.02 0.02 0.04 0.03 0.17 0.11 0.04 0.03 0.02 0.02 0.03
TSS (mg/L) 14 1 4 8 300 12 9 9 19 28 35
TDS (mg/L) 360 410 360 280 350 350 360 360 380 380
Temp oC 2.9 0.9 0.9 3.3 8.8 8.7 12.2 13.8 16.2 16.4 18.8
DO (mg/L) 14.2 13.8 14.6 12.7 10.6 12.9 11 9.1 8.9 8.1 8.3
pH 8.2 8.4 7.8 8.0 7.6 7.7 7.6 7.8 7.6 7.5 7.8
Turbidity (NTU) 7.2 280 4.9 5.2 5.9 12 20 21
Transp. (mm) 540 >600 >600
Chloride (ppm) (test strips) 36 39 62 34 22 33 32 32 32 31 31
Chlorophyll A (µg/L) 1.1 2.8 3.9 6 39 3 2 3 2 2
Dissolved Inorganic Carbon (mg/L) 0.5 0.5 12 35 41 40 42 43 43
Dissolved Organic Carbon (mg/L) 50 48 43 4.7 2 1.6 1.5 1.7 1 1.6
flow rate (CFS) 1.1 1.6 1.1 31 6 2 1 3 3 3
Total Biochemical Oxygen Demand (5 day) 1 1 1 2 1 1 1 1 1 1
Total Organic Carbon (mg/L) 1.6 2 2 18 2.8 2.1 1.9 2.4 2.6 2.6
Total Volatile Suspended Solids (mg/L) 0.5 2 2 44 4 2 2 3 5 6
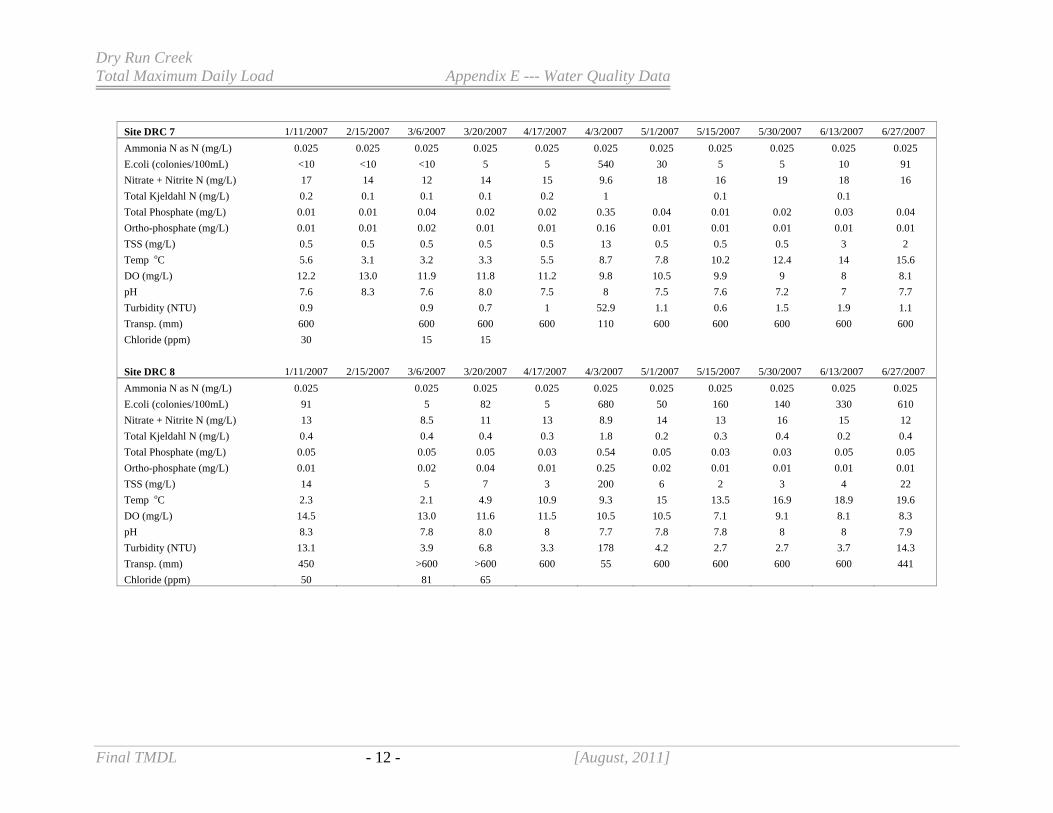
Dry Run Creek Total Maximum Daily Load Appendix E --- Water Quality Data
Final TMDL - 12 - [August, 2011]
Site DRC 7 1/11/2007 2/15/2007 3/6/2007 3/20/2007 4/17/2007 4/3/2007 5/1/2007 5/15/2007 5/30/2007 6/13/2007 6/27/2007
Ammonia N as N (mg/L) 0.025 0.025 0.025 0.025 0.025 0.025 0.025 0.025 0.025 0.025 0.025
E.coli (colonies/100mL) <10 <10 <10 5 5 540 30 5 5 10 91
Nitrate + Nitrite N (mg/L) 17 14 12 14 15 9.6 18 16 19 18 16
Total Kjeldahl N (mg/L) 0.2 0.1 0.1 0.1 0.2 1 0.1 0.1
Total Phosphate (mg/L) 0.01 0.01 0.04 0.02 0.02 0.35 0.04 0.01 0.02 0.03 0.04
Ortho-phosphate (mg/L) 0.01 0.01 0.02 0.01 0.01 0.16 0.01 0.01 0.01 0.01 0.01
TSS (mg/L) 0.5 0.5 0.5 0.5 0.5 13 0.5 0.5 0.5 3 2
Temp oC 5.6 3.1 3.2 3.3 5.5 8.7 7.8 10.2 12.4 14 15.6
DO (mg/L) 12.2 13.0 11.9 11.8 11.2 9.8 10.5 9.9 9 8 8.1
pH 7.6 8.3 7.6 8.0 7.5 8 7.5 7.6 7.2 7 7.7
Turbidity (NTU) 0.9 0.9 0.7 1 52.9 1.1 0.6 1.5 1.9 1.1
Transp. (mm) 600 600 600 600 110 600 600 600 600 600
Chloride (ppm) 30 15 15
Site DRC 8 1/11/2007 2/15/2007 3/6/2007 3/20/2007 4/17/2007 4/3/2007 5/1/2007 5/15/2007 5/30/2007 6/13/2007 6/27/2007
Ammonia N as N (mg/L) 0.025 0.025 0.025 0.025 0.025 0.025 0.025 0.025 0.025 0.025
E.coli (colonies/100mL) 91 5 82 5 680 50 160 140 330 610
Nitrate + Nitrite N (mg/L) 13 8.5 11 13 8.9 14 13 16 15 12
Total Kjeldahl N (mg/L) 0.4 0.4 0.4 0.3 1.8 0.2 0.3 0.4 0.2 0.4
Total Phosphate (mg/L) 0.05 0.05 0.05 0.03 0.54 0.05 0.03 0.03 0.05 0.05
Ortho-phosphate (mg/L) 0.01 0.02 0.04 0.01 0.25 0.02 0.01 0.01 0.01 0.01
TSS (mg/L) 14 5 7 3 200 6 2 3 4 22
Temp oC 2.3 2.1 4.9 10.9 9.3 15 13.5 16.9 18.9 19.6
DO (mg/L) 14.5 13.0 11.6 11.5 10.5 10.5 7.1 9.1 8.1 8.3
pH 8.3 7.8 8.0 8 7.7 7.8 7.8 8 8 7.9
Turbidity (NTU) 13.1 3.9 6.8 3.3 178 4.2 2.7 2.7 3.7 14.3
Transp. (mm) 450 >600 >600 600 55 600 600 600 600 441
Chloride (ppm) 50 81 65

Dry Run Creek Total Maximum Daily Load Appendix E --- Water Quality Data
Final TMDL - 13 - [August, 2011]
Site DRC 9 1/11/2007 2/15/2007 3/6/2007 3/20/2007 4/17/2007 4/3/2007 5/1/2007 5/15/2007 5/30/2007 6/13/2007 6/27/2007
Ammonia N as N (mg/L) 0.025 0.025 0.025 0.025 0.025 0.025 0.025 0.025 0.025 0.025 0.025
E.coli (colonies/100mL) 55 5 40 55 5 1400 20 90 210 270 530
Nitrate + Nitrite N (mg/L) 12 9.4 8.6 11 12 9 14 13 15 15 15
Total Kjeldahl N (mg/L) 0.2 0.2 0.2 0.2 0.4 1.6 0.1 0.2 0.2 0.2 0.4
Total Phosphate (mg/L) 0.04 0.01 0.05 0.04 0.03 0.53 0.04 0.03 0.02 0.05 0.04
Ortho-phosphate (mg/L) 0.02 0.02 0.03 0.03 0.25 0.02 0.02
TSS (mg/L) 8 1 4 8 7 150 14 5 5 7 14
Temp oC 2.9 0.1 1.4 2.5 6.9 8.3 10.3 11.7 14.6 15 16.8
DO (mg/L) 13.7 15.1 13.8 12.5 12.8 10.6 11.3 10.5 10.3 9.1 8.5
pH 7.8 8.0 7.6 8.1 7.6 8 7.8 7.6 7.6 7.7 7.7
Turbidity (NTU) 3 2.8 5.2 3.5 163 5.8 3.1 3.2 3.4 5.9
Transp. (mm) >600 >600 >600 600 60 600 600 600 600 600
Chloride (ppm) 43 43 36
Site DRC 10 1/11/2007 2/15/2007 3/6/2007 3/20/2007 4/3/2007 4/17/2007 5/1/2007 5/15/2007 5/30/2007 6/13/2007 6/27/2007
Ammonia N as N (mg/L) 0.08 0.025 0.06 0.025 0.025 0.025 0.025 0.025 0.025
E.coli (colonies/100mL) 250 45 370 3100 10 100 250 780 950
Nitrate + Nitrite N (mg/L) 15 11 14 7.2 17 15 17 17 17
Total Kjeldahl N (mg/L) 0.8 0.6 0.4 2.7 0.3 0.3 0.2 0.4 0.3
Total Phosphate (mg/L) 0.16 0.09 0.06 0.92 0.04 0.04 0.04 0.04
Ortho-phosphate (mg/L) 0.02 0.03 0.03 0.38 0.02 0.02 0.02 0.02
TSS (mg/L) 110 29 11 270 5 2 3 8 4
Temp oC 2.1 0.4 2.0 9 11.4 13 14.6 14.9 17.1
DO (mg/L) 13.9 14.5 13.3 10.6 11.4 10.1 10.3 9.5 10
pH 7.6 7.5 8.2 8 7.9 7.6 7.6 7.6 7.5
Turbidity (NTU) 79.2 10.3 7.4 402 5.3 1.9 2.7 4.9 3.5
Transp. (mm) 160 >600 >600 30 600 600 600 600 600
Chloride (ppm) 43 65 57

Dry Run Creek Total Maximum Daily Load Appendix E --- Water Quality Data
Final TMDL - 14 - [August, 2011]