Drug Security in Nigeria: Technology for supply chain ... · Drug Security in Nigeria Technology...
36
Drug Security in Nigeria Technology for Supply Chain Integrity November 2017
Transcript of Drug Security in Nigeria: Technology for supply chain ... · Drug Security in Nigeria Technology...
Drug Security in NigeriaTechnology for Supply Chain Integrity
November 2017
PwC 2
This publication has been prepared for general guidance on matters of interest only, and does not constitute professional advice. You should not act upon the information contained in this publication without obtaining specific professional advice. No representation or warranty (express or implied) is given as to the accuracy or completeness of the information contained in this publication, and, to the extent permitted by law, PricewaterhouseCoopers does not accept or assume any liability, responsibility or duty of care for the consequences of you or anyone else acting, or refraining to act, in reliance on the information contained in this publication or for any decision based on it.
Caveat
PwC
Contents
3
State of the Nigerian Economy
Health Landscape in Nigeria
Technology for Drug Security
What else can be done
1
2
3
4
PwC
State of the Nigerian Economy
4
PwC
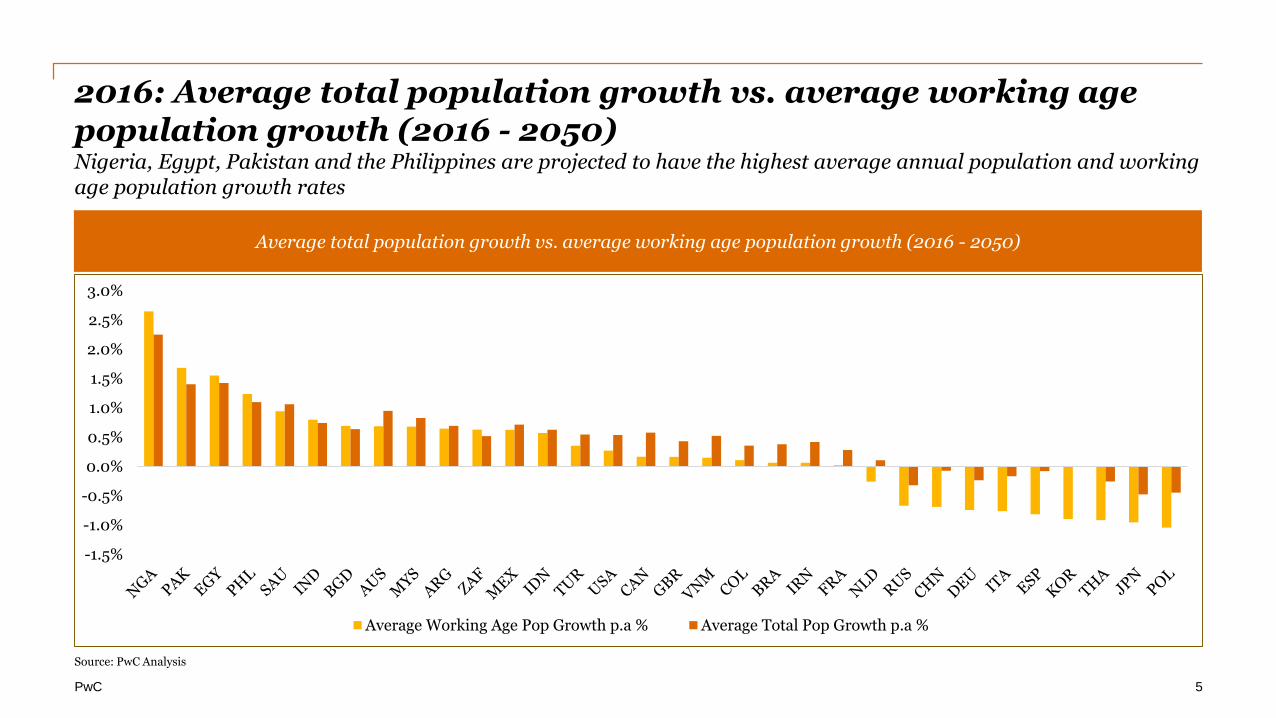
2016: Average total population growth vs. average working age population growth (2016 - 2050)Nigeria, Egypt, Pakistan and the Philippines are projected to have the highest average annual population and working age population growth rates
-1.5%
-1.0%
-0.5%
0.0%
0.5%
1.0%
1.5%
2.0%
2.5%
3.0%
Average Working Age Pop Growth p.a % Average Total Pop Growth p.a %
Source: PwC Analysis
Average total population growth vs. average working age population growth (2016 - 2050)
5
PwC
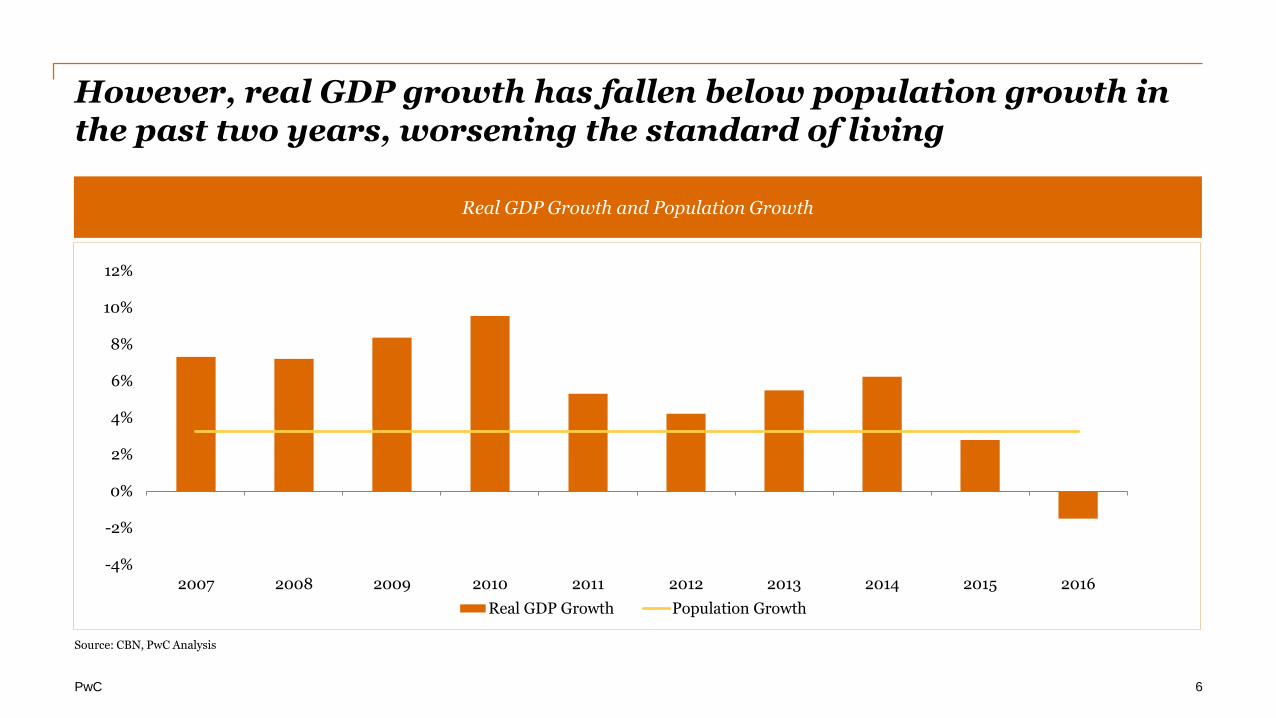
However, real GDP growth has fallen below population growth in the past two years, worsening the standard of living
Source: CBN, PwC Analysis
-4%
-2%
0%
2%
4%
6%
8%
10%
12%
2007 2008 2009 2010 2011 2012 2013 2014 2015 2016
Real GDP Growth Population Growth
Real GDP Growth and Population Growth
6

PwC
The Nigerian economy has turned a corner; recent macroeconomic trends strongly suggest a return to positive growth by YE2017
Q2’2017 Real GDP growth
0.55% y/y – best in six quarters
Inflation moderates to 15.9% y/y as at
September from a peak of 18.7% y/y in January 2017
Q3’2017 Purchasing Managers Index
average at54.3 points – best
since Q3’2014
NSEASI YtD35.3%* vs -6.2% in 2016
Reserves up by
40.6% in the past 12 months to USD33.3
billion
Source: CBN, NBS, NSE, PwC Analysis • NSEASI YtD is as at 23 October 2017• Reserves is as at 18 October 2017• YE – Year End 7
PwC
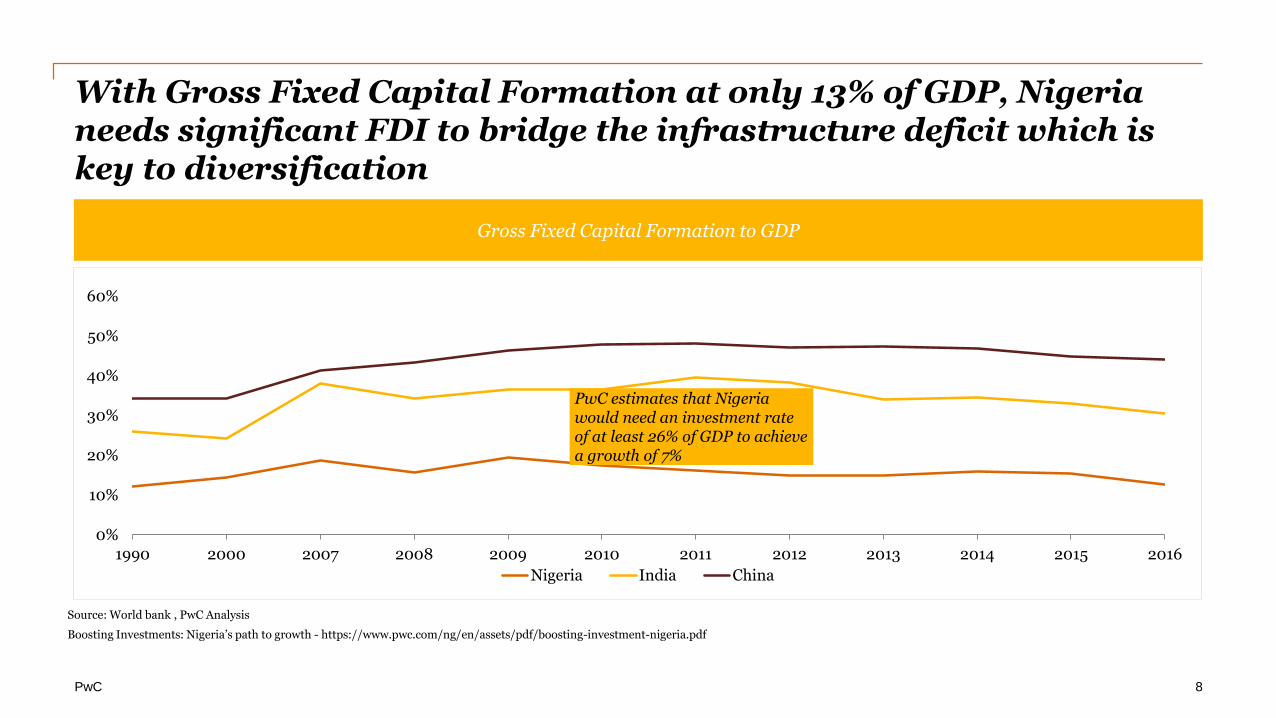
With Gross Fixed Capital Formation at only 13% of GDP, Nigeria needs significant FDI to bridge the infrastructure deficit which is key to diversification
Source: World bank , PwC Analysis
Boosting Investments: Nigeria’s path to growth - https://www.pwc.com/ng/en/assets/pdf/boosting-investment-nigeria.pdf
0%
10%
20%
30%
40%
50%
60%
1990 2000 2007 2008 2009 2010 2011 2012 2013 2014 2015 2016
Nigeria India China
PwC estimates that Nigeria would need an investment rate of at least 26% of GDP to achieve a growth of 7%
Gross Fixed Capital Formation to GDP
8
PwC
-
500
1,000
1,500
2,000
2,500
3,000
3,500
4,000
4,500
5,000
2013 Qrt. Avg. 2014 Qrt. Avg. 2015 Qrt. Avg. Q1'2016 Q2'2016 Q3'2016 Q4'2016 Q1'2017 Q2'2017
Foreign Portfolio Investment Foreign Direct Investment
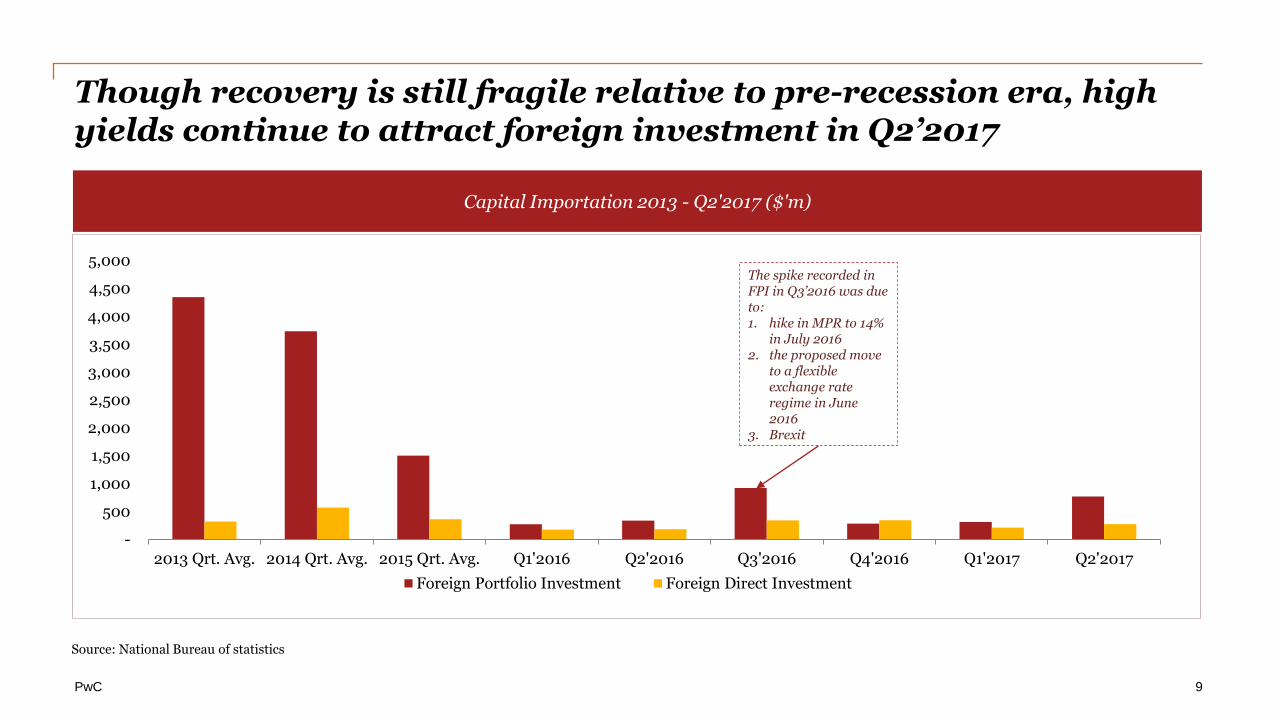
Though recovery is still fragile relative to pre-recession era, high yields continue to attract foreign investment in Q2’2017
Source: National Bureau of statistics
The spike recorded in FPI in Q3’2016 was due to: 1. hike in MPR to 14%
in July 2016 2. the proposed move
to a flexible exchange rate regime in June 2016
3. Brexit
Capital Importation 2013 - Q2'2017 ($'m)
9
PwC
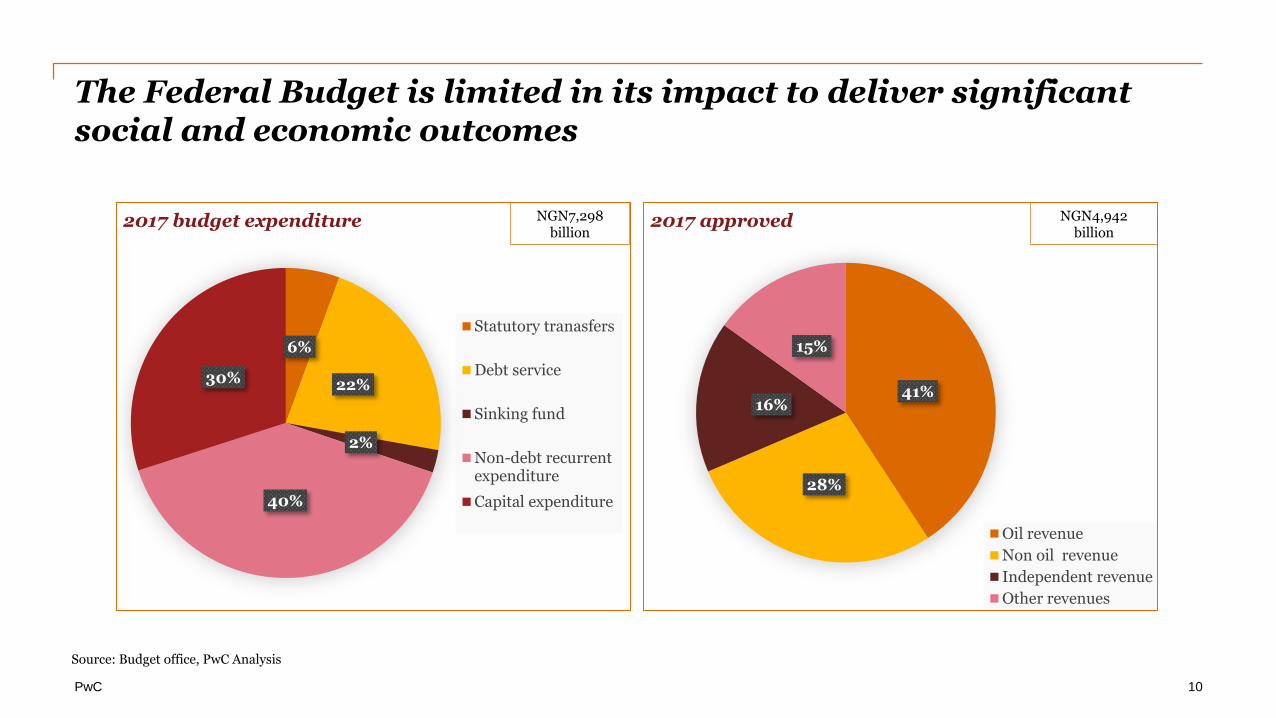
The Federal Budget is limited in its impact to deliver significant social and economic outcomes
41%
28%
16%
15%
2017 approved
Oil revenue
Non oil revenue
Independent revenue
Other revenues
NGN4,942 billion
6%
22%
2%
40%
30%
2017 budget expenditure
Statutory tranasfers
Debt service
Sinking fund
Non-debt recurrentexpenditure
Capital expenditure
NGN7,298 billion
Source: Budget office, PwC Analysis
10
PwC
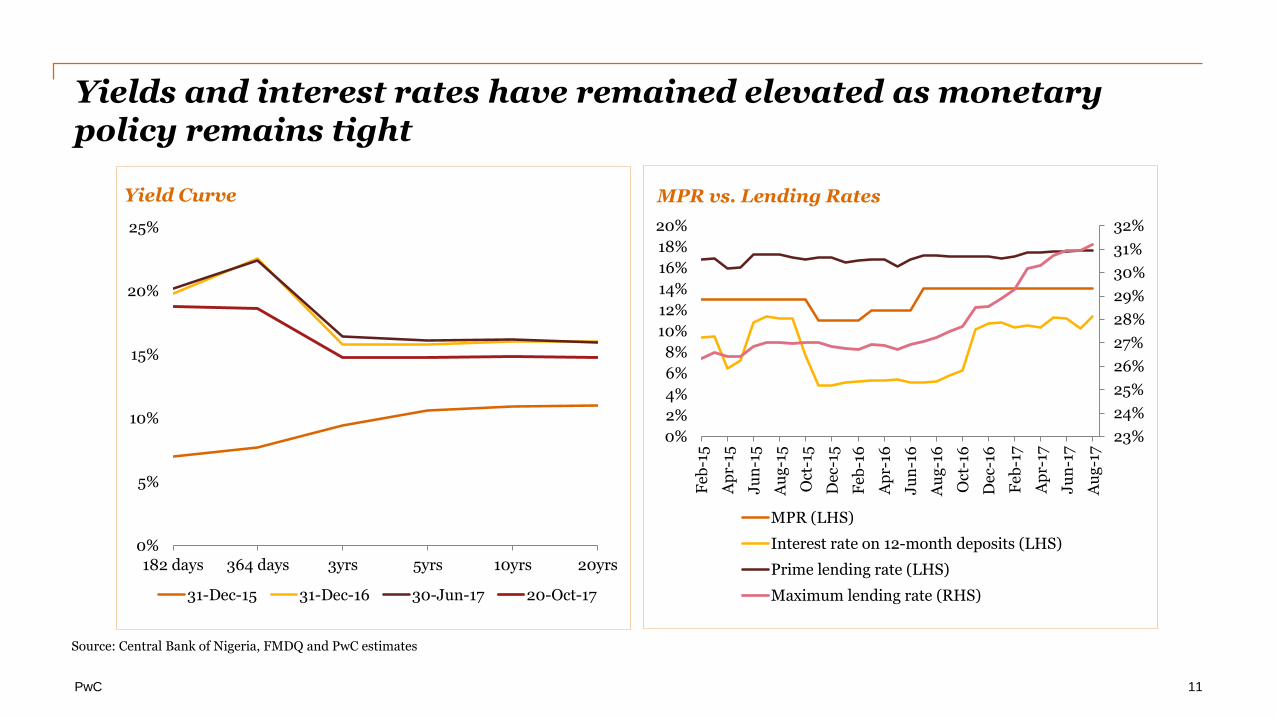
Yields and interest rates have remained elevated as monetary policy remains tight
Source: Central Bank of Nigeria, FMDQ and PwC estimates
23%
24%
25%
26%
27%
28%
29%
30%
31%
32%
0%
2%
4%
6%
8%
10%
12%
14%
16%
18%
20%
Feb
-15
Ap
r-15
Ju
n-1
5
Au
g-1
5
Oct
-15
Dec
-15
Feb
-16
Ap
r-16
Ju
n-1
6
Au
g-1
6
Oct
-16
Dec
-16
Feb
-17
Ap
r-17
Ju
n-1
7
Au
g-1
7
MPR vs. Lending Rates
MPR (LHS)
Interest rate on 12-month deposits (LHS)
Prime lending rate (LHS)
Maximum lending rate (RHS)
0%
5%
10%
15%
20%
25%
182 days 364 days 3yrs 5yrs 10yrs 20yrs
Yield Curve
31-Dec-15 31-Dec-16 30-Jun-17 20-Oct-17
11
PwC
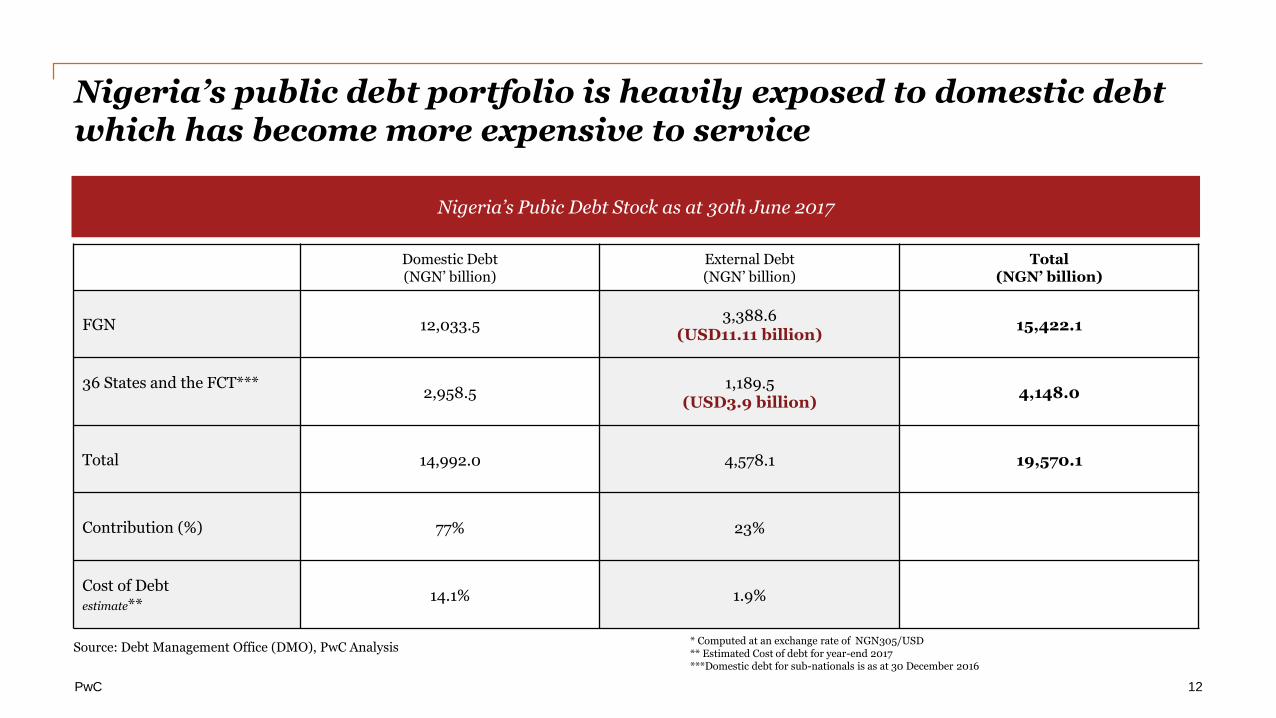
Nigeria’s public debt portfolio is heavily exposed to domestic debt which has become more expensive to service
Domestic Debt(NGN’ billion)
External Debt (NGN’ billion)
Total (NGN’ billion)
FGN 12,033.53,388.6
(USD11.11 billion)15,422.1
36 States and the FCT***2,958.5
1,189.5(USD3.9 billion)
4,148.0
Total 14,992.0 4,578.1 19,570.1
Contribution (%) 77% 23%
Cost of Debtestimate**
14.1% 1.9%
Source: Debt Management Office (DMO), PwC Analysis* Computed at an exchange rate of NGN305/USD** Estimated Cost of debt for year-end 2017***Domestic debt for sub-nationals is as at 30 December 2016
Nigeria’s Pubic Debt Stock as at 30th June 2017
12
PwC
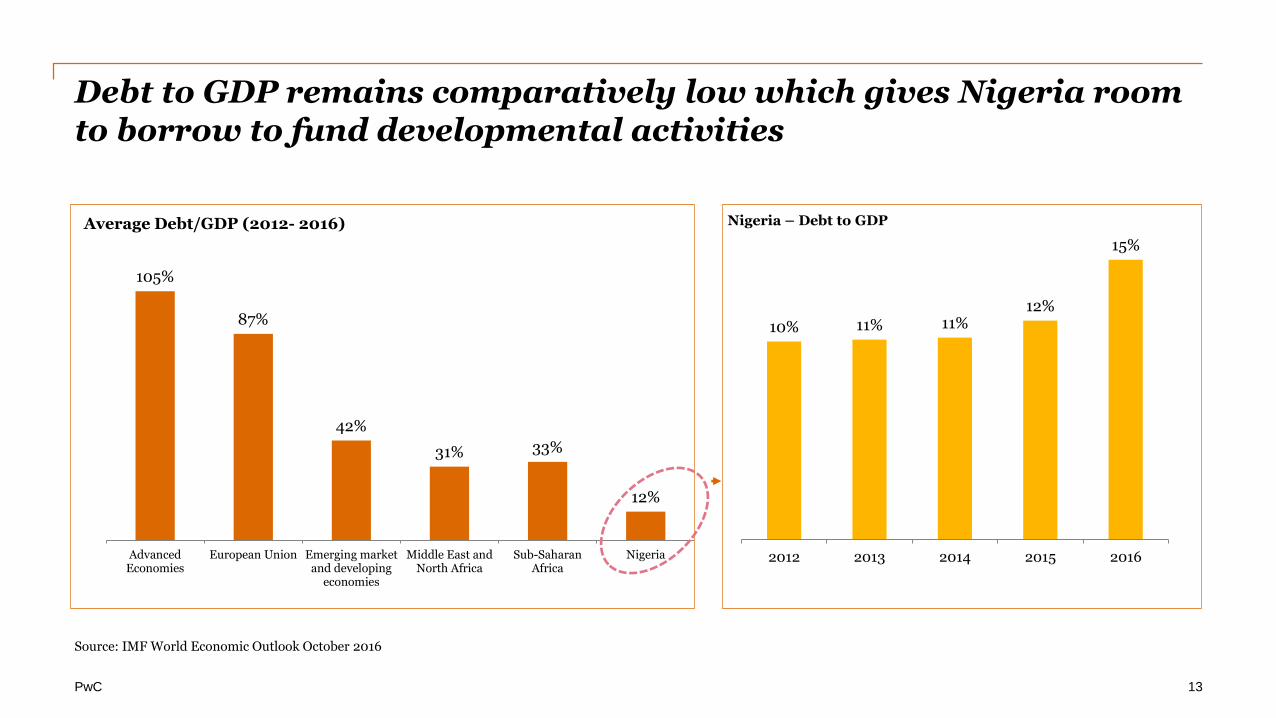
Debt to GDP remains comparatively low which gives Nigeria room to borrow to fund developmental activities
Source: IMF World Economic Outlook October 2016
105%
87%
42%
31% 33%
12%
AdvancedEconomies
European Union Emerging marketand developing
economies
Middle East andNorth Africa
Sub-SaharanAfrica
Nigeria
Average Debt/GDP (2012- 2016)
10% 11% 11%12%
15%
2012 2013 2014 2015 2016
Nigeria – Debt to GDP
13
PwC
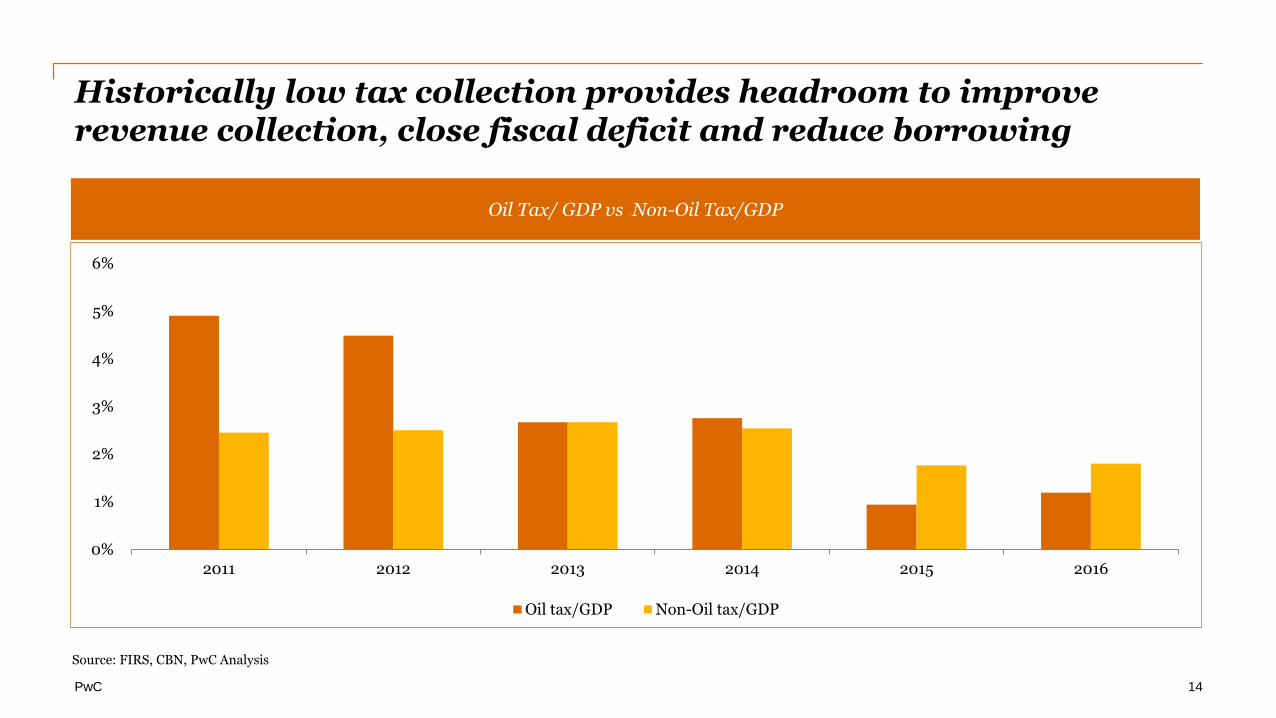
Historically low tax collection provides headroom to improve revenue collection, close fiscal deficit and reduce borrowing
Source: FIRS, CBN, PwC Analysis
0%
1%
2%
3%
4%
5%
6%
2011 2012 2013 2014 2015 2016
Oil tax/GDP Non-Oil tax/GDP
Oil Tax/ GDP vs Non-Oil Tax/GDP
14
PwC
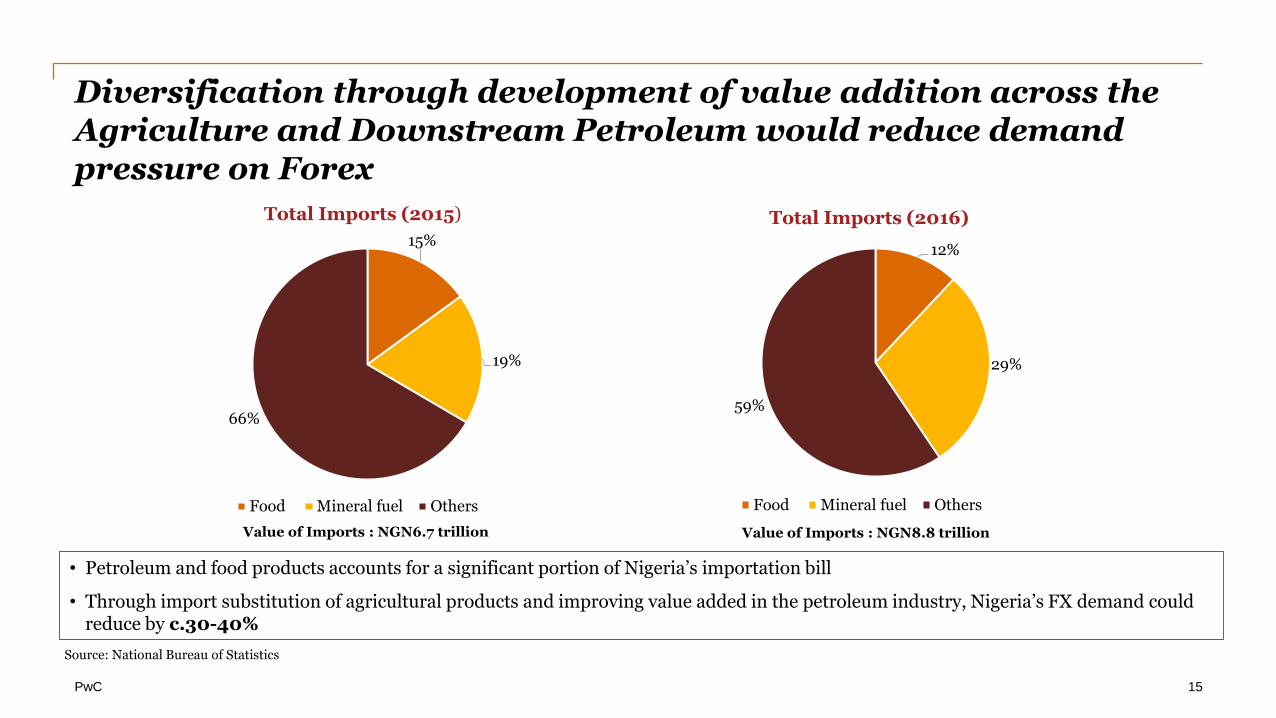
Diversification through development of value addition across the Agriculture and Downstream Petroleum would reduce demand pressure on Forex
• Petroleum and food products accounts for a significant portion of Nigeria’s importation bill
• Through import substitution of agricultural products and improving value added in the petroleum industry, Nigeria’s FX demand could reduce by c.30-40%
15%
19%
66%
Total Imports (2015)
Food Mineral fuel Others
12%
29%
59%
Total Imports (2016)
Food Mineral fuel Others
Value of Imports : NGN6.7 trillion Value of Imports : NGN8.8 trillion
Source: National Bureau of Statistics
15
PwC
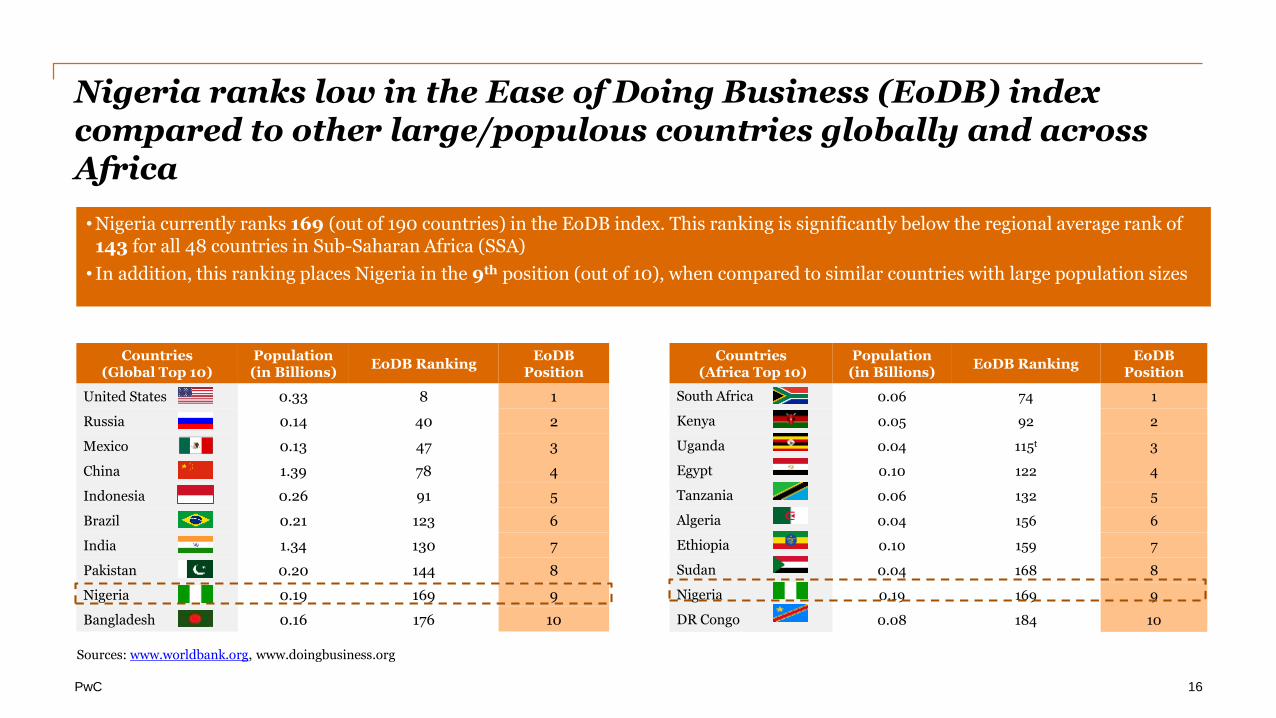
•Nigeria currently ranks 169 (out of 190 countries) in the EoDB index. This ranking is significantly below the regional average rank of 143 for all 48 countries in Sub-Saharan Africa (SSA)
• In addition, this ranking places Nigeria in the 9th position (out of 10), when compared to similar countries with large population sizes
Sources: www.worldbank.org, www.doingbusiness.org
Countries (Global Top 10)
Population (in Billions)
EoDB RankingEoDB
Position
United States 0.33 8 1
Russia 0.14 40 2
Mexico 0.13 47 3
China 1.39 78 4
Indonesia 0.26 91 5
Brazil 0.21 123 6
India 1.34 130 7
Pakistan 0.20 144 8
Nigeria 0.19 169 9
Bangladesh 0.16 176 10
Countries(Africa Top 10)
Population (in Billions)
EoDB RankingEoDB
Position
South Africa 0.06 74 1
Kenya 0.05 92 2
Uganda 0.04 115t 3
Egypt 0.10 122 4
Tanzania 0.06 132 5
Algeria 0.04 156 6
Ethiopia 0.10 159 7
Sudan 0.04 168 8
Nigeria 0.19 169 9
DR Congo 0.08 184 10
Nigeria ranks low in the Ease of Doing Business (EoDB) index compared to other large/populous countries globally and across Africa
16
PwC
Health Landscape in Nigeria
17
PwC
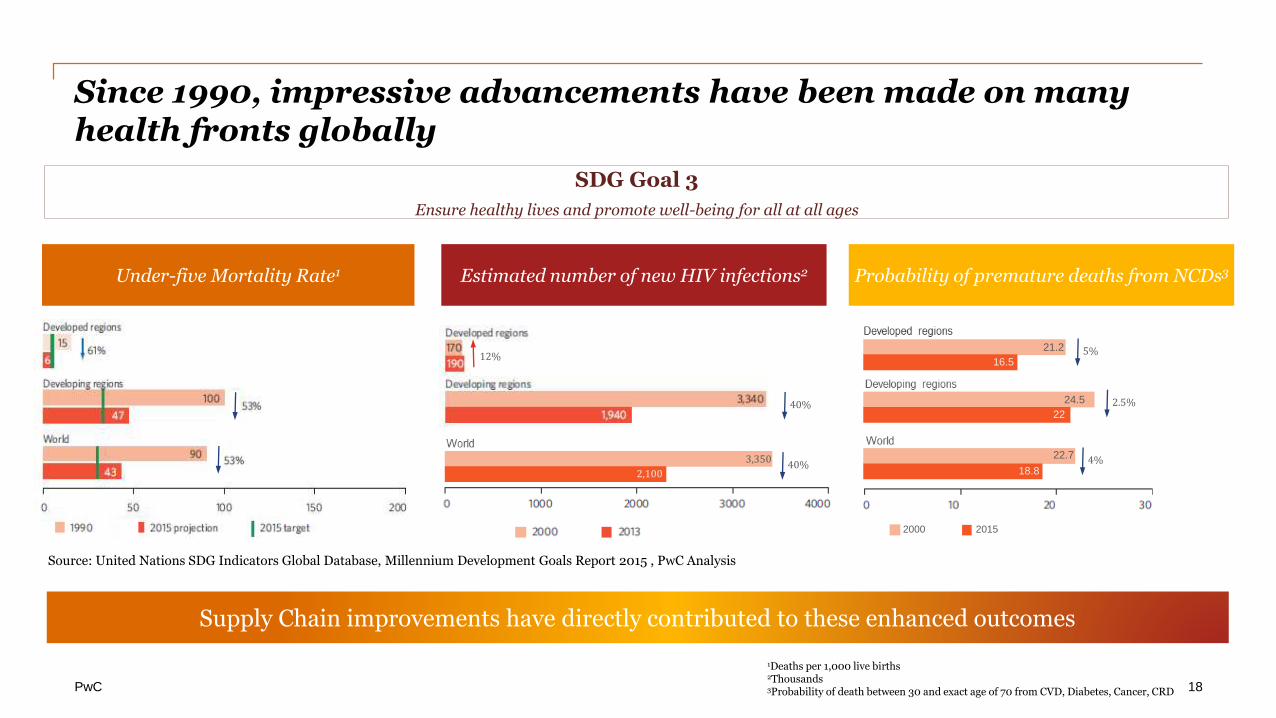
Since 1990, impressive advancements have been made on many health fronts globally
1Deaths per 1,000 live births2Thousands3Probability of death between 30 and exact age of 70 from CVD, Diabetes, Cancer, CRD
Source: United Nations SDG Indicators Global Database, Millennium Development Goals Report 2015 , PwC Analysis
SDG Goal 3
Ensure healthy lives and promote well-being for all at all ages
Supply Chain improvements have directly contributed to these enhanced outcomes
2015
Under-five Mortality Rate1 Estimated number of new HIV infections2
2,100
3,350
Probability of premature deaths from NCDs3
18.8
22.740%
40%22
24.5
16.5
21.2
2.5%
2000 2015
5%
4%
12%
18
PwC
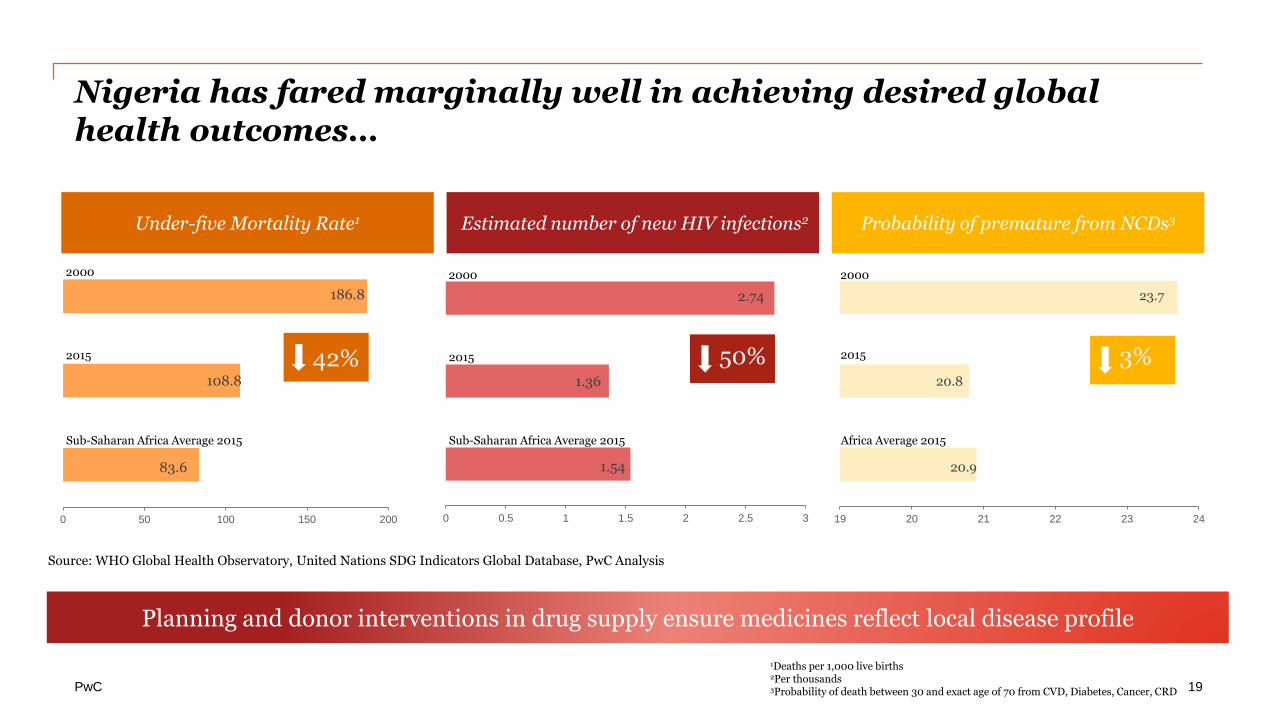
Nigeria has fared marginally well in achieving desired global health outcomes…
Under-five Mortality Rate1 Estimated number of new HIV infections2
83.6
108.8
186.8
0 50 100 150 200
Probability of premature from NCDs3
1.54
1.36
2.74
0 0.5 1 1.5 2 2.5 3
20.9
20.8
23.7
19 20 21 22 23 24
2000
2015
Sub-Saharan Africa Average 2015
2000
2015
Sub-Saharan Africa Average 2015
2000
2015
Africa Average 2015
42% 50% 3%
1Deaths per 1,000 live births2Per thousands3Probability of death between 30 and exact age of 70 from CVD, Diabetes, Cancer, CRD
Planning and donor interventions in drug supply ensure medicines reflect local disease profile
Source: WHO Global Health Observatory, United Nations SDG Indicators Global Database, PwC Analysis
19
PwC
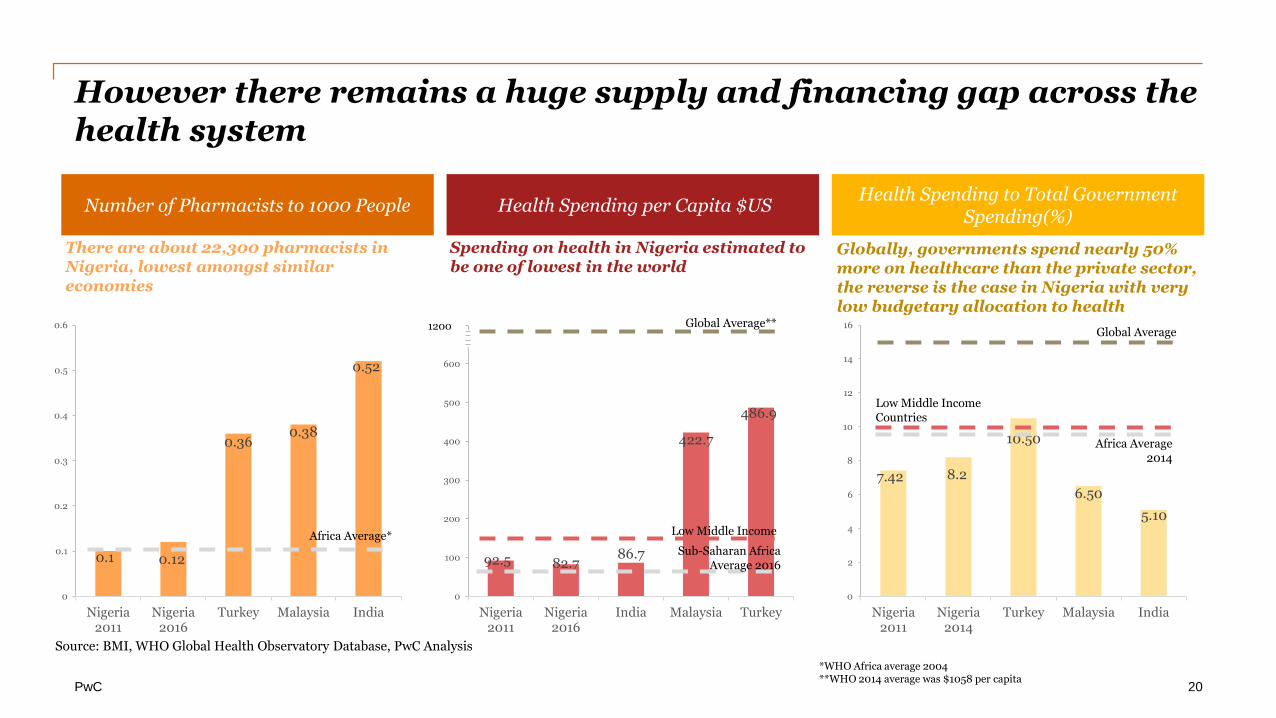
However there remains a huge supply and financing gap across the health system
Number of Pharmacists to 1000 People Health Spending per Capita $US
0.1 0.12
0.360.38
0.52
0
0.1
0.2
0.3
0.4
0.5
0.6
Nigeria2011
Nigeria2016
Turkey Malaysia India
Health Spending to Total Government Spending(%)
Africa Average*
There are about 22,300 pharmacists in Nigeria, lowest amongst similar economies
92.5 82.786.7
422.7
486.9
0
100
200
300
400
500
600
700
Nigeria2011
Nigeria2016
India Malaysia Turkey
Spending on health in Nigeria estimated to be one of lowest in the world
7.42 8.2
10.50
6.50
5.10
0
2
4
6
8
10
12
14
16
Nigeria2011
Nigeria2014
Turkey Malaysia India
Sub-Saharan Africa Average 2016
Global Average**
Low Middle Income
1200
*WHO Africa average 2004**WHO 2014 average was $1058 per capita
Source: BMI, WHO Global Health Observatory Database, PwC Analysis
Global Average
Africa Average 2014
Low Middle Income Countries
Globally, governments spend nearly 50% more on healthcare than the private sector, the reverse is the case in Nigeria with very low budgetary allocation to health
20
PwC
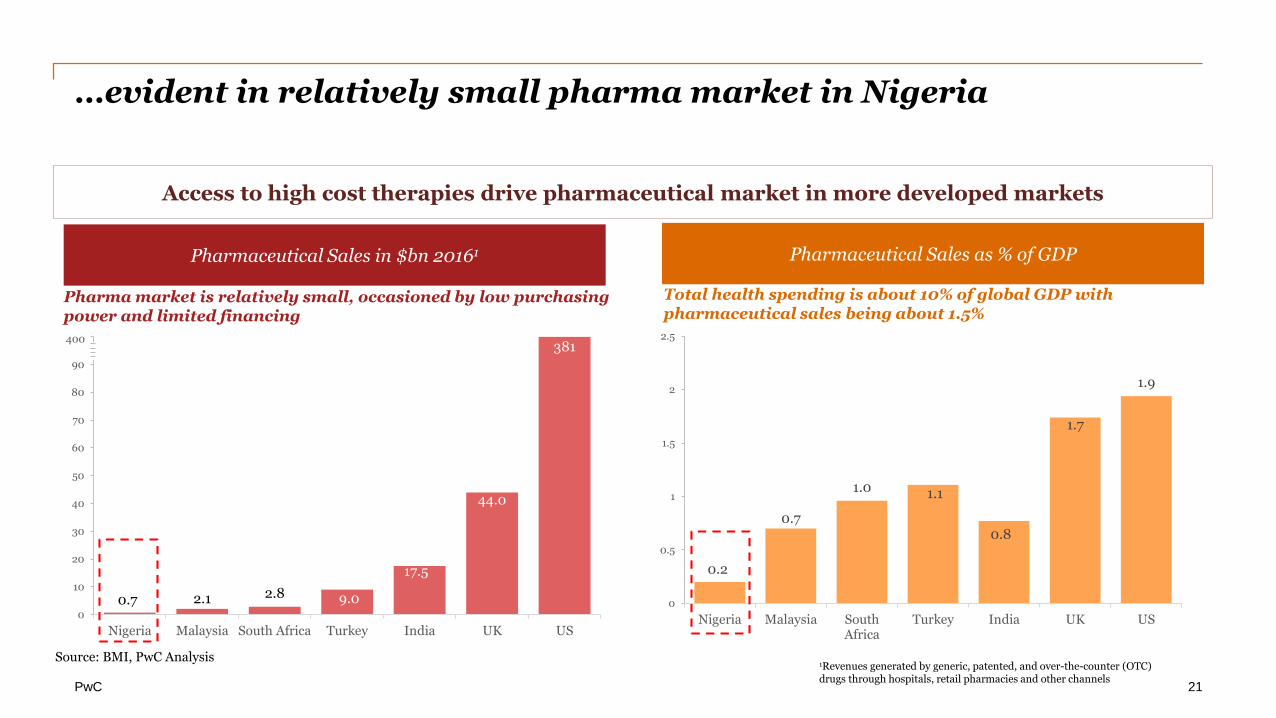
…evident in relatively small pharma market in Nigeria
Pharmaceutical Sales in $bn 20161
0.7 2.1 2.8 9.0
17.5
44.0
381
0
10
20
30
40
50
60
70
80
90
100
Nigeria Malaysia South Africa Turkey India UK US
400
Total health spending is about 10% of global GDP with pharmaceutical sales being about 1.5%
Access to high cost therapies drive pharmaceutical market in more developed markets
Pharma market is relatively small, occasioned by low purchasing power and limited financing
Pharmaceutical Sales as % of GDP
0.2
0.7
1.0 1.1
0.8
1.7
1.9
0
0.5
1
1.5
2
2.5
Nigeria Malaysia SouthAfrica
Turkey India UK US
1Revenues generated by generic, patented, and over-the-counter (OTC) drugs through hospitals, retail pharmacies and other channels
Source: BMI, PwC Analysis
21
PwC
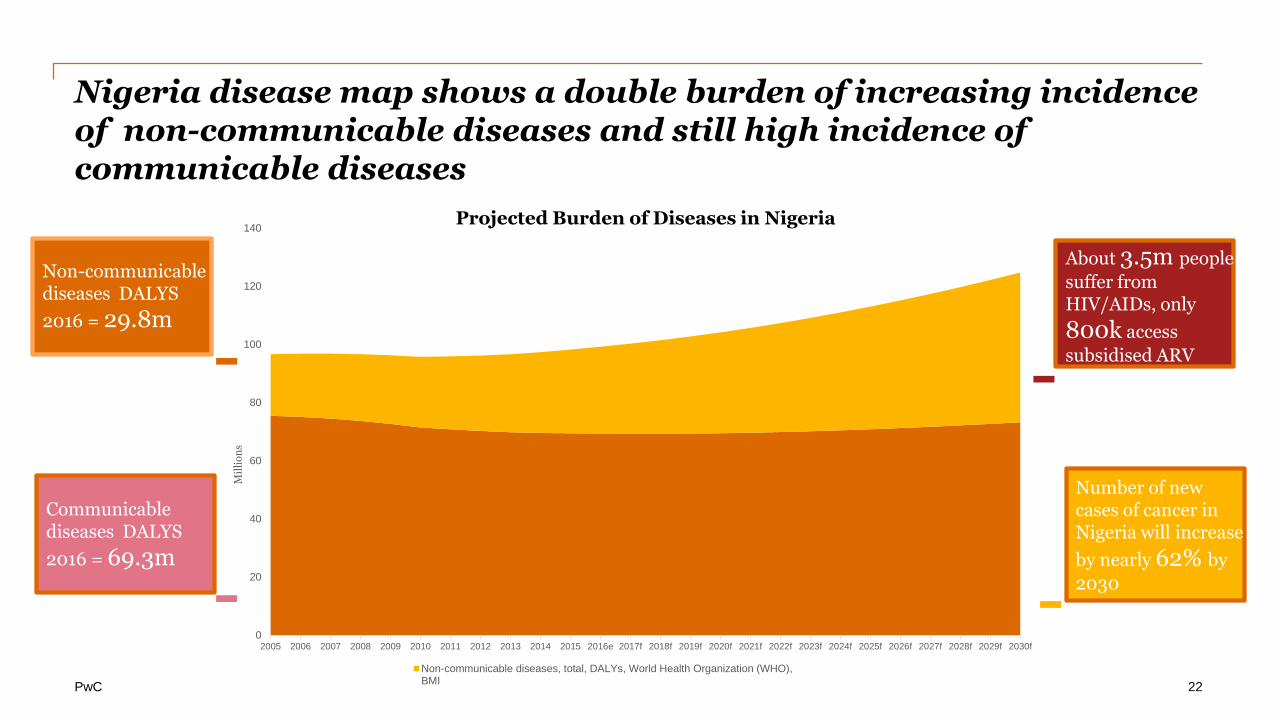
Nigeria disease map shows a double burden of increasing incidence of non-communicable diseases and still high incidence of communicable diseases
Projected Burden of Diseases in Nigeria
Number of new cases of cancer in Nigeria will increase
by nearly 62% by
2030
Non-communicable diseases DALYS
2016 = 29.8m
About 3.5m people
suffer from HIV/AIDs, only
800k access
subsidised ARV
Co
mm
un
ica
ble
Dis
ease
s
0
20
40
60
80
100
120
140
2005 2006 2007 2008 2009 2010 2011 2012 2013 2014 2015 2016e 2017f 2018f 2019f 2020f 2021f 2022f 2023f 2024f 2025f 2026f 2027f 2028f 2029f 2030f
Mil
lio
ns
Non-communicable diseases, total, DALYs, World Health Organization (WHO),BMI
Communicable diseases DALYS
2016 = 69.3m
22
PwC
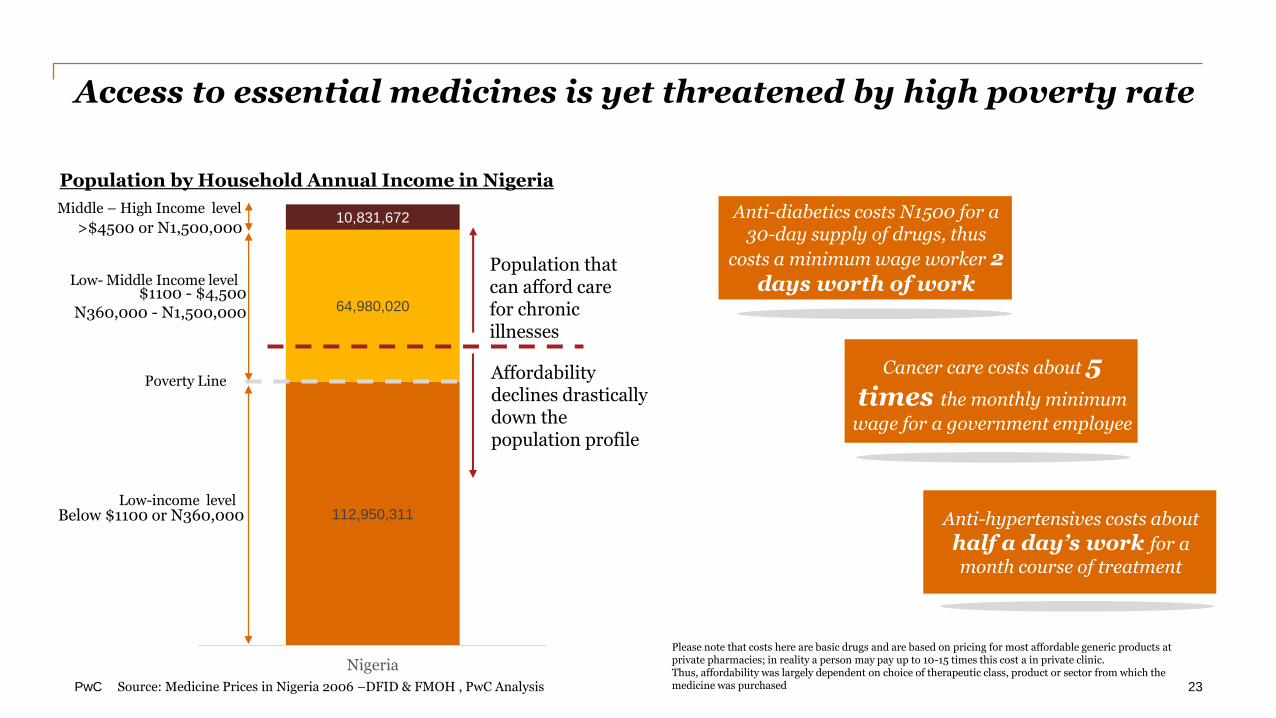
Access to essential medicines is yet threatened by high poverty rate
Population by Household Annual Income in Nigeria
112,950,311
64,980,020
10,831,672
Nigeria
Middle – High Income level
Low- Middle Income level
Low-income level
>$4500 or N1,500,000
$1100 - $4,500N360,000 - N1,500,000
Below $1100 or N360,000
Please note that costs here are basic drugs and are based on pricing for most affordable generic products at private pharmacies; in reality a person may pay up to 10-15 times this cost a in private clinic. Thus, affordability was largely dependent on choice of therapeutic class, product or sector from which the medicine was purchased
Cancer care costs about 5 times the monthly minimum
wage for a government employee
Anti-hypertensives costs about
half a day’s work for a
month course of treatment
Anti-diabetics costs N1500 for a 30-day supply of drugs, thus
costs a minimum wage worker 2 days worth of work
Population that can afford care for chronic illnesses
Affordability declines drastically down the population profile
Poverty Line
Source: Medicine Prices in Nigeria 2006 –DFID & FMOH , PwC Analysis 23

PwC
Technology for Drug Security
24
PwC
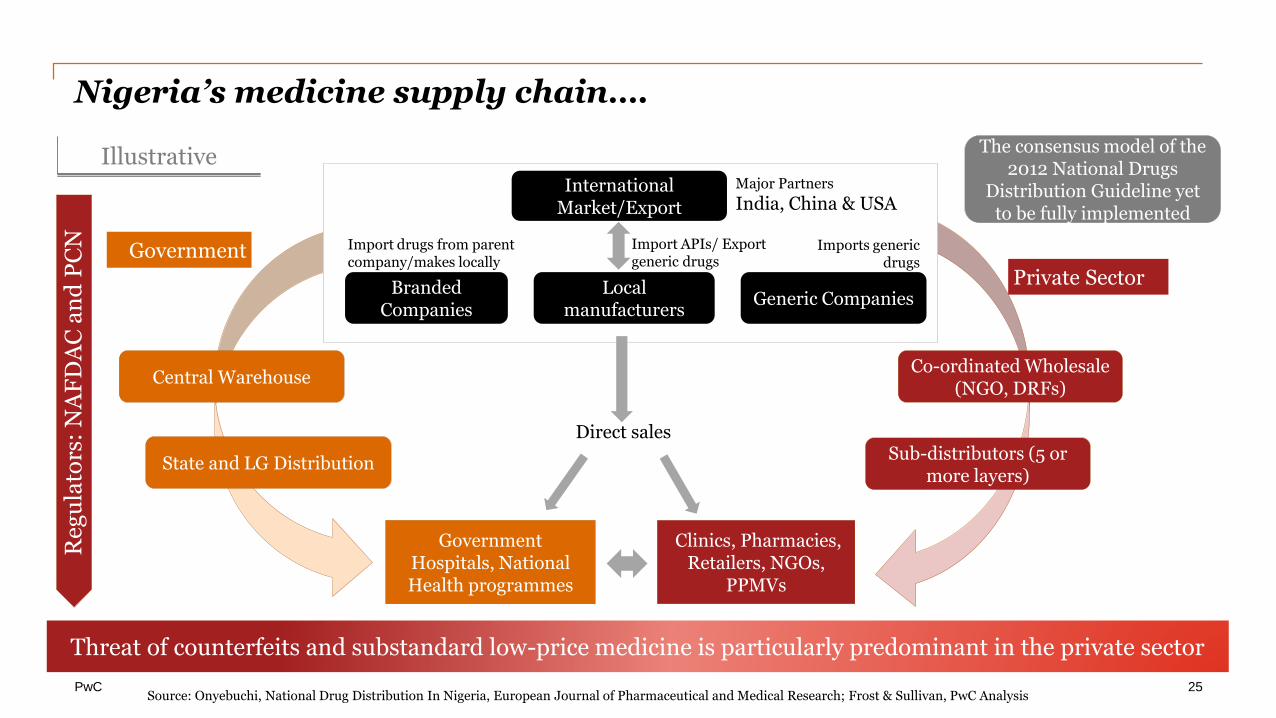
Nigeria’s medicine supply chain….
Local manufacturers
Branded Companies
Generic Companies
Government Hospitals, National Health programmes
Co-ordinated Wholesale (NGO, DRFs)
State and LG Distribution
Clinics, Pharmacies, Retailers, NGOs,
PPMVs
International Market/Export
Central Warehouse
Direct sales
Major Partners
India, China & USA
Government
Private Sector
Import APIs/ Export generic drugs
Imports generic drugs
Threat of counterfeits and substandard low-price medicine is particularly predominant in the private sector
Sub-distributors (5 or more layers)
Illustrative
Reg
ula
tors
: N
AF
DA
C a
nd
PC
N
Source: Onyebuchi, National Drug Distribution In Nigeria, European Journal of Pharmaceutical and Medical Research; Frost & Sullivan, PwC Analysis
The consensus model of the 2012 National Drugs
Distribution Guideline yet to be fully implemented
Import drugs from parent company/makes locally
25
PwC
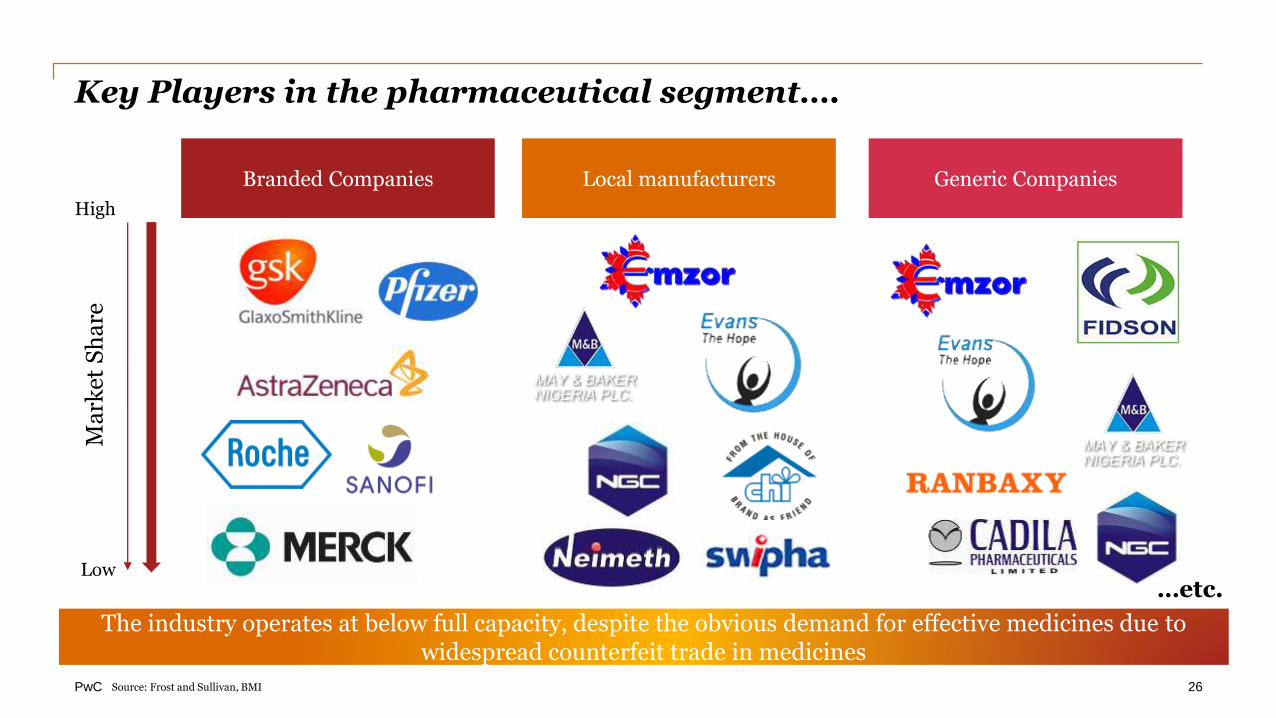
Key Players in the pharmaceutical segment….
Local manufacturersBranded Companies Generic Companies
Ma
rket
Sh
are
High
Low…etc.
The industry operates at below full capacity, despite the obvious demand for effective medicines due to widespread counterfeit trade in medicines
Source: Frost and Sullivan, BMI 26
PwC
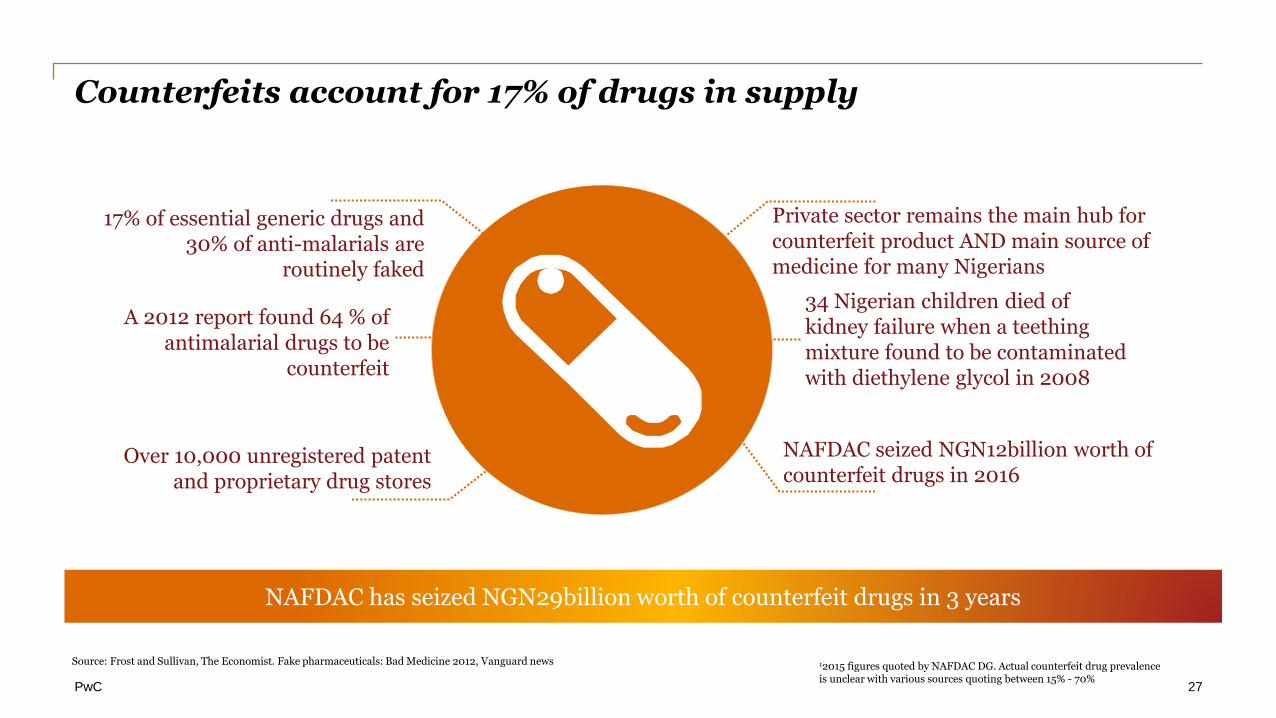
Counterfeits account for 17% of drugs in supply
17% of essential generic drugs and 30% of anti-malarials are
routinely faked
Private sector remains the main hub for counterfeit product AND main source of medicine for many Nigerians
NAFDAC seized NGN12billion worth of counterfeit drugs in 2016
NAFDAC has seized NGN29billion worth of counterfeit drugs in 3 years
Source: Frost and Sullivan, The Economist. Fake pharmaceuticals: Bad Medicine 2012, Vanguard news
A 2012 report found 64 % of antimalarial drugs to be
counterfeit
Over 10,000 unregistered patent and proprietary drug stores
34 Nigerian children died of kidney failure when a teething mixture found to be contaminated with diethylene glycol in 2008
27
12015 figures quoted by NAFDAC DG. Actual counterfeit drug prevalence is unclear with various sources quoting between 15% - 70%
PwC
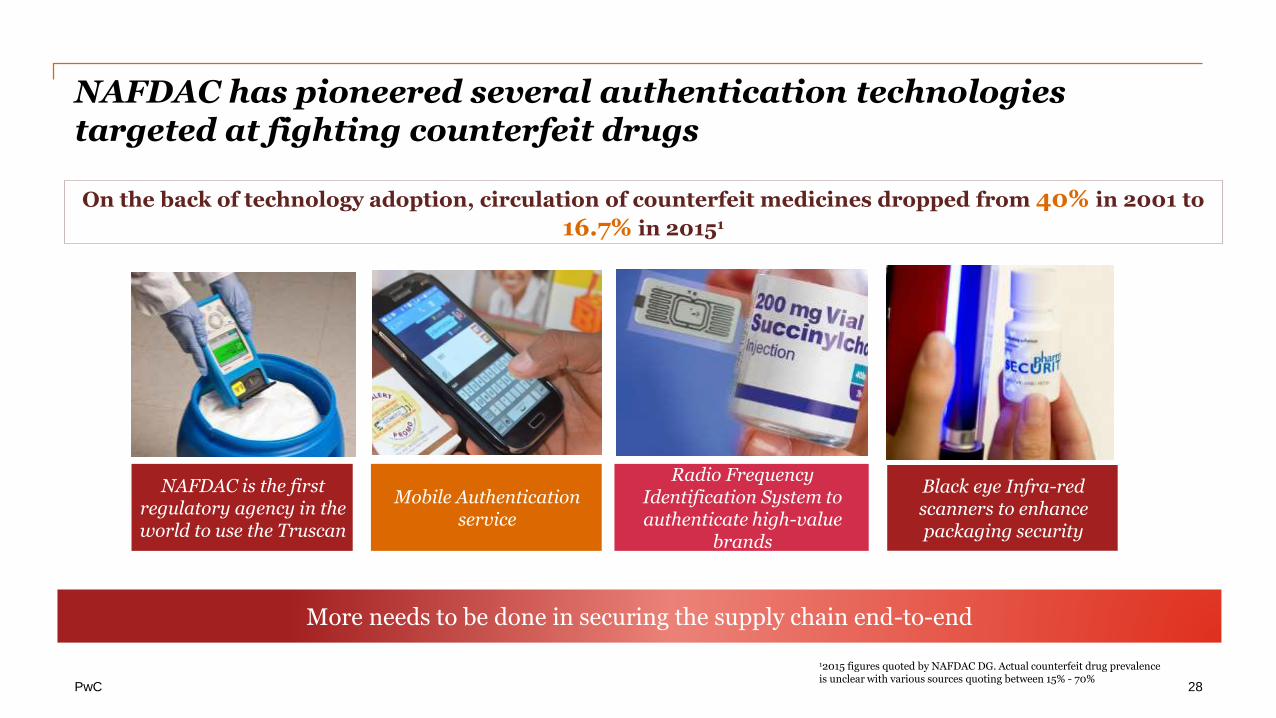
NAFDAC has pioneered several authentication technologies targeted at fighting counterfeit drugs
NAFDAC is the first regulatory agency in the world to use the Truscan
Mobile Authentication service
Black eye Infra-red scanners to enhance packaging security
Radio Frequency Identification System to authenticate high-value
brands
More needs to be done in securing the supply chain end-to-end
On the back of technology adoption, circulation of counterfeit medicines dropped from 40% in 2001 to
16.7% in 20151
12015 figures quoted by NAFDAC DG. Actual counterfeit drug prevalence is unclear with various sources quoting between 15% - 70%
28
PwC
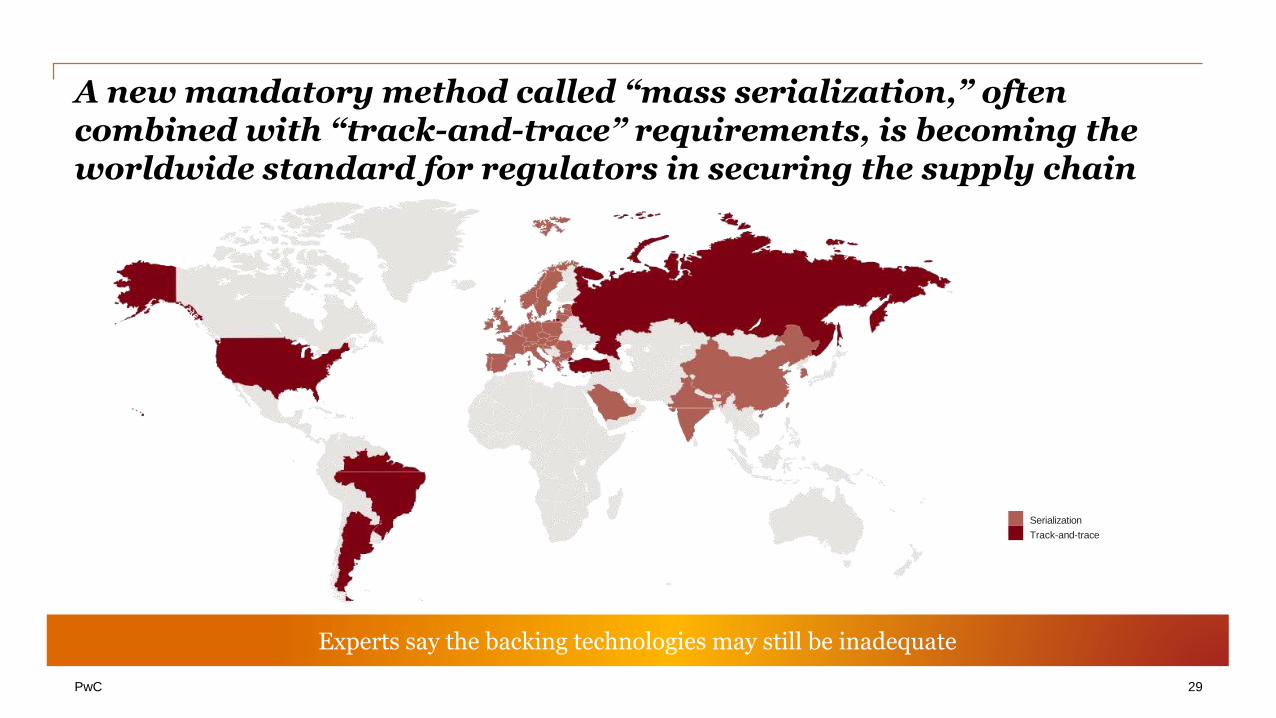
A new mandatory method called “mass serialization,” often combined with “track-and-trace” requirements, is becoming the worldwide standard for regulators in securing the supply chain
Experts say the backing technologies may still be inadequate
Serialization
Track-and-trace
29
PwC
The use case for blockchain technology
30
yolojo-kosoko
Typewritten text
https://youtu.be/9_Dvnz7aBRc
PwC
Advantages
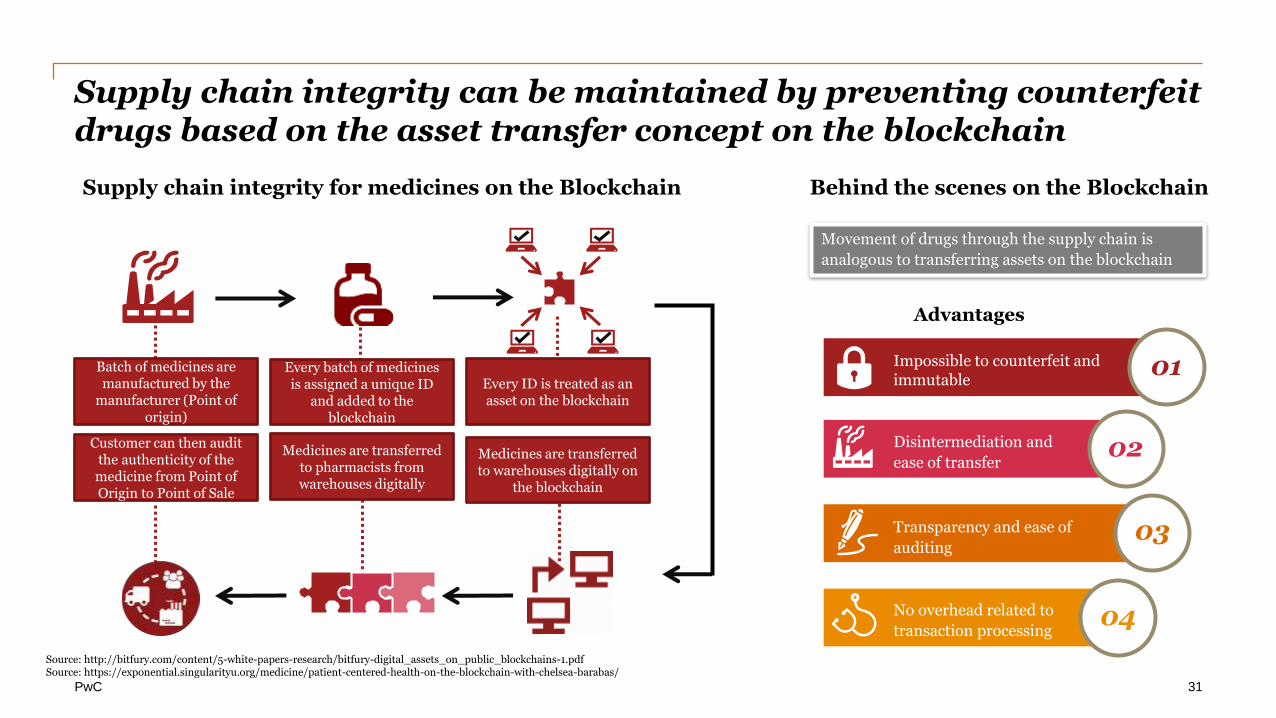
Supply chain integrity can be maintained by preventing counterfeit drugs based on the asset transfer concept on the blockchain
Batch of medicines are manufactured by the
manufacturer (Point of origin)
Every batch of medicines is assigned a unique ID
and added to the blockchain
Every ID is treated as an asset on the blockchain
Medicines are transferred to warehouses digitally on
the blockchain
Medicines are transferred to pharmacists from warehouses digitally
Customer can then audit the authenticity of the medicine from Point of Origin to Point of Sale
Supply chain integrity for medicines on the Blockchain Behind the scenes on the Blockchain
01
02
03
04
Impossible to counterfeit and immutable
Disintermediation and
ease of transfer
Transparency and ease of
auditing
No overhead related to
transaction processing
Movement of drugs through the supply chain is
analogous to transferring assets on the blockchain
Source: http://bitfury.com/content/5-white-papers-research/bitfury-digital_assets_on_public_blockchains-1.pdfSource: https://exponential.singularityu.org/medicine/patient-centered-health-on-the-blockchain-with-chelsea-barabas/
31
PwC
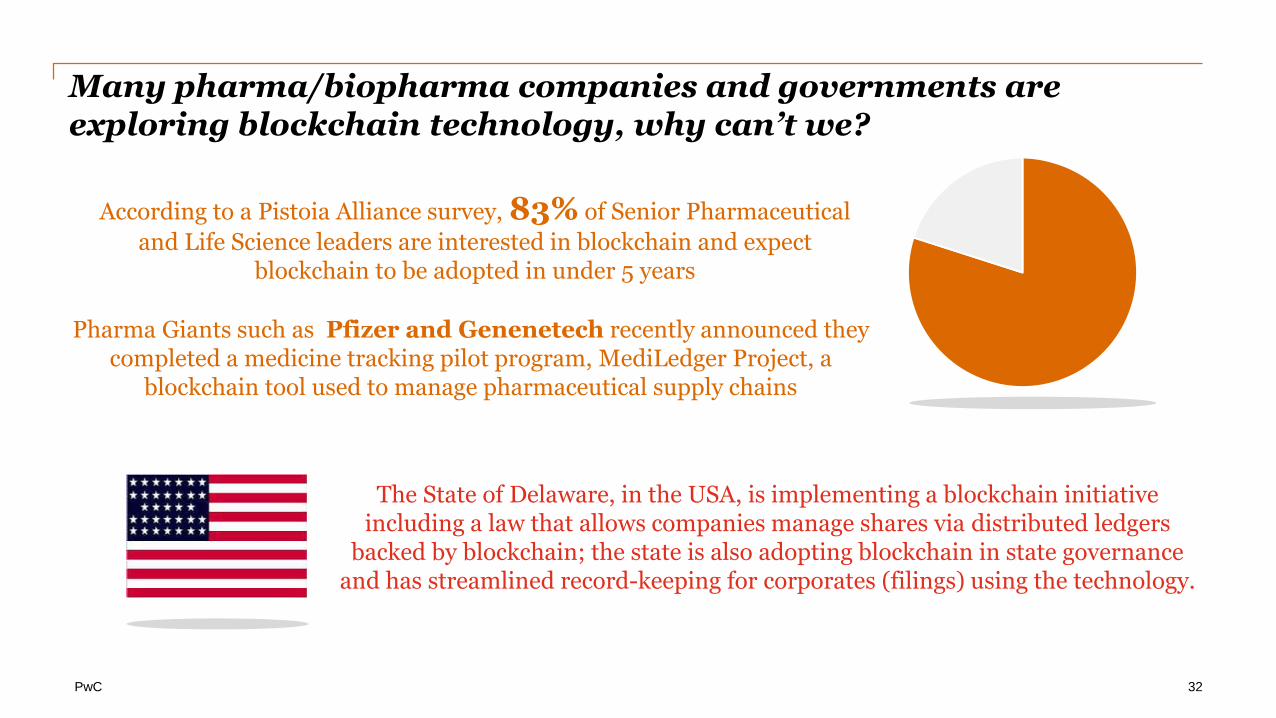
Many pharma/biopharma companies and governments are exploring blockchain technology, why can’t we?
According to a Pistoia Alliance survey, 83% of Senior Pharmaceutical
and Life Science leaders are interested in blockchain and expect blockchain to be adopted in under 5 years
Pharma Giants such as Pfizer and Genenetech recently announced they completed a medicine tracking pilot program, MediLedger Project, a
blockchain tool used to manage pharmaceutical supply chains
The State of Delaware, in the USA, is implementing a blockchain initiative including a law that allows companies manage shares via distributed ledgers
backed by blockchain; the state is also adopting blockchain in state governance and has streamlined record-keeping for corporates (filings) using the technology.
32
PwC
What else can be done?
33
PwC
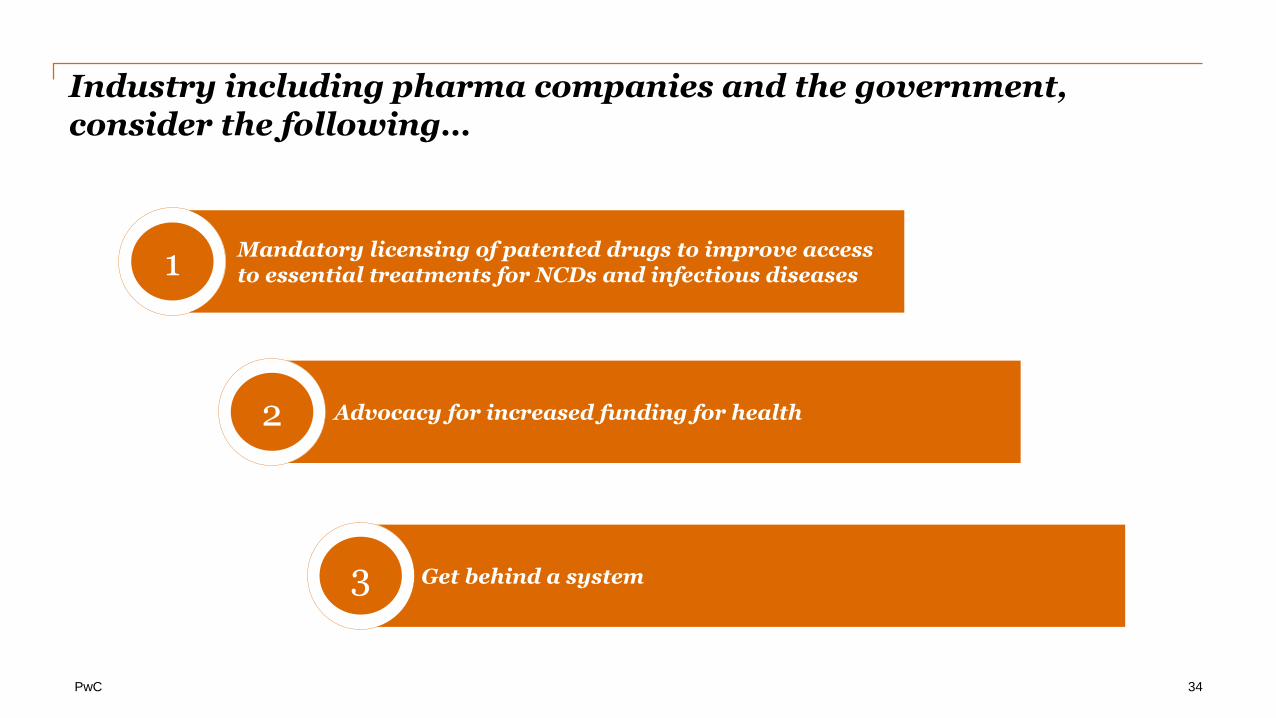
Mandatory licensing of patented drugs to improve access to essential treatments for NCDs and infectious diseases
Advocacy for increased funding for health
Get behind a system
1
2
3
Industry including pharma companies and the government, consider the following…
34

PwC
Do NOT turn a blind eye to malpractices and counterfeits in the system. Remember about 100,000 people die annually in Africa from fake drugs
Provide pharmaceuticals in the best interest of patients
1
Every pharmacist must also remember their duty
35

PwC
Thank You
36