
Drowned by Numbers? Designing an EU-wide Unemployment ... · unemployment benefits.5 Proposals have...
42
2016s-33 Drowned by Numbers? Designing an EU-wide Unemployment Insurance Étienne Farvaque, Florence Huart Série Scientifique/Scientific Series
Transcript of Drowned by Numbers? Designing an EU-wide Unemployment ... · unemployment benefits.5 Proposals have...

2016s-33
Drowned by Numbers? Designing an EU-wide Unemployment Insurance
Étienne Farvaque, Florence Huart
Série Scientifique/Scientific Series

Montréal
Juin/June 2016
© 2016 Étienne Farvaque, Florence Huart. Tous droits réservés. All rights reserved. Reproduction partielle
permise avec citation du document source, incluant la notice ©.
Short sections may be quoted without explicit permission, if full credit, including © notice, is given to the source.
Série Scientifique
Scientific Series
2016s-33
Drowned by Numbers?
Designing an EU-wide Unemployment Insurance
Étienne Farvaque, Florence Huart

CIRANO
Le CIRANO est un organisme sans but lucratif constitué en vertu de la Loi des compagnies du Québec. Le financement de
son infrastructure et de ses activités de recherche provient des cotisations de ses organisations-membres, d’une subvention
d’infrastructure du ministère de l’Économie, de l’Innovation et des Exportations, de même que des subventions et mandats
obtenus par ses équipes de recherche.
CIRANO is a private non-profit organization incorporated under the Quebec Companies Act. Its infrastructure and research
activities are funded through fees paid by member organizations, an infrastructure grant from the ministère de l’Économie,
de l’Innovation et des Exportations, and grants and research mandates obtained by its research teams.
Les partenaires du CIRANO
Partenaires corporatifs
Autorité des marchés financiers
Banque de développement du Canada
Banque du Canada
Banque Laurentienne du Canada
Banque Nationale du Canada
Bell Canada
BMO Groupe financier
Caisse de dépôt et placement du Québec
Fédération des caisses Desjardins du Québec
Financière Sun Life, Québec
Gaz Métro
Hydro-Québec
Industrie Canada
Intact
Investissements PSP
Ministère de l’Économie, de l’Innovation et des Exportations
Ministère des Finances du Québec
Power Corporation du Canada
Rio Tinto
Ville de Montréal
Partenaires universitaires
École Polytechnique de Montréal
École de technologie supérieure (ÉTS)
HEC Montréal
Institut national de la recherche scientifique (INRS)
McGill University
Université Concordia
Université de Montréal
Université de Sherbrooke
Université du Québec
Université du Québec à Montréal
Université Laval
Le CIRANO collabore avec de nombreux centres et chaires de recherche universitaires dont on peut consulter la liste sur son
site web.
ISSN 2292-0838 (en ligne)
Les cahiers de la série scientifique (CS) visent à rendre accessibles des résultats de recherche effectuée au CIRANO afin
de susciter échanges et commentaires. Ces cahiers sont écrits dans le style des publications scientifiques. Les idées et les
opinions émises sont sous l’unique responsabilité des auteurs et ne représentent pas nécessairement les positions du
CIRANO ou de ses partenaires.
This paper presents research carried out at CIRANO and aims at encouraging discussion and comment. The observations
and viewpoints expressed are the sole responsibility of the authors. They do not necessarily represent positions of
CIRANO or its partners.

Drowned by Numbers?
Designing an EU-wide Unemployment Insurance*
Étienne Farvaque†, Florence Huart
‡
Résumé/abstract
The severity of the recent crisis has given rise to several proposals for the creation of a European
unemployment insurance system. In this paper, we first explore the theoretical backgrounds of a
common insurance system. We, then, analyze the main features of an EU-wide unemployment
insurance, and explore its financial and political sustainability, under different scenarios, including a
“US-equivalent” one. We finally highlight key issues with regard to implementation and potential
undesirable effects.
Mots clés/keywords : intergovernmental transfers; fiscal union; fiscal federalism;
European integration; unemployment insurance
Codes JEL/JEL Codes : F45, F36, H77, H87, E60
* We thank Christophe Blot, Marcel Boyer, Gérard Cornilleau, Jérôme Creel, Gregory Clayes, Peter Clayes,
Matthias Dolls, Kodjovi Ekelou, Gilles Le Garrec, Timothy Goodspeed, Eric Hayer, Marcelin Joanis, Richard
Lewney, Claude Montmarquette, Massimo Morelli, Claire Naiditch, Mathieu Plane, Vincent Touzé, Lukas
Vogel, and participants in conferences (3rd EURINT International Conference in Iasi, Macroeconomics
Workshop "The Euro Crisis : Where Do We Stand ?" in Strasbourg University, 2016 ZEW Public Finance
Conference - Fiscal Equalisation in Europe) and seminars (in CIRANO, Montréal, La Sapienza University,
Roma, and OFCE, Paris) for useful comments and remarks. The usual disclaimer applies. † LEM - CNRS (UMR 9221), Université de Lille, Cité Scientifique (SH2), Villeneuve d’Ascq 59655 Cedex,
France ; Skema Business School, Lille, France ; Cirano (Canada). E-mail: [email protected]. ‡ LEM - CNRS (UMR 9221), Université de Lille, Cité Scientifique (SH2), Villeneuve d’Ascq 59655 Cedex,
France. E-mail: [email protected].

2
1. Introduction
Given the severity of the Euro area (EA) crisis, there have been some concerns about the lack
of economic instruments in the Economic and Monetary Union (EMU). As a consequence,
there has recently been a renewal of interest in the field of fiscal federalism in Europe.
However, as heads of states, governments and parliaments still are not ready to renounce
national sovereignty in the fiscal domain, the idea of a federal budget no longer lies at the
core of the recent literature.1 The latter has rather turned towards options such as common
insurance mechanisms.2
Some experts have pleaded the case for the creation of a common stabilization fund in order
to strengthen the foundations of EMU by helping member countries to adjust to asymmetric
shocks. In particular, three reports published in 2012 have aroused interest in the subject of an
EMU-wide insurance mechanism against asymmetric shocks.3 First, the Van Rompuy Report
(“Towards a genuine economic and monetary union”)4 provided a plea for a “fiscal capacity”
at the EMU level - that is to say, a federal budget or an unemployment insurance mechanism.
Second, the report of the Tommaso Padoa-Schioppa group (“Completing the Euro. A road
map towards fiscal union in Europe”) recommended the creation of a cyclical automatic
stabilization insurance fund in complement of a European debt agency and the Euro area
banking union (Enderlein et al., 2012). Third, the European Commission (“A blueprint for a
deep and genuine economic and monetary union. Launching a European debate”) advocated
the creation of an autonomous Euro area budget with a stabilization function against country-
specific shocks. As far as this budget would aim at reducing fluctuations in national incomes,
transfers to countries could be earmarked to specific items with countercyclical effects such as
unemployment benefits.5
Proposals have then emerged to specifically analyze the creation of a European
unemployment insurance. This has been most advocated by Dullien (2013, 2014), a German
economist, and by Andor (2014), the former European Commissioner for Employment, Social
Affairs and Inclusion. The main idea is to establish a basic complement to national
unemployment insurance systems.
At the academic level, it has been the core of several recent works lately, although the subject
is not completely new. In the literature on optimum currency areas (OCA), Kenen (1969)
claimed that monetary integration needs fiscal integration.6 At the time of the Maastricht
Treaty, a few research works were already done in order to assess the costs and benefits of a
1 According to Caudal et al. (2014), the cost of a Euro area budget would be high (12% of EA GDP) for a rather limited degree of automatic stabilization (11%).
2 Enderlein and Rubio (2014) recall that the Delors Report in 1989 referred to the creation of a financial mechanism aimed at helping countries with transitory difficulties. But the report did not expose the details of such mechanism. The members of the Delors Committee were thinking more about using the EU budget in a discretionary way in bad times. Going further back, the issue was also considered in the McDougall report of 1977.
3 Some proposals deal with the EMU dimension and consider the Euro area countries only, while some others cover the EU (European Union) as a whole. In this paper, the terms EMU and EU are often used interchangeably, except in the assessment of simulated effects.
4 It is also called the Four Presidents’ Report (presidents of the European Council, the European Commission, the European Central Bank and the Eurogroup).
5 Iara (2015) offers a chronology of contributions to the debate on fiscal union and reviews sources of revenue for an EMU budget.
6 See Dellas and Tavlas (2009) for a recent appraisal of the OCA literature in light of the EMU.

3
system of federal transfers in the EU (e.g., Italianer and Pisani-Ferry, 1992; Mélitz, 1993).
More recently, some researchers have studied the properties of a common stabilization fund
for the Euro area (Carnot et al., 2015; Delbecque, 2013; Enderlein et al., 2013; Furceri and
Zdzienicka, 2013). Some others simulated the effects of various transfer schemes in terms of
redistribution and stabilization (Bargain et al., 2013; Dolls et al., 2013). In some studies, the
common stabilization scheme encompasses all EU countries and not solely Euro area member
countries. In some others, the scheme relies on transfers taking the form of unemployment
benefits in the Euro area (Brandolini et al., 2014; Dolls et al., 2014; Dullien, 2014; Fichtner
and Haan, 2014; Lellouche and Sode, 2014) or in the EU (Beblávy and Maselli, 2014, Maselli
and Beblavý, 2015).
In this article, we focus on the creation of a European unemployment insurance fund. The grid
we use to analyze the issue is based on the following questions: how would the insurance fund
be financed? How could it be designed in order to avoid adverse redistributive effects
between countries and provide stabilization only? And to what extent would it help stabilize
economies?
Our contributions are six-fold. First, we explore the theoretical underpinnings of a common
insurance system designed for stabilization purposes, asking whether a group of different
countries (or regions) is better or worse off with a common insurance mechanism. What are
the conditions on which these countries could agree to implement a common insurance
mechanism against shocks? On what basis could they reach an agreement on the financing of
the system?
Second, we carry out a large set of simulations in order to analyze how the design of an EU-
wide unemployment insurance system – the choice of parameters along different scenarios –
influences financing and net transfers to countries. Our work covers the 27 EU countries over
the period 2005-2014. The results reveal that transfers can be large, but are overall
sustainable, especially if one takes an inter-temporal (i.e., business-cycle long) perspective,
and / or compares the contributions needed with what member states contribute to the EU
budget.
Third, and although the issue is sometimes blurred in the literature, we make a clear focus on
stabilization issues, and deliver a straightforward measure of the degree of stabilization
provided by such a system for all our scenarios. Our results reveal that the system is generally
desirable on this ground, except for some specific countries, for which the transfers would
increase the volatility of their economy.
Fourth, we discuss implementation problems and some potential undesirable problems that
could emerge with the establishment of the fund.
Fifth, we consider in our analysis the whole of the EU, and not only the Euro area. This is for
several reasons. The first is that all countries contribute to the EU budget, and we can thus
compare their contributions with the ones that would be requested by an unemployment
insurance fund. Second, even though it is presently questioned, the official aim, written in the
Treaties, is that all the Member States join the single currency area. Admittedly, Denmark and
the United Kingdom have opt-outs.7 They could nevertheless be allowed to take part in the
insurance system. Finally, and most importantly, given that crises have strong spillover
effects, even non-Euro area countries may have an interest in participating in a common
stabilization system.
7 We ran simulations in a last scenario without both countries.

4
A sixth contribution is that we provide a supplementary (online) Appendix that allows the
readers to run their own simulations in a transparent and easily accessible way, through an
Excel-designed file.
The paper is organized as follows: we explain the theoretical background of a common
insurance scheme (section 2) before reviewing the features of such a scheme for European
countries (section 3). We then proceed with our simulations (section 4). We finally discuss
key issues in the design and implementation of such a scheme (section 5) and conclude
(section 6).
2. Symmetric shocks insurance design: main theoretical aspects
Our goal is not to provide here a complete review of the arguments for or against the creation
of a European insurance mechanism against asymmetric shocks.8 We nevertheless intend to
review the main theoretical underpinning arguments, as they frame the analysis of the
desirability of the system.
2.1. What are the rationales for a common insurance system?
In the public finance literature (and, in particular, the literature on fiscal federalism), a federal
system of tax and transfers between regions can act as an insurance mechanism when there
are idiosyncratic regional shocks (or country-specific shocks). Such a centralized system is
considered as a potentially useful insurance mechanism when the probability that
idiosyncratic shocks occur is high and other mechanisms are weak or inexistent, such as a
private insurance mechanism (capital markets) and labour mobility. While the literature on
optimal currency areas deals with this subject – which adjustment mechanisms or risk-sharing
mechanisms to asymmetric shocks are available in a currency union –, the public finance
literature studies the conditions for a centralized system to be efficient. In general, it is more
likely to be efficient when preferences about (net) transfers are more similar across
jurisdictions (as famously pointed out by Kindleberger, 1986).
As regards the need for insurance, it obviously exists, as EMU is still not an OCA
(Eichengreen, 2014). Non-EMU EU countries shall also be permitted to participate in the
system as long as not all of them are in a flexible exchange rate regime. Anyway, they are
legally bound by the Treaties to participate in the EMU sooner or later (except Denmark and
the United Kingdom).
Furthermore, Bucovetsky (1998) shows that in the case where there is uncertainty about
which region will be rich or poor, two regions may decide upon forming a federation with
transfers if risk-aversion is sufficiently high and mobility costs as well (or the difference
between the per capita income of the rich region and the per capita income of the poor region
is decreasing). In Lee (1998), a centralized insurance system against idiosyncratic regional
shocks may be necessary even if individuals are mobile, because “the decentralized system
creates externalities and distorts the allocation of labor” (p.416).
8 For reviews of the pros and cons of a European insurance mechanism, see Allard et al. (2013a) and Clayes et al. (2014).

5
In terms of incentives, Guiso et al. (2013) support the idea that the greater the cultural
heterogeneity between countries, the more useful a fiscal union is. They illustrate their game-
theoretic model with the cultural clash between Germans and Greeks (the former wanting to
punish the latter for cheating) during the Euro sovereign debt crisis. According to their
reasoning, a fiscal common authority would circumvent cultural disagreements (and, shall we
add, much shilly-shallying) in deciding upon what to do in the face of a crisis.
In terms of stabilization effects, the Keynesian multiplier of supranational transfers to
households might be higher than that of national fiscal policies (Engler and Voigts, 2013). As
long as households are not subject to Ricardian equivalence nor impose risk premia (which
can happen if households are not fully aware of the – level of – federal taxes, and / or if the
insurance system is not being able to emit debt).
Moreover, politically, it would be a great sign of European integration if households could
receive a payment directly from a European agency (the one in charge of the fund) via a check
or bank transfer. This would however require that national tax authorities cooperate with the
agency in order to identify beneficiaries.
2.2. What are the main impediments to common insurance?
As is well known since at least Musgrave and Musgrave (1989), it is hard to disentangle
stabilization from redistribution effects in any system of transfers being aimed at insuring
regions against the risk of income loss. In the nineties already, the problem was deemed
important (European Commission, 1993). Note that some recent works have also emphasized
that there might be significant redistribution of income between countries with little
stabilization of income in the presence of asymmetric shocks (Bargain et al., 2013).
As regards national contributions to the system, some countries might end-up being
permanent net contributors, while some others would be permanent net recipients (Dolls et al.,
2014). In order to avoid this problem, either a country receives ad-hoc compensatory
payments on a regular basis (Von Hagen, 2007) or the system has a capacity to borrow. Note
that this problem already exists with the contributions to the EU budget (Table 1): four EU
countries have been permanent net contributors (Austria, Belgium, Germany, and Sweden)
while thirteen other countries have been permanent net recipients. Politically, how much more
would some member countries have to contribute for an extra common solidarity mechanism
and would this be worth it?9
[Insert Table 1 about here]
Any insurance system is subject to moral hazard. Persson and Tabellini (1996a) explain that
full insurance provided by a federal transfer system is not optimal because of incentive
problems: as long as federal transfers insure local governments against asymmetric shocks,
they can reduce the incentives of local governments to enact policies that reduce the
occurrence of these shocks or help the local economy adapt to these shocks. Local
9 If a European insurance system was found to need a borrowing capacity, the debt-related risk-sharing issue could also prove to be a tricky one. The subject of issuing Eurobonds is nevertheless beyond the scope of this article. See, e.g., Pisani-Ferry et al. (2013) on this issue, who consider the options of GDP-indexed sovereign bonds and a common guarantee on borrowing.

6
governments do not internalize positive spillover effects of local public investment on the
aggregate risk. One option is to complement the risk-sharing scheme with a federal public
investment scheme.10
In practical terms, this also raises the question of the coexistence of an
EU unemployment insurance system along with national systems: should the former replace
or complement the latter? And to what extent should it complement them?
Depending on the information that the central government has on regional shocks, the degree
of insurance provided by the federal government might not be optimal (Lockwood, 1999). In
particular, there might be over-insurance due to a common pool problem (Sanguinetti and
Tommasi, 2014): in the case where the federal government has incomplete information about
the actual realization of local income shocks, local governments increase local expenditure
expecting federal transfers, and do not take into account the negative externalities of their
decisions on other localities, namely fewer federal resources available to finance the federal
public good (that is, insurance).
Finally, there might be difficulties because of the heterogeneity of structures and preferences
among countries. Alesina and Perotti (1995) show that a centralized system is not necessarily
superior to a decentralized one, because there is a trade-off: on the one hand, under
centralization, the variability of the tax base and hence that of subsidies to individuals are
lower; on the other hand, the endogenously-determined tax rate is more variable, and this cost
is higher when income polarization is higher (that is, when preferences of voters are more
heterogeneous).
2.3. What is the optimal contribution rate?
Concerning the financing of the system, the optimal contribution rate is likely to differ across
countries.
Persson and Tabellini (1996b) consider that a low-risk country, i.e. a country with a lower
probability of being in a bad aggregate state than that of the other country, will accept a lower
contribution rate than that of the high-risk country. They compare two federal schemes. First,
transfers to governments decided upon through collective bargaining will provide
underinsurance, because the low-risk country has more clout in the negotiation than the high-
risk country (autarky being a reference point) and it imposes a lower contribution rate (hence,
funds are insufficient). Second, transfers to individuals, chosen by voting, will provide over-
insurance, because individual voters with a higher risk of income loss are more likely to form
cross-border coalitions or to have higher turnout rates.11
In practical terms, this means that the
institutional procedure of choosing the contribution rate matters!
Similarly, in a framework of strategic institutional choice, Luque et al. (2014) show that large,
rich or low-risk countries (i.e. with low volatility of income) will bargain for a lower union’s
tax rate than the other countries. Indeed, for large countries, the union’s tax rate will apply to
a tax base mostly composed of their income. As for rich countries, they want to avoid
“expropriation” by a union tax rate higher than their preferred one. And low-risk countries do
not expect a great need of insurance. Drawing from this analysis, we can infer that the optimal
10 Note that the European Commission has recently launched a vast EU-wide investment plan.
11 But the threat of secession by the low risk-region imposes an upper bound on the extent of over-insurance. They conclude: “As a consequence, residents in the rich region prefer intergovernment transfers with bargaining, whereas residents in the poor region prefer voting on a centralized social insurance. The reason is that the size of interregional transfers is larger under the second arrangement than under the first.” (p. 1007)
7
contribution rate of Germany, which is a large, rich and low-risk country, is lower than that
of, say, Greece. Does it mean that Germany should be entitled to claim more voting powers to
accept joining a fiscal union (or common insurance system)?12
Yet, as has become recently
apparent, it could also be in the interest of this country to accept a fiscal union whose costs
might be inferior to those of financial rescue packages.
If the common insurance system is to be financially balanced at each period, Von Hagen
(2007) proposes that the high-risk country pays a premium that the federal government would
use as a fixed transfer paid to the low-risk country, in order to compensate the latter for
providing more insurance than it would find optimal. Although the UK rebate on the EU
budget shows the possibility of such a correction mechanism, the political upheavals
associated with each (re)negotiation can only raise doubts on the desirability of such ad hoc
systems.
We can draw one important conclusion from these analyses: if the probability of asymmetric
shocks is not the same across countries in a monetary union, then the contribution rate to the
common insurance system has to be country-specific. If it were to be identical across
countries, then a repayment should be allowed for those less frequently hit by negative
asymmetric shocks (on efficiency grounds, not redistributive ones). In terms of incentives,
this repayment could mitigate part of the moral hazard problem: being insured against
asymmetric shocks, national governments would be less keen on implementing policies to
reduce the risk of such shocks, unless they receive a repayment for being less subjected to
these shocks. The practicality of such a design, however, is far from obvious, as the recent
literature on the design of a European unemployment system shows.
In a nutshell, the main benefits come from sharing the adjustment burden in the face of
adverse asymmetric shocks (and these are larger the further the area is from being an optimum
currency area), while the main costs are the share of the contributions made to the common
insurance fund.
3. Designing an European unemployment insurance system
In this section, we discuss the features of an unemployment insurance system, starting with
the description of the formulas used to compute payouts, contributions and net transfers.
3.1. Basic formulas
Starting from the formulas exposed by Lellouche and Sode (2014), we can first define the
benefits, Bi,t, paid out by the central scheme to a Member State i in year t, as:
(1) 𝐵𝑖,𝑡 = 𝑅𝑅 × 𝛼 × 𝑤𝑖,𝑡 × 𝐶𝑅 × 𝑈𝑖,𝑡,
12 This would run opposite to the arguments made, e.g., by Casella (1992), and according to which the smaller country will obtain a voting power superior to its economic weight to participate in the union.

8
where the variables wi,t and Ui,t are the average wage in the economy and the number of
unemployed respectively. As far as those currently unemployed were not earning the average
wage before, the parameter alpha represents a proportion of the average wage. For example α
is equal to 0.8 in the "do it by yourself" experiment proposed online by Clayes et al. (2014)
from Bruegel think tank. RR denotes the replacement rate (unemployment benefit as a
percentage of previous wage) while CR is the coverage ratio (number of unemployed
receiving benefits as a percentage of total number of unemployed). For given identical
parameters across countries (RR, CR and arguably alpha), the amount of benefits paid to each
country depends positively on the average wage in the economy and the number of
unemployed.
Contributions Ci,t, that each Member State pays into the scheme, are a share of the total wage
bill:
(2) 𝐶𝑖,𝑡 = 𝜏𝑖,𝑡 × 𝑤𝑖,𝑡 × 𝐸𝑖,𝑡,
with 𝐸𝑖,𝑡 = (1 − 𝑈𝑖,𝑡) representing total employment and 𝑤𝑖,𝑡 × 𝐸𝑖,𝑡 the wage bill. The
contribution rate 𝜏𝑖,𝑡 is to be chosen. Imposing a uniform contribution rate τ across countries
would imply that national contributions will increase with the national wage bill.
Net transfers received or paid by each Member State, Ti,t, are given by:
(3) 𝑇𝑖,𝑡 = 𝐵𝑖,𝑡 − 𝐶𝑖,𝑡.
A country i is a net recipient from the system in time t if 𝑇𝑖,𝑡 > 0 and a net contributor
otherwise.
One key variable for the financing of the insurance fund is thus the contribution rate (tau). It
can be single (i.e. common to all countries) and determined so that the fund is balanced over a
given period, say over the past three years:
𝜏𝑡 such as ∑ ∑ 𝑇𝑖,𝑗 = 0𝑖𝑡−1𝑗=𝑡−3 , that is:
∑ ∑ 𝐵𝑖,𝑗 −
𝑖
𝑡−1
𝑗=𝑡−3
∑ ∑ 𝜏𝑖,𝑗 × 𝑤𝑖,𝑗 × 𝐸𝑖𝑡 = 0
𝑖
𝑡−1
𝑗=𝑡−3
and:

9
(4) 𝜏𝑡 =∑ ∑ 𝐵𝑖,𝑗𝑖
𝑡−1𝑗=𝑡−3
∑ ∑ 𝑤𝑖,𝑗 × 𝐸𝑖,𝑗𝑖𝑡−1𝑗=𝑡−3
The single rate is equal to the sum of all benefits paid to all countries during the past three
years divided by the sum of all national wage bills during the same period. It is updated each
year. But it could be updated less frequently, for example every five years as in Lellouche and
Sode (2014). Alternatively, can be differentiated among countries and computed so that the
fund is balanced at the country level, say over the past three years:
(5) 𝜏𝑖,𝑡 =∑ 𝐵𝑖,𝑗
𝑡−1𝑗=𝑡−3
∑ 𝑤𝑖,𝑗 × 𝐸𝑖,𝑗𝑡−1𝑗=𝑡−3
Specifically, equals the sum of benefits received by country i during the past three years
divided by the sum of the wage bill of country i during the past three years. Setting country-
specific contribution rates that balance national net positions is called experience rating.13
3.2. National disparities
How would the values of the parameters be chosen? Given the heterogeneity of national
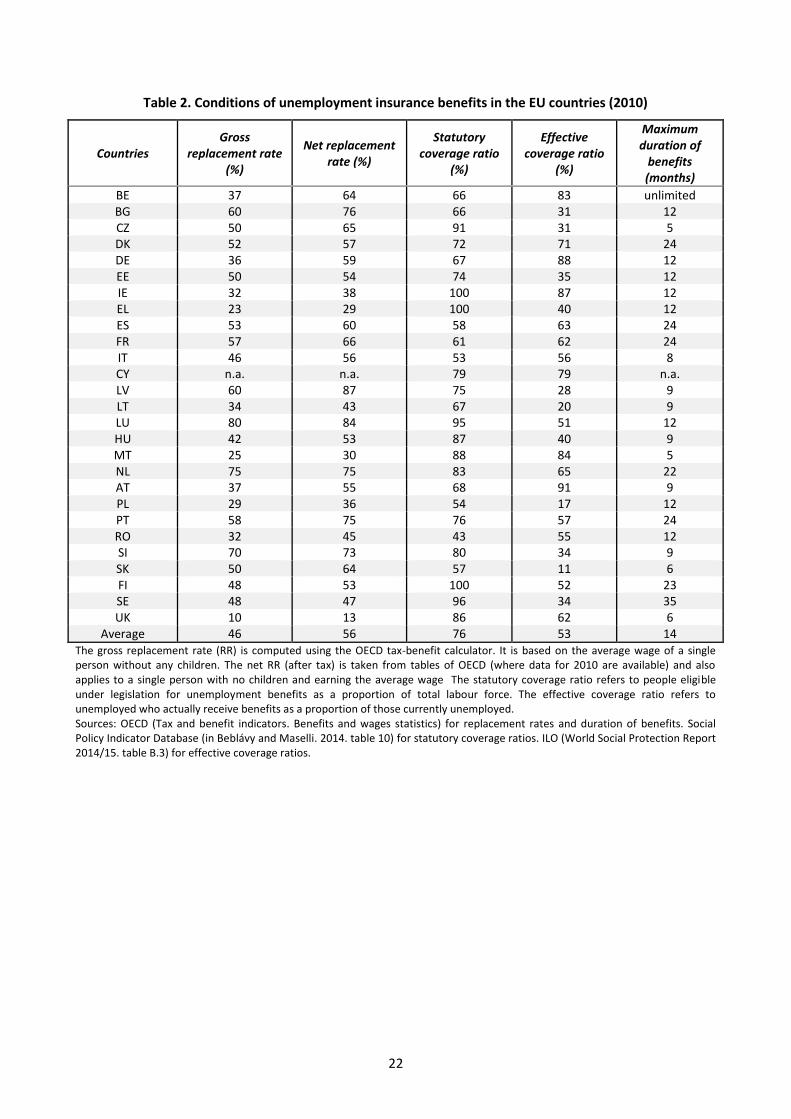
labour markets (described in Table 2), answering this question is quite tricky.14
At least, the
choice should be made in a consistent way. For instance, the value of each parameter is to be
taken from the same year. Due to data availability, we use the year 2010. In that year, gross
replacement rates varied from 10 percent in the United Kingdom to 80 percent in
Luxembourg. The average was 46 percent in the EU. It is higher if one takes into account the
net replacement rate (after tax): 56 percent. The difference between both rates is large for
some countries (e.g. Belgium, Germany, and Latvia). Coverage ratios also differ across
countries. Legal coverage was on average 76 percent in 2010. Three countries had 100
percent coverage: Ireland, Greece, and Finland. At the lower end, unemployment insurance in
Romania covered less than half the labour force. However, effective rates can be very
different from legal rates.15
For example, in Greece, only 40 percent of unemployed actually
received benefits in 2010 (the figure was 16 percent in 2014). Effective coverage was on
average 53 percent in that year in the EU.
As for the maximum duration of benefits, it ranges from 5 months in Malta and the Czech
Republic to an unlimited period in Belgium. On average, it was around 14 months in 2010 in
the EU.
13 In general, in the literature, there is no full experience rating (cumulated cash flows would be zero over the whole period) but partial experience rating (the cumulated net position is balanced over sub-periods).
14 For an overview of national unemployment insurance systems in the EU, see also Esser et al. (2013), Beer et al. (2014).
15 The legal rate represents people who are eligible to unemployment benefits as a proportion of total labour force while the effective rate represents unemployed who actually receive unemployment benefits as a proportion of total unemployed.
10
There are other conditions, in particular in terms of eligibility. For instance, a minimum
period of previous work (employment or contributions) is required in order to become eligible
for insurance benefits. In 2010, the qualifying period varied from less than 5 months in France
to more than 3 years in Slovakia (Esser et al., 2013).
Overall, national unemployment insurance systems are obviously more or less generous.
Clayes et al. (2014) warn that heterogeneity in that matter makes it hard to design a common
scheme. Should the common unemployment insurance system be designed to match the least
generous national system or should it be an average of national systems? In the former case,
the stabilization effects are likely to be small. In the latter case, contribution rates would
increase for employees in the least generous countries.
[Insert Table 2 about here]
3.3. Main features
The idea of a basic European unemployment scheme (Dullien, 2013) is to provide a minimum
amount of unemployment benefit and let member states be more generous if they want to by
giving a national supplement and for a longer period of time than the duration of the European
benefits. In the recent literature, the features of existing proposals or simulated schemes differ
according to the trigger (what starts the insurance mechanism), eligibility, payouts, duration
of benefits, and contributions. All these render the comparison of the existing proposals quite
difficult, as can be seen from Table 3.
[Insert Table 3 about here]
For example, concerning the trigger, unemployed could benefit from the EU unemployment
insurance scheme at all time (i.e. under any circumstances). Alternatively, there could be a
contingent clause under which the scheme would enter into force only in some exceptional
circumstances, such as a strong increase in the unemployment rate.
Also, concerning other features, most of schemes cover short-term unemployed only, from the
start of unemployment or from the third or fourth month (in order to avoid financing seasonal
unemployment). Most of the time, the duration of benefits is one year, the coverage ratio is at
least 50 percent (meaning that half of unemployed are insured), the replacement rate is set to
50 percent, and α is equal to 100 or 80 percent. As for the contribution rate τ, it varies
between 0.4 and 2 percent, or it is either set for balancing the aggregate position of the fund or
that of each country. As exposed above, as long as national unemployment insurance systems
and labour markets are heterogeneous, imposing a uniform contribution rate τ would not be
desirable. It could create distributional issues across countries.
A deductible is hardly ever added to the features of the scheme.16
Yet, Gros (2014) argues that
the insurance should cover the insured only above a certain deductible or threshold as is
common in the insurance industry. With a deductible (of say 1 percent of GDP), the shock is
fully absorbed above the threshold. Instead, in most proposals, the coverage is not 100
16 An exception is Beblavý et al. (2015).

11
percent, probably because of the lack of a deductible. Gros (2014) refers to the US Extended
Benefits Program: it is triggered if the state unemployment rate is above 5 percent (and has
been increased by more than 20 percent relative to the two preceding years).
3.4. Net transfers and stabilization impact
Existing studies are based on counterfactual simulations, built in order to assess the amount of
net transfers had the EU insurance scheme existed over a given period. However, it is not easy
to draw firm conclusions from their results (see Table 4). Indeed, simulations differ from one
study to another with regard to the choice of parameters (see Table 3 above), but also
according to the number of countries and the period covered. Yet, it is obvious that the size of
the sample as well as the starting date would critically influence the amount of transfers.
The cumulated cash position of the insurance fund is either in surplus (around 0.3% of EA
GDP) or in deficit (0.2 % of GDP), with the exception of larger amounts (around 4 or 5 % of
EA GDP) in Dullien (2013). Spain is almost always the main beneficiary. During the
recession year 2009, net transfers could have amounted up to 1.5 percent of Spain’s GDP in
the proposal made by Dullien (2013). Among the net contributors, there are rich countries (in
particular, the Netherlands and Austria), but not only: for instance, the Czech Republic, Malta
and Romania could be net contributors (less than 1 percent of GDP) in both schemes
simulated by Beblávy and Maselli (2014).
In most schemes, then, cumulated net contributions to the insurance fund are higher than
those to the actual EU budget (see Table 1). Are member states ready to pool more funds in
order to share the costs of short-term unemployment insurance? An additional problem is that
there are often permanent net transfers. For instance, this is the case in all six scenarios
studied by Dolls et al. (2014), which differ according to coverage ratios and generosity levels.
[Insert Table 4 about here]
In the recent literature on insurance schemes, some authors compute the stabilization impact
of transfers. Overall, the average stabilization impact during the recession year 2009 ranges
between 5 percent (Dullien, 2014) to 36 percent (Dolls et al., 2014). For Spain, the main
beneficiary of various European unemployment insurance schemes, the maximum impact
during that year would be 29 percent (Dullien, 2014) or the additional output would be 1.8%
of GDP (Beblávy and Maselli, 2014). However, there could be some adverse effects. In
Fichtner and Haan (2014), under the generous model, the recession in Spain would have been
a fall in GDP of -3.1% instead of -3.8% (actual data) in 2009, but afterwards, due to cash
reversal (as the recession becomes milder and short-term unemployment becomes long-term
unemployment), the recession would have been worse in 2010 (-0.4% instead of -0.2% in
actual data) and in 2011 (-0.26% instead of +0.05%).
There are some limitations though. First, results are not comparable, because methods differ.
In terms of measurement, Dullien (2013) computes stabilization effects by the ratio of the
change in net transfers to the change in output gap. In Beblávy and Maselli (2014), the
stabilization impact is measured by net transfers received multiplied by the fiscal multiplier.
In Dolls et al. (2014), simulations are made with Euromod, a calculator of taxes and benefits
of EU countries. An income stabilization coefficient is computed and basically measures the

12
change in disposable income after a shock on gross income. In Fichtner and Haan (2014),
stabilization effects are simulated with NiGEM. The propensity to consume is calibrated in
the model with a high value given that unemployed are likely to consume a large part of their
payouts.17
Second, the stabilization impact may be overestimated. It is, indeed, generally assumed that
the multiplier is one: a 1 percent increase in transfers gives rise to a 1 percent increase in
GDP.18
Yet, there is a controversy about the size of the Keynesian multiplier. Estimates vary
widely in the literature depending on theoretical assumptions or statistical methods. In the
United States, the Congressional Budget Office (CBO) uses a range of estimates: between 0.4
(low estimate) and 2.1 (high estimate) for transfer payments to individuals (Whalen and
Reichling, 2015).
Finally, Wolff (2012) is not in favor of an EMU-wide unemployment insurance system,
because the macroeconomic effects would be too limited. He refers to the study of Asdrubali
et al. (1996) based on the working of the federal tax and transfer system in the United States.
According to their results, 13 percent of a shock to gross state product is absorbed by fiscal
transfers between states. Out of this total of 13 percent, only 1.9 percent comes from
unemployment benefits.
4. Simulating a European insurance system
In order to have a consistent picture of how the parameters of the scheme influence net
transfers, we ran a large set of simulations considering all EU countries, except Croatia for
which there are too many missing data. We have detailed above the reasons that drive us to
consider the whole EU, and not only the members of the Euro area. We use data from
Eurostat (unemployment rate, number of short-term unemployed) and AMECO (GDP,
compensation per employee, and aggregate compensation of employee). Our sample period is
2005-2014. As long as there are missing data for some countries with regard to short-term
unemployment before 2000, we could not start the sample at 2000. Indeed, in some scenarios,
we need to compute averages of some variables over the past few years. Starting at 2005
allows us to avoid the problem of missing data. This is critical because missing data would
bias the amount of transfers to countries as long as the number of unemployed and its
evolution determine the amount of benefits.
The computation of net transfers (the net position of each country with regard to the fund) is
based on formulas given in the previous section (see Equation (3)). Two variables are used for
benefits (Equation (1)): average wage (i.e. compensation per employee) and the number of
short-term unemployed. In our baseline scenario, we set the parameter alpha at a value of 0.8
(share of the average wage in the economy that those currently unemployed used to earn). It is
arguably identical across countries. We focus instead on another source of heterogeneity
across countries, namely the replacement rate (RR). We take the EU average of the gross RR
(0.46) in the baseline, but we also consider a scenario with the net RR (0.56 on average in
variant 1) and another one with country-specific gross RR (national RR is taken if it is below
the EU average in variant 2). As for the coverage ratio (CR), it is set at 100 percent in the
baseline scenario and at 80 percent in a less generous scenario (variants 3 and 5). For the
contributions (Equation (2)), we need to apply a contribution rate (tau) to the wage bill
17 The authors do not precise the value of the parameter.
18 Beblávy et al. (2014) use a multiplier of 1.5.
13
(aggregate compensation of employees). In the baseline scenario, tau is single, that is
common to all countries and computed (and updated each year) so that the fund is balanced
over the past three years (Equation (4)).19
Alternatively, tau could be country-specific
(variants 4, 5, 7 and 9) so that the net position of the country is balanced over every past 3-
year period (Equation (5)). Moreover, one has to decide upon the trigger, that is whether the
insurance fund gives benefits at all time (short-term unemployed receive benefits during one
year) or under special circumstances. In the baseline scenario, the scheme works all time, but
we consider some other triggers: first, we take bad times that we define as years where short-
term unemployment rises more than 10 percentage points (variants 6 and 7). Second, we look
at the US system (the Extended Benefits Program during the financial crisis) whereby benefits
are paid to short-term unemployed when unemployment rate exceeds 5 percent and is 20
percent above the level of the past two years (variants 8 and 9). Finally, we consider a
scenario without the participation of Denmark and the United Kingdom (variant 10).
Table 5 shows the accumulated net position (in percentage of 2014 GDP) of each country and
of the fund for the whole period 2005-2014 under the baseline scenario and all variants.
Detailed results for each scenario are displayed in tables in the appendix (in € million and as a
percentage of GDP for each year).
Under the baseline scenario (first column of Table 5 and Table A1), total payouts would have
amounted to 48 €bn during the 2009 recession, and the fund would have been in deficit (27
€bn), because the accumulated surpluses the year before up to 20 €bn would still have not
been sufficient. At the end of 2014, the total deficit would have been 49 €bn. Spain would
have been the main net recipient (about 182 €bn over 10 years), but Germany would have
been a net contributor up to 107 €bn at the end of the period. If the sums look important, they
are much less impressive when expressed in percentage of GDP. For Germany, the net
contribution would represent 3,7% of its GDP spread over 10 years – that is, not far from its
actual accumulated net contribution to the EU budget, precisely 3.3% of GDP over the same
period (see Table 1). The deficit of the fund would represent 0.4% of EU GDP. There would
be three permanent net recipients: Spain (17% of GDP over the 10-year period), Greece (7%
of GDP), and Sweden (1% of GDP). And there would be four permanent net contributors:
Luxembourg (6% of GDP), the Netherlands and Malta (3% of GDP), and Slovenia (2% of
GDP). Taking the net replacement rate instead of the gross rate (Variant 1) or applying the
national rate if it is below the EU average (Variant 2) would not change the overall position of
the fund over the whole period. Yet, at the country-level, there would be more benefits for
some (net recipients) or more contributions for others (net contributors) with a higher
replacement rate. Applying country-specific rate for countries whose national gross
replacement rates are below the average (see Table 2) could change the net position.
[Insert Table 5 about here]
The coverage ratio could be adjusted (80 percent instead of 100 percent in Variant 3) in order
to reduce the deficit of the fund over the whole period (the deficit would be 0.3% of EU GDP
19
We choose a 3-year period because due to missing data before 2000 with regard to the number of short-term unemployed, we cannot compute benefits (and hence tau) over the past four or five years under certain scenarios
(e.g. with the trigger being a percentage change in the number of unemployed).
14
instead of 0.4%). The political acceptability of such a version is probably higher, although at
the cost of a reduced generosity. One could instead consider country-specific contribution
rates (Variants 4 and 5). In this case, there would not be any net permanent positions (see
Tables A5 and A6). The amount of payouts would be far lower yet. Spain would still be the
main net recipient (4% of GDP over the whole period) and Poland would be the main net
contributor (1% of GDP). Note that the fund would be in deficit (0.4 % of EU GDP). Either
the fund is given a borrowing capacity or it is triggered only in special circumstances, i.e., in
bad times. In Variants 6 and 7, we consider “bad times” (defined as years where the number
of short-term unemployed rises more than 10 percentage points) with a contribution rate
which is either common or country-specific (respectively). Under these variants, the fund
would have accumulated surpluses of 30 €bn (0.2% of GDP) and 18 €bn (0.1% of GDP)
respectively. All countries would have been net recipients in 2009. Note that Greece and
Portugal would no longer be net recipients if the contribution rate were country-specific. And
the cost of the system would be far higher if Denmark and the United Kingdom did not
participate into it (Variant 10).
Finally, in many discussions about adjustment mechanisms to shocks, the experience of the
United States is taken as a reference point and a model for Europe. We here take the analogy
seriously. During the financial crisis, the federal Extended Benefits Program provided benefits
for an additional period of 13 weeks and was triggered if the state unemployment rate
exceeded 5 percent and was 20 percent above the level of the previous two years. The
advantage of this mechanism is that it is based on shocks to unemployment, and not solely on
the level of unemployment. Given that the latter can be structural and depends on countries’
specific institutions, this further avoids the redistribution issue. We thus simulate such a “US
scenario” with a common contribution rate (Variant 8) or a country-specific one (Variant 9).
There would not have been any permanent net positions in any case. Moreover, each variant
gives some interesting results: under a common contribution rate, the deficit of the fund
would have been the lowest (0.2% of GDP); the main net contributors would be rich countries
(Belgium, Germany, France, Luxembourg, and Austria), and the countries which suffered
from a sharp increase in unemployment would be the main net recipients (Spain, Greece, and
Cyprus). Under a country-specific contribution rate, most countries would have a balanced
position over the period and again, the main net recipients would be the same as in the
previous case (with lower net benefits though).
All in all, then, the “US scenario” with country-specific contribution rates leads to more
satisfactory outcomes than other scenarios with regard to the cash position of the fund, the
cost of the system at the national level, and the fact that there are no permanent net positions.
It thus avoids the suspicion of redistribution that could hinder negotiations of an
unemployment insurance system.20
However, there could be some other criteria for assessing
the different variants. One could consider the “relative variability” indicator (Table 6): would
net transfers increase or decrease the variability of GDP? On average, and this is consistent
with intuition, a fund dedicated to bad times (variants 6 and 7) would perform better: the
variability of GDP would be 3% lower with net transfers. At the country level, most countries
(16 out of 27) would have the lowest variability under the “US system” with a common
contribution rate (variant 8).
20 It does not, however, completely address the country-level moral hazard problems. For instance, how can one be sure that a country does not put individuals in and out of short-term unemployment insurance in order to (re-)qualify them for European transfers? Although the issue cannot be neglected, it lies out of the scope of this paper.

15
[Insert Table 6 about here]
5. Ancillary issues
5.1. Implementation issues
First, the aggregate cash position of the system depends on the economic situation of member
countries, and hence on the starting date. It also depends on the definition of the trigger. In
our simulations, the accumulated position of the fund would have been a deficit in 2014
(despite a surplus that year) in the baseline scenario, but a surplus in the bad times scenarios
Variants 6 and 7).
There is also a risk of falsification of labour force statistics by some national governments.
Statistics on short-term unemployment might be rigged by governments, which would seek to
contribute less to the financing of national unemployment.
It is often implicitly assumed that the introduction of a European unemployment insurance
will come along with a reduction in contributions to national insurance.21
Yet, the total cost of
insurance for unemployed would increase if governments are not willing to lower national
social security contributions.
Fourth, if all countries were severely hit by a protracted crisis at the same time, the European
insurance scheme would be in deficit. Therefore, before deciding upon implementing this
scheme, one has to make sure that there is a political agreement upon the possibility of
borrowing at the European level in order to finance the scheme if needed. This is, however, a
delicate issue in the European arena (as, for example, the EU budget is already not allowed to
be in deficit).
Finally, one ought to think about the way a European unemployment insurance system can fit
in the existing institutional framework, namely the European Social fund and the European
Globalisation Adjustment Fund (Beblavý and Maselli, 2014). Would the latter two be the
victims of the new system, sacrificed during the political bargaining stage, to reduce the
overall cost of participation to the European process? At the present moment, this cannot be
ruled out.
5.2. A "bullet-proof" system?
If only for political acceptability, in the present circumstances, permanent net transfers across
countries are to be avoided. In Dolls et al. (2014), even in simulations with some experience
rating, there are some permanent net recipients and contributors. In our simulations, we could
avoid this by setting country-specific contribution rates that balance the country cash position
over the past three years. Moreover, the “US scenario” goes even further in this direction,
increasing the desirability of the system.
21 Fichtner and Haan (2014) make the assumption explicitly.

16
One should be careful about some potential anti-redistributive effects that could occur. Richer
countries might receive more European transfers than poorer countries during a recession or
severe economic slowdown. For instance, in our simulations, Poland is often a net
contributor.22
Besides, the system could be a support in terms of public finance for some countries, or a kind
of windfall for some others. Indeed, if we compare simulated transfers with actual amount of
national public expenditure in unemployment benefits (Table 7), an EU insurance could be a
support in terms of public finance for Spain (especially the variant 6 under bad times or the
variant 8 under the US specification) where the amount of unemployment benefits is already
relatively high (3.6% of GDP during the recession year of 2009). But it could also be a kind
of windfall for Latvia or Lithuania where public expenditure in unemployment benefits is
relatively low (1.6 and 0.9 % of GDP respectively).
[Insert Table 7 about here]
The definition of the trigger is critical. For instance, if the trigger is the change in the
unemployment rate, some countries might be net contributors despite a high level of
unemployment. For instance, Ireland would be a net contributor in 2014 in most of simulated
schemes except under variants where the trigger is influenced by the change in unemployment
such as variant 7 (bad times and specific tau) and variant 9 (US system and specific tau).23
The definition of the payouts and the contributions are also crucial: in Artus et al. (2013),
some countries are net recipients despite a low structural unemployment rate (Netherlands),
because the payments received are based on the unemployment rate whereas the contributions
are based on the structural unemployment rate.
If only short-term unemployment is insured by the common scheme, some countries with a
higher share of long-term unemployment could bear the costs of an additional insurance
without benefiting as much from it. This is the case of Italy, for instance, in the scheme
proposed by Dullien (2013), but not in our scenarios with country-specific contribution rates
and payments during bad times only.
Also, a European insurance scheme for short-term unemployment is certainly not suitable in
case of a protracted slowdown, because an increasing share of long-term unemployed would
not be covered. Indeed, the share of short-term unemployment decreased in all EU countries
except Germany between 2009 and 2014 (Table 8). In Greece, the unemployment rate
increased by 27% but the share of short-term unemployment decreased by 56%.
[Insert Table 8 about here]
22 Similarly, in the proposal of an EMU insurance system based on the pooling of bonds, made by Drèze and Durré (2014), Luxembourg would have been a net recipient and Spain a net contributor.
23 It would also be a net recipient in 2014 in variant 10 (EU-25).

17
6. Conclusion
All in all, intellectually, a EU-wide insurance mechanism appears a good idea to reinforce a
European integration process presently under stress. It may well be drowned by numbers,
though. And in particular if member states are still inclined to ask for a “juste retour” (fair
return) on their contributions to the common insurance scheme.
Anyway, whatever the EMU-wide insurance mechanism, it is to be thought as an element of a
comprehensive package of institutional reforms aimed at improving the European integration
process. From this point of view, Artus et al. (2013) propose to complete the euro with an
institutional reform based on a banking union, a European unemployment insurance and a
fiscal stabilization system (with rules regarding the issuance of debts).
Considering the cost of any insurance scheme and the possibility of permanent transfers,
Daniel Gros (2014) argues that we should think about creating a shock-absorber mechanism
against large shocks instead of trying to smooth the effects of all shocks. However, his
proposal would probably require the EU fund to be allowed to borrow during very bad times.
This is, again, a more than delicate political matter.
References
Alesina A. and R. Perotti (1995), “Economic risk and political risk in fiscal unions”, NBER
Working Paper No. 4992.
Allard C., P. K. Brooks, J. Bluedorn, F. Bornhorst, K. Christopherson, F. Ohnsorge and T.
Poghosyan (2013a), “Toward a Fiscal Union for the Euro Area”, IMF Staff Discussion Note
13/09.
Allard C., P. K. Brooks, J. Bluedorn, F. Bornhorst, K. Christopherson, F. Ohnsorge and T.
Poghosyan (2013b), “Toward a Fiscal Union for the Euro Area – Technical Background
Notes”, IMF Staff Discussion Note 13/09.
Andor L. (2014), “Basic European Unemployment Insurance - The best way forward in
strengthening the EMU’s resilience and Europe’s recovery”, Intereconomics, Forum
“Designing a European Unemployment Insurance Scheme”, Vol. 49 (4), 184-189.
Artus P., A. Bénassy-Quéré, L. Boone, J. Cailloux, J. Delpla, E. Farhi, P.-O. Gourinchas, J.
Tirole et G. Wolff (2013), « Compléter l’euro », Les notes du Conseil d’analyse économique,
No. 3, Avril.
Asdrubali, P., Sorensen, B. and O. Yosha (1996), “Channels of interstate risk-sharing: US
1963–1990”, The Quarterly Journal of Economics, Vol. 111, Issue 4, November.
Baja-Rubio O. and C. Díaz-Roldán (2003), “Insurance Mechanisms against Asymmetric
Shocks in a Monetary Union: a Proposal with an Application to EMU”, Louvain Economic
Review, 69(1), 73-96.

18
Bargain O., M. Dolls, C. Fuest, D. Neumann, A. Peichl, N. Pestel and S. Siegloch (2013),
“Fiscal union in Europe? Redistributive and stabilizing effects of a European tax-benefit
system and fiscal equalization mechanism”, Economic Policy, Vol. 28, No. 75, 375-422, July.
Beblavý, M., D. Gros and I. Maselli (2015), “Reinsurance of National Unemployment Benefit
Schemes”, CEPS Working Document, No. 401, January.
Beblavý M. and I. Maselli (2014), “An Unemployment Insurance Scheme for the Euro Area:
A simulation exercise of two options”, CEPS Special Report, No. 98, December.
Bernoth K. and P. Engler (2013), “A Transfer Mechanism as a Stabilization Tool in the
EMU”, DIW Economic Bulletin, 3(1), 3-8.
Brandolini A., F. Carta and F. D’Amuri (2014), “A feasible unemployment-based shock
absorber for the euro area”, Banca d’Italia Occasional Paper No. 254, November.
Bucovetsky S. (1998), “Federalism, equalization and risk aversion”, Journal of Public
Economics, 67, 301-28.
Carnot N., P. Evans, S. Fatica and G. Mourre (2015), “Income insurance: a theoretical
exercise with empirical application for the euro area”, European Commission, Economic
Papers No. 546, March.
Casella A. (1992), “Participation in a currency union”, American Economic Review, 847-63.
Caudal N., N. Georges, V. Grossmann-Wirth, J. Guillaume, T. Lellouch and A. Sode (2014),
“Un budget pour la zone euro”, Trésor-Éco, No. 120, Octobre.
Claeys G., Z. Darvas and G. Wolff (2014a), “Benefits and Drawbacks of European
Unemployment Insurance”, Bruegel Policy Brief, No. 2014/06, September.
Clayes G., S. Ganem, P. Hütti and T. Walsh (2014b), Do it yourself European Unemployment
Insurance, Bruegel. http://www.bruegel.org/nc/blog/detail/article/1434-do-it-yourself-
european-unemployment-insurance/#republishing
Dellas H. and G. Tavlas (2009), “An optimum-currency-area odyssey”, Journal of
international money and finance, 28(7), 1117-37.
Dolls M., C. Fuest, D. Neumann and A. Peichl (2013), “Fiscal Integration in the Eurozone:
Economic Effects of Two Key Scenarios”, ZEW Discussion Papers 13-106.
Dolls M., C. Fuest, D. Neumann and A. Peichl (2014), “An Unemployment Insurance Scheme
for the Euro Area? A Comparison of Different Alternatives using Micro Data”, IZA
Discussion Paper No. 8598, October.
Drèze J. and A. Durré (2014), “Fiscal Integration and Growth Stimulation in Europe”,
Louvain Economic Review, 80(2), 5-45.
Dullien S. (2013), A euro-area wide unemployment insurance as an automatic stabilizer: Who
benefits and who pays? Paper prepared for the European Commission, Social Europe.
Dullien S. (2014), “The Macroeconomic Stabilization Impact of a European Basic
Unemployment Insurance Scheme”, Intereconomics, Forum “Designing a European
Unemployment Insurance Scheme”, Vol. 49 (4), 189-193.
Dullien S. and F. Fichtner (2013), “A Common Unemployment Insurance for the Euro Area”,
DIW Economic Bulletin 1, 9-14.
Dullien S. and D. Schwarzer (2009), “Bringing Macroeconomics into the EU Budget Debate:
Why and How?” Journal of Common Market Studies, 47 (1), 153-174.

19
Enderlein H., P. Bofinger, L. Boone, P. de Grauwe, J.-C. Piris, J. Pisani-Ferry, M. J.
Rodriguez, A. Sapir and A. Vitorino (2012), Completing the euro: A road map towards fiscal
union in Europe (Report of the ‘Tommaso Padoa-Schioppa Group’), Notre Europe.
Enderlein H. and E. Rubio (2014), “25 years after the Delors Report: Which lessons for
Economic and Monetary Union?” Policy Paper No. 109, Notre Europe.
Epaulard A. (2014), “Contingent vs. Non-Contingent Unemployment Benefit Scheme for the
EMU”, Contribution to the Conference Economic shock absorbers for the Eurozone,
European Commission, Brussels, June 20.
European Commission (1993), The Economics of Community Public Finance, European
Economy, Reports and Studies, No. 5.
Fichtner F. and P. Haan (2014), “European Unemployment Insurance: Economic Stability
without Major Redistribution of Household Incomes”, DIW Economic Bulletin, 4(10), 39-50,
November.
Gros D. (2014), “A Fiscal Shock Absorber for the Eurozone? Insurance with Deductible”,
Intereconomics, Forum “Designing a European Unemployment Insurance Scheme”, Vol. 49
(4), 199-203.
Guiso L., H. Herrera and M. Morelli (2013), “A culture based theory of fiscal union
desirability”, CAGE Online Working Paper, University of Warwick.
Iara A. (2015), “Revenue for EMU: a contribution to the debate on fiscal union”, European
Commission, Taxation Papers No. 54, March.
Inman R. (2008), “The flypaper effect”, NBER Working Paper No. 14579.
Jara X. and H. Sutherland (2013), “The implications of an EMU unemployment insurance
scheme for supporting incomes”, Research Note 3/2013 of the Social Situation Monitor,
European Commission.
Jara X. and H. Sutherland (2014), “The Effects of an EMU Insurance Scheme on Income in
Unemployment”, Intereconomics, Forum “Designing a European Unemployment Insurance
Scheme”, Vol. 49 (4), 194-199.
Kenen P. B. (1969), “The Theory of Optimum Currency Areas: An Eclectic View”, in R.A.
Mundell and A.K. Swoboda (Eds.), Monetary Problems of the International Economy,
University of Chicago Press, Chicago, 41-60.
Kindleberger C. P. (1986), “International public goods without international government”,
American Economic Review, 76 (1).
Lee K. (1998), “Uncertain income and redistribution in a federal system”, Journal of Public
Economics, 69, 413-33.
Lellouche T. and A. Sode (2014), “An unemployment insurance scheme for the euro area”,
Tresor-Economics, No. 132, June.
Lockwood B. (1999), “Inter-regional insurance”, Journal of Public Economics, 72, 1-37.
Luque, J., Morelli M. and Tavares J. (2014), “A volatility-based theory of fiscal union
desirability”, Journal of Public Economics.
Maselli I., and Beblavý M. (2015), “The case for a European unemployment benefit scheme”,
CEPS Commentary, May 19 (4 pages).

20
Mélitz J. (1993), “Faut-il une assurance communautaire contre des différences de
conjoncture?” Economie et Statistique, No. 262-263, 101-108.
Musgrave R.A. and P.B. Musgrave P.B. (1989), Public finance in theory and practice,
McGraw-Hill, New York.
OFCE (2013), Fiches Régime d’assurance chômage européen, Dossier.
[http://www.ofce.sciences-po.fr/pdf-articles/actu/Assurance-chomage-europeen.pdf]
Persson T. and G. Tabellini (1996a), “Federal Fiscal Constitutions: Risk Sharing and Moral
Hazard”, Econometrica 64, May.
Persson T. and G. Tabellini (1996b), “Federal Fiscal Constitutions: Risk Sharing and
Redistribution” Journal of Political Economy 104 (5), 979–1009.
Picard P. and T. Worrall (2009), “Currency unions and international assistance”, CREA
Discussion Paper 09-01, University of Luxembourg.
Pisani-Ferry J., E. Vihriälä and G. Wolff (2013), “Options for a euro-area fiscal capacity”,
Bruegel Policy Contribution No. 2013/01, January.
Sanguinetti P. and M. Tommasi (2004), “Intergovernmental transfers and fiscal behavior
insurance versus aggregate discipline”, Journal of International Economics, 62, 149-170.
Vallée S. (2014), “From mutual insurance to fiscal federalism. Rebuilding the European
Monetary Union after the demise of the Maastricht architecture”, International Economics,
Vol. 138, August, 49-62.
Von Hagen J. (2007), “Achieving Economic Stabilization by Sharing Risk within Countries”,
in R. Boadway and A. Shah (eds.), Intergovernmental Fiscal Transfers, Washington, DC:
World Bank.
Von Hagen J. and C. Wyplosz (2008), “EMU’s Decentralized System of Fiscal Policy”,
European Economy Economic Papers No. 306.
Wolff B. (2012), “A Budget for Europe’s Monetary Union”, Bruegel Policy Contribution, No.
2012/22, December.

21
Table 1. Net payments from the EU budget (% of GDP)
2000-2014 2005-2014
(our sample)
EU Member States Accumulated net
position Yearly
average Permanent net
position During the 2009
recession Accumulated net
position
Belgium (BE) -3.8 -0.3 yes -0.5 -3.0
Bulgaria (BG) 22.4 1.8 yes 1.7 20.4
Czech Republic (CZ) 11.6 0.8 yes 1.1 11.0
Denmark (DK) -3.1 -0.2 no -0.4 -2.9
Germany (DE) -4.7 -0.3 yes -0.3 -3.3
Estonia (EE) 24.3 2.1 yes 4.1 22.6
Ireland (IE) 18.4 1.5 no 0.0 6.7
Greece (EL) 50.7 3.1 yes 1.3 26.8
Spain (ES) 1.4 0.0 no 0.1 1.6
France (FR) -1.8 -0.1 no -0.3 -2.2
Italy (IT) -2.9 -0.2 no -0.3 -2.4
Cyprus (CY) 2.4 0.2 no 0.0 1.8
Latvia (LV) 26.2 2.2 yes 2.7 24.4
Lithuania (LT) 34.1 2.9 yes 5.5 31.7
Luxembourg (LU) -2.3 -0.2 no -0.3 -1.3
Hungary (HU) 28.2 2.0 yes 2.9 27.3
Malta (MT) 9.9 0.8 yes 0.1 9.0
Netherlands (NL) -5.5 -0.4 no 0.0 -3.7
Austria (AT) -2.9 -0.2 yes -0.1 -2.1
Poland (PL) 19.7 1.5 yes 2.0 18.9
Portugal (PT) 26.7 1.8 yes 1.2 17.5
Romania (RO) 13.4 1.1 yes 1.4 12.4
Slovenia (SI) 10.0 0.7 yes 0.7 9.1
Slovakia (SK) 12.5 1.0 yes 0.8 11.8
Finland (FI) -2.2 -0.1 no -0.3 -2.1
Sweden (SE) -4.4 -0.3 yes 0.0 -3.1
United Kingdom (UK) -2.5 -0.2 no -0.1 -1.9
Net payments are net position or operating budgetary balance: EU expenditure allocated to the Member State minus national contribution to the EU budget. A negative sign denotes a net contribution to the EU budget. The accumulated net position is expressed in terms of 2014 GDP. The permanent net position is derived from the following question: was the Member State a net contributor/recipient each year during the period 2000-2014? Source: own calculations based on European Commission data (EU budget and AMECO)
22
Table 2. Conditions of unemployment insurance benefits in the EU countries (2010)
Countries Gross
replacement rate (%)
Net replacement rate (%)
Statutory coverage ratio
(%)
Effective coverage ratio
(%)
Maximum duration of
benefits (months)
BE 37 64 66 83 unlimited BG 60 76 66 31 12 CZ 50 65 91 31 5 DK 52 57 72 71 24 DE 36 59 67 88 12 EE 50 54 74 35 12 IE 32 38 100 87 12 EL 23 29 100 40 12 ES 53 60 58 63 24 FR 57 66 61 62 24 IT 46 56 53 56 8 CY n.a. n.a. 79 79 n.a. LV 60 87 75 28 9 LT 34 43 67 20 9 LU 80 84 95 51 12 HU 42 53 87 40 9 MT 25 30 88 84 5 NL 75 75 83 65 22 AT 37 55 68 91 9 PL 29 36 54 17 12 PT 58 75 76 57 24 RO 32 45 43 55 12 SI 70 73 80 34 9 SK 50 64 57 11 6 FI 48 53 100 52 23 SE 48 47 96 34 35 UK 10 13 86 62 6
Average 46 56 76 53 14 The gross replacement rate (RR) is computed using the OECD tax-benefit calculator. It is based on the average wage of a single person without any children. The net RR (after tax) is taken from tables of OECD (where data for 2010 are available) and also applies to a single person with no children and earning the average wage The statutory coverage ratio refers to people eligible under legislation for unemployment benefits as a proportion of total labour force. The effective coverage ratio refers to unemployed who actually receive benefits as a proportion of those currently unemployed. Sources: OECD (Tax and benefit indicators. Benefits and wages statistics) for replacement rates and duration of benefits. Social Policy Indicator Database (in Beblávy and Maselli. 2014. table 10) for statutory coverage ratios. ILO (World Social Protection Report 2014/15. table B.3) for effective coverage ratios.

23
Table 3. Main features of proposed or simulated unemployment insurance schemes
Authors Trigger Eligibility Qualifying
period
(months)
Duration of
benefits
(months)
Coverage
ratio
Alpha Replacement rate Contribution
rate
Andor (2014) all time short-term
unemployed
6 0.4
Artus et al. (2013) all time unemployed 1 0.2 0.20*wage bill*structural
unemployement rate
Beblávy & Maselli
(2014)
level of
unemployment
short-term
unemployed
6 0.75 1 0.4 0.005 or experience rating
Beblávy et al.
(2015)
level of
unemployment
short-term
unemployed
12 0.8 1 0.4 with a deductible 0.1% of GDP and experience
rating
Brandolini et al.
(2014)
change in
unemployment
unemployed 3 or 8 1 0.5 or 0.35 experience rating or rate
balancing the fund
Clayes et al.
(2014b)
all time or change
in unemployment
short-term
unemployed
0.4 0.8 0.5 or 0.6 or 0.7 or
0.8
rate balancing the fund or
experience rating
Dolls et al. (2014) all time or level of
unemployment
short-term
unemployed
12 0.5 or 0.7 0.5 0.0157 or experience rating
Dullien (2013) change in
unemployment
short-term
unemployed
12 1 0.8 0.5 0.0166 or 0.0065
Dullien (2014) all time or change
in unemployment
short-term
unemployed
12 0.5 0.8 0.5 0.013 or 0.007
Dullien & Fichtner
(2013)
all time short-term
unemployed
12 0.5 0.8 0.5 0.017 (rate balancing the
fund)
Dullien &
Schwarzer (2009)
all time unemployed 12 6 to 12 1 0.5 0.5 0.02
Epaulard (2014) level of
unemployment
3-13 months
unemployed9 from the 3rd 0.8 0.5 0.5 rate balancing the fund
Fichtner & Haan
(2014)
all time national
criteria
12 or 6 0.7 or 0.3 0.013 or 0.004
Jara & Sutherland
(2014)
all time unemployed 3 8 from the 4th 1 0.33
Lellouche and Sode
(2014)
all time short-term
unemployed
9 or 12 12 national CR minus
half the difference
between national
CR and EA average
1 0.50 rate balancing the fund or
experience rating
OFCE (2013) level or change in
unemployment
unemployed 9 3 to 12 0.5 experience rating or rate
balancing the fund

24
Table 4. Simulated net transfers in the literature (% of GDP)
The net position of the fund corresponds to cumulated net flows. A positive sign denotes a deficit and a minus sign a surplus. For net recipients and contributors, the cumulated flows over the whole period are also considered. In some studies, detailed results are lacking.
Study Sample Period Net position
of the fund
Main net
recipients
Main net
contributors
Permanent net
recipients
Permanent net
contributors
Artus et al. (2013) 12 EA countries 2012 0.2ES (1.3)
EL (1.1)
DE (-0.2)
FI, BE (-0.1)
Beblavý and Maselli (2014) 28 EU countries 1999-2012 0.2ES (5.3)
LV, PL (1.7)
NL (-2.3)
AT (1.1): :
Brandolini et al. (2014) 10 EA countries 2002-2008 0.0FI (0.07)
ES (0.06)
BE, FR, EL, IT, LU
(-0.03): :
Dolls et al. (2014) 18 EA countries 2000-2013 -0.06ES (7.4)
LV (4.6)
NL (-5.8)
AT (-3.5)FR, LV, ES AT, BE, LU, NL
Dullien (2013) 12 EA countries 1995-2011 -4.2FI (1.8)
ES (1.6)
IT (-0.6)
DE, FR, NL (-0.5)none none
Epaulard (2104) 12 EA countries 2000-2015 surplus ES, EL, IE DE, AT, BE noneBE, DE, FR, IT, AT,
FI
Fichtner and Haan (2014) 12 EA countries 1999-2012 :FR (4.1)
EL (3.9), ES (3.8)
FI (-5.7)
SK (-4.2)FR, EL, ES
AT, BE, FI, IT, NL,
SK
Lellouche and Sode (2014)12 EA countries
2000-2012 (-4 €bn)ES (3.3), PT (2.3),
EL (2.2)
FI (-3.1)
AT (-0.8)none none
OFCE (2013) 16 EA countries 2000-2013 0.3EL (6.0)
IE (3.1)
DE (-1.2)
EE (-0.7)none none

25
Table 5. Alternative scenarios – Accumulated net position over 2005-2014 (% of 2014 GDP)
Alpha = 0.80 in all scenarios. Bad times = short term unemployment rises more than 10 percentage points. US trigger = unemployment rate exceeds
5 percent and is 20 percent above the level of the past two years. Net transfers or net position = benefits minus contributions. At the country level, a
positive number means that the country is a net recipient of the fund and a negative number means that it is a net contributor. At the aggregate level (i.e., the global cash position of the fund given by the sum of all national net positions), a positive number means that the fund is in deficit and a
negative number that it is in surplus. All detailed results are in the appendix.
Scenario Baseline Variant 1 Variant 2 Variant 3 Variant 4 Variant 5 Variant 6 Variant 7 Variant 8 Variant 9 Variant 10
RR 0.46 0.56 0.46 or less 0.46 0.46 0.46 0.46 0.46 0.46 0.46 0.46
CR 1 1 1 0.80 1 0.80 1 1 1 1 1
Tau Single Single Single Single Specific Specific Single Specific Single Specific Single
Trigger All time All time All time All time All time All time Bad times Bad times US US All time
BE -1,8 -2,2 -1,6 -1,4 0,3 0,2 0,5 0,2 -2,0 0,0 -0,1
BG -0,7 -0,8 0,7 -0,5 0,2 0,1 0,1 0,1 0,2 -0,2 0,5
CZ -2,7 -3,3 -1,1 -2,2 0,0 0,0 -2,0 -0,4 -0,1 -0,1 -1,2
DK -2,1 -2,5 0,0 -1,7 0,4 0,4 -2,4 -0,5 0,3 -0,1 0,0
DE -3,7 -4,5 -3,3 -3,0 -0,7 -0,6 -1,5 -0,9 -1,9 0,0 -2,0
EE 0,0 0,0 1,6 0,0 -0,2 -0,2 -0,3 -0,5 1,7 -0,2 1,4
IE 0,8 1,0 -0,5 0,7 1,0 0,8 0,6 0,1 2,6 0,2 2,3
EL 6,8 8,3 0,5 5,5 2,3 1,9 2,9 -0,4 7,2 3,2 8,4
ES 17,3 21,0 19,3 13,8 3,9 3,1 6,6 1,1 11,6 1,7 19,1
FR 0,6 0,8 2,7 0,5 0,3 0,2 -0,8 0,4 -2,0 0,0 2,4
IT -0,1 -0,1 1,6 -0,1 0,7 0,5 0,0 0,4 1,6 1,2 1,4
CY 2,1 2,6 3,9 1,7 2,8 2,3 4,1 2,0 6,4 2,3 3,7
LV 3,8 4,7 5,4 3,1 0,1 0,1 1,1 0,2 2,6 0,2 5,2
LT 2,2 2,7 1,0 1,8 0,1 0,1 0,1 -0,5 1,9 -0,1 3,5
LU -5,9 -7,2 -4,2 -4,7 0,2 0,1 -1,4 -0,3 -1,8 0,0 -4,4
HU -0,9 -1,2 0,1 -0,8 0,6 0,5 -1,3 -0,1 1,0 -0,1 0,7
MT -2,8 -3,4 -3,8 -2,2 -0,3 -0,2 -0,8 -0,1 -1,6 0,0 -1,4
NL -3,3 -4,0 -1,3 -2,6 0,8 0,7 0,3 -0,1 -0,8 0,1 -1,5
AT -1,8 -2,2 -1,6 -1,4 0,1 0,1 -1,2 -0,4 -1,8 0,0 -0,2
PL 2,4 2,9 0,1 1,9 -1,3 -1,0 -0,2 -0,1 -0,2 -0,1 3,5
PT 1,7 2,0 3,6 1,3 1,5 1,2 3,2 -0,1 1,2 0,0 3,4
RO -0,4 -0,5 -1,1 -0,3 0,3 0,2 -1,2 -0,4 -1,2 0,0 0,7
SI -2,2 -2,7 -0,1 -1,8 0,9 0,7 -1,8 -0,6 1,1 0,0 -0,4
SK -0,4 -0,4 1,0 -0,3 -0,4 -0,4 -1,3 -0,9 -0,5 -0,1 0,8
FI 1,8 2,2 3,7 1,4 -0,5 -0,4 -1,9 -0,1 -0,6 -0,1 3,5
SE 1,4 1,6 3,1 1,1 0,5 0,4 -0,9 -1,5 -0,7 -0,2 2,9
UK -1,2 -1,4 -6,7 -0,9 0,3 0,2 -1,3 -0,3 -0,8 0,0 0,0
TOTAL 0,4 0,4 0,4 0,3 0,4 0,3 -0,2 -0,1 0,2 0,3 1,9

26
Table 6. Relative variability of GDP under alternative scenario (2005-2014)
Relative variability is computed as the ratio of the coefficient of variation of GDP with transfers (EU unemployment benefits) to the coefficient of
variation of GDP without transfers over the period considered. A value higher than one means that the insurance scheme increases economic
variability while a value below one means that the scheme reduces variability.
Scenario Baseline Variant 1 Variant 2 Variant 3 Variant 4 Variant 5 Variant 6 Variant 7 Variant 8 Variant 9 Variant 10
RR 0.46 0.56 0.46 or less 0.46 0.46 0.46 0.46 0.46 0.46 0.46 0.46
CR 1 1 1 0.80 1 0.80 1 1 1 1 1
Tau Single Single Single Single Specific Specific Single Specific Single Specific Single
Trigger All time All time All time All time All time All time Bad times Bad times US US All time
BE 0,99 0,99 0,99 0,99 1,00 1,00 1,00 1,00 0,98 1,00 0,99
BG 1,00 1,00 1,00 1,00 1,01 1,00 1,00 0,99 1,00 0,99 1,00
CZ 1,00 1,00 1,00 1,00 1,00 1,00 1,00 1,00 1,00 0,99 1,00
DK 1,00 1,01 1,01 1,00 1,00 1,00 0,98 0,99 0,97 0,96 1,00
DE 0,96 0,95 0,97 0,97 0,99 1,00 0,96 0,99 0,98 1,00 0,96
EE 0,99 0,98 0,99 0,99 0,98 0,99 0,99 1,00 0,97 0,97 0,99
IE 0,96 0,95 0,97 0,97 0,99 0,99 1,03 1,07 0,97 1,02 0,96
EL 0,97 0,97 0,99 0,98 1,00 1,00 1,02 1,05 0,97 1,02 0,97
ES 1,08 1,10 1,08 1,07 1,07 1,05 1,15 1,15 1,18 1,16 1,09
FR 0,99 0,99 0,99 0,99 1,00 1,00 1,01 0,98 0,98 1,00 1,00
IT 1,00 1,00 1,01 1,00 1,01 1,01 1,03 1,01 1,00 1,00 1,01
CY 1,02 1,02 1,02 1,01 1,01 1,01 1,02 1,03 1,03 1,03 1,02
LV 0,99 0,99 0,99 0,99 0,99 0,99 1,00 1,01 0,98 0,98 0,99
LT 1,00 1,00 1,00 1,00 0,99 0,99 0,99 1,00 0,98 0,97 1,00
LU 0,99 0,99 0,99 1,00 1,00 1,00 1,00 1,00 0,99 1,00 1,00
HU 0,99 0,99 0,99 0,99 0,98 0,99 0,96 0,95 0,95 0,95 0,99
MT 0,99 0,99 0,99 0,99 1,00 1,00 0,99 1,00 0,99 1,00 0,99
NL 1,01 1,01 1,01 1,00 1,01 1,01 1,02 1,04 1,00 1,03 1,01
AT 0,99 0,98 0,99 0,99 1,00 1,00 1,00 1,02 0,98 1,00 0,99
PL 0,99 0,99 0,99 0,99 1,01 1,01 0,99 0,99 1,00 1,00 0,99
PT 1,01 1,01 1,01 1,01 1,00 1,00 0,99 1,01 1,01 1,08 1,01
RO 1,00 1,00 1,00 1,00 1,00 1,00 1,00 1,00 1,00 1,00 1,00
SI 1,00 1,00 1,00 1,00 1,00 1,00 0,98 1,00 1,01 1,00 1,00
SK 1,00 1,00 1,00 1,00 1,01 1,00 1,00 1,00 1,00 1,00 1,00
FI 0,99 0,99 0,99 0,99 1,02 1,01 0,98 0,98 0,97 0,98 0,99
SE 0,99 0,99 0,99 0,99 0,99 0,99 0,97 0,99 0,97 0,98 0,99
UK 0,98 0,97 0,99 0,98 0,98 0,99 0,98 0,99 0,97 0,98 1,00
TOTAL 0,99 0,99 0,99 0,99 0,99 0,99 0,97 0,97 0,98 0,98 0,99

27
Table 7. Would have net transfers relieved national budgets in 2009?
Source: Eurostat for unemployment benefit expenditure and own simulations for net transfers (see appendix).
Table 8. Unemployment rate and short-term unemployment (%)
Source: own calculations with data from Eurostat.
Baseline Differentiated
rates (Variant 4)
Bad times
(Variant 6)
US system
(Variant 8)
EU25 (Variant
10)
BE 3,8 0,1 0,2 0,9 -0,1 0,2
BG 0,5 -0,1 0,1 0,5 -0,1 0,1
CZ 1,0 0,0 0,4 0,7 0,8 0,2
DK 1,6 0,1 0,6 1,0 1,2 0,0
DE 1,9 -0,1 0,1 0,7 -0,1 0,1
EE 1,2 1,4 1,7 2,2 2,3 1,6
IE 3,0 1,0 1,2 1,8 1,9 1,2
EL 1,6 0,5 0,3 1,1 -0,1 0,6
ES 3,6 2,7 1,8 3,5 3,6 2,8
FR 1,9 0,4 0,3 1,2 -0,1 0,6
IT 0,8 0,1 0,2 0,8 0,9 0,3
CY 1,0 0,1 0,3 0,8 0,9 0,2
LV 1,6 2,1 2,0 2,8 2,9 2,3
LT 0,9 1,4 1,5 2,1 2,2 1,5
LU 1,3 -0,5 0,1 0,3 -0,1 -0,3
HU 1,0 0,2 0,4 1,0 1,1 0,4
MT 0,6 -0,1 0,1 0,6 -0,1 0,1
NL 1,4 -0,3 0,2 0,5 -0,1 -0,1
AT 1,7 0,1 0,2 0,9 -0,1 0,2
PL 0,4 0,4 0,1 1,0 -0,1 0,5
PT 1,4 0,3 0,3 1,1 -0,1 0,5
RO 0,4 0,3 0,3 0,9 -0,1 0,4
SI 0,6 0,0 0,3 0,8 0,9 0,2
SK 1,0 0,4 0,5 1,0 -0,1 0,5
FI 2,4 0,5 0,3 1,4 1,5 0,7
SE 1,3 0,5 0,4 1,3 1,4 0,7
UK 0,8 0,3 0,4 1,2 1,3 0,0
EU27 1,7 0,4 0,4 1,2 0,7 0,5
Unemployment benefit
expenditure in 2009 (%
of GDP)
Simulated net transfers in 2009
2009 2010 2011 2012 2013 2014 Variation 2009-2014 2009 2010 2011 2012 2013 2014 Variation 2009-2014
Belgium 7,9 8,3 7,2 7,6 8,4 8,5 9 55,8 51,2 51,7 55,3 53,9 50,1 -10
Bulgaria 6,8 10,3 11,3 12,3 13 11,4 11 56,7 53,6 44,3 44,8 42,7 39,6 -30
Czech Republic 6,7 7,3 6,7 7 7 6,1 6 70 59,1 59,4 56,6 56,6 56,5 -19
Denmark 6 7,5 7,6 7,5 7 6,6 7 90,5 79,8 75,6 72 74,5 74,8 -17
Germany 7,6 7 5,8 5,4 5,2 5 5 54,5 52,7 52,1 54,6 55,3 55,7 2
Estonia 13,5 16,7 12,3 10 8,6 7,4 7 72,7 54,7 42,7 45,3 55,5 54,7 -25
Ireland 12 13,9 14,7 14,7 13,1 11,3 11 70,9 50,9 40,7 38,3 39,4 40,8 -42
Greece 9,6 12,7 17,9 24,5 27,5 26,5 27 59,6 55,4 50,7 40,9 32,9 26,5 -56
Spain 17,9 19,9 21,4 24,8 26,1 24,5 25 76,2 63,4 58,4 55,6 50,3 47,2 -38
France 9,1 9,3 9,2 9,8 10,3 10,3 10 64,8 59,8 58,5 59,6 59,6 57,3 -12
Italy 7,7 8,4 8,4 10,7 12,1 12,7 13 55,4 51,5 48 46,8 43,1 38,6 -30
Cyprus 5,4 6,3 7,9 11,9 15,9 16,1 16 89,6 79,6 79,2 69,9 61,7 52,3 -42
Latvia 17,5 19,5 16,2 15 11,9 10,8 11 74,2 55 45,5 47,9 51,4 57 -23
Lithuania 13,8 17,8 15,4 13,4 11,8 10,7 11 76,3 58,3 47,9 50,8 57,1 55,3 -28
Luxembourg 5,1 4,6 4,8 5,1 5,9 5,9 6 76,9 70,7 71,2 69,7 69,6 72,6 -6
Hungary 10 11,2 11 11 10,2 7,7 8 58,5 51 52,4 54,7 51,4 52,5 -10
Malta 6,9 6,9 6,4 6,3 6,4 5,9 6 58 55,1 52,7 51,5 54,3 53,2 -8
Netherlands 4,4 5 5 5,8 7,3 7,4 7 75,2 72,4 66,5 66 63,9 59,8 -20
Austria 5,3 4,8 4,6 4,9 5,4 5,6 6 78,3 74,6 73,7 75,1 75,4 72,8 -7
Poland 8,1 9,7 9,7 10,1 10,3 9 9 69,7 68,9 62,8 59,7 57,5 57,3 -18
Portugal 10,7 12 12,9 15,8 16,4 14,1 14 55,8 47,8 51,6 51,2 43,6 40,4 -28
Romania 6,5 7 7,2 6,8 7,1 6,8 7 68,4 65,5 59 55,8 54,8 58,9 -14
Slovenia 5,9 7,3 8,2 8,9 10,1 9,7 10 69,9 56,7 55,8 52,1 49 45,5 -35
Slovakia 12,1 14,5 13,7 14 14,2 13,2 13 46 36 32,1 32,7 29,8 29,8 -35
Finland 8,2 8,4 7,8 7,7 8,2 8,7 9 83,2 76 77,8 78,6 79,3 77,6 -7
Sweden 8,3 8,6 7,8 8 8 7,9 8 86,7 81,4 80,4 81,1 81,5 81,1 -6
United Kingdom 7,6 7,8 8,1 7,9 7,6 6,1 6 75,4 67,4 66,5 65,3 63,8 64,2 -15
EU27 9 9,6 9,6 10,4 10,8 10,2 10 66,8 60,1 57,2 55,7 52,8 50,6 -24
Unemploymen rate (%) Share of short-term unemployment (%)

28
Appendix
Table A1. Baseline
Net position (€ million)
Net position (% of GDP)
Baseline: α = 0.80; RR = 0.46; CR = 1; τ = single rate (ranging from 0.02 in 2008-2009 to 0.027 in 2012-2014). Trigger = all time. The accumulated
net position (benefits minus contributions) is expressed in terms of 2004 GDP. At the country level, a positive (negative) number means that the country is a net recipient of (contributor to) the fund. At the aggregate level (global cash position of the fund given by the sum of all national net
positions), a positive (negative) number means that the fund is in deficit (surplus). Relative variability is computed as the ratio of the coefficient of variation of GDP with EU unemployment benefits to that of GDP without transfers over the whole period.
2005 2006 2007 2008 2009 2010 2011 2012 2013 2014Accumulated net
positionBE -300 -443 -664 -581 178 -364 -1 469 -1 390 -951 -1 241 -7 224
BG -15 -26 -85 -97 -24 52 -19 -1 13 -72 -274
CZ -194 -346 -558 -699 60 -173 -456 -578 -547 -680 -4 171
DK -647 -1 042 -1 054 -1 088 324 334 -130 -536 -645 -847 -5 330
DE 1 388 -2 867 -6 476 -6 658 -2 652 -8 629 -16 829 -20 546 -21 074 -22 804 -107 147
EE -26 -52 -85 -35 195 163 0 -45 -39 -80 -4
IE -534 -581 -499 161 1 752 972 397 159 -16 -273 1 539
EL 553 205 242 251 1 132 1 548 2 307 2 668 2 122 1 212 12 241
ES 5 572 4 955 5 287 14 108 28 714 25 132 24 077 27 595 26 280 20 875 182 596
FR 1 814 963 -248 66 7 085 3 214 -460 413 859 -467 13 238
IT -452 -2 333 -3 075 -801 2 016 715 -2 037 1 036 2 445 1 261 -1 224
CY -13 -32 -46 -47 18 12 45 121 182 128 368
LV 16 -6 -21 66 394 252 94 77 25 26 924
LT -18 -70 -105 -3 373 342 134 74 72 17 816
LU -186 -210 -245 -226 -187 -286 -336 -376 -364 -371 -2 789
HU -192 -184 -232 -134 226 101 5 -4 -161 -409 -981
MT -13 -9 -11 -14 -5 -15 -31 -40 -38 -47 -223
NL -1 589 -2 680 -3 233 -3 343 -1 850 -1 528 -2 879 -2 410 -699 -1 122 -21 334
AT -15 -301 -434 -623 223 -528 -1 124 -1 217 -922 -915 -5 857
PL 2 160 1 272 406 552 1 148 1 742 982 737 710 14 9 721
PT -169 -257 -75 -98 506 272 635 1 111 811 160 2 896
RO -95 -157 -145 -76 343 167 -74 -216 -194 -190 -636
SI -70 -115 -158 -167 -10 -46 -55 -78 -32 -83 -815
SK 46 -81 -127 -126 237 153 -46 -63 -101 -170 -275
FI 513 330 166 212 982 582 191 8 260 383 3 627
SE 1 025 521 109 370 1 634 1 294 304 143 278 142 5 820
UK -5 070 -3 759 -4 326 -1 590 5 234 1 570 -412 -3 126 -4 582 -9 835 -25 896
Total 3 489 -7 304 -15 692 -620 48 045 27 048 2 815 3 518 3 691 -15 387 49 603
Accumulated
net position3 489 -3 815 -19 508 -20 128 27 918 54 965 57 780 61 299 64 990 49 603
2005 2006 2007 2008 2009 2010 2011 2012 2013 2014Accumulated net
position
Relative
variabilityBE -0,10 -0,14 -0,19 -0,16 0,05 -0,10 -0,39 -0,36 -0,24 -0,31 -1,80 0,99
BG -0,06 -0,10 -0,27 -0,27 -0,07 0,14 -0,05 0,00 0,03 -0,17 -0,65 1,00
CZ -0,18 -0,28 -0,40 -0,43 0,04 -0,11 -0,28 -0,36 -0,35 -0,44 -2,69 1,00
DK -0,30 -0,46 -0,45 -0,45 0,14 0,14 -0,05 -0,21 -0,26 -0,33 -2,07 1,00
DE 0,06 -0,12 -0,26 -0,26 -0,11 -0,33 -0,62 -0,75 -0,75 -0,79 -3,69 0,96
EE -0,24 -0,38 -0,52 -0,21 1,38 1,11 0,00 -0,25 -0,21 -0,41 -0,02 0,99
IE -0,32 -0,32 -0,25 0,09 1,04 0,59 0,23 0,09 -0,01 -0,15 0,83 0,96
EL 0,28 0,09 0,10 0,10 0,48 0,68 1,11 1,37 1,16 0,68 6,84 0,97
ES 0,60 0,49 0,49 1,26 2,66 2,33 2,24 2,62 2,50 1,97 17,25 1,08
FR 0,10 0,05 -0,01 0,00 0,37 0,16 -0,02 0,02 0,04 -0,02 0,62 0,99
IT -0,03 -0,15 -0,19 -0,05 0,13 0,04 -0,12 0,06 0,15 0,08 -0,08 1,00
CY -0,09 -0,20 -0,27 -0,25 0,10 0,07 0,23 0,62 1,00 0,73 2,10 1,02
LV 0,12 -0,03 -0,09 0,27 2,09 1,40 0,47 0,35 0,11 0,11 3,84 0,99
LT -0,09 -0,29 -0,36 -0,01 1,38 1,22 0,43 0,22 0,21 0,05 2,25 1,00
LU -0,62 -0,63 -0,68 -0,60 -0,52 -0,73 -0,79 -0,86 -0,80 -0,79 -5,92 0,99
HU -0,21 -0,20 -0,23 -0,12 0,24 0,10 0,01 0,00 -0,16 -0,40 -0,95 0,99
MT -0,24 -0,16 -0,20 -0,23 -0,09 -0,23 -0,45 -0,55 -0,50 -0,59 -2,81 0,99
NL -0,29 -0,47 -0,53 -0,53 -0,30 -0,24 -0,45 -0,38 -0,11 -0,17 -3,26 1,01
AT -0,01 -0,11 -0,15 -0,21 0,08 -0,18 -0,36 -0,38 -0,29 -0,28 -1,78 0,99
PL 0,88 0,47 0,13 0,15 0,36 0,48 0,26 0,19 0,18 0,00 2,35 0,99
PT -0,11 -0,15 -0,04 -0,05 0,29 0,15 0,36 0,66 0,48 0,09 1,67 1,01
RO -0,12 -0,16 -0,12 -0,05 0,28 0,13 -0,06 -0,16 -0,13 -0,13 -0,42 1,00
SI -0,24 -0,36 -0,45 -0,44 -0,03 -0,13 -0,15 -0,22 -0,09 -0,22 -2,19 1,00
SK 0,12 -0,18 -0,23 -0,19 0,37 0,23 -0,07 -0,09 -0,14 -0,23 -0,37 1,00
FI 0,31 0,19 0,09 0,11 0,54 0,31 0,10 0,00 0,13 0,19 1,78 0,99
SE 0,33 0,16 0,03 0,10 0,53 0,35 0,07 0,03 0,06 0,03 1,36 0,99
UK -0,26 -0,18 -0,20 -0,08 0,31 0,09 -0,02 -0,15 -0,23 -0,44 -1,17 0,98
Total 0,03 -0,06 -0,12 0,00 0,39 0,21 0,02 0,03 0,03 -0,11 0,36 0,99
Accumulated
net position0,03 -0,03 -0,15 -0,16 0,23 0,43 0,44 0,46 0,48 0,36

29
Table A2. Variant 1
Net position (€ million)
Net position (% of GDP)
Baseline except RR = 0.56
2005 2006 2007 2008 2009 2010 2011 2012 2013 2014Accumulated net
positionBE -366 -539 -808 -707 217 -443 -1 789 -1 692 -1 158 -1 510 -8 795
BG -18 -31 -104 -118 -30 63 -23 -2 16 -87 -334
CZ -237 -422 -679 -850 73 -210 -555 -704 -666 -827 -5 078
DK -787 -1 268 -1 283 -1 324 394 406 -158 -652 -785 -1 032 -6 489
DE 1 690 -3 491 -7 884 -8 106 -3 229 -10 505 -20 488 -25 012 -25 655 -27 761 -130 440
EE -32 -63 -103 -42 237 198 0 -55 -48 -97 -5
IE -651 -708 -607 196 2 133 1 183 483 194 -19 -332 1 873
EL 673 250 295 305 1 378 1 884 2 809 3 248 2 584 1 475 14 902
ES 6 783 6 033 6 437 17 175 34 956 30 595 29 312 33 594 31 993 25 414 222 290
FR 2 208 1 172 -302 80 8 626 3 913 -560 502 1 045 -568 16 116
IT -551 -2 840 -3 744 -975 2 455 871 -2 480 1 261 2 976 1 535 -1 490
CY -16 -38 -56 -57 22 15 55 147 222 155 448
LV 20 -7 -25 80 480 307 114 94 30 32 1 124
LT -22 -85 -127 -4 454 417 163 90 88 20 993
LU -226 -256 -299 -275 -228 -349 -409 -458 -444 -452 -3 395
HU -233 -223 -282 -163 275 123 7 -5 -195 -497 -1 195
MT -15 -11 -14 -17 -7 -19 -38 -48 -46 -57 -272
NL -1 934 -3 263 -3 936 -4 070 -2 252 -1 861 -3 504 -2 934 -851 -1 366 -25 972
AT -19 -367 -528 -759 272 -643 -1 368 -1 481 -1 123 -1 114 -7 130
PL 2 630 1 548 494 672 1 398 2 120 1 195 897 864 17 11 834
PT -206 -313 -92 -119 616 331 773 1 353 987 195 3 526
RO -116 -192 -176 -92 418 203 -90 -262 -236 -231 -775
SI -86 -140 -192 -204 -13 -56 -67 -95 -39 -101 -992
SK 56 -98 -155 -153 289 186 -56 -76 -123 -206 -335
FI 625 401 203 259 1 196 708 233 10 316 466 4 416
SE 1 247 634 132 450 1 989 1 576 369 174 339 173 7 085
UK -6 173 -4 577 -5 266 -1 936 6 372 1 911 -501 -3 806 -5 578 -11 973 -31 526
Total 4 247 -8 892 -19 103 -755 58 490 32 927 3 427 4 283 4 493 -18 732 60 386
Accumulated
net position4 247 -4 645 -23 748 -24 503 33 987 66 914 70 341 74 624 79 118 60 386
2005 2006 2007 2008 2009 2010 2011 2012 2013 2014Accumulated net
position
Relative
variabilityBE -0,12 -0,16 -0,23 -0,20 0,06 -0,12 -0,47 -0,44 -0,29 -0,38 -2,19 0,99
BG -0,08 -0,12 -0,33 -0,32 -0,08 0,17 -0,06 0,00 0,04 -0,21 -0,79 1,00
CZ -0,22 -0,34 -0,49 -0,53 0,05 -0,13 -0,34 -0,44 -0,42 -0,53 -3,28 1,00
DK -0,37 -0,56 -0,55 -0,55 0,17 0,17 -0,06 -0,26 -0,31 -0,40 -2,52 1,01
DE 0,07 -0,15 -0,31 -0,32 -0,13 -0,41 -0,76 -0,91 -0,91 -0,96 -4,49 0,95
EE -0,29 -0,46 -0,64 -0,26 1,68 1,35 0,00 -0,31 -0,25 -0,50 -0,02 0,98
IE -0,38 -0,39 -0,31 0,10 1,27 0,72 0,28 0,11 -0,01 -0,18 1,01 0,95
EL 0,34 0,11 0,13 0,13 0,58 0,83 1,35 1,67 1,42 0,82 8,32 0,97
ES 0,73 0,60 0,60 1,54 3,24 2,83 2,73 3,18 3,05 2,40 21,00 1,10
FR 0,12 0,06 -0,02 0,00 0,44 0,20 -0,03 0,02 0,05 -0,03 0,75 0,99
IT -0,04 -0,18 -0,23 -0,06 0,16 0,05 -0,15 0,08 0,18 0,09 -0,09 1,00
CY -0,11 -0,24 -0,32 -0,30 0,12 0,08 0,28 0,76 1,22 0,89 2,56 1,02
LV 0,15 -0,04 -0,11 0,33 2,55 1,70 0,57 0,42 0,13 0,13 4,67 0,99
LT -0,11 -0,35 -0,44 -0,01 1,68 1,49 0,52 0,27 0,25 0,06 2,74 1,00
LU -0,76 -0,77 -0,83 -0,73 -0,63 -0,89 -0,96 -1,04 -0,98 -0,96 -7,21 0,99
HU -0,26 -0,25 -0,28 -0,15 0,29 0,13 0,01 -0,01 -0,19 -0,48 -1,16 0,99
MT -0,30 -0,20 -0,24 -0,28 -0,11 -0,28 -0,55 -0,67 -0,61 -0,72 -3,42 0,99
NL -0,36 -0,57 -0,65 -0,64 -0,36 -0,29 -0,55 -0,46 -0,13 -0,21 -3,96 1,01
AT -0,01 -0,14 -0,19 -0,26 0,09 -0,22 -0,44 -0,47 -0,35 -0,34 -2,17 0,98
PL 1,07 0,57 0,16 0,18 0,44 0,59 0,32 0,23 0,22 0,00 2,86 0,99
PT -0,13 -0,19 -0,05 -0,07 0,35 0,18 0,44 0,80 0,58 0,11 2,04 1,01
RO -0,14 -0,19 -0,14 -0,06 0,35 0,16 -0,07 -0,20 -0,16 -0,15 -0,52 1,00
SI -0,29 -0,44 -0,55 -0,54 -0,04 -0,16 -0,18 -0,26 -0,11 -0,27 -2,66 1,00
SK 0,14 -0,22 -0,28 -0,23 0,45 0,28 -0,08 -0,11 -0,17 -0,27 -0,45 1,00
FI 0,38 0,23 0,11 0,13 0,66 0,38 0,12 0,00 0,16 0,23 2,16 0,99
SE 0,40 0,19 0,04 0,13 0,64 0,43 0,09 0,04 0,08 0,04 1,65 0,99
UK -0,32 -0,22 -0,24 -0,10 0,38 0,11 -0,03 -0,19 -0,28 -0,54 -1,42 0,97
Total 0,04 -0,07 -0,15 -0,01 0,48 0,26 0,03 0,03 0,03 -0,13 0,43 0,99
Accumulated
net position0,04 -0,04 -0,18 -0,19 0,28 0,53 0,54 0,56 0,59 0,43

30
Table A3. Variant 2
Net position (€ million)
Net position (% of GDP)
Baseline except RR = 0.46 or the national gross RR if it is below the EU average.
2005 2006 2007 2008 2009 2010 2011 2012 2013 2014Accumulated net
positionBE -258 -388 -544 -446 158 -332 -1 279 -1 237 -890 -1 152 -6 368
BG 18 10 -42 -46 28 110 45 70 89 3 286
CZ -16 -146 -332 -432 296 89 -166 -273 -255 -403 -1 639
DK -208 -578 -552 -563 829 866 440 73 -38 -239 30
DE 427 -3 028 -5 699 -5 613 -2 512 -7 657 -14 572 -17 717 -18 197 -19 821 -94 390
EE -6 -27 -54 -1 224 192 33 -8 1 -38 314
IE -533 -591 -537 -62 1 062 491 50 -135 -265 -469 -988
EL -176 -395 -395 -377 61 205 557 754 546 75 855
ES 7 385 6 916 7 451 16 415 30 899 27 383 26 412 29 919 28 520 23 087 204 386
FR 5 502 4 801 3 810 4 228 11 116 7 539 4 231 5 462 5 905 4 520 57 115
IT 1 873 91 -519 1 833 4 542 3 386 822 4 013 5 352 4 119 25 512
CY 12 -5 -17 -16 48 45 81 157 214 157 677
LV 39 23 20 113 428 283 129 117 68 72 1 293
LT -26 -68 -95 -20 261 234 73 24 21 -24 379
LU -127 -147 -174 -150 -112 -205 -245 -276 -261 -266 -1 962
HU -83 -78 -106 -7 302 189 103 97 -47 -276 94
MT -20 -19 -20 -22 -17 -26 -38 -46 -46 -53 -306
NL -508 -1 563 -2 028 -2 077 -610 -238 -1 483 -913 783 335 -8 301
AT -25 -266 -357 -485 191 -455 -977 -1 069 -838 -856 -5 138
PL 1 017 403 -178 -133 324 542 -57 -286 -320 -800 512
PT 140 60 260 246 839 625 993 1 460 1 158 500 6 283
RO -142 -206 -211 -170 144 -3 -192 -303 -294 -304 -1 682
SI -11 -51 -87 -89 64 33 28 7 52 -2 -55
SK 105 -14 -45 -30 333 257 69 62 24 -41 720
FI 831 663 524 591 1 344 966 616 472 721 834 7 562
SE 1 601 1 125 771 1 035 2 216 1 992 1 126 1 080 1 234 1 061 13 240
UK -13 864 -14 815 -15 332 -12 167 -9 178 -12 370 -14 575 -17 742 -17 685 -20 510 -148 240
Total 2 947 -8 294 -14 487 1 555 43 279 24 138 2 224 3 763 5 552 -10 490 50 188
Accumulated
net position2 947 -5 347 -19 834 -18 279 25 000 49 138 51 362 55 125 60 678 50 188
2005 2006 2007 2008 2009 2010 2011 2012 2013 2014Accumulated net
position
Relative
variabilityBE -0,08 -0,12 -0,16 -0,13 0,05 -0,09 -0,34 -0,32 -0,23 -0,29 -1,58 0,99
BG 0,08 0,04 -0,13 -0,13 0,08 0,30 0,11 0,17 0,22 0,01 0,68 1,00
CZ -0,01 -0,12 -0,24 -0,27 0,20 0,06 -0,10 -0,17 -0,16 -0,26 -1,06 1,00
DK -0,10 -0,26 -0,24 -0,23 0,36 0,36 0,18 0,03 -0,01 -0,09 0,01 1,01
DE 0,02 -0,13 -0,23 -0,22 -0,10 -0,30 -0,54 -0,64 -0,65 -0,68 -3,25 0,97
EE -0,06 -0,20 -0,33 -0,01 1,58 1,30 0,20 -0,04 0,00 -0,19 1,61 0,99
IE -0,31 -0,32 -0,27 -0,03 0,63 0,30 0,03 -0,08 -0,15 -0,25 -0,53 0,97
EL -0,09 -0,18 -0,17 -0,16 0,03 0,09 0,27 0,39 0,30 0,04 0,48 0,99
ES 0,79 0,69 0,69 1,47 2,86 2,53 2,46 2,84 2,72 2,18 19,31 1,08
FR 0,31 0,26 0,20 0,21 0,57 0,38 0,21 0,26 0,28 0,21 2,67 0,99
IT 0,13 0,01 -0,03 0,11 0,29 0,21 0,05 0,25 0,33 0,25 1,58 1,01
CY 0,08 -0,03 -0,10 -0,08 0,26 0,24 0,41 0,81 1,18 0,89 3,87 1,02
LV 0,28 0,13 0,09 0,46 2,27 1,57 0,64 0,53 0,29 0,30 5,37 0,99
LT -0,13 -0,28 -0,33 -0,06 0,97 0,83 0,23 0,07 0,06 -0,07 1,05 1,00
LU -0,43 -0,44 -0,48 -0,40 -0,31 -0,52 -0,58 -0,63 -0,58 -0,56 -4,17 0,99
HU -0,09 -0,09 -0,10 -0,01 0,32 0,19 0,10 0,10 -0,05 -0,27 0,09 0,99
MT -0,38 -0,35 -0,35 -0,35 -0,28 -0,39 -0,55 -0,64 -0,61 -0,66 -3,84 0,99
NL -0,09 -0,27 -0,33 -0,33 -0,10 -0,04 -0,23 -0,14 0,12 0,05 -1,27 1,01
AT -0,01 -0,10 -0,13 -0,17 0,07 -0,15 -0,32 -0,34 -0,26 -0,26 -1,56 0,99
PL 0,42 0,15 -0,06 -0,04 0,10 0,15 -0,02 -0,07 -0,08 -0,19 0,12 0,99
PT 0,09 0,04 0,15 0,14 0,48 0,35 0,56 0,87 0,68 0,29 3,63 1,01
RO -0,18 -0,21 -0,17 -0,12 0,12 0,00 -0,14 -0,23 -0,20 -0,20 -1,12 1,00
SI -0,04 -0,16 -0,25 -0,23 0,18 0,09 0,08 0,02 0,14 0,00 -0,15 1,00
SK 0,27 -0,03 -0,08 -0,04 0,52 0,38 0,10 0,09 0,03 -0,05 0,96 1,00
FI 0,51 0,38 0,28 0,31 0,74 0,52 0,31 0,24 0,36 0,41 3,71 0,99
SE 0,51 0,34 0,22 0,29 0,72 0,54 0,28 0,26 0,28 0,25 3,08 0,99
UK -0,71 -0,72 -0,71 -0,64 -0,55 -0,68 -0,78 -0,87 -0,88 -0,92 -6,67 0,99
Total 0,03 -0,07 -0,11 0,01 0,35 0,19 0,02 0,03 0,04 -0,08 0,36 0,99
Accumulated
net position0,03 -0,04 -0,15 -0,14 0,20 0,39 0,39 0,41 0,45 0,36

31
Table A4. Variant 3
Net position (€ million)
Net position (% of GDP)
Baseline except CR = 0.80.
2005 2006 2007 2008 2009 2010 2011 2012 2013 2014Accumulated net
positionBE -240 -354 -531 -465 143 -291 -1 176 -1 112 -761 -993 -5 779
BG -12 -21 -68 -78 -19 42 -15 -1 10 -57 -219
CZ -156 -277 -446 -559 48 -138 -365 -463 -438 -544 -3 337
DK -517 -834 -843 -870 259 267 -104 -429 -516 -678 -4 264
DE 1 111 -2 294 -5 181 -5 327 -2 122 -6 903 -13 463 -16 436 -16 859 -18 243 -85 718
EE -21 -41 -68 -28 156 130 0 -36 -31 -64 -3
IE -428 -465 -399 129 1 402 778 318 127 -13 -218 1 231
EL 442 164 194 201 905 1 238 1 846 2 134 1 698 969 9 792
ES 4 458 3 964 4 230 11 287 22 971 20 105 19 262 22 076 21 024 16 700 146 077
FR 1 451 770 -198 53 5 668 2 571 -368 330 687 -373 10 591
IT -362 -1 866 -2 460 -641 1 613 572 -1 629 829 1 956 1 009 -979
CY -11 -25 -37 -37 14 10 36 97 146 102 294
LV 13 -5 -17 53 315 202 75 62 20 21 739
LT -15 -56 -84 -3 298 274 107 59 58 13 653
LU -149 -168 -196 -181 -150 -229 -269 -301 -292 -297 -2 231
HU -153 -147 -185 -107 181 81 4 -4 -128 -327 -785
MT -10 -7 -9 -11 -4 -12 -25 -32 -30 -38 -179
NL -1 271 -2 144 -2 587 -2 675 -1 480 -1 223 -2 303 -1 928 -559 -898 -17 067
AT -12 -241 -347 -499 178 -422 -899 -974 -738 -732 -4 686
PL 1 728 1 017 324 442 918 1 393 785 589 568 11 7 777
PT -135 -206 -60 -79 405 218 508 889 649 128 2 317
RO -76 -126 -116 -61 274 133 -59 -172 -155 -152 -509
SI -56 -92 -126 -134 -8 -37 -44 -63 -25 -66 -652
SK 37 -64 -102 -100 190 122 -37 -50 -81 -136 -220
FI 411 264 133 170 786 465 153 6 208 306 2 902
SE 820 417 87 296 1 307 1 036 243 115 223 114 4 656
UK -4 056 -3 007 -3 461 -1 272 4 187 1 256 -329 -2 501 -3 666 -7 868 -20 717
Total 2 791 -5 843 -12 554 -496 38 436 21 638 2 252 2 814 2 953 -12 310 39 682
Accumulated
net position2 791 -3 052 -15 606 -16 102 22 334 43 972 46 224 49 039 51 992 39 682
2005 2006 2007 2008 2009 2010 2011 2012 2013 2014Accumulated net
position
Relative
variabilityBE -0,08 -0,11 -0,15 -0,13 0,04 -0,08 -0,31 -0,29 -0,19 -0,25 -1,44 0,99
BG -0,05 -0,08 -0,21 -0,21 -0,05 0,11 -0,04 0,00 0,03 -0,14 -0,52 1,00
CZ -0,14 -0,22 -0,32 -0,35 0,03 -0,09 -0,22 -0,29 -0,28 -0,35 -2,15 1,00
DK -0,24 -0,37 -0,36 -0,36 0,11 0,11 -0,04 -0,17 -0,20 -0,26 -1,66 1,00
DE 0,05 -0,10 -0,21 -0,21 -0,09 -0,27 -0,50 -0,60 -0,60 -0,63 -2,95 0,97
EE -0,19 -0,31 -0,42 -0,17 1,10 0,89 0,00 -0,20 -0,17 -0,33 -0,02 0,99
IE -0,25 -0,25 -0,20 0,07 0,83 0,47 0,19 0,07 -0,01 -0,12 0,66 0,97
EL 0,22 0,08 0,08 0,08 0,38 0,55 0,89 1,10 0,93 0,54 5,47 0,98
ES 0,48 0,39 0,39 1,01 2,13 1,86 1,79 2,09 2,00 1,58 13,80 1,07
FR 0,08 0,04 -0,01 0,00 0,29 0,13 -0,02 0,02 0,03 -0,02 0,49 0,99
IT -0,02 -0,12 -0,15 -0,04 0,10 0,04 -0,10 0,05 0,12 0,06 -0,06 1,00
CY -0,07 -0,16 -0,21 -0,20 0,08 0,05 0,18 0,50 0,80 0,58 1,68 1,01
LV 0,10 -0,03 -0,07 0,22 1,68 1,12 0,37 0,28 0,08 0,09 3,07 0,99
LT -0,07 -0,23 -0,29 -0,01 1,11 0,98 0,34 0,18 0,17 0,04 1,80 1,00
LU -0,50 -0,51 -0,55 -0,48 -0,42 -0,58 -0,63 -0,69 -0,64 -0,63 -4,74 1,00
HU -0,17 -0,16 -0,18 -0,10 0,19 0,08 0,00 0,00 -0,13 -0,32 -0,76 0,99
MT -0,20 -0,13 -0,16 -0,19 -0,07 -0,19 -0,36 -0,44 -0,40 -0,47 -2,24 0,99
NL -0,24 -0,37 -0,42 -0,42 -0,24 -0,19 -0,36 -0,30 -0,09 -0,14 -2,60 1,00
AT 0,00 -0,09 -0,12 -0,17 0,06 -0,14 -0,29 -0,31 -0,23 -0,22 -1,42 0,99
PL 0,71 0,37 0,10 0,12 0,29 0,39 0,21 0,15 0,14 0,00 1,88 0,99
PT -0,09 -0,12 -0,03 -0,04 0,23 0,12 0,29 0,53 0,38 0,07 1,34 1,01
RO -0,09 -0,13 -0,09 -0,04 0,23 0,11 -0,04 -0,13 -0,11 -0,10 -0,34 1,00
SI -0,19 -0,29 -0,36 -0,35 -0,02 -0,10 -0,12 -0,17 -0,07 -0,18 -1,75 1,00
SK 0,09 -0,14 -0,18 -0,15 0,30 0,18 -0,05 -0,07 -0,11 -0,18 -0,29 1,00
FI 0,25 0,15 0,07 0,09 0,43 0,25 0,08 0,00 0,10 0,15 1,42 0,99
SE 0,26 0,12 0,02 0,08 0,42 0,28 0,06 0,03 0,05 0,03 1,08 0,99
UK -0,21 -0,15 -0,16 -0,07 0,25 0,07 -0,02 -0,12 -0,18 -0,35 -0,93 0,98
Total 0,02 -0,05 -0,10 0,00 0,32 0,17 0,02 0,02 0,02 -0,09 0,29 0,99
Accumulated
net position0,02 -0,03 -0,12 -0,12 0,18 0,35 0,35 0,37 0,39 0,29

32
Table A5. Variant 4
Net position (€ million)
Net position (% of GDP)
Baseline except tau is country-specific (e.g. ranging from 0.008 for Luxembourg in 2008-2009 to 0.077 for Spain in 2014).
2005 2006 2007 2008 2009 2010 2011 2012 2013 2014Accumulated net
positionBE 249 32 -201 -263 540 332 -415 42 541 180 1 037
BG -64 -35 -80 -54 46 157 66 60 30 -61 66
CZ -24 -148 -294 -289 549 360 101 -102 -38 -144 -29
DK -120 -473 -275 -212 1 272 1 180 548 -153 -294 -321 1 153
DE 3 737 -1 798 -5 321 -5 256 1 229 -869 -5 000 -4 572 -2 195 -1 214 -21 259
EE -37 -50 -51 29 243 152 -77 -144 -70 -42 -47
IE -23 20 133 679 1 948 677 -199 -552 -411 -427 1 845
EL 83 -264 -244 -219 768 1 155 1 742 1 576 487 -888 4 195
ES -1 204 -1 795 -1 394 7 356 19 444 10 124 4 367 5 661 3 291 -4 261 41 589
FR -532 -726 -2 258 -1 989 5 475 2 660 296 1 613 1 728 -156 6 112
IT 81 -1 693 -2 174 574 3 306 2 481 -22 3 553 3 690 1 128 10 923
CY 31 4 -16 -20 53 53 84 129 143 33 494
LV -47 -54 -53 58 372 155 -78 -152 -127 -45 28
LT -106 -120 -82 69 415 284 -47 -178 -109 -80 45
LU 12 -6 -33 3 39 -14 2 9 42 35 88
HU 123 98 21 41 341 221 125 70 -115 -330 595
MT -5 1 0 -5 3 1 -6 -7 -1 -5 -22
NL 514 -893 -1 255 -914 1 048 1 898 727 1 125 2 202 1 081 5 533
AT 266 -90 -306 -501 524 9 -206 -66 373 319 321
PL -897 -1 616 -2 151 -1 377 255 1 217 331 -78 -247 -757 -5 319
PT 172 -4 183 -15 544 308 749 1 011 320 -635 2 634
RO -35 -10 12 54 410 209 -22 -168 -68 6 388
SI 46 -7 -47 -52 125 104 97 37 60 -19 344
SK -131 -219 -196 -78 342 204 -35 -72 -69 -79 -334
FI -687 -641 -568 -270 615 278 -37 -195 164 280 -1 060
SE 1 337 292 -536 -408 1 130 827 -237 -333 -24 -4 2 042
UK -106 2 246 849 1 345 6 704 3 396 1 736 -1 081 -2 093 -6 268 6 726
Total 2 632 -7 949 -16 338 -1 714 47 739 27 559 4 591 7 033 7 210 -12 674 58 088
Accumulated
net position2 632 -5 317 -21 655 -23 369 24 370 51 929 56 520 63 552 70 762 58 088
2005 2006 2007 2008 2009 2010 2011 2012 2013 2014Accumulated net
position
Relative
variabilityBE 0,08 0,01 -0,06 -0,07 0,15 0,09 -0,11 0,01 0,14 0,04 0,26 1,00
BG -0,27 -0,13 -0,25 -0,15 0,13 0,43 0,16 0,15 0,07 -0,14 0,16 1,01
CZ -0,02 -0,12 -0,21 -0,18 0,37 0,23 0,06 -0,06 -0,02 -0,09 -0,02 1,00
DK -0,06 -0,21 -0,12 -0,09 0,55 0,49 0,22 -0,06 -0,12 -0,12 0,45 1,00
DE 0,16 -0,08 -0,21 -0,21 0,05 -0,03 -0,19 -0,17 -0,08 -0,04 -0,73 0,99
EE -0,33 -0,37 -0,31 0,18 1,72 1,03 -0,47 -0,82 -0,37 -0,22 -0,24 0,98
IE -0,01 0,01 0,07 0,36 1,16 0,41 -0,12 -0,32 -0,24 -0,23 1,00 0,99
EL 0,04 -0,12 -0,10 -0,09 0,32 0,51 0,84 0,81 0,27 -0,50 2,34 1,00
ES -0,13 -0,18 -0,13 0,66 1,80 0,94 0,41 0,54 0,31 -0,40 3,93 1,07
FR -0,03 -0,04 -0,12 -0,10 0,28 0,13 0,01 0,08 0,08 -0,01 0,29 1,00
IT 0,01 -0,11 -0,14 0,04 0,21 0,15 0,00 0,22 0,23 0,07 0,68 1,01
CY 0,21 0,02 -0,09 -0,11 0,29 0,28 0,43 0,67 0,79 0,19 2,82 1,01
LV -0,34 -0,32 -0,23 0,24 1,98 0,86 -0,39 -0,68 -0,55 -0,19 0,12 0,99
LT -0,51 -0,50 -0,28 0,21 1,54 1,01 -0,15 -0,54 -0,31 -0,22 0,12 0,99
LU 0,04 -0,02 -0,09 0,01 0,11 -0,04 0,00 0,02 0,09 0,08 0,19 1,00
HU 0,14 0,11 0,02 0,04 0,36 0,23 0,12 0,07 -0,11 -0,32 0,58 0,98
MT -0,10 0,03 0,00 -0,08 0,06 0,01 -0,08 -0,09 -0,01 -0,06 -0,28 1,00
NL 0,10 -0,16 -0,21 -0,14 0,17 0,30 0,11 0,18 0,34 0,16 0,84 1,01
AT 0,11 -0,03 -0,11 -0,17 0,18 0,00 -0,07 -0,02 0,12 0,10 0,10 1,00
PL -0,37 -0,59 -0,69 -0,38 0,08 0,34 0,09 -0,02 -0,06 -0,18 -1,29 1,01
PT 0,11 0,00 0,10 -0,01 0,31 0,17 0,43 0,60 0,19 -0,37 1,52 1,00
RO -0,04 -0,01 0,01 0,04 0,34 0,16 -0,02 -0,13 -0,05 0,00 0,26 1,00
SI 0,16 -0,02 -0,13 -0,14 0,35 0,29 0,26 0,10 0,17 -0,05 0,92 1,00
SK -0,33 -0,48 -0,35 -0,12 0,54 0,30 -0,05 -0,10 -0,09 -0,11 -0,44 1,01
FI -0,42 -0,37 -0,30 -0,14 0,34 0,15 -0,02 -0,10 0,08 0,14 -0,52 1,02
SE 0,43 0,09 -0,15 -0,12 0,36 0,22 -0,06 -0,08 -0,01 0,00 0,48 0,99
UK -0,01 0,11 0,04 0,07 0,40 0,19 0,09 -0,05 -0,10 -0,28 0,30 0,98
Total 0,02 -0,07 -0,13 -0,01 0,39 0,22 0,03 0,05 0,05 -0,09 0,42 0,99
Accumulated
net position0,02 -0,04 -0,17 -0,18 0,20 0,41 0,43 0,47 0,53 0,42
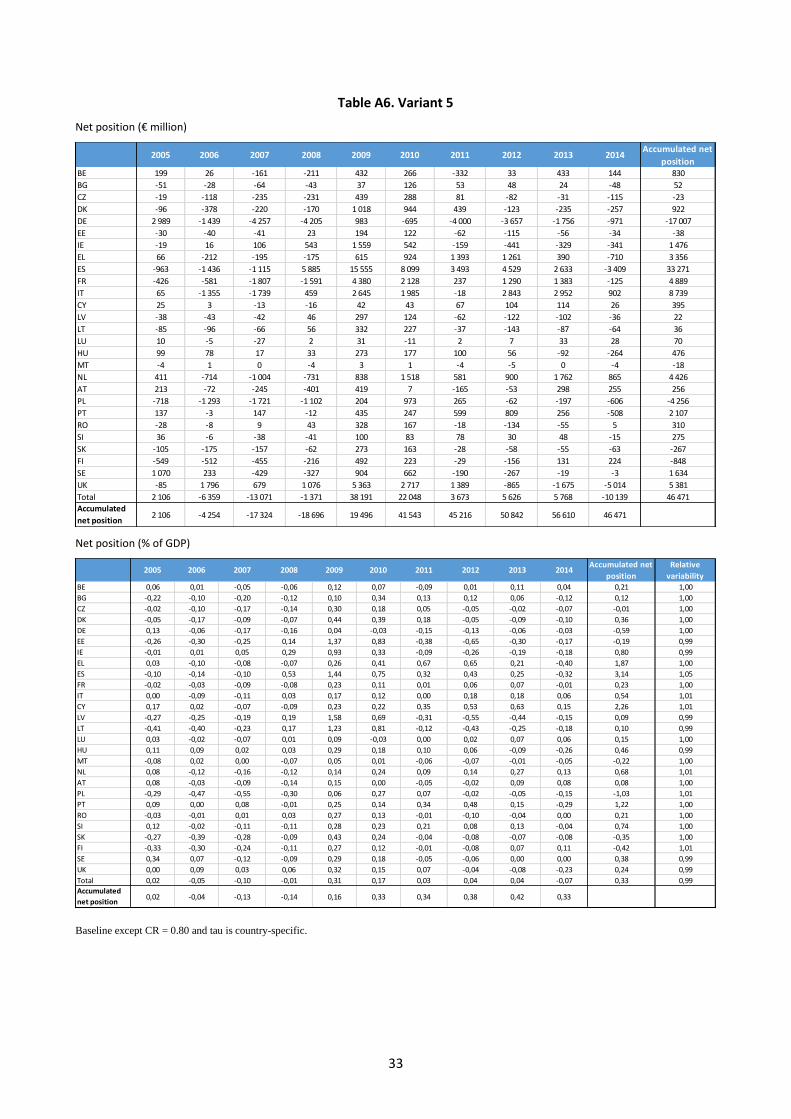
33
Table A6. Variant 5
Net position (€ million)
Net position (% of GDP)
Baseline except CR = 0.80 and tau is country-specific.
2005 2006 2007 2008 2009 2010 2011 2012 2013 2014Accumulated net
positionBE 199 26 -161 -211 432 266 -332 33 433 144 830
BG -51 -28 -64 -43 37 126 53 48 24 -48 52
CZ -19 -118 -235 -231 439 288 81 -82 -31 -115 -23
DK -96 -378 -220 -170 1 018 944 439 -123 -235 -257 922
DE 2 989 -1 439 -4 257 -4 205 983 -695 -4 000 -3 657 -1 756 -971 -17 007
EE -30 -40 -41 23 194 122 -62 -115 -56 -34 -38
IE -19 16 106 543 1 559 542 -159 -441 -329 -341 1 476
EL 66 -212 -195 -175 615 924 1 393 1 261 390 -710 3 356
ES -963 -1 436 -1 115 5 885 15 555 8 099 3 493 4 529 2 633 -3 409 33 271
FR -426 -581 -1 807 -1 591 4 380 2 128 237 1 290 1 383 -125 4 889
IT 65 -1 355 -1 739 459 2 645 1 985 -18 2 843 2 952 902 8 739
CY 25 3 -13 -16 42 43 67 104 114 26 395
LV -38 -43 -42 46 297 124 -62 -122 -102 -36 22
LT -85 -96 -66 56 332 227 -37 -143 -87 -64 36
LU 10 -5 -27 2 31 -11 2 7 33 28 70
HU 99 78 17 33 273 177 100 56 -92 -264 476
MT -4 1 0 -4 3 1 -4 -5 0 -4 -18
NL 411 -714 -1 004 -731 838 1 518 581 900 1 762 865 4 426
AT 213 -72 -245 -401 419 7 -165 -53 298 255 256
PL -718 -1 293 -1 721 -1 102 204 973 265 -62 -197 -606 -4 256
PT 137 -3 147 -12 435 247 599 809 256 -508 2 107
RO -28 -8 9 43 328 167 -18 -134 -55 5 310
SI 36 -6 -38 -41 100 83 78 30 48 -15 275
SK -105 -175 -157 -62 273 163 -28 -58 -55 -63 -267
FI -549 -512 -455 -216 492 223 -29 -156 131 224 -848
SE 1 070 233 -429 -327 904 662 -190 -267 -19 -3 1 634
UK -85 1 796 679 1 076 5 363 2 717 1 389 -865 -1 675 -5 014 5 381
Total 2 106 -6 359 -13 071 -1 371 38 191 22 048 3 673 5 626 5 768 -10 139 46 471
Accumulated
net position2 106 -4 254 -17 324 -18 696 19 496 41 543 45 216 50 842 56 610 46 471
2005 2006 2007 2008 2009 2010 2011 2012 2013 2014Accumulated net
position
Relative
variabilityBE 0,06 0,01 -0,05 -0,06 0,12 0,07 -0,09 0,01 0,11 0,04 0,21 1,00
BG -0,22 -0,10 -0,20 -0,12 0,10 0,34 0,13 0,12 0,06 -0,12 0,12 1,00
CZ -0,02 -0,10 -0,17 -0,14 0,30 0,18 0,05 -0,05 -0,02 -0,07 -0,01 1,00
DK -0,05 -0,17 -0,09 -0,07 0,44 0,39 0,18 -0,05 -0,09 -0,10 0,36 1,00
DE 0,13 -0,06 -0,17 -0,16 0,04 -0,03 -0,15 -0,13 -0,06 -0,03 -0,59 1,00
EE -0,26 -0,30 -0,25 0,14 1,37 0,83 -0,38 -0,65 -0,30 -0,17 -0,19 0,99
IE -0,01 0,01 0,05 0,29 0,93 0,33 -0,09 -0,26 -0,19 -0,18 0,80 0,99
EL 0,03 -0,10 -0,08 -0,07 0,26 0,41 0,67 0,65 0,21 -0,40 1,87 1,00
ES -0,10 -0,14 -0,10 0,53 1,44 0,75 0,32 0,43 0,25 -0,32 3,14 1,05
FR -0,02 -0,03 -0,09 -0,08 0,23 0,11 0,01 0,06 0,07 -0,01 0,23 1,00
IT 0,00 -0,09 -0,11 0,03 0,17 0,12 0,00 0,18 0,18 0,06 0,54 1,01
CY 0,17 0,02 -0,07 -0,09 0,23 0,22 0,35 0,53 0,63 0,15 2,26 1,01
LV -0,27 -0,25 -0,19 0,19 1,58 0,69 -0,31 -0,55 -0,44 -0,15 0,09 0,99
LT -0,41 -0,40 -0,23 0,17 1,23 0,81 -0,12 -0,43 -0,25 -0,18 0,10 0,99
LU 0,03 -0,02 -0,07 0,01 0,09 -0,03 0,00 0,02 0,07 0,06 0,15 1,00
HU 0,11 0,09 0,02 0,03 0,29 0,18 0,10 0,06 -0,09 -0,26 0,46 0,99
MT -0,08 0,02 0,00 -0,07 0,05 0,01 -0,06 -0,07 -0,01 -0,05 -0,22 1,00
NL 0,08 -0,12 -0,16 -0,12 0,14 0,24 0,09 0,14 0,27 0,13 0,68 1,01
AT 0,08 -0,03 -0,09 -0,14 0,15 0,00 -0,05 -0,02 0,09 0,08 0,08 1,00
PL -0,29 -0,47 -0,55 -0,30 0,06 0,27 0,07 -0,02 -0,05 -0,15 -1,03 1,01
PT 0,09 0,00 0,08 -0,01 0,25 0,14 0,34 0,48 0,15 -0,29 1,22 1,00
RO -0,03 -0,01 0,01 0,03 0,27 0,13 -0,01 -0,10 -0,04 0,00 0,21 1,00
SI 0,12 -0,02 -0,11 -0,11 0,28 0,23 0,21 0,08 0,13 -0,04 0,74 1,00
SK -0,27 -0,39 -0,28 -0,09 0,43 0,24 -0,04 -0,08 -0,07 -0,08 -0,35 1,00
FI -0,33 -0,30 -0,24 -0,11 0,27 0,12 -0,01 -0,08 0,07 0,11 -0,42 1,01
SE 0,34 0,07 -0,12 -0,09 0,29 0,18 -0,05 -0,06 0,00 0,00 0,38 0,99
UK 0,00 0,09 0,03 0,06 0,32 0,15 0,07 -0,04 -0,08 -0,23 0,24 0,99
Total 0,02 -0,05 -0,10 -0,01 0,31 0,17 0,03 0,04 0,04 -0,07 0,33 0,99
Accumulated
net position0,02 -0,04 -0,13 -0,14 0,16 0,33 0,34 0,38 0,42 0,33

34
Table A7. Variant 6
Net position (€ million)
Net position (% of GDP)
Baseline except trigger is bad times (short term unemployment rises more than 10 percentage points).
2005 2006 2007 2008 2009 2010 2011 2012 2013 2014Accumulated net
positionBE 1 884 -870 -701 -604 3 117 -2 125 -2 324 1 874 3 072 -1 348 1 976
BG -57 -48 -43 -42 192 201 -177 253 -110 -111 57
CZ -310 -267 -227 -220 1 031 -729 -803 -675 -421 -410 -3 032
DK -764 -618 -503 -432 2 403 -1 486 -1 576 -1 347 -878 -902 -6 105
DE 17 800 -6 332 -4 975 -4 210 17 739 -14 879 -16 237 -14 217 -9 418 -9 768 -44 497
EE -35 -32 -31 106 312 -81 -91 -82 -57 -63 -54
IE -469 -394 879 1 570 2 984 -813 -851 -719 -479 -505 1 204
EL -485 -395 -325 -279 2 514 2 420 3 253 -680 -392 -396 5 234
ES -3 156 -2 615 -2 172 23 653 37 703 -6 285 -6 461 35 868 -3 237 -3 282 70 017
FR -6 420 -5 119 -4 073 -3 426 23 668 -12 073 -12 984 18 390 -7 293 -7 401 -16 731
IT -4 047 -3 232 -2 565 10 098 12 408 -7 455 -7 913 11 635 -4 202 -4 241 486
CY 75 -36 -29 -26 144 -92 150 250 321 -43 714
LV -39 -39 -41 261 534 -87 -96 -89 -63 -68 273
LT -61 -56 -51 242 569 -133 -149 -133 -90 -96 41
LU -103 -85 -71 89 122 -228 -70 -220 87 -157 -637
HU 400 -225 -193 -166 921 -505 -540 -448 -291 -299 -1 348
MT -16 30 -10 -9 39 -33 -37 -33 29 -24 -63
NL -1 882 -1 490 -1 209 -1 042 3 252 1 812 -3 863 2 918 5 760 -2 163 2 093
AT -828 -663 -533 -458 2 453 -1 612 -1 753 -1 541 2 159 -1 048 -3 824
PL -640 -542 -475 -475 3 083 3 198 -1 690 -1 465 -969 -991 -966
PT 916 -423 1 328 -284 1 875 -985 1 685 2 353 -502 -504 5 459
RO -222 -204 -191 -190 1 088 -523 -531 -449 -300 -311 -1 831
SI 139 -85 -72 -64 297 -221 -230 -189 -121 -121 -666
SK -102 -89 -82 -79 630 -289 -316 -275 -181 -191 -975
FI -553 -444 -359 -312 2 471 -1 072 -1 176 -1 028 -666 -669 -3 809
SE 3 044 -806 -665 -547 4 027 -1 948 -2 277 -2 072 -1 380 -1 364 -3 988
UK -7 150 13 882 -4 722 -3 375 19 786 -11 053 -11 586 -10 733 -6 811 -7 408 -29 170
Total -3 078 -11 196 -22 111 19 777 145 363 -57 077 -68 647 37 146 -26 434 -43 885 -30 143
Accumulated
net position-3 078 -14 274 -36 384 -16 608 128 755 71 678 3 031 40 177 13 742 -30 143
2005 2006 2007 2008 2009 2010 2011 2012 2013 2014Accumulated net
position
Relative
variabilityBE 0,61 -0,27 -0,20 -0,17 0,89 -0,58 -0,61 0,48 0,78 -0,34 0,49 1,00
BG -0,24 -0,18 -0,14 -0,12 0,53 0,55 -0,44 0,62 -0,27 -0,26 0,14 1,00
CZ -0,28 -0,22 -0,16 -0,14 0,70 -0,47 -0,49 -0,42 -0,27 -0,26 -1,96 1,00
DK -0,36 -0,27 -0,22 -0,18 1,04 -0,62 -0,64 -0,54 -0,35 -0,35 -2,37 0,98
DE 0,77 -0,26 -0,20 -0,16 0,72 -0,58 -0,60 -0,52 -0,34 -0,34 -1,53 0,96
EE -0,31 -0,24 -0,19 0,64 2,21 -0,55 -0,55 -0,47 -0,31 -0,32 -0,28 0,99
IE -0,28 -0,21 0,45 0,84 1,78 -0,49 -0,50 -0,42 -0,27 -0,27 0,65 1,03
EL -0,24 -0,18 -0,14 -0,12 1,06 1,07 1,57 -0,35 -0,21 -0,22 2,92 1,02
ES -0,34 -0,26 -0,20 2,12 3,49 -0,58 -0,60 3,40 -0,31 -0,31 6,61 1,15
FR -0,36 -0,28 -0,21 -0,17 1,22 -0,60 -0,63 0,88 -0,35 -0,35 -0,78 1,01
IT -0,27 -0,21 -0,16 0,62 0,79 -0,46 -0,48 0,72 -0,26 -0,26 0,03 1,03
CY 0,50 -0,22 -0,17 -0,14 0,78 -0,48 0,77 1,29 1,77 -0,25 4,08 1,02
LV -0,28 -0,22 -0,18 1,07 2,84 -0,48 -0,48 -0,40 -0,27 -0,28 1,13 1,00
LT -0,29 -0,23 -0,18 0,74 2,11 -0,48 -0,48 -0,40 -0,26 -0,26 0,11 0,99
LU -0,35 -0,26 -0,20 0,24 0,34 -0,58 -0,17 -0,50 0,19 -0,33 -1,35 1,00
HU 0,44 -0,25 -0,19 -0,16 0,99 -0,52 -0,54 -0,45 -0,29 -0,29 -1,30 0,96
MT -0,31 0,56 -0,18 -0,15 0,64 -0,50 -0,54 -0,46 0,38 -0,30 -0,80 0,99
NL -0,35 -0,26 -0,20 -0,16 0,53 0,29 -0,60 0,46 0,90 -0,33 0,32 1,02
AT -0,33 -0,25 -0,19 -0,16 0,86 -0,55 -0,57 -0,49 0,67 -0,32 -1,16 1,00
PL -0,26 -0,20 -0,15 -0,13 0,98 0,89 -0,45 -0,38 -0,24 -0,24 -0,23 0,99
PT 0,58 -0,25 0,76 -0,16 1,07 -0,55 0,96 1,40 -0,30 -0,29 3,15 0,99
RO -0,28 -0,21 -0,15 -0,13 0,90 -0,41 -0,40 -0,34 -0,21 -0,21 -1,22 1,00
SI 0,48 -0,27 -0,20 -0,17 0,82 -0,61 -0,62 -0,53 -0,33 -0,32 -1,79 0,98
SK -0,26 -0,20 -0,15 -0,12 0,99 -0,43 -0,45 -0,38 -0,25 -0,25 -1,30 1,00
FI -0,34 -0,26 -0,19 -0,16 1,36 -0,57 -0,60 -0,51 -0,33 -0,33 -1,87 0,98
SE 0,97 -0,24 -0,19 -0,16 1,30 -0,53 -0,56 -0,49 -0,32 -0,32 -0,93 0,97
UK -0,37 0,67 -0,22 -0,18 1,19 -0,61 -0,62 -0,53 -0,34 -0,33 -1,31 0,98
Total -0,03 -0,09 -0,17 0,15 1,19 -0,45 -0,52 0,28 -0,20 -0,32 -0,22 0,97
Accumulated
net position-0,03 -0,12 -0,28 -0,13 1,06 0,56 0,02 0,30 0,10 -0,22

35
Table A8. Variant 7
Net position (€ million)
Net position (% of GDP)
Baseline except tau is country-specific and the trigger is bad times (short term unemployment rises more than 10 percentage points).
2005 2006 2007 2008 2009 2010 2011 2012 2013 2014Accumulated net
positionBE 1 168 -2 082 -1 089 -1 098 3 753 -1 305 -1 328 2 561 3 029 -2 868 740
BG 0 0 0 0 239 271 -222 188 -293 -148 35
CZ -255 -265 0 0 1 242 -437 -439 -435 0 0 -589
DK -642 -657 0 0 2 853 -973 -968 -975 0 0 -1 361
DE 11 211 -16 781 -8 977 -9 180 22 152 -7 709 -7 856 -7 955 0 0 -25 094
EE -45 -47 0 134 293 -144 -157 -126 0 0 -92
IE -276 0 1 210 1 392 2 270 -1 862 -1 568 -1 059 0 0 107
EL -714 -707 -710 0 2 813 2 430 2 315 -2 866 -2 015 -1 246 -701
ES -5 004 0 0 25 552 30 674 -21 639 -21 012 28 745 -12 763 -13 370 11 183
FR 0 0 0 0 27 257 -9 441 -9 511 20 042 -10 204 -10 148 7 995
IT 0 0 0 12 266 10 451 -9 144 -9 153 13 337 -5 987 -6 060 5 709
CY 88 -76 -45 -45 171 -61 189 192 198 -268 343
LV -63 0 0 300 474 -217 -249 -203 0 0 42
LT -103 -109 0 290 517 -268 -293 -222 0 0 -188
LU -112 -91 -57 151 133 -122 58 -134 171 -153 -157
HU 693 -253 -268 -263 1 071 -338 -353 -359 0 0 -70
MT -15 28 -16 -16 33 -18 -18 -18 51 -19 -7
NL -3 571 -2 768 -1 580 0 4 356 3 930 -3 344 2 870 3 933 -4 793 -967
AT -1 512 -845 -857 0 2 936 -1 021 -1 033 -1 052 3 180 -1 123 -1 328
PL 0 0 0 0 3 502 3 497 -2 924 -3 012 -1 677 0 -613
PT 615 -1 006 1 143 -1 112 1 597 -1 311 1 973 1 664 -1 825 -1 901 -162
RO -210 -211 -207 0 1 249 -382 -373 -407 0 0 -541
SI 117 -161 -95 -97 364 -126 -121 -118 0 0 -237
SK -187 -191 -206 0 715 -265 -258 -256 0 0 -649
FI 0 0 0 0 2 793 -959 -982 -1 000 0 0 -148
SE 2 071 -3 467 -2 675 -1 454 4 545 -1 632 -1 792 -1 833 0 0 -6 237
UK -5 770 19 726 -7 356 -6 101 17 468 -7 232 -7 713 -8 596 0 0 -5 574
Total -2 514 -9 964 -21 785 20 718 145 923 -56 476 -67 133 38 973 -24 202 -42 097 -18 559
Accumulated
net position-2 514 -12 478 -34 264 -13 545 132 378 75 901 8 768 47 740 23 538 -18 559
2005 2006 2007 2008 2009 2010 2011 2012 2013 2014Accumulated net
position
Relative
variabilityBE 0,38 -0,64 -0,32 -0,31 1,07 -0,36 -0,35 0,66 0,77 -0,71 0,18 1,00
BG 0,00 0,00 0,00 0,00 0,66 0,74 -0,55 0,46 -0,71 -0,35 0,08 0,99
CZ -0,23 -0,21 0,00 0,00 0,84 -0,28 -0,27 -0,27 0,00 0,00 -0,38 1,00
DK -0,30 -0,29 0,00 0,00 1,24 -0,40 -0,39 -0,39 0,00 0,00 -0,53 0,99
DE 0,49 -0,70 -0,36 -0,36 0,90 -0,30 -0,29 -0,29 0,00 0,00 -0,86 0,99
EE -0,40 -0,35 0,00 0,81 2,07 -0,98 -0,96 -0,71 0,00 0,00 -0,47 1,00
IE -0,16 0,00 0,61 0,74 1,35 -1,13 -0,92 -0,61 0,00 0,00 0,06 1,07
EL -0,36 -0,32 -0,30 0,00 1,18 1,07 1,11 -1,48 -1,10 -0,70 -0,39 1,05
ES -0,54 0,00 0,00 2,29 2,84 -2,00 -1,95 2,72 -1,22 -1,26 1,06 1,15
FR 0,00 0,00 0,00 0,00 1,41 -0,47 -0,46 0,96 -0,48 -0,47 0,37 0,98
IT 0,00 0,00 0,00 0,75 0,66 -0,57 -0,56 0,83 -0,37 -0,37 0,35 1,01
CY 0,59 -0,47 -0,26 -0,24 0,93 -0,32 0,97 0,99 1,09 -1,53 1,96 1,03
LV -0,46 0,00 0,00 1,23 2,52 -1,20 -1,23 -0,92 0,00 0,00 0,18 1,01
LT -0,49 -0,45 0,00 0,89 1,92 -0,96 -0,94 -0,67 0,00 0,00 -0,52 1,00
LU -0,38 -0,27 -0,16 0,40 0,37 -0,31 0,14 -0,31 0,38 -0,33 -0,33 1,00
HU 0,77 -0,28 -0,26 -0,25 1,15 -0,35 -0,35 -0,36 0,00 0,00 -0,07 0,95
MT -0,28 0,51 -0,27 -0,26 0,55 -0,27 -0,26 -0,25 0,68 -0,24 -0,09 1,00
NL -0,66 -0,48 -0,26 0,00 0,71 0,62 -0,52 0,45 0,61 -0,73 -0,15 1,04
AT -0,60 -0,32 -0,30 0,00 1,03 -0,35 -0,33 -0,33 0,99 -0,34 -0,40 1,02
PL 0,00 0,00 0,00 0,00 1,11 0,97 -0,78 -0,78 -0,42 0,00 -0,15 0,99
PT 0,39 -0,61 0,65 -0,62 0,91 -0,73 1,12 0,99 -1,08 -1,10 -0,09 1,01
RO -0,26 -0,21 -0,17 0,00 1,04 -0,30 -0,28 -0,30 0,00 0,00 -0,36 1,00
SI 0,40 -0,51 -0,27 -0,26 1,01 -0,35 -0,33 -0,33 0,00 0,00 -0,64 1,00
SK -0,48 -0,42 -0,37 0,00 1,12 -0,39 -0,37 -0,36 0,00 0,00 -0,86 1,00
FI 0,00 0,00 0,00 0,00 1,54 -0,51 -0,50 -0,50 0,00 0,00 -0,07 0,98
SE 0,66 -1,04 -0,75 -0,41 1,47 -0,44 -0,44 -0,43 0,00 0,00 -1,45 0,99
UK -0,30 0,96 -0,34 -0,32 1,05 -0,40 -0,41 -0,42 0,00 0,00 -0,25 0,99
Total -0,02 -0,08 -0,17 0,16 1,20 -0,44 -0,51 0,29 -0,18 -0,30 -0,13 0,97
Accumulated
net position-0,02 -0,10 -0,27 -0,10 1,08 0,60 0,07 0,36 0,17 -0,13

36
Table A9. Variant 8
Net position (€ million)
Net position (% of GDP)
Baseline except trigger is the US system (unemployment rate exceeds 5 percent and is 20 percent above the level of the past two years).
2005 2006 2007 2008 2009 2010 2011 2012 2013 2014Accumulated net
positionBE -67 -67 -53 -8 -276 -1 240 -1 905 -1 717 -1 409 -1 107 -7 848
BG -4 -4 -3 -1 -20 269 201 -134 -116 -91 97
CZ -19 -20 -17 -3 1 150 807 -658 -572 -445 -337 -114
DK -47 -47 -38 -6 2 657 2 331 -1 291 -1 140 -927 -740 750
DE -503 -485 -378 -59 -1 914 -8 682 -13 306 -12 033 -9 942 -8 017 -55 318
EE -2 -2 -2 0 327 271 -74 -70 -61 -51 334
IE -29 -30 -25 1 847 3 135 2 064 -698 -608 -505 -415 4 736
EL -30 -30 -25 -4 -130 2 812 3 414 3 867 3 282 -325 12 830
ES -195 -200 -165 25 525 38 805 33 576 -5 295 36 658 -3 417 -2 694 122 599
FR -397 -392 -309 -48 -1 557 -7 045 -10 641 -9 458 -7 699 -6 074 -43 618
IT -250 -248 -195 -30 13 682 -4 350 -6 485 12 647 14 881 -3 481 26 172
CY 116 -3 -2 0 159 136 168 263 318 -35 1 120
LV -2 -3 -3 -1 551 369 -79 -75 -67 -56 634
LT -4 -4 -4 -1 593 521 -122 -113 -95 -79 692
LU -6 -7 -5 -1 -29 -133 -206 -186 -158 -129 -860
HU 675 -17 -15 -2 1 006 780 -443 -379 -307 -245 1 052
MT -1 -1 -1 0 -4 -19 -30 -28 -24 -19 -127
NL -116 -114 -92 -15 -479 -2 103 -3 166 -2 803 5 641 -1 776 -5 022
AT -51 -51 -40 -6 -209 -941 -1 437 -1 304 -1 079 -860 -5 979
PL -40 -41 -36 -7 -182 3 853 -1 385 -1 240 -1 023 -813 -915
PT -33 -32 -26 -4 -128 1 595 -812 2 471 -530 -414 2 086
RO -14 -16 -14 -3 -70 -305 -436 -380 -317 -255 -1 808
SI -6 -7 -5 -1 335 250 230 -160 -127 -99 409
SK -6 -7 -6 -1 -37 541 -259 -233 -191 -157 -356
FI -34 -34 -27 -4 2 653 -626 -964 -870 -703 -549 -1 158
SE -62 -62 -50 -8 4 320 -1 137 -1 866 -1 754 -1 457 -1 119 -3 195
UK -442 -448 -358 -47 21 570 -6 450 -9 495 -9 084 -7 190 -6 080 -18 024
Total -1 570 -2 371 -1 896 27 113 85 909 17 146 -57 041 11 566 -13 668 -36 018 29 170
Accumulated
net position-1 570 -3 941 -5 837 21 276 107 185 124 331 67 289 78 856 65 188 29 170
2005 2006 2007 2008 2009 2010 2011 2012 2013 2014Accumulated net
position
Relative
variabilityBE -0,02 -0,02 -0,02 0,00 -0,08 -0,34 -0,50 -0,44 -0,36 -0,28 -1,95 0,98
BG -0,01 -0,01 -0,01 0,00 -0,06 0,73 0,50 -0,33 -0,28 -0,22 0,23 1,00
CZ -0,02 -0,02 -0,01 0,00 0,78 0,52 -0,40 -0,36 -0,28 -0,22 -0,07 1,00
DK -0,02 -0,02 -0,02 0,00 1,15 0,97 -0,52 -0,45 -0,37 -0,29 0,29 0,97
DE -0,02 -0,02 -0,02 0,00 -0,08 -0,34 -0,49 -0,44 -0,35 -0,28 -1,91 0,98
EE -0,02 -0,02 -0,01 0,00 2,31 1,84 -0,45 -0,40 -0,32 -0,26 1,71 0,97
IE -0,02 -0,02 -0,01 0,99 1,86 1,25 -0,41 -0,35 -0,29 -0,22 2,55 0,97
EL -0,02 -0,01 -0,01 0,00 -0,05 1,24 1,64 1,99 1,80 -0,18 7,16 0,97
ES -0,02 -0,02 -0,02 2,29 3,60 3,11 -0,49 3,47 -0,33 -0,25 11,58 1,18
FR -0,02 -0,02 -0,02 0,00 -0,08 -0,35 -0,52 -0,45 -0,36 -0,28 -2,04 0,98
IT -0,02 -0,02 -0,01 0,00 0,87 -0,27 -0,40 0,78 0,92 -0,22 1,62 1,00
CY 0,78 -0,02 -0,01 0,00 0,87 0,71 0,86 1,35 1,76 -0,20 6,40 1,03
LV -0,02 -0,02 -0,01 0,00 2,93 2,05 -0,39 -0,34 -0,29 -0,23 2,64 0,98
LT -0,02 -0,02 -0,01 0,00 2,20 1,86 -0,39 -0,34 -0,27 -0,22 1,91 0,98
LU -0,02 -0,02 -0,02 0,00 -0,08 -0,34 -0,48 -0,43 -0,35 -0,27 -1,83 0,99
HU 0,75 -0,02 -0,01 0,00 1,08 0,80 -0,44 -0,38 -0,31 -0,24 1,02 0,95
MT -0,02 -0,02 -0,01 0,00 -0,07 -0,29 -0,44 -0,39 -0,31 -0,24 -1,60 0,99
NL -0,02 -0,02 -0,02 0,00 -0,08 -0,33 -0,49 -0,44 0,88 -0,27 -0,77 1,00
AT -0,02 -0,02 -0,01 0,00 -0,07 -0,32 -0,47 -0,41 -0,33 -0,26 -1,82 0,98
PL -0,02 -0,02 -0,01 0,00 -0,06 1,07 -0,37 -0,32 -0,26 -0,20 -0,22 1,00
PT -0,02 -0,02 -0,01 0,00 -0,07 0,89 -0,46 1,47 -0,31 -0,24 1,21 1,01
RO -0,02 -0,02 -0,01 0,00 -0,06 -0,24 -0,33 -0,28 -0,22 -0,17 -1,21 1,00
SI -0,02 -0,02 -0,02 0,00 0,93 0,69 0,62 -0,44 -0,35 -0,27 1,10 1,01
SK -0,02 -0,01 -0,01 0,00 -0,06 0,81 -0,37 -0,32 -0,26 -0,21 -0,47 1,00
FI -0,02 -0,02 -0,01 0,00 1,47 -0,33 -0,49 -0,44 -0,35 -0,27 -0,57 0,97
SE -0,02 -0,02 -0,01 0,00 1,40 -0,31 -0,46 -0,41 -0,33 -0,26 -0,74 0,97
UK -0,02 -0,02 -0,02 0,00 1,30 -0,36 -0,51 -0,44 -0,36 -0,27 -0,81 0,97
Total -0,01 -0,02 -0,01 0,21 0,70 0,13 -0,43 0,09 -0,10 -0,26 0,21 0,98
Accumulated
net position-0,01 -0,03 -0,05 0,16 0,88 0,98 0,51 0,59 0,48 0,21

37
Table A10. Variant 9
Net position (€ million)
Net position (% of GDP)
Baseline except tau is country-specific and the trigger is the US system (unemployment rate exceeds 5 percent and is 20 percent above the level of the
past two years).
2005 2006 2007 2008 2009 2010 2011 2012 2013 2014Accumulated net
positionBE 0 0 0 0 0 0 0 0 0 0 0
BG 0 0 0 0 0 362 212 -262 -268 -125 -80
CZ 0 0 0 0 1 242 796 -875 -866 -404 0 -107
DK 0 0 0 0 2 853 2 225 -2 052 -2 068 -1 092 0 -135
DE 0 0 0 0 0 0 0 0 0 0 0
EE 0 0 0 0 338 215 -219 -245 -123 0 -34
IE 0 0 0 1 851 2 658 1 034 -2 349 -1 885 -875 0 433
EL 0 0 0 0 0 3 360 3 149 2 357 487 -3 693 5 660
ES 0 0 0 25 552 30 674 15 603 -33 014 17 225 -24 354 -13 370 18 316
FR 0 0 0 0 0 0 0 0 0 0 0
IT 0 0 0 0 14 657 -4 978 -4 983 13 337 13 330 -12 483 18 879
CY 119 -45 -45 -45 171 129 122 129 143 -268 410
LV 0 0 0 0 564 279 -284 -355 -167 0 37
LT 0 0 0 0 611 418 -394 -439 -223 0 -27
LU 0 0 0 0 0 0 0 0 0 0 0
HU 693 -253 -268 -263 1 071 737 -707 -720 -360 0 -70
MT 0 0 0 0 0 0 0 0 0 0 0
NL -1 497 -1 521 -1 580 0 0 0 0 0 7 902 -2 680 624
AT 0 0 0 0 0 0 0 0 0 0 0
PL 0 0 0 0 0 4 770 -1 686 -1 737 -1 677 0 -330
PT -840 -488 0 0 0 2 170 -702 2 471 -1 666 -1 024 -79
RO 0 0 0 0 0 0 0 0 0 0 0
SI 0 0 0 0 364 253 171 -378 -258 -138 14
SK 0 0 0 0 0 710 -256 -255 -250 0 -51
FI 0 0 0 0 2 793 -959 -982 -1 000 0 0 -148
SE 0 0 0 0 4 545 -1 632 -1 792 -1 833 0 0 -712
UK 0 0 0 0 22 936 -7 232 -7 713 -8 596 0 0 -605
Total -1 525 -2 307 -1 893 27 094 85 476 18 262 -54 354 14 880 -9 857 -33 781 41 995
Accumulated
net position-1 525 -3 833 -5 725 21 369 106 845 125 107 70 752 85 633 75 776 41 995
2005 2006 2007 2008 2009 2010 2011 2012 2013 2014Accumulated net
position
Relative
variabilityBE 0,00 0,00 0,00 0,00 0,00 0,00 0,00 0,00 0,00 0,00 0,00 1,00
BG 0,00 0,00 0,00 0,00 0,00 0,99 0,53 -0,64 -0,65 -0,30 -0,19 0,99
CZ 0,00 0,00 0,00 0,00 0,84 0,51 -0,53 -0,54 -0,26 0,00 -0,07 0,99
DK 0,00 0,00 0,00 0,00 1,24 0,92 -0,83 -0,82 -0,43 0,00 -0,05 0,96
DE 0,00 0,00 0,00 0,00 0,00 0,00 0,00 0,00 0,00 0,00 0,00 1,00
EE 0,00 0,00 0,00 0,00 2,39 1,46 -1,33 -1,39 -0,66 0,00 -0,18 0,97
IE 0,00 0,00 0,00 0,99 1,58 0,63 -1,37 -1,09 -0,50 0,00 0,23 1,02
EL 0,00 0,00 0,00 0,00 0,00 1,49 1,52 1,21 0,27 -2,06 3,16 1,02
ES 0,00 0,00 0,00 2,29 2,84 1,44 -3,07 1,63 -2,32 -1,26 1,73 1,16
FR 0,00 0,00 0,00 0,00 0,00 0,00 0,00 0,00 0,00 0,00 0,00 1,00
IT 0,00 0,00 0,00 0,00 0,93 -0,31 -0,30 0,83 0,83 -0,77 1,17 1,00
CY 0,80 -0,28 -0,26 -0,24 0,93 0,68 0,63 0,67 0,79 -1,53 2,34 1,03
LV 0,00 0,00 0,00 0,00 3,00 1,55 -1,41 -1,60 -0,72 0,00 0,15 0,98
LT 0,00 0,00 0,00 0,00 2,27 1,49 -1,26 -1,32 -0,64 0,00 -0,08 0,97
LU 0,00 0,00 0,00 0,00 0,00 0,00 0,00 0,00 0,00 0,00 0,00 1,00
HU 0,77 -0,28 -0,26 -0,25 1,15 0,75 -0,70 -0,73 -0,36 0,00 -0,07 0,95
MT 0,00 0,00 0,00 0,00 0,00 0,00 0,00 0,00 0,00 0,00 0,00 1,00
NL -0,28 -0,27 -0,26 0,00 0,00 0,00 0,00 0,00 1,23 -0,41 0,10 1,03
AT 0,00 0,00 0,00 0,00 0,00 0,00 0,00 0,00 0,00 0,00 0,00 1,00
PL 0,00 0,00 0,00 0,00 0,00 1,33 -0,45 -0,45 -0,42 0,00 -0,08 1,00
PT -0,53 -0,29 0,00 0,00 0,00 1,21 -0,40 1,47 -0,98 -0,59 -0,05 1,08
RO 0,00 0,00 0,00 0,00 0,00 0,00 0,00 0,00 0,00 0,00 0,00 1,00
SI 0,00 0,00 0,00 0,00 1,01 0,70 0,46 -1,05 -0,71 -0,37 0,04 1,00
SK 0,00 0,00 0,00 0,00 0,00 1,06 -0,37 -0,35 -0,34 0,00 -0,07 1,00
FI 0,00 0,00 0,00 0,00 1,54 -0,51 -0,50 -0,50 0,00 0,00 -0,07 0,98
SE 0,00 0,00 0,00 0,00 1,47 -0,44 -0,44 -0,43 0,00 0,00 -0,17 0,98
UK 0,00 0,00 0,00 0,00 1,38 -0,40 -0,41 -0,42 0,00 0,00 -0,03 0,98
Total -0,01 -0,02 -0,01 0,21 0,70 0,14 -0,41 0,11 -0,07 -0,24 0,30 0,98
Accumulated
net position-0,01 -0,03 -0,04 0,17 0,88 0,98 0,54 0,64 0,56 0,30

38
Table A11. Variant 10
Net position (€ million)
Net position (% of GDP)
Baseline except Denmark and the United Kingdom do not participate into the system.
2005 2006 2007 2008 2009 2010 2011 2012 2013 2014Accumulated net
positionBE 213 87 -81 52 813 322 -711 -542 -85 -385 -316
BG 12 4 -49 -53 22 104 39 65 84 -1 227
CZ -48 -184 -370 -468 270 63 -194 -296 -273 -419 -1 919
DK 0 0 0 0 0 0 0 0 0 0 0
DE 5 243 989 -2 342 -2 244 1 753 -3 830 -11 527 -14 602 -14 959 -16 606 -58 126
EE -10 -32 -59 -6 220 189 30 -10 -2 -40 280
IE -313 -341 -224 455 2 018 1 234 675 460 295 48 4 307
EL 783 446 512 544 1 430 1 851 2 599 2 952 2 377 1 463 14 957
ES 7 066 6 548 7 092 16 099 30 656 27 159 26 187 29 745 28 382 22 958 201 890
FR 4 852 4 080 3 136 3 659 10 668 7 108 3 780 5 084 5 594 4 228 52 189
IT 1 463 -364 -944 1 472 4 261 3 120 547 3 790 5 173 3 951 22 471
CY 7 -10 -22 -20 45 42 77 154 212 155 642
LV 35 18 13 107 424 280 125 114 66 70 1 252
LT 10 -36 -62 48 415 385 182 130 131 77 1 281
LU -137 -159 -186 -160 -121 -213 -254 -284 -267 -272 -2 052
HU -53 -47 -71 41 376 264 182 183 29 -219 685
MT -5 -1 -3 -5 4 -5 -19 -26 -24 -32 -114
NL -698 -1 773 -2 229 -2 250 -748 -366 -1 617 -1 025 692 250 -9 764
AT 376 103 9 -143 705 -8 -551 -573 -259 -250 -592
PL 2 463 1 602 800 1 050 1 566 2 248 1 534 1 349 1 339 643 14 595
PT 86 1 205 199 802 590 959 1 434 1 137 480 5 892
RO 10 -33 14 123 504 335 100 -28 1 7 1 032
SI -21 -63 -99 -100 56 25 20 1 46 -6 -140
SK 95 -27 -58 -43 322 246 58 53 17 -48 614
FI 775 600 464 540 1 304 928 575 437 692 808 7 123
SE 1 499 1 011 661 944 2 151 1 923 1 047 1 010 1 175 1 007 12 428
UK 0 0 0 0 0 0 0 0 0 0 0
Total 23 704 12 419 6 108 19 842 59 918 43 995 23 843 29 574 31 571 17 865 268 839
Accumulated
net position23 704 36 123 42 231 62 072 121 991 165 986 189 829 219 403 250 975 268 839
2005 2006 2007 2008 2009 2010 2011 2012 2013 2014Accumulated net
position
Relative
variabilityBE 0,07 0,03 -0,02 0,01 0,23 0,09 -0,19 -0,14 -0,02 -0,10 -0,08 0,99
BG 0,05 0,01 -0,15 -0,15 0,06 0,28 0,10 0,16 0,21 0,00 0,54 1,00
CZ -0,04 -0,15 -0,27 -0,29 0,18 0,04 -0,12 -0,18 -0,17 -0,27 -1,24 1,00
DK 0,00 0,00 0,00 0,00 0,00 0,00 0,00 0,00 0,00 0,00 0,00 1,00
DE 0,23 0,04 -0,09 -0,09 0,07 -0,15 -0,43 -0,53 -0,53 -0,57 -2,00 0,96
EE -0,09 -0,24 -0,37 -0,03 1,56 1,28 0,18 -0,06 -0,01 -0,21 1,43 0,99
IE -0,18 -0,19 -0,11 0,24 1,20 0,75 0,39 0,27 0,17 0,03 2,32 0,96
EL 0,39 0,20 0,22 0,22 0,60 0,82 1,25 1,52 1,30 0,82 8,35 0,97
ES 0,76 0,65 0,66 1,44 2,84 2,51 2,44 2,82 2,71 2,17 19,07 1,09
FR 0,27 0,22 0,16 0,18 0,55 0,36 0,18 0,24 0,26 0,20 2,44 1,00
IT 0,10 -0,02 -0,06 0,09 0,27 0,19 0,03 0,23 0,32 0,24 1,39 1,01
CY 0,05 -0,06 -0,13 -0,11 0,24 0,22 0,40 0,80 1,17 0,89 3,67 1,02
LV 0,25 0,10 0,06 0,44 2,25 1,56 0,62 0,51 0,28 0,29 5,20 0,99
LT 0,05 -0,15 -0,21 0,15 1,54 1,38 0,58 0,39 0,38 0,21 3,53 1,00
LU -0,46 -0,48 -0,52 -0,43 -0,33 -0,54 -0,60 -0,65 -0,59 -0,58 -4,36 1,00
HU -0,06 -0,05 -0,07 0,04 0,40 0,27 0,18 0,19 0,03 -0,21 0,66 0,99
MT -0,10 -0,02 -0,05 -0,08 0,07 -0,07 -0,27 -0,36 -0,31 -0,40 -1,44 0,99
NL -0,13 -0,31 -0,37 -0,35 -0,12 -0,06 -0,25 -0,16 0,11 0,04 -1,49 1,01
AT 0,15 0,04 0,00 -0,05 0,25 0,00 -0,18 -0,18 -0,08 -0,08 -0,18 0,99
PL 1,01 0,59 0,26 0,29 0,50 0,62 0,41 0,35 0,34 0,16 3,53 0,99
PT 0,05 0,00 0,12 0,11 0,46 0,33 0,54 0,85 0,67 0,28 3,40 1,01
RO 0,01 -0,03 0,01 0,09 0,42 0,26 0,07 -0,02 0,00 0,00 0,69 1,00
SI -0,07 -0,20 -0,28 -0,26 0,15 0,07 0,05 0,00 0,13 -0,02 -0,38 1,00
SK 0,24 -0,06 -0,10 -0,06 0,51 0,37 0,08 0,07 0,02 -0,06 0,82 1,00
FI 0,47 0,35 0,25 0,28 0,72 0,50 0,29 0,22 0,34 0,40 3,49 0,99
SE 0,48 0,30 0,19 0,27 0,69 0,52 0,26 0,24 0,27 0,23 2,89 0,99
UK 0,00 0,00 0,00 0,00 0,00 0,00 0,00 0,00 0,00 0,00 0,00 1,00
Total 0,21 0,10 0,05 0,15 0,49 0,35 0,18 0,22 0,23 0,13 1,94 0,99
Accumulated
net position0,21 0,30 0,33 0,48 1,00 1,30 1,45 1,64 1,86 1,94