Droplet Impact vs. Cavitation Erosion - Start€¦ · Droplet Impact vs. Cavitation Erosion ......
8
1 WIMRC 3rd International Cavitation Forum 2011 University of Warwick, UK, 4 th -6 th July 2011 Droplet Impact vs. Cavitation Erosion T. Keil*, P. F. Pelz, J. Kadavelil Technische Universität Darmstadt Chair of Fluid Systems Technology Magdalenenstraße 4, 64289 Darmstadt Germany J. Necker*, W. Moser, D. Christ Voith Hydro Holding GmbH & Co.KG Alexanderstraße 11, 89522 Heidenheim Germany [email protected], [email protected] ABSTRACT The quantification of the damage potential - aggressiveness - of imploding cavitation bubbles is of high importance for the economical use of low head water turbines, i.e. Kaplan-type turbines. For this kind of turbines a certain amount of cavitation is normally allowed even in the designed operating range to avoid costly deep settings. The amount of admissible cavitation is governed among others by the requirement that no cavitation damage occurs in the machine. This requirement is strongly linked to the necessity to quantify the aggressiveness of the cavitation. The common model test performed on a homologous model of the water turbine is an important mosaic for this quantification. Combined with the experience of prototype machines a fairly accurate decision on the admissible cavitation can be made. However, during this homologous test no erosion is seen in the model machine. Input on the material resistance is acquainted at Voith by a droplet impact test rig. A water jet is stroken by a specimen causing damage on its surface. The macroscopic structure of the damage looks similar to a surface attacked by cavitation. Based on these experiments, relative statements on the material resistance can be done, such as: “Material A more resistant than Material B”. To extend the information content of the droplet impact test rig and to link the test rig parameters to cavitation parameters a specimen exposed to the water jet is analyzed at the Technische Universität Darmstadt using the 2-D pit-count method as well as a white-light-interferometer. The size of the impacts is analyzed in the very early stage of the surface destruction when no mass erosion has taken place yet (incubation time range). A second set of specimen is exposed to cavitation in a test rig situated at the Chair of Fluid Systems Technology (FST). The specimen of the two test rigs show similar damage appearances with respect to the early and advanced incubation time period where displacements of grains in the material structure take place. This paper describes the used test rigs, the pit-count analysis and the obtained results of the correlation between the droplet impact test rig and the cavitation test rig of FST. To compare different erosion tests a dimensionless deformation energy C , D is introduced which shows to be a suitable and use full quantity. The dimensionless deformation energy for the droplet test is by 2 to 3 orders of magnitude higher in comparison with the cavitation tests done at TU Darmstadt. On the other side a dimensionless cavitation erosion rate K is defined. The relation between C , D and K as well as the dependents of both quantities on material properties is still ongoing research work. NOMENCLATURE letter E energy ML 2 T -2 d diameter L f damage frequency T -1 G elastic shear modulus MT -2 L -1 h pit depth L K cavitation rate - L, l length L p pressure ML -1 T -2 R radius L Re Reynolds number - T exposure time T V plastic deformation V Π non-dim. energy - σ cavitation number - ρ density ML -3 ϑ yield stress MT -2 L -1 υ kinematic viscosity L 2 T -1 Ω angular velocity T -1 indices c cavitation mill d droplet impact m material
Transcript of Droplet Impact vs. Cavitation Erosion - Start€¦ · Droplet Impact vs. Cavitation Erosion ......
1
WIMRC 3rd International Cavitation Forum 2011
University of Warwick, UK, 4th-6th July 2011
Droplet Impact vs. Cavitation Erosion
T. Keil*, P. F. Pelz, J. Kadavelil Technische Universität Darmstadt Chair of Fluid Systems Technology
Magdalenenstraße 4, 64289 Darmstadt Germany
J. Necker*, W. Moser, D. Christ Voith Hydro Holding GmbH & Co.KG
Alexanderstraße 11, 89522 Heidenheim Germany
[email protected], [email protected]
ABSTRACT
The quantification of the damage potential - aggressiveness - of imploding cavitation bubbles is of high importance for the economical use of low head water turbines, i.e. Kaplan-type turbines. For this kind of turbines a certain amount of cavitation is normally allowed even in the designed operating range to avoid costly deep settings.
The amount of admissible cavitation is governed among others by the requirement that no cavitation damage occurs in the machine. This requirement is strongly linked to the necessity to quantify the aggressiveness of the cavitation.
The common model test performed on a homologous model of the water turbine is an important mosaic for this quantification. Combined with the experience of prototype machines a fairly accurate decision on the admissible cavitation can be made. However, during this homologous test no erosion is seen in the model machine.
Input on the material resistance is acquainted at Voith by a droplet impact test rig. A water jet is stroken by a specimen causing damage on its surface. The macroscopic structure of the damage looks similar to a surface attacked by cavitation. Based on these experiments, relative statements on the material resistance can be done, such as: “Material A more resistant than Material B”.
To extend the information content of the droplet impact test rig and to link the test rig parameters to cavitation parameters a specimen exposed to the water jet is analyzed at the Technische Universität Darmstadt using the 2-D pit-count method as well as a white-light-interferometer. The size of the impacts is analyzed in the very early stage of the surface destruction when no mass erosion has taken place yet (incubation time range).
A second set of specimen is exposed to cavitation in a test rig situated at the Chair of Fluid Systems Technology (FST). The specimen of the two test rigs show similar damage appearances with respect to the early and advanced incubation time period where displacements of grains in the material structure take place.
This paper describes the used test rigs, the pit-count analysis and the obtained results of the correlation between the droplet impact test rig and the cavitation test rig of FST.
To compare different erosion tests a dimensionless deformation energy C,D is introduced which shows to be a
suitable and use full quantity. The dimensionless deformation energy for the droplet test is by 2 to 3 orders of magnitude higher in comparison with the cavitation tests done at TU Darmstadt.
On the other side a dimensionless cavitation erosion rate K
is defined. The relation between C,D and K as well as the
dependents of both quantities on material properties is still ongoing research work.
NOMENCLATURE letter
E energy ML2T-2 d diameter L f damage frequency T-1 G elastic shear modulus MT-2L-1 h pit depth L K cavitation rate - L, l length L p pressure ML-1T-2 R radius L Re Reynolds number - T exposure time T V plastic deformation V Π non-dim. energy - σ cavitation number - ρ density ML-3 ϑ yield stress MT-2L-1 υ kinematic viscosity L2T-1 Ω angular velocity T-1
indices c cavitation mill d droplet impact m material
2
1. INTRODUCTION
Imploding cavitation bubbles can damage relevant components in hydraulic systems. The vapor bubbles are caused by the decrease of the hydrodynamic pressure below a critical pressure of the fluid which is a function of the vapor pressure, the turbulence and the cavitation nuclei. When the bubble grow to a critical size (given by the so called Blake diameter) they become unstable and consequently implode which cause, in the vicinity of walls, pressure peaks up to several hundreds of MPa.
One aspect of the operating limits of a hydraulic system like displacement or centrifugal pump, flow valve or water turbine is the intensity of cavitation. A possibility to quantify the intensity is to use soft metal coating in homologous model tests. The considered geometry is coated by a soft metal like copper. The coating is exposed to the collapsing cavitation bubbles until plastic deformations (pits) or material loss can be detected. Using this method the location and the intensity of the cavitation damage can be analyzed. However, these tests are time consuming. For special purposes like measuring the material dependent fatigue and erosion curves, experiments are performed in which the surface degradation is usually faster than in the homologous model test. Beside the speed up, these experiments often allow a better visual access and an easier interpretation of the cavitation damage. The Chair of Fluid System Technology has a so-called “cavitation mill” for these purposes.
Another method to produce similar damage appearance like cavitation erosion is the droplet impact test. A fast rotating rod with attached material samples strikes through a water jet which flows in the direction of the rotation axis. The sample surface is degraded by the impact of the water jet.
In the context of a cooperation between Voith and the Chair of Fluid Systems Technology of TU Darmstadt samples of copper and of stainless steel are investigated in the droplet impact test rig and in the cavitation mill. Similar appearance of damage is adjusted to transfer the cavitation parameters to the droplet test rig. The damage is analyzed by the pit-count system of FST and white light-interferometer pictures of the surfaces are taken. The aim of the study is to find a correlation between the droplet impact and the cavitation mill.
2. EXPERIMENTAL SET UP Cavitation Mill
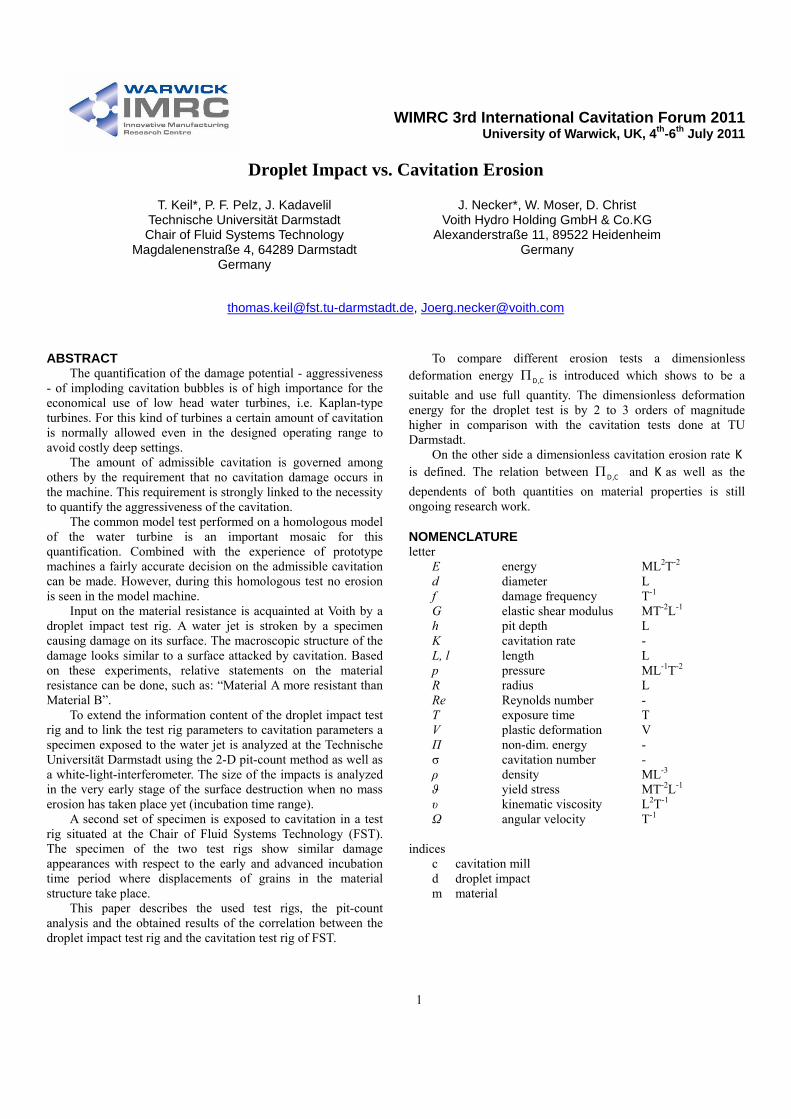
Consisting of a rotating disc in a closed case filled with water the fluid is set in movement with an angular velocity .
Four bore holes at the front side of the disc lead to a reduction of the local pressure in the cavities. The pressure is below the critical pressure of the fluid and four aggressive cavitation zones moving with the rotating disc are generated. The collapse of the cavitation zone takes place on the material surface of the samples which are arranged on the circumference in removable, stationary bridges close to the rotating disc. Altogether there are six of these bridges, but only four of them are used as sample holder. To ensure the same flow conditions in each experiment the specimen which is positioned in the marked area of Fig. 1 is used.
BRIDGEPROBE
d
DISC
PROBE
BOREBORE CAVITATION ZONE
Fig. 1: Cavitation mill of the Chair of Fluid Systems Technology.
After the collapse onto the previous bridge the cavitation zone regenerates itself. By varying the motor speed the Reynolds number of the flow can be changed
,
2
d:Re
2
(1)
where d is the distance between two opposite holes on the disc, is the angular velocity of the rotating disk and the kinematic viscosity of water. The experiments were performed at a Reynolds number of 6e5.11Re .
Independent of the Reynolds number is the cavitation number.
.
2
d
2
pp:
2V
(2)
p is the system pressure, Vp the vapor pressure and the
water density. The cavitation number is controlled by the system pressure.
Fig. 2 shows the geometry of the specimens which are applied in the cavitation mill. The marked area on the surface is the range for the pit-count system. In addition, a smaller area shows the interested zone for scanning with a white-light-interferometer.
1.5
Fig. 2: Specimen for cavitation mill.
3
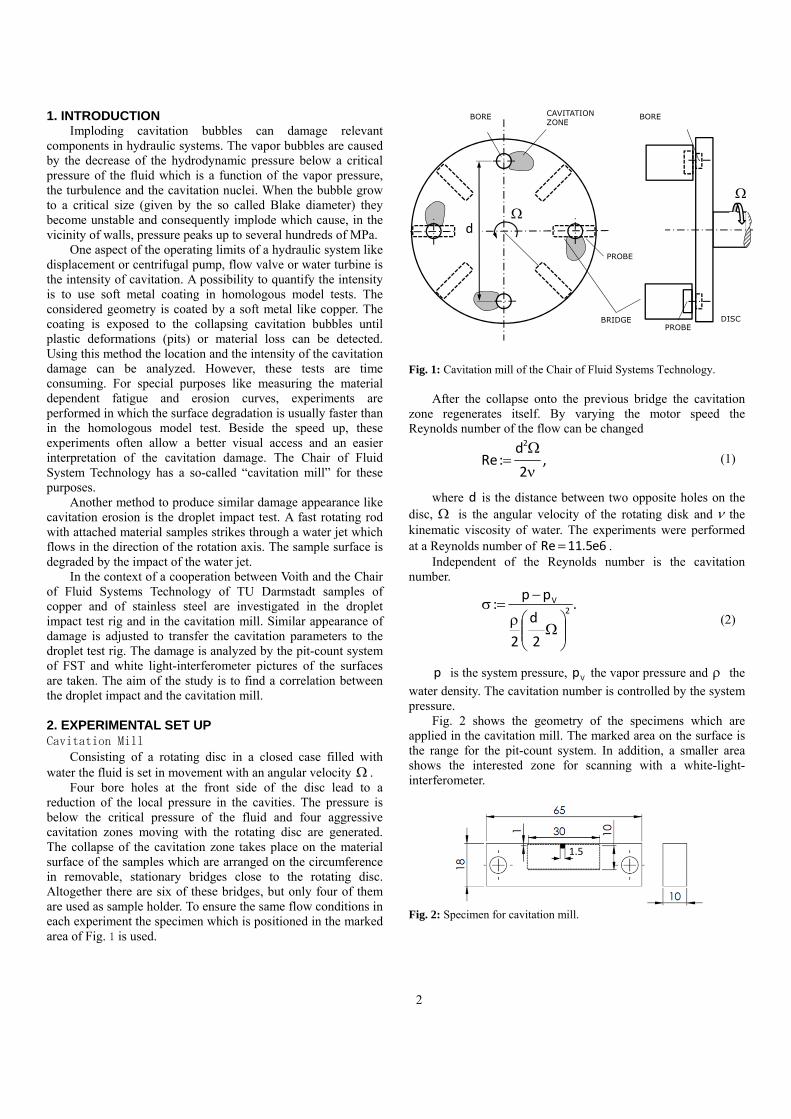
Droplet Impact Test Rig
The droplet impact test rig exists of a rotating lever arm which rotates at a constant speed. To change the impact velocity the material specimen are positioned at different radii.
Once of each revolution the specimens are hit by the water jet. The speed of the water jet is controlled by a throttle. The embedded sketch shows the dimension of the specimen.
14
Fig. 3: Droplet impact test rig at Voith Hydro. Materials Within our study copper and stainless steel 1.4313 specimens were tested.
Cavitation and Cavitation Erosion
Different types of cavitation and different stages of the cavitation damage process can be distinguished. An overview about the main cavitation mechanism and their exposure time onto material surfaces is summarized and highlighted by Van Terwisga [1]. When the spherical cavitation bubble becomes unstable, it collapses and deforms to look like a donut. A mircojet and a strong pressure wave towards the surface are observed which imply a significant load on a small area. Up to now it is unclear what the influence of the high temperature of the collapsing bubble is.
Suppose the mean frequency of bubble cavitation is proportional to the rotating frequency times the number of specimen, and the exposure time is T , there will be ~ fT load cycles on the material surface. For quasi-stationary process conditions the fatigue process is divided in three stages:
1. Incubation stage In the early phase of exposure only plastic deformation occurs at the surface. In this period, no material loss is recorded, only small dents with different depths (and diameters) in the surface (“pits”) can be analyzed. Empirical correlations between pit size, material and energy applied to the surface can be used in the early stage of this phase when still no overlapping of the pits has happened or no boundaries of the grains are visible.
2. Transitional stage Following the incubation period, cracks along the grain-boundaries indicate the beginning of the second phase in which material is eroded from the surface. During this phase the ratio of mass-loss and time is progressive, i.e. the size of the pieces torn off the surface increases with time.
3. Mass loss stage Subsequently a third phase with a constant ratio of mass-loss and time can be distinguished. The size of the pieces torn off the surface stays approximately the same.
0.0
0.2
0.4
0.6
0.8
1.0
1.2
1.4
1.6
0 20 40 60 80
DAMAGE CYCLES fT
REL
. W
EIG
HT
LOSS
[%
]
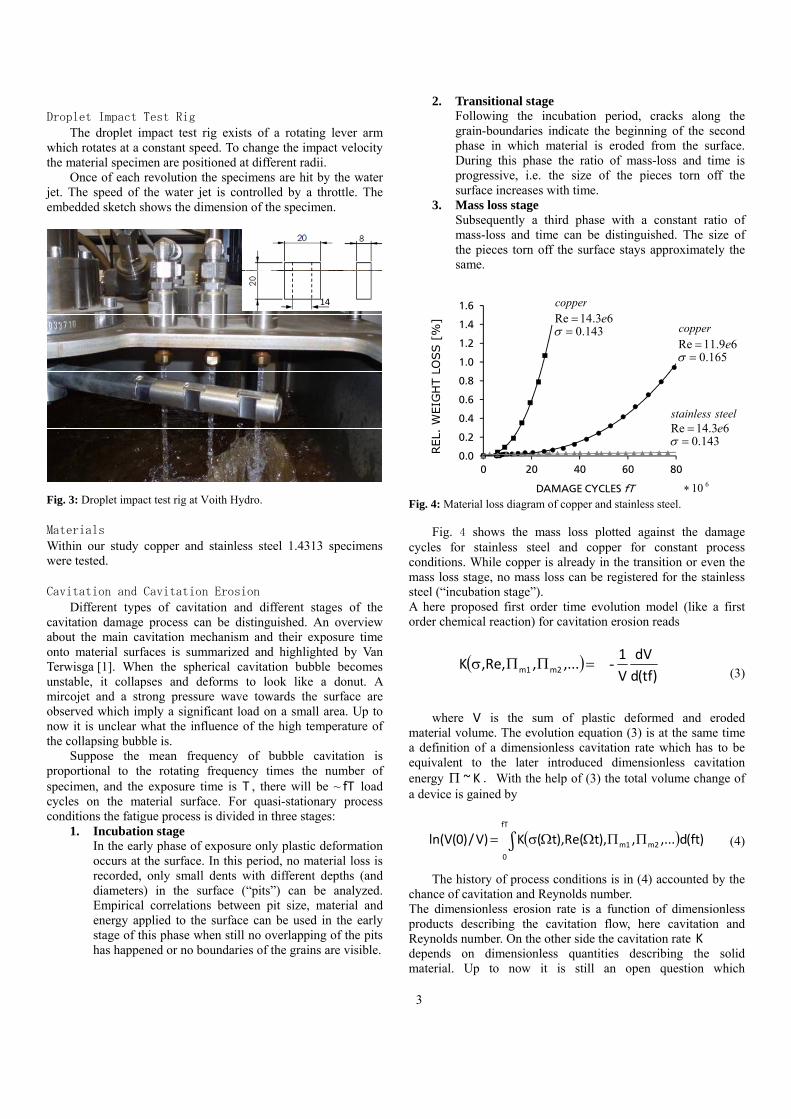
610
copper63.14Re e
143.0 copper
69.11Re e165.0
steelstainless63.14Re e
143.0
Fig. 4: Material loss diagram of copper and stainless steel.
Fig. 4 shows the mass loss plotted against the damage cycles for stainless steel and copper for constant process conditions. While copper is already in the transition or even the mass loss stage, no mass loss can be registered for the stainless steel (“incubation stage”). A here proposed first order time evolution model (like a first order chemical reaction) for cavitation erosion reads
)tf(d
dV
V
1,...,,Re,K 2m1m -
(3)
where V is the sum of plastic deformed and eroded material volume. The evolution equation (3) is at the same time a definition of a dimensionless cavitation rate which has to be equivalent to the later introduced dimensionless cavitation energy K~ . With the help of (3) the total volume change of a device is gained by
)ft(d,...,),tRe(),t(K)V/)0(Vln(fT
0
2m1m∫ (4)
The history of process conditions is in (4) accounted by the chance of cavitation and Reynolds number. The dimensionless erosion rate is a function of dimensionless products describing the cavitation flow, here cavitation and Reynolds number. On the other side the cavitation rate K depends on dimensionless quantities describing the solid material. Up to now it is still an open question which

4
dimensionless material quantities describe properly the erosion resistance of different materials. For general visco-plastic-elastic material behavior the ratio of the square of the material viscosity to the material density
m
2
m / is a material typical force which has to be made
dimensionless with the yield stress and a material typical
length ml (e. q. grain diameter). A second dimensionless product
surely is the ratio of yield stress to the elastic shear modulus of the material G :
,...
l
L,
G ,
/
l
m
m3m2m
m2m
2m
1m
(5)
The investigation carried out at the droplet impact test rig
and the cavitation mill is specifically focused on the incubation stage. This allows a more precise quantification of the deformed surface and a better comparison of the damage mechanisms. Especially the correlation between pit size and applied energy is most accurate if single pits without overlapping can be analyzed.
Water Impact Erosion
When the material surface of the specimen strikes through the water jet, the jet is atomized into small droplets in a very short time. The kinetic energy is introduced into the material surface, resulting in a plastic deformation of the material. Fig. 5 shows the impact of the specimen in a sequence of pictures recorded by a high-speed camera. The jet can be seen at t= 0. It flows from the top to the bottom. The specimen moves from the back towards the front. The impact velocity is approximately
sec/m 70u .
0 μs
65 μs
130 μs
195 μs
260 μs
325 μs
20 mm
Fig. 5: High speed visualisation of the atomization of the water jet into
water droplets.
The specimen hits the jet after 65 s elapsed. The atomization of the jet is continued till the specimen is moved out of the jet and the jet can recover again.
Even with the high performance high-speed camera a more detailed view of the impact is hidden behind a droplet curtain. If any cavitation is involved in the atomization and, if yes, the extent of it, has not been sufficiently clarified yet. Knezevic [7] describes in the center of the droplet impact a very low pressure
zone, where cavitation could be occurred. The low pressure in the droplets may stem from a reflected shock wave also described by Farhat et al [12].
The process of a droplet impact describes Ni [4]. He divides the droplet impact into five stages. Upon impact, a part of the energy of the water jet, given by the kinetic energy of the jet and its surface energy and a part of the energy of the specimen, given by its kinetic energy are converted into the deformation of the specimen and in the atomization of the jet. In addition, part of the energy leads to a deceleration of the rotating arm and the heating of the water.
In the early stage of the tests, the damaged surface shows dents of different depths. The shape of the damage implies that the main load of the surface stems from droplets generated during the atomization of the jet. Pictures of the surface at different times during the incubation period are shown in Fig. 6. An analytical calculation of the energy needed for the deformation of the surface is difficult since e.g. no spectrum of the droplet sizes is available or even cavitation may contribute to the load of the surface.
Exceeding the incubation stage and entering the mass loss stages show the large aggressiveness of the droplet tests in general and of the test rig specifically. Only after a relatively small number of impacts in the order of 106 a stainless steel surface is heavily damaged.
0 impacts 0.6 Mio. impacts 1.5 Mio. impacts
Fig. 6: Surface of stainless steel 1.4313 in droplet test rig.
This high potential of droplets to damage surfaces is in
accordance with several prototype applications in different fields like in Pelton buckets or steam turbines. A quantification of the material loss of a stainless steel sample is given in Fig. 7.
5
0
0.2
0.4
0.6
0.8
1
0.0 2.0 4.0 6.0
DAMAGE CYCLES fT
REL
. W
EIG
HT
LOSS
[%
]
610
rigtestimpactDroplet
steelstainless 4313.1
143.0
63.14Re
""
e
millcavitation
copper
Fig. 7: Mass loss in the droplet test rig of stainless steel vs. mass loss of
copper in the cavitation mill at FST.
It is interesting to see that the most aggressive operation of the cavitation mill shown in Fig. 7 is much less aggressive than the one investigated in the droplet test rig. Even with the -compared to copper - much more resistant stainless steel much larger mass-loss rates are achieved for equal damage cycles. This allows to obtain results from the droplet test rig for relative tests (Material “A” more resistant than material “B”) in very short durations.
For the presented study this large aggressiveness of the droplet test rig made it challenging to stop early enough the destruction of the surface before the displacement of the grains in the material already started. This requirement is important for an accurate application of the pit count method. EXPERIMENTAL RESULTS
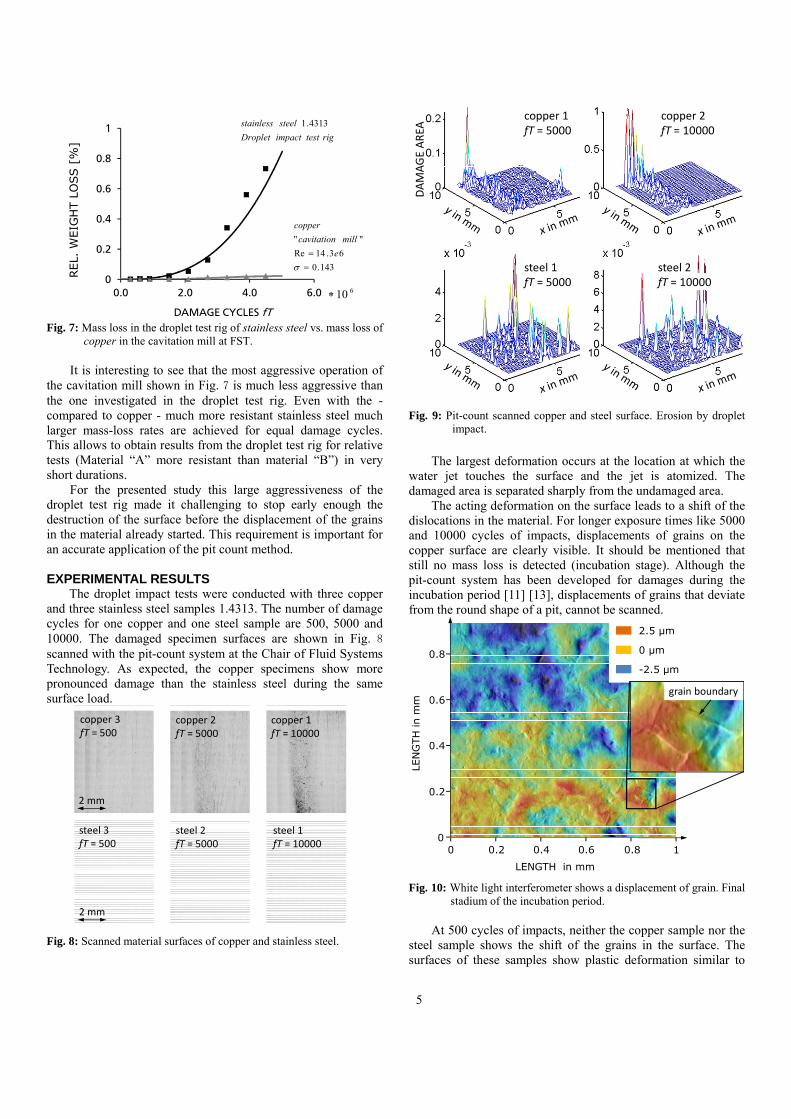
The droplet impact tests were conducted with three copper and three stainless steel samples 1.4313. The number of damage cycles for one copper and one steel sample are 500, 5000 and 10000. The damaged specimen surfaces are shown in Fig. 8 scanned with the pit-count system at the Chair of Fluid Systems Technology. As expected, the copper specimens show more pronounced damage than the stainless steel during the same surface load.
copper 3fT = 500
steel 3fT = 500
copper 1fT = 10000
copper 2fT = 5000
steel 2fT = 5000
steel 1fT = 10000
2 mm
2 mm
Fig. 8: Scanned material surfaces of copper and stainless steel.
DAMAGE AREA
copper 2fT = 10000
copper 1fT = 5000
steel 1fT = 5000
steel 2fT = 10000
Fig. 9: Pit-count scanned copper and steel surface. Erosion by droplet
impact.
The largest deformation occurs at the location at which the
water jet touches the surface and the jet is atomized. The damaged area is separated sharply from the undamaged area.
The acting deformation on the surface leads to a shift of the dislocations in the material. For longer exposure times like 5000 and 10000 cycles of impacts, displacements of grains on the copper surface are clearly visible. It should be mentioned that still no mass loss is detected (incubation stage). Although the pit-count system has been developed for damages during the incubation period [11] [13], displacements of grains that deviate from the round shape of a pit, cannot be scanned.
0 10.2 0.4 0.6 0.80
0.2
0.4
0.6
0.8
LENGTH in mm
LEN
GTH
in m
m
2.5 µm
0 µm
-2.5 µm
grain boundary
Fig. 10: White light interferometer shows a displacement of grain. Final
stadium of the incubation period. At 500 cycles of impacts, neither the copper sample nor the
steel sample shows the shift of the grains in the surface. The surfaces of these samples show plastic deformation similar to
6
pits originate by bubble collapses near the surface. Following Lohrberg [11], the integral deformation energy associated with the counted and measured pits is given by
.l
R1LE
i
3
m
i3m∑
(6)
Here 3
mL is a material typical energy, mL is a second
material typical length in addition to the prior defined length ml ,
and iR is the detected pit radius. The total deformation energy is
made dimensionless, with the water density , the typical
length of the arm 2/d and the mass specific kinetic energy
2/)2/d( 2 :
.
d
E
fT
64:
25
C,DC,D (7)
fT describes the number of damage cycles.
Cavitation Tests
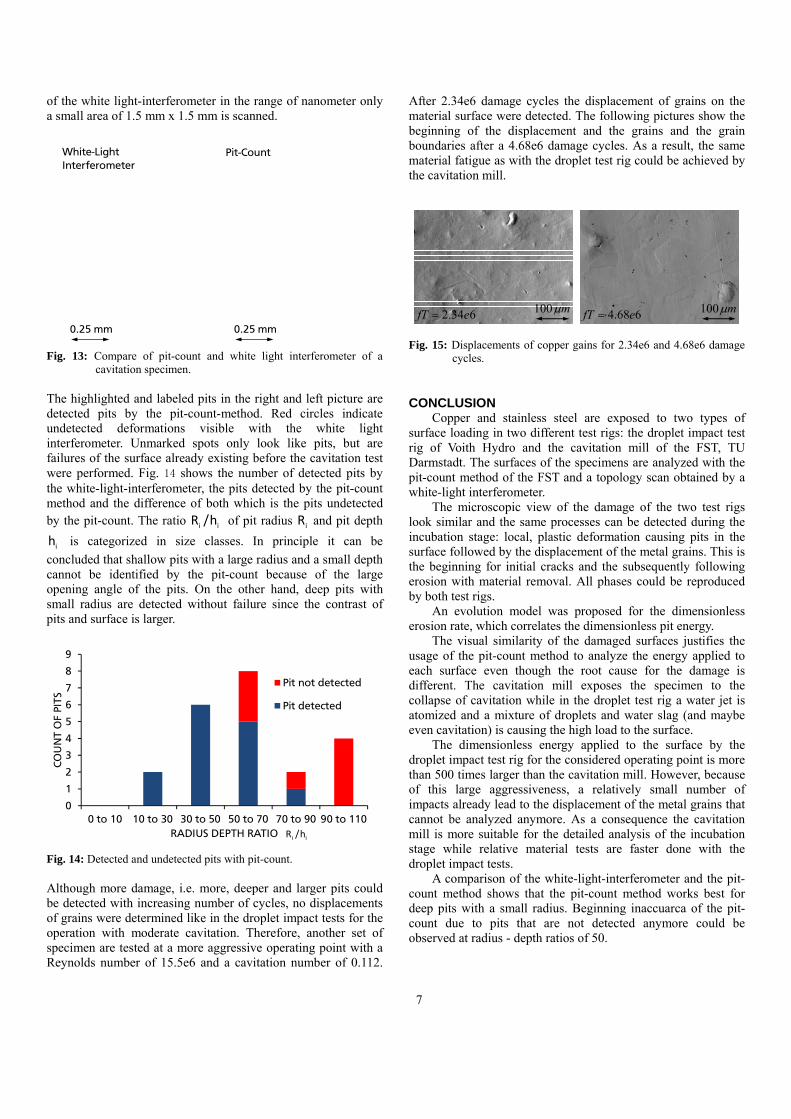
With the same material the cavitation test were performed. Two specimens were damaged at an operation point with moderate cavitation aggressiveness in the cavitation mill. The cavitation exposure times are 9 and 19 hours at a Reynolds number of 11e6 and a cavitation number of 0.2184.
DAMAGEAREA
6e08.1fT
6e44.1fT
6e88.2fT
Fig. 11: Pit-count scanned copper surface. Erosion by collapsing
bubbles Compared to the droplet impact test, the damage focuses around the sample center at the upper edge. The damage intensity decreases radially outward, but not as abruptly as in the droplet impact test.
The deformation energy is determined using the empirical relation (6) together with the definition (7) for the dimensionless deformation work per cycle C . Again it is assumed that the
deformation work per cycle is proportional to the dimensionless
cavitation rate given by (3) which is in our future research focus at TU Darmstadt.
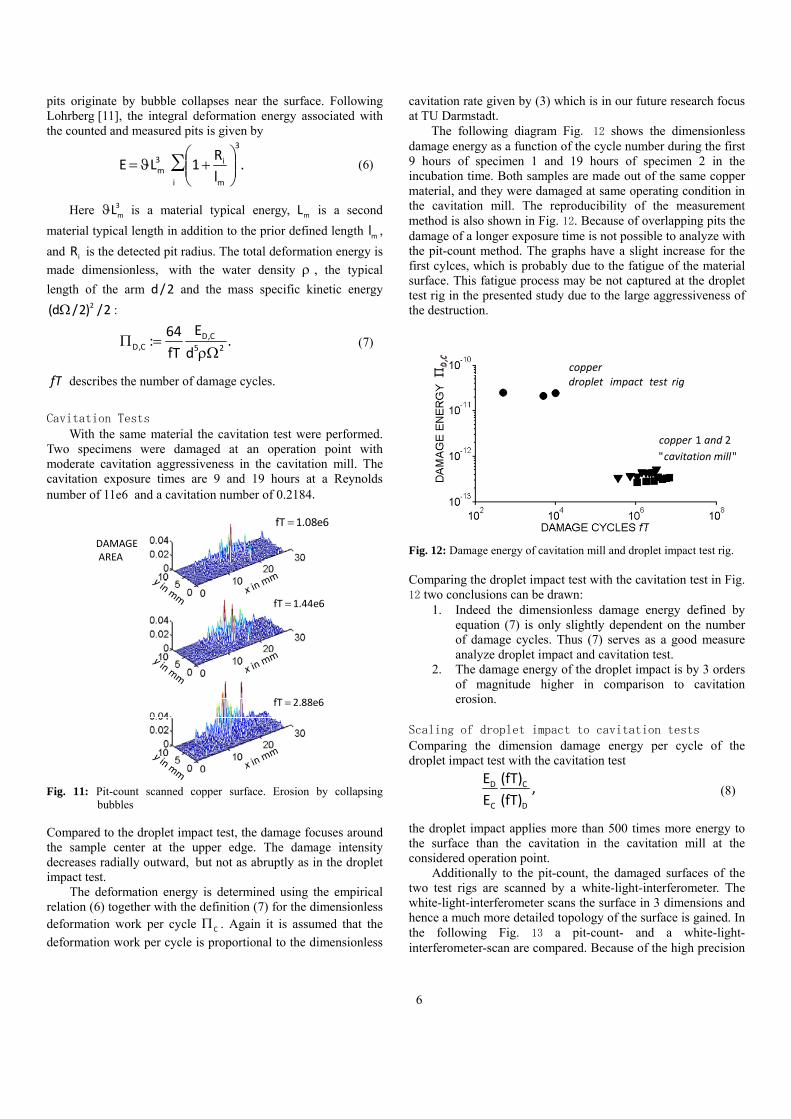
The following diagram Fig. 12 shows the dimensionless damage energy as a function of the cycle number during the first 9 hours of specimen 1 and 19 hours of specimen 2 in the incubation time. Both samples are made out of the same copper material, and they were damaged at same operating condition in the cavitation mill. The reproducibility of the measurement method is also shown in Fig. 12. Because of overlapping pits the damage of a longer exposure time is not possible to analyze with the pit-count method. The graphs have a slight increase for the first cylces, which is probably due to the fatigue of the material surface. This fatigue process may be not captured at the droplet test rig in the presented study due to the large aggressiveness of the destruction.
copper
21 andcopper
rigtestimpactdroplet
"" millcavitation
Fig. 12: Damage energy of cavitation mill and droplet impact test rig. Comparing the droplet impact test with the cavitation test in Fig. 12 two conclusions can be drawn:
1. Indeed the dimensionless damage energy defined by equation (7) is only slightly dependent on the number of damage cycles. Thus (7) serves as a good measure analyze droplet impact and cavitation test.
2. The damage energy of the droplet impact is by 3 orders of magnitude higher in comparison to cavitation erosion.
Scaling of droplet impact to cavitation tests Comparing the dimension damage energy per cycle of the droplet impact test with the cavitation test
,)fT(
)fT(
E
E
D
C
C
D (8)
the droplet impact applies more than 500 times more energy to the surface than the cavitation in the cavitation mill at the considered operation point.
Additionally to the pit-count, the damaged surfaces of the two test rigs are scanned by a white-light-interferometer. The white-light-interferometer scans the surface in 3 dimensions and hence a much more detailed topology of the surface is gained. In the following Fig. 13 a pit-count- and a white-light-interferometer-scan are compared. Because of the high precision
7
of the white light-interferometer in the range of nanometer only a small area of 1.5 mm x 1.5 mm is scanned.
0.25 mm0.25 mm
Pit-CountWhite-Light
Interferometer
Fig. 13: Compare of pit-count and white light interferometer of a
cavitation specimen. The highlighted and labeled pits in the right and left picture are detected pits by the pit-count-method. Red circles indicate undetected deformations visible with the white light interferometer. Unmarked spots only look like pits, but are failures of the surface already existing before the cavitation test were performed. Fig. 14 shows the number of detected pits by the white-light-interferometer, the pits detected by the pit-count method and the difference of both which is the pits undetected by the pit-count. The ratio ii h/R of pit radius iR and pit depth
ih is categorized in size classes. In principle it can be
concluded that shallow pits with a large radius and a small depth cannot be identified by the pit-count because of the large opening angle of the pits. On the other hand, deep pits with small radius are detected without failure since the contrast of pits and surface is larger.
0
1
2
3
4
5
6
7
8
9
0 to 10 10 to 30 30 to 50 50 to 70 70 to 90 90 to 110
CO
UN
T O
F P
ITS
RADIUS DEPTH RATIO
Pit not detected
Pit detected
ii h/R
Fig. 14: Detected and undetected pits with pit-count. Although more damage, i.e. more, deeper and larger pits could be detected with increasing number of cycles, no displacements of grains were determined like in the droplet impact tests for the operation with moderate cavitation. Therefore, another set of specimen are tested at a more aggressive operating point with a Reynolds number of 15.5e6 and a cavitation number of 0.112.
After 2.34e6 damage cycles the displacement of grains on the material surface were detected. The following pictures show the beginning of the displacement and the grains and the grain boundaries after a 4.68e6 damage cycles. As a result, the same material fatigue as with the droplet test rig could be achieved by the cavitation mill.
m100m100634.2 efT 668.4 efT
Fig. 15: Displacements of copper gains for 2.34e6 and 4.68e6 damage
cycles.
CONCLUSION Copper and stainless steel are exposed to two types of
surface loading in two different test rigs: the droplet impact test rig of Voith Hydro and the cavitation mill of the FST, TU Darmstadt. The surfaces of the specimens are analyzed with the pit-count method of the FST and a topology scan obtained by a white-light interferometer.
The microscopic view of the damage of the two test rigs look similar and the same processes can be detected during the incubation stage: local, plastic deformation causing pits in the surface followed by the displacement of the metal grains. This is the beginning for initial cracks and the subsequently following erosion with material removal. All phases could be reproduced by both test rigs.
An evolution model was proposed for the dimensionless erosion rate, which correlates the dimensionless pit energy.
The visual similarity of the damaged surfaces justifies the usage of the pit-count method to analyze the energy applied to each surface even though the root cause for the damage is different. The cavitation mill exposes the specimen to the collapse of cavitation while in the droplet test rig a water jet is atomized and a mixture of droplets and water slag (and maybe even cavitation) is causing the high load to the surface.
The dimensionless energy applied to the surface by the droplet impact test rig for the considered operating point is more than 500 times larger than the cavitation mill. However, because of this large aggressiveness, a relatively small number of impacts already lead to the displacement of the metal grains that cannot be analyzed anymore. As a consequence the cavitation mill is more suitable for the detailed analysis of the incubation stage while relative material tests are faster done with the droplet impact tests.
A comparison of the white-light-interferometer and the pit-count method shows that the pit-count method works best for deep pits with a small radius. Beginning inaccuarca of the pit-count due to pits that are not detected anymore could be observed at radius - depth ratios of 50.
8
REFERENCES [1] Van Terwisga, Fitzsimmons, P.A., Ziru, L., Foeth, E.J.,
Cavitation Erosion – A review of physical mechanisms and erosion risk models, Proc CAV2009 – 7th International Symposium on Cavitation, Ann Arbor, 2009
[2] Fortes Patella, R., Reboud, J.L., Interaction between pressure waves and spherical cavitation bubbles: Discussion about cavitation erosion mechanism, Proc. Of the 2000 ASME Fluids Engineering Summer Conference, Boston, Massachusetts, 2000
[3] Fortes Patella, R., Challier, G., Reboud, J.L., Archer, A., Cavitation erosion mechanism: numerical simulations of the interaction between pressure waves and solid boundaries, Proc. CAV2001 International Symposioum on Cavitation, Pasadena, 2001
[4] Ni, J., Guo, Q., Zhou, Z., Wang, F., Submodel for Predicting Slag Deposition Formation in Slagging Gasification Systems, Energy Flues 2011, 1004-1009
[5] Castrejon-Pita, J.R., Betton, E.S., Kubiak, K.J., Wilson, M.C.T., Hutchings, I.M., The dynamics of the impact and coalescence of droplets on a solid surface, BIOMICROFLUIDICS 5, 014112, 2011
[6] Lunkad, S.F., Buwa, V.V., Nigam, K.D.P., Numerical simulations of impact and spreading on horizontal and inclined surfaces, Chemical Engineering Science 62 (2007), 7214-7224, 2007
[7] Knezevié, K.H., High-Velocity Impact of a Liquid on a Rigid Surface: The Effect of Liquid Compressibility, Dissertation, Swiss Federal Institute of Technology Zurich, Zurich, 2002
[8] Field J.E., Dear, J.P., Ogren, J.E., The effects of target compliance on liquid drop impact, J. Appl. Phys. 65 (2), 15 January 1989
[9] Qin, C.P., Zheng, Y.G., Wei, R., Cavitation erosion of nanocomposite Ti-Si-C-N and Ti/Ti-Si-C-N coatings deposited on 2Cr13 stainless steel using a Plasma Enhanced Magnetron Sputtering process, Surface & Coatings Technology 204 (2010) 3530-3538
[10] Mettin, R., Luther, S., Lindau, O., Koch, P. Lauterborn, W., Investigation of Cavitation Bubble Dynamics by Means of Fast Cinematography, The International Conference on Multiphase Systems Ufa, RUSSIA, June 15 17, 2000, ICMS 2000
[11] Lohrberg, H., Messung und aktive Kontrolle der erosiven Aggressivität der Kavitation in Turbomaschinen, Fortschritts-Bericht VDI Reihe 8 Nr. 942 ISBN 3-18-394208-5, 2001
[12] Farhat, M. The Swiss Army’s Shot at Science: High-Speed Impact of a Solid on a Water Jet, Lay Language Paper of 62nd APS DFD Annual Meeting, 2009
[13] Keil, T., Cordes, U., Pelz, P.F., Ludwig, G., On the Transient Behavior of Cloud Cavitation and the Erosion in a Nozzle Flow, Warwick IMRC, 3rd International Cavitation Forum 2011


![Progress in Paper Recycling Cavitation-jet deinking: A new ......which cavitation occurs and even the impact force by using hydrodynamic parameters of the jet [9,10]. As a result,](https://static.fdocuments.net/doc/165x107/5e8a8836d5b72f48b9406f74/progress-in-paper-recycling-cavitation-jet-deinking-a-new-which-cavitation.jpg)