DRIVES US TOWARD FURTHER SUCCESS · Financial Highlight: 3Q18 & 9M18 performance Hyvahl & RDCC...
36
GDP DRIVES US TOWARD FURTHER SUCCESS
Transcript of DRIVES US TOWARD FURTHER SUCCESS · Financial Highlight: 3Q18 & 9M18 performance Hyvahl & RDCC...
GDP
DRIVES US TOWARD FURTHER SUCCESS
Performance by Business
Financial Performance
Strategic Direction
3Q18 Highlight
2
Projects Update
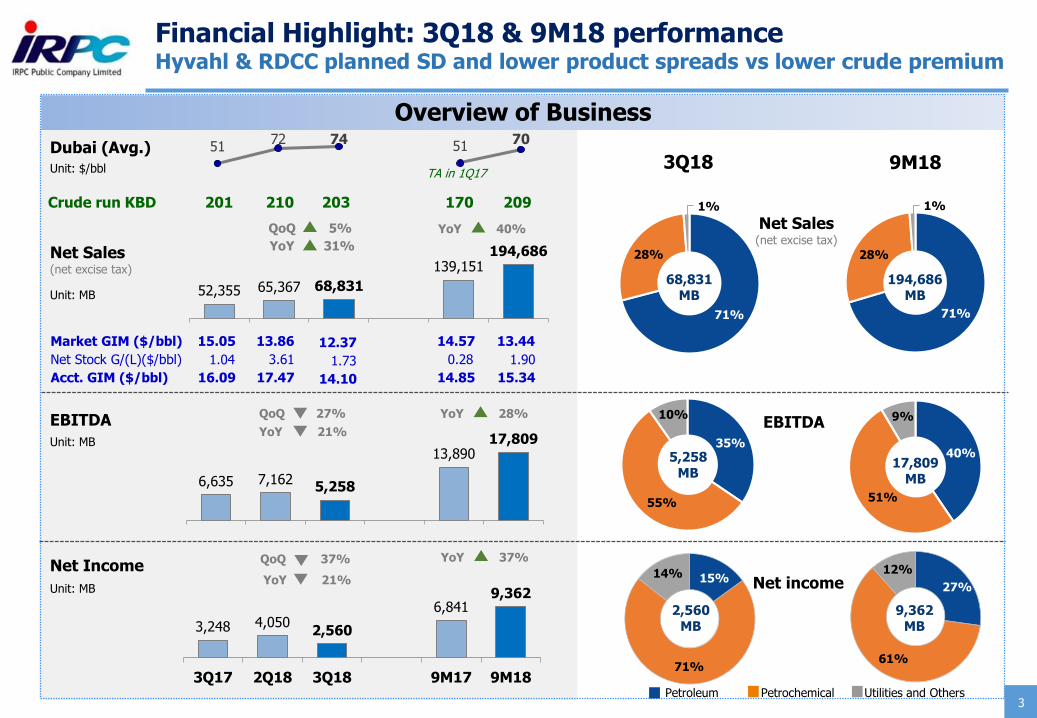
Financial Highlight: 3Q18 & 9M18 performanceHyvahl & RDCC planned SD and lower product spreads vs lower crude premium
27%
61%
12%
52,355 65,367 68,831
139,151 194,686
QoQ 5%
YoY 31%
Overview of Business
Net Sales(net excise tax)
Dubai (Avg.)
Unit: $/bbl
Net Income
Unit: MB
Unit: MB
YoY 21%
QoQ 37%
EBITDA
Unit: MB
6,635 7,162 5,258
13,890 17,809
QoQ 27%
YoY 21%
Petroleum Petrochemical Utilities and Others
Net Sales(net excise tax)
EBITDA
Net income
9M18
40%
51%
9%
71%
28%
1%
194,686MB
17,809MB
3,248 4,050 2,560
6,841 9,362
3Q17 2Q18 3Q18 9M17 9M18
9,362MB
Market GIM ($/bbl) 15.05 13.86 12.37
5172 74
5170
Crude run KBD 201 210 203
Acct. GIM ($/bbl) 16.09 17.47 14.10
3
3Q18
35%
55%
10%
71%
28%
1%
68,831MB
5,258MB
15%
71%
14%
2,560MB
Net Stock G/(L)($/bbl) 1.04 3.61 1.73
YoY 37%
YoY 28%
YoY 40%
170 209
TA in 1Q17
14.57
15.34
1.90
13.44
14.85
0.28

Awards & Achievement in 3Q18
received outstanding plant management
“Best SET Sustainability Awards 2018
And Thailand Sustainability
Investment”
4
IRPC’s Achievement
Social Contribution Marketing
By The Stock Exchange of Thailand (SET)
“Thailand Energy Awards 2018”
For Plant Management
By Department of Alternative Energy Development and Efficiency,
Ministry of Energy
“Excellent CG Scoring Company”
Corporate Governance Report : CGR
By Thai Institute of Directors (IOD)and The Stock Exchange
of Thailand (SET)
“Dow Jones Sustainability Indices (DJSI) Member”
In Oil and Gas Refining & Marketing Industry
The 5th consecutive year, with the highest score
By RobecoSAM
“IRPC Join Guangzhao SaijuPerformance Polymer Ltd.”
Investment in plastic product E-Commerce business in
The PRC and incorporation a subsidiary under the
laws of Thailand
“Top Community Care Companies in Asia 2018”
By Asia Corporate Excellence & Sustainability Awards
5
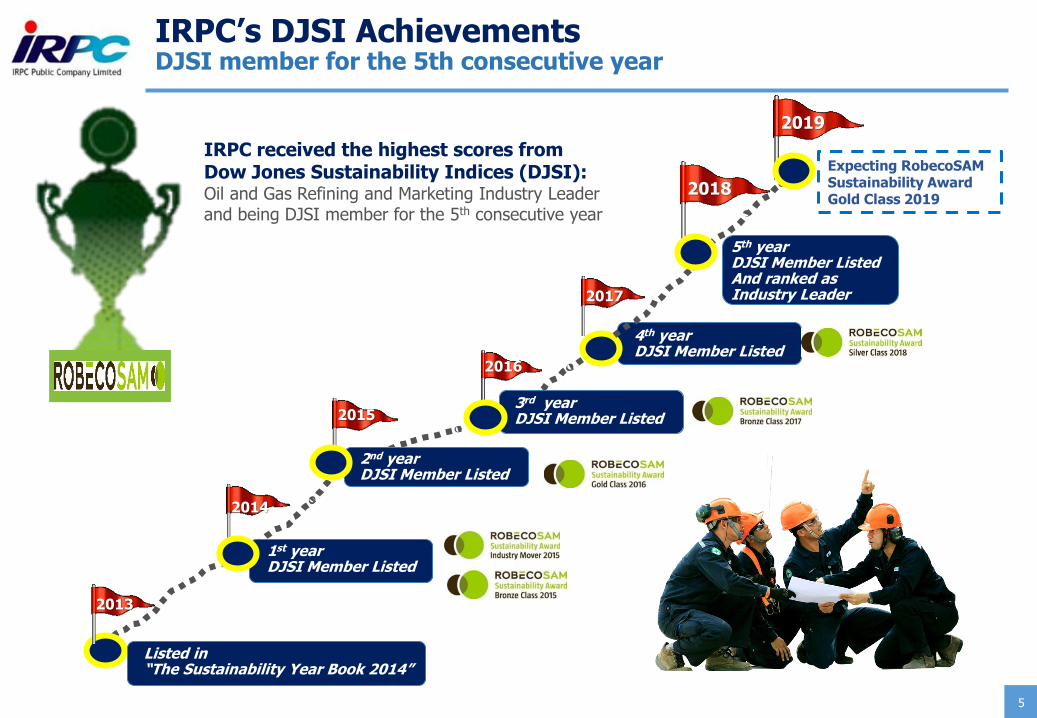
IRPC’s DJSI Achievements DJSI member for the 5th consecutive year
2018
2014
2015
2016
2017
Listed in “The Sustainability Year Book 2014”
1st yearDJSI Member Listed
2nd yearDJSI Member Listed
3rd yearDJSI Member Listed
4th yearDJSI Member Listed
2013
5th yearDJSI Member ListedAnd ranked as Industry Leader
IRPC received the highest scores from Dow Jones Sustainability Indices (DJSI):Oil and Gas Refining and Marketing Industry Leader and being DJSI member for the 5th consecutive year
Expecting RobecoSAMSustainability Award Gold Class 2019
2019
Performance by Business
Financial Performance
Strategic Direction
3Q18 Highlight
6
Projects Update
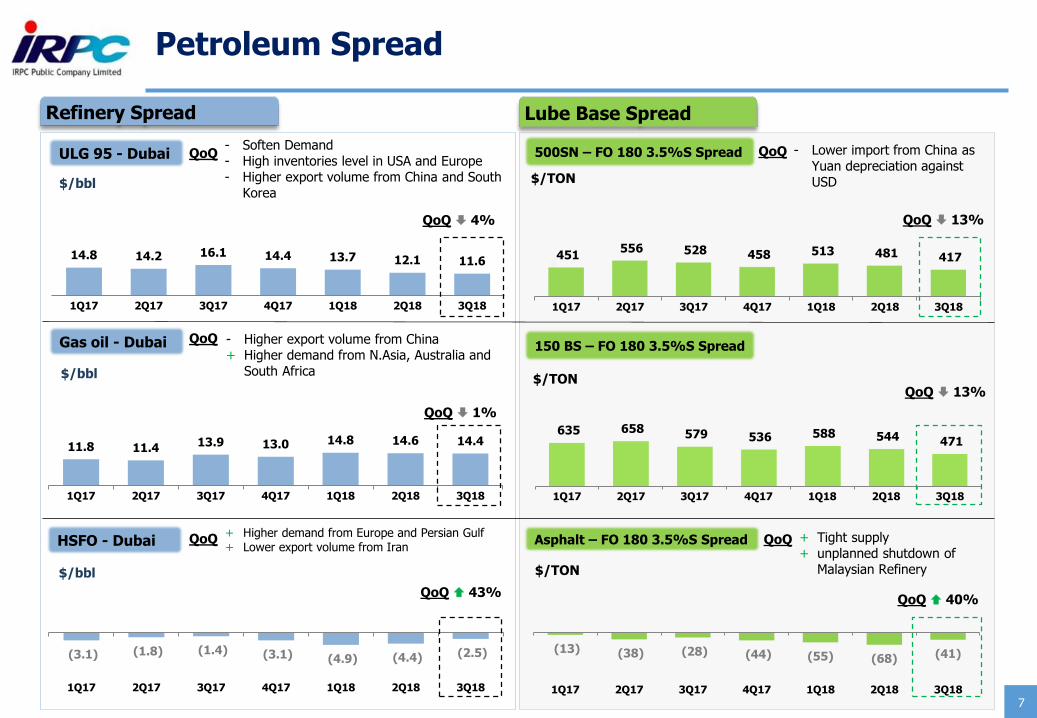
Petroleum Spread
7
+ Higher demand from Europe and Persian Gulf+ Lower export volume from Iran
11.8 11.4 13.9 13.0 14.8 14.6 14.4
1Q17 2Q17 3Q17 4Q17 1Q18 2Q18 3Q18
- Soften Demand- High inventories level in USA and Europe- Higher export volume from China and South
Korea
14.8 14.2 16.1 14.4 13.7 12.1 11.6
1Q17 2Q17 3Q17 4Q17 1Q18 2Q18 3Q18
(3.1) (1.8) (1.4) (3.1) (4.9) (4.4) (2.5)
1Q17 2Q17 3Q17 4Q17 1Q18 2Q18 3Q18
500SN – FO 180 3.5%S Spread
150 BS – FO 180 3.5%S Spread
Asphalt – FO 180 3.5%S Spread
$/bbl
$/bbl
$/bbl
Lube Base SpreadRefinery Spread
Gas oil - Dubai
ULG 95 - Dubai
HSFO - Dubai
(13) (38) (28) (44) (55) (68) (41)
1Q17 2Q17 3Q17 4Q17 1Q18 2Q18 3Q18
635 658 579 536 588 544 471
1Q17 2Q17 3Q17 4Q17 1Q18 2Q18 3Q18
451 556 528 458 513 481 417
1Q17 2Q17 3Q17 4Q17 1Q18 2Q18 3Q18
QoQ 13%
QoQ 43%
QoQ 13%
QoQ 1%
QoQ 40%
- Higher export volume from China + Higher demand from N.Asia, Australia and
South Africa
QoQ 4%
+ Tight supply + unplanned shutdown of
Malaysian Refinery
QoQ
QoQ
QoQ
QoQ
QoQ
$/TON
$/TON
$/TON
- Lower import from China as Yuan depreciation against USD
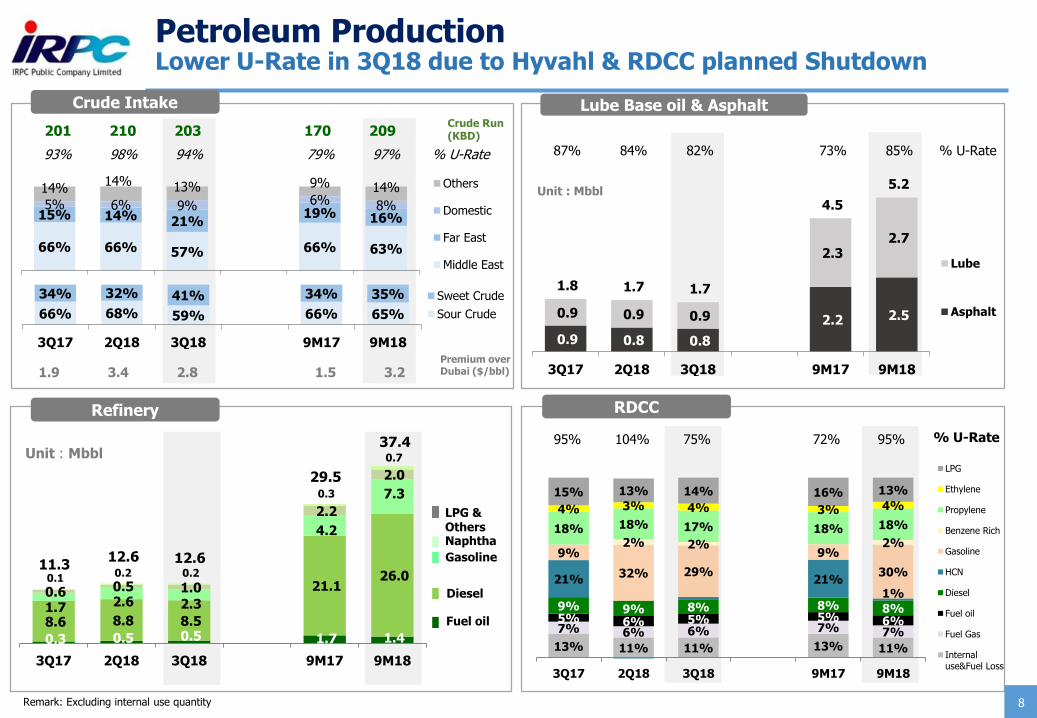
13% 11% 11% 13% 11%
7% 6% 6% 7% 7%5% 6% 5% 5% 6%
9% 9% 8% 8% 8%
21% 21%1%
9%
32% 29%
9%
30%
2% 2% 2%18% 18% 17% 18% 18%
4% 3% 4% 3% 4%15% 13% 14% 16% 13%
3Q17 2Q18 3Q18 . 9M17 9M18
LPG
Ethylene
Propylene
Benzene Rich
Gasoline
HCN
Diesel
Fuel oil
Fuel Gas
Internaluse&Fuel Loss
0.9 0.8 0.8
2.2 2.5 0.9 0.9 0.9
2.3 2.7
1.8 1.7 1.7
4.5
5.2
3Q17 2Q18 3Q18 9M17 9M18
Lube
Asphalt66% 68% 59% 66% 65%
34% 32% 41% 34% 35%
3Q17 2Q18 3Q18 9M17 9M18
Sweet Crude
Sour Crude
201 210 203 170 209
Petroleum ProductionLower U-Rate in 3Q18 due to Hyvahl & RDCC planned Shutdown
1.9 3.4 2.8 1.5 3.2
93% 98% 94% 79% 97% % U-Rate
Unit : Mbbl
Unit : Mbbl
LPG & OthersNaphtha
Gasoline
Diesel
Fuel oil
Remark: Excluding internal use quantity
Premium over Dubai ($/bbl)
95% 104% 75% 72% 95% % U-Rate
Crude Intake
RDCC Refinery
Lube Base oil & Asphalt
87% 84% 82% 73% 85% % U-Rate
0.3 0.5 0.5 1.7 1.4 8.6 8.8 8.5
21.1 26.0
1.7 2.6 2.3
4.2
7.3
0.6 0.5 1.0
2.2
2.0
0.1 0.2 0.2
0.3
0.7
11.3 12.6 12.6
29.5
37.4
3Q17 2Q18 3Q18 9M17 9M18
8
66% 66% 57% 66% 63%
15% 14% 21%19% 16%
5% 6% 9% 6% 8%
14%14% 13% 9% 14% Others
Domestic
Far East
Middle East
Crude Run (KBD)
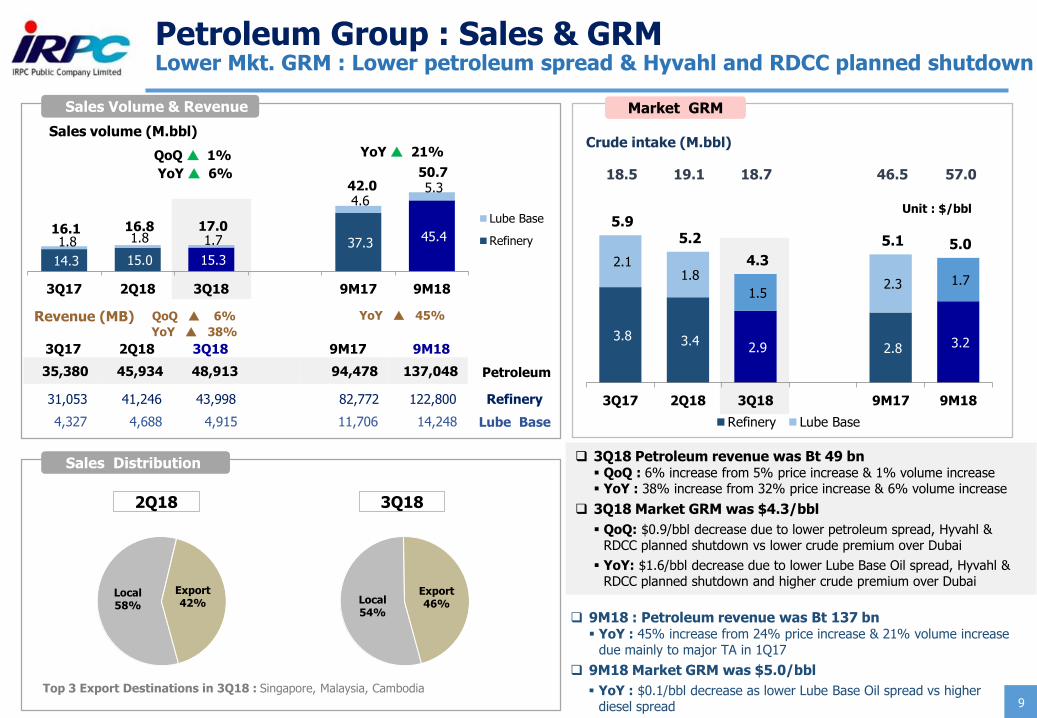
Petroleum Group : Sales & GRMLower Mkt. GRM : Lower petroleum spread & Hyvahl and RDCC planned shutdown
3.8 3.4 2.9 2.8 3.2
2.1 1.8
1.5 2.3 1.7
5.9 5.2
4.3
5.1 5.0
3Q17 2Q18 3Q18 9M17 9M18
Refinery Lube Base4,327 4,688 4,915 11,706 14,248
14.3 15.0 15.3
37.3 45.4 1.8 1.8 1.7
4.6 5.3
16.1 16.8 17.0
42.0 50.7
3Q17 2Q18 3Q18 9M17 9M18
Lube Base
Refinery
31,053 41,246 43,998 82,772 122,800 Refinery
35,380 45,934 48,913 94,478 137,048
Sales Volume & Revenue
18.5 19.1 18.7 46.5 57.0
Crude intake (M.bbl)
Unit : $/bbl
Sales Distribution
Top 3 Export Destinations in 3Q18 : Singapore, Malaysia, Cambodia
YoY 6%
QoQ 1%
YoY 38%
QoQ 6%
Sales volume (M.bbl)
Revenue (MB)
❑ 9M18 : Petroleum revenue was Bt 137 bn▪ YoY : 45% increase from 24% price increase & 21% volume increase
due mainly to major TA in 1Q17
❑ 9M18 Market GRM was $5.0/bbl
▪ YoY : $0.1/bbl decrease as lower Lube Base Oil spread vs higher diesel spread
3Q17 2Q18 3Q18 9M17 9M18
Market GRM
❑ 3Q18 Petroleum revenue was Bt 49 bn▪ QoQ : 6% increase from 5% price increase & 1% volume increase▪ YoY : 38% increase from 32% price increase & 6% volume increase
❑ 3Q18 Market GRM was $4.3/bbl
▪ QoQ: $0.9/bbl decrease due to lower petroleum spread, Hyvahl & RDCC planned shutdown vs lower crude premium over Dubai
▪ YoY: $1.6/bbl decrease due to lower Lube Base Oil spread, Hyvahl & RDCC planned shutdown and higher crude premium over Dubai
9
YoY 21%
YoY 45%
Petroleum
Lube Base
Local58%
Export42%
2Q18
Local54%
Export46%
3Q18

10
Petrochemical Spread
200 170 159
109 137 115 121
1Q17 2Q17 3Q17 4Q17 1Q18 2Q18 3Q18
591 544 622 626 659 581 550
171 286 201 284 367 427 267
762 830 823 910 1,026 1,008
817
1Q17 2Q17 3Q17 4Q17 1Q18 2Q18 3Q18
Ethylene-NP HDPE-Ethylene
192 202 182 114
182 164 217
1Q17 2Q17 3Q17 4Q17 1Q18 2Q18 3Q18
1,029 878 977 905 998 945 898
1Q17 2Q17 3Q17 4Q17 1Q18 2Q18 3Q18
435 296 323 258 406 362 361
228 365 356 363 287 298 256
663 661 679 621 693 660 617
1Q17 2Q17 3Q17 4Q17 1Q18 2Q18 3Q18
Propylene-NP PP-Propylene
HDPE-Ethylene –Naphtha Spread
PP-Propylene –Naphtha Spread
MX – Naphtha SpreadToluene – Naphtha Spread
PS –Naphtha SpreadABS –Naphtha Spread
Ole
fin
sS
tyre
nic
sA
rom
ati
cs
1,382 1,226 1,377 1,353 1,428 1,379 1,248
1Q17 2Q17 3Q17 4Q17 1Q18 2Q18 3Q18
- Lower demand from Monsoon
QoQ 19% QoQ 7%
QoQ 5%
QoQ 5% QoQ 9%
QoQ 32%
- Higher utilization rate - Soften demand from China
- Lower Chinese demand due to weaken Yuan
+ Tight supply from turnaround
QoQ
QoQ
QoQ
QoQ
QoQ
QoQ
+ Increasing demand
$/TON
$/TON
$/TON$/TON
$/TON
$/TON
+ Higher PX demand+ Tight supply from turnaround in
N.E.A.
- High production volume in China- Weaken demand
109 106 87
253 297
4 4 6
9
14
81 87 86
229
250
194 197 179
490
561
100 75 61 192 209
162 196 202
401
592
261 271 263
592
801
Polyolefins
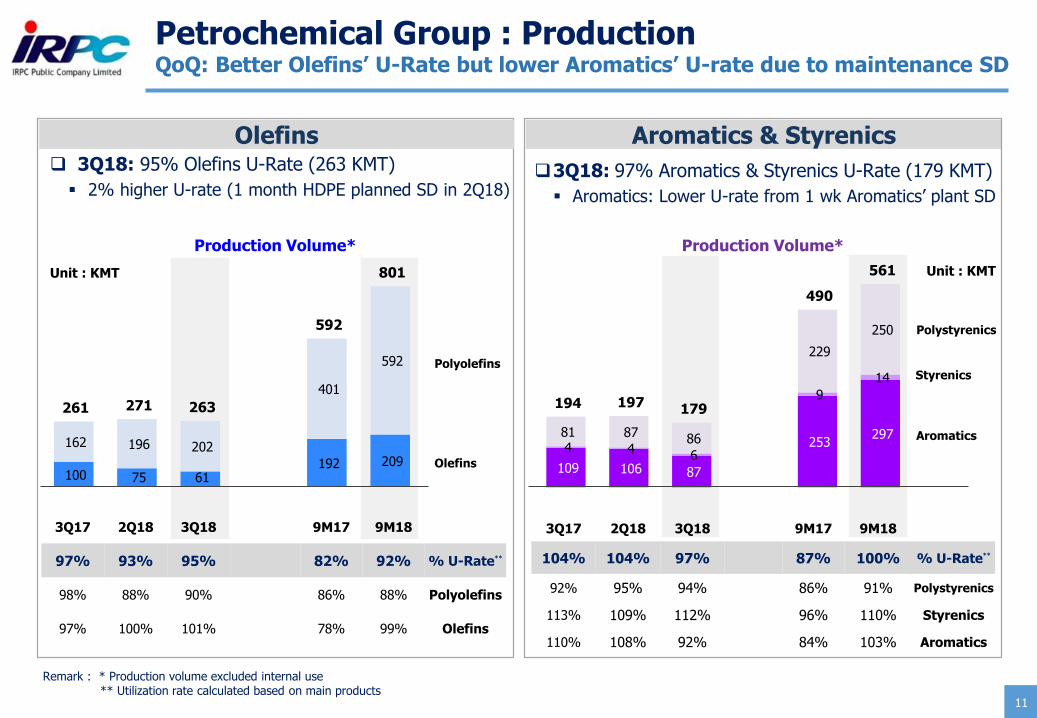
Petrochemical Group : ProductionQoQ: Better Olefins’ U-Rate but lower Aromatics’ U-rate due to maintenance SD
3Q17 2Q18 3Q18 9M17 9M18
97% 93% 95% 82% 92% % U-Rate**
98% 88% 90% 86% 88% Polyolefins
97% 100% 101% 78% 99% Olefins
Aromatics & StyrenicsOlefins
3Q17 2Q18 3Q18 9M17 9M18
104% 104% 97% 87% 100% % U-Rate**
92% 95% 94% 86% 91% Polystyrenics
113% 109% 112% 96% 110% Styrenics
110% 108% 92% 84% 103% Aromatics
Olefins
Unit : KMT
Remark : * Production volume excluded internal use** Utilization rate calculated based on main products
❑ 3Q18: 95% Olefins U-Rate (263 KMT)
▪ 2% higher U-rate (1 month HDPE planned SD in 2Q18)
Polystyrenics
Styrenics
Aromatics
❑3Q18: 97% Aromatics & Styrenics U-Rate (179 KMT)
▪ Aromatics: Lower U-rate from 1 wk Aromatics’ plant SD
Unit : KMT
11
Production Volume* Production Volume*
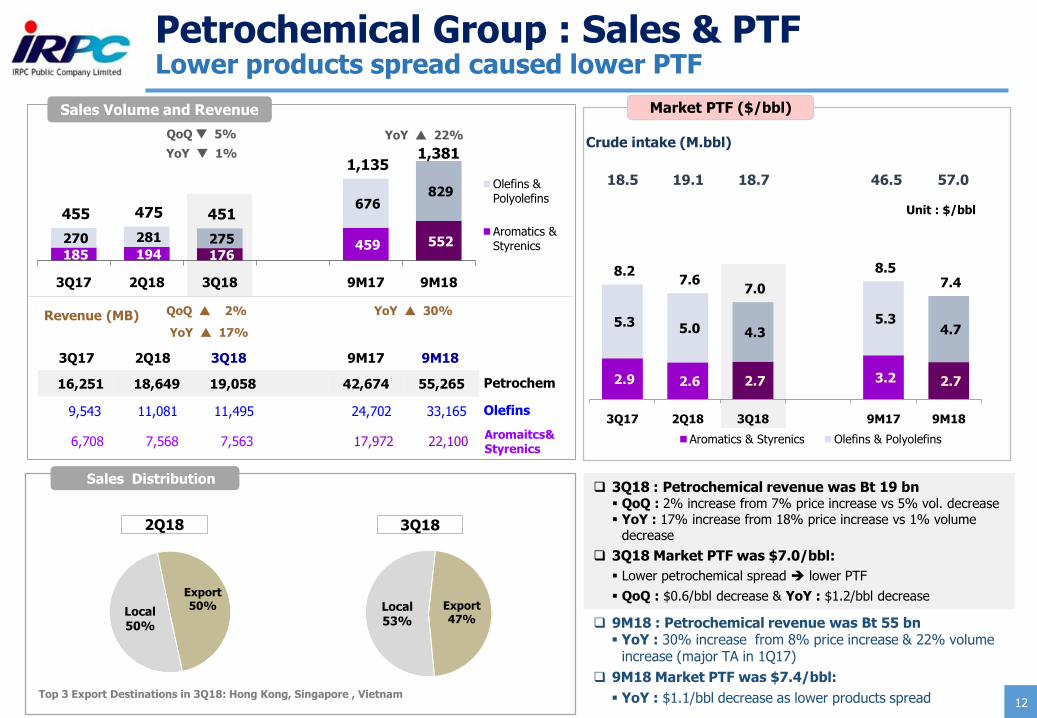
Petrochemical Group : Sales & PTFLower products spread caused lower PTF
185 194 176 459 552 270 281 275
676 829
455 475 451
1,135 1,381
3Q17 2Q18 3Q18 9M17 9M18
Olefins &Polyolefins
Aromatics &Styrenics
2.9 2.6 2.7 3.2 2.7
5.3 5.0 4.3 5.3
4.7
8.2 7.6
7.0
8.5 7.4
3Q17 2Q18 3Q18 9M17 9M18
Unit : $/bbl
Aromatics & Styrenics Olefins & Polyolefins
Sales Volume and Revenue
Sales Distribution
Top 3 Export Destinations in 3Q18: Hong Kong, Singapore , Vietnam
QoQ 5%
QoQ 2% Revenue (MB)
3Q17 2Q18 3Q18 9M17 9M18
YoY 1%
YoY 17%
Market PTF ($/bbl)
16,251 18,649 19,058 42,674 55,265
9,543 11,081 11,495 24,702 33,165
6,708 7,568 7,563 17,972 22,100
12
YoY 22%
YoY 30%
Petrochem
Olefins
Aromaitcs&Styrenics
❑ 9M18 : Petrochemical revenue was Bt 55 bn▪ YoY : 30% increase from 8% price increase & 22% volume
increase (major TA in 1Q17)
❑ 9M18 Market PTF was $7.4/bbl:
▪ YoY : $1.1/bbl decrease as lower products spread
❑ 3Q18 : Petrochemical revenue was Bt 19 bn▪ QoQ : 2% increase from 7% price increase vs 5% vol. decrease▪ YoY : 17% increase from 18% price increase vs 1% volume
decrease
❑ 3Q18 Market PTF was $7.0/bbl:
▪ Lower petrochemical spread ➔ lower PTF
▪ QoQ : $0.6/bbl decrease & YoY : $1.2/bbl decrease Local53%
Export47%
3Q18
Local50%
Export50%
2Q18
18.5 19.1 18.7 46.5 57.0
Crude intake (M.bbl)
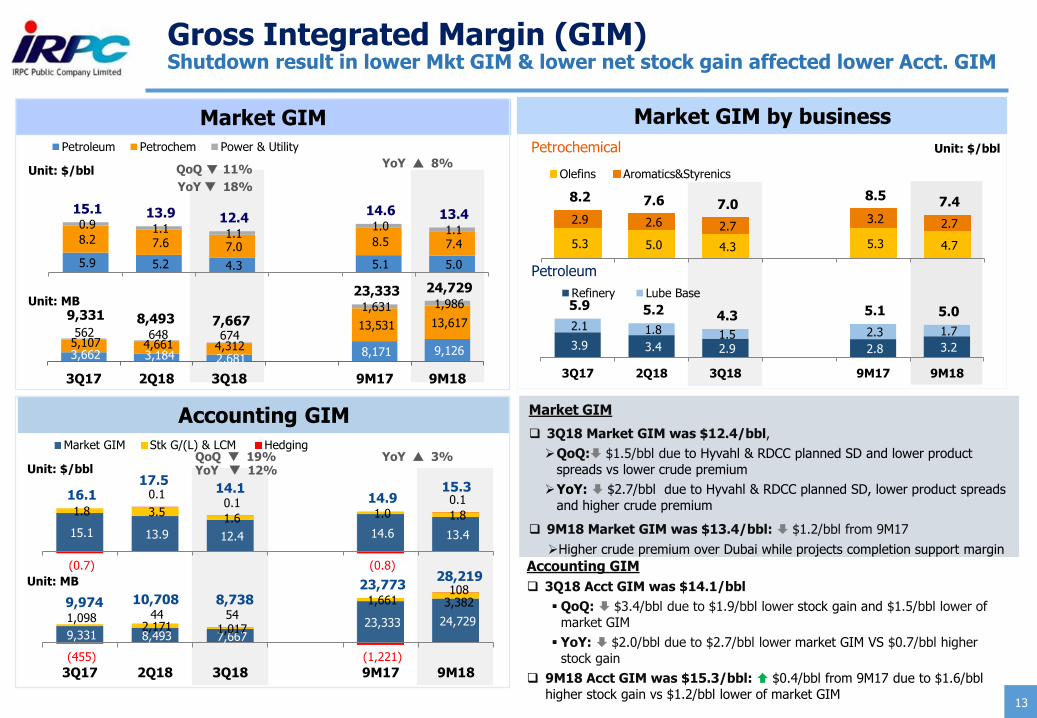
Market GIM
❑ 3Q18 Market GIM was $12.4/bbl,
➢QoQ: $1.5/bbl due to Hyvahl & RDCC planned SD and lower product
spreads vs lower crude premium
➢YoY: $2.7/bbl due to Hyvahl & RDCC planned SD, lower product spreads
and higher crude premium
❑ 9M18 Market GIM was $13.4/bbl: $1.2/bbl from 9M17
➢Higher crude premium over Dubai while projects completion support margin
3.9 3.4 2.9 2.8 3.2
2.1 1.8 1.5 2.3 1.7
5.9 5.2 4.3 5.1 5.0
3Q17 2Q18 3Q18 9M17 9M18
Refinery Lube Base
5.3 5.0 4.3 5.3 4.7
2.9 2.6 2.7 3.2 2.7
8.2 7.6 7.0 8.5 7.4
Olefins Aromatics&Styrenics
5.9 5.2 4.3 5.1 5.0
8.2 7.6 7.0 8.5 7.4
0.9 1.1 1.1 1.0 1.1
15.1 13.9 12.4 14.6 13.4
Petroleum Petrochem Power & Utility
3,662 3,184 2,681 8,171 9,126
5,107 4,661 4,312
13,531 13,617 562 648 674
1,631 1,986 9,331 8,493 7,667
23,333 24,729
3Q17 2Q18 3Q18 9M17 9M18
9,331 8,493 7,667 23,333 24,729 1,098
2,171 1,017
1,661 3,382
(455)
44 54
(1,221)
108 9,974 10,708 8,738
23,773 28,219
3Q17 2Q18 3Q18 9M17 9M18
15.1 13.9 12.4 14.6 13.4
1.8 3.5 1.6 1.0 1.8
(0.7)
0.1 0.1
(0.8)
0.1 16.1 17.5
14.114.9
15.3
Market GIM Stk G/(L) & LCM Hedging
Market GIM
Unit: $/bbl
Accounting GIM
Unit: $/bbl
Unit: MB
Market GIM by business
Unit: $/bblPetrochemical
Petroleum
Unit: MB
13
Gross Integrated Margin (GIM)Shutdown result in lower Mkt GIM & lower net stock gain affected lower Acct. GIM
YoY 18%
QoQ 11%
YoY 8%
YoY 12% YoY 3% QoQ 19%
Accounting GIM
❑ 3Q18 Acct GIM was $14.1/bbl
▪ QoQ: $3.4/bbl due to $1.9/bbl lower stock gain and $1.5/bbl lower of
market GIM
▪ YoY: $2.0/bbl due to $2.7/bbl lower market GIM VS $0.7/bbl higher
stock gain
❑ 9M18 Acct GIM was $15.3/bbl: $0.4/bbl from 9M17 due to $1.6/bbl
higher stock gain vs $1.2/bbl lower of market GIM
Performance by Business
Financial Performance
Strategic Direction
3Q18 Highlight
14
Projects Update
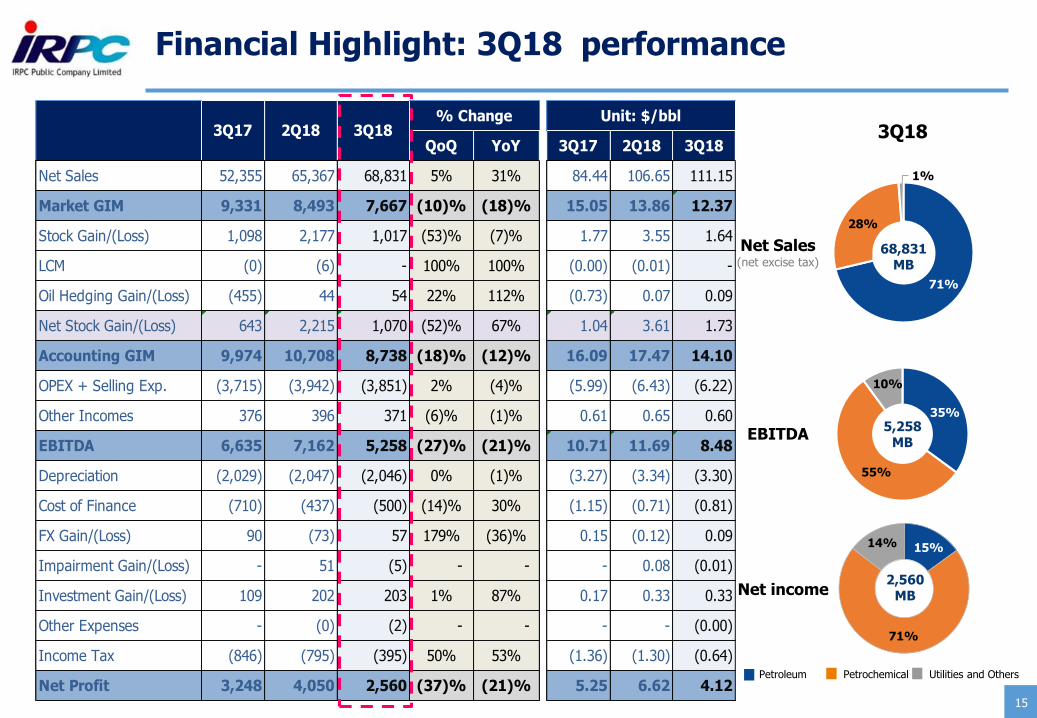
QoQ YoY 3Q17 2Q18 3Q18
Net Sales 52,355 65,367 68,831 5% 31% 84.44 106.65 111.15
Market GIM 9,331 8,493 7,667 (10)% (18)% 15.05 13.86 12.37
Stock Gain/(Loss) 1,098 2,177 1,017 (53)% (7)% 1.77 3.55 1.64
LCM (0) (6) - 100% 100% (0.00) (0.01) -
Oil Hedging Gain/(Loss) (455) 44 54 22% 112% (0.73) 0.07 0.09
Net Stock Gain/(Loss) 643 2,215 1,070 (52)% 67% 1.04 3.61 1.73
Accounting GIM 9,974 10,708 8,738 (18)% (12)% 16.09 17.47 14.10
OPEX + Selling Exp. (3,715) (3,942) (3,851) 2% (4)% (5.99) (6.43) (6.22)
Other Incomes 376 396 371 (6)% (1)% 0.61 0.65 0.60
EBITDA 6,635 7,162 5,258 (27)% (21)% 10.71 11.69 8.48
Depreciation (2,029) (2,047) (2,046) 0% (1)% (3.27) (3.34) (3.30)
Cost of Finance (710) (437) (500) (14)% 30% (1.15) (0.71) (0.81)
FX Gain/(Loss) 90 (73) 57 179% (36)% 0.15 (0.12) 0.09
Impairment Gain/(Loss) - 51 (5) - - - 0.08 (0.01)
Investment Gain/(Loss) 109 202 203 1% 87% 0.17 0.33 0.33
Other Expenses - (0) (2) - - - - (0.00)
Income Tax (846) (795) (395) 50% 53% (1.36) (1.30) (0.64)
Net Profit 3,248 4,050 2,560 (37)% (21)% 5.25 6.62 4.12
Unit: $/bbl3Q17 2Q18 3Q18
% Change
15
Financial Highlight: 3Q18 performance
Net Sales(net excise tax)
EBITDA
Net income
3Q18
35%
55%
10%
71%
28%
1%
68,831MB
5,258MB
15%
71%
14%
2,560MB
Petroleum Petrochemical Utilities and Others
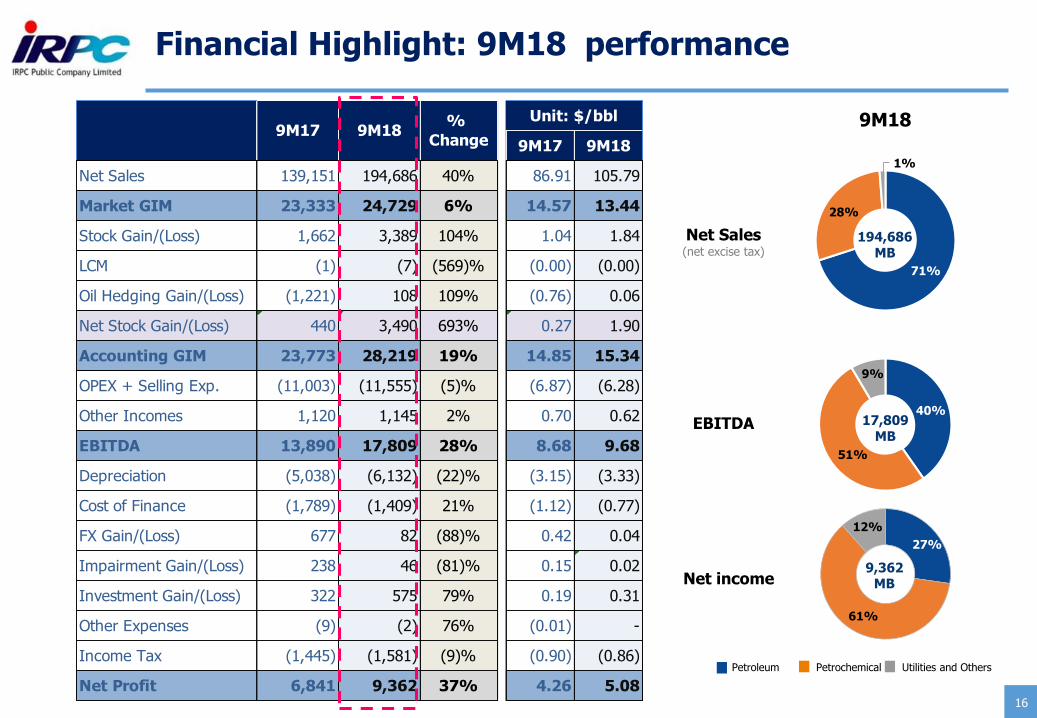
9M17 9M18
Net Sales 139,151 194,686 40% 86.91 105.79
Market GIM 23,333 24,729 6% 14.57 13.44
Stock Gain/(Loss) 1,662 3,389 104% 1.04 1.84
LCM (1) (7) (569)% (0.00) (0.00)
Oil Hedging Gain/(Loss) (1,221) 108 109% (0.76) 0.06
Net Stock Gain/(Loss) 440 3,490 693% 0.27 1.90
Accounting GIM 23,773 28,219 19% 14.85 15.34
OPEX + Selling Exp. (11,003) (11,555) (5)% (6.87) (6.28)
Other Incomes 1,120 1,145 2% 0.70 0.62
EBITDA 13,890 17,809 28% 8.68 9.68
Depreciation (5,038) (6,132) (22)% (3.15) (3.33)
Cost of Finance (1,789) (1,409) 21% (1.12) (0.77)
FX Gain/(Loss) 677 82 (88)% 0.42 0.04
Impairment Gain/(Loss) 238 46 (81)% 0.15 0.02
Investment Gain/(Loss) 322 575 79% 0.19 0.31
Other Expenses (9) (2) 76% (0.01) -
Income Tax (1,445) (1,581) (9)% (0.90) (0.86)
Net Profit 6,841 9,362 37% 4.26 5.08
Unit: $/bbl%
Change9M17 9M18
16
Financial Highlight: 9M18 performance
27%
61%
12%
9M18
40%
51%
9%
71%
28%
1%
194,686MB
17,809MB
9,362MB
Net Sales(net excise tax)
EBITDA
Net income
Petroleum Petrochemical Utilities and Others

699 3,734 6,358 6,438
17,416 1,936
4,516
3,363
6,887
699
7,098 8,294
13,325
21,932
2018 2019 2020 2021 >2021
THB Bond
USD Loan
THB Loan
128,324 126,970
8,637 9,220
45,438 52,753
2,145 2,336
87,650 88,996
2,378 2,537
55,812 51,347
38,704 48,399
Financial PositionIncrease ST loans to support crude payment due to high crude oil price
Maturity of Long-term Debt
Debt ProfileStatements of Financial Position
Cash Flow
Unit : MB
Remark: Long-term debt as at 30 Sep 2018
Unit: MB
PP&E
Other Non-C/A
Cash
184,544
Other CurrentLiabilities
LT Liabilities incl. current port.
Shareholders’Equity
Sep. 2018
191,279
Dec. 2017
Other CA
Other Non-CurrentLiabilities
Beginning Cash
1 Jan 2018
Ending Cash30 Sep 2018
Cash Flow from
Operating
Unit: MB
Cash Flow from
Investing
Cash Flow from
Financing
Net Debt = 61,412 MB
Ex. Rate = 32.58 Baht/$
Financial Ratios
< 1.0x
Net D/E CA/CL
17
0.74 0.61 0.69
3Q17 2Q18 3Q18
0.85 0.90 1.00
3Q17 2Q18 3Q18
ST Loan20%
LT Loan (USD)10%
LT Loan (THB)54%
Bond (THB)16%
Float 84 THB 66
Fixed 16 USD 34
Currency (%) Interest Rate (%)
Performance by Business
Financial Performance
Strategic Direction
3Q18 Highlight
18
Projects Update
19
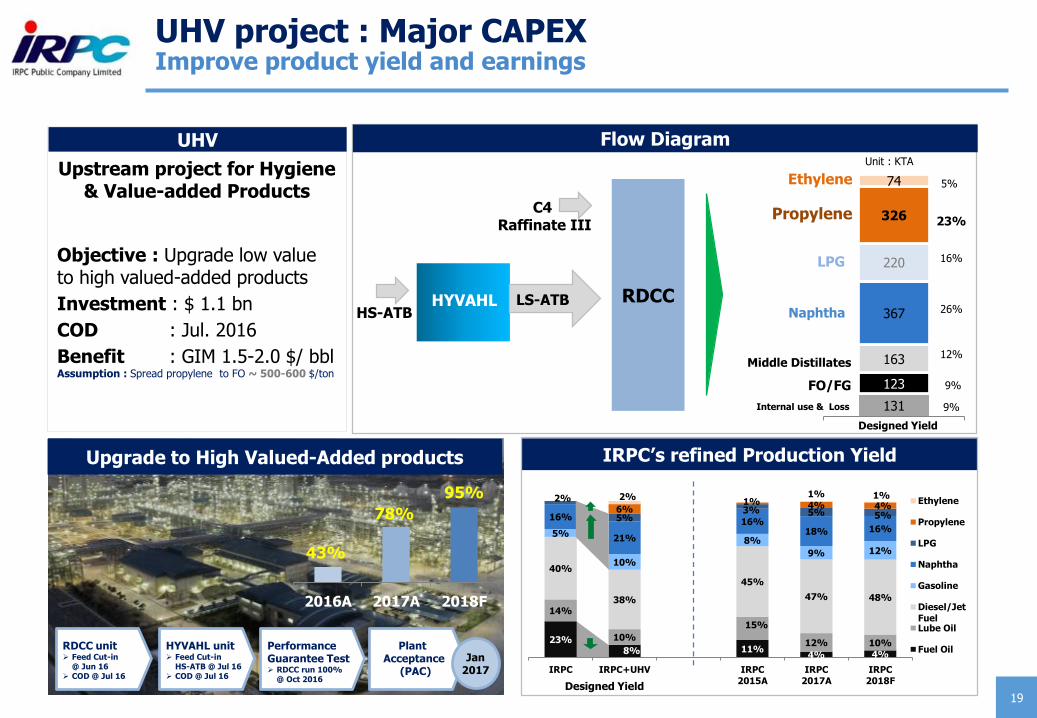
UHV project : Major CAPEXImprove product yield and earnings
IRPC’s refined Production Yield
Upstream project for Hygiene & Value-added Products
Objective : Upgrade low value to high valued-added products
Investment : $ 1.1 bn
COD : Jul. 2016
Benefit : GIM 1.5-2.0 $/ bblAssumption : Spread propylene to FO ~ 500-600 $/ton
RDCC unit➢ Feed Cut-in
@ Jun 16➢ COD @ Jul 16
HYVAHL unit➢ Feed Cut-in
HS-ATB @ Jul 16➢ COD @ Jul 16
Performance Guarantee Test➢ RDCC run 100%
@ Oct 2016
Plant Acceptance
(PAC)
Jan 2017
43%
78%
95%
2016A 2017A 2018F
Upgrade to High Valued-Added products
131
123
163
367
220
326
74
HS-ATB
LPG
Ethylene
HYVAHL
Propylene
Naphtha
FO/FG
Middle Distillates
RDCC
C4 Raffinate III
Internal use & Loss
Unit : KTA
16%
5%
23%
9%
9%
26%
12%
Flow Diagram
LS-ATB
UHV
Designed Yield
23%8% 11%
4% 4%
14%
10%
15%
12% 10%
40%
38%
45%
47% 48%
5%
10%
8%
9% 12%
16%
21%
16%18% 16%
2%
5%3% 5% 5%
6%1% 4% 4%
2% 1% 1%
IRPC IRPC+UHV IRPC2015A
IRPC2017A
IRPC2018F
Ethylene
Propylene
LPG
Naphtha
Gasoline
Diesel/JetFuelLube Oil
Fuel Oil
Designed Yield
20
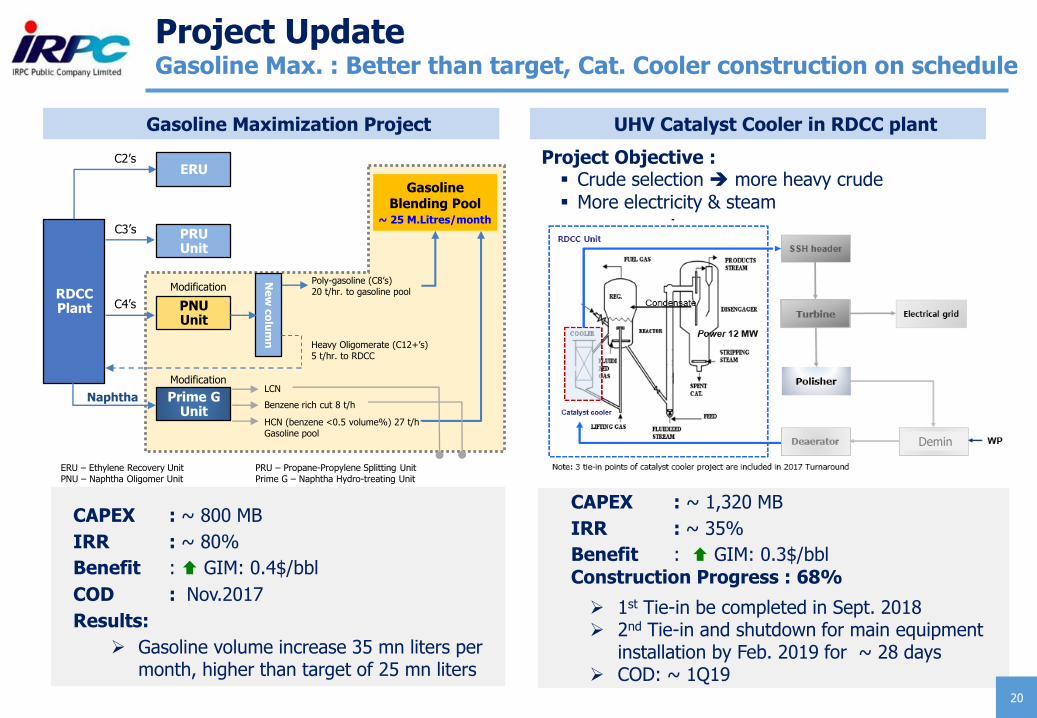
Project UpdateGasoline Max. : Better than target, Cat. Cooler construction on schedule
Gasoline Maximization Project UHV Catalyst Cooler in RDCC plant
CAPEX : ~ 800 MB
IRR : ~ 80%
Benefit : GIM: 0.4$/bbl
COD : Nov.2017
Results:
➢ Gasoline volume increase 35 mn liters per month, higher than target of 25 mn liters
Demin
RDCC Plant
ERU
PRU Unit
PNU Unit
Prime G Unit
Ne
w c
olu
mn
GasolineBlending Pool
~ 25 M.Litres/month
C2’s
C3’s
C4’s
Naphtha
Modification
Modification
Poly-gasoline (C8’s)20 t/hr. to gasoline pool
Heavy Oligomerate (C12+’s)5 t/hr. to RDCC
HCN (benzene <0.5 volume%) 27 t/h Gasoline pool
Benzene rich cut 8 t/h
LCN
ERU – Ethylene Recovery Unit PRU – Propane-Propylene Splitting Unit PNU – Naphtha Oligomer Unit Prime G – Naphtha Hydro-treating Unit
CAPEX : ~ 1,320 MB
IRR : ~ 35%
Benefit : GIM: 0.3$/bblConstruction Progress : 68%
➢ 1st Tie-in be completed in Sept. 2018➢ 2nd Tie-in and shutdown for main equipment
installation by Feb. 2019 for ~ 28 days➢ COD: ~ 1Q19
Project Objective :▪ Crude selection ➔ more heavy crude▪ More electricity & steam
21
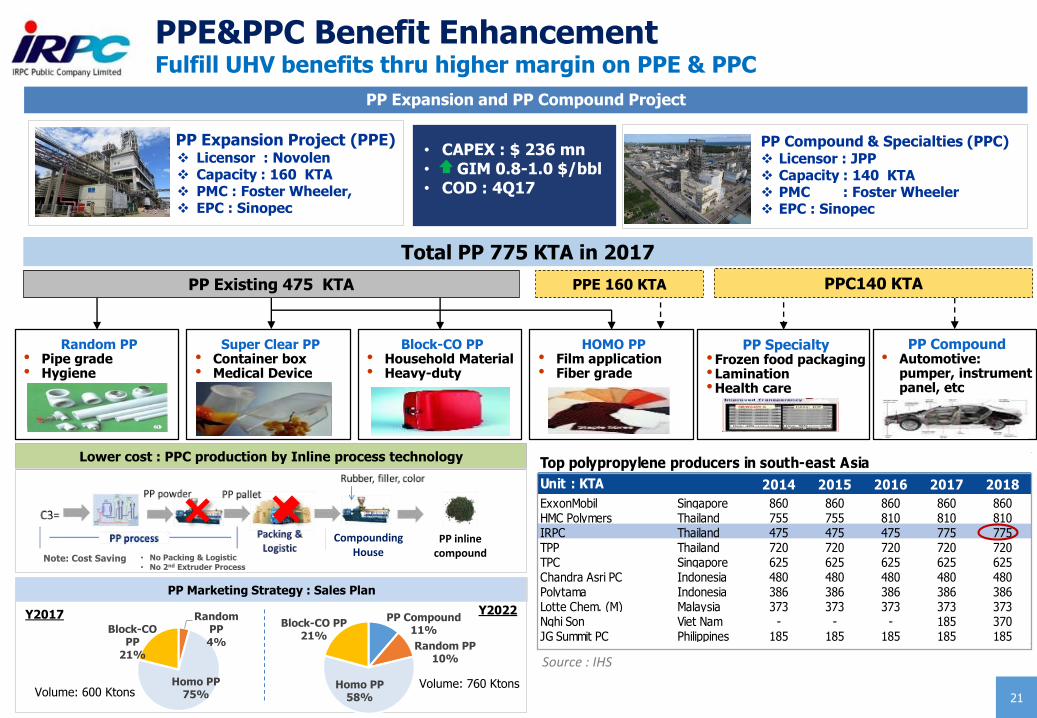
PPE&PPC Benefit EnhancementFulfill UHV benefits thru higher margin on PPE & PPC
Random PP• Pipe grade• Hygiene
Super Clear PP• Container box• Medical Device
Block-CO PP• Household Material• Heavy-duty
HOMO PP• Film application• Fiber grade
PP Specialty•Frozen food packaging•Lamination•Health care
PP Compound• Automotive:
pumper, instrument panel, etc
PPE 160 KTA PPC140 KTA
Total PP 775 KTA in 2017
PP Existing 475 KTA
PP Expansion and PP Compound Project
CompoundingHouse
PP inline compound
Lower cost : PPC production by Inline process technology
Note: Cost Saving • No Packing & Logistic• No 2nd Extruder Process
PP Marketing Strategy : Sales Plan
Y2017
Volume: 600 Ktons
Y2022
Volume: 760 Ktons
PP Expansion Project (PPE)❖ Licensor : Novolen ❖ Capacity : 160 KTA ❖ PMC : Foster Wheeler, ❖ EPC : Sinopec
• CAPEX : $ 236 mn• GIM 0.8-1.0 $/bbl• COD : 4Q17
Top polypropylene producers in south-east Asia
2014 2015 2016 2017 2018
ExxonMobil Singapore 860 860 860 860 860HMC Polymers Thailand 755 755 810 810 810IRPC Thailand 475 475 475 775 775TPP Thailand 720 720 720 720 720TPC Singapore 625 625 625 625 625Chandra Asri PC Indonesia 480 480 480 480 480Polytama Indonesia 386 386 386 386 386Lotte Chem. (M) Malaysia 373 373 373 373 373Nghi Son Viet Nam - - - 185 370JG Summit PC Philippines 185 185 185 185 185
Unit : KTA
Source : IHS
Random PP4%
Homo PP75%
Block-CO PP
21%
PP Compound11%
Random PP10%
Homo PP58%
Block-CO PP21%
PP Compound & Specialties (PPC) ❖ Licensor : JPP❖ Capacity : 140 KTA❖ PMC : Foster Wheeler ❖ EPC : Sinopec
22
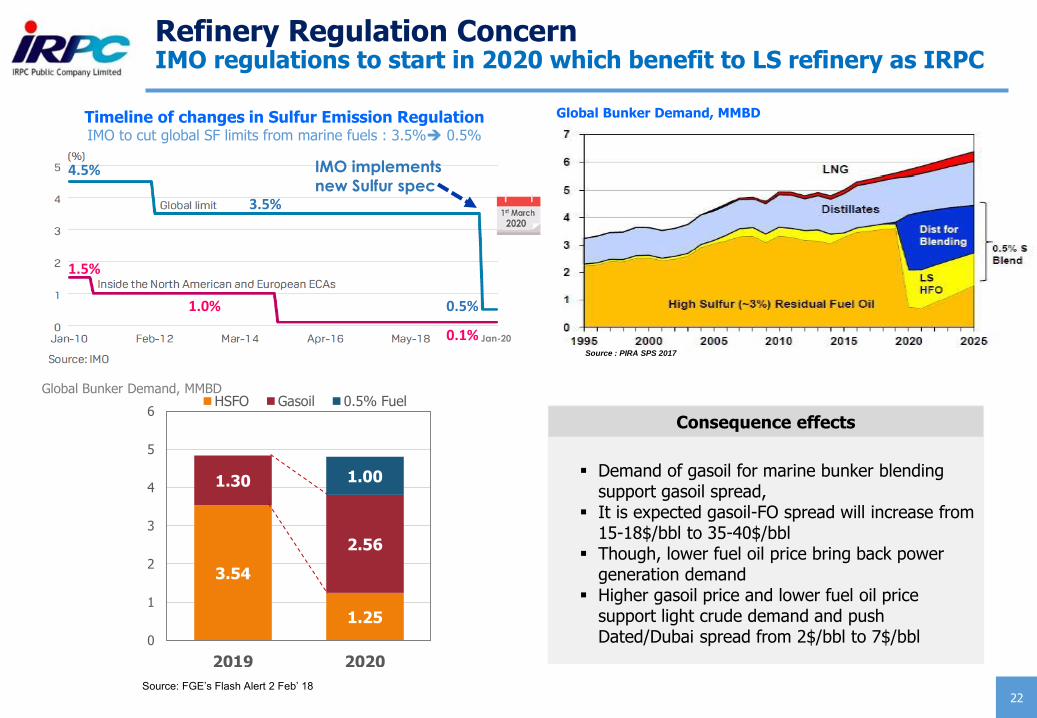
Refinery Regulation ConcernIMO regulations to start in 2020 which benefit to LS refinery as IRPC
Source : PIRA SPS 2017
1.5%
1.0%
4.5%
3.5%
0.5%
Jan-200.1%
IMO implements
new Sulfur spec
Timeline of changes in Sulfur Emission RegulationIMO to cut global SF limits from marine fuels : 3.5%➔ 0.5%
Global Bunker Demand, MMBD
Source: FGE’s Flash Alert 2 Feb’ 18
Consequence effects
▪ Demand of gasoil for marine bunker blending support gasoil spread,
▪ It is expected gasoil-FO spread will increase from 15-18$/bbl to 35-40$/bbl
▪ Though, lower fuel oil price bring back power generation demand
▪ Higher gasoil price and lower fuel oil price support light crude demand and push Dated/Dubai spread from 2$/bbl to 7$/bbl
3.54
1.25
1.30
2.56
1.00
0
1
2
3
4
5
6
2019 2020
HSFO Gasoil 0.5% FuelGlobal Bunker Demand, MMBD
23
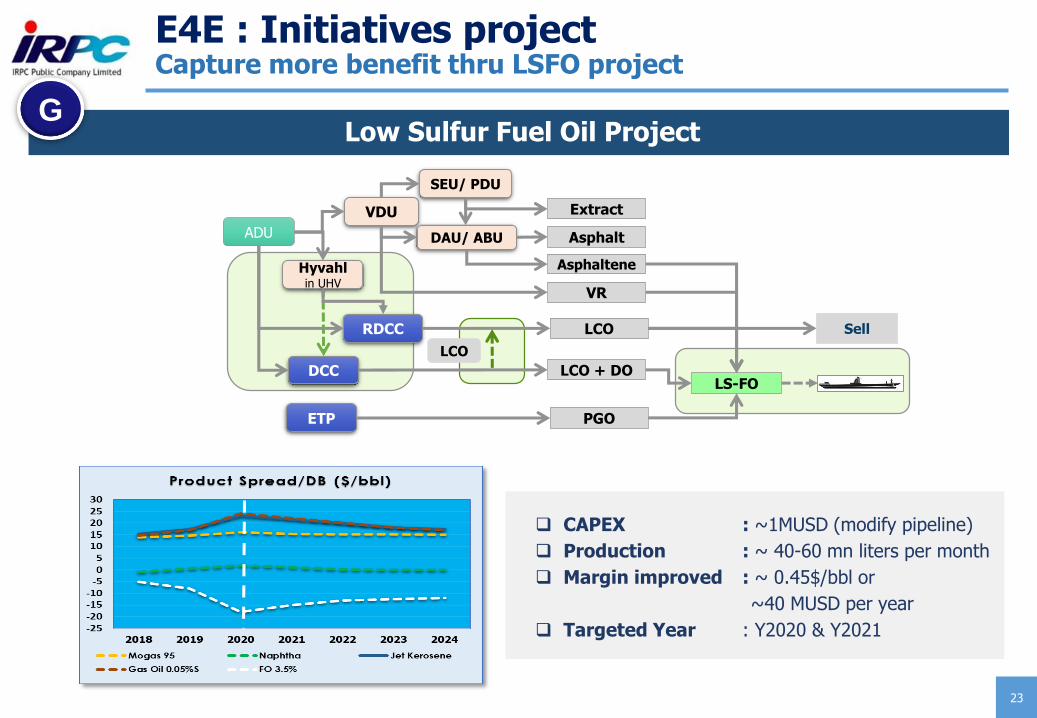
E4E : Initiatives projectCapture more benefit thru LSFO project
❑ CAPEX : ~1MUSD (modify pipeline)
❑ Production : ~ 40-60 mn liters per month
❑ Margin improved : ~ 0.45$/bbl or
~40 MUSD per year
❑ Targeted Year : Y2020 & Y2021
Price Assumption to Study IMO effect.Low Sulfur Fuel Oil Project
ADU
VDU
RDCC
Hyvahlin UHV
DCC
SEU/ PDU
DAU/ ABU Asphalt
Extract
VR
Asphaltene
LCO + DO
LCO
ETP PGO
LS-FO
LCO
Sell
G
24
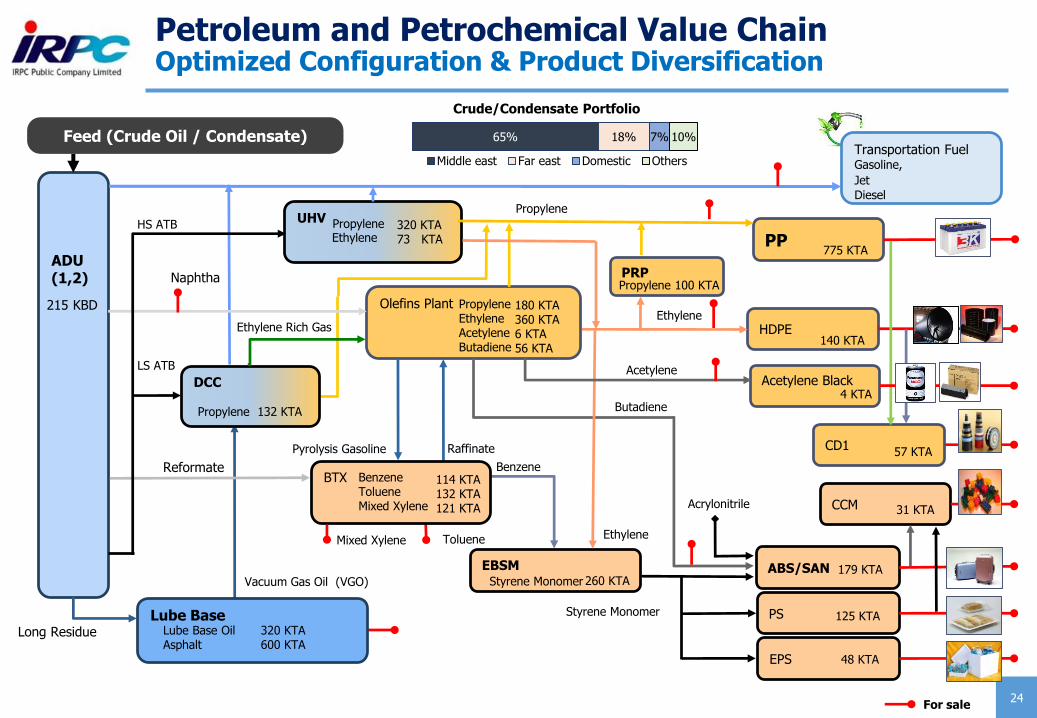
Petroleum and Petrochemical Value Chain Optimized Configuration & Product Diversification
Olefins Plant PropyleneEthyleneAcetylene Butadiene
180 KTA360 KTA6 KTA56 KTA
Vacuum Gas Oil (VGO)
PP
PS
ABS/SAN
EPS
CCM
Acetylene Black
HDPEEthylene
Acetylene
Propylene
Benzene
TolueneMixed Xylene
Butadiene
CD1
Ethylene
EBSM
Long Residue
4 KTA
140 KTA
775 KTA
Ethylene Rich Gas
DCC
Propylene 132 KTA
ADU (1,2)
215 KBD
Naphtha
Reformate
UHV
Ethylene Propylene 320 KTA
73 KTA
Lube BaseLube Base Oil Asphalt
320 KTA600 KTA
BTX Benzene TolueneMixed Xylene
114 KTA132 KTA121 KTA 31 KTA
57 KTA
179 KTA
125 KTA
48 KTA
260 KTAStyrene Monomer
Acrylonitrile
Feed (Crude Oil / Condensate)Transportation FuelGasoline,
Jet
Diesel
PRP
HS ATB
Propylene 100 KTA
Pyrolysis Gasoline Raffinate
Styrene Monomer
LS ATB
65% 18% 7% 10%
Crude/Condensate Portfolio
Middle east Far east Domestic Others
For sale
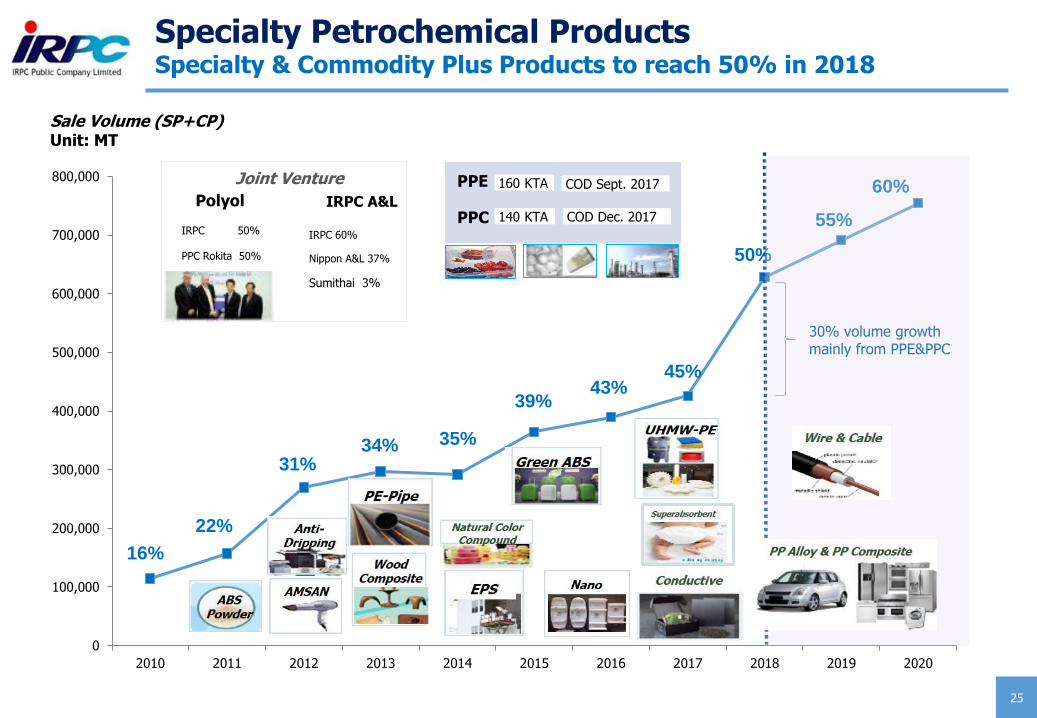
16%
22%
31%34% 35%
39%43%
45%
50%
55%
60%
0
0.1
0.2
0.3
0.4
0.5
0.6
0.7
0
100,000
200,000
300,000
400,000
500,000
600,000
700,000
800,000
2010 2011 2012 2013 2014 2015 2016 2017 2018 2019 2020
25
Specialty Petrochemical ProductsSpecialty & Commodity Plus Products to reach 50% in 2018
IRPC 50%
PPC Rokita 50%
IRPC A&L
IRPC 60%
Nippon A&L 37%
Sumithai 3%
Joint Venture
Polyol
Sale Volume (SP+CP) Unit: MT
PPE
PPC
160 KTA
140 KTA COD Dec. 2017
COD Sept. 2017
30% volume growth mainly from PPE&PPC
Performance by Business
Financial Performance
Strategic Direction
3Q18 Highlight
26
Projects Update
27
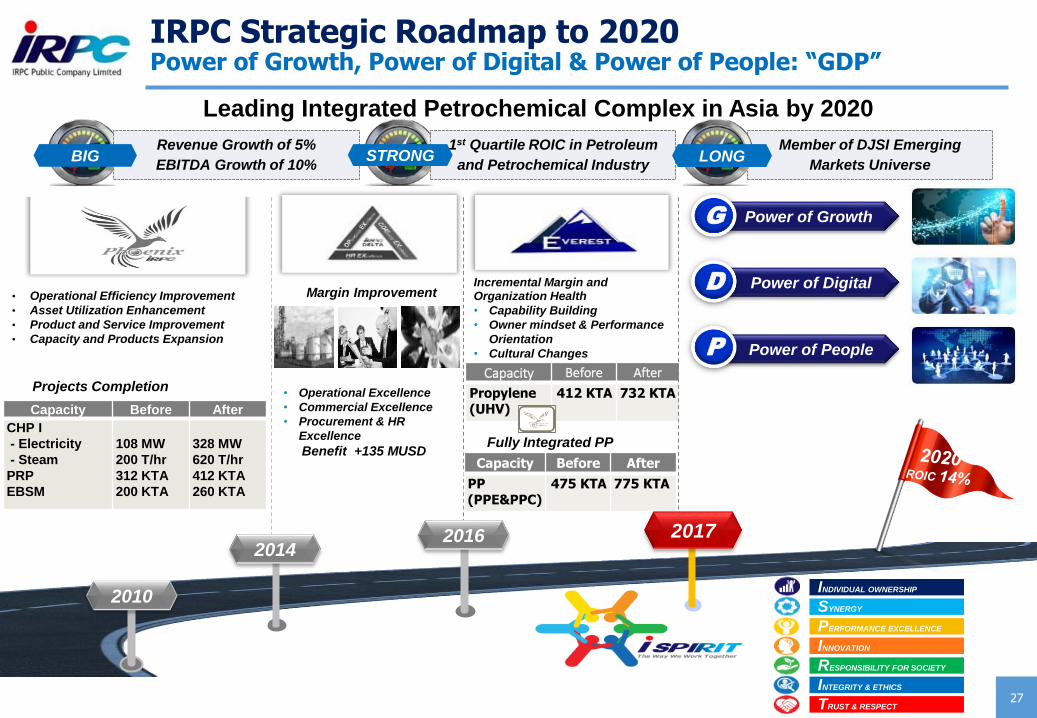
IRPC Strategic Roadmap to 2020Power of Growth, Power of Digital & Power of People: “GDP”
Capacity Before After
Propylene (UHV)
412 KTA 732 KTA
2010
2014
Margin Improvement
• Operational Excellence
• Commercial Excellence
• Procurement & HR
Excellence
Benefit +135 MUSD
INDIVIDUAL OWNERSHIP
SYNERGY
PERFORMANCE EXCELLENCE
INNOVATION
RESPONSIBILITY FOR SOCIETY
INTEGRITY & ETHICS
TRUST & RESPECT
Projects Completion
• Operational Efficiency Improvement
• Asset Utilization Enhancement
• Product and Service Improvement
• Capacity and Products Expansion
Incremental Margin and Organization Health
• Capability Building
• Owner mindset & Performance
Orientation
• Cultural Changes
Fully Integrated PP
Revenue Growth of 5%
EBITDA Growth of 10%
1st Quartile ROIC in Petroleum
and Petrochemical Industry STRONG
Member of DJSI Emerging
Markets Universe
Capacity Before After
PP (PPE&PPC)
475 KTA 775 KTA
20172016
Capacity Before After
CHP I
- Electricity
- Steam
PRP
EBSM
108 MW
200 T/hr
312 KTA
200 KTA
328 MW
620 T/hr
412 KTA
260 KTA
BIG LONG
Leading Integrated Petrochemical Complex in Asia by 2020
Power of GrowthG
Power of DigitalD
Power of PeopleP
28
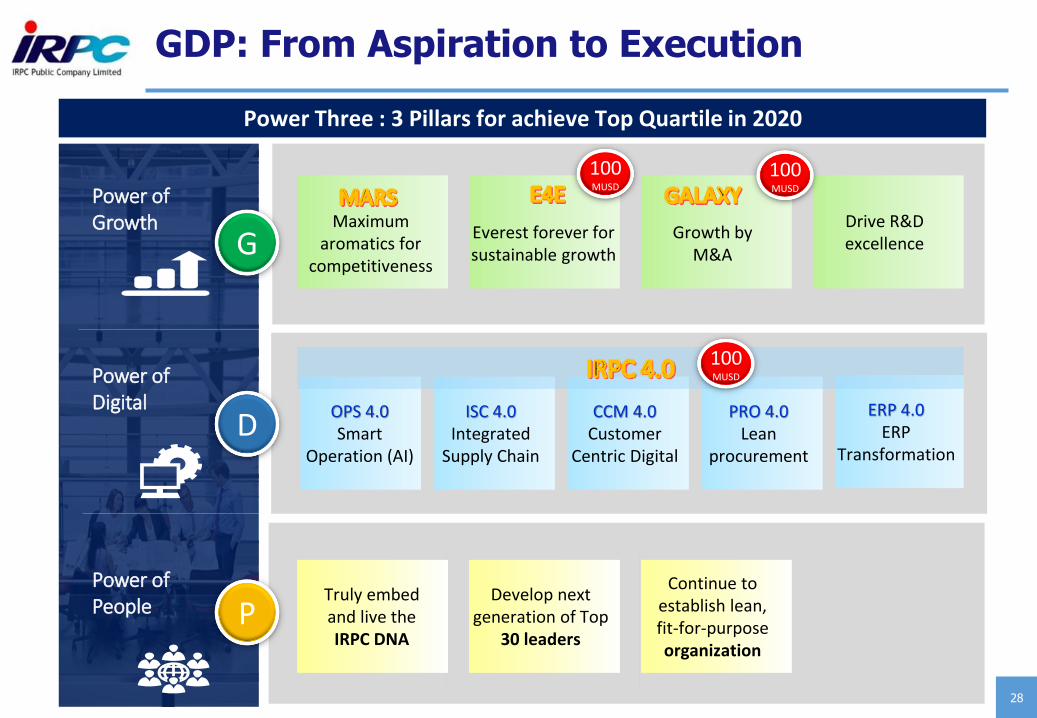
GDP: From Aspiration to Execution
Power Three : 3 Pillars for achieve Top Quartile in 2020
Power of Digital
Power of People
Truly embedand live the IRPC DNA
Develop next generation of Top
30 leaders
Continue to establish lean, fit-for-purpose organization
P
Power of Growth Maximum
aromatics for competitiveness
Growth byM&A
Everest forever for sustainable growth
Drive R&D excellenceG
100MUSD
100MUSD
OPS 4.0Smart
Operation (AI)
ISC 4.0Integrated
Supply Chain
CCM 4.0Customer
Centric Digital
ERP 4.0ERP
Transformation
PRO 4.0Lean
procurement
100MUSD
D
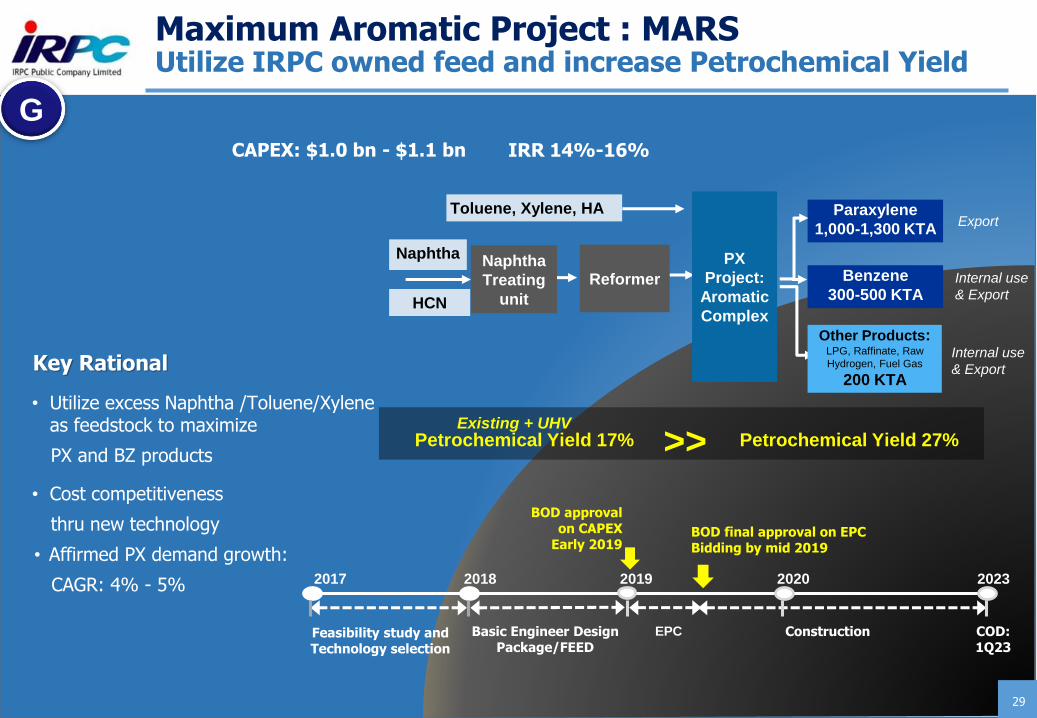
MARS - Maximum Aromatics
Reformer Benzene
300-500 KTA
Paraxylene
1,000-1,300 KTA
Naphtha PX
Project:
Aromatic
Complex
Internal use
& Export
Export
Naphtha
Treating
unitHCN
Toluene, Xylene, HA
Internal use
& Export
Other Products: LPG, Raffinate, Raw
Hydrogen, Fuel Gas
200 KTA
CAPEX: $1.0 bn - $1.1 bn IRR 14%-16%
Petrochemical Yield 17% Existing + UHV
Petrochemical Yield 27% >>
Key Rational
• Utilize excess Naphtha /Toluene/Xylene as feedstock to maximize
PX and BZ products
• Cost competitiveness
thru new technology
• Affirmed PX demand growth:
CAGR: 4% - 5%
G
Maximum Aromatic Project : MARSUtilize IRPC owned feed and increase Petrochemical Yield
COD:1Q23
Feasibility study and Technology selection
Basic Engineer Design Package/FEED
Construction
202320192017 20202018
EPC
BOD approval on CAPEX
Early 2019BOD final approval on EPC Bidding by mid 2019
29
30
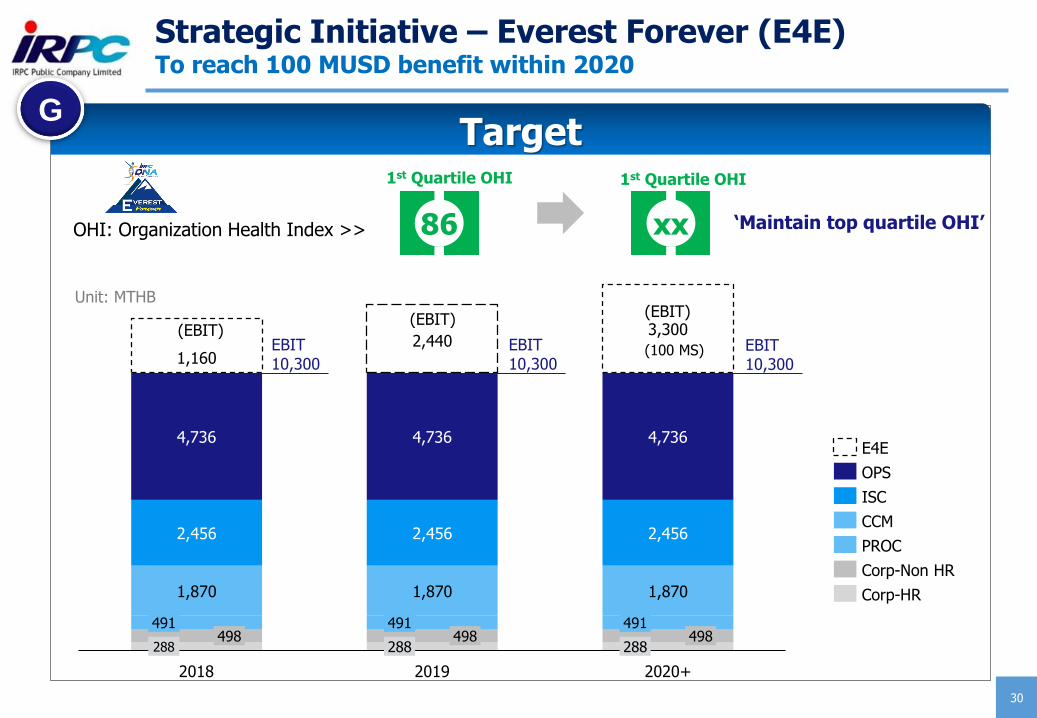
Strategic Initiative – Everest Forever (E4E)To reach 100 MUSD benefit within 2020
1,870 1,870 1,870
2,456 2,456 2,456
4,736 4,736 4,736
1,1602,440
3,300
491498
491
288
2018
498491
2019
288498
288
2020+
E4E
ISC
OPS
CCM
Corp-Non HR
PROC
Corp-HR
OHI: Organization Health Index >> 86
1st Quartile OHI
xx
1st Quartile OHI
(EBIT)(EBIT)
(EBIT)
‘Maintain top quartile OHI’
Unit: MTHB
EBIT10,300
EBIT10,300
EBIT10,300
Target
(100 MS)
G
31
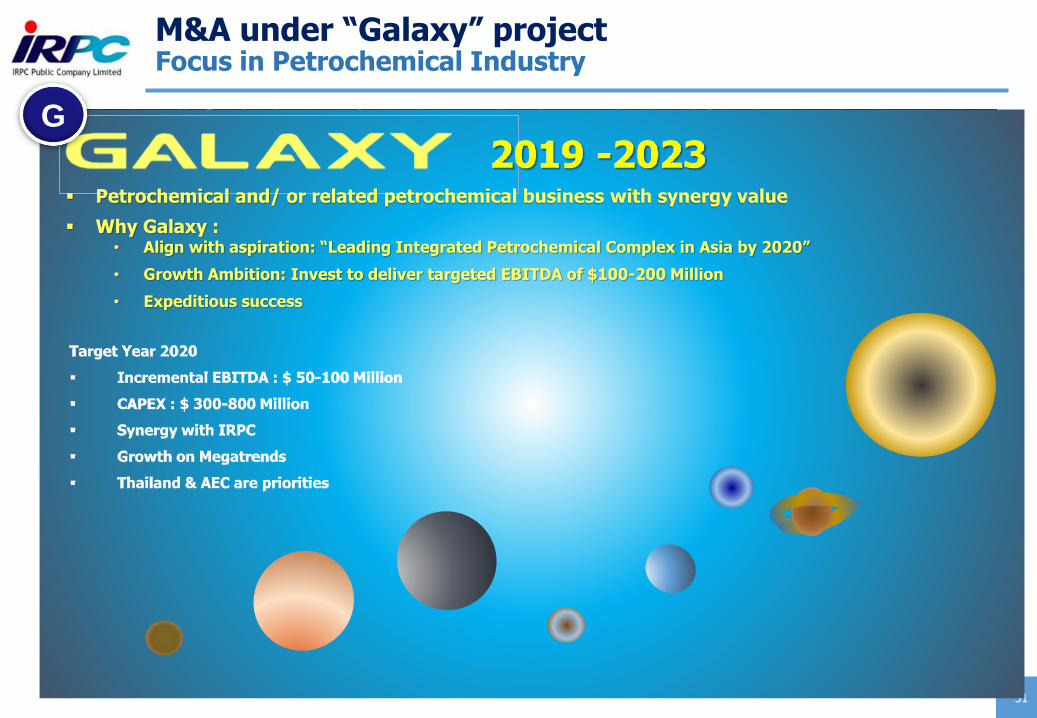
M&A under “Galaxy” projectFocus in Petrochemical Industry
▪ Petrochemical and/ or related petrochemical business with synergy value
▪ Why Galaxy :• Align with aspiration: “Leading Integrated Petrochemical Complex in Asia by 2020”
• Growth Ambition: Invest to deliver targeted EBITDA of $100-200 Million
• Expeditious success
G
32
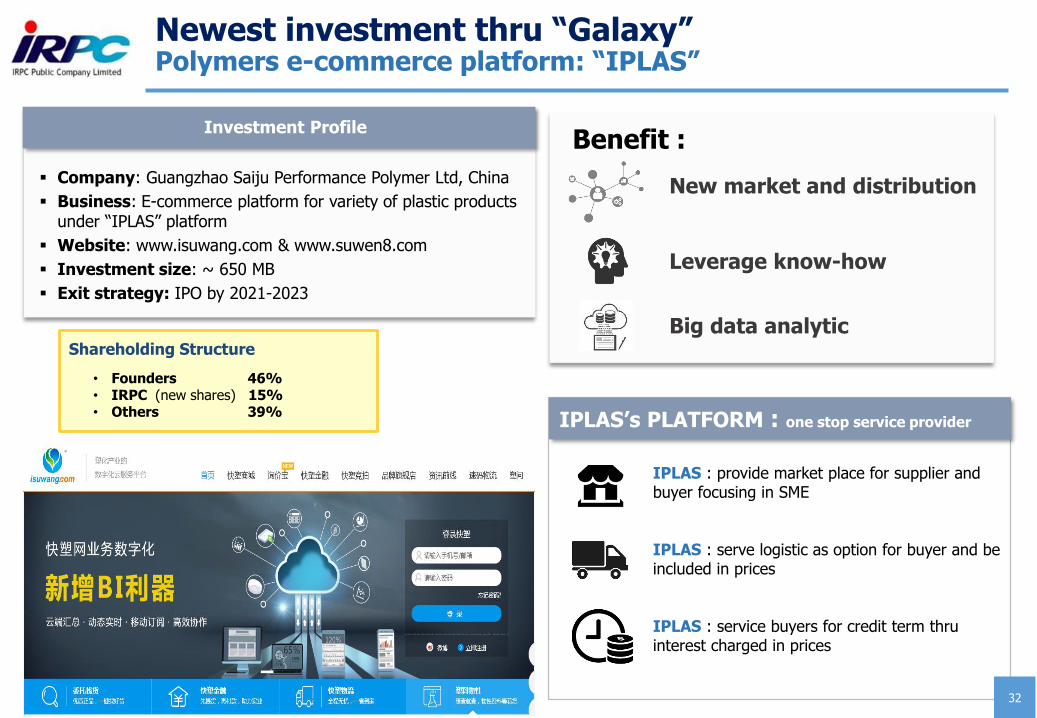
Newest investment thru “Galaxy”Polymers e-commerce platform: “IPLAS”
Investment Profile
▪ Company: Guangzhao Saiju Performance Polymer Ltd, China
▪ Business: E-commerce platform for variety of plastic products under “IPLAS” platform
▪ Website: www.isuwang.com & www.suwen8.com
▪ Investment size: ~ 650 MB
▪ Exit strategy: IPO by 2021-2023
Shareholding Structure
• Founders 46%• IRPC (new shares) 15%• Others 39%
Investment Profile
New market and distribution
Benefit :
Big data analytic
Leverage know-how
IPLAS : provide market place for supplier and buyer focusing in SME
IPLAS : serve logistic as option for buyer and be included in prices
IPLAS : service buyers for credit term thru interest charged in prices
IPLAS’s PLATFORM : one stop service provider
33
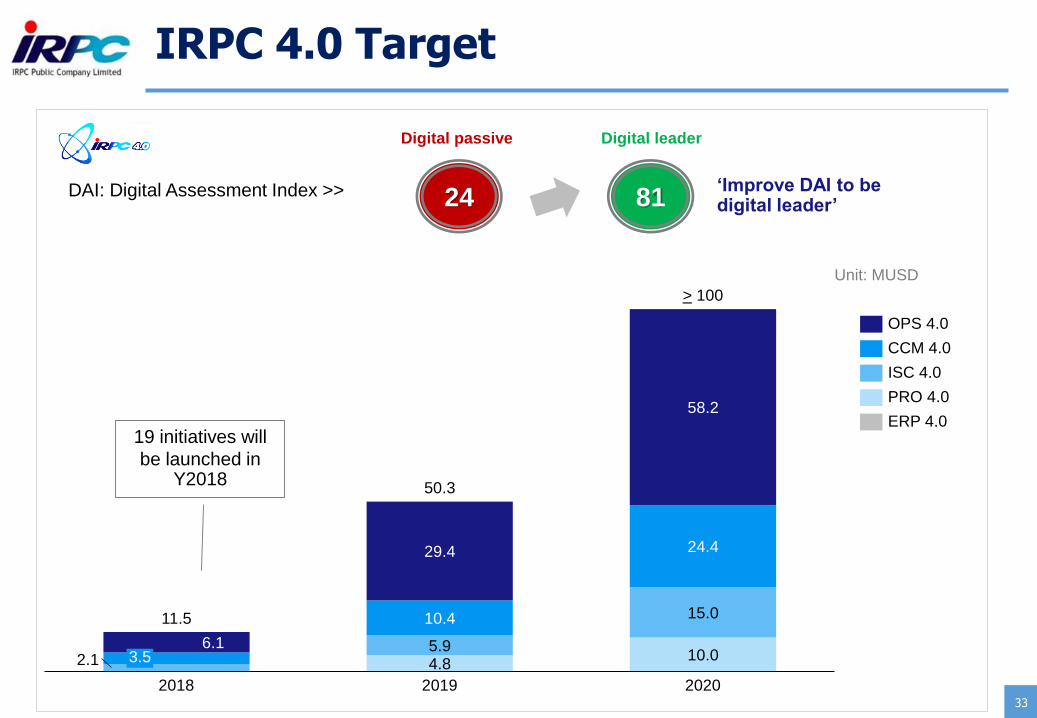
IRPC 4.0 Target
2.1 4.810.0
5.9
15.0
6.1
10.4
24.429.4
58.2
2020
3.5
> 100
2018 2019
11.5
50.3
OPS 4.0
CCM 4.0
PRO 4.0
ISC 4.0
ERP 4.0
24
Digital passive
81
Digital leader
DAI: Digital Assessment Index >> ‘Improve DAI to be digital leader’
Unit: MUSD
19 initiatives will
be launched in Y2018
34
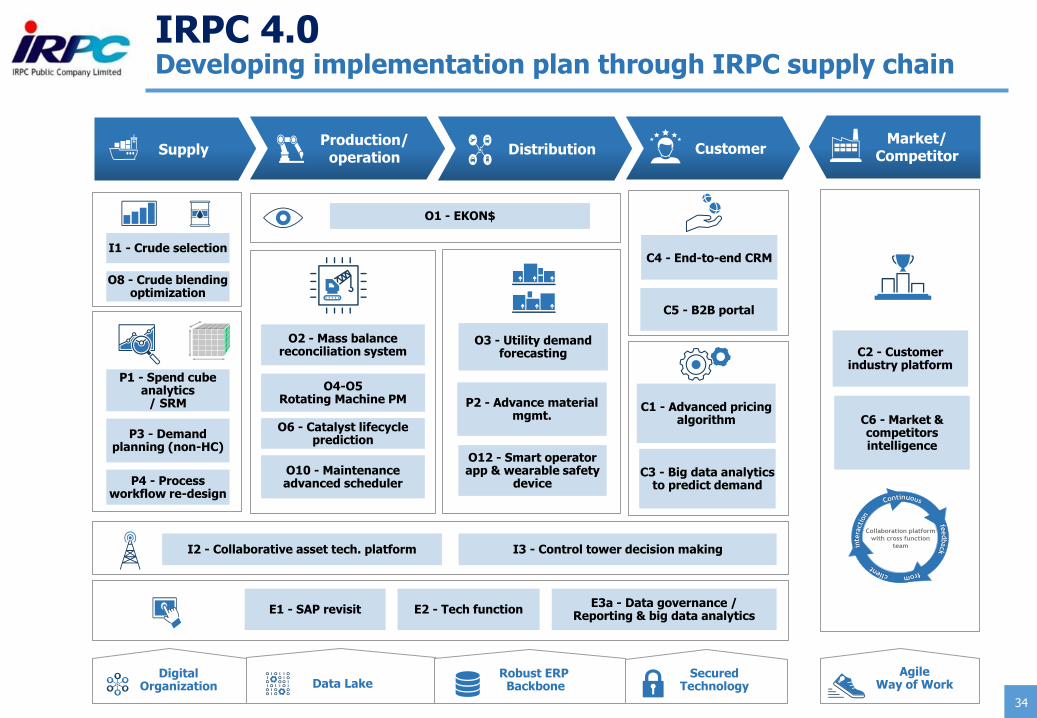
IRPC 4.0 Developing implementation plan through IRPC supply chain
O3 - Utility demand forecasting
O2 - Mass balance reconciliation system
E1 - SAP revisit
I3 - Control tower decision making
O4-O5Rotating Machine PM
O1 - EKON$
P1 - Spend cube analytics
/ SRM
I1 - Crude selection
SupplyProduction/
operationDistribution Customer
Market/Competitor
Digital Organization Data Lake
Robust ERPBackbone
Secured Technology
Agile Way of Work
Collaboration platform
with cross function
team
P2 - Advance material mgmt.
C4 - End-to-end CRM
C1 - Advanced pricing algorithm C6 - Market &
competitors intelligence
C3 - Big data analytics to predict demand
E2 - Tech functionE3a - Data governance /
Reporting & big data analytics
I2 - Collaborative asset tech. platform
P3 - Demand planning (non-HC)
C5 - B2B portal
P4 - Process workflow re-design
C2 - Customer industry platform
O6 - Catalyst lifecycle prediction
O10 - Maintenance advanced scheduler
O8 - Crude blending optimization
O12 - Smart operator app & wearable safety
device
35
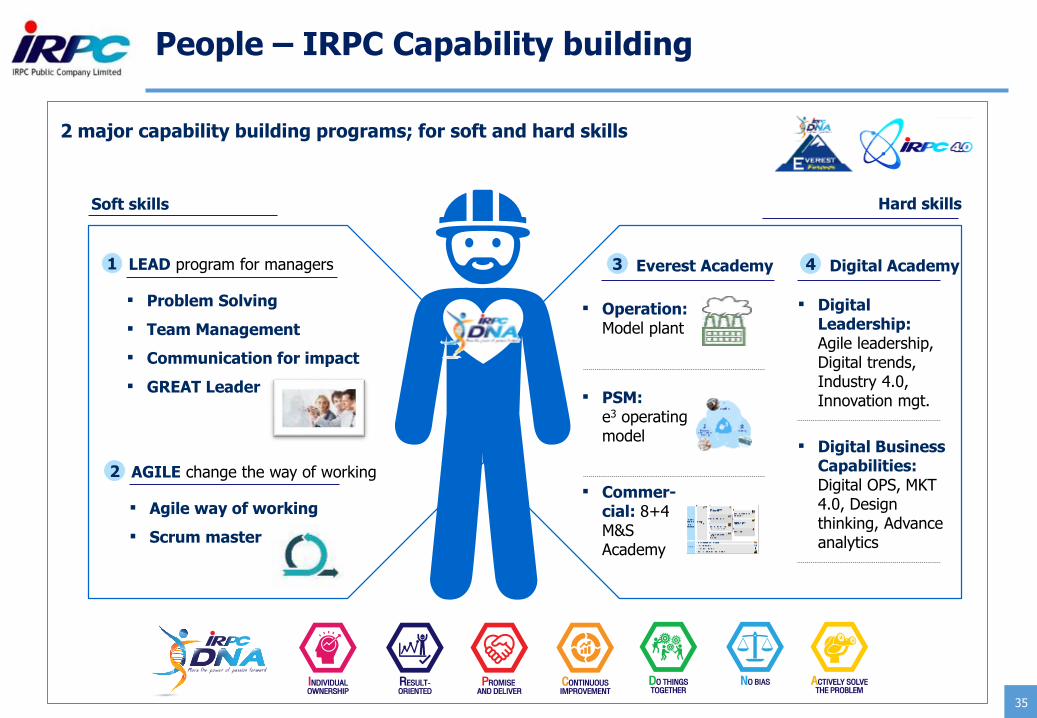
People – IRPC Capability building
2 major capability building programs; for soft and hard skills
1 3
Soft skills Hard skills
Everest AcademyLEAD program for managers
▪ Problem Solving
▪ Team Management
▪ Communication for impact
▪ GREAT Leader
▪ Operation: Model plant
▪ PSM: e3 operating model
▪ Commer-cial: 8+4 M&SAcademy
4 Digital Academy
▪ Digital Leadership: Agile leadership, Digital trends, Industry 4.0, Innovation mgt.
▪ Digital Business Capabilities: Digital OPS, MKT 4.0, Design thinking, Advance analytics
2 AGILE change the way of working
▪ Agile way of working
▪ Scrum master
Thank You
This presentation material has been prepared solely for informational purposes only. IRPC is furnishing it solely for use by prospective investors / analysts in
the proposed event. IRPC makes no representations or warranties as to the accuracy or completeness of such information. By accepting this material each
recipient agrees that IRPC shall not have any liability for any representations (express or implied) contained in, or for any omissions from this presentation.
The information contained herein does not purport to be all-inclusive or to contain all of the Information that may be material to the recipient’s decision. Each
recipient of the information and data contained herein should perform its own independent investigation and analysis of the transaction and the creditworthiness of IRPC . Reference in this Disclaimer to this shall include references to the Appendices (if any) hereto.
Investor Relations Contact: [email protected]
Tel. +662-765-7380, Fax. +662-765-7379