Drivers of Future Energy Demand - U.S. Energy … · Drivers of Future Energy Demand in China ......
22
Drivers of Future Energy Demand in China Asian Energy Demand Outlook 2014 EIA Energy Conference July 14, 2014 Valerie J. Karplus MIT Sloan School of Management
Transcript of Drivers of Future Energy Demand - U.S. Energy … · Drivers of Future Energy Demand in China ......
Drivers of Future Energy Demand in China
Asian Energy Demand Outlook 2014 EIA Energy Conference
July 14, 2014
Valerie J. Karplus
MIT Sloan School of Management
2
www.china.org.cn
www.flickr.com www.wikimedia.org
globalchange.mit.edu
Global Climate Change
Human Development
Local Pollution
Industrial Development & Resource Needs
How to balance?
0
500
1000
1500
2000
2500
3000
3500
4000
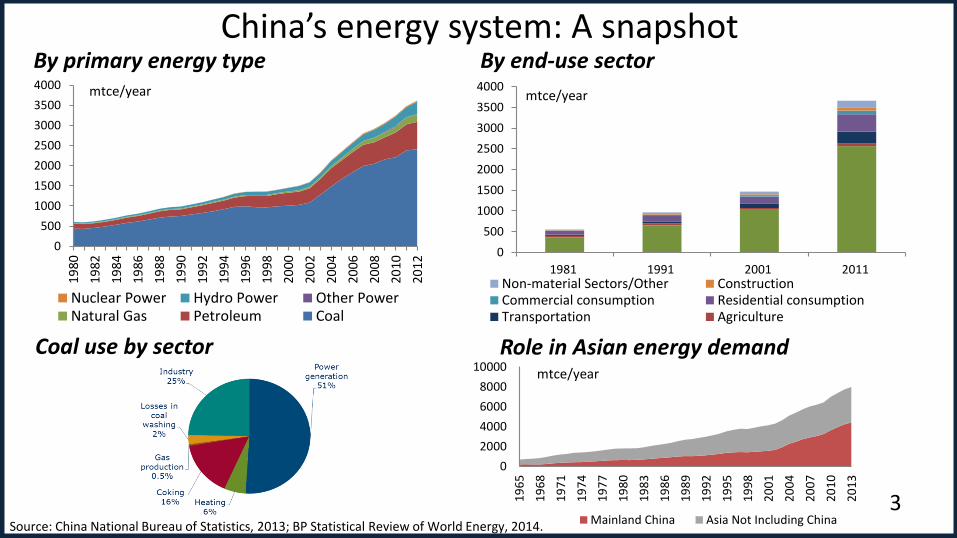
1981 1991 2001 2011Non-material Sectors/Other ConstructionCommercial consumption Residential consumptionTransportation Agriculture
mtce/year
0
2000
4000
6000
8000
10000
19
65
19
68
19
71
19
74
19
77
19
80
19
83
19
86
19
89
19
92
19
95
19
98
20
01
20
04
20
07
20
10
20
13
Mainland China Asia Not Including China
China’s energy system: A snapshot By primary energy type By end-use sector
Coal use by sector
3
0
500
1000
1500
2000
2500
3000
3500
40001
98
0
19
82
19
84
19
86
19
88
19
90
19
92
19
94
19
96
19
98
20
00
20
02
20
04
20
06
20
08
20
10
20
12
Nuclear Power Hydro Power Other PowerNatural Gas Petroleum Coal
mtce/year
Source: China National Bureau of Statistics, 2013; BP Statistical Review of World Energy, 2014.
mtce/year
Role in Asian energy demand
Drivers of Energy Demand in China • Energy-economic system
– Industrial energy intensity
– Domestic consumption-investment shift
– Export trends
– Household income / migration / urbanization
• Policy: China Energy Outlook
– Air pollution
– Climate change
4
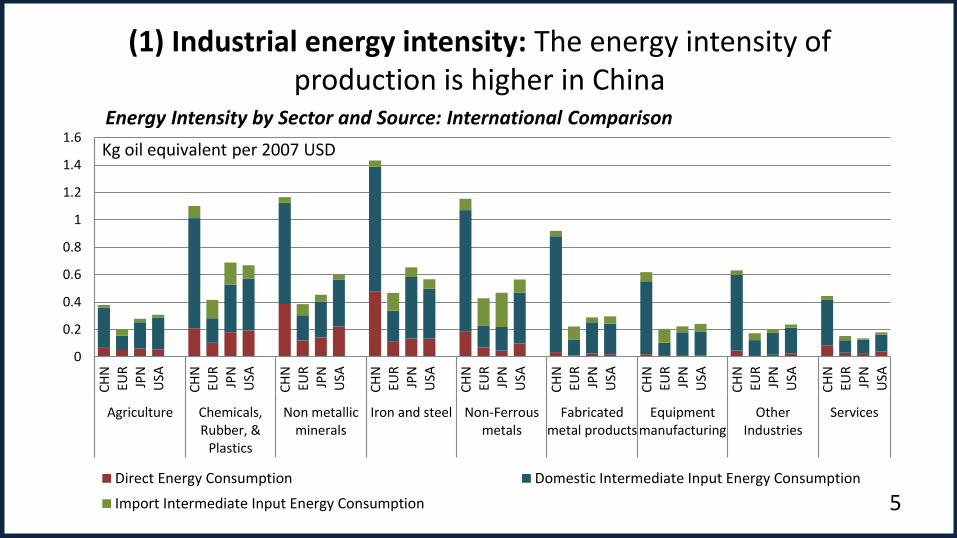
(1) Industrial energy intensity: The energy intensity of production is higher in China
5
0
0.2
0.4
0.6
0.8
1
1.2
1.4
1.6
CH
NEU
RJP
NU
SA
CH
NEU
RJP
NU
SA
CH
NEU
RJP
NU
SA
CH
NEU
RJP
NU
SA
CH
NEU
RJP
NU
SA
CH
NEU
RJP
NU
SA
CH
NEU
RJP
NU
SA
CH
NEU
RJP
NU
SA
CH
NEU
RJP
NU
SA
Agriculture Chemicals,Rubber, &
Plastics
Non metallicminerals
Iron and steel Non-Ferrousmetals
Fabricatedmetal products
Equipmentmanufacturing
OtherIndustries
Services
Direct Energy Consumption Domestic Intermediate Input Energy Consumption
Import Intermediate Input Energy Consumption
Kg oil equivalent per 2007 USD
Energy Intensity by Sector and Source: International Comparison
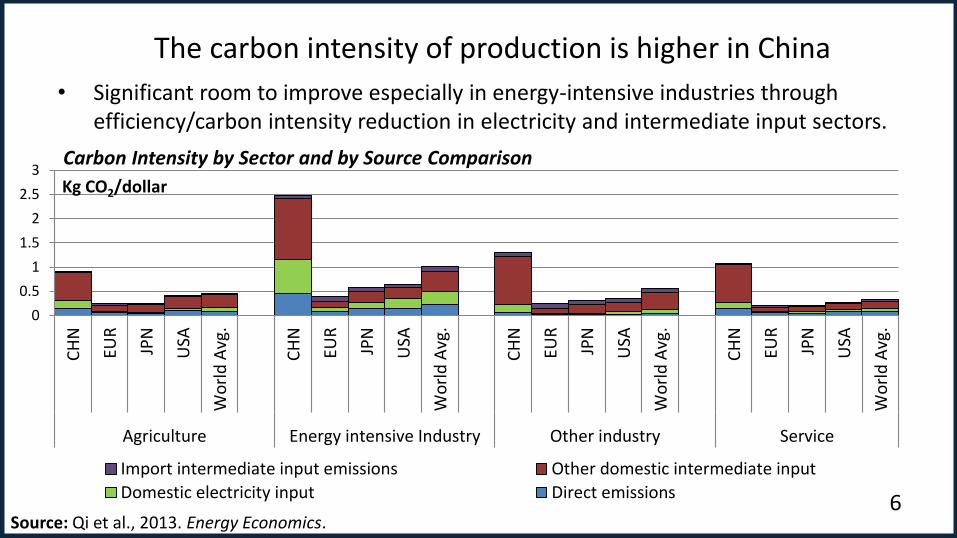
The carbon intensity of production is higher in China
6
• Significant room to improve especially in energy-intensive industries through efficiency/carbon intensity reduction in electricity and intermediate input sectors.
0
0.5
1
1.5
2
2.5
3
CH
N
EUR
JPN
USA
Wo
rld
Avg
.
CH
N
EUR
JPN
USA
Wo
rld
Avg
.
CH
N
EUR
JPN
USA
Wo
rld
Avg
.
CH
N
EUR
JPN
USA
Wo
rld
Avg
.
Agriculture Energy intensive Industry Other industry Service
Kg CO2/dollar
Import intermediate input emissions Other domestic intermediate input
Domestic electricity input Direct emissions
Carbon Intensity by Sector and by Source Comparison
Source: Qi et al., 2013. Energy Economics.
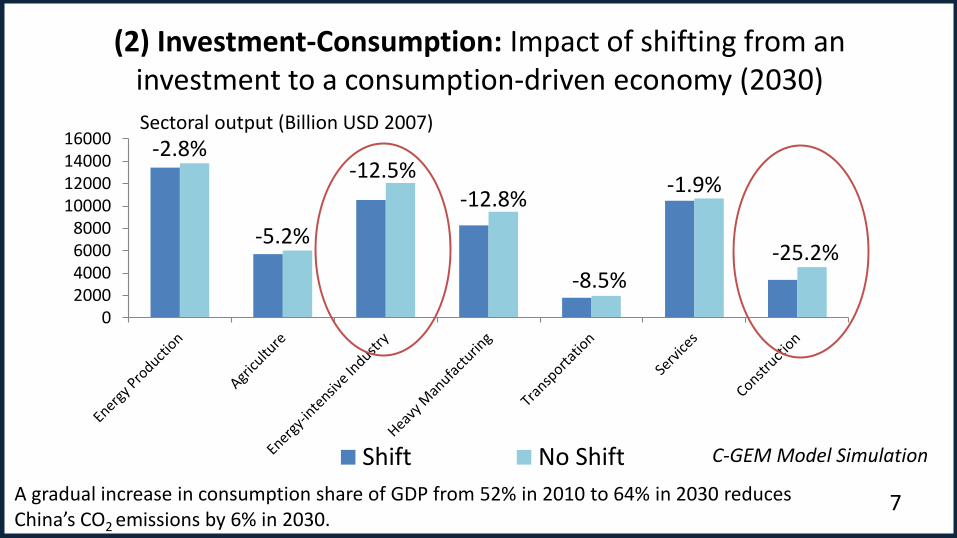
(2) Investment-Consumption: Impact of shifting from an investment to a consumption-driven economy (2030)
7
02000400060008000
10000120001400016000
Shift No Shift
A gradual increase in consumption share of GDP from 52% in 2010 to 64% in 2030 reduces China’s CO2 emissions by 6% in 2030.
-2.8%
-5.2%
-12.5% -12.8%
-8.5%
-1.9%
-25.2%
Sectoral output (Billion USD 2007)
C-GEM Model Simulation
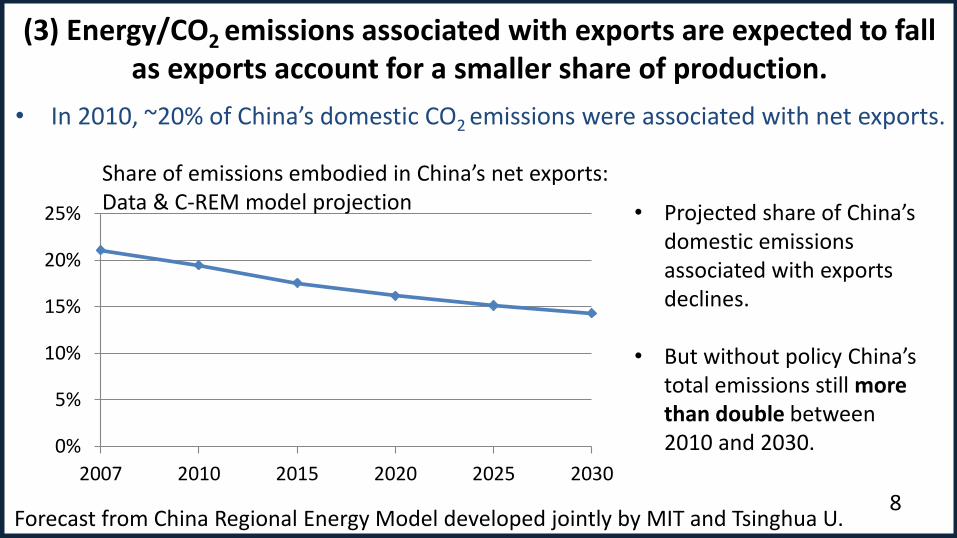
• In 2010, ~20% of China’s domestic CO2 emissions were associated with net exports.
8
0%
5%
10%
15%
20%
25%
2007 2010 2015 2020 2025 2030
• Projected share of China’s domestic emissions associated with exports declines.
• But without policy China’s total emissions still more than double between 2010 and 2030.
(3) Energy/CO2 emissions associated with exports are expected to fall as exports account for a smaller share of production.
Forecast from China Regional Energy Model developed jointly by MIT and Tsinghua U.
Share of emissions embodied in China’s net exports: Data & C-REM model projection
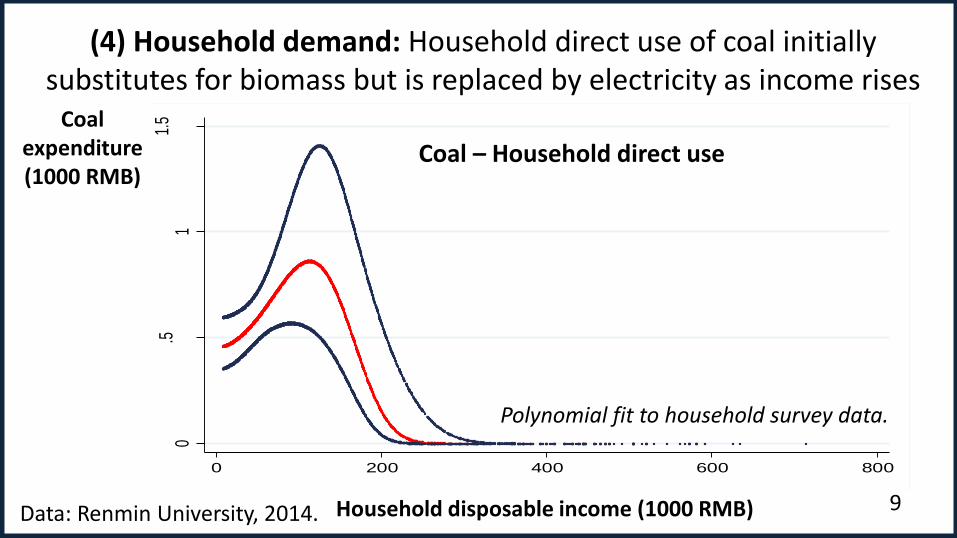
(4) Household demand: Household direct use of coal initially substitutes for biomass but is replaced by electricity as income rises
9
0.5
11.
5
0 200 400 600 800
Coal – Household direct use
Household disposable income (1000 RMB)
Coal expenditure (1000 RMB)
Data: Renmin University, 2014.
Polynomial fit to household survey data.
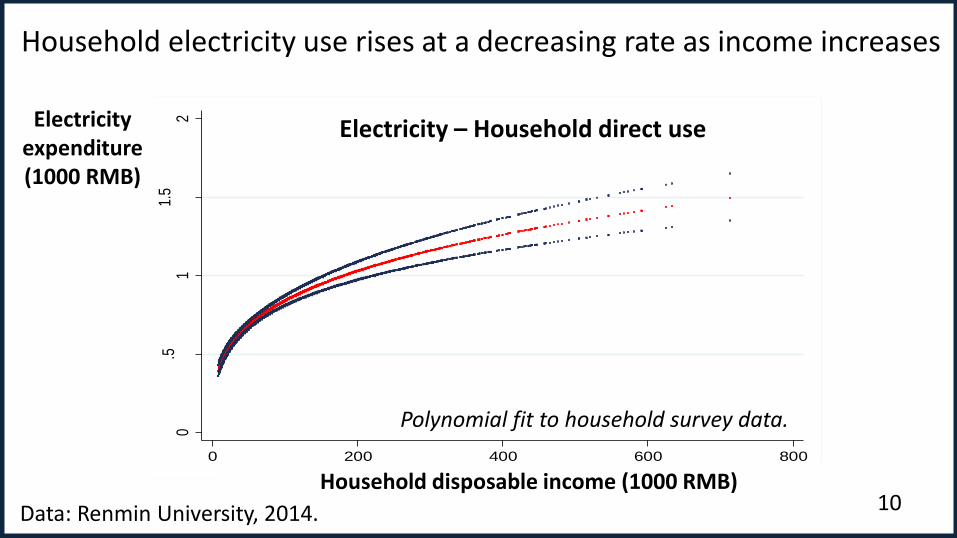
Household electricity use rises at a decreasing rate as income increases
10
0.5
11.
52
0 200 400 600 800
Electricity – Household direct use
Household disposable income (1000 RMB)
Electricity expenditure (1000 RMB)
Data: Renmin University, 2014.
Polynomial fit to household survey data.
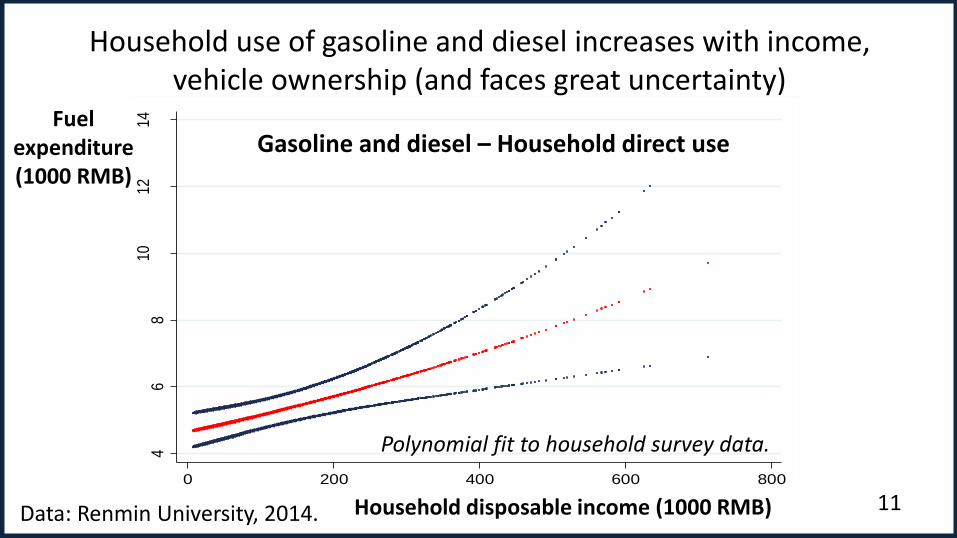
Household use of gasoline and diesel increases with income, vehicle ownership (and faces great uncertainty)
11
46
810
1214
0 200 400 600 800
Gasoline and diesel – Household direct use
Household disposable income (1000 RMB) Data: Renmin University, 2014.
Polynomial fit to household survey data.
Fuel expenditure (1000 RMB)
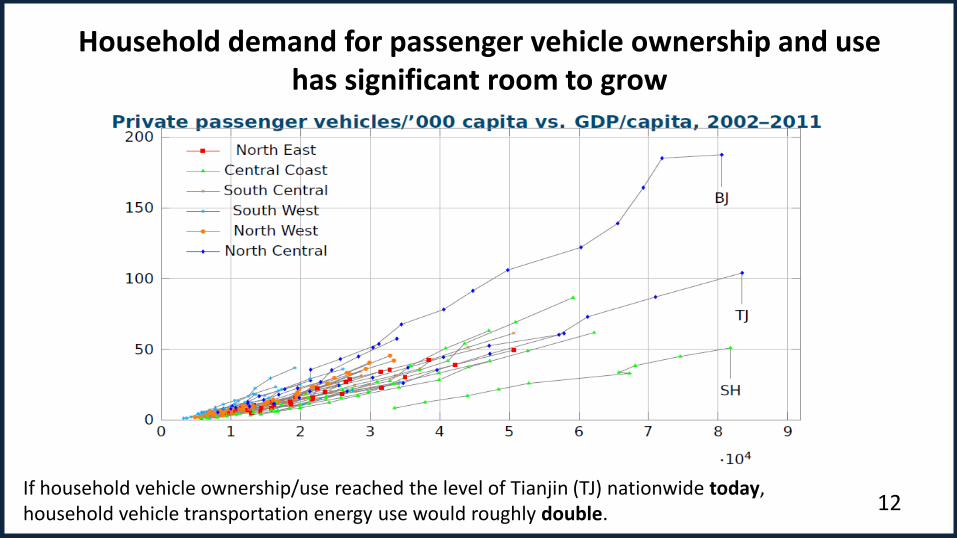
Household demand for passenger vehicle ownership and use has significant room to grow
12 If household vehicle ownership/use reached the level of Tianjin (TJ) nationwide today, household vehicle transportation energy use would roughly double.
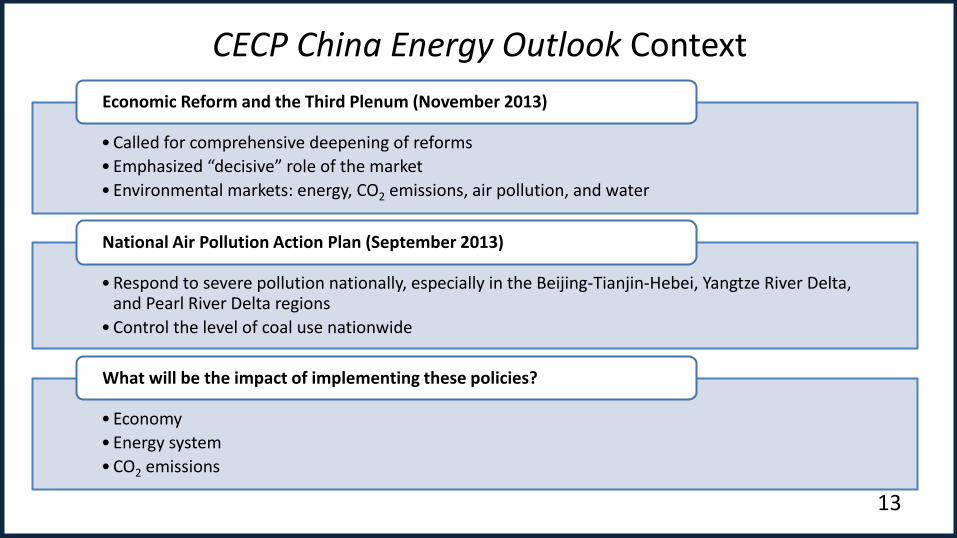
CECP China Energy Outlook Context
13
• Called for comprehensive deepening of reforms
• Emphasized “decisive” role of the market
• Environmental markets: energy, CO2 emissions, air pollution, and water
Economic Reform and the Third Plenum (November 2013)
• Respond to severe pollution nationally, especially in the Beijing-Tianjin-Hebei, Yangtze River Delta, and Pearl River Delta regions
• Control the level of coal use nationwide
National Air Pollution Action Plan (September 2013)
• Economy
• Energy system
• CO2 emissions
What will be the impact of implementing these policies?
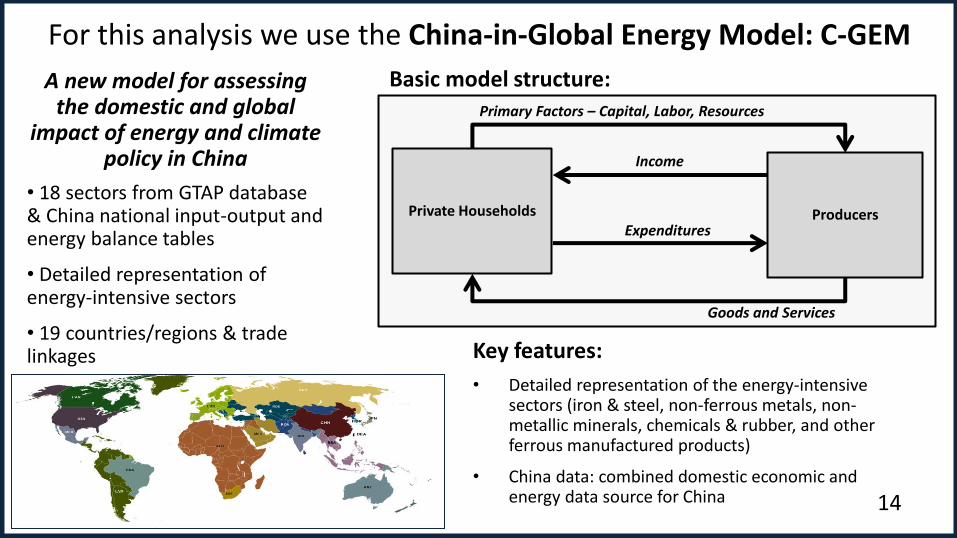
For this analysis we use the China-in-Global Energy Model: C-GEM
14
Private Households
Income
Expenditures
Goods and Services
Primary Factors – Capital, Labor, Resources
Producers
Basic model structure: A new model for assessing the domestic and global
impact of energy and climate policy in China
• 18 sectors from GTAP database & China national input-output and energy balance tables
• Detailed representation of energy-intensive sectors
• 19 countries/regions & trade linkages Key features:
• Detailed representation of the energy-intensive sectors (iron & steel, non-ferrous metals, non-metallic minerals, chemicals & rubber, and other ferrous manufactured products)
• China data: combined domestic economic and energy data source for China
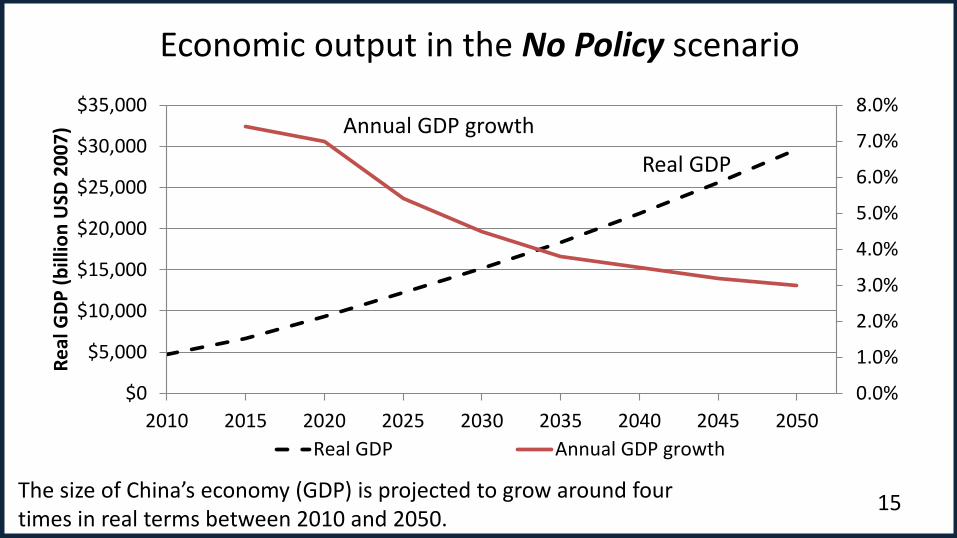
Economic output in the No Policy scenario
15 The size of China’s economy (GDP) is projected to grow around four times in real terms between 2010 and 2050.
0.0%
1.0%
2.0%
3.0%
4.0%
5.0%
6.0%
7.0%
8.0%
$0
$5,000
$10,000
$15,000
$20,000
$25,000
$30,000
$35,000
2010 2015 2020 2025 2030 2035 2040 2045 2050
Re
al G
DP
(b
illio
n U
SD 2
00
7)
Real GDP Annual GDP growth
Real GDP
Annual GDP growth
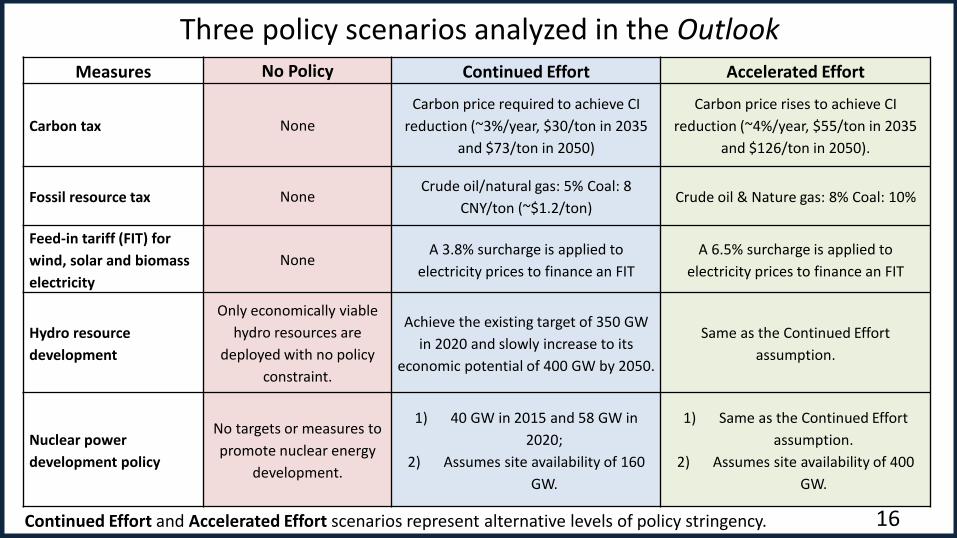
Three policy scenarios analyzed in the Outlook Measures No Policy Continued Effort Accelerated Effort
Carbon tax None
Carbon price required to achieve CI
reduction (~3%/year, $30/ton in 2035
and $73/ton in 2050)
Carbon price rises to achieve CI
reduction (~4%/year, $55/ton in 2035
and $126/ton in 2050).
Fossil resource tax None Crude oil/natural gas: 5% Coal: 8
CNY/ton (~$1.2/ton) Crude oil & Nature gas: 8% Coal: 10%
Feed-in tariff (FIT) for
wind, solar and biomass
electricity
None A 3.8% surcharge is applied to
electricity prices to finance an FIT
A 6.5% surcharge is applied to
electricity prices to finance an FIT
Hydro resource
development
Only economically viable
hydro resources are
deployed with no policy
constraint.
Achieve the existing target of 350 GW
in 2020 and slowly increase to its
economic potential of 400 GW by 2050.
Same as the Continued Effort
assumption.
Nuclear power
development policy
No targets or measures to
promote nuclear energy
development.
1) 40 GW in 2015 and 58 GW in
2020;
2) Assumes site availability of 160
GW.
1) Same as the Continued Effort
assumption.
2) Assumes site availability of 400
GW.
16 Continued Effort and Accelerated Effort scenarios represent alternative levels of policy stringency.
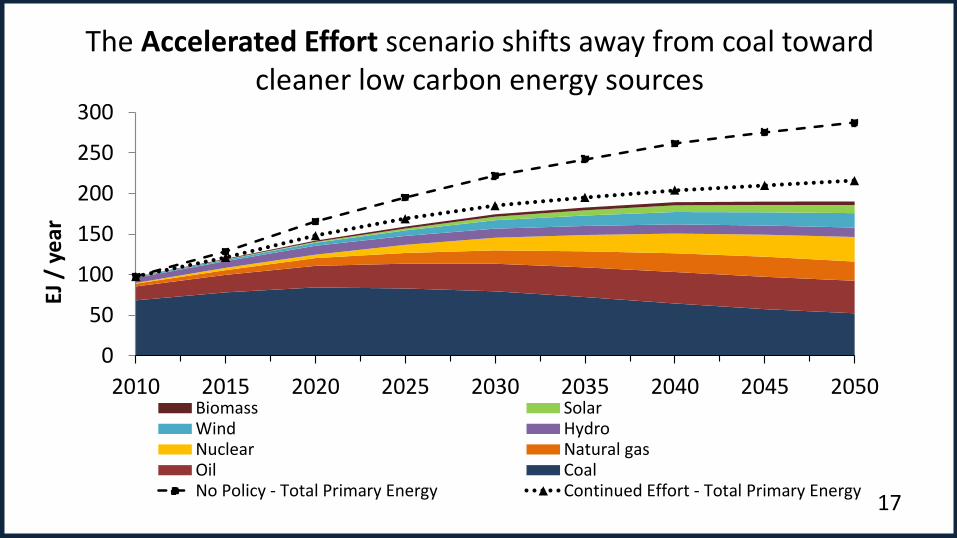
The Accelerated Effort scenario shifts away from coal toward cleaner low carbon energy sources
17
0
50
100
150
200
250
300
2010 2015 2020 2025 2030 2035 2040 2045 2050
EJ /
ye
ar
Biomass SolarWind HydroNuclear Natural gasOil CoalNo Policy - Total Primary Energy Continued Effort - Total Primary Energy
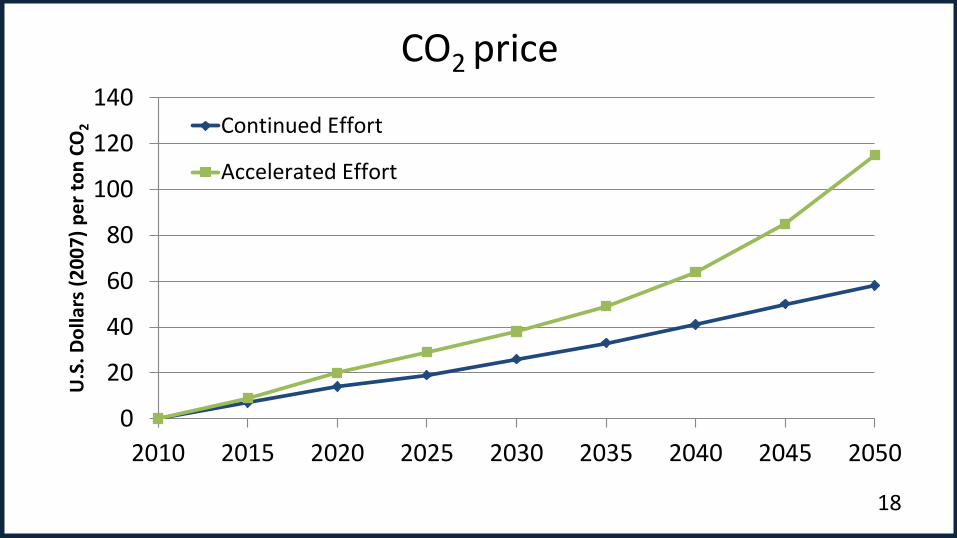
CO2 price
18
0
20
40
60
80
100
120
140
2010 2015 2020 2025 2030 2035 2040 2045 2050
U.S
. Do
llars
(2
00
7)
pe
r to
n C
O2
Continued Effort
Accelerated Effort
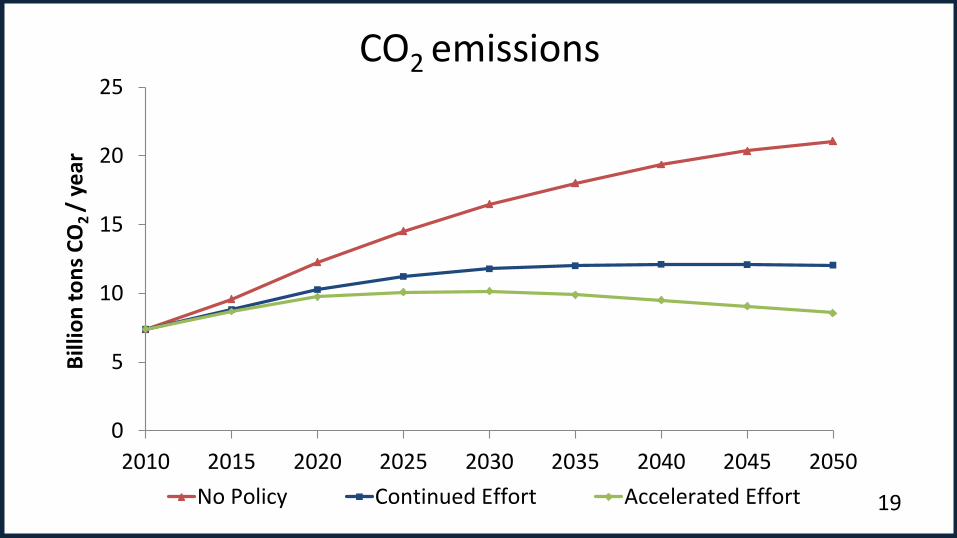
CO2 emissions
19
0
5
10
15
20
25
2010 2015 2020 2025 2030 2035 2040 2045 2050
Bill
ion
to
ns
CO
2 /
ye
ar
No Policy Continued Effort Accelerated Effort
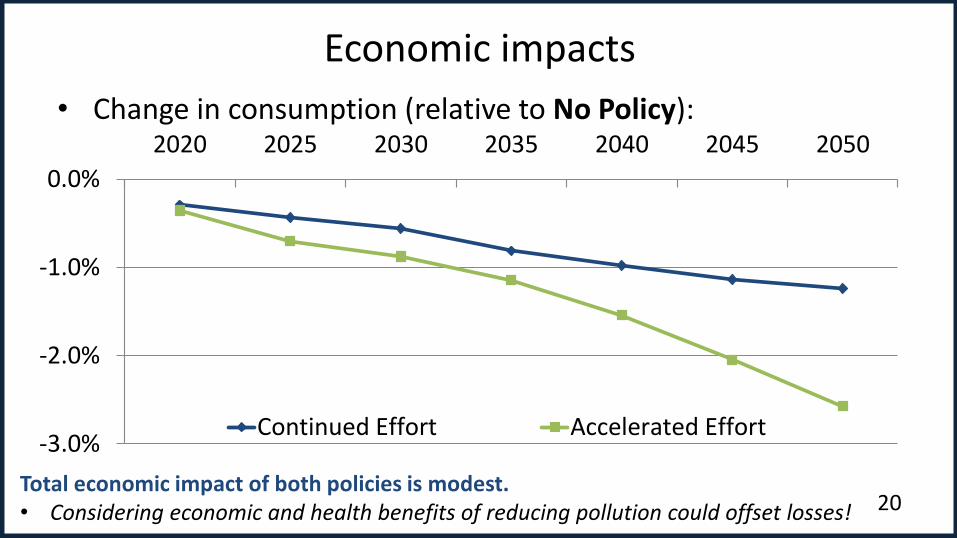
Economic impacts
20
• Change in consumption (relative to No Policy):
-3.0%
-2.0%
-1.0%
0.0%
2020 2025 2030 2035 2040 2045 2050
Continued Effort Accelerated Effort
Total economic impact of both policies is modest. • Considering economic and health benefits of reducing pollution could offset losses!
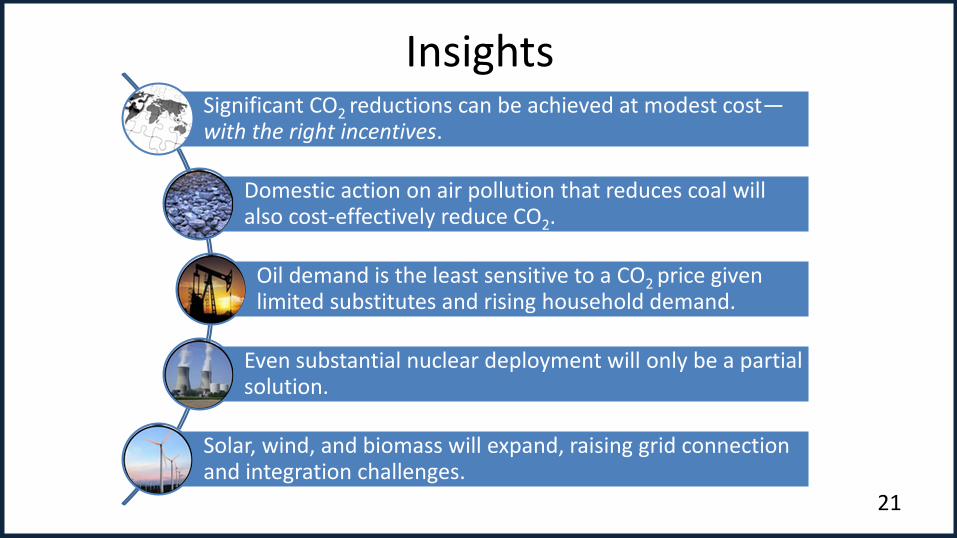
Insights
21
Significant CO2 reductions can be achieved at modest cost—with the right incentives.
Domestic action on air pollution that reduces coal will also cost-effectively reduce CO2.
Oil demand is the least sensitive to a CO2 price given limited substitutes and rising household demand.
Even substantial nuclear deployment will only be a partial solution.
Solar, wind, and biomass will expand, raising grid connection and integration challenges.
globalchange.mit.edu/cecp 22
Thank you 谢谢!


![Drivers of Demand for Travel in London[1]](https://static.fdocuments.net/doc/165x107/577cc47a1a28aba711997090/drivers-of-demand-for-travel-in-london1.jpg)