
Print - 400W48V M&W brand switching power supply products ...
Athens Journal of Mass Media and Communications January 2018
7
Drivers of Brand Switching Behavior in Mobile
Telecommunications
By Nicholas Grigoriou
Aveek Majumdar†
Lars Lie‡
Brand switching refers to migration of users from one brand to another. Switching is associated
with negative consequences such as declining market share and poor profitability. As such, mobile
telecommunications user switching has become a critical issue facing mobile service providers.
Drawn from an online self-completion survey of mobile telecommunications users (N = 24,141)
across four countries, this study examines previously unexplored antecedent factors determining
brand switching behavior of mobile telecommunications users, and the relative importance of those
factors. The research identifies the overall dimensions of switching behavior and then validates a
theoretical model. The regression model suggests weak coefficient of determination (R2) between
the dependent and independent variables. The study bridges the theoretical and practical
knowledge gap in the literature by examining factors influencing consumers’ switching behavior.
Two economically developed and two emerging economies were selected in this study to examine
potential differences in consumers’ behavior towards mobile telecommunications services in both
emerging and developed markets, and help us understand the potential reasons for these
differences.
Keywords: branding, mobile telecommunications, switching behavior
Introduction
Over the past 20 years, the telecommunications industry has experienced
significant growth spurred by the highly competitive mobile telecommunications
revolution (Svendsen & Prebensen, 2013). Mobile phone handsets have changed
the way consumers use them. Beyond making and receiving calls and sending
short messages (SMS), today mobile phone handsets are used for data download,
internet access, listening to music, playing games, GPS navigation, and
videoconferencing. Malhotra and Kubowicz Malhotra (2013) posit that mobile
phones have evolved into multi-tasking devices where 70% of usage is voice
and 30% is data. Mobile telecommunications service providers continue to
invest capital to improve their infrastructure and the quality of their service
provision. In doing so, many of these mobile telecommunications service
providers partner with handset manufacturers to ensure service compatibility,
thus enriching the customer experience.
The growth of the mobile telecommunications industry has resulted in
greater choice of services and service providers for consumers. In some
nations, such as Australia, Bahrain, Latvia, and Luxembourg, the mobile phone
penetration rate exceeds 100% (Chuang, 2011) as measured by the number of
Lecturer in Marketing, School of Business, Monash University Malaysia, Malaysia.
† Associate Director, Client Services, The Nielsen Company, Malaysia.
‡ Senior Manager, Client Services, The Nielsen Company, Malaysia.
Vol. 4, No. 1 Grigoriou et al.: Drivers of Brand Switching Behavior…
8
mobile phones in circulation, per head of the population. More than five billion
mobile service subscriptions support the notion that approximately 80% of the
world’s population communicates on the go (Global Mobile Suppliers
Association, 2012). As new consumers enter this market, mobile
telecommunications service providers must retain their existing customers and
grow their customer base to sustain their revenue and market share (Malhotra
& Kubowicz Malhotra, 2013). Doing so requires, inter alia, the provision of
service quality (Zeithaml, Berry, & Parasuraman 1996). As Lim, Widdows,
and Park (2006) demonstrate, service quality in the mobile services industry
affects customer satisfaction and loyalty through economic and emotional factors.
This study addresses a gap in our existing knowledge of what causes brand
switching behavior in the fast growing mobile telecommunications industry.
We provide practical guidance to managerial decision makers in the industry
by identifying and modeling the variables that cause consumers to switch
mobile telecommunications brands. Further, we expand our theoretical
understanding of the causes brand switching behavior by demonstrating the
interrelationships among the variables that cause switching behavior and
provide suggested guidelines for further research in this area. In doing so, we
attempt to address the research question: What factors affect consumers’
switching behavior for mobile telecommunications providers?
Understanding the factors affecting brand switching in the mobile
telecommunications industry has important managerial implications for
customer retention (Edward & Sahadev, 2011; Kouser, Qureshi, Shahzad, &
Hasan 2012; Ooko, Nzomoi, & Numo, 2014). In turn, understanding brand
switching behavior assists firms in understanding customer loyalty determinants
(Adjei & Denanyoh, 2014) and with the design, development, and implementation
of customer loyalty programs (Lee, Lee, & Feick, 2001), which is seen as a
pre-requisite for customer lifetime value (Heskett, 2002).
The rest of this paper is organized as follows. First we provide a review of
the relevant literature of brand switching. We then propose research hypotheses
and a conceptual model for empirical validation. Section four addresses the
research methodology employed in this study. In section five we present the
analysis of the data and the findings of our study. The paper ends with the
conclusion from our finds.
Literature Review
Brand Loyalty
Brand loyalty is a concept that has attracted considerable scholarly
attention from marketing practitioners and academics (Worthington, Russell-
Bennett, & Härtel, 2010). Brand loyalty consists of a consumerʼs commitment
to repurchase or otherwise continue using the brand and can be demonstrated
by repeated buying of a branded product over another (Farhat & Khan, 2011).
In todayʼs competitive environment where consumers have numerous choices
Athens Journal of Mass Media and Communications January 2018
9
of brands, building and sustaining brand loyalty is crucial for the survival of
firms (Ramaseshan & Stein, 2014). Academic interest in brand loyalty reveals
that brand loyalty is a multidimensional construct. For instance, brand loyalty
has been empirically examined from brand personality perspective (Roy,
Khandeparkar, & Motiani, 2016), consumer brand experiences (Iglesias,
Singh, & Batista-Foguet, 2011), brand communities (Kamboj & Rahman,
2016), brand equity (Guzmán, 2012), and brand switching behavior (Al-Kwifi
& Ahmed, 2015). Considering the numerous benefits accrued through brand
loyalty, scholarly research has focused on how to increase and sustain brand
loyalty (Ha, John, Janda, & Muthaly, 2011). One such approach is through the
dual strategy and the reduction of churning.
Customer Retention and Churning
A fundamental premise of marketing involves the acquisition and retention
of customers, given the incremental cost difference between acquiring a new
customer and retaining an existing one. Within the mobile telecommunications
sector, the cost of acquiring new customers is prohibitive for many service
providers compared to the cost of retaining current customer (Coussement,
Benoit, & Van den Poel, 2010). Fornell and Wernerfelt (1988) posit that acquiring
a new customer costs the telecommunications service provider four to five
times as much as keeping an existing customer satisfied, whilst Seo, Ranganathan,
& Babad (2008) found that figure to be closer to 15 times. Further, as scholars
have noted, customer retention may result in perceptual, motivational, and
behavioral consequences that are beneficial to the service provider (Bansal &
Taylor, 1999; Burnham, Frels, & Mahajan, 2003). Thus, market driven firms
place particular emphasis in their marketing on retaining existing customers
while seeking to acquire new ones (Gustafsson, Johnson, & Roos, 2005). This
paradigm gave rise to the practice of relationship marketing (Verhoef, 2003).
Despite the growing body of literature on customer retention (Ngai, 2005),
"churn" or customer movement between competitors, remains on ongoing
problem for service providers (Keaveney & Parthasarathy, 2001). In light of
this, Berry and Linoff (2004) posit that within the mobile telecommunications
industry, two types of churn exist. Voluntary churn refers to customers who
decide to sever their relationship with their service provider, whereas
involuntary churn refers to a situation where the service provider terminates the
relationship with a customer, often due to non-payment of invoices. Whilst
both churn types in the mobile telephone industry are reportedly high, exact
churn rates are difficult to discern (Seo et al., 2008).
Consumers’ desire and ability to switch service providers is often a
function of switching costs. Switching costs include economic (e.g. financial)
and non-economic (e.g. search effort) costs (Burnham et al., 2003). Switching
costs are barriers to switching and they act as factors that make it difficult and
costly for consumers to change service providers (Jones, Mothersbaugh, &
Beatty, 2000). Scholars have found that customer satisfaction is also linked to
the desire to switch mobile telecommunications service providers (Shin &
Kim, 2008), although not all consumers who switch providers do so from a
Vol. 4, No. 1 Grigoriou et al.: Drivers of Brand Switching Behavior…
10
lack of customer satisfaction. For instance, within the mobile telephone
industry, customers are prone to switching providers if a competing firm provides
lower prices (Madden, Savage, & Coble-Neal, 1999) or other value added
service (Kim & Yoon, 2004).
Research has shown that regulatory policy, like mobile phone number
portability between service providers, affects consumers’ switching behavior.
In nations where number portability exists, consumers can retain their mobile
number while switching between providers.
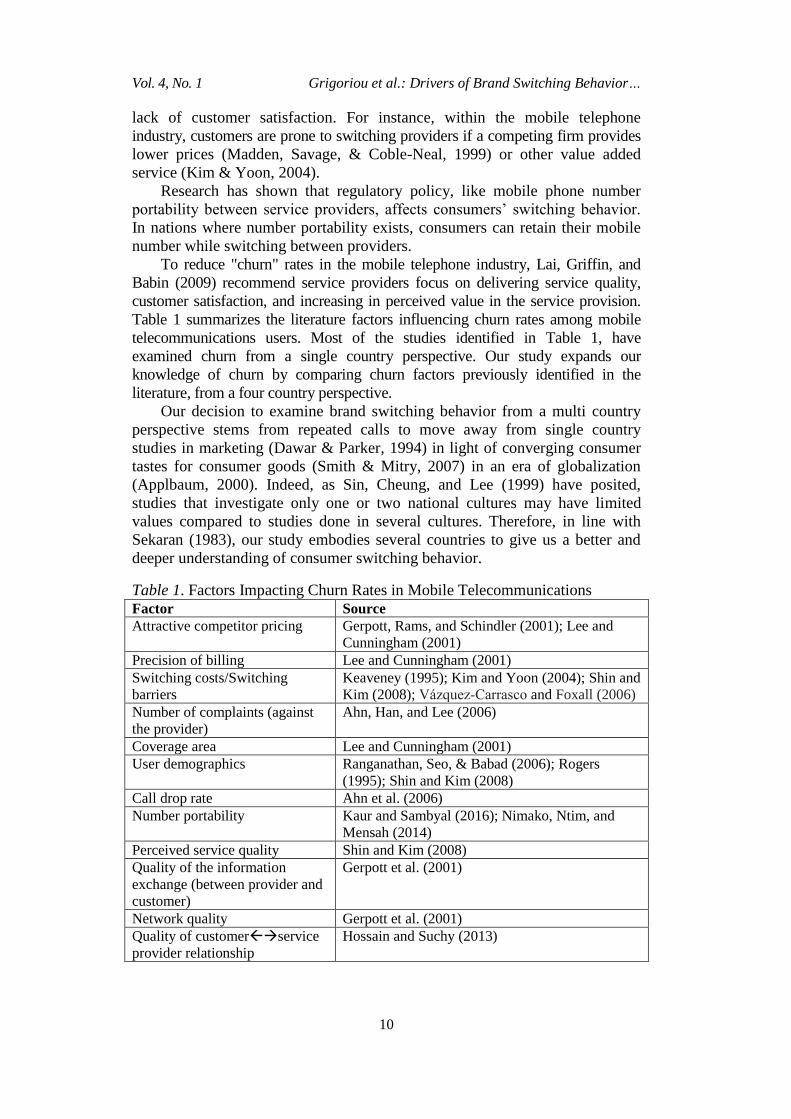
To reduce "churn" rates in the mobile telephone industry, Lai, Griffin, and
Babin (2009) recommend service providers focus on delivering service quality,
customer satisfaction, and increasing in perceived value in the service provision.
Table 1 summarizes the literature factors influencing churn rates among mobile
telecommunications users. Most of the studies identified in Table 1, have
examined churn from a single country perspective. Our study expands our
knowledge of churn by comparing churn factors previously identified in the
literature, from a four country perspective.
Our decision to examine brand switching behavior from a multi country
perspective stems from repeated calls to move away from single country
studies in marketing (Dawar & Parker, 1994) in light of converging consumer
tastes for consumer goods (Smith & Mitry, 2007) in an era of globalization
(Applbaum, 2000). Indeed, as Sin, Cheung, and Lee (1999) have posited,
studies that investigate only one or two national cultures may have limited
values compared to studies done in several cultures. Therefore, in line with
Sekaran (1983), our study embodies several countries to give us a better and
deeper understanding of consumer switching behavior.
Table 1. Factors Impacting Churn Rates in Mobile Telecommunications
Factor Source Attractive competitor pricing Gerpott, Rams, and Schindler (2001); Lee and
Cunningham (2001) Precision of billing Lee and Cunningham (2001) Switching costs/Switching
barriers
Keaveney (1995); Kim and Yoon (2004); Shin and
Kim (2008); Vázquez‐Carrasco and Foxall (2006) Number of complaints (against
the provider)
Ahn, Han, and Lee (2006)
Coverage area Lee and Cunningham (2001) User demographics Ranganathan, Seo, & Babad (2006); Rogers
(1995); Shin and Kim (2008) Call drop rate Ahn et al. (2006) Number portability Kaur and Sambyal (2016); Nimako, Ntim, and
Mensah (2014) Perceived service quality Shin and Kim (2008) Quality of the information
exchange (between provider and
customer)
Gerpott et al. (2001)
Network quality Gerpott et al. (2001) Quality of customerservice
provider relationship
Hossain and Suchy (2013)
Athens Journal of Mass Media and Communications January 2018
11
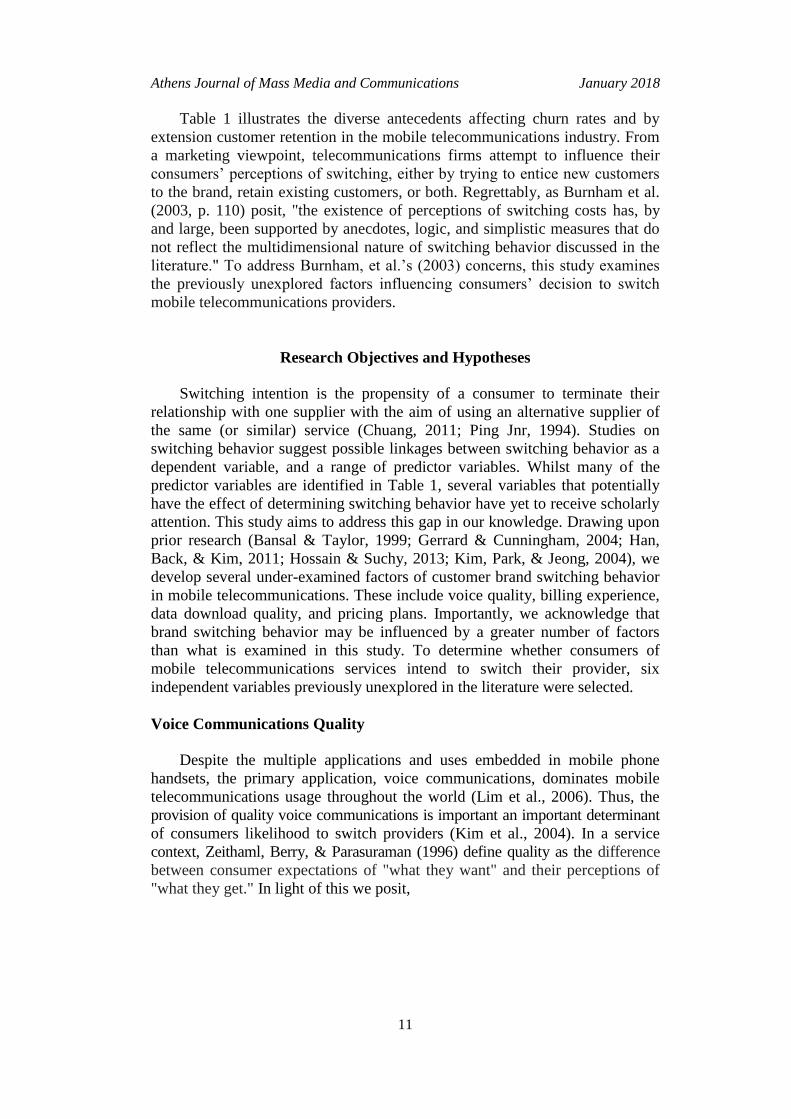
Table 1 illustrates the diverse antecedents affecting churn rates and by
extension customer retention in the mobile telecommunications industry. From
a marketing viewpoint, telecommunications firms attempt to influence their
consumers’ perceptions of switching, either by trying to entice new customers
to the brand, retain existing customers, or both. Regrettably, as Burnham et al.
(2003, p. 110) posit, "the existence of perceptions of switching costs has, by
and large, been supported by anecdotes, logic, and simplistic measures that do
not reflect the multidimensional nature of switching behavior discussed in the
literature." To address Burnham, et al.’s (2003) concerns, this study examines
the previously unexplored factors influencing consumers’ decision to switch
mobile telecommunications providers.
Research Objectives and Hypotheses
Switching intention is the propensity of a consumer to terminate their
relationship with one supplier with the aim of using an alternative supplier of
the same (or similar) service (Chuang, 2011; Ping Jnr, 1994). Studies on
switching behavior suggest possible linkages between switching behavior as a
dependent variable, and a range of predictor variables. Whilst many of the
predictor variables are identified in Table 1, several variables that potentially
have the effect of determining switching behavior have yet to receive scholarly
attention. This study aims to address this gap in our knowledge. Drawing upon
prior research (Bansal & Taylor, 1999; Gerrard & Cunningham, 2004; Han,
Back, & Kim, 2011; Hossain & Suchy, 2013; Kim, Park, & Jeong, 2004), we
develop several under-examined factors of customer brand switching behavior
in mobile telecommunications. These include voice quality, billing experience,
data download quality, and pricing plans. Importantly, we acknowledge that
brand switching behavior may be influenced by a greater number of factors
than what is examined in this study. To determine whether consumers of
mobile telecommunications services intend to switch their provider, six
independent variables previously unexplored in the literature were selected.
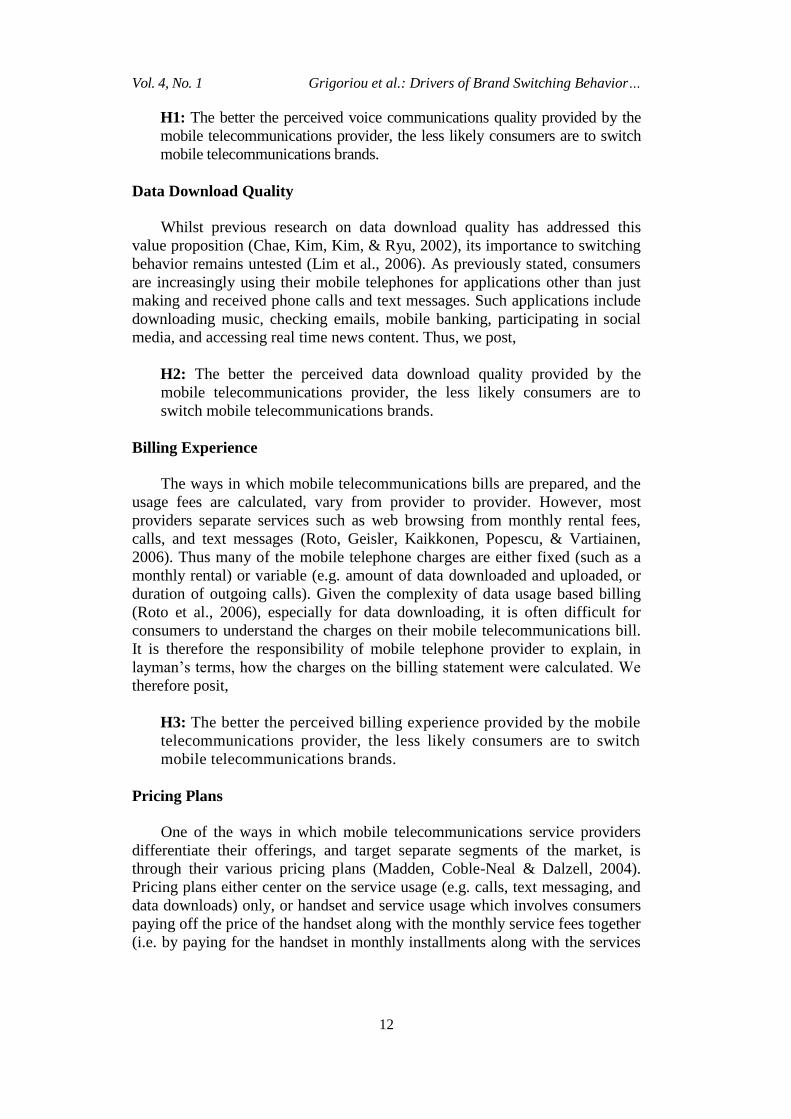
Voice Communications Quality
Despite the multiple applications and uses embedded in mobile phone
handsets, the primary application, voice communications, dominates mobile
telecommunications usage throughout the world (Lim et al., 2006). Thus, the
provision of quality voice communications is important an important determinant
of consumers likelihood to switch providers (Kim et al., 2004). In a service
context, Zeithaml, Berry, & Parasuraman (1996) define quality as the difference
between consumer expectations of "what they want" and their perceptions of
"what they get." In light of this we posit,
Vol. 4, No. 1 Grigoriou et al.: Drivers of Brand Switching Behavior…
12
H1: The better the perceived voice communications quality provided by the
mobile telecommunications provider, the less likely consumers are to switch
mobile telecommunications brands.
Data Download Quality
Whilst previous research on data download quality has addressed this
value proposition (Chae, Kim, Kim, & Ryu, 2002), its importance to switching
behavior remains untested (Lim et al., 2006). As previously stated, consumers
are increasingly using their mobile telephones for applications other than just
making and received phone calls and text messages. Such applications include
downloading music, checking emails, mobile banking, participating in social
media, and accessing real time news content. Thus, we post,
H2: The better the perceived data download quality provided by the
mobile telecommunications provider, the less likely consumers are to
switch mobile telecommunications brands.
Billing Experience
The ways in which mobile telecommunications bills are prepared, and the
usage fees are calculated, vary from provider to provider. However, most
providers separate services such as web browsing from monthly rental fees,
calls, and text messages (Roto, Geisler, Kaikkonen, Popescu, & Vartiainen,
2006). Thus many of the mobile telephone charges are either fixed (such as a
monthly rental) or variable (e.g. amount of data downloaded and uploaded, or
duration of outgoing calls). Given the complexity of data usage based billing
(Roto et al., 2006), especially for data downloading, it is often difficult for
consumers to understand the charges on their mobile telecommunications bill.
It is therefore the responsibility of mobile telephone provider to explain, in
layman’s terms, how the charges on the billing statement were calculated. We
therefore posit,
H3: The better the perceived billing experience provided by the mobile
telecommunications provider, the less likely consumers are to switch
mobile telecommunications brands.
Pricing Plans
One of the ways in which mobile telecommunications service providers
differentiate their offerings, and target separate segments of the market, is
through their various pricing plans (Madden, Coble-Neal & Dalzell, 2004).
Pricing plans either center on the service usage (e.g. calls, text messaging, and
data downloads) only, or handset and service usage which involves consumers
paying off the price of the handset along with the monthly service fees together
(i.e. by paying for the handset in monthly installments along with the services
Athens Journal of Mass Media and Communications January 2018
13
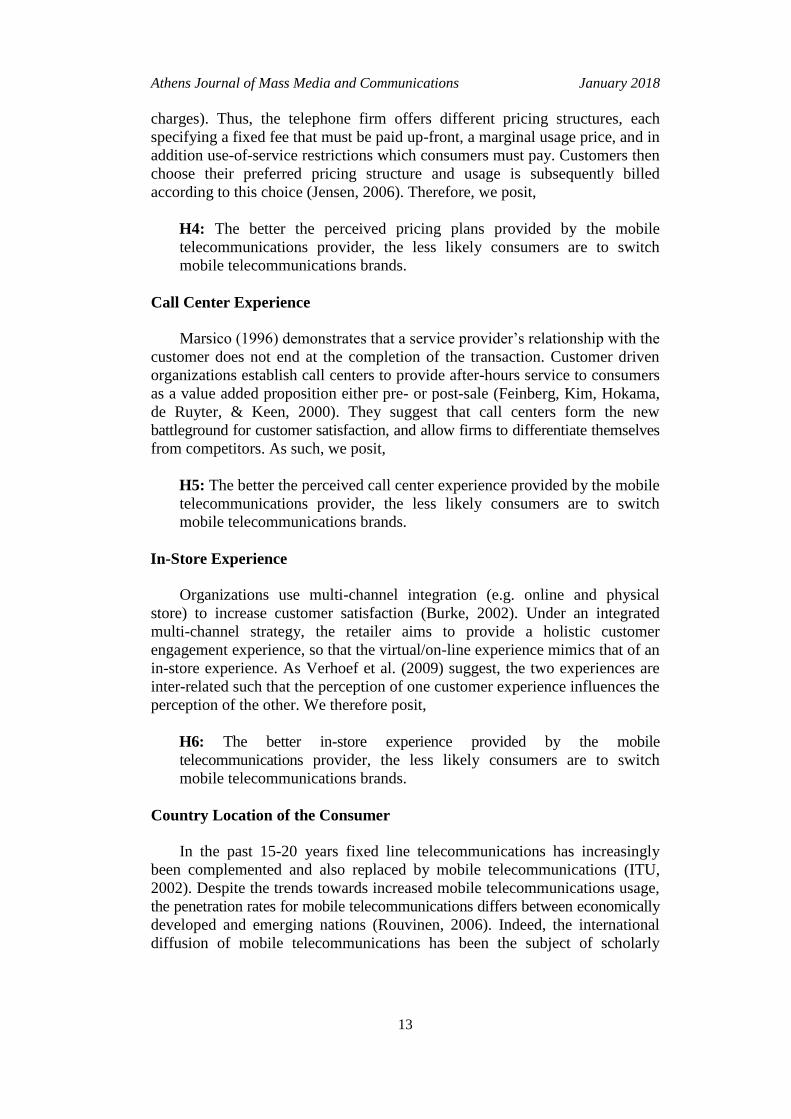
charges). Thus, the telephone firm offers different pricing structures, each
specifying a fixed fee that must be paid up-front, a marginal usage price, and in
addition use-of-service restrictions which consumers must pay. Customers then
choose their preferred pricing structure and usage is subsequently billed
according to this choice (Jensen, 2006). Therefore, we posit,
H4: The better the perceived pricing plans provided by the mobile
telecommunications provider, the less likely consumers are to switch
mobile telecommunications brands.
Call Center Experience
Marsico (1996) demonstrates that a service provider’s relationship with the
customer does not end at the completion of the transaction. Customer driven
organizations establish call centers to provide after-hours service to consumers
as a value added proposition either pre- or post-sale (Feinberg, Kim, Hokama,
de Ruyter, & Keen, 2000). They suggest that call centers form the new
battleground for customer satisfaction, and allow firms to differentiate themselves
from competitors. As such, we posit,
H5: The better the perceived call center experience provided by the mobile
telecommunications provider, the less likely consumers are to switch
mobile telecommunications brands.
In-Store Experience
Organizations use multi-channel integration (e.g. online and physical
store) to increase customer satisfaction (Burke, 2002). Under an integrated
multi-channel strategy, the retailer aims to provide a holistic customer
engagement experience, so that the virtual/on-line experience mimics that of an
in-store experience. As Verhoef et al. (2009) suggest, the two experiences are
inter-related such that the perception of one customer experience influences the
perception of the other. We therefore posit,
H6: The better in-store experience provided by the mobile
telecommunications provider, the less likely consumers are to switch
mobile telecommunications brands.
Country Location of the Consumer
In the past 15-20 years fixed line telecommunications has increasingly
been complemented and also replaced by mobile telecommunications (ITU,
2002). Despite the trends towards increased mobile telecommunications usage,
the penetration rates for mobile telecommunications differs between economically
developed and emerging nations (Rouvinen, 2006). Indeed, the international
diffusion of mobile telecommunications has been the subject of scholarly
Vol. 4, No. 1 Grigoriou et al.: Drivers of Brand Switching Behavior…
14
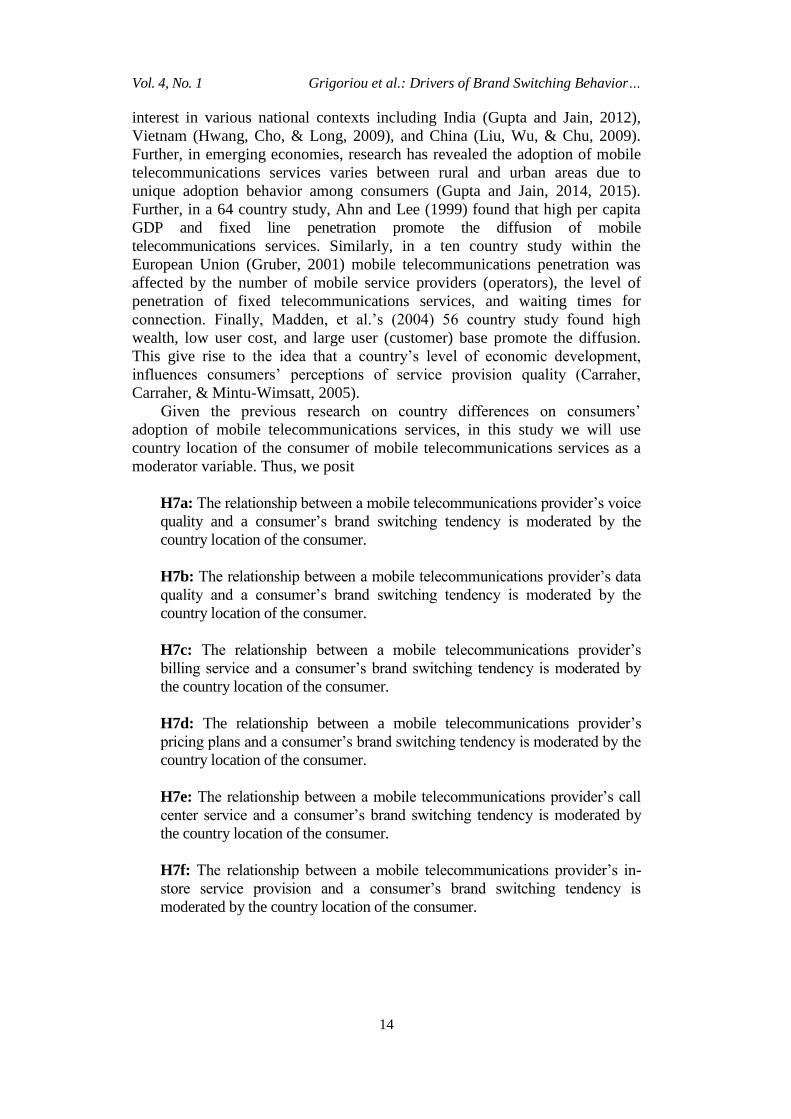
interest in various national contexts including India (Gupta and Jain, 2012),
Vietnam (Hwang, Cho, & Long, 2009), and China (Liu, Wu, & Chu, 2009).
Further, in emerging economies, research has revealed the adoption of mobile
telecommunications services varies between rural and urban areas due to
unique adoption behavior among consumers (Gupta and Jain, 2014, 2015).
Further, in a 64 country study, Ahn and Lee (1999) found that high per capita
GDP and fixed line penetration promote the diffusion of mobile
telecommunications services. Similarly, in a ten country study within the
European Union (Gruber, 2001) mobile telecommunications penetration was
affected by the number of mobile service providers (operators), the level of
penetration of fixed telecommunications services, and waiting times for
connection. Finally, Madden, et al.’s (2004) 56 country study found high
wealth, low user cost, and large user (customer) base promote the diffusion.
This give rise to the idea that a country’s level of economic development,
influences consumers’ perceptions of service provision quality (Carraher,
Carraher, & Mintu-Wimsatt, 2005).
Given the previous research on country differences on consumers’
adoption of mobile telecommunications services, in this study we will use
country location of the consumer of mobile telecommunications services as a
moderator variable. Thus, we posit
H7a: The relationship between a mobile telecommunications provider’s voice
quality and a consumer’s brand switching tendency is moderated by the
country location of the consumer.
H7b: The relationship between a mobile telecommunications provider’s data
quality and a consumer’s brand switching tendency is moderated by the
country location of the consumer.
H7c: The relationship between a mobile telecommunications provider’s
billing service and a consumer’s brand switching tendency is moderated by
the country location of the consumer.
H7d: The relationship between a mobile telecommunications provider’s
pricing plans and a consumer’s brand switching tendency is moderated by the
country location of the consumer.
H7e: The relationship between a mobile telecommunications provider’s call
center service and a consumer’s brand switching tendency is moderated by
the country location of the consumer.
H7f: The relationship between a mobile telecommunications provider’s in-
store service provision and a consumer’s brand switching tendency is
moderated by the country location of the consumer.
Athens Journal of Mass Media and Communications January 2018
15
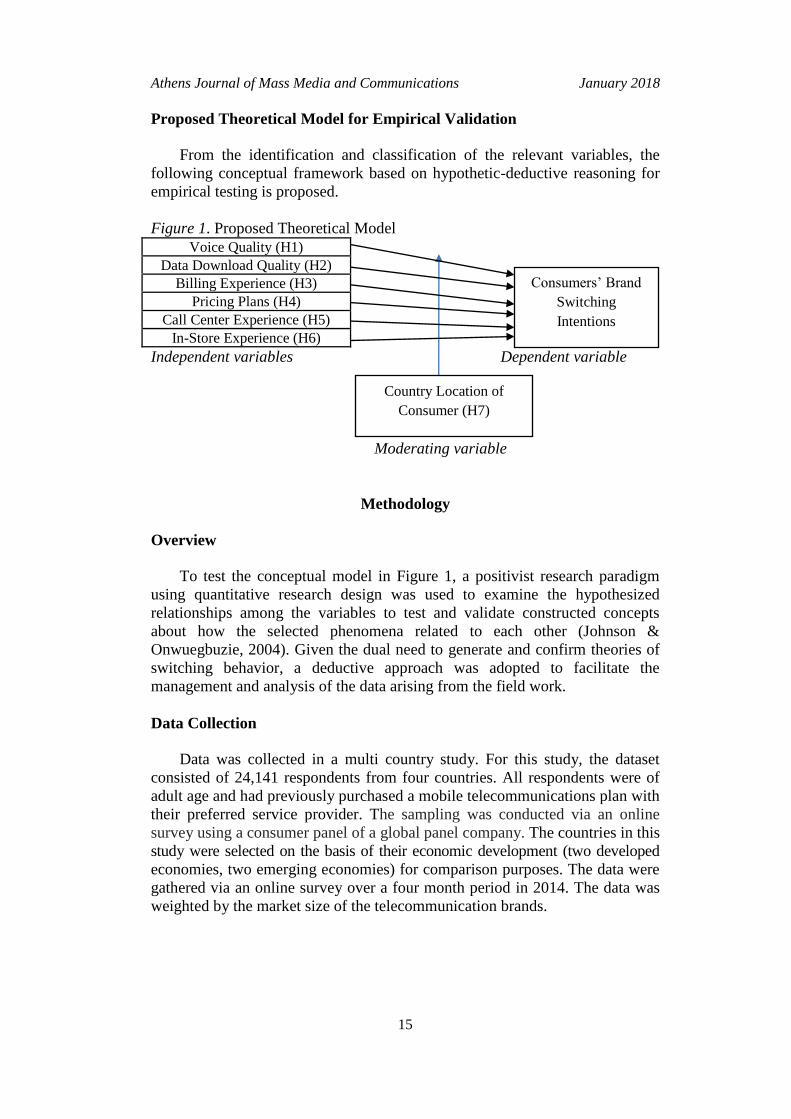
Proposed Theoretical Model for Empirical Validation
From the identification and classification of the relevant variables, the
following conceptual framework based on hypothetic-deductive reasoning for
empirical testing is proposed.
Figure 1. Proposed Theoretical Model
Voice Quality (H1) Data Download Quality (H2)
Billing Experience (H3) Pricing Plans (H4)
Call Center Experience (H5) In-Store Experience (H6)
Independent variables Dependent variable
Moderating variable
Methodology
Overview
To test the conceptual model in Figure 1, a positivist research paradigm
using quantitative research design was used to examine the hypothesized
relationships among the variables to test and validate constructed concepts
about how the selected phenomena related to each other (Johnson &
Onwuegbuzie, 2004). Given the dual need to generate and confirm theories of
switching behavior, a deductive approach was adopted to facilitate the
management and analysis of the data arising from the field work.
Data Collection
Data was collected in a multi country study. For this study, the dataset
consisted of 24,141 respondents from four countries. All respondents were of
adult age and had previously purchased a mobile telecommunications plan with
their preferred service provider. The sampling was conducted via an online
survey using a consumer panel of a global panel company. The countries in this
study were selected on the basis of their economic development (two developed
economies, two emerging economies) for comparison purposes. The data were
gathered via an online survey over a four month period in 2014. The data was
weighted by the market size of the telecommunication brands.
Consumers’ Brand
Switching
Intentions
Country Location of
Consumer (H7)
Vol. 4, No. 1 Grigoriou et al.: Drivers of Brand Switching Behavior…
16
The number of telecommunications brands covered in each country varied
between three and seven, as illustrated below:
China: 3 (China Mobile, China Unicom, China Telecom)
India: 7 (Airtel, Vodafone, Reliance Communication, Idea, BSNL, Aircel,
Uninor)
Japan: 5 (NTT Docomo, KDDI Mobile, SoftBank Mobile, EMOBILE,
Willcom)
USA: 6 (AT&T, Verizon, Sprint, T-Mobile, Cellular One, US Cellular)
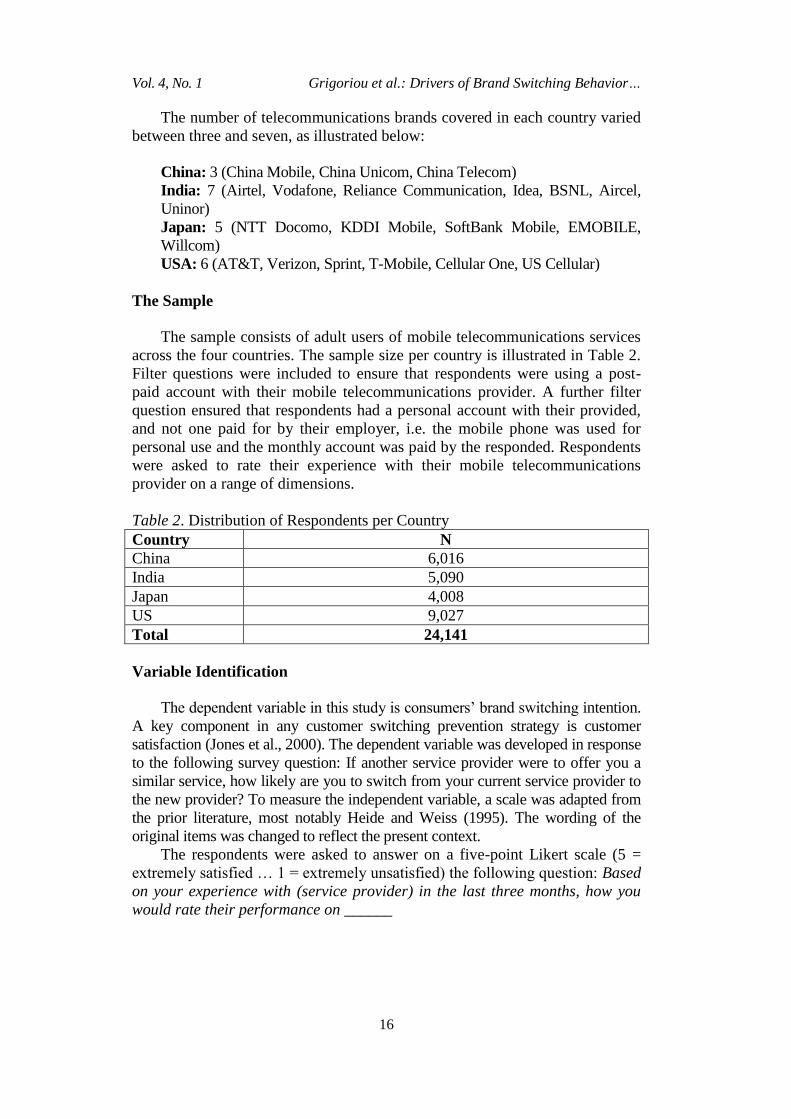
The Sample
The sample consists of adult users of mobile telecommunications services
across the four countries. The sample size per country is illustrated in Table 2.
Filter questions were included to ensure that respondents were using a post-
paid account with their mobile telecommunications provider. A further filter
question ensured that respondents had a personal account with their provided,
and not one paid for by their employer, i.e. the mobile phone was used for
personal use and the monthly account was paid by the responded. Respondents
were asked to rate their experience with their mobile telecommunications
provider on a range of dimensions.
Table 2. Distribution of Respondents per Country
Country N
China 6,016
India 5,090
Japan 4,008
US 9,027
Total 24,141
Variable Identification
The dependent variable in this study is consumers’ brand switching intention.
A key component in any customer switching prevention strategy is customer
satisfaction (Jones et al., 2000). The dependent variable was developed in response
to the following survey question: If another service provider were to offer you a
similar service, how likely are you to switch from your current service provider to
the new provider? To measure the independent variable, a scale was adapted from
the prior literature, most notably Heide and Weiss (1995). The wording of the
original items was changed to reflect the present context.
The respondents were asked to answer on a five-point Likert scale (5 =
extremely satisfied … 1 = extremely unsatisfied) the following question: Based
on your experience with (service provider) in the last three months, how you
would rate their performance on ______
Athens Journal of Mass Media and Communications January 2018
17
1. Voice Quality.
2. Data Quality.
3. Billing Experience/Recharge experience.
4. Pricing Plans.
5. Call Center Experience.
6. In Store/Outlet experience.
In addition to the six independent variables, the county location of the
telecommunications provider was used as a moderating variable to test the
strength of the relationship between the dependent and independent variables.
To examine the moderating effects of country location, the total sample was
divided into the four focal countries from which data were collected. The
countries and sample sizes per country are illustrated in Table 2.
Questionnaire Design
Survey research was used to collect numerical data to test our stated
hypotheses. Specifically, our research instrument was designed to collect data
related to the attitudes, practices and perceptions of mobile telecommunications
consumers regarding brand switching behavior. To measure the constructs,
procedures were derived from the extant literature. We used Chang and Chen’s
(2007) service sector loyalty scale and adapted it for mobile telecommunications
services. The survey was issued to adults in the focal countries via an online
survey. The survey included filter questions to preclude non-adults from
participating in the survey, and to ensure the responded was currently using a paid
mobile telecommunications plan.
Data Analysis and Findings
To examine the hypothesized relationships among the variables, we
conducted a logistic regression analysis in line with the recommendations of
Dayton (1992). Our empirical findings validate the hypotheses of this research,
and a number of management implications can be derived.
All independent variables indicated that higher rated performance by a
service provider will decrease the probability of brand switching (i.e. increase
the likelihood of customer retention). Thus, consumers are less likely to switch
brands when a service provider was rated higher than its competitors on their
provision of mobile telecommunications services However, our logistic model
coefficient does not interpret the size of the marginal effect. Therefore, we can
only posit if the independent variables have a positive or a negative effect on
the dependent variable.
We found that data quality, billing experience, voice quality, pricing plans,
call center experience and in-store experience were found to have a positive effect
on customer retention across the four countries, holding all other variables
constant, as the p-value is lower than 0.05 at the 95% confidence interval. This
means consumers were less likely to switch brands when the telecommunications
Vol. 4, No. 1 Grigoriou et al.: Drivers of Brand Switching Behavior…
18
service provider improved their provision of these services across the four
countries. The managerial implication of this finding for telecommunications firms
provides insights as to what specific aspects of the firms’ value proposition is
likely to drive, or result, in brand switching behavior. Accordingly, organizational
resources should be focused towards improving these service dimensions.
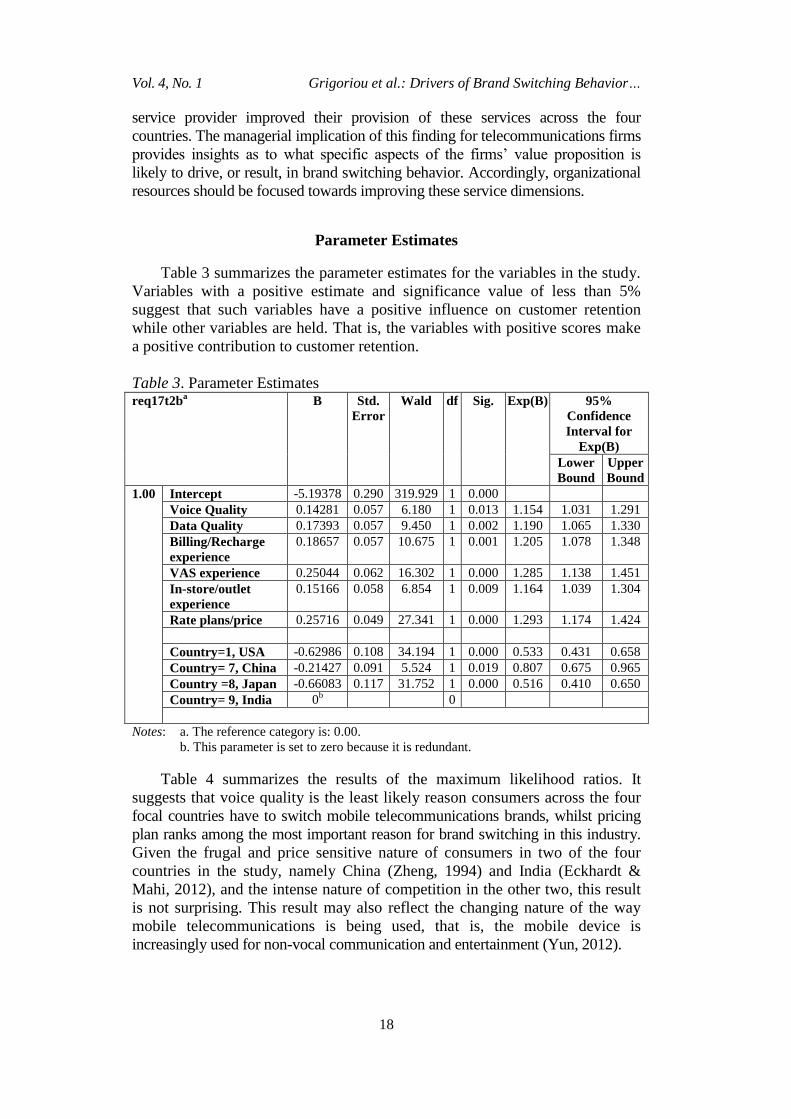
Parameter Estimates
Table 3 summarizes the parameter estimates for the variables in the study.
Variables with a positive estimate and significance value of less than 5%
suggest that such variables have a positive influence on customer retention
while other variables are held. That is, the variables with positive scores make
a positive contribution to customer retention.
Table 3. Parameter Estimates
req17t2ba B Std.
Error
Wald df Sig. Exp(B) 95%
Confidence
Interval for
Exp(B) Lower
Bound
Upper
Bound 1.00 Intercept -5.19378 0.290 319.929 1 0.000
Voice Quality 0.14281 0.057 6.180 1 0.013 1.154 1.031 1.291 Data Quality 0.17393 0.057 9.450 1 0.002 1.190 1.065 1.330 Billing/Recharge
experience
0.18657 0.057 10.675 1 0.001 1.205 1.078 1.348
VAS experience 0.25044 0.062 16.302 1 0.000 1.285 1.138 1.451 In-store/outlet
experience
0.15166 0.058 6.854 1 0.009 1.164 1.039 1.304
Rate plans/price 0.25716 0.049 27.341 1 0.000 1.293 1.174 1.424
Country=1, USA -0.62986 0.108 34.194 1 0.000 0.533 0.431 0.658 Country= 7, China -0.21427 0.091 5.524 1 0.019 0.807 0.675 0.965 Country =8, Japan -0.66083 0.117 31.752 1 0.000 0.516 0.410 0.650 Country= 9, India 0
b 0
Notes: a. The reference category is: 0.00.
b. This parameter is set to zero because it is redundant.
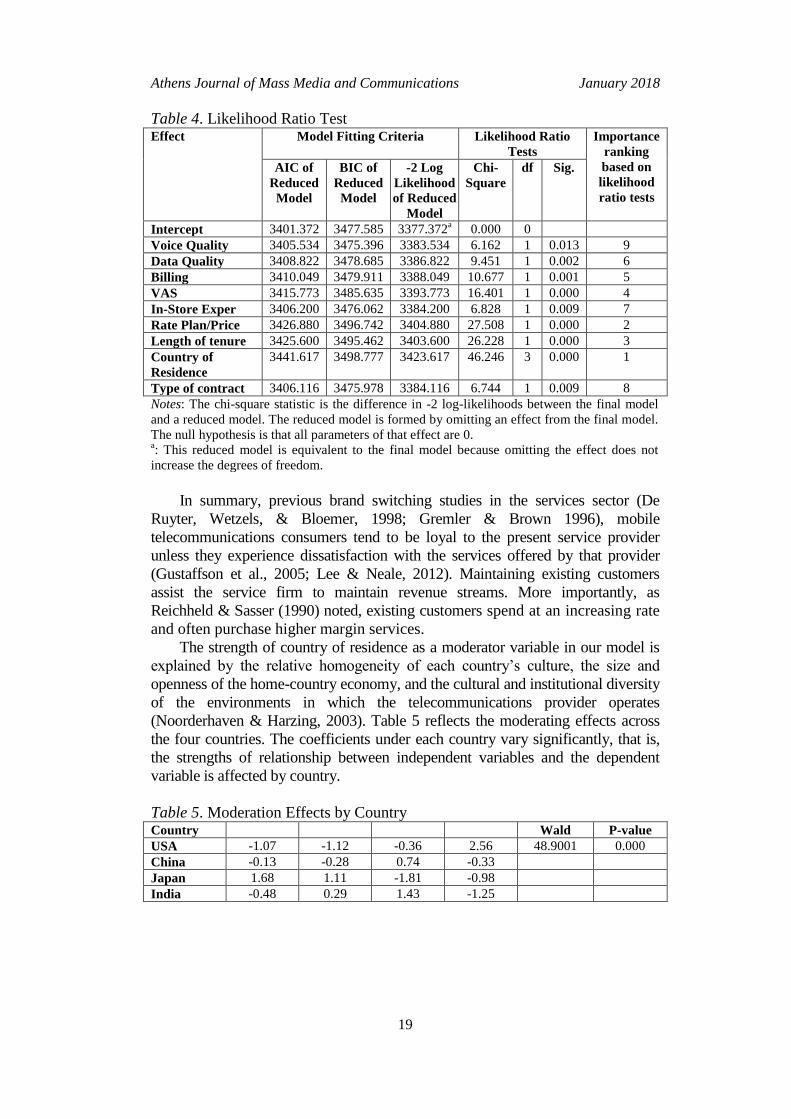
Table 4 summarizes the results of the maximum likelihood ratios. It
suggests that voice quality is the least likely reason consumers across the four
focal countries have to switch mobile telecommunications brands, whilst pricing
plan ranks among the most important reason for brand switching in this industry.
Given the frugal and price sensitive nature of consumers in two of the four
countries in the study, namely China (Zheng, 1994) and India (Eckhardt &
Mahi, 2012), and the intense nature of competition in the other two, this result
is not surprising. This result may also reflect the changing nature of the way
mobile telecommunications is being used, that is, the mobile device is
increasingly used for non-vocal communication and entertainment (Yun, 2012).
Athens Journal of Mass Media and Communications January 2018
19
Table 4. Likelihood Ratio Test Effect Model Fitting Criteria Likelihood Ratio
Tests
Importance
ranking
based on
likelihood
ratio tests
AIC of
Reduced
Model
BIC of
Reduced
Model
-2 Log
Likelihood
of Reduced
Model
Chi-
Square
df Sig.
Intercept 3401.372 3477.585 3377.372a 0.000 0
Voice Quality 3405.534 3475.396 3383.534 6.162 1 0.013 9 Data Quality 3408.822 3478.685 3386.822 9.451 1 0.002 6 Billing 3410.049 3479.911 3388.049 10.677 1 0.001 5 VAS 3415.773 3485.635 3393.773 16.401 1 0.000 4 In-Store Exper 3406.200 3476.062 3384.200 6.828 1 0.009 7 Rate Plan/Price 3426.880 3496.742 3404.880 27.508 1 0.000 2 Length of tenure 3425.600 3495.462 3403.600 26.228 1 0.000 3 Country of
Residence
3441.617 3498.777 3423.617 46.246 3 0.000 1
Type of contract 3406.116 3475.978 3384.116 6.744 1 0.009 8 Notes: The chi-square statistic is the difference in -2 log-likelihoods between the final model
and a reduced model. The reduced model is formed by omitting an effect from the final model.
The null hypothesis is that all parameters of that effect are 0. a: This reduced model is equivalent to the final model because omitting the effect does not
increase the degrees of freedom.
In summary, previous brand switching studies in the services sector (De
Ruyter, Wetzels, & Bloemer, 1998; Gremler & Brown 1996), mobile
telecommunications consumers tend to be loyal to the present service provider
unless they experience dissatisfaction with the services offered by that provider
(Gustaffson et al., 2005; Lee & Neale, 2012). Maintaining existing customers
assist the service firm to maintain revenue streams. More importantly, as
Reichheld & Sasser (1990) noted, existing customers spend at an increasing rate
and often purchase higher margin services.
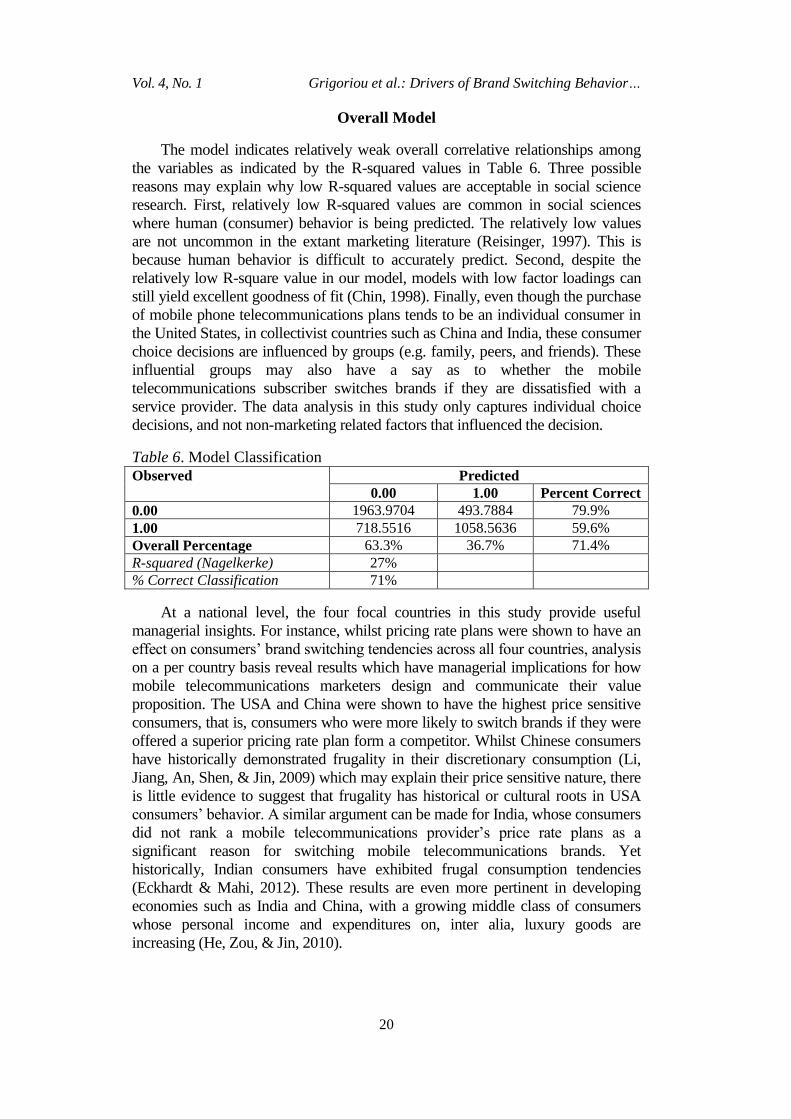
The strength of country of residence as a moderator variable in our model is
explained by the relative homogeneity of each country’s culture, the size and
openness of the home-country economy, and the cultural and institutional diversity
of the environments in which the telecommunications provider operates
(Noorderhaven & Harzing, 2003). Table 5 reflects the moderating effects across
the four countries. The coefficients under each country vary significantly, that is,
the strengths of relationship between independent variables and the dependent
variable is affected by country.
Table 5. Moderation Effects by Country Country Wald P-value USA -1.07 -1.12 -0.36 2.56 48.9001 0.000 China -0.13 -0.28 0.74 -0.33
Japan 1.68 1.11 -1.81 -0.98
India -0.48 0.29 1.43 -1.25
Vol. 4, No. 1 Grigoriou et al.: Drivers of Brand Switching Behavior…
20
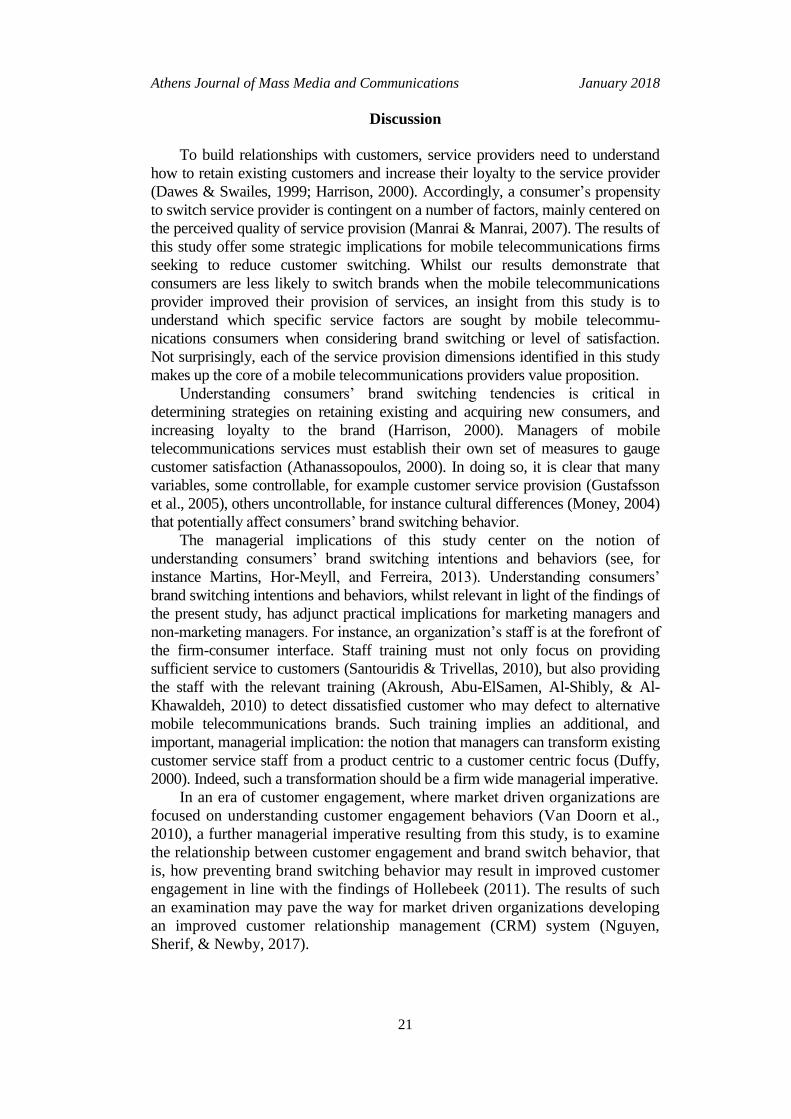
Overall Model
The model indicates relatively weak overall correlative relationships among
the variables as indicated by the R-squared values in Table 6. Three possible
reasons may explain why low R-squared values are acceptable in social science
research. First, relatively low R-squared values are common in social sciences
where human (consumer) behavior is being predicted. The relatively low values
are not uncommon in the extant marketing literature (Reisinger, 1997). This is
because human behavior is difficult to accurately predict. Second, despite the
relatively low R-square value in our model, models with low factor loadings can
still yield excellent goodness of fit (Chin, 1998). Finally, even though the purchase
of mobile phone telecommunications plans tends to be an individual consumer in
the United States, in collectivist countries such as China and India, these consumer
choice decisions are influenced by groups (e.g. family, peers, and friends). These
influential groups may also have a say as to whether the mobile
telecommunications subscriber switches brands if they are dissatisfied with a
service provider. The data analysis in this study only captures individual choice
decisions, and not non-marketing related factors that influenced the decision.
Table 6. Model Classification
Observed Predicted 0.00 1.00 Percent Correct
0.00 1963.9704 493.7884 79.9% 1.00 718.5516 1058.5636 59.6% Overall Percentage 63.3% 36.7% 71.4% R-squared (Nagelkerke) 27%
% Correct Classification 71%
At a national level, the four focal countries in this study provide useful
managerial insights. For instance, whilst pricing rate plans were shown to have an
effect on consumersʼ brand switching tendencies across all four countries, analysis
on a per country basis reveal results which have managerial implications for how
mobile telecommunications marketers design and communicate their value
proposition. The USA and China were shown to have the highest price sensitive
consumers, that is, consumers who were more likely to switch brands if they were
offered a superior pricing rate plan form a competitor. Whilst Chinese consumers
have historically demonstrated frugality in their discretionary consumption (Li,
Jiang, An, Shen, & Jin, 2009) which may explain their price sensitive nature, there
is little evidence to suggest that frugality has historical or cultural roots in USA
consumers’ behavior. A similar argument can be made for India, whose consumers
did not rank a mobile telecommunications provider’s price rate plans as a
significant reason for switching mobile telecommunications brands. Yet
historically, Indian consumers have exhibited frugal consumption tendencies
(Eckhardt & Mahi, 2012). These results are even more pertinent in developing
economies such as India and China, with a growing middle class of consumers
whose personal income and expenditures on, inter alia, luxury goods are
increasing (He, Zou, & Jin, 2010).
Athens Journal of Mass Media and Communications January 2018
21
Discussion
To build relationships with customers, service providers need to understand
how to retain existing customers and increase their loyalty to the service provider
(Dawes & Swailes, 1999; Harrison, 2000). Accordingly, a consumer’s propensity
to switch service provider is contingent on a number of factors, mainly centered on
the perceived quality of service provision (Manrai & Manrai, 2007). The results of
this study offer some strategic implications for mobile telecommunications firms
seeking to reduce customer switching. Whilst our results demonstrate that
consumers are less likely to switch brands when the mobile telecommunications
provider improved their provision of services, an insight from this study is to
understand which specific service factors are sought by mobile telecommu-
nications consumers when considering brand switching or level of satisfaction.
Not surprisingly, each of the service provision dimensions identified in this study
makes up the core of a mobile telecommunications providers value proposition.
Understanding consumers’ brand switching tendencies is critical in
determining strategies on retaining existing and acquiring new consumers, and
increasing loyalty to the brand (Harrison, 2000). Managers of mobile
telecommunications services must establish their own set of measures to gauge
customer satisfaction (Athanassopoulos, 2000). In doing so, it is clear that many
variables, some controllable, for example customer service provision (Gustafsson
et al., 2005), others uncontrollable, for instance cultural differences (Money, 2004)
that potentially affect consumers’ brand switching behavior.
The managerial implications of this study center on the notion of
understanding consumers’ brand switching intentions and behaviors (see, for
instance Martins, Hor-Meyll, and Ferreira, 2013). Understanding consumers’
brand switching intentions and behaviors, whilst relevant in light of the findings of
the present study, has adjunct practical implications for marketing managers and
non-marketing managers. For instance, an organization’s staff is at the forefront of
the firm-consumer interface. Staff training must not only focus on providing
sufficient service to customers (Santouridis & Trivellas, 2010), but also providing
the staff with the relevant training (Akroush, Abu-ElSamen, Al-Shibly, & Al-
Khawaldeh, 2010) to detect dissatisfied customer who may defect to alternative
mobile telecommunications brands. Such training implies an additional, and
important, managerial implication: the notion that managers can transform existing
customer service staff from a product centric to a customer centric focus (Duffy,
2000). Indeed, such a transformation should be a firm wide managerial imperative.
In an era of customer engagement, where market driven organizations are
focused on understanding customer engagement behaviors (Van Doorn et al.,
2010), a further managerial imperative resulting from this study, is to examine
the relationship between customer engagement and brand switch behavior, that
is, how preventing brand switching behavior may result in improved customer
engagement in line with the findings of Hollebeek (2011). The results of such
an examination may pave the way for market driven organizations developing
an improved customer relationship management (CRM) system (Nguyen,
Sherif, & Newby, 2017).
Vol. 4, No. 1 Grigoriou et al.: Drivers of Brand Switching Behavior…
22
The finding of USA consumers’ tendencies to switch mobile telecommuni-
cations brands on the basis of superior offers from competing brands has important
managerial implications for how marketers segment and targeting consumers in
the USA. The mobile telecommunications product’s value proposition and
ultimate success in the market depends on it.
Theoretical Implications
The findings of our study have theoretical implications within the
marketing and consumer behavior domain. For instance, we address the
important role of the service quality construct in affecting brand switching
behavior. Service quality provision, in turn, has been theoretically linked to
service loyalty (De Ruyter et al., 1998). Further, our study provides a theoretical
understanding of consumers’ likely re-purchase intention. Consumers’ repurchase
intentions are based on, inter alia, their level of satisfaction with their service
provider (Hellier, Geursen, Carr, & Rickard, 2003), which has been empirically
linked to brand loyalty (Lam, Ahearne, Hu, & Schillewaert, 2010), via customer
retention (Oyeniyi & Joachim, 2008).
Conclusion
Market driven organizations are constantly trying to build and maintain
brand loyalty amid strong competition. Nowhere is this more evident in the
mobile telecommunications industry. The importance of loyalty stems from its
positive consequences in relation to customer retention, repurchase, long-term
customer relationships and profitability (Reichheld and Sasser, 1990). Central
to this notion, is an understanding of what drives consumers’ brand switching
behavior, and what marketing strategies organizations can deploy to ensure
long-term customer loyalty. The current study modeled brand switching behavior
among mobile telecommunications consumers across four nations and provided
evidence of the factors that are most likely to lead to brand switching behavior.
One limitation of the current study is that it examined brand switching
behavior using six variables identified in the extant literature. Future work can
examine latent variables that may influence brand switching behavior that are not
considered in this study. By doing so, future studies can expand our understanding
of brand switching behavior among consumers of mobile telephone services and
suggest managerial decision associated with preventing such behavior.
Given the cross national nature of the current study, future scholarly work
may address cultural (or sub-cultural) factors affecting brand switching behavior.
Such a study would go beyond a nation’s level of economic development
(addressed in this study) to consider cultural dimensions that may affect brand
switching. Indeed, cultural factors could have a moderating effect on consumers’
tendencies to switch mobile telecommunications brands.
Athens Journal of Mass Media and Communications January 2018
23
Acknowledgement
This study is conducted by the Global Customer Experience team of The
Nielsen Company as part of a global R&D initiative. The authors wish to thank
Dr. Nguyen Thi Binh, Statistical Consulting and Analysis team of The Nielsen
Company, Vietnam.
References Adjei, K., & Denanyoh, R. (2014). Determinants of customer loyalty among mobile
telecom subscribers in the Brong Ahafo Region of Ghana. International Journal
of Business and Social Research, 4(1), 82-95.
Ahn, H., & Lee, M.-H. (1999). An Econometric Analysis of the Demand for Access to
Mobile Telephone Networks. Information Economics and Policy, 11(3), 297-305.
Ahn, J. H., Han, S. P., & Lee, Y. S. (2006). Customer churn analysis: Churn determinants
and mediation effects of partial defection in the Korean mobile telecommunications
service industry. Telecommunications Policy, 30(10), 552-568.
Akroush, M. N., Abu-ElSamen, A. A., Al-Shibly, M. S., & Al-Khawaldeh, F. M.
(2010). Conceptualisation and development of customer service skills scale: an
investigation of Jordanian customers. International Journal of Mobile
Communications, 8(6), 625-653.
Al-Kwifi, O. S., & Ahmed, Z. U. (2015). An intellectual journey into the historical
evolution of marketing research in brand switching behavior–past, present and
future. Journal of Management History, 21(2), 172-193.
Applbaum, K. (2000). Crossing borders: Globalization as myth and charter in American
transnational consumer marketing. American Ethnologist, 27(2), 257-282.
Athanassopoulos, A. D. (2000). Customer satisfaction cues to support market
segmentation and explain switching behavior. Journal of Business Research,
47(3), 191-207.
Bansal, H. S., & Taylor, S. F. (1999). The service provider switching model (spsm) a
model of consumer switching behavior in the services industry. Journal of
Service Research, 2(2), 200-218.
Berry, M. J., & Linoff, G. S. (2004). Data Mining Techniques for Marketing, Sales,
and Customer Relationship Management. Indianapolis, USA: John Wiley & Sons.
Burke, R. R. (2002). Technology and the customer interface: what consumers want in
the physical and virtual store. Journal of the Academy of Marketing Science, 30(4),
411-432.
Burnham, T. A., Frels, J. K., & Mahajan, V. (2003). Consumer switching costs: a
typology, antecedents, and consequences. Journal of the Academy of Marketing
Science, 31(2), 109-126.
Carraher, S. M., Carraher, S. C., & Mintu-Wimsatt, A. (2005). Customer service
management in Western and Central Europe: A concurrent validation strategy in
entrepreneurial financial information services organizations. Journal of Business
Strategies, 22(1), 41-54.
Vol. 4, No. 1 Grigoriou et al.: Drivers of Brand Switching Behavior…
24
Chae, M., Kim, J., Kim, H., & Ryu, H. (2002). Information quality for mobile internet
services: A theoretical model with empirical validation. Electronic Markets, 12(1),
38-46.
Chang, Y. H., & Chen, F. Y. (2007). Relational benefits, switching barriers and loyalty: A
study of airline customers in Taiwan. Journal of Air Transport Management, 13(2),
104-109.
Chin, W.W. (1998). Commentary: Issues and Opinion on Structural Equation Modeling.
MIS Quarterly, 22(1), 6-16.
Chuang, Y. F. (2011). Pull-and-suck effects in Taiwan mobile phone subscribers
switching intentions. Telecommunications Policy, 35(2), 128-140.
Coussement, K., Benoit, D. F., & Van den Poel, D. (2010). Improved marketing
decision making in a customer churn prediction context using generalized
additive models. Expert Systems with Applications, 37(3), 2132-2143.
Dawar, N., & Parker, P. (1994). Marketing universals: Consumersʼ use of brand name,
price, physical appearance, and retailer reputation as signals of product quality. The
Journal of Marketing, 81-95.
Dawes, J., & Swailes, S. (1999). Retention sans frontieres: issues for financial service
retailers. International Journal of Bank Marketing, 17(1), 36-43.
Dayton, C. M. (1992). Logistic Regression Analysis. Retrieved from http://84.89.132.
1/~satorra/dades/M2012LogisticRegressionDayton.pdf
De Ruyter, K., Wetzels, M., & Bloemer, J. (1998). On the relationship between
perceived service quality, service loyalty and switching costs. International Journal
of Service Industry Management, 9(5), 436-453.
Duffy, J. (2000). Measuring customer capital. Strategy & Leadership, 28(5), 10-15.
Eckhardt, G. M., & Mahi, H. (2012). Globalization, consumer tensions, and the
shaping of consumer culture in India. Journal of Macromarketing, 32(2), 280-294.
Edward, M., & Sahadev, S. (2011). Role of switching costs in the service quality,
perceived value, customer satisfaction and customer retention linkage. Asia Pacific
Journal of Marketing and Logistics, 23(3), 327-345.
Farhat, R., & Khan, B. M. (2011). Importance of brand personality to customer
loyalty: A conceptual study. New Media and Mass Communication, 1(1), 4-10.
Feinberg, R. A., Kim, I. S., Hokama, L., de Ruyter, K., & Keen, C. (2000). Operational
determinants of caller satisfaction in the call center. International Journal of
Service Industry Management, 11(2), 131-141.
Fornell, C., & Wernerfelt, B. (1988). A model for customer complaint management.
Marketing Science, 7(3), 287-298.
Gerpott, T. J., Rams, W., & Schindler, A. (2001). Customer retention, loyalty, and
satisfaction in the German mobile cellular telecommunications market.
Telecommunications Policy, 25(4), 249-269.
Gerrard, P., & Cunningham, J. B. (2004). Consumer switching behavior in the Asian
banking market. Journal of Services Marketing, 18(3), 215-223. Global Mobile Suppliers Association (2012). Retrieved from http://www.gsacom.com/.
Gremler, D. D., & Brown, S. W. (1996). Service loyalty: its nature, importance, and
implications. Advancing Service Quality: A Global Perspective. In B. Edvardsson, S.
W. Brown, R. Johnston, and E. E. Scheuing (Eds.), Proceedings in American
Marketing Association. QUIS V: Advancing Service Quality: A Global Perspective,
ISQA, New York, NY, pp. 171-181.
Gruber, H. (2001). Competition and Innovation: The Diffusion of Mobile
Telecommunications in Central and Eastern Europe. Information Economics and
Policy, 13(1), 19-34.
Athens Journal of Mass Media and Communications January 2018
25
Gupta, R., & Jain, K. (2012). Diffusion of mobile telecommunications in India: An
empirical study. Technological Forecasting and Social Change, 79(4), 709-715.
Gupta, R., & Jain, K. (2014). Adoption of mobile telecommunications in rural India:
An empirical study. Decision Sciences, 45(2), 281-307.
Gupta, R., & Jain, K. (2015). Adoption behavior of rural India for mobile
telecommunications: A multi group study. Telecommunications Policy, 39(8),
691-704.
Gustafsson, A., Johnson, M. D., & Roos, I. (2005). The effects of customer
satisfaction, relationship commitment dimensions, and triggers on customer
retention. Journal of Marketing, 69(4), 210-218.
Guzmán, F. (2012). Consumer Perception of Brand Equity Measurement: A New
Scale (Doctoral dissertation). University of North Texas, USA.
Ha, H. Y., John, J., Janda, S. and Muthaly, S. (2011). The effects of advertising
spending on brand loyalty in services. European Journal of Marketing, 45(4),
673-691.
Han, H., Back, K. J., & Kim, Y. H. (2011). A multidimensional scale of switching
barriers in the full-service restaurant industry. Cornell Hospitality Quarterly,
52(1), 54-63.
Harrison, T. (2000). Financial Services Marketing. London: Pearson Education Limited.
He, Y., Zou, D., & Jin, L. (2010). Exploiting the goldmine: a lifestyle analysis of
affluent Chinese consumers. Journal of Consumer Marketing, 27(7), 615-628.
Heide, J. B., & Weiss, A. M. (1995). Vendor consideration and switching behavior for
buyers in high-technology markets. The Journal of Marketing, 59(3), 30-43.
Hellier, P. K., Geursen, G. M., Carr, R. A., & Rickard, J. A. (2003). Customer
repurchase intention: A general structural equation model. European Journal of
Marketing, 37(11/12), 1762-1800.
Heskett, J. L. (2002). Beyond customer loyalty. Managing Service Quality: An
International Journal, 12(6), 355-357.
Hollebeek, L. D. (2011). Demystifying customer brand engagement: Exploring the
loyalty nexus. Journal of Marketing Management, 27(7-8), 785-807.
Hossain, M. M., & Suchy, N. J. (2013). Influence of customer satisfaction on loyalty:
a study on mobile telecommunication industry. Journal of Social Sciences, 9(2),
73-80.
Hwang, J., Cho, Y., & Long, N. V. (2009). Investigation of factors affecting the
diffusion of mobile telephone services: An empirical analysis for Vietnam.
Telecommunications Policy, 33(9), 534-543.
Iglesias, O., Singh, J. J., & Batista-Foguet, J. M. (2011). The role of brand experience
and affective commitment in determining brand loyalty. Journal of Brand
Management, 18(8), 570-582.
ITU. (2002). World Development Report 2002 – Reinventing Telecoms. Geneva:
International Telecommunication Union.
Jensen, S. (2006). Implementation of competitive nonlinear pricing: tariffs with
inclusive consumption. Review of Economic Design, 10(1), 9-29.
Johnson, R. B., & Onwuegbuzie, A. J. (2004). Mixed methods research: A research
paradigm whose time has come. Educational Researcher, 33(7), 14-26.
Jones, M. A., Mothersbaugh, D. L., & Beatty, S. E. (2000). Switching barriers and
repurchase intentions in services. Journal of Retailing, 76(2), 259-274.
Kamboj, S., & Rahman, Z. (2016). The influence of user participation in social media-
based brand communities on brand loyalty: age and gender as moderators. Journal of
Brand Management, 23(6), 679-700.
Vol. 4, No. 1 Grigoriou et al.: Drivers of Brand Switching Behavior…
26
Kaur, G., & Sambyal, R. (2016). Exploring Predictive Switching Factors for Mobile
Number Portability. Vikalpa, The Journal for Decision Makers , 41(1), 74-95.
Keaveney, S. M. (1995). Customer switching behavior in service industries: An
exploratory study. The Journal of Marketing, 59(2), 71-82.
Keaveney, S. M., & Parthasarathy, M. (2001). Customer switching behavior in online
services: An exploratory study of the role of selected attitudinal, behavioral, and
demographic factors. Journal of the Academy of Marketing Science, 29(4), 374-
390.
Kim, M. K., Park, M. C., & Jeong, D. H. (2004). The effects of customer satisfaction
and switching barrier on customer loyalty in Korean mobile telecommunication
services. Telecommunications Policy, 28(2), 145-159.
Kim, H. S., & Yoon, C. H. (2004). Determinants of subscriber churn and customer
loyalty in the Korean mobile telecommunications market. Telecommunications
Policy, 28(9), 751-765.
Kouser, R., Qureshi, S., Shahzad, F. A., & Hasan, H. (2012). Factors influencing the
customer’s satisfaction and switching behavior in cellular services of
Pakistan. Interdisciplinary Journal of Research in Business, 2(1), 15-25.
Lai, F., Griffin, M., & Babin, B. J. (2009). How quality, value, image, and satisfaction
create loyalty at a Chinese telecom. Journal of Business Research, 62(10), 980-986.
Lam, S. K., Ahearne, M., Hu, Y., & Schillewaert, N. (2010). Resistance to brand
switching when a radically new brand is introduced: A social identity theory
perspective. Journal of Marketing, 74(6), 128-146.
Li, D., Jiang, Y., An, S., Shen, Z., & Jin, W. (2009). The influence of money attitudes
on young Chinese consumers' compulsive buying. young consumers, 10(2), 98-109.
Lee, M., & Cunningham, L. F. (2001). A cost/benefit approach to understanding service
loyalty. Journal of Services Marketing, 15(2), 113-130.
Lee, R., & Neale, L. (2012). Interactions and consequences of inertia and switching
costs. Journal of Services Marketing, 26 (5), 365-374.
Lee, J., Lee, J., & Feick, L. (2001). The impact of switching costs on the customer
satisfaction-loyalty link: mobile phone service in France. Journal of Services
Marketing, 15(1), 35-48.
Lim, H., Widdows, R., & Park, J. (2006). M-loyalty: winning strategies for mobile
carriers. Journal of Consumer Marketing, 23(4), 208-218.
Liu, X., Wu, F. S., & Chu, W. L. (2009). Innovation diffusion: mobile telecommunications
adoption in China. International Journal of Innovation Management, 13(2), 245-271.
Madden, G., Coble-Neal, G., & Dalzell, B. (2004). A dynamic model of mobile
telecommunications subscription incorporating a network effect. Telecommunications
Policy, 28(2): 133-144.
Madden, G., Savage, S. J., & Coble-Neal, G. (1999). Subscriber churn in the
Australian ISP market. Information Economics and Policy, 11(2), 195-207.
Malhotra, A., & Kubowicz Malhotra, C. (2013). Exploring switching behavior of US
mobile service customers. Journal of Services Marketing, 27(1), 13-24.
Manrai, L. A., & Manrai, A. K. (2007). A field study of customers’ switching behavior for
bank services. Journal of Retailing and Consumer Services, 14(3), 208-215.
Marsico, K. (1996). Call centers: today's new profit centers, AT&T Technology, 10(4),
14-18.
Martins, R. C., Hor-Meyll, L. F., & Ferreira, J. B. (2013). Factors affecting mobile users'
switching intentions: A comparative study between the Brazilian and German
markets. BAR-Brazilian Administration Review, 10(3), 239-262.
Money, R. B. (2004). Promotion and switching behavior in Japanese and American
business-to-business service clients. Journal of Business Research, 57, 297-305.
Athens Journal of Mass Media and Communications January 2018
27
Ngai, E. W. T. (2005). Customer relationship management research (1992-2002): An
academic literature review and classification. Marketing Intelligence & Planning,
23(6), 582-605.
Nimako, S. G., Ntim, B. A., & Mensah, A. F. (2014). Effect of Mobile Number
Portability Adoption on Consumer Switching Intention. International Journal of
Marketing Studies, 6(2), 117-134.
Noorderhaven, N. G., & Harzing, A. W. (2003). The "country-of-origin effect" in
multinational corporations: Sources, mechanisms and moderating conditions.
Management and International Review, 47-66.
Nguyen, T. H., Sherif, J. S., & Newby, M. (2007). Strategies for successful CRM
implementation. Information Management & Computer Security, 15(2), 102-115.
Ooko, D., Nzomoi, J., & Mumo, R. (2014). Determinants of consumer switching
behavior in mobile telecommunications industry in Kenya. International Journal
of Business and Commerce, 3(5), 82-98.
Oyeniyi, O., & Joachim, A. A. (2008). Customer service in the retention of mobile
phone users in Nigeria. African Journal of Business Management, 2(2), 26-34.
Ping Jnr, R.A. (1994). Does satisfaction moderate the association between alternative
attractiveness and exit intention in a marketing channel? Journal of the Academy
of Marketing Science, 22(4), 364-371.
Ramaseshan, B., & Stein, A. (2014). Connecting the dots between brand experience
and brand loyalty: The mediating role of brand personality and brand relationships.
Journal of Brand Management, 21(7-8), 664-683.
Ranganathan, C., Seo, D., & Babad, Y. (2006). Switching behavior of mobile users:
do usersʼ relational investments and demographics matter?. European Journal of
Information Systems, 15(3), 269-276.
Reichheld, F. P., & Sasser, W. E. (1990). Zero defections: Quality Comes to Services.
Harvard Business Review, 68(5), 105-111.
Reisinger, H. (1997). The Impact of Research Designs on R2 in Linear Regression
Models: An Exploratory Meta-Analysis. Journal of Empirical Generalizations in
Marketing Science, 2, 1-12.
Rogers, E. (1995). The Diffusion of Innovations. (4th ed.). New York, NY: The Free Press.
Roto, V., Geisler, R., Kaikkonen, A., Popescu, A., & Vartiainen, E. (2006, May). Data
traffic costs and mobile browsing user experience. Proceedings of the 4th MobEA
Workshop on Empowering the Mobile Web, pp. 1-6.
Rouvinen, P. (2006). Diffusion of digital mobile telecommunications: Are developing
countries different? Telecommunications Policy, 30(1), 46-63.
Roy, P., Khandeparkar, K., & Motiani, M. (2016). A lovable personality: The effect of
brand personality on brand love. Journal of Brand Management, 23(5), 97-113.
Santouridis, I., & Trivellas, P. (2010). Investigating the impact of service quality and
customer satisfaction on customer loyalty in mobile telecommunications in
Greece. The TQM Journal, 22(3), 330-343.
Sekaran, U. (1983). Methodological and theoretical issues and advancements in cross-
cultural research. Journal of International Business Studies, 14(2), 61-73.
Seo, D., Ranganathan, C., & Babad, Y. (2008). Two-level model of customer retention
in the US mobile telecommunications service market. Telecommunications
Policy, 32(3), 182-196.
Shin, D. H., & Kim, W. Y. (2008). Forecasting customer switching intention in mobile
service: An exploratory study of predictive factors in mobile number portability.
Technological Forecasting and Social Change, 75(6), 854-874.
Vol. 4, No. 1 Grigoriou et al.: Drivers of Brand Switching Behavior…
28
Sin, L. Y., Cheung, G. W., & Lee, R. (1999). Methodology in cross-cultural consumer
research: A review and critical assessment. Journal of International Consumer
Marketing, 11(4), 75-96.
Smith, D. E., & Mitry, D. J. (2007). Cultural convergence: consumer behavioral
changes in the European wine market. Journal of Wine Research, 18(2), 107-112.
Svendsen, G. B., & Prebensen, N. K. (2013). The effect of brand on churn in the
telecommunications sector. European Journal of Marketing, 47(8), 1177-1189.
Van Doorn, J., Lemon, K. N., Mittal, V., Nass, S., Pick, D., Pirner, P., & Verhoef, P.
C. (2010). Customer engagement behavior: Theoretical foundations and research
directions. Journal of Service Research, 13(3), 253-266.
Vázquez‐Carrasco, R., & Foxall, G. R. (2006). Positive vs. negative switching barriers:
The influence of service consumers' need for variety. Journal of Consumer
Behaviour, 5(4), 367-379.
Verhoef, P. C. (2003). Understanding the effect of customer relationship management
efforts on customer retention and customer share development. Journal of Marketing,
67(4), 30-45.
Verhoef, P. C., Lemon, K. N., Parasuraman, A., Roggeveen, A., Tsiros, M., &
Schlesinger, L. A. (2009). Customer experience creation: Determinants, dynamics
and management strategies. Journal of Retailing, 85(1), 31-41.
Worthington, S., Russell-Bennett, R., & Härtel, C. (2010). A tri-dimensional approach
for auditing brand loyalty. Journal of Brand Management, 17(4), 243-253.
Yun, X. (2012). Chinese use of mobile texting for social interactions: Cultural
implications in the use of communication technology. Intercultural Communication
Studies, 21(2), 131-150.
Zeithaml, V. A., Berry, L. L., & Parasuraman, A. (1996). The behavioral consequences of
service quality. The Journal of Marketing, 60(2), 31-46.
Zheng, Y. (1994). Development and democracy: are they compatible in China? Political
Science Quarterly, 109(2), 235-259.


