Drive Tourism: Up the Wall and Around the Bend - Sustainable
118
Transcript of Drive Tourism: Up the Wall and Around the Bend - Sustainable


DRIVE TOURISM
Up the Wall and Around the Bend
Centre for Regional Tourism ResearchThe Centre for Regional Tourism Research is a partnership between theCooperative Research Centre for Sustainable Tourism and Southern CrossUniversity. It was formed in 1998 to undertake research and extension activities tohelp grow tourism industries, which would contribute to sustainable communitiesin regional Australia. The Centre has been substantially expanded throughout2001/2002, and has forged links with the Australian Regional Tourism Network.The Centre has appointed a Management Board representing the Network,Southern Cross University, and CRC Tourism. The Management Board hasdeveloped a business plan based on the mission:
To provide research output that can underpin sustainable regional tourism inAustralia.
The Centre has the vision:To be seen as the credible, authoritative, respected resource centre for research andprofessional development in regional tourism.
This book is one in a series of publications reflecting the research focus of theCentre. For further information, consult the CRC for Sustainable Tourism website (www.crctourism.com.au/bookshop).
Editorial TeamDean Carson (Southern Cross University)Iain Waller (Southern Cross University)Noel Scott (Griffith University)

DRIVE TOURISM
Up the Wall and Around the Bend
Editors
Dean CarsonIain WallerNoel Scott
AcknowledgementsThe editors would like to acknowledge the support for this book from PerryHobson, Head of School of Tourism and Hospitality Management at SouthernCross University, and Professor Chris Cooper from the University of Queensland.Brad Cox and Trish O’Connor at the CRC for Sustainable Tourism who haveworked tirelessly to get the book to print.
This book is published at http://SustainableTourism.Publisher-Site.com/a series imprint of theUniversityPress.com
First published in Australia in 2002by Common Ground Publishing Pty LtdPO Box 463Altona Vic 3018ABN 66 074 822 629
in association withCooperative Research Centre for Sustainable Tourismhttp://www.crctourism.com.au/
Copyright © CRC for Sustainable Tourism Pty Ltd 2002.
All rights reserved. Apart from fair dealing for the purposes of study,research, criticism or review as permitted under the Copyright Act, no partof this book may be reproduced by any process without written permissionfrom the publisher. Any enquiries should be directed to Brad Cox, Directorof Publications or Trish O’Connor, Publications Manager at [email protected].
National Library of Australia Cataloguing-in-Publication Data:
Drive tourism: up the wall and the bend.
Bibliography.ISBN 1 86335 512 X.
ISBN 1 86335 513 8 (PDF).
1. Tourism – Australia. 2. Automobile driving – Australia.I. Carson, Dean Bradley. II. Scott, Noel, 1958–. III.Waller, Iain.
338.479194
Dbook and ebook versions of this book produced using Common Ground’sC-2-C (Creator to Consumer) book production software, under licence atwww.C-2-Csystem.com
Typeset in Australia by Common Ground PublishingPrinted in Australia by Mercury Printeam on 80gsm White Bond.

Contents
Executive Summary xi
1. The Nature of Drive Tourism in Australia 1
Dean Carson and Iain Waller1.1 Introduction 11.2 Research on Transport and Tourism 21.3 Sources of Information 41.4 Overview of Self-drive Tourism Characteristics 51.5 Approaches to Understanding Drive Tourism 8
2. Keeping Track of the Self-drive Market 11
Mark Olsen2.1 Understanding the Drive Market 112.2 What Makes them Drive 12
2.2.1 External Influences 122.2.2 Internal Influences 12
2.3 Types of Drive Holidays 132.4 Getting Information to the Drive Market 14
2.4.1 Pre-trip Planning 142.4.2 On the Journey 15
2.5 Demographic Characteristics of the Drive Market 162.6 A Strategic Approach to Marketing Drive Tourism 16
2.6.1 Strategic Analysis of the Queensland Drive Market 172.7 The Australian Drive Market 182.8 Further Analysis and Segmentation of the Drive Market 19
2.8.1 Segmentation by Length of Trip 192.8.2 Segmentation by Lifecycle 212.8.3 Mono versus Multiple Destinations 22
2.9 Further Research 222.10 Conclusion 24
3. Drive Tourism and Special Interest Tourism 25
Ros Derrett3.1 Introduction 253.2 SIT and Self-drive Tourism 263.3 The Rainforest Way Example 293.4 Conclusion 31
4. Senior Drive Tourism in Australia 33
Bruce Prideaux4.1 Introduction 334.2 Significance of the Senior Travel Market 334.3 The Drive Market 354.4 Structure of Drive Tourism 354.5 Characteristics of Senior Drive Tourism in Australia 36
Contents
4.6 Conclusion 38
5. Regular Revisitation in Caravan Parks 41
Kathy Marles5.1 Introduction 415.2 Repeat Visitation 425.3 Place and Community Attachment 435.4 Case Study 44
5.4.1 Stage 1: Baseline Study 445.4.2 Stage 2: Survey of Caravaners and Campers 49
5.5 Conclusion 51
6. Cluster Marketing in Tasmania 53
Rowan Sproule6.1 The Self-drive Market in Tasmania 536.2 Tasmania’s Tourism 21 Strategic Plan 546.3 Rejuvenating Journeys 556.4 Tasmanian Visitor Information System (TVIS) 56
6.4.1 The Tasmanian Holiday Planner 566.4.2 Touring Route Guides 566.4.3 The Tasmanian Visitor Information Network (TVIN) 566.4.4 Road Signage 566.4.5 Regional Touring Strategies 576.4.6 Roadside Facilities and Scenic Viewpoints 60
6.5 Conclusion 61
7. The Great Green Way 63
Christian Ware and Samuel Budge7.1 Introduction 637.2 Background 637.3 Methodology 657.4 Results 667.5 Conclusion 67
8. The Problem of Bypassed Townships 69
Ian Kelly and Mike Spark8.1 Introduction 698.2 Background 708.3 The Investigation 718.4 Discussion 758.5 Adoption and Implementation of a Tourism Strategy 768.6 Establishing the Township Presence 788.7 Cautionary Considerations 80
9. Product Market Perspective of Self-drive Tourism 81
Noel Scott9.1 Introduction 819.2 History of Drive Tourism 829.3 Touring by Automobile 829.4 A Framework for Automobile Touring 85
9.4.1 Product Markets Concept 86

Contents
vii
9.5 Importance of Usage Situation 869.5.1 What Is the Product? 879.5.2 Gaps between Product-markets 879.5.3 Fuzzy Boundaries 889.5.4 Relationship to Special Interest Tourism 88
9.6 Product-market Dynamics 889.7 Management Uses of Product Markets 899.8 Implications 89
Appendix – Author Profiles 91
References 93
Editors 102

Contents
Tables
Table 1: Generic Characteristics of Transport Modes 3
Table 2: Transport Mode Selection for International Visitors to Australia 1999 6
Table 3: Percentage of Self-drive Transport Selections for InternationalVisitors to Regions 1999 7
Table 4: National Drive Market 19
Table 5: Journey Length Segmentation (Queensland Only) 20
Table 6: Comparison of the Potential Market Segments to Northern Rivers 31
Table 7: Percentage of Transport Mode Selection for All Age in 1999(Number of Overnight Trips) 37
Table 8: Percentage of Self-drive Tourists in Age Groups by Length of Trip in 1999 38
Table 9: Incidence of Regular Repeat Visitation in Caravan Parksduring the Summer Season 45
Table 10: Proportion of Regular Repeat Summer Visitors to Caravan Parks 46
Table 11: Average Proportion of Repeat Visitor Sites in Caravan Parksduring the Summer Season 47
Table 12: Trends in Repeat Visitation Pattern over the Last Five Years 47
Table 13: Positive Aspects of Repeat Visitation as Expressed by Managers 48
Table 14: Negative Aspects of Repeat Visitation as Expressed by Managers 49
Table 15: Distance to Park from Permanent Residence 49
Table 16: Central Place Function Outlets 73
Table 17: Visitor-oriented Function Outlets 74
Table 18: Total Outlets (Location Quotients) 74

Contents
ix
Figures
Figure 1: Australia’s Tourism Regions 5
Figure 2: Drive Market Research Model 17
Figure 3: Segmentation of the Queensland Drive Market 21
Figure 4: Carnarvon Gorge (Injune to Rolleston) Total Traffic versus Road Upgrade 24
Figure 5: Place Attachment and Years of Visitation 50
Figure 6: Community Attachment and Years of Visitation 51
Figure 7: Tourism 21 Tourism Development Framework 55
Figure 8: West Coast Tourism Development Framework 58
Figure 9: Hobart and South Tourism Development Framework 59
Figure 10: The Bass and Midland Highways (Tasmania) 72
Figure 11: The Dukes Highway (South Australia) and Western Highway (Victoria) 72
Figure 12: Growth of Mobility, France 83


Executive SummaryThis book provides some perspectives and case studies on self-drive tourism inregional Australia. The self-drive market is extremely important to tourism inAustralia, and has characteristics which influence how tourism product ismanaged and distributed. In particular, the book is concerned with the nature ofactivities undertaken by self-drive tourists, and their trip planning behaviour. Thisbook is intended for use by researchers, as it provides an overview of existingresearch and highlights gaps and potential new research approaches.
Tourism managers will be able to use this book as a source of case studies andto provide a better understanding of the variety of tourism markets, which useself-drive transport. The book will serve as a reference tool for tourism plannerswho wish to access drive tourists in their product development and marketingcampaigns. Contributions to the book have come from both industry andacademia. Contributors come from five States, and the topics discussed reflect thediversity of tourism in regional Australia generally, along with the diversity ofdrive tourist experiences.
This book reports on a variety of research, which can contribute to increasedunderstanding of drive tourism, and consequently assist in improving marketingand management practices.
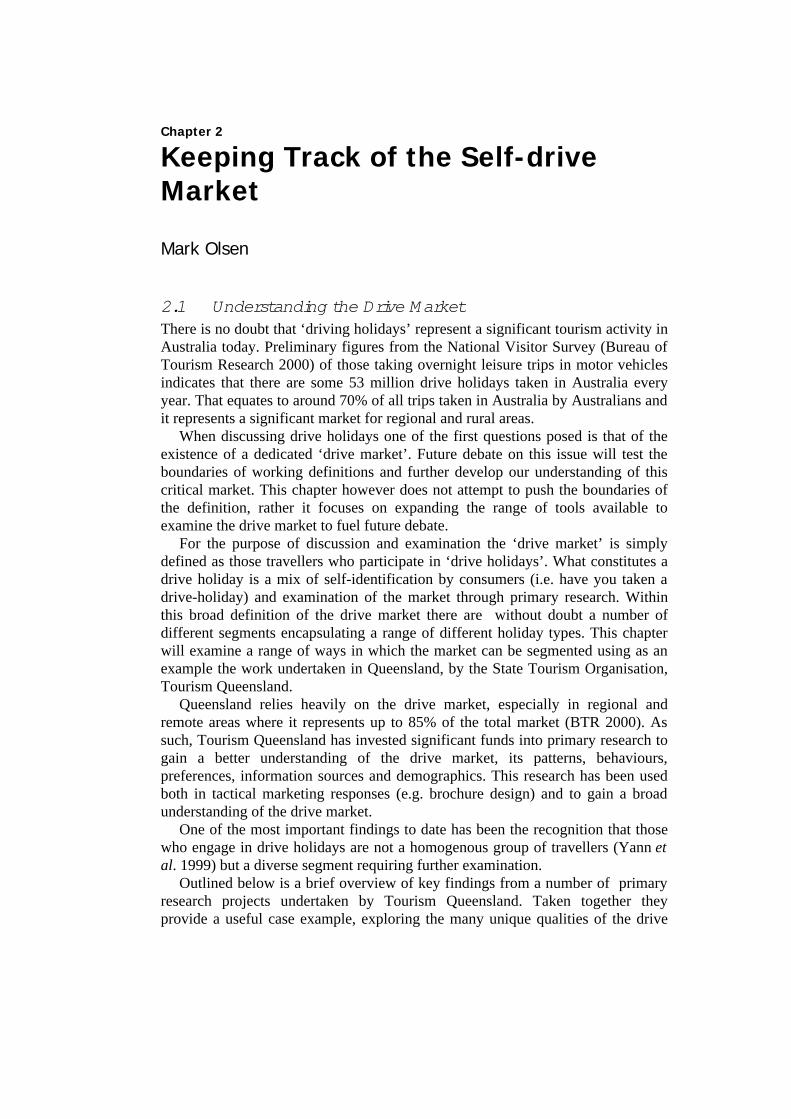
Chapter 1 (The Nature of Drive Tourism in Australia) describes the currentstate of knowledge about the self-drive market in regional destinations, andidentifies gaps in that knowledge. Chapter 2 (Keeping Track of the Drive Market)examines drive tourism in Queensland as a case study. It is based on a series ofextensive research projects conducted by Tourism Queensland. It highlights anumber of drive tourism segments as well as the information needs and holidaypreference for drive travellers. A number of research and policy implications arehighlighted.
Chapter 3 (Drive Tourism and Special Interest Tourism) considers the kinds ofactivities and interests which are engaged in by drive tourists. Drive tourism islinked to the concept of special interest tourism, where tourists have specificpurposes (usually activity based) for visiting destinations. This chapter describeshow understanding special interest characteristics of drive tourists could improvemarketing and management approaches.
Chapter 4 (Senior Drive Tourism in Australia) focuses on both thecharacteristics of the seniors drive tourism market and problems that seniorsencounter when undertaking this form of tourism travel, while Chapter 5 (RegularRevisitation in Caravan Parks) presents a case study of regular repeat visitationduring the summer holidays to caravan parks in Queensland, New South Walesand Victoria. Together, these chapters identify some of the demographic andbehavioural markets within drive tourism.
Characteristics of the spread of drive tourism can be seen in the case studiespresented in Chapters 6 (Relationships Between Sites and Routes) and 7(Cooperative Marketing of Drive Tourism) which report on research intomarketing interventions aimed at self drive tourists in Tasmania and Far NorthQueensland respectively.

Executive Summary
xii
Chapter 8 (The Problem of Bypassed Townships) also provides some casestudy research, focusing on how marketing and management approaches canfacilitate drive tourism development in towns that are no longer situated on majorroad routes.
Chapter 9 (A Product-Market Perspective of Drive Tourism Research) providesa synthesis of the concepts developed throughout the book. In particular, thecomplexity of drive tourism, and the diversity of markets who may be said toengage in drive tourism, is explored and a model for identifying markets andincreasing understanding of those markets is proposed.

Chapter 1
The Nature of Drive Tourismin Australia
Dean Carson and Iain Waller
1.1 IntroductionThere has been substantial recent discussion about the role of transport in tourismand tourism development (Burton 1994; Lamb & Davison 1996; Page 1999;Prideaux 2000). This discussion can be expected to increase in the Australiancontext in particular in the wake of the transport ‘crises’ linked to the September11 terrorist attacks in the United States, and the collapse of national and regionalair transport services culminating in the corporate failure of Ansett airlines inSeptember 2001. One of the implications of these events has been to focusattention on alternatives to air transport, and particularly on the private and ‘self-drive’ vehicle (Weekend Bulletin 2001). This book presents research into therelationship between self-drive transport and tourism development. Thequantitative significance of self-drive tourism is described, and a variety offeatures of self-drive markets are explored. The aim of the book is to identify thediversity of research issues associated with self-drive tourism, and to present somemodels, which can shed light on this diversity. The need for a book on this topic isevident from a review of the recent literature. Despite 80% of domestic touristsarriving at their destination by car, there is little discussion of drive tourism in theliterature and almost none in the Australian context.
The book addresses this gap and contains a variety of contributions fromAustralian academic and industry-based researchers. Its genesis has been from theCentre for Regional Tourism Research, a partnership between the CooperativeResearch Centre for Sustainable Tourism and Southern Cross University (Prosser2000). That a research centre focused on regional issues should be involved is notsurprising, as the research demonstrates that self-drive tourism is particularlyimportant in regional Australia, and for domestic tourism. Many of the pieces ofresearch reported in this book concentrate on these aspects of self-drive tourism,although the key issues also apply to metropolitan and urban visitor flows, andthere are forms of self-drive tourism (such as fly-drive tourism) which particularlyinvolve international visitors. The research conducted for this book is presentedwithin the following framework:
• Self-drive tourism is complex and diverse in terms of markets,locations, and impacts, and taken together is overwhelmingly the mostsubstantial component of the transport mix in Australian tourism,
• Understanding self-drive tourism is particularly important for regionaltourism destinations,

Drive Tourism: Up the Wall and Around the Bend
2
• Self-drive tourists are most usually domestic tourists, but there are keyinternational markets represented as well,
• Understanding the characteristics of self-drive tourists and the nature ofvisitor flows is central to the sustainable development of tourism inmany destinations, and for the success of many tourism products.
1.2 Research on Transport and TourismAs Prideaux (2000) noted, the tourism literature is dotted with references to thecentral role transport plays in tourism activity. Transport is seen as an enabler oftourism (Faulkner & Poole 1989); a necessary precursor to tourism activity(Leiper 1995); and as serving as part of the attractions mix in some scenarios(Hall 1998). There has been research into the economic and destination choiceimplications of long haul air transport (Chu Te 1993). Long distance bus andcoach travel has been studied in terms of market characteristics and productdevelopment (King 1988). Similar research has examined rail transport (Hensher1989). However, both Prideaux (2000) and Hall (1998) note that researchers havetended to treat the transport component of tourism lightly, and have failed toinvestigate in depth why particular transport options are chosen, how these mayinfluence the development of tourism in specific destinations, and how transportoptions may reflect market characteristics and provide opportunities for improvedtourism management.
The Federal Government in Australia has long recognised the need foradequate and efficient transportation systems to facilitate the sustainable growthof tourism throughout the country (Commonwealth Department of Tourism 1992;Commonwealth of Australia 1998). The desired benefits of a strong and dispersedtourism industry: employment; economic stimulus; improved resourcemanagement; and the protection of social and cultural resources – requiresadequate access to tourism destinations, not only for tourists, but for the materialgoods they consume (Hall & Page 1999).
Significant public sector investment is made in planning, building, andmaintaining transport infrastructure (Bull 1995). Local Government, regionaltourism organisations, and State tourism bodies invest in signage and promotionof transport options to demonstrate accessibility of particular destinations, and tomanage the flow of tourists between and within destinations. Some Governmentmay have a particular interest in using transport networks to disperse tourists andtheir economic impacts (Charlton 1998).
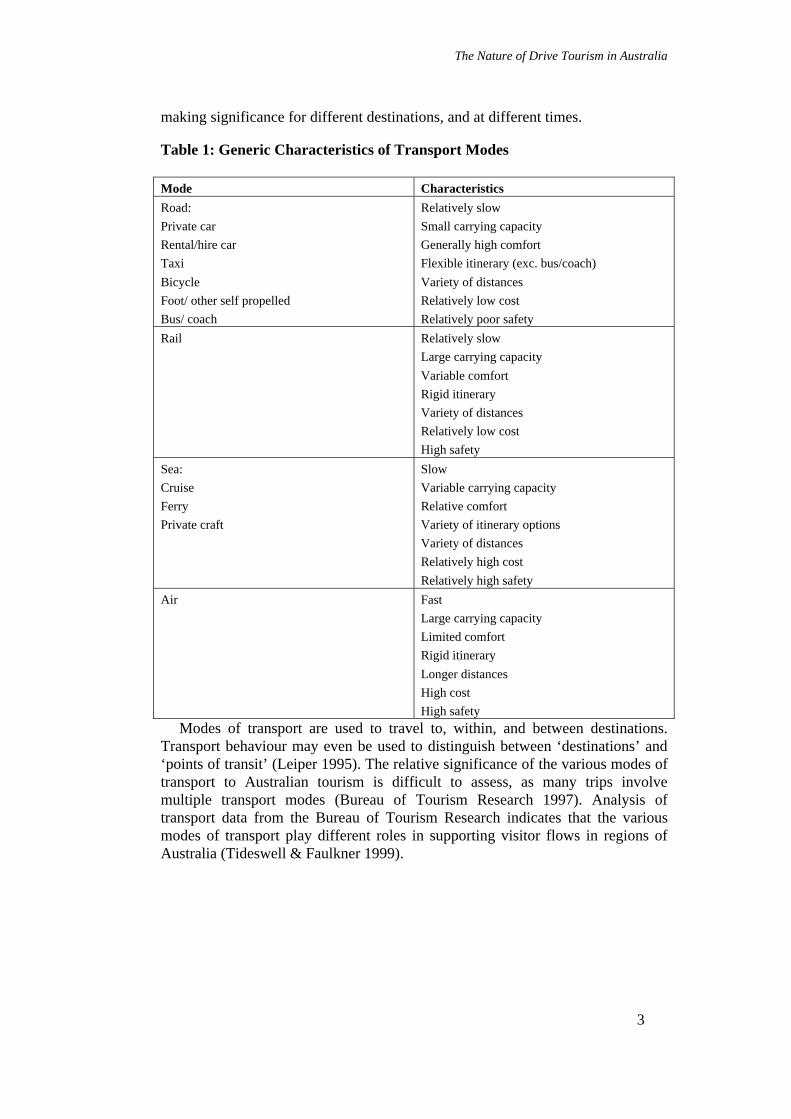
Prideaux (2000) identified the four main modes of transport as: road; rail; air;and sea. For travel to and within destinations, the choice of which mode, ormodes, of transport are used may depend on the travellers’ evaluation of speed;carrying capacity; comfort; cost; and safety. Mode selection may also be afunction of consumer characteristics and market behaviour, although surprisinglylittle research has been published on this issue. Table 1 identifies some of thegeneric characteristics, which may effect the selection of the various modes oftransport. Each characteristic may assume different values, or different decision-
The Nature of Drive Tourism in Australia
3
making significance for different destinations, and at different times.
Table 1: Generic Characteristics of Transport Modes
Mode Characteristics
Road:
Private car
Rental/hire car
Taxi
Bicycle
Foot/ other self propelled
Bus/ coach
Relatively slow
Small carrying capacity
Generally high comfort
Flexible itinerary (exc. bus/coach)
Variety of distances
Relatively low cost
Relatively poor safety
Rail Relatively slow
Large carrying capacity
Variable comfort
Rigid itinerary
Variety of distances
Relatively low cost
High safety
Sea:
Cruise
Ferry
Private craft
Slow
Variable carrying capacity
Relative comfort
Variety of itinerary options
Variety of distances
Relatively high cost
Relatively high safety
Air Fast
Large carrying capacity
Limited comfort
Rigid itinerary
Longer distances
High cost
High safety
Modes of transport are used to travel to, within, and between destinations.Transport behaviour may even be used to distinguish between ‘destinations’ and‘points of transit’ (Leiper 1995). The relative significance of the various modes oftransport to Australian tourism is difficult to assess, as many trips involvemultiple transport modes (Bureau of Tourism Research 1997). Analysis oftransport data from the Bureau of Tourism Research indicates that the variousmodes of transport play different roles in supporting visitor flows in regions ofAustralia (Tideswell & Faulkner 1999).

Drive Tourism: Up the Wall and Around the Bend
4
1.3 Sources of Inform ationThe Bureau of Tourism Research is responsible for delivering results from twodata collections: the International Visitor Survey; and the National Visitor Survey.The International Visitor Survey (IVS) includes approximately 20000 interviewswith international visitors in departure lounges in Australia’s internationalairports. The IVS was conducted by the Australian Tourism Commission from1979 (excluding 1982 and 1987) before the responsibility was assigned to theBureau of Tourism Research in 1988. The sampling methodology includes quotasbased on flight destinations, country of residence, and basic demographics. Thesurvey asks about destinations visited, characteristics of visitors, and travelbehaviour and expenditure (Hunt & Prosser 1998). It is intended to be analysed interms of country of residence of visitors, and has been criticised for its poorquality for analysis in terms of destinations (Jones 1994/1996; Hutchison 1997).
The National Visitor Survey (NVS) commenced in January 1998 and replacedthe Domestic Tourism Monitor, which had provided domestic tourism informationsince 1978. It involves household interviews with 80000 Australian residentsannually. Information is gathered on visitor characteristics, destinations (domestic,international, and day trips), and activities and expenditure. Attempts are made toensure that data can be analysed for most of Australia’s 84 tourism regions(shown in Figure 1) (Hunt & Prosser 1998).
In choosing to analyse data from the IVS and NVS, it is recognised that thesecollections have national significance, are widely available, and have widespreadrecognition. The Bureau of Tourism Research has invested considerable resourcesin maximising the quality of data from these collections, particularly at a nationallevel. However there are some limitations in using this data:
• There is a significant lag between data collection and release, with themost recent data available at the time of this research being from 1999(an eighteen month lag currently – this has been less in the past).
• The IVS contains transport related data for 1999 only, makinghistorical analysis impossible.
• The NVS began in 1998, and there are too many methodologicalinconsistencies to allow comparison with previous data from theDomestic Tourism Monitor.
• Data definitions and elements differ between the IVS and NVS, makingit impossible to conduct combined analysis.
• The bulk of transport data relates to the unit of analysis of a ‘stopover’(i.e. a location in the visit where the visitor spent at least one night),and it is difficult to retrieve transport data relating to an entire visitunless unit record data is available.
• Unit record data is prohibitively expensive, so analysis must beperformed on pre-formatted ‘data cubes’, limiting the sophistication ofanalysis.

The Nature of Drive Tourism in Australia
5
Figure 1: Australia’s Tourism Regions
Despite these limitations, the Bureau of Tourism Research data provides anoverview of visitor behaviour, and is appropriate for describing the ‘big picture’characteristics of transport use. Later chapters call on a variety of additionalnational and local data sources to detail specific elements of that picture.
1.4 Overview of Self-drive Tourism CharacteristicsIn terms of international visitors to Australia, it is clear that air is the mostcommon transport mode for entering Australia. While it is possible to travel toAustralia by sea, only a very small proportion of inbound tourists who do so. TheInternational Visitor Survey is conducted exclusively with visitors departing (andso most normally arriving in) Australia by air. However, once in Australia,international visitors use a variety of transport modes. Table 2 summarises thetransport information contained in the 1999 International Visitor Survey. The firstcolumn identifies the percentage of visitors who used each form of transport totravel from the airport of arrival into Australia to their first stopover destination(i.e. the location they spent their first night in Australia). Self-drive modes oftransport in Table 2 include: private or company car; rental car; self-drive van,motor home or campervan; and four-wheel drive vehicle. Other road transportincludes long distance coach/bus travel, but also: taxi or chauffer driven hire car;local public transport; hotel or motel shuttle/courtesy bus; and charter or tour bus.The second column identifies the percentage of visitors who used particular
Drive Tourism: Up the Wall and Around the Bend
6
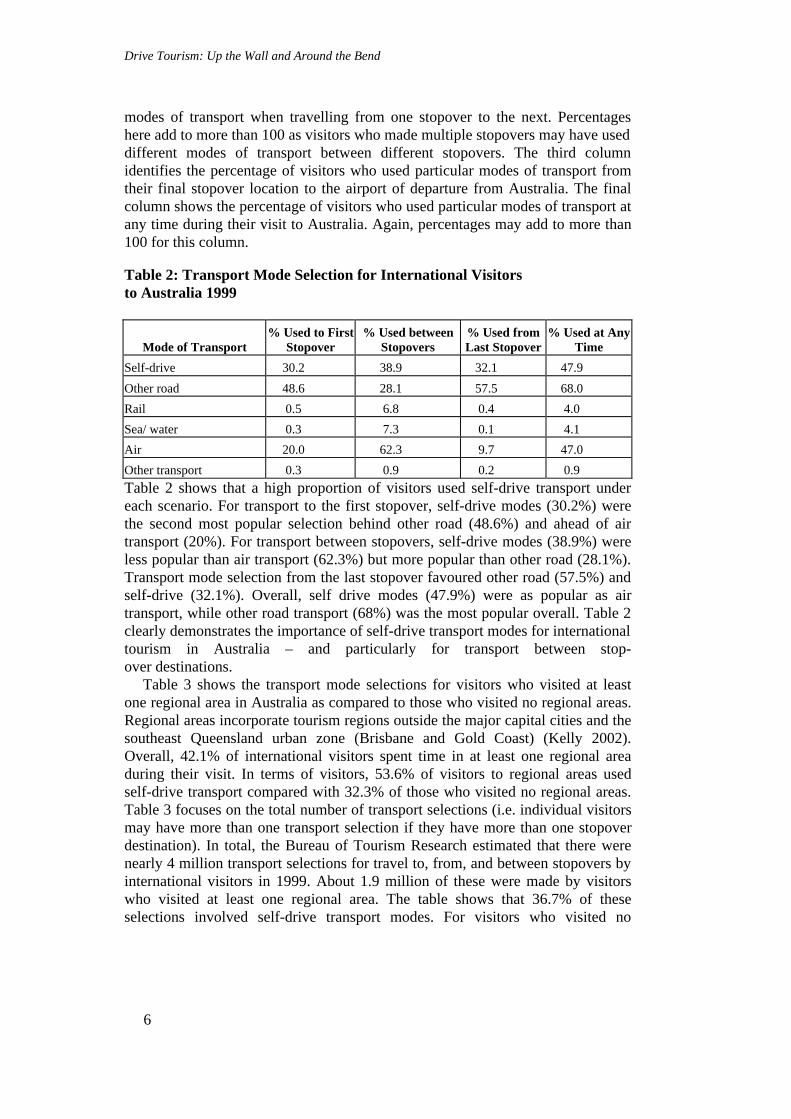
modes of transport when travelling from one stopover to the next. Percentageshere add to more than 100 as visitors who made multiple stopovers may have useddifferent modes of transport between different stopovers. The third columnidentifies the percentage of visitors who used particular modes of transport fromtheir final stopover location to the airport of departure from Australia. The finalcolumn shows the percentage of visitors who used particular modes of transport atany time during their visit to Australia. Again, percentages may add to more than100 for this column.
Table 2: Transport Mode Selection for International Visitorsto Australia 1999
Mode of Transport% Used to First
Stopover% Used between
Stopovers% Used fromLast Stopover
% Used at AnyTime
Self-drive 30.2 38.9 32.1 47.9
Other road 48.6 28.1 57.5 68.0
Rail 0.5 6.8 0.4 4.0
Sea/ water 0.3 7.3 0.1 4.1
Air 20.0 62.3 9.7 47.0
Other transport 0.3 0.9 0.2 0.9
Table 2 shows that a high proportion of visitors used self-drive transport undereach scenario. For transport to the first stopover, self-drive modes (30.2%) werethe second most popular selection behind other road (48.6%) and ahead of airtransport (20%). For transport between stopovers, self-drive modes (38.9%) wereless popular than air transport (62.3%) but more popular than other road (28.1%).Transport mode selection from the last stopover favoured other road (57.5%) andself-drive (32.1%). Overall, self drive modes (47.9%) were as popular as airtransport, while other road transport (68%) was the most popular overall. Table 2clearly demonstrates the importance of self-drive transport modes for internationaltourism in Australia – and particularly for transport between stop-over destinations.
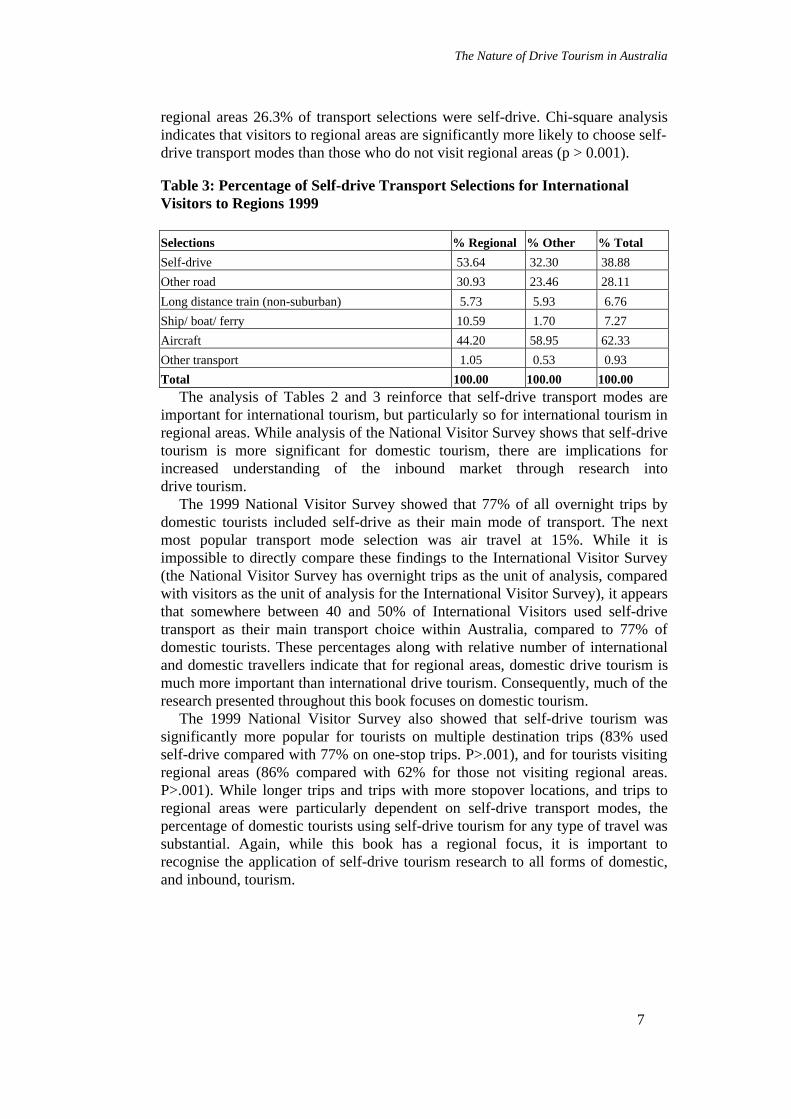
Table 3 shows the transport mode selections for visitors who visited at leastone regional area in Australia as compared to those who visited no regional areas.Regional areas incorporate tourism regions outside the major capital cities and thesoutheast Queensland urban zone (Brisbane and Gold Coast) (Kelly 2002).Overall, 42.1% of international visitors spent time in at least one regional areaduring their visit. In terms of visitors, 53.6% of visitors to regional areas usedself-drive transport compared with 32.3% of those who visited no regional areas.Table 3 focuses on the total number of transport selections (i.e. individual visitorsmay have more than one transport selection if they have more than one stopoverdestination). In total, the Bureau of Tourism Research estimated that there werenearly 4 million transport selections for travel to, from, and between stopovers byinternational visitors in 1999. About 1.9 million of these were made by visitorswho visited at least one regional area. The table shows that 36.7% of theseselections involved self-drive transport modes. For visitors who visited no
The Nature of Drive Tourism in Australia
7
regional areas 26.3% of transport selections were self-drive. Chi-square analysisindicates that visitors to regional areas are significantly more likely to choose self-drive transport modes than those who do not visit regional areas (p > 0.001).
Table 3: Percentage of Self-drive Transport Selections for InternationalVisitors to Regions 1999
Selections % Regional % Other % Total
Self-drive 53.64 32.30 38.88
Other road 30.93 23.46 28.11
Long distance train (non-suburban) 5.73 5.93 6.76
Ship/ boat/ ferry 10.59 1.70 7.27
Aircraft 44.20 58.95 62.33
Other transport 1.05 0.53 0.93
Total 100.00 100.00 100.00The analysis of Tables 2 and 3 reinforce that self-drive transport modes are
important for international tourism, but particularly so for international tourism inregional areas. While analysis of the National Visitor Survey shows that self-drivetourism is more significant for domestic tourism, there are implications forincreased understanding of the inbound market through research intodrive tourism.
The 1999 National Visitor Survey showed that 77% of all overnight trips bydomestic tourists included self-drive as their main mode of transport. The nextmost popular transport mode selection was air travel at 15%. While it isimpossible to directly compare these findings to the International Visitor Survey(the National Visitor Survey has overnight trips as the unit of analysis, comparedwith visitors as the unit of analysis for the International Visitor Survey), it appearsthat somewhere between 40 and 50% of International Visitors used self-drivetransport as their main transport choice within Australia, compared to 77% ofdomestic tourists. These percentages along with relative number of internationaland domestic travellers indicate that for regional areas, domestic drive tourism ismuch more important than international drive tourism. Consequently, much of theresearch presented throughout this book focuses on domestic tourism.
The 1999 National Visitor Survey also showed that self-drive tourism wassignificantly more popular for tourists on multiple destination trips (83% usedself-drive compared with 77% on one-stop trips. P>.001), and for tourists visitingregional areas (86% compared with 62% for those not visiting regional areas.P>.001). While longer trips and trips with more stopover locations, and trips toregional areas were particularly dependent on self-drive transport modes, thepercentage of domestic tourists using self-drive tourism for any type of travel wassubstantial. Again, while this book has a regional focus, it is important torecognise the application of self-drive tourism research to all forms of domestic,and inbound, tourism.
Drive Tourism: Up the Wall and Around the Bend
8
1.5 Approaches to Understanding Drive TourismTable 1 considered some generic observations on the nature of differenttransportation modes. Self-drive tourism has advantages for tourists in terms of:greater control over speed of travel (although slower speed than air and some railtravel); greater control over itinerary; often greater comfort and lower cost. At thesame time, however, self-drive tourism generally has lower carrying capacity(people) than other forms of transport, although it may involve higher freightcapacity in practical terms than many other forms of transport. Self-drive tourismis also associated with relatively low safety, as reflected in Australia’s roadaccident statistics, and the tendency for road accidents and road deaths to peak atkey holiday periods (Woodley 2002).
From a tourism industry perspective, self-drive transport modes allow forgreater dispersal of tourism flows, and may be used to bring tourists andassociated economic outcomes to locations away from the major transport routes(especially air transport). Self-drive tourism may first be required to bring asuitable flow of tourists to a location to offer opportunities for other transportmodes to provide access to that location (Roberts and Hall 2001). Self-drivetourism may also have implications for the environmental sustainability oftourism (Roberts and Hall 2001). On the one hand, the relatively small numbers ofpeople who can be brought to a region in a single self-drive vehicle may improvethe capacity to manage visitor numbers to closed locations such as some nationalparks. On the other hand, the unpredictability of self-drive itineraries, and theenvironmental cost of small vehicle transport pose threats to sensitiveenvironments. Self-drive tourism can also contribute to traffic congestion,pressure on public amenities (not only roads, but waste disposal, water use, andhealth and medical services). Unless a greater understanding of the nature of self-drive tourism: the markets; destination choices; travel itineraries; and resource usecharacteristics is developed, it will be impossible to manage both positive andnegative impacts.
This book reports on a variety of research, which can contribute to increasedunderstanding of drive tourism, and consequently assist in improving marketingand management practices.
Chapter 2 (Keeping Track of the Drive Market) examines drive tourism inQueensland as a case study. It is based on a series of extensive research projectsconducted by Tourism Queensland. It highlights a number of drive tourismsegments as well as the information needs and holiday preference for drivetravellers. A number of research and policy implications are highlighted.
Chapter 3 (Drive Tourism and Special Interest Tourism) considers the kinds ofactivities and interests which are engaged in by drive tourists. Drive tourism islinked to the concept of special interest tourism, where tourists have specificpurposes (usually activity based) for visiting destinations. This chapter describeshow understanding special interest characteristics of drive tourists could improvemarketing and management approaches.
Chapter 4 (Senior Drive Tourism in Australia) focuses on both thecharacteristics of the seniors drive tourism market and problems that seniors

The Nature of Drive Tourism in Australia
9
encounter when undertaking this form of tourism travel, while Chapter 5 (RegularRevisitation in Caravan Parks) presents a case study of regular repeat visitationduring the summer holidays to caravan parks in Queensland, New South Walesand Victoria. Together, these chapters identify some of the demographic andbehavioural markets within drive tourism.
Characteristics of the spread of drive tourism can be seen in the case studiespresented in Chapters 6 (Relationships Between Sites and Routes) and 7(Cooperative Marketing of Drive Tourism) which report on research intomarketing interventions aimed at self drive tourists in Tasmania and Far NorthQueensland respectively.
Chapter 8 (The Problem of Bypassed Townships) also provides some casestudy research, focusing on how marketing and management approaches canfacilitate drive tourism development in towns that are no longer situated on majorroad routes.
Chapter 9 (A Product-Market Perspective of Drive Tourism Research) providesa synthesis of the concepts developed throughout the book. In particular, thecomplexity of drive tourism, and the diversity of markets who may be said toengage in drive tourism, is explored and a model for identifying markets andincreasing understanding of those markets is proposed.

Chapter 2
Keeping Track of the Self-driveMarket
Mark Olsen
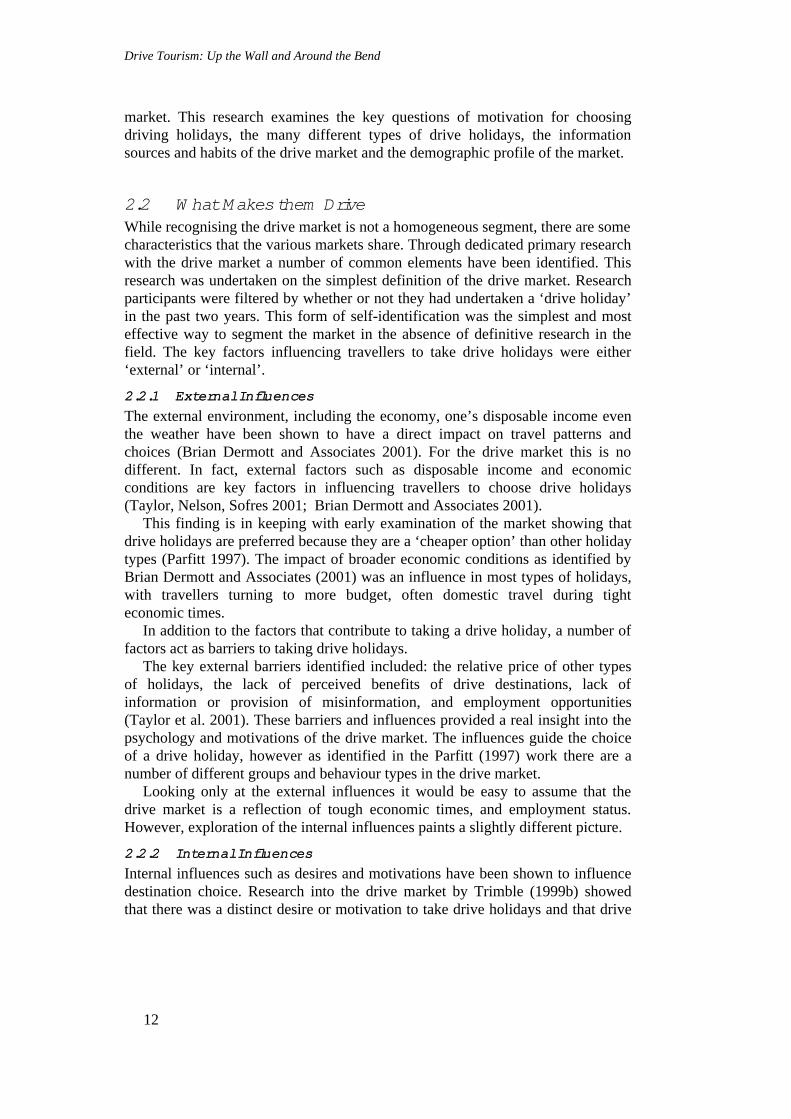
2.1 Understanding the Drive MarketThere is no doubt that ‘driving holidays’ represent a significant tourism activity inAustralia today. Preliminary figures from the National Visitor Survey (Bureau ofTourism Research 2000) of those taking overnight leisure trips in motor vehiclesindicates that there are some 53 million drive holidays taken in Australia everyyear. That equates to around 70% of all trips taken in Australia by Australians andit represents a significant market for regional and rural areas.
When discussing drive holidays one of the first questions posed is that of theexistence of a dedicated ‘drive market’. Future debate on this issue will test theboundaries of working definitions and further develop our understanding of thiscritical market. This chapter however does not attempt to push the boundaries ofthe definition, rather it focuses on expanding the range of tools available toexamine the drive market to fuel future debate.
For the purpose of discussion and examination the ‘drive market’ is simplydefined as those travellers who participate in ‘drive holidays’. What constitutes adrive holiday is a mix of self-identification by consumers (i.e. have you taken adrive-holiday) and examination of the market through primary research. Withinthis broad definition of the drive market there are without doubt a number ofdifferent segments encapsulating a range of different holiday types. This chapterwill examine a range of ways in which the market can be segmented using as anexample the work undertaken in Queensland, by the State Tourism Organisation,Tourism Queensland.
Queensland relies heavily on the drive market, especially in regional andremote areas where it represents up to 85% of the total market (BTR 2000). Assuch, Tourism Queensland has invested significant funds into primary research togain a better understanding of the drive market, its patterns, behaviours,preferences, information sources and demographics. This research has been usedboth in tactical marketing responses (e.g. brochure design) and to gain a broadunderstanding of the drive market.
One of the most important findings to date has been the recognition that thosewho engage in drive holidays are not a homogenous group of travellers (Yann etal. 1999) but a diverse segment requiring further examination.
Outlined below is a brief overview of key findings from a number of primaryresearch projects undertaken by Tourism Queensland. Taken together theyprovide a useful case example, exploring the many unique qualities of the drive
Drive Tourism: Up the Wall and Around the Bend
12
market. This research examines the key questions of motivation for choosingdriving holidays, the many different types of drive holidays, the informationsources and habits of the drive market and the demographic profile of the market.
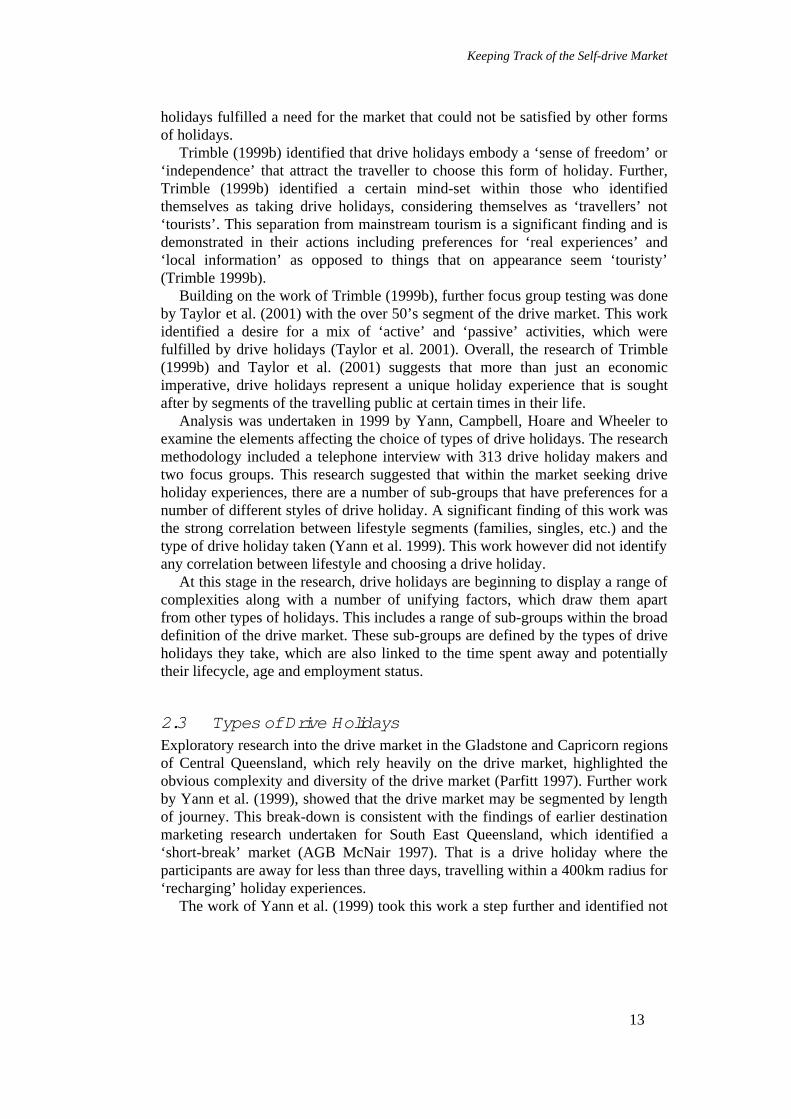
2.2 W hat Makes them DriveWhile recognising the drive market is not a homogeneous segment, there are somecharacteristics that the various markets share. Through dedicated primary researchwith the drive market a number of common elements have been identified. Thisresearch was undertaken on the simplest definition of the drive market. Researchparticipants were filtered by whether or not they had undertaken a ‘drive holiday’in the past two years. This form of self-identification was the simplest and mosteffective way to segment the market in the absence of definitive research in thefield. The key factors influencing travellers to take drive holidays were either‘external’ or ‘internal’.
2.2.1 External Influences
The external environment, including the economy, one’s disposable income eventhe weather have been shown to have a direct impact on travel patterns andchoices (Brian Dermott and Associates 2001). For the drive market this is nodifferent. In fact, external factors such as disposable income and economicconditions are key factors in influencing travellers to choose drive holidays(Taylor, Nelson, Sofres 2001; Brian Dermott and Associates 2001).
This finding is in keeping with early examination of the market showing thatdrive holidays are preferred because they are a ‘cheaper option’ than other holidaytypes (Parfitt 1997). The impact of broader economic conditions as identified byBrian Dermott and Associates (2001) was an influence in most types of holidays,with travellers turning to more budget, often domestic travel during tighteconomic times.
In addition to the factors that contribute to taking a drive holiday, a number offactors act as barriers to taking drive holidays.
The key external barriers identified included: the relative price of other typesof holidays, the lack of perceived benefits of drive destinations, lack ofinformation or provision of misinformation, and employment opportunities(Taylor et al. 2001). These barriers and influences provided a real insight into thepsychology and motivations of the drive market. The influences guide the choiceof a drive holiday, however as identified in the Parfitt (1997) work there are anumber of different groups and behaviour types in the drive market.
Looking only at the external influences it would be easy to assume that thedrive market is a reflection of tough economic times, and employment status.However, exploration of the internal influences paints a slightly different picture.
2.2.2 Internal Influences
Internal influences such as desires and motivations have been shown to influencedestination choice. Research into the drive market by Trimble (1999b) showedthat there was a distinct desire or motivation to take drive holidays and that drive
Keeping Track of the Self-drive Market
13
holidays fulfilled a need for the market that could not be satisfied by other formsof holidays.
Trimble (1999b) identified that drive holidays embody a ‘sense of freedom’ or‘independence’ that attract the traveller to choose this form of holiday. Further,Trimble (1999b) identified a certain mind-set within those who identifiedthemselves as taking drive holidays, considering themselves as ‘travellers’ not‘tourists’. This separation from mainstream tourism is a significant finding and isdemonstrated in their actions including preferences for ‘real experiences’ and‘local information’ as opposed to things that on appearance seem ‘touristy’(Trimble 1999b).
Building on the work of Trimble (1999b), further focus group testing was doneby Taylor et al. (2001) with the over 50’s segment of the drive market. This workidentified a desire for a mix of ‘active’ and ‘passive’ activities, which werefulfilled by drive holidays (Taylor et al. 2001). Overall, the research of Trimble(1999b) and Taylor et al. (2001) suggests that more than just an economicimperative, drive holidays represent a unique holiday experience that is soughtafter by segments of the travelling public at certain times in their life.
Analysis was undertaken in 1999 by Yann, Campbell, Hoare and Wheeler toexamine the elements affecting the choice of types of drive holidays. The researchmethodology included a telephone interview with 313 drive holiday makers andtwo focus groups. This research suggested that within the market seeking driveholiday experiences, there are a number of sub-groups that have preferences for anumber of different styles of drive holiday. A significant finding of this work wasthe strong correlation between lifestyle segments (families, singles, etc.) and thetype of drive holiday taken (Yann et al. 1999). This work however did not identifyany correlation between lifestyle and choosing a drive holiday.
At this stage in the research, drive holidays are beginning to display a range ofcomplexities along with a number of unifying factors, which draw them apartfrom other types of holidays. This includes a range of sub-groups within the broaddefinition of the drive market. These sub-groups are defined by the types of driveholidays they take, which are also linked to the time spent away and potentiallytheir lifecycle, age and employment status.
2.3 Types of Drive HolidaysExploratory research into the drive market in the Gladstone and Capricorn regionsof Central Queensland, which rely heavily on the drive market, highlighted theobvious complexity and diversity of the drive market (Parfitt 1997). Further workby Yann et al. (1999), showed that the drive market may be segmented by lengthof journey. This break-down is consistent with the findings of earlier destinationmarketing research undertaken for South East Queensland, which identified a‘short-break’ market (AGB McNair 1997). That is a drive holiday where theparticipants are away for less than three days, travelling within a 400km radius for‘recharging’ holiday experiences.
The work of Yann et al. (1999) took this work a step further and identified not
Drive Tourism: Up the Wall and Around the Bend
14
only a short break market but examined potential differences within the remaining‘long-haul’ drive holiday. The work of Yann et al. (1999) identified three triptypes in the drive market, touring (multiple destinations), A to B travel (withstops), and A to B travel without stops. This finding creates four separate driveholiday types based on length of trip, whether it was a multiple or monodestination holiday and the distance travelled. Even for the most experiencedtourism researcher this is a complex mix of interactions.
Adding to the complexity, the work of Yann, Campbell, Hoare and Wheeler,also identified a link between lifecycle and type of drive holiday taken. That is,those with young families were more likely to travel A to B with stops, olderretired couples were more likely to take extended drive holidays and youngerworking couples more likely to take short breaks or short tours (Yann et al. 1999).
2.4 Getting Inform ation to the Drive MarketA defining element of the drive market, reinforcing its unique qualities, is thelevel of reliance on certain information sources, and the level of planning prior totravel compared to other holiday travellers (Trimble 1999a; Yann et al. 1999;Taylor et al. 2001; Parfitt 1997).
The work of Yann, Campbell, Hoare and Wheeler showed that within the drivemarket there are further differences in terms of the type and level of informationsought. Focus groups and survey research with drive market consumers indicatedthat the drive market have two distinct phases of information collection, pre-tripplanning and information gained on the journey (Yann et al. 1999; Parfitt 1997).
2.4.1 Pre-trip Planning
While extensive planning of the main route is a key part of drive holidays, someaspects of a trip including which towns to visit, where to stay and what activitiesthey undertake are primarily made ‘on the road’ (Yann et al. 1999). This planningbehaviour is consistent with the desires of those on drive holidays for a sense offreedom and the flexibility sought from a drive holiday. Further, the amount ofplanning has been shown to be directly linked to the length of trip for the majorityof those on driving holidays (Market and Communications Research: MCR 2002).That is, the longer the trip the more planning is done. While there will always beexceptions to the rule it is quite logical to expect that those taking longer journeys,travelling further from home will do more planning. The focus groups run byTaylor et al. (2001) showed that the over 50’s drive market consider pre-tripplanning one of the most enjoyable parts of a drive holiday.
Before departing home the drive market relies mostly on one or more of:Automobile clubs, State Tourism Organisations, word of mouth, and the Internetas sources information (Trimble 1999a; Yann et al. 1999; Taylor et al. 2001;Parfitt 1997). An estimated 65% of self drive travellers went to their motoringorganisation and looked at maps as the first points of reference (Yann et al. 1999).Following this, information was usually gathered from the State TourismOrganisations in the form of brochures and travel guides.
Word of mouth has a strong influence on consumer decision making and was

Keeping Track of the Self-drive Market
15
found to act as a filter to brochures, guides and maps (Yann et al. 1999). Again,the information sources used differ depending on what sort of information isdesired, for attractions and places to visit, the State Tourism Organisation, wordof mouth, motoring organisations and travel guides are the main sources ofinformation in that order (Yann et al. 1999). Whereas for route information themotoring organisations are the principal contact followed by maps, then the StateTourism Organisation.
Pre-trip planning is undoubtedly an important part of the drive holidayexperience but it has also been revealed to be an avenue for improvedperformance in the drive market. The work of Yann et al. (1999) showed thatgood pre-trip planning information along with adequate road signage can lead tovisiting more attractions, better time management and higher satisfaction with theoverall journey. This is an important point for State and Regional TourismOrganisations attempting to get the most from the drive market.
In the melee of information sources, brochures, guides, maps, logos and imagesthat the drive market are bombarded with they often seek a ‘one-stop shop’ (MCR2002). One method applied in a number of areas to address the competingdemands of different areas or regions is the use of tourism themed routes. Thesecorridors pull a range of experiences under a single product banner that is directlylinked to the activities of the drive market. Working examples include the MatildaHighway (QLD), Explorers Highway (NT/SA) and the Great Ocean Road (VIC)to name a few. While the research has shown that the drive market respond well totourism themed routes (Yann et al. 1999; MCR 2002) what is not known at thisstage is how many themed routes the market can bear.
2.4.2 On the Journey
On the road, sources of information are much different to those used beforeleaving home. The majority of research discussed here tends to indicate that this iswhere Visitor Information Centres (VICs) play a key role (Taylor 1999). Theresearch by Taylor (1999) indicated that the drive market is looking to meet alocal and find out the ‘real’ (not touristy) information. Also, the VIC is seen as aplace to find out about some of the regions ‘secrets’. The research shows thateffective VICs have the ability to improve the experience and to a small degreeincrease length of stay in a region (Taylor 1999). This is an important finding forthose involved in regional tourism. The VICs can therefore be seen as the first lineof attack in delivering the best experience on the ground and represent a realopportunity to secure a competitive advantage in the drive market.
Consistent with the findings on pre-trip planning, certain places are seen toprovide better information for certain activities. For example the VICs are seen asthe best place for information on attractions and activities (Taylor 1999). Whenlooking for direction, the visitor places a higher level of trust in motoringauthority maps, Main Roads signage and the Visitor Information Centre staff thantourist brochures (Yann et al. 1999).
The desire for ‘freedom’ inherent in the drive holiday means that little morethan the first and last nights accommodation is booked and only around 40%actually travel the route they had originally planned (Yann et al. 1999). It is

Drive Tourism: Up the Wall and Around the Bend
16
information collected on the route from places like visitor information centres thatcan change drivers’ plans (Taylor 1999).
2.5 Dem ographic Characteristics of the Drive MarketWhile no specific research has been undertaken to test the correlation betweendemographics and an affinity with drive holidays, the research is clear thatlifecycle (most often linked to age) does contributed to the preference for differenttypes of drive holidays (Yann et al. 1999). Looking at the major data sets and theprimary research there are some trends in demographics, especially age, lifecycleand work status that are common in the drive market.
In the Queensland example, the drive market is primarily over 45 years (CMResearch 1999), travelling as a couple (from analysis of the QVS, QTTC 1990),and evenly split between male and female participants (Yann et al. 1999). Thisoverall picture, however, does not show the diversity or complexity of thesegments of the drive market. This ‘big picture’ view is valuable for an initialassessment and guide but further segmentation is required to effectively target thedrive market.
The research currently available highlights that the drive market demonstratesa range of unique qualities, which may separate it from other forms of tourism.Those participating in drive holidays have their own channels of communication,including a heavy reliance on word of mouth, they demonstrate a clear motivationfor this type of holiday experience and it potentially appeals to a certaindemographic or a number of demographic groups. This information howevercould be in danger of existing in a research vacuum without the guidance ofcomparison over time or comparison with other groups of travellers. This is wherea strategic context is required.
2.6 A Strategic Approach to Marketing Drive TourismThe primary research outlined in the earlier section of this chapter has provided amuch clearer understanding of the motivations, information collection habits anddemography of the drive market. Detailed analysis of the primary researchpresents an opportunity to respond tactically in marketing and development to theneeds of the drive market. The value of this activity in the broader scheme oftourism marketing and development and the effectiveness of such activity is notimmediately clear from one-off primary research. What appears to be missing isthe ‘big picture’ view of market trends and a clear understanding of whatconstitutes the drive market so it can be compared with other segments.
To gain a big picture or ‘strategic’ view of a market typically involves time-series analysis across a range of sectors. While there is not dedicated data set forthe drive market, the existing data sets of the National Visitor Survey (NVS),International Visitor Survey (IVS) and the Holiday Tracking Study (HTS)discussed in chapter one do provide an excellent State and regional picture of thedrive market. Most tourism practitioners are aware of the limitations of the major
Keeping Track of the Self-drive Market
17
data sets and examination of the drive market is no exception.In the Queensland example, these data sets have been used to great effect,
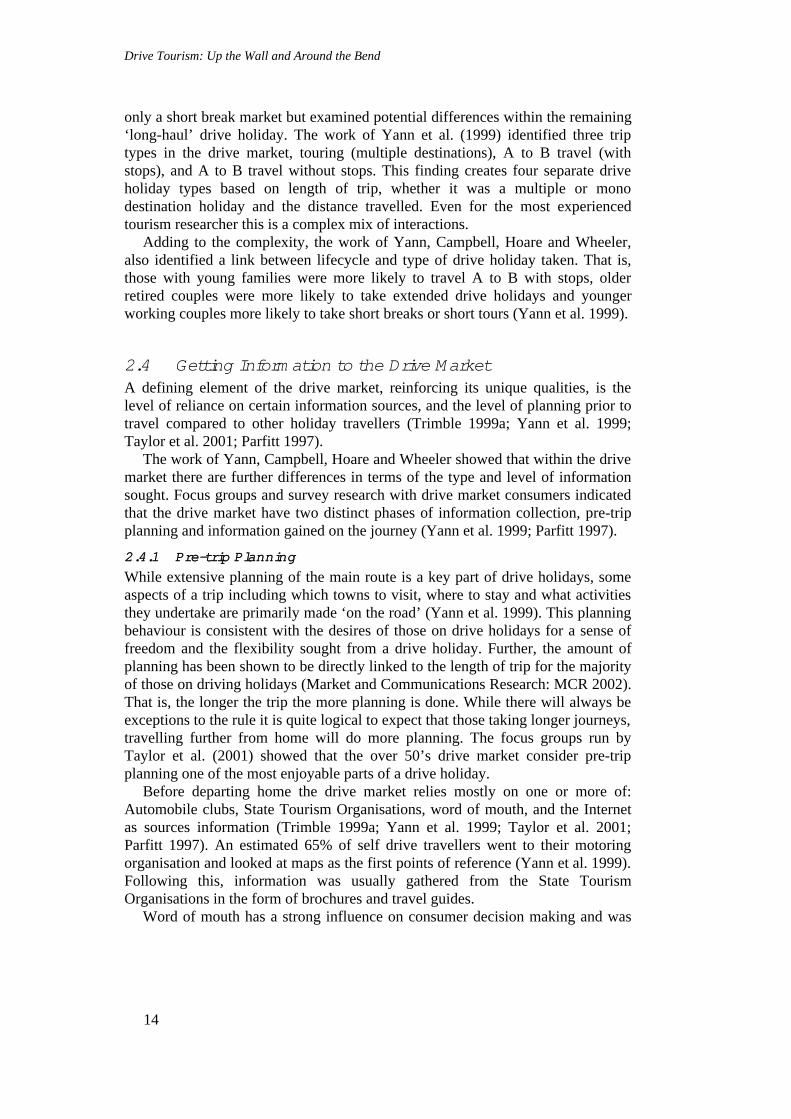
within the broader research context. That is: the information is never examined inisolation, it is always drawn from and compared back to the primary drive marketresearch. Figure 2 outlines the research framework applied in Queensland as amodel for drive market evaluation incorporating both dedicated and ongoing datasources.
Figure 2: Drive Market Research Model
The ‘tactical research’ approach outlined in Figure 2 is highly effective indeveloping tactical responses to opportunities/challenges identified. The questionis how were these opportunities/challenges identified and how important is areaction in a time when resource allocation is strictly monitored and maximumefficiency is the order of the day.
2.6.1 Strategic Analysis of the Queensland Drive M arket
The basic premise of ‘strategic analysis’ as described in this chapter is to utilisereadily available longitudinal data to identify big picture trends. The informationdrawn from existing data sets can complement the information collected throughdedicated drive research to assist in further segmenting the market, monitoringtrends, identifying big picture opportunities and measuring the effectiveness ofactivities in shifting market share. In essence the strategic research assists inidentifying ‘what to do’ and the dedicated research highlights ‘how best to do it’.
To begin drawing information from the current data sets a standard definitionfor the ‘drive market’ needed to be developed. This definition had be a balancebetween concerns of academic rigour and the limitations of the existing data sets.From the research and the markets self-identification with drive holidays, the keyelements of the definitions includes:
• the main form of transport used is the motor vehicle (either privately
Drive Tourism: Up the Wall and Around the Bend
18
owned, borrowed, or rented);• the main reason for travel is either holiday or visiting friends or
relatives (VFR) excluding business and education travel; and• day-trips are excluded due to the frequency of travel impacting on the
usefulness of the data.Thus the working definition of the drive market adopted by Tourism
Queensland are those:travelling away from home for at least one night, on holidays or visiting friendsand relatives, in their own, a rented or borrowed vehicle, as the primary mode oftransport.
This definition provides an opportunity to further segment and examine thedrive market drawing on the dedicated drive research. However, simplydeveloping a definition yielded immediate results in the ability to clearly definewhat was and what wasn’t the drive market, how it compared to other markets andhow it had changed over time. The following is an overview of the data drawnfrom the key data sets using the above definition.
2.7 The Australian Drive MarketWhether looking at intrastate or interstate travel the motor vehicle is still thepredominate means of transport for non-commercial trips. Both the HolidayTracking Survey (HTS) and the National Visitor Survey (NVS) indicate thataround 70% of all trips taken in Australia are taken by car, 4WD, caravan,campervan and motorbike.
In total, around 53 million drive holidays are taken in Australia every year. Ofthose around 17 million are away for at least 4 nights (32%) the rest are on short-breaks (1–3 nights). Of those staying over 4 nights 90% are by Australians and10% international. Around 22% of all international visitors to the country engagein drive holidays (IVS 1999). In Queensland this figure is around 20%. Within anumber of key markets that figure is much higher. For example of the 330,000‘United Kingdom’ and ‘other Europe’ visitors that come to Queensland almost50% drive. These figures provide the first opportunity to put the drive market intoperspective at a national level. In comparison the domestic travel market that flyto their destinations represent only 7 million per annum (NVS 2000).
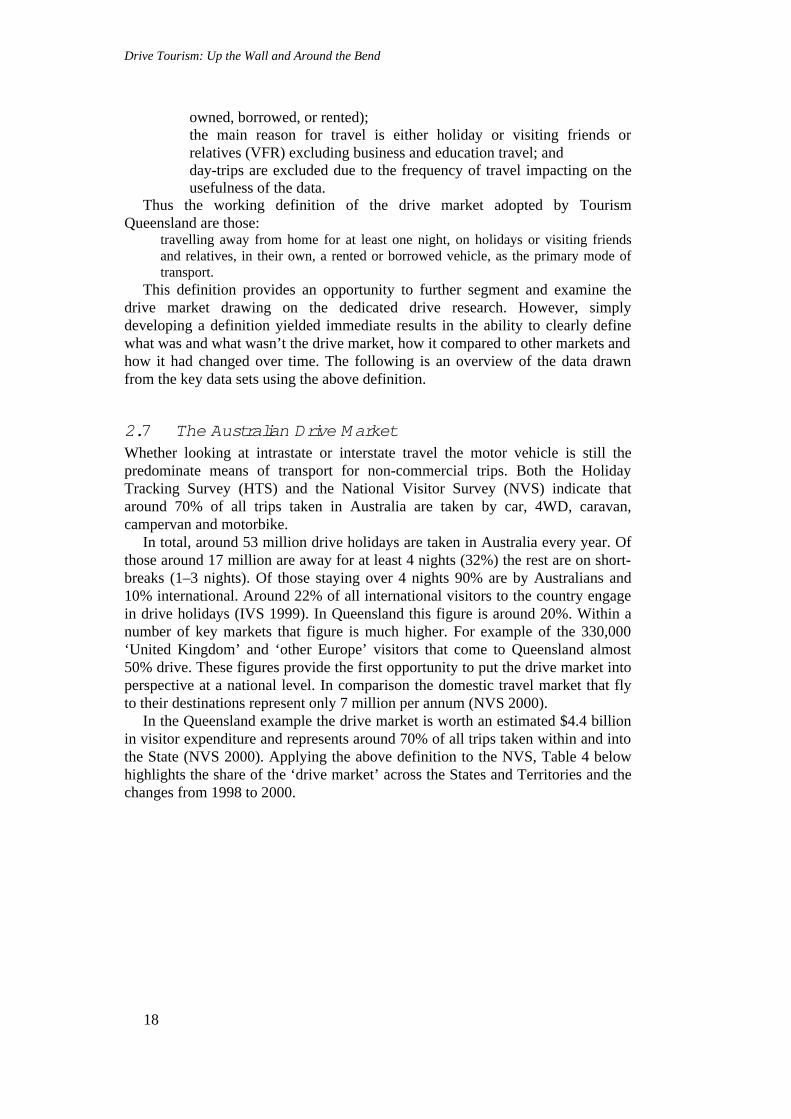
In the Queensland example the drive market is worth an estimated $4.4 billionin visitor expenditure and represents around 70% of all trips taken within and intothe State (NVS 2000). Applying the above definition to the NVS, Table 4 belowhighlights the share of the ‘drive market’ across the States and Territories and thechanges from 1998 to 2000.
Keeping Track of the Self-drive Market
19
Table 4: National Drive Market
State Total* (000’s) Share (%) 98–00(000’s)
Growth
(%)
Share shift (%)
QLD 10,704 20.0 1551 14.5 1.9
NSW 18,398 34.4 362 2.0 –1.3
VIC 13,154 24.6 12 0.1 0.5
SA 3,991 7.5 508 12.7 0.2
WA 4,447 8.3 549 12.3 0.6
NT 386 0.7 41 10.6 0.0
TAS 1,277 2.4 –71 –5.6 –0.3
ACT 1,177 2.2 105 8.9 0.1
TOTAL 53,538 100% 2,968 5.5%
This simple analysis provides the ability for States/Territories to begin trackingprogress in the drive market on a national level. As identified in the earlierresearch (Parfitt 1997) we know, the drive market is not a homogenous market, itis made up of a range of market segments and travel patterns which need to beunderstood to be effective in working with the drive market.
2.8 Further Analysis and Segm entation of the Drive MarketDrawing on the dedicated drive research it is possible to identify a number of keyelements that define segments of the drive market. An initial sieve of the researchhighlighted three directly measurable elements that distinguished the drive marketthat were also readily identifiable from the existing data sets, they included:
• length of trip;• lifestyle segment; and• multiple or mono-destination travel.
Each of these is explored in more detail in the following section including asummary of some of the outputs generated from the major data sources.
2.8.1 Segm entation by Length of Trip
Length of trip was identified through the focus groups as impacting on tripplanning approaches (Yann et al. 1999). Further examination of this form ofsegmentation was provided through the Productive Marketing Approach (BrianDermott and Associates 2001) work. The Productive Marketing Approach usedcluster-based analysis to identify segments in the Holiday Tracking Survey andthe National Visitor Survey. While this work was not specific to the drive market,it sought to identify segments across the broad tourism market.
The cluster analysis identified three discrete drive market segments (each withdrive as the dominate form of transport) entitled ‘Short Breaks’, ‘Big Tour’ and‘Grand Tour’. These segments had differentiated holiday patterns, however one ofthe main defining factors was the total length of time on holiday (BDA 2001).Tourism Queensland further analysed the National Visitors Survey using the

Drive Tourism: Up the Wall and Around the Bend
20
established drive market definition and identified similar differentiating patternsin total trip length. From this four core trip length segments were introduced asthe first level of drive market segmentation, these are:
• Short Break (1–3 nights)• Short Tour (4–7 nights)• Big Tour (8–21 nights)• Grand Tour (22+ nights)
This segmentation supported previous Destination Marketing research andcorresponds with the typical trip packages provided for by organisations such asRACQ. In applying this first sieve to the NVS, the following results werecompiled for Queensland.
Table 5: Journey Length Segmentation (Queensland Only)
Visitors/Numbers Value/Yield
Number
2000 %
Growth
1999–2000
Total 2000expenditure
Growth1999–2000
Averagespend pertraveller
Grand Tour(22+ days)
308,000 2.8 1.7% $598 million 8.9% $1,942
Big Tour(8–21 days)
1,314,000 12.3 1.6% $1.3 billion 9.7% $1,042
Short Tour(4–7 days)
2,179,000 20.4 15.4% $1.1 billion 29.1% $506
Short Break(1–3 days)
6,903,000 64.6 6.5% $1.3 billion 1.9% $194
Total DriveMarket
10.7 m 67% 7.5% $4.4 billion 11% $412
Total Qld 16.1m 100% –1.6% $9.5 billion 5% $594
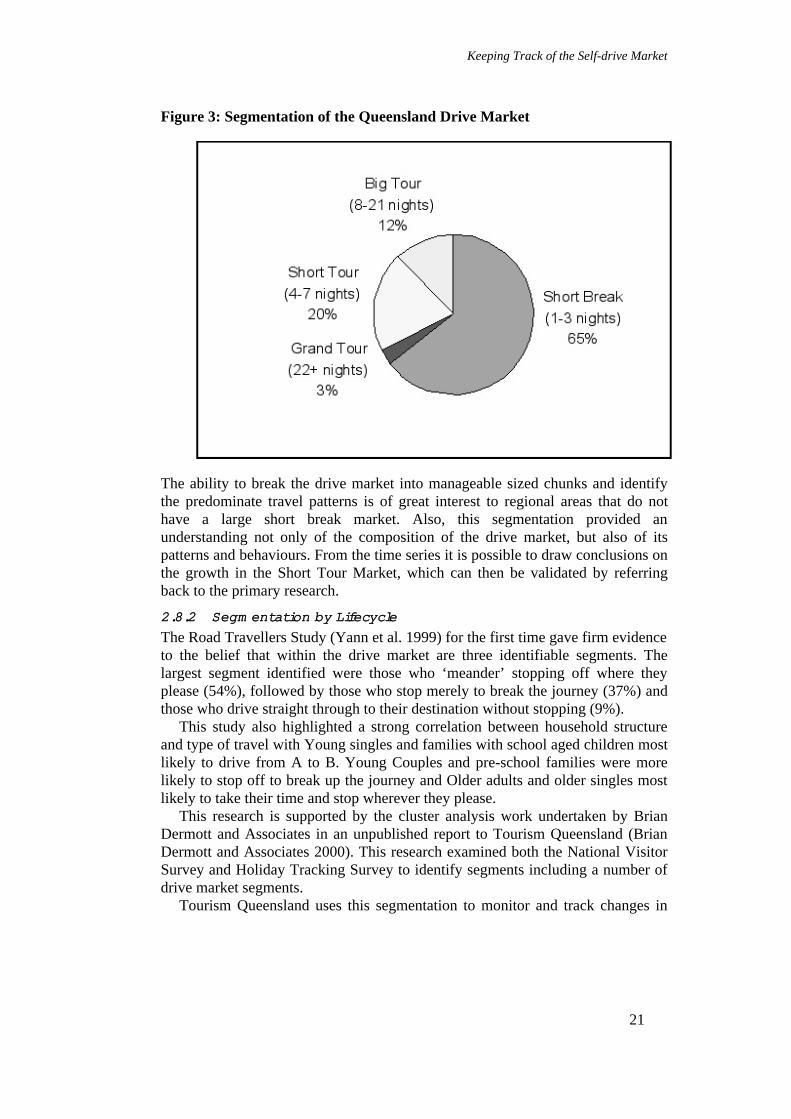
In further examining the Queensland drive market (which is relatively similarto the national profile) it is clear that the dominant segment of the drive market isthe short break market in terms of volume (see Figure 3).
Keeping Track of the Self-drive Market
21
Figure 3: Segmentation of the Queensland Drive Market
The ability to break the drive market into manageable sized chunks and identifythe predominate travel patterns is of great interest to regional areas that do nothave a large short break market. Also, this segmentation provided anunderstanding not only of the composition of the drive market, but also of itspatterns and behaviours. From the time series it is possible to draw conclusions onthe growth in the Short Tour Market, which can then be validated by referringback to the primary research.
2.8.2 Segm entation by Lifecycle
The Road Travellers Study (Yann et al. 1999) for the first time gave firm evidenceto the belief that within the drive market are three identifiable segments. Thelargest segment identified were those who ‘meander’ stopping off where theyplease (54%), followed by those who stop merely to break the journey (37%) andthose who drive straight through to their destination without stopping (9%).
This study also highlighted a strong correlation between household structureand type of travel with Young singles and families with school aged children mostlikely to drive from A to B. Young Couples and pre-school families were morelikely to stop off to break up the journey and Older adults and older singles mostlikely to take their time and stop wherever they please.
This research is supported by the cluster analysis work undertaken by BrianDermott and Associates in an unpublished report to Tourism Queensland (BrianDermott and Associates 2000). This research examined both the National VisitorSurvey and Holiday Tracking Survey to identify segments including a number ofdrive market segments.
Tourism Queensland uses this segmentation to monitor and track changes in

Drive Tourism: Up the Wall and Around the Bend
22
the national ‘drive market’. It allows a more detailed examination of changes inthe drive market and shift-share analysis. In terms of practical application, thisform of segmentation may allow greater understanding and tracking of theimpacts of the baby-boomers. The baby boomers have been identified as apotential growth market with preferences for holiday types that may be suited todrive holidays (Muller & Cleaver 2000).
2.8.3 M ono versus M ultiple Destinations
The Road Travellers Research (Yann et al. 1999) highlighted the existence ofthree main drive holiday travel patterns: Touring (multiple locations); A to Btravel with stops; and A to B travel without stops. The third kind of drive holidayis primarily utilising the motor vehicle as a cost effective transport mode andcould be subject to mode substitution if the price of alternative forms (e.g. air)were to be reduced.
While recognising the fundamental importance of this distinction and theresearch evidence of its existence this form of segmentation is subject to thesignificant challenge of finding a data set that includes such information to trackand monitor changes. Therefore, in the Queensland experience this form ofsegmentation is only available from one-off research.
2.9 Further ResearchThe work shown in this chapter in understanding, mapping trends and segmentingthe drive market is the only a small portion of the potential for furtherexamination of the drive market. The analysis has in many cases raised morequestions than it has provided answers. Areas for exploration within the bounds ofwhat is currently collected are almost, limitless. The few that have been identifiedinclude further analysis of the NVS to provide a distinction between multiple andmono-destination drive holidays, tracking the flow of visitors by corridor anddeveloping data sets to influence road infrastructure planning.
As highlighted in the discussion on segmentation, one of elements identified inthe existing primary research, which defines different types of drive holidays, isthe choice to travel to multiple destinations as opposed to having a singledestination focus (Yann et al. 1999). While recognising this trend, the current datasets do not make such analysis easy. It is possible however to manipulate the unitrecord data of the National Visitor Survey to identify those visitors which hadmultiple stops along the route as opposed to those travelling straight through.
This information would allow further examination of the drive market thatwould have application for example in the areas of feasibility assessments forattractions along major corridors. With such information the A to B no stopstraveller could be removed from the target market to give a more realisticindication of the target drive market.
Information that is of great use and interest to regional tourism areas is theflow of visitors and their changing trends. This information can assist in numerousareas from tactical responses like billboard placement to measures of effectivenessof route marketing campaigns. Early work in this area can be found in Clark and
Keeping Track of the Self-drive Market
23
Black (1998), examining the flow of visitors through the outback region ofQueensland.
This research however relied on dedicated primary research, which isexpensive and as such cannot be done on a regular basis. One potential response isthe development of a ‘visitor flows model’ using the NVS data in concert withMain Roads counts, Visitor Information Centre data and other key regionaltourism statistics to maintain an active count of the number of visitors on anymajor section of road at anytime.
The visitor flow model is only limited by the availability of data but couldpotentially provide monthly or quarterly corridor estimates utilising a GeographicInformation Systems (GIS) platform. This information could also have applicationin influencing road infrastructure planning.
Road infrastructure provides essential access for visitors to destinations. Forregional areas road infrastructure and access are vital to the success of burgeoningtourism industries. To date tourism’s input to, and affect on, road infrastructureplanning has been ad hoc at best. The challenge in impacting on roadinfrastructure is two-fold, firstly there is a need to be able to present data that iscomparable to other industries to demonstrate the cost/benefit of investing in roadinfrastructure to benefit tourism. Secondly, and most importantly, isdemonstrating the broader economic and regional development implications oftourism to the road engineering fraternity.
The Strategic Tourism Roads Study (2000) which was a co-operative projectbetween Tourism Queensland and the Department of Main Roads, which followedwork undertaken by the Cameron McNamara, Tourism Priority Roads Study(1988) and the work for the Tourism Task Force, Tourism Transport NeedsAcross Australia (1996). This work highlighted that despite its importance to theState economy, tourism did not figure greatly in road infrastructure planning inQueensland. The study highlighted that the triggers for upgrading roads for theQueensland Department of Main Roads revolved around the quantum of heavyand light traffic not so much the value. On this criterion even the most bullishestimates of visitor growth on key corridors would not justify road upgrades.
On the other side of the equation, evaluation of traffic counts around keytourism assets such as Carnarvon Gorge demonstrate a strong correlation betweenroad sealing and increased traffic (see Figure 4).
Figure 4 clearly shows the growth in traffic (AADT) on Carnarvon Highway, akey access point for Carnarvon Gorge in Queensland, as the road wasprogressively sealed from 1992 to 1996. While this does not relate directly tovisitors there is potential to use the ‘visitor flows model’ discussed previously tolink overall traffic growth to visitors. This can then be examined in terms of anincrease in visitor numbers as a result of road sealing, the resultant estimatedincrease in expenditure and potentially utilising the Tourism Satellite Account toestimate job creation. Armed with this information the tourism industry may be ina better position to lobby for road upgrades to benefit the growth of the industry.

Drive Tourism: Up the Wall and Around the Bend
24
Figure 4: Carnarvon Gorge (Injune to Rolleston) Total Traffic versus RoadUpgrade
2.10 ConclusionThe drive market and drive holidays represent a significant contributor to tourismin Australia, especially regional tourism. Despite this, little detail was knownabout this important market prior to a wave of primary research since the late1990’s. This research has provided tourism practitioners with a real insight intothe motivations, planning activities, information sources and demographics of thedrive market. This series of one-off research around the country, and especially inQueensland has identified the existence of a certain mind-set attached to ‘driveholidays’.
While the definition of what constitutes a ‘drive holiday’ and whether there issuch a thing as the ‘drive market’ are still open for debate what is known is thatthere are a number of sources to gain better information and intelligence about thedrive market at our fingertips.
Utilising existing information from the National Visitor Survey, HolidayTracking Survey and the International Visitor Survey provides practitioners withthe ability to expand their view of the drive market from a detailed view providedthrough one-off research to a more strategic view. This more strategic viewincludes time-series data on a national level, which allows market shift-shareanalysis, examination of trends and potentially analysis of visitor flows.
Such information provides tourism practitioners for the first time with anational picture of the drive market, its size, contribution to the economy, andcomparison with other segments of the tourism equation. While more work needsto be done on forming a standard definition of what constitutes the drive market,opportunities for application of the outcomes continue to arise including input toroad infrastructure planning, tests of effectiveness of activities in the drive market,and opportunities to better target market segments.

Chapter 3
Drive Tourism and Special InterestTourism
Ros Derrett
3.1 IntroductionRegional Australia has a timely opportunity to deal with the growing Specialinterest tourism (SIT) markets. Some individuals and groups are seekingcustomised leisure and recreational experiences. While SIT may be a new term, itis not a new phenomenon. Special interest tourism is ‘the provision of customisedleisure and recreational experiences driven by the specific expressed interests ofindividuals and groups’ (Douglas, Douglas & Derrett 2001). People have longvisited specific destinations for specific experiences associated with a predilectionfor a particular passive or active pursuit. Some return regularly to engage withexperts in appropriate environments for specific rather than general educational,leisure, adventure and restorative reasons.
Growth in the SIT has been identified (Hall & Weiler 1992) particularly infarm and regional, adventure, cultural, heritage and event tourism. SIT, like othertourism sectors, is market driven. There is expanding demand for viable productsto satisfy the needs of enthusiasts who ‘travel with a purpose’. Regionalentrepreneurs, communities and government agencies may wish to satisfy thedrive special tourist’s desire for authenticity and real experiences that offer themactive identification with host communities in a non-exploitative manner.
Inside the cars, buses and on bikes travelling to regional Australia are curiouspeople. Their curiosity has been raised because of their special interest and theirexpectation that flexible, personalised service can be accessed. They want anactive and conscious relationship between themselves and their hosts, asindividuals and communities, in a way, which doesn’t degrade the quality of lifeof either (Douglas et al. 2001).
Read (1980) suggests that SIT is the hub around which the total travelexperience is planned and developed. Participants identify strongly with theirchosen activity and through this the pursuit of serious leisure. This involvementprovides a way of finding personal fulfillment. According to Naisbitt (1990:195):‘The 1990s were characterised by a new respect for the individual as thefoundation of society and the basic unit of change’. As individuals take to theroads of Australia they can assist enterprises, communities and regions inrevitalising their image, their products and services.
Drive Tourism: Up the Wall and Around the Bend
26
3.2 SIT and Self-drive TourismIndividuals have special interests. Some individuals are happy to share theseinterests with others during their travel experiences. Some prefer to limit thenumber of people with whom they come into contact while on holidays. Theyconcentrate their time, energy and other resources on satisfying a specific leisurepursuit that allows them to engage with like-minded specialists. Regions that canprovide specialist experiences like fly fishing, fossicking, bird watching,photography or gourmet regional cuisine need to consider all aspects of theindividual visitors experience.
Such visitors are not always looking for ‘bargains’. They like to read materialbefore they go somewhere; they send off for everything to research the access tospecial activities. They rarely book ahead, but carefully plan the route. Suchvisitors enjoy the freedom and flexibility of drive tourism and use the localtourism information centres, along with agencies such as NRMA, RACV, andRACQ for getting good room rates (Douglas et al. 2001).
Touring by car enthusiasts have a main destination in mind for at least twonight stopovers on their way or return (AMR 2000:4) or taking a holiday that hasat least overnight stopovers in different locations but with no main destination.Having determined what specific interests can be satisfied, visitors indicate theylike to stop and explore their chosen activity; they are not hurried and can go attheir own pace; they enjoy driving and they can take more luggage (AMR2000:45).
The lack of reliable public transport in regional Australia has meant that areasonable proportion (>25%) of backpackers opt for self-drive vehicles for someof their trip to pursue their specialist interest. Bikes and motorbikes are also anoption (TNSW 2000). Self drive cars, rental cars, campervans and sometimes thepurchase of a vehicle are features of this sector (Tulpute 1999). With theindependence this provides, regional agencies need to ensure they provideadequate information, in time, at the right time in the decision making processwith clear directions. Detailed material on specific areas of interest like heritage,shipwrecks, horse riding or healing needs to be located in the outlets identifiedabove. This relevant information, via websites, tourist information centres,billboards, print collateral in accommodation should be waiting for the SIT driveenthusiast.
Drive tourism facilitates observation with an emphasis on sightseeing. 91% oflong car touring holidays are for sightseeing (Yann 1993) with 76% ofparticipants seeking interesting environments while 60% look for new places andactivities. SIT visitors’ desire to participate allows them to access diverse localinteresting visual arts, crafts, theatre music practice and special events andfestivals for authenticity, ritual, and spectacle.
Tourists with particular interests readily access the Internet. SIT serviceproviders need to offer more information via the web and encourage direct contactprior to meeting their guests. Both parties come with greater expectations withexplicit information on sites, destinations, services and personalised contact. Thismedium addresses the needs of individuals with opportunities for attention to
Drive Tourism and Special Interest Tourism
27
detail, e.g., special diets, numbers of groups for tours, customised tourismexperiences, although this requires them to know the level of the individual’sskills, commitment and resources.
The SIT drive market represents changing demand patterns. Read (1980, citedin Hall & Weiler 1992) suggested that SIT or REAL tourism comprised fourmajor elements, rewarding, enriching, adventuresome and learning experiences.These people journey to find the unfamiliar (Urry 1990). What is visited (such asmonuments and artistic events) is being replaced by tourist demand for howdestinations are visited (Wood 1992). The demand for shorter, more frequent andmore intensive tourism experiences can lead to high yield options for regionaltourism operators where visitors are prepared to spend more, but stay for shorterperiods. This can provide a better return for tourism investment.
There is an increasing link between holidays and personal interests developedat home. The tourism experience then becomes an opportunity to exploit thoseinterests more intensively. Holidays become an essential part of a holisticlifestyle, which includes changes of scenery and climate, but complementsestablished special interests. Existing operators need to better understand theircustomers and seeks from them information which would enhance the return visitand encourage positive word of mouth. By contacting existing SIT groups throughtheir home base, their newsletters, their web listings, magazines and othernetworks, their relevant needs can be established and satisfied by regionaloperators and marketers.
Regional operators need to observe the changes in SIT visitors’ family life andgenerational responsibilities, broader economic and lifestyle changes, togetherwith their greater expenditures on leisure pursuits. Many are time poor but moneyrich consumers who will demand satisfaction and personal development fromprecisely tailored, flexible products. Retirees, for example, are free to travelthroughout the year and with a wide range of incomes, will have differentdemands from the fraught executive who will have a two to three night window ofopportunity.
The mix in products and services available in regional Australia needs to takethis into account. Individual special interest tourists like to satisfy their curiosity,learn more, appreciate beauty, collect things, improve themselves, express theirpersonalities and receive approval from others. They generally wish to be first ineverything and be recognised as authorities and influential, so as to have a goodstory to tell of their experience when they return home. The sorts of benefits theyseek include filling their increased leisure time with value for money experiences.They expect a high standard of service and resulting personal prestige orsocial/cultural advancement from their commitment to specific ‘cutting edge’activities. There is an element of fashion or trend setting in consumer motivations.The self is at the centre of modern consumer society. It ties together issues ofchoice, identity, status and culture (Douglas et al. 2001).
Those providing SIT services need to address the key principles of qualitycustomer services. Knowledgeable staff are required to deliver accurateinterpretation of sites, understanding of the limitations to over-use of property,

Drive Tourism: Up the Wall and Around the Bend
28
sensitivity to land ownership issues and appreciation of cultural heritage. Clear,simple and truthful collateral and signage must be present to direct potentialcustomers to the properties and services. Partnerships with other elements of thetourism system to facilitate packages are required. Fundamental to all this is anacknowledgement of the connection between tourism and such specialist areas asindigenous culture, visual arts, conservation of the natural environment and localhistory.
For the drive tourism sector SIT offers community contact. Community, thecustodians of the content of Australian tourism, must be enabled to participate intourism by forming its content. Only if Australians are involved in tourism will itsurvive. This is a substantial premise for the development of tourism sensitive tothe concerns of the host community. The drive SIT market generally recognisesthat cultural tourism is the art of participating in another culture, of relating topeople and places that have a strong sense of their own identity. It is an approachto tourism that gives tourists credit for intelligence, and promises them somedepth of experience and real-life layering that can be explored on many levels.
Regional and rural communities need to work to establish a dynamic that willmake them attractive not only to the residents but also to visitors. Those aspects ofcommunity life which visitors may find attractive become commodities and theresultant commercial imperative can bring tension. Especially vulnerable arecommunities that have developed festivals and events that reflect the lifestylechoices of the residents. Festivals that have amused and entertained locals forgenerations are now being recognised as opportunities to promote towns, share aspecific local pursuit and provide economic gain for communities.
The Jacaranda Festival in Grafton in regional New South Wales wasestablished in the 1930s. Beef Week in Casino commenced in the early 1980s tohighlight the importance of a local industry. Both community based non profitvolunteer organisations find that the annual programming of each event now hasas much to do with tourism marketing as it does with the traditional communitycultural development and fun making. So, they can target specific segments oftheir annual (and often repeat) market and exploit the contact for the nicheactivities included in their event programs, e.g. dog shows, veteran car rallies, artand craft exhibitions.
The SIT drive market provides an opportunity for partnerships between variousstakeholders. When opportunities to revitalise a community arise, for example, byplacing an art and craft outlet in an unused railway station, or opening a museumwith a collection of memorabilia to a local hero or offering locally grown produceat functions hosted by a local tour operator, they may be undertaken by non-profitcommunity based organisations. These are attractive to the drive market. Eventssuch as agricultural shows, rodeos, car rallies, fishing competitions and sportingfixtures commenced generations earlier may be revitalised in the light of increasedinterest from domestic and international drive tourists wanting to do what thelocals do.
Drive Tourism and Special Interest Tourism
29
3.3 The Rainforest W ay Exam pleEffective strategic planning, management and marketing will ensure that while theSIT drive market can be agents of change; each community needs to establishthresholds with which they are comfortable, so that they can manage the resourcesand the communal will appropriately. Increased special interest tourism activityhas significant implications for regional economic development. Not all membersof the community have the same attitude at the same time, to the same specialistpursuits, even over the same locations.
An area that is preparing such a focused approach to the SIT market is theNorthern Rivers of New South Wales and South East Queensland. There is acooperative project that crosses State borders and regional councils for the mutualbenefit of all stakeholders and addresses some of the special interest touristsneeds. The proposed Rainforest Way and its associated loops and trails willprovide enhanced themed experiences for visitors to the region. A common visionto develop and promote a primary touring route with complementary experientialloops and trails through Northern Rivers NSW and South East Queensland toprovide enhanced experiences for visitors and greater environmental, cultural,social and economic benefits for the cross border regions has been adopted.
Throughout regional Australia there are opportunities to connect individualswith special interests to a raft of regionally specific activities in distinctive andappropriate locations. Planners need to encourage responsible and sustainabledevelopment that respects the values of regional stakeholders and communities.This requires consistent, clear, well interpreted routes to expose SIT visitors tosites and experiences like forest walks, gem-fields, alternative technology andagriculture, health retreats, markets for arts and crafts or artists’ studios and localproduce.
The hinterlands of Northern Rivers New South Wales and South EastQueensland regions have both been identified as having significant potential fortourism growth through their rich diversity of natural and cultural attractions. Thisarea shares many common themes, embracing national parks, hinterland, WorldHeritage Sites, indigenous culture and resident lifestyles.
One of the major attractions of the region is the natural environments andWorld Heritage listed sites. The Mount Warning shield volcano provides adominant influence on the landscape that moves from lush tropical rainforest toexpanses of eucalypt forest and mountains with sheer rock faces. Collectively theregion’s World Heritage Sites are referred to as the Central Eastern RainforestReserves Australia (CERRA). The CERRA includes some of the major touristattractions of the region including, Mount Warning National Park, Border RangesNational Park, Nightcap National Park (NSW), Lamington National Park andSpringbrook National Park (QLD). Their significance as an area of immensenatural attraction is sometimes lost due to the geographical spread of theindividual sites and the fragmented marketing practices of the region, especially inthe lack of cross border cooperative marketing. This is a significant challenge.
The National Visitor Survey (NVS) indicated that in 1999 more than 1.8 milliondomestic visitors travelled to the Northern Rivers region, staying more than 6.9
Drive Tourism: Up the Wall and Around the Bend
30
million nights. Most of these visitors travelled to the area by private vehicle. Inaddition to this a number of international tourists also visited the region. Researchprovided in Tourism Trends in NSW – Northern Rivers Regional Profile 1999supports the information provided by the NVS and adds some other interestingdata on visitors to the region.
Eighty-five per cent travel to the region by private car, 2% travel by rental car,50% of visitors are holiday and leisure travellers, 33% visiting friends andrelatives, 40% stay at friends and relatives properties, 18% stay in hotel, resortmotel or motor inn, 16% stay in a caravan ark or camp on private property, 3%stay in a backpackers/hostel, 48% of visitors enjoy ecotourism activities (includesgoing to the beach and rainforests) and 77% enjoy social activities such as visitingfriends and relatives. This total market can be divided into unique marketsegments which have been identified as: Ecotourists, Short breakers, Southerndrifters, International drivers and Backpackers. Within each segment there arepeople with special interests. They can be targeted and provided with tourismexperiences of specific interest to them.
Fifteen per cent of nature based tourists visit specifically to experience thenatural environment and 13% specifically for cultural pursuits. These ecotouristsdisplay a desire for interesting and unspoilt natural environments, visiting nationalparks and bushwalking, and cultural experiences such as visiting galleries andmuseums and attending festivals. Ecotourists are generally better educated andmore environmentally sensitive. 33% of all overseas visitors to the region are alsoecotourists. The area is best known for its beaches, mountain scenery, nationalparks and alternative lifestyles, but recognition of World Heritage by bothinternational and domestic visitors is low.
Visitors are driving south to escape the urban density, crowds and the high-riseand tourist environments of Brisbane and the Gold Coast. They perceive the areaas clean, unspoilt, underdeveloped, uncomplicated and uncrowded. Theyappreciate the tranquillity, simplicity, safety, flexibility and peaceful naturalbeauty of the environment of the region. They perceive the area as unique,interesting and harmonious, with opportunities to relax, and experience adventureand discovery with locals. They find the area casual, comfortable and convenientand the locals friendly and genuine. This ‘ambience’ needs to be packaged andtranslated into tourism product.
The SIT market identified includes a farm holiday experience for participantsto meet farmers, get close to farm animals, swim in a creek, ride machinery, seewildlife in its native habitat, ride a horse, canoe, fish for yabbies in a dam. Alongthe Rainforest Way visitors can learn more of the diverse alternative culturesthrough health activities, sustainable permaculture/horticultural practices andregional cuisine allowing people to follow from farm gate to restaurant plate.
A substantial touring by car market exists for the region. Segments includes thewell-established ‘snow bird’ market escaping the cooler climes; it includesfamilies on school holidays with special interests; the older market; and long termmeanderers. International travellers, increasing in number, travel by car, coach,train or campervan from Sydney and from South Eastern Queensland (picked up
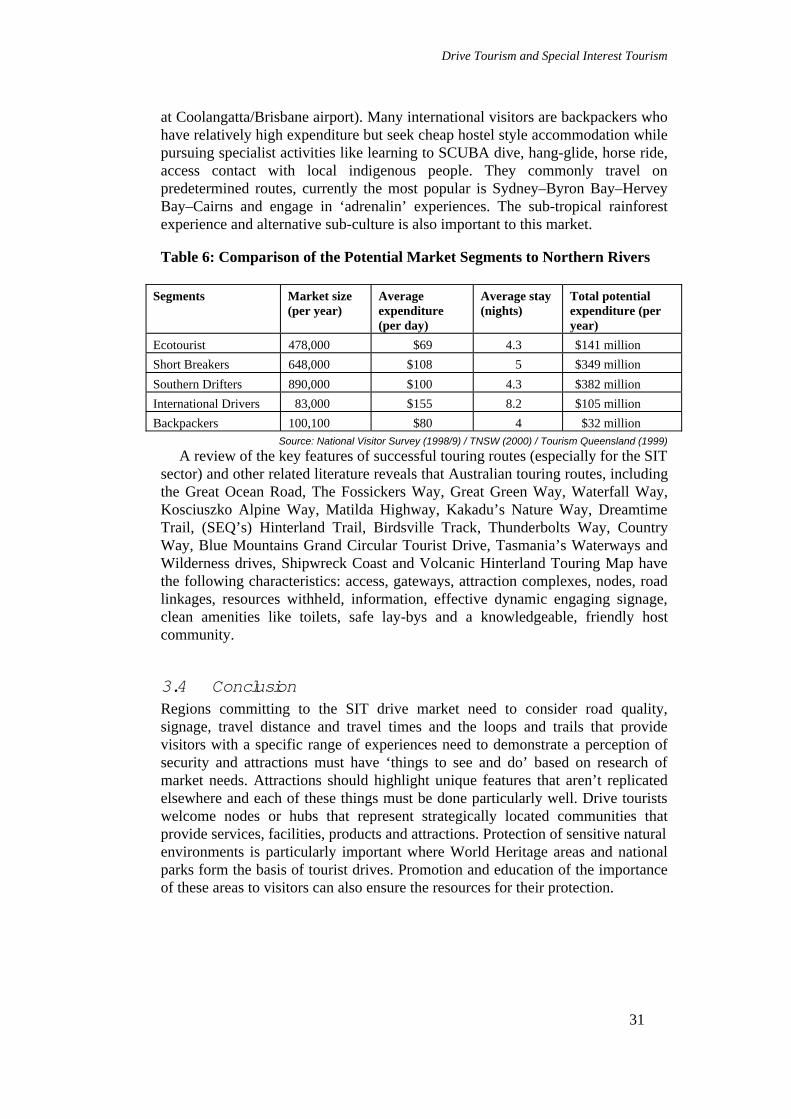
Drive Tourism and Special Interest Tourism
31
at Coolangatta/Brisbane airport). Many international visitors are backpackers whohave relatively high expenditure but seek cheap hostel style accommodation whilepursuing specialist activities like learning to SCUBA dive, hang-glide, horse ride,access contact with local indigenous people. They commonly travel onpredetermined routes, currently the most popular is Sydney–Byron Bay–HerveyBay–Cairns and engage in ‘adrenalin’ experiences. The sub-tropical rainforestexperience and alternative sub-culture is also important to this market.
Table 6: Comparison of the Potential Market Segments to Northern Rivers
Segments Market size(per year)
Averageexpenditure(per day)
Average stay(nights)
Total potentialexpenditure (peryear)
Ecotourist 478,000 $69 4.3 $141 million
Short Breakers 648,000 $108 5 $349 million
Southern Drifters 890,000 $100 4.3 $382 million
International Drivers 83,000 $155 8.2 $105 million
Backpackers 100,100 $80 4 $32 millionSource: National Visitor Survey (1998/9) / TNSW (2000) / Tourism Queensland (1999)
A review of the key features of successful touring routes (especially for the SITsector) and other related literature reveals that Australian touring routes, includingthe Great Ocean Road, The Fossickers Way, Great Green Way, Waterfall Way,Kosciuszko Alpine Way, Matilda Highway, Kakadu’s Nature Way, DreamtimeTrail, (SEQ’s) Hinterland Trail, Birdsville Track, Thunderbolts Way, CountryWay, Blue Mountains Grand Circular Tourist Drive, Tasmania’s Waterways andWilderness drives, Shipwreck Coast and Volcanic Hinterland Touring Map havethe following characteristics: access, gateways, attraction complexes, nodes, roadlinkages, resources withheld, information, effective dynamic engaging signage,clean amenities like toilets, safe lay-bys and a knowledgeable, friendly hostcommunity.
3.4 ConclusionRegions committing to the SIT drive market need to consider road quality,signage, travel distance and travel times and the loops and trails that providevisitors with a specific range of experiences need to demonstrate a perception ofsecurity and attractions must have ‘things to see and do’ based on research ofmarket needs. Attractions should highlight unique features that aren’t replicatedelsewhere and each of these things must be done particularly well. Drive touristswelcome nodes or hubs that represent strategically located communities thatprovide services, facilities, products and attractions. Protection of sensitive naturalenvironments is particularly important where World Heritage areas and nationalparks form the basis of tourist drives. Promotion and education of the importanceof these areas to visitors can also ensure the resources for their protection.

Chapter 4
Senior Drive Tourism in Australia
Bruce Prideaux
4.1 IntroductionThe popularity of Australia’s suburban life style has created a high level of privatecar ownership and in contemporary Australia the private car is regarded as anessential mode of personal transport. As the popularity of private car ownershiphas grown so has the propensity for owners to use cars as the primary mode oftransport for leisure travel. Being generally poorly suited to servicing suburbantransport needs, public transport has declined significantly in importancereinforcing the trend towards self-drive tourism travel. This chapter looks ataspects of the senior sector of the drive tourism market in Australia drawing onresearch published by the Bureau of Tourism Research (BTR) and researchcommissioned by the Office of the Aging Department of Families, Youth andCommunity Care, Queensland Government and undertaken by Wei and Ruys(1998). This chapter focuses on both the characteristics of the seniors drivetourism market and problems that seniors encounter when undertaking this formof tourism travel.
4.2 Significance of the Senior Travel MarketThe actual size of the senior market is difficult to determine because there is littleagreement on the age cut-off that marks seniors from other groups of travellers.For example, the Federal Government allows people who retire from the age of 55years to have access to their personal superannuation investments. However,males do not qualify for a pension until they reach the age of 65 years whilefemales can currently retire at age 61 years and six months and receive agovernment funded aged pension, although this cut-off is being graduallyincreased to 65 years to bring it in line with the male cut-off. In anothergovernment scheme, persons aged 60 years and over are able to enrol for aSeniors Card that entitles them to a range of discounts on government services.The picture is no clearer in the literature, which has criticised age as a basiccriteria (Tomljenovic and Faulkner 2000) and argued that cognitive age andlifestyles rather than physical age may be a more appropriate basis for developingtourist segments (Moschis 1990; Schewe 1990). From the arguments advanced inthe literature and given the confusing position adopted by government it appearsthat any age-based criterion may not be the most appropriate method ofdetermining a person’s membership of the seniors market. However, for thepurposes of this chapter age criteria have been adopted because of the structure of

Drive Tourism: Up the Wall and Around the Bend
34
the data set available to the researcher.Recent research undertaken by Wei and Ruys, found that 57.3% of seniors
relied on their private car as the primary mode of holiday travel. The size of thesenior market is significant and in 1999 seniors 65 years and over accounted for12% of the nation’s population. In a more liberal interpretation of the definition ofthe term senior using 55 years and older as the cut-off point, the BTR (1998)found that 3.18 million seniors participated in over night travel and accounted for20% of all trips undertaken in Australia.
A study into the leisure, travel and shopping habits of Australian seniorspublished by AC Nielsen (1998) found that the major constraints to travelexperiences by seniors were financial reasons (60%), concerns over health (23%),lack of a travel companion (19%), too many responsibilities at home (18%) andlack of time for travel (9%). The study, based on 1,181 respondents, found thatseniors were more likely to travel intrastate (an average of 3.2 trips per year) thaninterstate (1.6 trips per year) or overseas (1.2 trips per year).
In the near future the size of the senior’s market will grow as the baby-boomersgeneration, defined as being people born between 1946 and 1965 (Muller andCleaver 2000), begin retiring. The impact will be felt gradually as the first baby-boomers commence retiring at the minimum age of 55 years in 2001 and willaccelerate from between 2011 onwards as the initial wave of post war childrenturn 65 years of age and become eligible for government funded aged pensions.This generation of seniors will represent a profound shift in the level of demandfor tourism goods and services. Compared to the current cohort of seniors who aremembers of the of pre war generation, baby-boomers are likely to have greaterpersonal wealth on retirement because of greater access to superannuation fundsand their ability to accrue greater personal wealth during the last half century ofrelative prosperity. Pre War retirees had relatively restricted access to personalsuperannuation schemes and are more likely to rely on government fundedpensions for the bulk of their income.
Recent projections by the Australian Bureau of Statistics (1997) predict that thenumber of seniors in Australia will grow to 4 million by 2007 and 7 million by2051 when seniors will represent approximately 32% of the population. Incomparison, the number of persons in the 15 to 44 years age group is not expectedto increase during this period.
The fall in net national fertility rates to below replacement levels, common tomost developed countries, has created the situation where the percentage ofretirees in the population will grow over coming decades creating a powerfulmarket sector. Boosted by access to superannuation funds and already wellaquatinted with travel the coming generation of baby-boomer seniors will createnew markets for tourism goods and services and importantly, have the personalwealth to consume travel products on a scale not possible for the currentgeneration of seniors. This shift in both market power and market size will createnew opportunities for the tourism industry; however, this new market will besophisticated, well travelled and likely to demand higher levels of service thanpast generations of seniors. It is also likely that baby-boomers will be more

Senior Drive Tourism in Australia
35
environmentally aware placing new demands on the tourism industry to focus onenergy conservation, waste disposal and sustainable practices in their businesspractices (Prideaux, Wei, and Ruys 2001).
4.3 The Drive MarketSeniors have a high level of motor vehicle ownership with 60% of seniors owningat least one vehicle (Ruys and Wei 2001). It is possible to discern two majorforms of drive tourism; travel from an origin point to a destination where the car isused primarily as a mode of transport, or where the route along which travel takesplace becomes the primary focus of interest. It is also possible to argue a thirdform where drive tourism is a mix of the previously described cases.
The drive tourism market can also be divided into market sectors based on thepurpose of the research. For example, a demographic classification my divide thedrive market into a 17 to 30 year old group, 31 to 54 year age group and 55 yearsplus, or permutations of age brackets according to the purpose of the study. It isalso useful to classify market sectors on distance criteria such as day-trippers,interstate and interstate. Purpose of travel is also another useful method fordeveloping market sectors and includes VFR (visiting friends and relatives),leisure, holiday, or similar. Tables appearing in this chapter are based on datasupplied by the BTR. In most cases data is segmented into three aged definedcategories (up to age 44 years, 45–64 years and 65 years and over). As arguedpreviously, 65 years may not be the most appropriate category by which to judgemembership of the seniors market sector, however, given the constraints of thedata set the 65 years plus cut-off is used in this chapter.
4.4 Structure of Drive TourismThe structure of drive tourism differs considerably from other forms of tourismthat may focus on a particular type of activity or on a specific class of locationsuch as a seaside resort, historic city, capital city, national parks or spas.According to Prideaux (2001) the major elements of drive tourism are:
• The road and all of the associated activities required to build andmaintain it;
• Accommodation which includes motels, farm stays, caravan parks,camping grounds, Bed and Breakfasts, self catering units or apartmentsand hotels;
• Refuelling facilities which supply petroleum, gas and diesel as well asfood and, in some jurisdictions, alcoholic beverages;
• Information, usually consisting of roadside signage, tourisminformation centres and brochures;
• Enforcement of road rules and regulations by police;• Vehicle repairs and recovery;• Attractions that target highway travellers as their prime source of
customers; and
Drive Tourism: Up the Wall and Around the Bend
36
• Promotion of on-road attractions.In Australia the significance of drive tourism has been recognised by all state
tourism marketing authorities and a range of specialised brochures and otherpromotional media are used to promote self-drive leisure travel. For rural areas theaccess to drive tourists has created new investment and employment opportunitiesand many peripheral areas have been able to attract public sector grant funds toestablish new attractions. Examples include the Stockman’s Hall of Fame inWestern Queensland and the Queensland Heritage Trails Network. Developmentof tourism attractions of this nature has also attracted private investors who areresponsible for the provision of Tourism product infrastructure which is definedby Prideaux (2002) as the fabric of supporting tourism orientated businesses thatinclude attractions, accommodation, food and beverage service, shopping,recreation, entertainment, festivals and sites of tourism interest.
4.5 Characteristics of Senior Drive Tourism in AustraliaParticipation by seniors in drive tourism in Australia has been researched by Weiand Ruys (1998). This research presents a comprehensive snapshot of the size andstructure of the market as well as the views of seniors on significant issues. Asboth surveys were designed to identify only the views and patterns of the currentcohorts of seniors the likely intensions of baby-boomer seniors is unknown.
Research conducted by Wei and Ruys (1998) gives a comprehensive outline ofthe views of seniors on a number of aspects of the seniors market and is reportedin summary form:
• Information Sources. In order of importance, and based on use ofmultiple information sources, the most importance sources ofinformation were: word-of-mouth from family, friends and otherseniors (60.4%); pamphlets and brochures (58.3%); travel agents(57.1%); travel brochures (56.4%) and; Seniors Card business discountdirectory (55.1%). The significance of print media compared toelectronic media should be noted and must be a major considerationwhen determining promotional campaigns and appropriate distributionchannels.
• Seasonal Travel Preferences. The most popular period of travel is inthe July-September period (74.4%) followed by April-June (53.1%)and October-December (27.8). Further, travel undertaken during schoolholidays (7.8%) was less popular than travel outside of school holidayperiods (38.8%) or anytime (28.8%).
• Mode of Transport. Seniors rely on their car as their primary mode oftransport (61.5%) followed by public transport (24.4%) and tourcoaches (9.8%).
• Other Significant Issues. Seniors travel to learn and experience newthings and to visit friends and relatives. Budget constraints were themost frequently cited reason for limiting or preventing travel. Healthissues were also a major constraint to additional travel. In some casesthe poor health of the respondent’s partner precluded travel. Issues of

Senior Drive Tourism in Australia
37
comfort were important and included accessibility, size of signage andavailability of facilities such as toilets. As the age of the travellerincreases issues of this nature become increasingly important.
The National Visitors Survey (BTR 2000) provides a comprehensive picture ofsome aspects of drive tourism including travel habits, socio-demographiccharacteristics and trip characteristics on a longitudinal basis. The NationalVisitors Survey is conducted on an ongoing basis throughout the year with datacollected from respondents via a telephone survey. Data presented in thefollowing tables includes all age groups thus providing a valuable basis forcomparison of a range of variables apart from age. Analysis is restricted to adiscussion of the significance of senior’s participation in drive tourism althoughthe data covers all forms of transport and in most tables, age groups other thanseniors.
The data divides travel by road into self-drive, which includes rental vehicles,and other road which describes coaches. Collectively, the tables indicate thatseniors prefer self-drive to other modes of transport. After self-drive the preferredforms of travel are by air followed by coach. The general pattern of usageindicates that as distance increases seniors, in common with other tourist sectors,substitute travel by road with air travel.
Table 7: Percentage of Transport Mode Selection for All Agein 1999 (Number of Overnight Trips)
Self-drive Other road Aircraft Longdistance
train (non-suburban)
Ship/ boat/ferry
Othertransport
Total
15–19 (%) 48.38 64.52 39.70 6.28 4.59 0.74 100.00
20–24 (%) 46.63 75.11 45.49 5.36 7.57 1.67 100.00
25–29 (%) 43.41 76.58 51.89 4.14 6.35 0.99 100.00
30–34 (%) 42.56 74.29 48.90 3.42 4.49 0.79 100.00
35–39 (%) 42.06 72.40 43.94 3.01 4.13 0.86 100.00
40–44 (%) 47.21 66.51 41.35 3.57 1.57 1.39 100.00
45–49 (%) 47.92 65.04 44.18 2.29 0.98 0.51 100.00
50–54 (%) 53.26 60.01 45.80 3.39 1.94 0.38 100.00
55–59 (%) 53.05 61.07 53.20 3.32 2.12 1.02 100.00
60–64 (%) 54.35 57.70 48.70 5.06 4.81 0.08 100.00
65–69 (%) 60.59 54.53 52.46 6.18 4.15 0.73 100.00
70 & over (%) 57.94 50.56 44.89 5.81 3.05 0.27 100.00
Total (%) 47.87 67.94 47.00 4.02 4.10 0.89 100.00Source: National Visitors Survey (BTR 2000)
Table 7 indicates the use of transport modes by age group for travel inAustralia. From this table it is apparent that self-drive transport is only marginallymore popular than air travel in the 55 years and over market segment. Of the total

Drive Tourism: Up the Wall and Around the Bend
38
number of self drive trips, the 55 years plus group accounted for 23.2% of all tripswhile the 65 years and older segment accounted for 5.2% of self drive journeys.
Table 8 groups travellers into three age categories and subdivides eachcategory into four journey types. Short breaks indicate overnight trips that mightbe undertaken over a weekend. Short tours may be up to a week in duration whilelonger tours may extend up to the usual length of a persons annual leaveentitlement. A grand tour refers to a much long journey that may extend overseveral months or more. While short breaks are most common for all age groups,Table 4.2 shows that senior drive tourists tend to longer trips than those in otherage groups.
Table 8: Percentage of Self-drive Tourists in Age Groups by Length of Tripin 1999
Trip length Junior 45–64 years 65 years + Total
Short Break 75.54 71.72 56.12 72.39
Short Tour 16.90 18.09 25.77 18.17
Long Tour 6.80 8.83 13.71 8.12
Grand Tour 0.76 1.37 4.40 1.32
Total 100.00 100.00 100.00 100.00Source: National Visitors Survey (BTR 2000)
Income distributions for senior drive tourists also identify characteristics of themarket. For seniors aged 65 years and over, 62.2% had a yearly income ofbetween $8,300 and $25,999 (excluding respondents who either refused to answerthis question or did not know). This compares to the 45–64 year age group whereonly 22.9% of respondents received an annual income of this level, the majorityhaving a higher level of income. Seniors with income levels below $8,300 wereunlikely to travel while the largest number of visitor nights were consumed by the$8,300 to $15,599 income group followed by the $15,600 to $25,999 incomegroup. It is apparent that income restraints are a major factor in determining thetype, location and length of stay of seniors undertaking travel.
4.6 ConclusionThis chapter outlines the extent of senior travel in Australia focusing on drivetourism. Disposable income as well as a range of other factors including healthand the propensity to travel, determines the participation of seniors in drivetourism. In the near future it can be anticipated that newly retired baby-boomerswill change the existing patterns of travel by seniors, however, the extent of anychange and the new demands likely to be created are currently unclear. Thischange in the consumption habits of seniors will have significant implications forthe tourism industry and those operators who service the drive market.
From the research reported on in this chapter it is apparent that there are a

Senior Drive Tourism in Australia
39
number of gaps in our understanding of the structure and operation of the selfdrive market as it applies to seniors. Further research could for example bedirected towards identifying new market opportunities that will emerge as themembers of the baby-boomer generation commence retirement travel. Other areasof interest and of economic significance include the role of caravanning in selfdrive tourism, special needs of seniors undertaking self drive travel and changesthat may have to be made to travel distribution systems.


Chapter 5
Regular Revisitation inCaravan Parks
Kathy Marles
5.1 IntroductionI’ve been coming to this caravan park for Christmas holidays since I was twomonths old. I haven’t missed a year. Our family has 13 sites in this caravan park –my two brothers are here, five cousins, my parents, nephews and daughter. This isour family’s gathering place. This Christmas was small – we only had 40 of us herefor Christmas day lunch. Usually we have more, up to 80 of us – all sitting here onthe banks of the river – beautiful. My grandparents used to come here. They werethe first. They came in the days when there was no bridge and they used to pileonto the punt. We’ve been coming here ever since – 50 maybe 55 years. My sisterlives in Alaska now, but every two to three years she comes back to haveChristmas in the caravan park at Brunswick Heads.
JD (52) Brunswick Heads, December 2000.
For some Australian families, the summer holidays start by hitching the caravanto the back of the car or packing up the tent. The family then heads to the nearestbeach or waterway to set up camp. For many of these families the annualChristmas school vacation is spent at the same caravan park and often, on thesame campsite. This holiday pattern is loyally repeated for many years, especiallywhile the children are of school age. In some cases, it is repeated from onegeneration to the next, so that the family sojourn to the caravan park for theChristmas school holidays becomes a long held family tradition. In 1999, it wasestimated (Bureau of Tourism Research National Visitor Survey) that 5.5 milliondomestic overnight trips involved caravan parks or camping grounds as the mainform of accommodation. This represents approximately 8% of the total tourismmarket in regional Australia.
This chapter presents a case study of regular repeat visitation during thesummer holidays in caravan parks in Queensland, New South Wales and Victoria.Virtually all of these travellers arrive by private vehicle. This chapter provides anin-depth examination of one drive tourism segment and indicates the depth ofmotivation of drive travellers, an area that is relatively under-researched in theliterature.

Drive Tourism: Up the Wall and Around the Bend
42
The case study is drawn from the authors doctoral thesis that was developed intwo parts. Firstly, a baseline study of caravan parks of the eastern states ofAustralia was conducted to indicate the size and nature of this group of repeatcaravaners. Secondly, it explores the relationship between place and communityattachment and the frequency of visitation, through a face-to-face in-depth surveyof caravaners conducted on site.
5.2 Repeat VisitationWhile each holiday is a new and unique experience, many find comfort inreturning to the same destination, especially when the previous experience was agood one (Ryan 1995). The phenomenon of returning to previously visitedholiday destinations is not new. Some have favoured destinations that they visitregularly, while others may have visited a destination only twice in a lifetime(Ryan 1995; Oppermann 1997, 1998, 1999). People in the pre-industrial agesoften travelled to the same summer villa or spa bath (Murphy 1985; Lynch & Veal1996; Leiper 1995). Those with holiday homes also return frequently to the samedestination (Coppock 1977; Downing and Dower 1973; Henshall 1977; Murphy1985). Another group among the repeat visitor is the recreational hobbyist, suchas the fisherman, horse rider or snow and water skier, who have favoured and oftfrequented sites of recreation (Watson, Roggenbuck and Williams 1991; Watson,Williams and Daigle 1991; Moore 1994; Ramthun 1995; Beeton 1999; Vaske2000). A repeat visitor might also be a person who visited a destination in theiryouth and has returned as an older person. Many backpackers return to the placesvisited in his/her youthful travels, and nostalgia lures many to return to thepreviously visited destination (Horna 1994; Lynch and Veal 1996).
However, it is the regularity of the repetition along with the loyalty to thedestination, the caravan park and the specific campsite that sets this group ofcaravaners apart from most other tourists researched to date. The habitual natureof the vacation behaviour raises questions about the motives behind the decisionto return to the same destination. Of initial interest is the intrinsic mobility of thecaravan and why families forego this mobility for the stability of the samedestination. These families are loyal to the caravanning/camping lifestyle and alsoloyal to a specific destination, repeatedly choosing the same holiday rather thanexercising alternative options. It is also of interest that people would return to apreviously visited destination, given the vastly increased number of destinationoptions available to the modern tourist. Today’s consumer has an array of holidaytypes and destinations from which to choose (Weaver & Oppermann 2000). Assuch, significant reasons must lie behind the choice to revisit a destination ratherthan seek out a new one.
As frequency of visitation varies, the motivating factors that drive therevisitation are unlikely to be uniform across or within any of the traveller marketsegments. In addition, they are likely to be multifaceted, suggesting a complexinteraction of factors that impact on the holiday making decision. Somemotivating factors would seem self-evident. For example, satisfaction with

Regular Revisitation in Caravan Parks
43
previous visits, ease of access to the destination, and known expectations of afamiliar destination may be among such motivations (Gyte and Phelps 1989;Mazursky 1989, Watson, Roggenbuck and Williams 1991; Ankomah & Crompton1996; Oppermann 1997). Children’s happiness with the holiday choice (Ryan1992; Lawson 1991; Wiegand 1991; Cullingford 1995) and the time taken to relaxmay also be influences on the choice to revisit a destination. Given a certaindegree of familiarity with a destination, the risk of having an unsuccessful holidaymay also be reduced (Bello & Etzel 1985; Gitelson and Crompton 1984; Ryan1995). Thus repeat visitation may simply be motivated by convenience and riskaversion, in addition to variables such as proximity to the destination, satisfactionwith previous holidays at the destination and general knowledge and familiaritywith the destination.
5.3 Place and Com m unity Attachm entMore subtle motivations may be in force, particularly with habitual repeat visitors.Familiarity with a destination changes the experience and the expectations of thatexperience. It is also likely to change the relationship with the host community(Ryan 1995). Thus the more often a holiday is held at the same destination themore comfortable and at ease the tourist will feel. Over time a sense of belongingand ownership may develop. This feeling of ownership, or of belonging and beingat home, manifests into an emotional attachment to the geographical space or thedestination of return.
One theory that may be applicable to this type of repeat visitation is placeattachment. Place attachment studies explore the emotional attachments thatpeople have to geographic locales. It states that a sense of belonging to a placedevelops over time and influences the way people define themselves. In essence,an individual feels at home and endows the physical space with personal meaning(Tuan 1977; Proshansky, Fabian & Kaminoff 1978; Buttimer 1980; Stokols 1981;Feldman 1990). Thus, place attachment is based on past experience and mayexplain the motive for repeat visitation to a single destination.
Place attachment theory also encompasses social interactions within thecontext of the geographical locale. It indicates both emotional bonds to thephysical place and social bonds to the family and community that interact with theindividual within that place. The theory suggests that individuals who participatein varied activities within the community form deeper place attachment bonds(Jordan 1980; Feldman 1990; Halseth 1993; McCool & Martin 1994; Hawkins &Backman 1998). Similarly, familiarity with other holidaymakers and repeatedshared experiences facilitates the development of a community spirit, and a senseof belonging to the people in the place. Therefore, place attachment is intensifiedby the level of involvement and commitment to the community within the place(Hay 1988; Feldman 1990).
The habitual repeat caravaner is unique in several aspects. While they belongamong the self-drive and the domestic markets, their loyalty to the one destinationsets them apart from most others in these groups. It also makes them unique

Drive Tourism: Up the Wall and Around the Bend
44
among the repeat visitor, who may have visited a destination only twice in alifetime (Oppermann 1997, 1998b, 1999). Nor does their behaviour mimic that ofthe traditional caravaner, who is more of a rover. The habitual nature of thebehaviour raises questions with respect to the incidence of repeat visitation and tothe factors that motivate visitors to return to the same place time and time again.
5.4 Case StudyThis study was conducted in two stages. Firstly, it was necessary to establish themagnitude of the phenomenon of interest. Thus the initial phase of investigationaimed to establish the prevalence of repeat visitation by caravaners and campersin Queensland, New South Wales and Victoria during the Christmas schoolvacation period. Secondly, it was aimed to form a link between the level ofvisitation and the level of place and community attachment. Thus the second stageof the research explored these issues of attachment in relation to visitation. Itconsisted of a survey of caravaners and campers within parks that reported highlevels of repeat visitation during the Christmas season.
5.4.1 Stage 1: Baseline Study
Methodology
The baseline study aimed to determine the incidence of repeat visitation incaravan parks during the Christmas school vacation. All caravan parks inQueensland, New South Wales and Victoria were approached. In total, 1828questionnaires were mailed to caravan park managers in September 2000. Follow-up contact was established by telephone and was conducted in the months ofOctober and November 2000. A response rate of 42% (765 questionnaires) wasachieved. Of these, 54 caravan parks identified themselves as non-tourist parksand were eliminated from any further analysis. Thus, 711 useable questionnaires(39%) were analysed. Queensland showed the lowest response rate. This isprobably due to the fact that in much of Queensland the peak tourist season doesnot occur over the Christmas period. The respondents of this stage of the researchprovided the subjects from which the second stage subjects were drawn.
Results
The survey questions were targeted at managers to identify information aboutrepeat visitors during the Christmas holiday season only. As the primary aim ofthe research was to establish the incidence of this type of visitation, it wasnecessary to define a repeat visitor. Firstly, a distinction was drawn between arepeat visitor and a regular repeat visitor. The definition of a repeat visitor allowsfor a person to have visited a destination only twice in a lifetime. These visits mayhave occurred 20 years or more apart. The category of regular repeat visitor wasestablished to allow for someone who returns to the same destination in a moreregular pattern. In this sense a regular repeat visitor is someone who visits thesame destination over consecutive years. A second consideration was that people

Regular Revisitation in Caravan Parks
45
might have departed from their usual routines during the Christmas holidayseason of 1999/2000 due to the millennium celebrations occurring across thenation. With this in mind, a regular repeat visitor was defined as someone whohad stayed in the caravan park for at least three out of the last five Christmasschool holidays.
Regular repeat visitation in caravan parks during the Christmas holiday seasonwas reported by 65% of park managers. There was slightly less evidence ofsummer repeat visitation in Queensland. This is probably due to the fact that muchof Queensland, particularly north and western Queensland, experiences the peaktourist season during the winter months. Victoria showed a slightly higherreported level of regular repeat visitation than New South Wales. Table 5.1 showsthe incidence of repeat visitation by state.
Both the age of the park and ownership type seemed to influence theoccurrence of repeat visitation. The older parks showed more repetition than theyounger parks. Of those parks 50 years or older, 86% reported regular repeatvisitation compared to 67% and 57% for parks 25–<50 years old and less than 25years old, respectively. There also appeared to be greater regular repeat visitationin the parks that were owned by the state and local governments when comparedto privately owned parks and parks under other management types. The trend withage and ownership type may in part be occurring because the older parks tendedto be those owned by either the state or local governments. Therefore the regularrepeat visitors may be the same ones reported in both instances. There was noevidence of a similar trend when regular repetition was examined in relation to theyears of management. This may suggest that regular repeat visitors continue theirloyalty to the caravan park regardless of management changes (refer to Table 9).
Table 9: Incidence of Regular Repeat Visitation in Caravan Parks duringthe Summer Season
Yes (%) No (%) Don’tknow (%)
State
NSW 69 25 6
VIC 76 21 3
QLD 47 46 7
Age of park
< 25 years 57 36 7
25 - <50 years 67 29 4
50 yrs or more 69 11 3
Years under present management
< 1 yr 55 14 31
1-<5 yrs 67 27 5
5-<10 yrs 67 32 1
10-<20 yrs 66 31 3
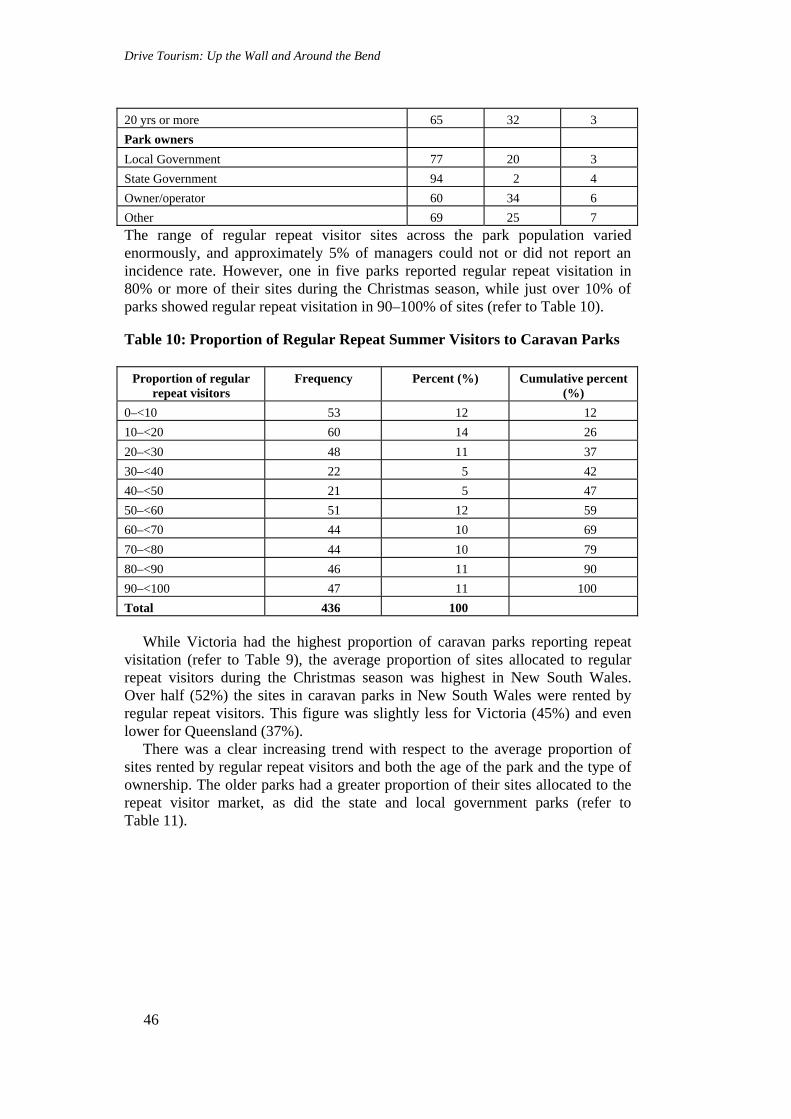
Drive Tourism: Up the Wall and Around the Bend
46
20 yrs or more 65 32 3
Park owners
Local Government 77 20 3
State Government 94 2 4
Owner/operator 60 34 6
Other 69 25 7
The range of regular repeat visitor sites across the park population variedenormously, and approximately 5% of managers could not or did not report anincidence rate. However, one in five parks reported regular repeat visitation in80% or more of their sites during the Christmas season, while just over 10% ofparks showed regular repeat visitation in 90–100% of sites (refer to Table 10).
Table 10: Proportion of Regular Repeat Summer Visitors to Caravan Parks
Proportion of regularrepeat visitors
Frequency Percent (%) Cumulative percent(%)
0–<10 53 12 12
10–<20 60 14 26
20–<30 48 11 37
30–<40 22 5 42
40–<50 21 5 47
50–<60 51 12 59
60–<70 44 10 69
70–<80 44 10 79
80–<90 46 11 90
90–<100 47 11 100
Total 436 100
While Victoria had the highest proportion of caravan parks reporting repeatvisitation (refer to Table 9), the average proportion of sites allocated to regularrepeat visitors during the Christmas season was highest in New South Wales.Over half (52%) the sites in caravan parks in New South Wales were rented byregular repeat visitors. This figure was slightly less for Victoria (45%) and evenlower for Queensland (37%).
There was a clear increasing trend with respect to the average proportion ofsites rented by regular repeat visitors and both the age of the park and the type ofownership. The older parks had a greater proportion of their sites allocated to therepeat visitor market, as did the state and local government parks (refer toTable 11).

Regular Revisitation in Caravan Parks
47
Table 11: Average Proportion of Repeat Visitor Sites in Caravan Parksduring the Summer Season
Mean%
Age of park
< 25 years 39
25–<50 years 46
50 yrs or more 58
Years under present management
< 1 yr 56
1–<5 yrs 47
5–<10 yrs 41
10–20 yrs 47
20 yrs or more 46
Park owners
Local Government 60
State Government 53
Owner/operator 42
Other 37
Managers were also asked about the trends in regular repeat visitation over thelast 5 Christmas seasons (1995–1999). One third (33%) of managers reported anincrease in the regular repeat visitation market over the previous five-year period.Only 17% of park managers reported that there had been a decrease in theproportion of repeat visitors (refer to Table 12).
Table 12: Trends in Repeat Visitation Pattern over the Last Five Years
Change Frequency Percent (%)
Increase 153 33
Decrease 76 17
No change 165 36
Don’t know 68 15
Total 462 100
Managers were asked for their park management perspectives of the repeatvisitation phenomenon. They highlighted the aspects of regular repeat visitationthat they perceived as advantages and those they perceived as disadvantagesOverall the reactions of managers to regular repeat visitation was more positivethan negative.
There were several major positive aspects as expressed by managers. Managerswere also appreciative that they knew their clients and many expressed thatpersonal friendships developed between them and their customers. Another

Drive Tourism: Up the Wall and Around the Bend
48
advantage to knowing the clients was that the managers could address their needsmore fully. At the same time, they could also be confident in their customers’behaviour, as both parties knew what was expected of them. A further advantagethat was reported was that the park atmosphere improved. This came aboutthrough a more friendly and family oriented experience. In addition, theatmosphere was also improved because the security in the park was enhanced. Asthe visitors were better acquainted with each and become more aware of whomight be out of place in the park, a ‘neighbourhood watch’ mentality tended todevelop. Other managers pointed to the financial security that was gained byhaving bookings confirmed in advance and the reduced costs due to word ofmouth advertising. Some managers thought that a positive result of regular repeatvisitation was that their customers were satisfied which meant that themanagement was providing the right services and facilities.
Table 13: Positive Aspects of Repeat Visitation as Expressed by Managers
Positive aspect Percent of cases (%) *
Know clients 25
Atmosphere 24
Guaranteed income/bookings 23
Customers knows rules and what to expect 20
Providing the right service/facilities 19
Customer satisfaction 17
Word of mouth advertising 17
Love the area 14
They appreciate changes to the park 2* Percentages will not add to 100% as respondents were able to answer more than once
Over 50% of the managers reported that there were no negative managementaspects of regular repeat visitation. Where managers did express concerns, severalissues were raised. Customers were reported as feeling that they ‘owned’ the park,which impacted upon managers’ decision-making abilities, sometimes inhibitednew visitors and was expressed in the demand for the same site, year after year. Inmany cases these sites were the best-positioned sites in the park and the customerswere hostile to any change to the site allocation. Managers argued that because theprime sites were taken or that the park was fully booked, new customers weredenied access to the park. Further, the regular repeat visitors often visited onlyonce a year and it was perceived that new clients may be more loyal throughoutthe year. The sense of ownership also made it difficult to make any changes to thepark without encountering some level of opposition from the regulars. This wasparticularly so in parks that were increasing their cabin facilities. Others felt thatthe regulars were generally more demanding and took liberties with the rules ofthe park on the basis that they were ‘friends’ with the management or somehowhad more rights than newer visitors.
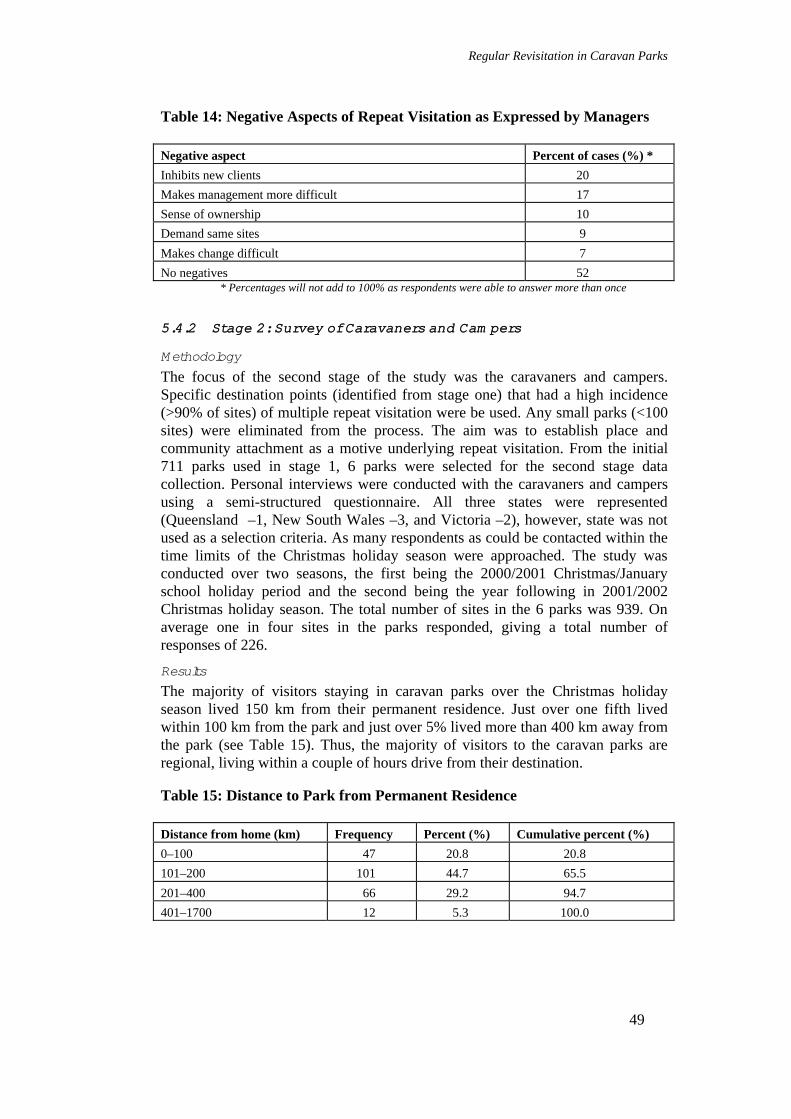
Regular Revisitation in Caravan Parks
49
Table 14: Negative Aspects of Repeat Visitation as Expressed by Managers
Negative aspect Percent of cases (%) *
Inhibits new clients 20
Makes management more difficult 17
Sense of ownership 10
Demand same sites 9
Makes change difficult 7
No negatives 52* Percentages will not add to 100% as respondents were able to answer more than once
5.4.2 Stage 2: Survey of Caravaners and Cam pers
Methodology
The focus of the second stage of the study was the caravaners and campers.Specific destination points (identified from stage one) that had a high incidence(>90% of sites) of multiple repeat visitation were be used. Any small parks (<100sites) were eliminated from the process. The aim was to establish place andcommunity attachment as a motive underlying repeat visitation. From the initial711 parks used in stage 1, 6 parks were selected for the second stage datacollection. Personal interviews were conducted with the caravaners and campersusing a semi-structured questionnaire. All three states were represented(Queensland –1, New South Wales –3, and Victoria –2), however, state was notused as a selection criteria. As many respondents as could be contacted within thetime limits of the Christmas holiday season were approached. The study wasconducted over two seasons, the first being the 2000/2001 Christmas/Januaryschool holiday period and the second being the year following in 2001/2002Christmas holiday season. The total number of sites in the 6 parks was 939. Onaverage one in four sites in the parks responded, giving a total number ofresponses of 226.
Results
The majority of visitors staying in caravan parks over the Christmas holidayseason lived 150 km from their permanent residence. Just over one fifth livedwithin 100 km from the park and just over 5% lived more than 400 km away fromthe park (see Table 15). Thus, the majority of visitors to the caravan parks areregional, living within a couple of hours drive from their destination.
Table 15: Distance to Park from Permanent Residence
Distance from home (km) Frequency Percent (%) Cumulative percent (%)
0–100 47 20.8 20.8
101–200 101 44.7 65.5
201–400 66 29.2 94.7
401–1700 12 5.3 100.0

Drive Tourism: Up the Wall and Around the Bend
50
Preliminary results on place and community attachment showed a moderate toweak positive relationship between the number of years visiting a park and theintensity of the attachment (place attachment r =.417; community attachmentr =.393). That is, the intensity of the attachment feelings increased as the numberof years of visitation increased. Both place and community attachments weremeasured from 11 Likert scaled items respectively. Simple linear regressionsshowed that the number of years visiting a park was a significant predictor of theintensity of the attachment (place attachment p<.0005 and community attachmentp<.0005). Thus as expected, it would appear that the level of intensity ofattachment increases as the number of years visited the park increases (see Figure5 and 6). However, there are many more factors that may influence the intensityof attachment. For example, the number of years visited the park does not specifythat these years be consecutive, therefore it is possible that some people may havehad significant gaps in their visitations patterns. Secondly it will be necessary oncloser examination of the data to explore the type of park being frequented.Visitation in parks that allow annual leases can often be quite distinct from parksthat only permit casual visitors. Annual leases permit visitors to visit as frequentlyas possible and many treat their caravan site as their second or holiday home.
Figure 5: Place Attachment and Years of Visitation

Regular Revisitation in Caravan Parks
51
Figure 6: Community Attachment and Years of Visitation
5.5 ConclusionCaravaners and campers who regularly visit the same destination come to think ofthat place as ‘home’. This has been highlighted by the managers of caravan parksas well as the caravaners and campers. Managers interpreted this in a positive andnegative way. Positive, because the ‘feeling at home’ phenomenon creates apositive and friendlier atmosphere within the park and on the whole makesmanagement easier. But negative, in that it is difficult for managers to facilitatechange. This is made more complex by the fact that many of these people, whoare genuinely emotionally attached to the park, are really only visiting the park fora few weeks a year, whereas the management issues are constant throughout thewhole year.
The caravaners themselves highlighted their feelings of attachment to the placeand the people in the place. It is often the place that attracts people back to thesame destination, but as the number of visits increase over time the communitywithin the place also becomes an attraction. Thus with very regular repeatvisitation, the visitor feels at ease, facilitating a positive emotional response to theplace, community and the holiday. The visitor knows what to expect, who theywill be sharing their holiday with and in many senses the decision to holiday thereis a low involvement one. However, it is not an unimportant decision.
Regular repeat visitation in caravan parks during the Christmas holiday seasonhas been in evidence in some cases for more than 50 years. However, both repeat

Drive Tourism: Up the Wall and Around the Bend
52
visitation and destination loyalty have only recently come to the attention oftourism researchers (Gitleson and Crompton 1984; Ryan 1995; Pritchard andHoward 1997; Gyte and Phelps 1989; Oppermann 1997, 1998, 1999; Niininen andRiley 1998). Currently there is no way of differentiating a person who has visiteda destination twice in forty years from someone who has visited a destinationannually for forty years. Clearly, the definition of repeat visitors encompassesboth types of visitors, and clearly the motivations and experiences of these visitorswill be quite different. Thus, a distinction needs to be made between infrequentrepeat visitation and multiple or habitual visitation so that a deeper understandingof the motives for repetition can be facilitated. Because of this lack of attentionthe traditional explanations provided by the theories of motivation, destinationchoice and decision making fall short when applied to multiple repeat visitors.
Similarly there is a lack of research investigating the influence of placeattachment and community attachment in tourism. While nostalgia and pastexperience as factors determining decisions have come under scrutiny, a lesssuperficial interpretation would result if links between place and communityattachment were established. Equally limited attention has been shown to shorthaul domestic travel, despite the possibility of this being a significant element ofthe market in many Australian destinations. Thus it is timely that we should belooking to drive and regional tourism as a partial salve to the problems created byterrorism and the collapse within the airline industry. People are likely to belooking closer to home for their holidays in the near future and with a very stableand loyal base the caravan industry has a good foundation on which to advance ina growing market. With a greater understanding of the motives propelling repeatvisitation and the identification of distinguishing features, as strengths andweaknesses within the market place, the industry will be better able to focus theirattention on their target market.
This paper has described a process for improving understanding of themotivations of a specific drive tourism market (repeat visitors to caravan parks). Itis important to recognise that drive tourists not only engage in driving as abehaviour, but undertake other activities and experiences in their roles as tourist.Simply focusing on the method of transport will not be adequate in understandinghow these markets operate.
Chapter 6
Cluster Marketing in Tasmania
Rowan Sproule
6.1 The Self-drive Market in Tasm aniaTasmania is a drive destination of substantial proportions in the context ofdomestic tourism. 49.8% of all holiday visitors used rental vehicles while in thestate with a further 23.1% using their own vehicle. A further 9.8% used publictransport and 6.1% an organised tour coach. This piece of action research inTasmania shows how destination managers can develop interventions (includingbut not limited to signage, regional organisation and brochure ware) that can beused in a strategy for managing the benefits derived from drive tourism. Therationale underpinning these market perceptions are the size of the State and thebelief that all the state and its tourism product can be experienced in a relativelyshort space of time.
The Tasmanian Visitor Survey [TVS] (Tourism Tasmania 2002) is thedefinitive source for information on visitors to Tasmania. It was first conducted in1978 and became an annual survey from 1988. The TVS is a sample survey ofapproximately 11,000 adult visitors (departing after their visit) and is designed toprovide a profile of the characteristics, travel behaviour, and expenditure ofinternational and domestic visitors to Tasmania. The results of this survey showthat the total number of visitors to Tasmania is estimated by systematicallyexpanding, a position supported by independent research by the Roy MorganResearch Holiday Tracking Study and a range of other data sets from ABS andother sources.
Interstate travel forms the largest section of Tasmania’’ tourism market,accounting for 73% of all visitors in 2000/01, compared to 26% from overseas (upfrom 17% in 1999/00). As a percentage of all visitors, Victoria (35%), New SouthWales (17%) and Queensland (9%) were the major source of interstate visitors in2000/01. North America (10%), British Isles (6%), and Continental Europe (5%)were the major sources of overseas visitors.
In 2000/01, 420,000 visitors left Tasmania by air while 110,000 left by sea.The majority of visitors fly to and from Tasmania via Hobart (62%) andLaunceston (32%) airports. 87% of sea travel is via Devonport and 10% viaGeorge Town although from September 2002 new SuperFast ferries will serviceonly Devonport, increasing passenger and vehicle capability by 100%. Thesevisitors disclosed that they came to Tasmania for the following purposes:
• 51.2% for leisure/holiday;• 24.9% to visit friends and relatives;• 14.6% for employment or business;• 3.5% for conferences and meetings; and
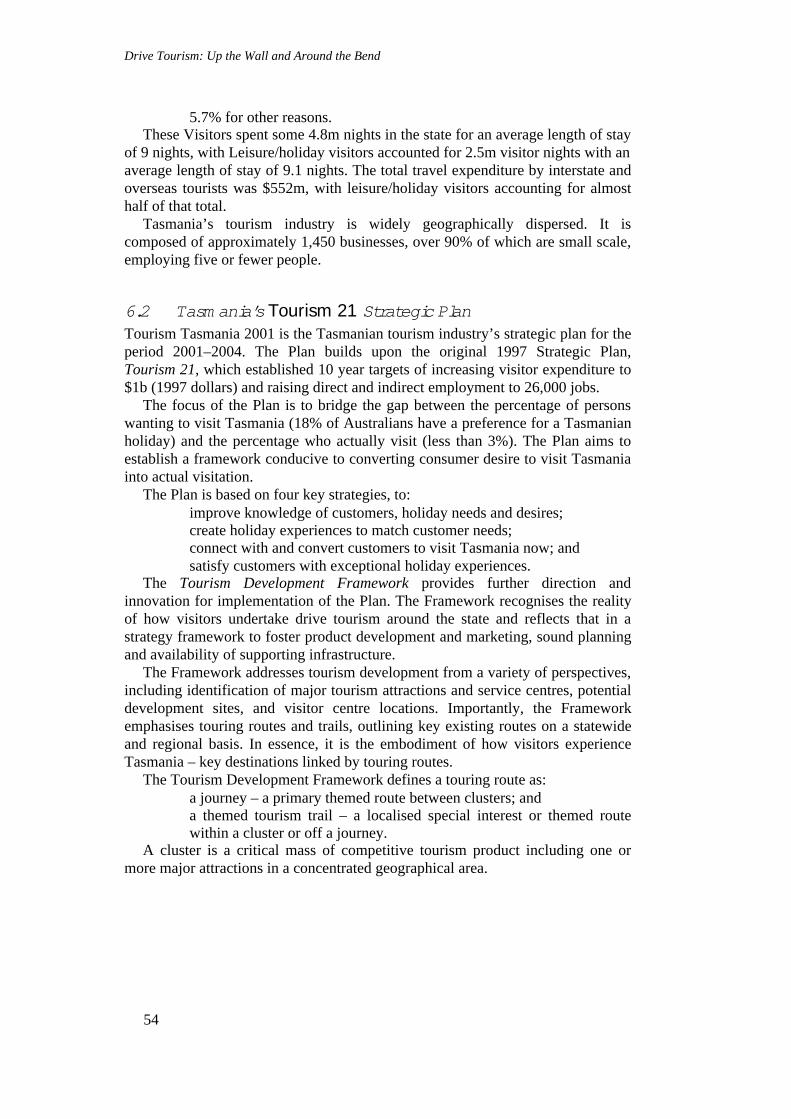
Drive Tourism: Up the Wall and Around the Bend
54
• 5.7% for other reasons.These Visitors spent some 4.8m nights in the state for an average length of stay
of 9 nights, with Leisure/holiday visitors accounted for 2.5m visitor nights with anaverage length of stay of 9.1 nights. The total travel expenditure by interstate andoverseas tourists was $552m, with leisure/holiday visitors accounting for almosthalf of that total.
Tasmania’s tourism industry is widely geographically dispersed. It iscomposed of approximately 1,450 businesses, over 90% of which are small scale,employing five or fewer people.
6.2 Tasm ania’sTourism 21 Strategic PlanTourism Tasmania 2001 is the Tasmanian tourism industry’s strategic plan for theperiod 2001–2004. The Plan builds upon the original 1997 Strategic Plan,Tourism 21, which established 10 year targets of increasing visitor expenditure to$1b (1997 dollars) and raising direct and indirect employment to 26,000 jobs.
The focus of the Plan is to bridge the gap between the percentage of personswanting to visit Tasmania (18% of Australians have a preference for a Tasmanianholiday) and the percentage who actually visit (less than 3%). The Plan aims toestablish a framework conducive to converting consumer desire to visit Tasmaniainto actual visitation.
The Plan is based on four key strategies, to:• improve knowledge of customers, holiday needs and desires;• create holiday experiences to match customer needs;• connect with and convert customers to visit Tasmania now; and• satisfy customers with exceptional holiday experiences.
The Tourism Development Framework provides further direction andinnovation for implementation of the Plan. The Framework recognises the realityof how visitors undertake drive tourism around the state and reflects that in astrategy framework to foster product development and marketing, sound planningand availability of supporting infrastructure.
The Framework addresses tourism development from a variety of perspectives,including identification of major tourism attractions and service centres, potentialdevelopment sites, and visitor centre locations. Importantly, the Frameworkemphasises touring routes and trails, outlining key existing routes on a statewideand regional basis. In essence, it is the embodiment of how visitors experienceTasmania – key destinations linked by touring routes.
The Tourism Development Framework defines a touring route as:• a journey – a primary themed route between clusters; and• a themed tourism trail – a localised special interest or themed route
within a cluster or off a journey.A cluster is a critical mass of competitive tourism product including one or
more major attractions in a concentrated geographical area.
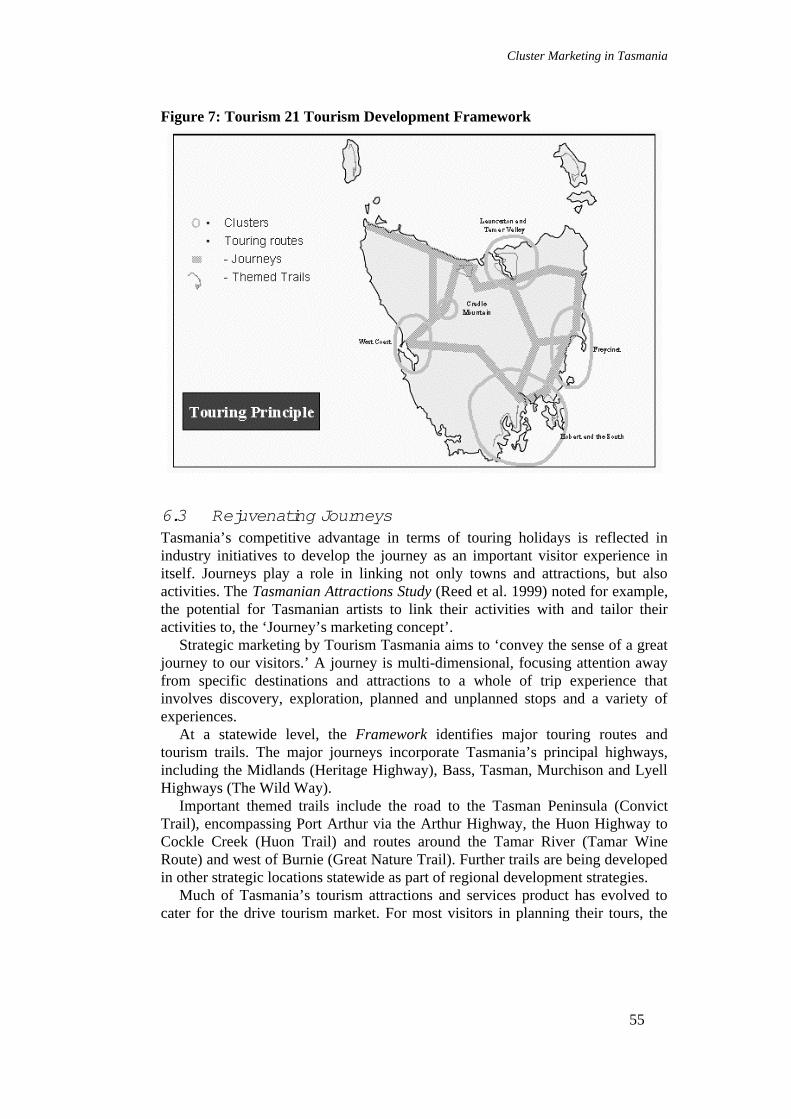
Cluster Marketing in Tasmania
55
Figure 7: Tourism 21 Tourism Development Framework
6.3 Rejuvenating JourneysTasmania’s competitive advantage in terms of touring holidays is reflected inindustry initiatives to develop the journey as an important visitor experience initself. Journeys play a role in linking not only towns and attractions, but alsoactivities. The Tasmanian Attractions Study (Reed et al. 1999) noted for example,the potential for Tasmanian artists to link their activities with and tailor theiractivities to, the ‘Journey’s marketing concept’.
Strategic marketing by Tourism Tasmania aims to ‘convey the sense of a greatjourney to our visitors.’ A journey is multi-dimensional, focusing attention awayfrom specific destinations and attractions to a whole of trip experience thatinvolves discovery, exploration, planned and unplanned stops and a variety ofexperiences.
At a statewide level, the Framework identifies major touring routes andtourism trails. The major journeys incorporate Tasmania’s principal highways,including the Midlands (Heritage Highway), Bass, Tasman, Murchison and LyellHighways (The Wild Way).
Important themed trails include the road to the Tasman Peninsula (ConvictTrail), encompassing Port Arthur via the Arthur Highway, the Huon Highway toCockle Creek (Huon Trail) and routes around the Tamar River (Tamar WineRoute) and west of Burnie (Great Nature Trail). Further trails are being developedin other strategic locations statewide as part of regional development strategies.
Much of Tasmania’s tourism attractions and services product has evolved tocater for the drive tourism market. For most visitors in planning their tours, the

Drive Tourism: Up the Wall and Around the Bend
56
roads linking the various places are merely the routes to get from one attraction toanother. In the perception of the prospective visitor, they are not part of theexperience, but the necessary path to get from one location to another. Visitorsand the product operator often come together more by chance than design.
To reduce this lack of connectivity Tourism Tasmania has initiated a numberof complimentary approaches. They include the Tasmanian Visitor InformationSystem, the development of regional touring strategies and an enhancementprogram for roadside facilities and scenic viewpoints.
6.4 Tasm anian Visitor Inform ation System (TVIS)The Tasmanian Visitor Information System (TVIS) is the holistic name given toan approach for providing consistent and clear information to visitors andprospective visitors to Tasmania.
TVIS involves integrating a number of separate elements into a systematicapproach aimed at meeting the information needs of travelers at various points inthe consumer decision chain. Components are linked by common themes andconcepts.
The TVIS embraces the Tasmanian Holiday Planner, Regional and ThemedTrail Guides, the Tourism Tasmania (http://www.discovertasmania.com) website,the 20 accredited Visitor Centres statewide, and road signage.
6.4.1 The Tasm anian Holiday PlannerLaunched by Tourism Tasmania in September 1998, the publication fills theinformation gap that existed for many consumers when contemplating a holiday inTasmania. In one publication the major things to see and do Statewide arehighlighted, providing the information for planning a tour. The Planner is also avaluable guide for travel agents.
6.4.2 Touring Route Guides
Development of ‘rejuvenating journeys’ provides a marketing tool to positionTasmania as the country’s premier touring destination. Each touring route willcapitalise on the State’s perceived competitive advantages of wilderness, lifestyleand cultural heritage. By packaging attractions, experiences and commercialtourism facilities into a series of touring guides, travellers will have a definitivepublication for planning the detail of their holiday, and a reference source duringthe journey.
6.4.3 The Tasm anian Visitor Inform ation Netw ork (TVIN)
The network of 20 visitor centres, under the umbrella of the TVIN, has beendeveloped to provide nationally accredited standards of service to travellers. Thecentres provide quality, statewide, 7 days a week service in key tourismdestinations and on key tourism routes.
6.4.4 Road Signage
A joint initiative of Department of Infrastructure, Energy and Resources (DIER)and Tourism Tasmania and supported by Local Government Association of

Cluster Marketing in Tasmania
57
Tasmania, Tourism Council Tasmania and Royal Automobile Club of Tasmania,has been underway for some two years with the express purpose of updating andimproving directional and tourism feature and facility signage.
DIER funds the directional signage component of this project, and a priorityprogram based on the Tourism Development Framework has been established. Afeature of the new directional signage is the use of highly reflective photo signs inkey locations statewide – typically for by-passed towns, major directional changeson the state highway network, and for significant natural attractions such asNational Parks.
Tourism feature, attraction and facility signage has been redeveloped toprovide a state of the art profile in authorised locations on state and localgovernment roads. The new style of signage has been available for installation byoperators since January 2001.
6.4.5 Regional Touring Strategies
The strategic growth of the Drive Tourism market product in Tasmania has beenfacilitated not only by the Tourism 21 industry strategy and the development ofkey attractions and facilities by entrepreneurs, but as well, policy direction ofgovernment has been of substantial assistance.
In addition to the TVIS initiative outlined earlier, State Government hasembarked on a significant partnership program with local government designed toimprove co-operation on a number of fronts, but also to put in place major andminor project opportunities designed to improve economic and social outcomesfor communities.
For tourism, this has enabled the development of regional growth strategiesfocussed on drive tourism in partnership with local government, localcommunities and industry players. The following are two such case studies.
W est Coast Tourism Plan
It is a simple fact that tourism business development and expansion occursbecause individuals or enterprises decide to invest in a particular location. Thedecision is invariably based on taking advantage of the particular assets andstrengths of that location and opportunities to access visitors.
On the West Coast of Tasmania, private sector investment has focused on fivekey hubs – Queenstown, Rosebery, Strahan, Tullah and Zeehan – all of which areat different stages of development. While some are well developed and others areat an embryonic stage, all have the potential to grow and develop as part of theWest Coast Cluster. The development focus has predominantly been within thediscreet locations and little attention has been given to developing the experienceof the journey to and through the West Coast as part of the experience of theregion. The following figure outlines the location of key hubs and attractions.
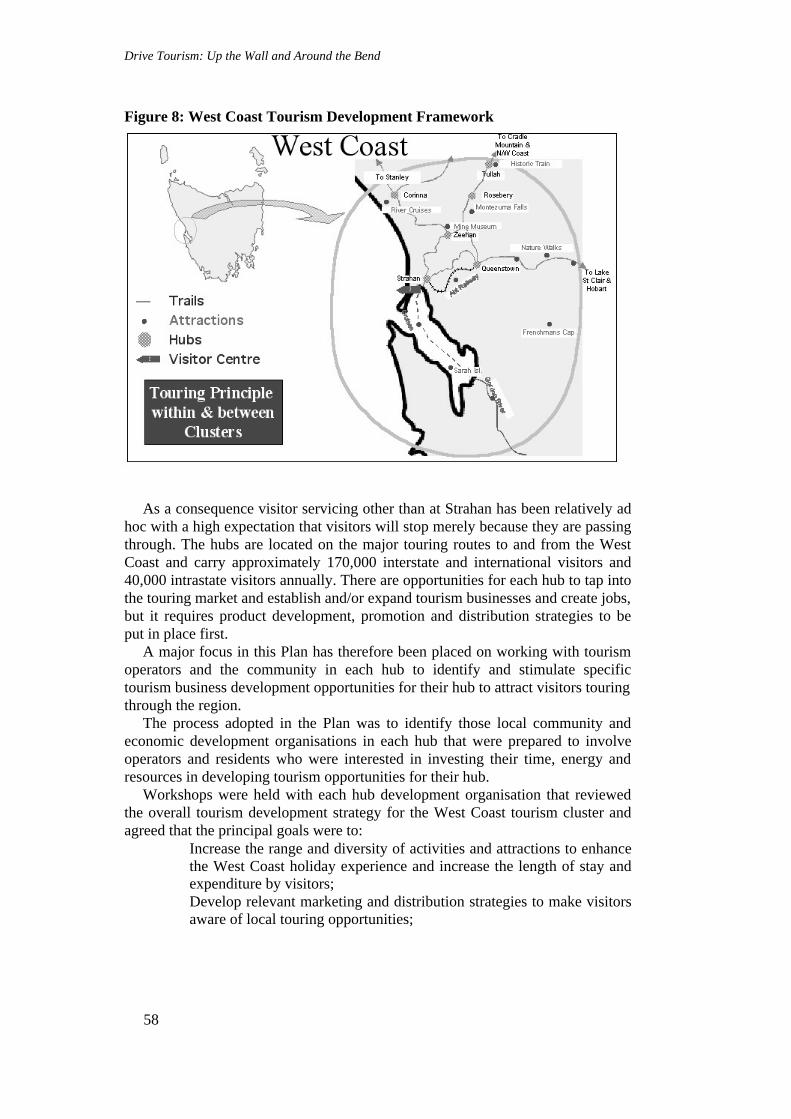
Drive Tourism: Up the Wall and Around the Bend
58
Figure 8: West Coast Tourism Development Framework
As a consequence visitor servicing other than at Strahan has been relatively adhoc with a high expectation that visitors will stop merely because they are passingthrough. The hubs are located on the major touring routes to and from the WestCoast and carry approximately 170,000 interstate and international visitors and40,000 intrastate visitors annually. There are opportunities for each hub to tap intothe touring market and establish and/or expand tourism businesses and create jobs,but it requires product development, promotion and distribution strategies to beput in place first.
A major focus in this Plan has therefore been placed on working with tourismoperators and the community in each hub to identify and stimulate specifictourism business development opportunities for their hub to attract visitors touringthrough the region.
The process adopted in the Plan was to identify those local community andeconomic development organisations in each hub that were prepared to involveoperators and residents who were interested in investing their time, energy andresources in developing tourism opportunities for their hub.
Workshops were held with each hub development organisation that reviewedthe overall tourism development strategy for the West Coast tourism cluster andagreed that the principal goals were to:
• Increase the range and diversity of activities and attractions to enhancethe West Coast holiday experience and increase the length of stay andexpenditure by visitors;
• Develop relevant marketing and distribution strategies to make visitorsaware of local touring opportunities;
Cluster Marketing in Tasmania
59
• Review the current tourism features, products and services in each huband its visitor appeal and tourism development strengths;
• Identify priority tourism development opportunities that mightcontribute to these goals;
• Identify infrastructure and related requirements including visitorcentres, tourism road signage, visitor pull over sites, toilet and restareas; and
• Identify job and training needs.The Plan has been adopted by the local industry and the West Coast Council
and is now in the process of implementation. The outcome of the strategy will bean enhancement of touring opportunities for visitors to the region and a substantialimprovement in the economic contribution from tourism to the local economy.
Southern Touring Route Strategy
A key strategy in the 2001/02 Southern Tasmanian Tourism Business Planprepared by Tasmania’s South Regional Tourism Association (TasSouth), theSouthern Tasmanian Tourism Task Force (which represents the 12 SouthernCouncils) and Tourism Tasmania is to prepare local tourism plans for each of thefive touring routes/trails in Southern Tasmania.
Figure 9: Hobart and South Tourism Development Framework
The strategy is based on the principle of the Tourism Development Frameworkand embraces the concepts of clusters, hubs, touring routes and trails as well asthe application of ‘Tasmanian’ brand values. The aim is to integrate the range ofattractions and experiences relevant to the specific hubs in each of the Councilareas and along the touring routes/trails. Specifically, the local plans will

Drive Tourism: Up the Wall and Around the Bend
60
coordinate market, product and infrastructure development proposals and ensureeach touring route/trail has different, exciting local touring and activities visitorswant to experience.
The strategy is a means to spread the benefits from tourism throughout thebroader Southern Region. The ultimate outputs will be:
• Collateral in the market place which enables visitors to find out whattourism products are available through the region and provides a clearunderstanding of how to experience them;
• Road signage which highlights elements of the touring routes totravellers using the principles contained in the State GovernmentsTasmanian Visitor Information System initiative and complimentingexisting themed initiatives such as the Huon Trail and the ConvictTrail; and
• A strategic focus for the development of new tourism infrastructure(including supporting infrastructure such as public amenities) andproduct.
The strategy will:• provide visitors with the opportunity to choose a range of activities
extending over several days and for the industry to maximise visitorsatisfaction and spending opportunities; and
• maximise industry, Councils and stakeholder commitment toimplementing the plans.
6.4.6 Roadside Facilities and Scenic View points
The variety, standard and location of rest areas, lookouts, feature walks and otherfacilities at the roadside are important to tourist experience and comfort. Touringis enhanced by the provision of appropriate infrastructure, such as picnic areas,lookouts, tourist information bays and toilet facilities.
Complimenting the Development Framework, the Department ofInfrastructure, Energy and Resources in partnership with Tourism Tasmania hasundertaken a review of roadside facilities along the major ‘journeys’. The studyexamined three types of facilities:1. Rest areas: for example, toilets, running water, seating and shaded areas,
providing drivers with an opportunity to stop, rest and refresh;2. Picnic facilities: for example, barbeques, picnic areas and play equipment
catering to travellers wishing to have a longer stay, including self-drivevisitors; and,
3. Feature stops: for example, lookouts and nature trails providing visitors withan opportunity to appreciate and photograph the varied scenery acrossTasmania in short, manageable stops which do not disrupt the journey. Theidentification of safe pull-over areas also avoids the tendency of drivers to pullover in unsafe and undeveloped locations.
The Review has identified a number of strategic opportunities to enhancevisitor satisfaction and an implementation program is currently being developedas part of the state government/local government partnership program through theregional touring strategies.

Cluster Marketing in Tasmania
61
6.5 ConclusionIntervention in the market place to provide a quality visitor outcome is theintention of the Tasmanian tourism industry with its Drive Tourism Program.Without this intervention touring through Tasmania would be consigned toincremental growth based on development only in key locations by entrepreneurs.Given that poor tourism experiences can result from inadequate levels of publicinfrastructure and supporting programs the industry and government interventionis both welcome and necessary.

Chapter 7
The Great Green Way
Christian Ware and Samuel Budge
7.1 IntroductionThis chapter offers lessons for others interested in promoting to drive tourists. Theprimary mechanism being used to promote the Great Green Way is a brochure.The brochure provides information about the various attractions the region has tooffer; a tourist style map of the region; information about travelling times anddistances; helpful tips regarding safety issues and how to treat the environment;and contact details of the tourist information centres within the region.
The brochure campaign was launched to coincide with the Christmas schoolholiday period in December 1996 and has continued to operate since then.Distribution of the brochures has been primarily through tourist informationcentres, petrol stations, caravan parks, the RACQ and other motoringorganisations, and car rental agents. In addition, the Great Green Way has alsobeen promoted at various holiday and travel shows, camping and caravan shows,fishing expositions, and 4WD shows.This campaign has been developed with the aim of increasing the length of timevisitors spend in the region, and is aimed at two key target markets:1. Self drive visitors to the region (both domestic and international); and2. Local residents of both Cairns and Townsville taking short breaks (Great
Green Way Action Plan 1996/97).
7.2 BackgroundDavidson and Wiethauft (1989) identify a trend within the destination marketingfield whereby increased accountability is being demanded of those responsible forregional tourism promotional campaigns. It is against this emerging culture ofgreater accountability that this study of the Great Green Way promotionalcampaign is based, with the primary aim of the study being to provide anindication of the campaign’s success as justification for its continued financialsupport and backing from the region’s various tourism industry stakeholders.Success here can be measured by increased visitation to attractions and/orextended stays.
Various studies have been conducted investigating the profile of those mostlikely to seek destinational information (primarily in the form of brochures andmaps) from visitor information centres, or to request such information prior to thecommencement of their travels. Research by Fesenmaier and Vogt (1993) andFesenmaier (1994) revealed that the majority of interstate self drive travellers in

Drive Tourism: Up the Wall and Around the Bend
64
the USA tended to undertake a low level of information search prior to leavingtheir homes and a high level of information search once en route, the second ofthese studies finding that only 28% of respondents visiting Illinois consultedtravel information sources before leaving home whilst 54% obtained travelinformation en route. These findings have important implications with respect tothe timing and distribution points at which destinational information targeted atself drive tourists should be made available.
Wicks and Schuett’s (1991) study of potential travellers who requestedbrochures via the mail revealed that brochures were an important source ofinformation for travellers on shorter weekend breaks and day trips, whilst Gitelsonand Crompton’s (1983) study in Texas revealed that brochures were used to asignificantly greater extent by those travelling longer distances and by those ontrips of longer duration. The findings of Gitelson and Crompton were partiallyconfirmed by Etzel and Wahlers (1985) who found that those undertaking trips oflonger duration had a greater propensity to seek destination related information.
Fesenmaier, Vogt and Stewart (1993) found that the style of travellers mostlikely to be influenced by destinational information collected en route fell intothree categories; those on short breaks close to home, those touring (or self driveholiday makers), and outdoor recreationalists. Etzel and Wahlers (1985) indicatedthat those seeking destinational information tended to have higher tripexpenditures and spend a longer period of time on vacation. Destinationalinformation appears to be more sought after by educated and/or affluent people(Gitelson and Crompton 1983; Etzel and Wahlers 1985, Tierney 1993; Etzel andWahlers 1985). It also appears that action-oriented as opposed torelaxation-oriented vacations (Gitelson, and Crompton 1983; Etzel and Wahlers1985), and by those seeking a well planned vacation (Gitelson and Crompton1983), tend to seek out brochures more enthusiastically than their counterparts.
Kim, Weaver and McCleary (1996), in examining the travel information searchpatterns of the seniors market, noted that the more ‘active knowledge seekingtravellers’ were likely to utilise destinational information and that those seniortravellers who were either visiting friends or relatives, or seeking relaxation wereless likely to utilise such information. Snepenger, Meged, Snelling and Worrall(1990) suggest that visiting friends and relatives (at the destination), pastexperience visiting the destination, and novelty associated with the destination,have a large influence on the extent to which destinational information is sought,concluding that destination naive visitors (those visiting for the first time and notvisiting friends or relatives) will place a greater reliance on such materials.
The concept behind the Great Green Way promotional campaign is very muchin the ilk of that prescribed by Perdue (1986) with regard to ‘travel-throughregions’ in Nebraska, with the primary aim being to get visitors travelling betweenthe region’s two major centres (Townsville and Cairns) off the highway to visitregional attractions and centres that might otherwise be passed by unnoticed.Gunn (1988a) states that the availability of different attractions within reasonablegeographic proximity of each other strengthens a region’s drawing power with thevariety offered by the region enabling a wider spectrum of the travel party’s needs
The Great Green Way
65
to be satisfied. The challenge in such instances is for tourism stakeholders tomarket the region in a cooperative fashion, which recognises the complimentarystrengths of the region’s diversity, ahead of individual interests.
Cooperative marketing campaigns, such as that undertaken by the Great GreenWay Management Committee, are advocated by Richardson and Cohen (1993) onthe grounds that they create regions that are more able to develop a ‘unique sellingproposition’ which is easily identified and applied in the mind of the prospectivetourist. Richardson and Cohen (1993) argue that regional marketing should bebased on cooperative efforts between adjoining locations, which share acommonality in terms of geographic and/or cultural features, as opposed toregions specified in terms of pre-defined political boundaries. Such a multi-destinational approach to promoting tourism creates an understanding of thelinkages within a region, which in turn, better facilitates an effective marketingcampaign (Lue et al. 1993). The Great Green Way promotional campaign hasinvolved cooperative marketing at both the local and regional tourism authoritylevels.
Contrasting views exist in the literature as to the extent to which brochuresinfluence travel decisions, with the predominant view being that in the majority ofinstances brochures play more of a secondary or informing role in tourists’decision making processes to ‘word of mouth’ advice received from friends andrelatives and/or travel consultants (Wicks and Schuett (1993), Getz and Sailor(1993), Burke and Gitelson (1990), Ashworth and Goodall 1988, Gitelson andCrompton 1983). However, promotional brochures do increase awareness (Baas,Manfredo, Lee and Allen’s (1989).
Factors found to influence the extent to which destination specific material isused by and/or influences potential visitors travel decisions include; the traveller’spast experience with a given destination in the form of previous visits to that site(or others perceived as similar), with past experience resulting in a reduction inthe use/influence of destination specific materials relating to that site (Etzel andWahlers 1985; Zhou 1997); the individual’s level of travel experience in general,with those individuals having made more trips overall, being more likely to utilisedestination specific material (Etzel and Wahlers 1985); and the perceivedusefulness of the brochure in question, with positive evaluation by the potentialvisitor resulting in a greater likelihood of visitation to the site in question(Zhou 1997).
Given the inconsistency in research findings relating to brochure influence andusage, it is important to determine whether the Great Green Way brochure playeda role in the destination visit and if it did whether that role was as a determinant ofthe visit or as a source of supporting information (Burke and Gitelson 1990).
7.3 MethodologyBecause we had identified measures of success it was important to be able todistinguish if a change has occurred as a result of the brochure. In light ofFesenmaier’s (1994) comments that the majority of self drive travellers indulge in
Drive Tourism: Up the Wall and Around the Bend
66
high levels of information search once en route, and Gitelson and Crompton’s(1983) remarks regarding the importance that brochures be made available in themost appropriate location and time periods within the travellers trip planninghorizon, it would seem that many prospects are likely to enter the Great GreenWay region oblivious to the many opportunities that it presents. Hence anindication of awareness was a starting point for assessing the success of thepromotional activity. An analysis of the increases in the measures reported bythose who are unaware of the Great Green Way will help determine the success ofthis promotional program.
This situation would seem to demand that any analysis of the brochure’simpact be addressed according to three main antecedents:1. awareness of the Great Green Way as disclosed by participants;2. increased visitation to attractions as a result of increased awareness from the
brochure as reported by participants; and3. increased overnight stays as a result of motivation to undertake activities
mentioned in the brochure as reported by participants.As a consequence of these antecedents being highlighted, a self administered
questionnaire was developed and administered to 603 self drive tourists during athree month period extending from the 24th of March to the 23rd of June 1998.Potential participants in the visitor survey were approached using a conveniencesampling method based around visitation to information centres. Respondentswere asked to indicate whether or not they had been aware of the Great GreenWay as a region prior to their visiting an information centre, what changes to theirtravel patterns had arisen in both attraction visitation and also in terms of extranights spent in the region.
7.4 ResultsThe results revealed that only 24.4% of respondents were aware of the GreatGreen Way prior to their participation in the study. A lower than expectedproportion of intrastate visitors were aware of the Great Green Way (39.5%)whilst a higher than expected proportion of interstate visitors were aware of theGreat Green Way (19%). Interestingly, 85.8% of respondents to the visitor surveyindicated that using the brochure had resulted in them visiting additionallocations/attractions, with an average of 4.3 additional sites being visited by thosewho were influenced. Of those reporting having visited additional sites, 51.2%had in turn reported spending an average of 3.1 extra nights in the region.
Respondents who were predominantly on a touring style holiday (91.5%)indicated that they were more likely to visit places as a direct result of using theGreat Green Way brochure than respondents who stated a specific destination(78.8%).
Short-term travellers indicated that the brochure had less of a direct result of onincreased visitation to attractions (77.5%) than long-term travellers (96.7%). Notsurprisingly, a lower than expected proportion of short term travellers indicatedspending extra nights in the region as a direct result of using the Great Green Way

The Great Green Way
67
brochure (32.9%) compared to medium and long term holiday makers (59.0% and63.8% respectively).
Amongst the 85.8% of respondents who indicated visiting places within theGreat Green Way region as a direct result of using the brochure, the resultantmean number of additional locations visited within the region was 4.3 with amedian value of 3.0. The most commonly noted number of additional locationsvisited as a result of the brochures use was one (19.6% of responses) and themaximum number recorded was twenty-three. Of these respondents, 44% had hadno original plans with respect to visiting locations in the region, and 51.2%indicated that such visits had resulted in extra nights being spent in the region.
The average number of extra locations visited as a direct result of using thebrochure, among those respondents indicating the brochure had influenced theirtrip decisions was 4.3, confirming the strong and highly beneficial influence of thebrochure in persuading visitors to spend additional time in the region. Intrastatevisitors were likely to visit a significantly higher number of additional places thanwere international visitors, possibly due to international visitors pre planning theirtrip through the region to a greater extent and/or international visitors being onmore restrictive time budgets.
These results indicate that the Great Green Way brochure has been successfulin influencing visitors to the region to visit additional attractions/locations and asa consequence, in many instances, spend extra nights in the region. In addition toplaying a vital role in influencing visitors to the region to visit additionalattractions/locations in the region the brochure also fulfilled an important role as auseful source of supplementary information for those visiting sites, which formedpart of their original trip plans. Among the 59.3% of respondents indicating thatthey had visited sites as part of their original trip plans 87.6% indicated that thesevisits were a direct result of the brochure.
7.5 ConclusionThis cooperative promotional campaign aimed to stimulate the awareness of a‘through traveller’ (Lue et al. 1993) to an inter-connected set of attractions in theGreat Green Way. The strategic aim being to create a desire in travellers to visitthe attractions in the area. Undertaking this strategy has clearly increasedvisitation to the region’s attractions and has resulted also in increased usage oflocal accommodation. Such an approach bases its strengths on the cumulativedrawing power of a complementary set of attractions (Wall 1983). Therespondents to this study demonstrated a positive response to being made aware ofthe diversity of tourism opportunities available in the region. While it is notpossible to suggest that equity exists in terms of partner contributions andreceived benefits, it is clear that cooperative marketing changes the strategicpossibilities of operators, and therefore regions. As partners recognise that theirformer competitors are in fact seen as ‘complementary and agglomerative’ by theprospective tourist, the greater the possibilities of achieving better overall results.
Cooperative marketing ventures between operators and regional tourism

Drive Tourism: Up the Wall and Around the Bend
68
authorities enable economies of scale through the sharing of campaign expenses;but more importantly, they reduce the amount of advertising clutter that resultsfrom an individualistic and competitive approach to regional development throughtourism. Although this chapter has utilised the brochure as an example of thepossibilities for cooperative approaches that can demonstrate measurableoutcomes. It should be noted that the cooperative marketing approach taken in theGreat Green Way drive route is only one component in a comprehensivemarketing strategy.
Chapter 8
The Problem of BypassedTownships
Ian Kelly and Mike Spark
8.1 IntroductionGeographical factors contribute strongly to the presence of tourism as a leisureactivity and to the success or otherwise of tourism-related commercial operations.Among the geographic concepts useful in the analysis of drive tourism are spatialinteraction, the friction of distance, the gravity model and accessibility.
At a broad level, the flow of leisure travellers from generating to destinationregions may be explained in terms of spatial interaction, defined as purposefulmovement from one location to another. Spatial interaction occurs only wherethere is complementarity, the existence in one location of demand that can be metby a supply in another location. Furthermore, this supply-demand relationship canbe implemented only if there is transferability, some means of bringing supplyand demand together, and absence of an intervening opportunity (an alternativesource of supply which can meet the demand at less cost).
Thus, a demand for warmer weather among Melbourne residents stimulatestemporary migration to tropical Cairns, a movement made possible by transportfacilities. However, for some travellers this Melbourne-Cairns interaction will nottake place if their needs can be met at less cost by visiting the Gold Coast, a closerdestination, or even Bali, which, despite the greater distance involved, may beseen to offer better value.
In fact, distance is another major geographic factor. Records of spatialinteraction show a negative correlation between frequency and distance; that is,the greater the distance between locations, the less frequent the movementbetween them, explained by the increase in cost, time and effort involved inovercoming the ‘friction of distance’. For many potential travellers, transferabilityis denied because of an inability to meet the costs of transport, and maps of touristflows demonstrate that most leisure trips are conducted relatively close to home(Pearce 1995).
However, the Gravity Model, based on Newton’s gravity equation, introduces acomplexity to this explanation of human activity flow patterns. It notes thatinteraction between two locations is positively related to their mass (commonlyexpressed as population) and negatively related to the distance between them. In atourism context, the model suggests that interaction is likely to be greatestbetween locations where population is large and the provision of visitor facilitiesmost highly developed. Thus, in Australia, the heaviest tourist traffic is betweenthe metropolitan centres, although this circumstance disguises the extent to which
Drive Tourism: Up the Wall and Around the Bend
70
these are gateways to other destination areas.The dominance of the metropolitan centres stems from the advantages they
possess with respect to accessibility. Historically, intensity of human activity andinnovativeness have been greatest in locations where site and situation attributeshave encouraged a convergence of routeways, bringing about a sharing ofknowledge among people with differing experiences, and accelerated economicdevelopment (Friedmann 1975). The converse, of course, is a relative lack ofdevelopment in locations lacking accessibility.
This is a problem that has been faced by a number of townships, in Australiaand elsewhere, whose accessibility to motor vehicle traffic has been reduced byhighway redevelopment.
8.2 BackgroundA number of reports have indicated that Australia’s rural population has declinedin recent times, with some areas experiencing a loss of up to 40 per cent over thelast two decades. Contributory factors, matched to varying extents in otherindustrialised countries (Page and Getz 1997), include reduced employment inagriculture and the attraction of educational, social and other facilities available inthe metropolitan centres.
Loss of population leads to reduced demand for the services provided in ruralvillages and townships. The situation is worsened by improvements in transporttechnology and highway reconstruction aimed at reducing travel time betweenlarger centres by bypassing smaller centres, but also making it easier for ruralresidents to access larger centres for central place functions such as banking andretail purchases. Rationalisation, based on pursuit of scale economies, has beenreflected in withdrawal of such services from rural centres, contributing further tothe cycle of population decline.
Being bypassed can have dramatic effects on townships, many of whichdepended at least to some extent on the business generated by accessibility tohighway traffic. A Bureau of Transport and Communications Economics report(1994) noted that while some residents appreciate the increased safety andquietness associated with traffic diversion, those who depend on traffic-servingbusinesses suffer loss of their livelihood.
It is claimed in the report that bypass economic impacts are generally moreadverse for small townships. However, the study of two New South Walesbypassed towns, Mittagong and Berrima, indicated the more recently bypassedcentre, Mittagong (population about 4200), appeared to be experiencing at leastshort-term decline in business activity, while Berrima (population about 650),noted for its well-preserved colonial buildings, had enhanced its tourism appeal,with a consequent shift in business activity from retailing to accommodation.
Deloraine, in North-West Tasmania, was bypassed in 1988. A Meander ValleyCouncil officer claimed that the town had become more prosperous, and attributedits successful adaptation to its very active community organisations; carefullynurtured links with local art, craft and food producers; promotion of its function as

The Problem of Bypassed Townships
71
a gateway to nearby attractions; appropriate highway signposting; and thedevelopment of a large artistic exhibit as a key town attraction.
These observations appeared to constitute evidence that townships incurringhighway bypass may be cushioned to some extent by the presence of resourcesaround which the township could be developed as a tourist destination.
8.3 The InvestigationGeographical studies suggest that successful adaptation to bypassing relates tosurvival as a central place; that is, a location to which people from the surroundingdistrict travel to purchase household goods and personal services and to socialise(Berry 1967). Significance as a central place may be assessed by identifying thenumber of central place functional outlets, establishments where such goods andservices are made available to members of the public. In general, they includeretail shops, personal and professional services, and meeting places.
A field survey was conducted, listing the functional outlets in 15 smalltownships (population under 2500) bypassed as the result of highway redirection.They included four townships bypassed by the Bass Highway in North-WestTasmania (Hadspen, Carrick, Exton and Deloraine), five by the Midland Highwayin Tasmania (Evandale, Ross, Oatlands, Tunbridge and Kempton), and six by theDukes and Western Highways connecting Melbourne and Adelaide (Hahndorf,Tailem Bend, Bordertown, Dimboola, Keith and Ballan). The location of eachtownship in relation to larger centres is shown in Figures 10 and 11.
As noted, central place retailing caters for general household requirements.Among the townships surveyed, the most common outlet type in this category isclothing (new) and there is substantial representation of supermarkets and grocerystores; meat, fish and poultry; and hardware and machinery. Personal andprofessional services are most strongly represented by hairdressing and beautytreatments, public houses and property agents. Central places also contribute tothe social needs of communities by providing meeting locations, and almost allthe townships surveyed contained one or more meeting places (apart from publichouses) in the form of clubs and/or churches.

Drive Tourism: Up the Wall and Around the Bend
72
Figure 10: The Bass and Midland Highways (Tasmania)
Figure 11: The Dukes Highway (South Australia) and Western Highway(Victoria)

The Problem of Bypassed Townships
73
Table 16: Central Place Function Outlets
Locality Pop. (1996) Retailoutlets
Serviceoutlets
Meetingplaces
Total
Bordertown 2337 33 18 2 53
Deloraine 2168 36 17 2 55
Hadspen 1730 0 0 1 1
Hahndorf 1727 28 14 3 45
Dimboola 1557 23 7 0 30
Tailem Bend 1488 12 4 1 17
Ballan 1414 16 7 2 25
Keith 1089 26 14 2 42
Evandale 1033 2 2 4 8
Oatlands 539 19 11 0 30
Carrick 331 1 1 3 5
Kempton 327 1 1 3 5
Ross 275 5 1 4 10
Tunbridge – 0 0 1 1
Exton – 1 0 1 2
Total 16015 203 97 29 329
Table 16 shows the distribution, in broad categories, of central place functionaloutlets in the 15 townships. A strong presence of these retail, service and meetingprovisions indicates that a township is maintaining its central place role, despitethe improvements in travel time to alternative centres. The information in Table8.1 suggests a positive correlation between township population and the totalnumber of central place outlets (Pearsons Product Moment CorrelationCoefficient, r = 0.7). The anomalous position of Hadspen may be explained by itsproximity to the city of Launceston to which most of the population can easilycommute for employment and shopping. It is also too close to Launceston toconstitute a rest stop for travellers using the Midland Highway. Smallersettlements such as Oatlands and Keith continue to service prosperous farmingareas, and probably benefit from their relative remoteness.
The extent to which a township is dependent on, or is successfully catering forvisitors (i.e., people not residing in the immediately surrounding district) may beindicated by provisions for dining out (restaurants, cafes, takeaways and bakeries),sales outlets for tourist-oriented items (art and craft goods, antiques, gifts andsouvenirs), and accommodation houses (hotels, motels, guesthouses and bed andbreakfast establishments).

Drive Tourism: Up the Wall and Around the Bend
74
Table 17: Visitor-oriented Function Outlets
Locality Pop. (1996) Dining Out Touristshops
Accom. Total
Bordertown 2337 8 1 2 11
Deloraine 2168 11 5 5 21
Hadspen 1730 0 0 0 0
Hahndorf 1727 37 44 6 87
Dimboola 1557 4 8 2 14
Tailem Bend 1488 6 0 1 7
Ballan 1414 3 1 2 6
Keith 1089 9 7 1 17
Evandale 1033 8 6 3 17
Oatlands 539 7 16 4 27
Carrick 331 3 2 0 5
Kempton 327 2 5 2 9
Ross 275 7 11 7 25
Tunbridge – 1 2 1 4
Exton – 0 1 0 1
Total 16015 106 109 36 251
Table 17 shows the distribution of these functions, and it is clear that there islittle correlation with population size (r = 0.2). Hahndorf is by far the largestprovider of visitor services, but these are also of major importance in the smallercentres of Oatlands and Ross. It is noted that those three townships are alsorelatively better served with central place functions than other townships.
Table 18: Total Outlets (Location Quotients)
Locality Pop. (1996) Total outlets Location Quotient
Bordertown 2337 64 0.66
Deloraine 2168 76 0.85
Hadspen 1730 1 0.01
Hahndorf 1727 132 1.85
Dimboola 1557 44 0.68
Tailem Bend 1488 24 0.39
Ballan 1414 31 0.53
Keith 1089 59 1.31
Evandale 1033 25 0.58
Oatlands 539 57 2.56
Carrick 331 10 0.73
Kempton 327 14 1.03
Ross 275 35 3.08

The Problem of Bypassed Townships
75
Locality Pop. (1996) Total outlets Location Quotient
Tunbridge – 5 –
Exton – 3 –
Total 16015 580
Table 18 shows the distribution of combined central place and visitorprovisions, and uses a location quotient to demonstrate the level of provision inrelation to population. The location quotient is a measure of the extent to which anattribute is present in a location in comparison with a set of locations of which it isa part. In the present context, it has been calculated as follows:
• LQ = (ls/lp)/(TS/TP), where• ls = the number of services in a locality• lp = the locality population• TS = the total number of services in the surveyed localities• TP = the total population of the surveyed localities (excluding
Tunbridge and Exton).A Location Quotient of 1 indicates a presence of services matching the average
for that population size. Above or below average presence is indicated by valuesgreater or less than 1 respectively. It should be noted that the number of outletsprovided exceeds the number of establishments, as some provisions are combined(e.g. groceries and take-away food).
The locality maintaining the largest number of services for its population isRoss, followed by Oatlands, Hahndorf , Keith and Kempton, all with LQs greaterthan 1. The dearth of services in Hadspen is again highlighted.
8.4 DiscussionThe above findings, and observations conducted in the field, suggest that factorsinfluencing the survival and prosperity of the surveyed bypassed townshipsinclude:
• Population level. There appears to be a threshold population belowwhich revival after bypass is unachievable. In the sample, the twosmallest townships were marked by numerous vacancies and ‘For Sale’signs and are no longer recognised by the Australian Bureau ofStatistics as named localities for census purposes. However, there is nogeneral correlation between the total number of functional outletsavailable and the population of a township (r = –0.05).
• Proximity to a larger urban centre. In some instances townships haveattracted or retained a resident population of commuters sufficient tosupport the continuance of retail outlets and services (e.g. Evandale).However, where the township residents choose to shop in the centrewhere they are employed, the township may retain very few centralplace functions (e.g. Hadspen), and constitute no more than a dormitorysuburb.
• The prosperity of the surrounding region. Townships which have

Drive Tourism: Up the Wall and Around the Bend
76
traditionally existed to service the farming community of the areaappear to have maintained that function where farming continues tothrive (e.g. Oatlands). Indeed, it was indicated that following thebypass, the township of Oatlands became more attractive to nearbyrural residents as a place in which to conduct the weekly shopping.
• Continued service to travellers. A few settlements maintain their linksto the travelling public by establishing comfort stop arrangements withscheduled coach services (e.g. Oatlands, Tasmania; Bordertown, SouthAustralia). There is a spillover effect in that the service becomes knownto and used by car travellers.
• The presence of tourism resources. Among the townships surveyed,successful adaptation to highway bypassing appears to relate to factorswhich include the presence of colonial constructions (houses, churches,bridges, etc) (e.g. Ross and Evandale) or a distinctive ethnic character(e.g. Hahndorf). Some settlements have built on their gateway role,servicing travellers to and from nearby attractions (e.g. Deloraine andOatlands).
It is submitted that, while there are a number of factors contributing to post-bypass maintenance of township economies, there is strong evidence to supportthe contention that, with respect to the sample examined, tourism has played animportant part, with the small Tasmanian township of Ross as the clearestillustrative example. The following is therefore a case study identifying theconsiderations involved and processes implemented in the adoption by Rossresidents of a tourism strategy.
8.5 Adoption and Im plem entation of a Tourism StrategyRural tourism is generally distinguished by a wide dispersal of attractions andactivity settings. However, within broad rural environments, villages and smalltownships (such as those examined in this investigation) constitute minorsettlement nuclei whose economies may be enhanced by an ability to attractvisitors. It is also true that, where there are established settlements, tourism is seenas placing few demands on public resources, requiring only access provisions,roadside and site markers, cleanup services and marketing. It is expected thatmore costly investments – accommodation, restaurants and entertainment facilities– will be provided by the private sector (Frederick 1993).
The Tasmanian township of Ross was bypassed by the Midland Highway in1972. The decision by residents to adopt a tourism strategy was preceded by acommunity consultation process guided by the principles of shared decision-making and collaboration (more recently highlighted by Williams et al. 1998 andMarcouiller 1997, respectively). These involve achieving consensus through anegotiation process which includes all stakeholders and recognises theinterdependence among them.
Support for the tourism proposal was followed by the appointment of amanagement committee charged with developing a plan based on a SWOT(Strengths, Weaknesses, Opportunities and Threats) analysis of the township as a

The Problem of Bypassed Townships
77
visitor attraction. This included an inventory of the natural, built and culturalresources (present or potential) to which visitors could be drawn along with theidentification of additional facilities (e.g. accommodation, public toilets, car andcoach parking, picnic areas) required to meet the needs of visitors.
The management committee continues to recognise the role of presentation andthe development of additional attractions in the success of the township. With alarge number of appropriate structures, Ross offers a colonial heritage experience,and as far as possible everything visible is consistent with that theme. Oldbuildings are preserved and new ones designed to match them. Township signs(no longer intended to catch the eye of motorists on the highway) are subdued,and make use of colours and print styles of the 19th century. The main street iskept spotless, and even the householders contribute with the quality of theirgarden design and maintenance. A number of dishes offered in the restaurantsreflect the colonial theme.
The visitor experience is further enhanced by interpretation – an educationalprocess contributing to understanding and appreciation of the significance andunique character of the township. This is in the form of brochures, notice boards,plaques and tour guide commentaries.
It is also recognised that visitor activities must be in keeping with theatmosphere created. These include carriage rides, guided walks and museum,historic site, workshop and gallery visits. The Tasmanian Wool Centre,commemorating the major product of the surrounding area, was established as abicentennial project in 1988. Tourism sidelines (Kelly and Dixon 1991) by localfood and/or beverage producers are encouraged. Classes are organised by localartists and craftspeople and workshop interviews arranged.
The popularity of shopping has not been ignored. Vehicular traffic movementis controlled, and easy walking surfaces provided. Large, shady trees encouragepeople to adopt a leisurely pace as they move from one sightseeing spot toanother, past the various shops. Merchandise items such as souvenirs are generallyconsistent with the chosen theme, and many are locally crafted.
The provision of adequate quality accommodation not only boosts theemployment base, but is necessary for retention of visitors overnight or longer.Unlike highway or city accommodation, bypassed township accommodationcannot attract guests merely by virtue of convenient location, and must developspecialist appeal and be consistent with the township theme in architectural styleand furnishings. In townships such as Ross, it may take the form of colonial bedand breakfast establishments, guesthouses, country inns, serviced cottages orhome hosting – usually small, owner-operated businesses distinguished by a highlevel of personal service and host-guest interaction. Given the relative remotenessand small size of the townships, it has been necessary to arrange for in-housetraining during off-peak trading hours to ensure appropriate quality in the deliveryof hospitality services.

Drive Tourism: Up the Wall and Around the Bend
78
8.6 Establishing the Township PresenceBypassed townships remain advantaged to the extent that nearby highways stillprovide quick and easy access for motor-vehicle travellers. However, whileappropriate signage is important in drawing travellers from the highway, there is arequirement to adopt a strategic marketing approach to ensure longer-termtownship viability and progress.
For settlements like Ross, there is the ability to offer a number of benefits tothe drive tourism market, likely to include travellers stopping only for food and/orfuel; short-term visitors undertaking casual sightseeing; visitors drawn by specificevents, attractions or activities; day-trippers (tour or family groups) incorporatingthe township in a larger tour; and short-break visitors staying overnight or atweekends in local accommodation.
The ability of a small township to compete as a destination may depend on thepromotion of a unique or outstanding feature, natural or cultural, but morecommonly there is reliance on a combination of elements (WREP 1998). Getz andPage (1997) note that the tourism appeal of rural areas relates to:
• remoteness, isolation, solitude, peace and quiet;• undisturbed nature and aesthetically pleasing landscapes;• access to ‘authentic’ cultures (ethnic, traditional and native);• heritage sites and buildings;• a perception of safety, hospitality, and relative exclusivity (not mass
tourism);• enhanced lifestyle opportunities (including foods and beverages); and• adventure experiences.
‘Nostalgia tourism’ is a term coined to encompass the growing interest inexploring the rural or small town lifestyle as a means of escape from the pressuresof modern life (Creighton 1997). Many bypassed townships have historical sitesand heritage assets which are becoming more highly valued as our relativelyyoung nation matures, and opportunities may be taken to promote these, perhapsthrough festivals celebrating a settlement’s culture or history.
The provision of a caravan park is necessary to tap into a growing market, theso-called ‘gray nomads’, freed by retirement from the restrictions of workschedules, and able therefore to counter the fluctuations in weekly and seasonalvisitation. Equipped with their own cooking facilities and transportation, thesecaravan travellers tend to patronise local outlets for their food supplies and use thepark as a base from which to visit a range of attractions in the district.
Another potential market is the conference sector. Substantial financial benefitsmay be derived from hosting even small meetings, and these may be enhanced bythe establishment of a good reputation with business organisations and returnvisits, perhaps with family, by participants who enjoyed their initial experience ofthe place.
More generally, however, there should be an emphasis on relationshipmarketing, with one approach directed to turning visitors into advocates. Forexample, return visits may be encouraged by the establishment of ‘villager clubs’(Creighton 1997) involving newsletters to visitors who have recorded their contact

The Problem of Bypassed Townships
79
details (with comments) in a village register. Advocacy can also be pursuedthrough partnership arrangements with supplier organisations such as attractionoperators and coach and car rental companies, whereby visitors may be offereddiscounted packages which cover admission, transport and accommodation.
It should be noted that the benefits of the Internet are available to bypassed(and other rural) townships, contributing to a situation in which effective, wide-reaching promotion is no longer exclusive to the larger organisations withsubstantial financial resources. The Internet will lead to more ‘place wars’ (Kotler,Haider & Rein 1993) by enhancing market reach, but it also increases the capacityfor collaboration among service and product providers in the township andneighbouring areas and with regional, state and national organisations.
As noted, the major tourism assets of bypassed townships are typically of aphysical, cultural or heritage nature, often belonging to the community at large butsupplemented by the assets and efforts of private operators. However intangibleassets such as community values, hospitality and lifestyle are equally importantcomponents of the package to be promoted to the world at large, and collaborationby all involved in the community is essential to the success of township marketingor re-imaging projects. Internal tensions communicated to visitors may cause themto look for alternative destinations offering an experience more consistent withtheir expectations.
Even competition among townships should be tempered by an appreciation ofthe value of collaboration which allows the sharing of regional and localpromotional and administration expenses, and greater reach through the combinedefforts. For example, Ross is joined with other townships in promotions ofTasmania’s Heritage Highway, directed at travellers with an interest in Australia’scolonial background.
In summary, it is submitted that, for bypassed townships, success in targetingthe drive tourism market will depend on the following:
• Retention of a relatively easy link to a major highway;• The presence or creation of attributes with the potential to be tourism
resources;• A consultation process which ensures that all stakeholder views are
taken into account and provides a channel for community support;• A representative management committee to fill a leadership role, seek
and provide informed advice, develop an implementation plan andoversee its continuing operation;
• Measures to ensure visitor safety and comfort;• Accommodation provisions which provide visitors with a ‘taste’ of the
township traditions;• Maintenance of consistency and ‘a sense of place’ in the presentation of
the township’s tangible and intangible facilities and attractions;• Encouragement of visitor interest through appropriate interpretation;
and• Heightened visibility through highway signposting, a presence on the
Internet and collaborative promotion arrangements with othertownships and organisations.
Drive Tourism: Up the Wall and Around the Bend
80
8.7 Cautionary ConsiderationsThe authors recognise that bypassing is only one of the factors contributing torural poverty and a decline in services available. There are areas where high levelsof unemployment and declining purchasing power have resulted from downsizingin or closure of extractive, power-generation and processing industries. Whilesuch localities may benefit from the adoption of a tourism strategy as proposed inthis paper, the focus here has been on townships retaining relatively easy access toa major highway. The strategy may, therefore, be effective in townships notbypassed but placed in proximity to highways as the result of new construction orredirection programs. There may also be parallels with settlements, such asVictoria’s Williamstown, whose significance as a port declined with the growth ofPort Melbourne and a reduction in the demand for sea transport, but which is nowa thriving tourist destination.
It is also recognised that a necessary element of the proposed strategy –funding – has been largely ignored. On the positive side, a tourism strategy asproposed here is likely to be encouraged by Australian governments, from local tonational, as having the potential to contribute to the objectives of decentralisation,provision of rural employment and heritage conservation. The planning processshould, therefore, incorporate efforts to attract government (and other) funding,especially in the early implementation stages.
It must be noted that not all bypassed or otherwise depressed townships willhave the colonial buildings of Ross or the ethnic character of Hahndorf withwhich to attract visitors, and may be faced with the problem of creating tourismresources. However, where they are present, a major concern relates to thesustainability of the assets treasured by the community and highly regarded by thetraveller, and the extent to which they may be negatively impacted by the successof the marketing efforts. It is essential that township promotion plans becontinuously open to review processes which incorporate clear identification ofthe constraints within which the community must contain its aspirations.
An additional concern relates to the manageability of the proposed approach. Itis likely that the smaller the township, the more easily the strategy can beimplemented. While this may offer hope to townships so small they may nototherwise recover from bypassing, larger centres may find it necessary to adopt anapproach which involves identification of one or more precincts suitable forpresentation as unified attractions.
It is emphasised that the hypothesis in this paper is based largely onobservation of a limited number of bypassed townships, and the proposals largelyon the experience of one successful township response to bypassing. However,given the seriousness of problems relating to the provision of services in ruralareas, and the increasing frequency with which bypasses occur, it is suggested thata utilitarian follow-up should involve further consultation and the development ofa handbook providing detailed directions for each stage in the planning,implementation and maintenance processes involved in the adoption of a townshiptourism strategy.
Chapter 9
Product Market Perspective ofSelf-drive Tourism
Noel Scott
9.1 IntroductionThe chapters of this book on drive tourism reflect many of the problems andissues central to the study of tourism more generally. As a topic for research, thestudy of drive tourism is a very loosely defined, is not theoretically structured andlacks methodological rigour. A number of authors in this book refer to the lack ofdefinition of drive tourism or perhaps the lack of consensus on what couldconstitute a definition. Dean Carson and Iain Waller, and Bruce Prideaux haveintroduced some of the available information on Drive Tourism from the Bureauof Tourism Research. Carson and Waller have also provided an informationframework to help classify data.
In addition, drive tourism has been studied from many different perspectivessuch as management and business, marketing and economics. Economicperspectives on drive tourism include the value of scenic roads, (Walsh,Sanderson & McKean 1990), tourist expenditure and regional development(Roehl, Fesenmaier & Fesenmaier 1993). One of the major focuses for drivetourism research has been to explore the interaction between tourism andeconomic development (Greffe 1994). From a business perspective, there arestudies on bus tour operators (Dean 1993), independent automobile touring (Lue,Crompton & Stewart 1996; Taplin & Qui 1997), the rental – fly/drive market(Oppermann 1995) and caravan parks (Bell & Crilley 2002) as well as issues suchas tourism signage (Dornbusch & Kawczynska 1992). From a marketingperspective there are articles on traveller segmentation, (Stewart, Lue, Fesenmaier& Anderson 1990), promotional effectiveness (Hodgson 1993) and particularmarket segments such as the seniors market (Vincent & Santos 1990). Many ofthese approaches are found in this book.
On the other hand the theoretical diversity found in the literature is not linkedto strong methodological development with only few methodological issuesdiscussed (McCool 1991; Stewart, Anderson, Fesenmaier & Lue 1993) and thesemainly related to techniques of survey data collection.
The definition of drive tourism adopted here follows the definition of tourismadopted by the WTO. This includes a distance criteria in that it involves traveloutside the usual environment. For the purposes of statistical data collection, theAustralian Bureau of Tourism Research (BTR) uses a measure of 40 kilometres todefine the boundaries of the usual environment.
Thus, it is possible to define drive tourism as travel by car or bus more than 40
Drive Tourism: Up the Wall and Around the Bend
82
kilometres for tourist purposes. It may be subdivided into categories such as self-drive/own car or self-drive/rented car although no taxonomic structure has beenaccepted in the literature.
9.2 History of Drive TourismA useful starting point for any area of academic endeavour is to look at the historyof the phenomena under study. This history can provide a context andunderstanding of the development of major institutions, illuminate critical eventsand people and provide of the past and current magnitude of the phenomena aswell as some of the dynamics of change over time. It may also highlight importantissues or problems for research.
The automobile has radically changed tourist habits this century. In the firstdecade of the 20th century, a small, wealthy elite in America enthusiasticallyembraced the automobile and paved the way for the larger market. The initialdestination of these drive tourist ‘innovators’ was the romantic northeastern USscenery. Choice of this destination was influenced by contemporary paintingsfrom the Hudson Valley School of artists (Hugill 1985). Cheaper automobilesallowed the mass market to follow the trend setting wealthy innovative tourists.In a similar fashion, (Butler 1985) has discussed how automobiles havedramatically altered the Scottish Highlands in the 1950s. The automobile allowedthe ‘masses’ to visit places once the preserve of royalty and the elite.
However, the motivations for discovery, travel and imitation are nothing new.Many of the institutions and conventions associated with modern touring aredocumented in a history of Roman holidays (Feifer 1986). These include roadsideinns, tourist maps and popular attractions. More recently, the history of the GrandTour in Europe (Brodsky-Porges 1981; Towner 1985) documents a similar set ofinnovations such as travelogues and maps, the growth of an organised andstandardised pattern of accommodation and the popularisation of certaindestinations. The lure of touring and travel is both deeply ingrained andwidespread in society.
9.3 Touring by Autom obileAutomobiles made their presence felt in Australia in the early 1900s. Richardson(1999: 101) discusses the growth of the infrastructure of touring and notes thatmost motoring organisations formally established touring departments in the1920s. In 1917, the Royal Automobile Association of South Australia and theCommercial Travellers Association agreed on a method to identify ‘the best hotelsat accommodate members in country towns’. In 1919, ‘Pioneer Motor Coaches’offered an 8 day tour from Melbourne to Mt Kosciusko.
During this period the automobile gradually supplanted travel by horse as thepreferred method of short travel while rail or sea remained popular for longerdistance travel.
Motor coaches and cars underwrote development of tourist roads in New
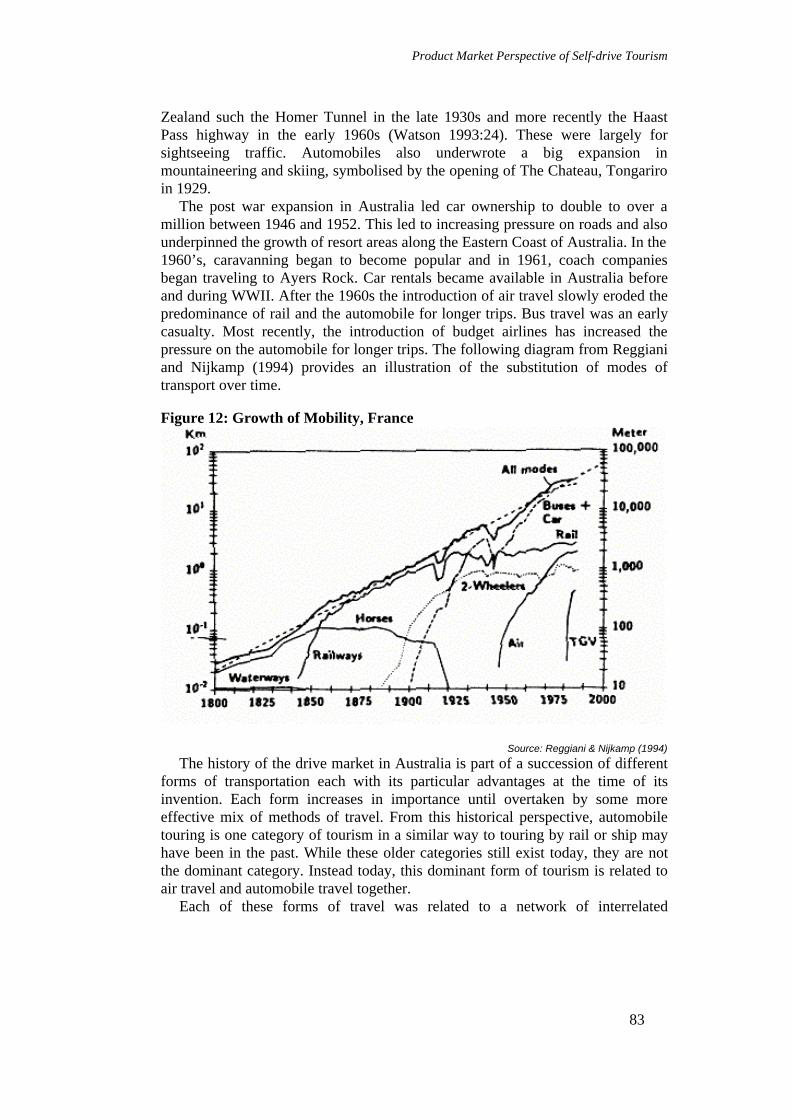
Product Market Perspective of Self-drive Tourism
83
Zealand such the Homer Tunnel in the late 1930s and more recently the HaastPass highway in the early 1960s (Watson 1993:24). These were largely forsightseeing traffic. Automobiles also underwrote a big expansion inmountaineering and skiing, symbolised by the opening of The Chateau, Tongariroin 1929.
The post war expansion in Australia led car ownership to double to over amillion between 1946 and 1952. This led to increasing pressure on roads and alsounderpinned the growth of resort areas along the Eastern Coast of Australia. In the1960’s, caravanning began to become popular and in 1961, coach companiesbegan traveling to Ayers Rock. Car rentals became available in Australia beforeand during WWII. After the 1960s the introduction of air travel slowly eroded thepredominance of rail and the automobile for longer trips. Bus travel was an earlycasualty. Most recently, the introduction of budget airlines has increased thepressure on the automobile for longer trips. The following diagram from Reggianiand Nijkamp (1994) provides an illustration of the substitution of modes oftransport over time.
Figure 12: Growth of Mobility, France
Source: Reggiani & Nijkamp (1994)
The history of the drive market in Australia is part of a succession of differentforms of transportation each with its particular advantages at the time of itsinvention. Each form increases in importance until overtaken by some moreeffective mix of methods of travel. From this historical perspective, automobiletouring is one category of tourism in a similar way to touring by rail or ship mayhave been in the past. While these older categories still exist today, they are notthe dominant category. Instead today, this dominant form of tourism is related toair travel and automobile travel together.
Each of these forms of travel was related to a network of interrelated

Drive Tourism: Up the Wall and Around the Bend
84
institutions. During the early years of automobile motoring and touring a numberof institutions were developed. These provided specialised functions required bythe developing category of travel. Many of these we take for granted today butwere innovations at the time. Automobile Associations (RACQ, RACV, etc.) wereinitially formed to provide mechanical support for motorists but soon developedother functions. These included provision of detailed maps, guides foraccommodation and information about enroute attractions and services. Servicestations were set up in towns around the country providing employment and newskill requirements. From a tourism point of view, specialist tour operatorsappeared early first with cars and then buses. Caravan parks began appearing andbecame the foundation for destinations such as the Gold Coast and other coastalresorts.
In the process, these organisations developed a network of relationshipsevidenced by the Motoring organisation guide books and touring arms. Theseinterrelationships in turn influenced and guided the development of furtherinnovations and the actions of the larger public.
However, the actions of those behind the wheel should not be ignored as partof the dynamics of the development of automobile touring in Australia. Asautomobile touring developed, the activities undertaken and places visited forholidays developed and changed because of the actions of individuals or smallgroups of people. The automobile provided the opportunity to undertakeadventurous and novel experiences well away from the norms of the homeenvironment. In the United States, those wealthy enough to own automobiles‘rediscovered’ areas painted by the ‘Hudson school’ that they had previously beenaware of but were unable to visit. These areas were well know and hadassociations of romance and status.
In Australia, one region initially visited included Mt Kosciusko and later whenimproving technology provide the means, Ayres Rock (now Uluru). These andother icons came, at the time, to represent the adventure and excitement of thisnew form of travel. Those who undertook these initial adventures have provided alegacy and roadmap for others to follow. These in turn have been passed on tolatter generations and as a result there, today, the ‘gray nomads’, those oldertravelers on extended holidays driving around Australia or through the Outbackare in part motivated by ideas and common ‘representations’ (in the sense used by(Moscovici 1984)) that have evolved since those early days.
One interesting conclusion from a historical review of the drive market is tonote that many of the ‘inventions’ and organisations that we take for granted todayare in fact historical creations that derive from specific historical situations andthen have become embedded and stabilised. Thus the representations and ideasthat we have today are crystallised from the actions of individuals in the past. Inpart the importance of history in tourism is due to the enduring nature of someaspects of the tourism product. In some ways this stability is illustrated by thework of Marles on repeat visitation to caravan parks. We still see and use todaythe hotels and caravan parks that were established many years ago. The nature ofthe tourism product is longer terms and less commercial.

Product Market Perspective of Self-drive Tourism
85
It is therefore possible to interpret the history of automobile touring inAustralia in terms of the interactions of the traveller with the suppliers of servicesboth direct (tour operators) and indirect (Governments providing funding forroads). Both the automobile and associated organisations are affected by theactions of individual people using their cars and visa versa. In the next section Iwill develop these ideas further by providing a theoretical framework for thestructure of automobile touring as a tourism market and the dynamics of thismarket over the longer term.
9.4 A Fram ework for Autom obile TouringIt is normal in the field of tourism to understand the interaction of the tourismproduct, the traveler and the tourism operator in a destination as part of a tourismsystem (Leiper 1989). In the case of automobile touring, such a system would becharacterised as only partly industrialised (Leiper 1990) since it involves manynon-commercial transactions and activities (i.e. Driving the car is predominately anon-commercial activity). The application of systems theory to a particular part ofreality involves the identification of a system boundary, the identification ofsystem variables (or possibly subsystems) and definition of the relationshipbetween them (Allen 1998).
The application of systems theory to tourism has predominantly involved theuse of boundary conditions of a geographical nature. The specification of thevariables or subsystems within the tourism system has been more controversial.For example, (Mill & Morrison 1985) focuses only on the destination andidentifies five subsystems (attractions, accommodation, transport, hospitality andevents). Alternatively, (McKercher 1999) identifies several subsystems andadditionally specifies that the relationships between these is both nonlinear andinvolves feedback and interaction between them. This complex interaction of thesubsystems over time leads to chaotic system dynamics over time.
In considering automobile touring in Australia, it is less obvious that ageographical system boundary is useful as the activity includes multipledestinations spread over much of the Australian continent. At the same time thephenomena of automobile touring involves a substantial economic component.Driving a car involve continual direct expenditure along with all the additionaltourism services (accommodation, meals, entertainment and attractions, etc). Inthe case of automobile touring, the product-market, a concept from the economicand marketing literature is more useful than a geographical boundary as a meansof structuring the overall system of automobile touring in Australia. Thus, as willbe discussed below, automobile touring in Australia may be imagined as anoverall system composed of a number of product markets. Thus the subsystems insuch a conceptualisation are product-markets rather than simply attractions oraccommodation as other authors have discussed. This retains the holistic nature ofthe overall systems approach and yet allows examination of the interaction oftourism elements (attractions, accommodation, forms of transport) at a lower levelof amalgamation.

Drive Tourism: Up the Wall and Around the Bend
86
9.4.1 Product M arkets Concept
The product-market is a theoretical concept central to economics and marketingand is based on several of the important assumptions that have been traditionallybeen associated with theorising in these areas. These are:
• Marketing is necessitated by a separation in society of consumers andproducers;
• Marketing acts are the exchanges that take place between these twogroups (Bagozzi 1979);
• The actions of individual consumers and producers, when aggregated,generate the forces of demand and supply; and
• The dynamic interplay between the forces of demand and supply is aprimary characteristic of the marketplace as a whole (Dickson 1992).
Within this context, product-markets are the most intimate level of interactionbetween suppliers and consumers. Rosa, Porac, Spanjol and Saxon (1999)considers product-markets as the meeting grounds for buyers and sellers of goods.He defines a product-market as:
…The bounded arenas in which prices and quantities for substitutable goods andservices are negotiated by consumers and producers and are separated from otherbounded arenas by gaps in demand between the product groupings.
Similarly, Day, Shocker and Srivastava (1979) defines a product-market as:The set of products judged to be substitutes, within those usage situations in whichsimilar patterns of benefit are sought, and the customers for whom such usages arerelevant.
The concept of a product-market therefore involves those products judged assubstitutable by consumers within a particular usage situation. It also involves theproducers of those goods.
9.5 Im portance of Usage SituationThe concept of a product market is based on the view that the organising themefor a market is not products or people per se, but the benefits sought by thosepeople from the products. These benefits provide the basis for the usage situationsincluded by Day et al. (1979) in their definition. It is possible for the same productto be used to provide different benefits by different consumers. Thus the samehotel room could be used by a honeymoon couple to provide the setting forromance and intimacy or by a business person for fulfilment of the physiologicalneeds of sleep and rest.
In the case of automobile touring, there are a number of usage situations orbenefits that may be sought. These include benefits such as adventure andexcitement, escape, discovery and learning derived from the experience within thecar itself or alternatively benefits provided by the places visited in which case thecar become a very secondary aspect of the product market, necessary but notsufficient to explain existence of the product market.
Thus automobile touring may be considered conceptually to be broken into atleast two distinct product-markets consisting of those for whom it is the benefitsof the travel itself that are important (along with all the services that support them)

Product Market Perspective of Self-drive Tourism
87
and those for whom it is the excitement of the places that can be visited that areimportant (along with that different mix of services that support them.
This is a conceptual analysis provided only to illustrate that it is benefits andusage situation, along with the product available that define the product-market.The actual structure of the automobile market must be derived from research and anumber of methods are available in the literature to do this as discussed by Day etal. (1979) and other authors.
9.5.1 W hat Is the Product?
The concept of the product market fits well with the idea of tourism as a complexand essentially experiential tourism product involving some amalgam of productsand services such as accommodation and attractions etc. (Smith 1994) (Gabbott &Hogg 1998; Murphy, Pritchard, & Smith 2000; Wahab, Crampon, & Rothfield1976).
From this perspective, tourism product markets consist of a product systemwhere consumers group a series of complementary products together(Ratneshwar, Shocker, Cotte, & Srivastava 1999). These complementary productsare gathered from a range of suppliers meeting the tourist’s expectations. In thissense the tourism product involves a system of suppliers. The initial decision toundertake automobile touring involves a cascade of subsequent decisions,(Woodside & King 2001) some of which are related and some of which areindependent but partially determined by previous decisions. Therefore the actualsum of all individual holiday components purchased constitutes the holistictourism product.
9.5.2 Gaps betw een Product-m arkets
The concept of a product-market involves, as suggested by the definition, bothsubstitutability between products within the product market and gaps in demandbetween product-markets. These gaps in demand represent a structure imposed bythe actions of suppliers and the knowledge systems of the customers (Bourgeois,Haines & Sommers 1987; Rosa et al. 1999). Thus it may not be economicallyfeasible for suppliers to meet all the different requirements of customers. Insteadthey may only meet the demand where it is densest. In this case, customers eitherleave the market or accept a product that meets their needs imperfectly. Intourism, the cost of hotels and apartments, of roads and staff may mean that someautomobile travellers are only imperfectly provided for.
This view of automobile touring in particular and tourism in general as a seriesof negotiated product markets, with gaps in demand is in contrast to the ideasassociated with other forms of tourism, notably ecotourism and resorts. A numberof authors in tourism have discussed tourism in terms of a spectrum (Boyd &Butler 1996; Butler & Waldbrook 1991; Orams 1996; Prideaux 2000a). Theseauthors present demand for ecotourism for example along a continuum withoutdiscussing whether there is equal demand on each segment. The concept of aproduct-market instead suggests that on any such spectrum representing thevariety of benefits sought, there will be gaps.

Drive Tourism: Up the Wall and Around the Bend
88
9.5.3 Fuzzy Boundaries
It should be remembered however that a product market is only an attempt toprovide a conceptual tool for examining the exchanges that take place betweensuppliers and consumers. They have no physical reality but are of use asmanagement tools. Considerable attention has been given to defining productmarket structures and the boundaries between product categories from a cognitive(Rosa et al. 1999) and organisational perspective. Bauer and Herrmann (1995)suggests that both consumer and supplier need to be involved in defining product-markets and their boundaries. In the final instance however, these boundaries areindistinct and changeable over time. Thus over the history of the automobilemarket, as new innovations were introduced, (such as better engines, caravans,four wheel drive and off road vehicles, new roads), the initial automobile touringmarket changed and evolved. Today, it is a complex series of partiallyoverlapping product markets each with indistinct or fuzzy boundaries.
9.5.4 Relationship to Special Interest Tourism
Previous authors in this book have examined automobile touring from theviewpoint of special interest tourism. Special interest tourism was examined indetail first by Weiler and Hall (1992) and involves identification of ‘types’ oftourism that have some ‘particular interest’. It involves ‘the realisation thattransport and accommodation considerations alone do not provide the tourismproduct’ (Hall & Weiler 1992). In this sense the idea of special interest tourism issimilar to the concept of a tourism product-market especially as the definition of aparticular form of Special Interest Tourism often involves the motivation of thetraveller (i.e. REAL travel).
In addition, the concept of special interest tourism as discussed by Hall andWeiler does involve the idea of change over time, similar to the discussion ofproduct market dynamics above. These authors draw attention to the changesinduced in tourism and the creation of new product-markets due to changes in thewider society especially those caused by increased environmental awarenessand agitation.
9.6 Product-m arket Dynam icsThe concept of product market as the interaction of travellers and operators andthe complexity of the nature of the tourism product which they jointly definesuggests that even within a product market there may be no two products that areexactly the same, no two automobile tours are the same but only similar to oneanother. However, over time the cumulative actions of many such travellers maybe considered to define as aggregate demand curve with both some averagepattern of experiences around which there is considerable variation. Change in theproduct market can therefore be thought of as movement in the shape or averageof this demand curve.
On this basis we can consider classifying the changes in product markets into anumber of areas. Incremental change occurs when the shape of the demandfrequency curve varies only slightly over time while radical change occurs when a
Product Market Perspective of Self-drive Tourism
89
whole new curve is created. Mutational change may occur when behaviourchanges and as a result the curve splits into two related curves.
9.7 Managem ent Uses of Product MarketsApart from conceptual clarification, product markets are useful for a number ofpractical management tasks. In fact, careful market demarcation is an essentialelement of practically all strategic and tactical marketing decisions. A productmarket analysis can provide a detailed knowledge of the competitive relationshipswithin a markets, and is particularly useful for the purposes of product policy,such as identifying unsatisfied demand, developing new products and modifyingor eliminating existing products (Day et al. 1979; Srivastava, Leone & Shocker1981). Moreover, they are useful in examining whether or not a company shouldenter into new or existing markets; how brand, product-type and variant-choicedecisions are made by the travellers and – as a result of this – provide direction inthe nature of the marketing mix.
Product markets can help a particular organisation ‘chalk out’ the boundariesof the firm’s (or strategic business unit’s) business (Ratneshwar et al. 1999). Thisallows a firm to better articulate its mission or purpose – its self concept of whatits about and what it can or should be in the future (Ansoff 1965; Drucker 1974).Additionally, product markets can help significantly in simplifying the process ofenvironment scanning undertaken by businesses in their planning processes(Ratneshwar et al. 1999). In particular, it is clear in tourism and fundamental tothe concept of a product market that events in the business environment havevarying impacts on different product markets. This is especially important inlonger term planning and scenario generation exercises as well as understandingthe impact of events or shocks on particular product markets. Mark Olsen and RosDerrett provide two detailed case studies of the drive market category and some ofthe product markets within it. It reflects that more and more tourism is being seenas a number of related ‘product’ categories rather than a homogeneous market.The chapters by Kathy Marles and Ian Kelly and Mike Spark provide somedetailed examination of some of the real product market issues of crucial interestto operators. Again these later two papers illustrate the detailed and complexnature of drive tourism.
9.8 Im plicationsThe major implication of the use of the product market concept to conceptualiseautomobile touring is that we must consider automobile touring as a series ofproduct markets each with its own dynamics and the boundaries of which shouldbe explored through research. Additionally, these product market boundaries areconstantly changing both through the actions of operators, travelers and the effectof innovations and change in the wider business environment.
Examples are numerous:• Over the past ten years, there has been considerable growth in the use of

Drive Tourism: Up the Wall and Around the Bend
90
self contained cabins in caravan parks as a means of adapting to changingconsumer demand for higher quality accommodation.
• The growth of self drive international travelers to Outback areas ofAustralia is forcing examination of issues relating to signage and safetyinformation, and the role of visitor information centres.
• New road construction where existing towns are being bypassed meansthat these towns need to develop new tourism attractions to bring thetravelers back to town.
• The aging ‘baby boom’ generation provides an enormous opportunity forautomobile touring but will significant increases in the quality and rangeof services available in remote areas in order to encourage them to travel.Some opportunities lie in the area of new communication technology.
• Finally, the product market approach places emphasis on the skills andresources of people to adapt to change. These people may live in remote orrural areas where support for these changes is not readily available.

Appendix – Author Profiles
Samuel Budge: Research assistant with the Centre for Regional TourismResearch at Southern Cross University.Dean Carson: Senior Research Fellow with the Centre for Regional TourismResearch at Southern Cross University.Ros Derrett: Projects Manager with the Centre for Regional Tourism Researchand Director of the Southern Cross University Regional Gateway.Ian Kelly: Well travelled tourism academic and geographer now residing inAdelaide. Among many projects is the editor of the Australian Regional TourismConvention’s annual Regional Tourism Handbook.Kathy Marles: PhD candidate at Griffith University on the Gold Coast.Conducting research on behalf of the Cooperative Research Centre for SustainableTourism.Mark Olsen: Manager of the Drive Tourism Unit with Tourism Queensland.Bruce Prideaux: Senior Lecturer in the School of Tourism and LeisureManagement at the University of Queensland.Noel Scott: PhD candidate at Griffith University on the Gold Coast. Conductingresearch on behalf of the Cooperative Research Centre for Sustainable Tourism.Mike Spark: Lecturer in Marketing at Swinburne University, Lillydale campus.Rowan Sproule: Director of Tourism Development with Tourism Tasmania.Iain Waller: Academic Coordinator with the Centre for Regional TourismResearch at Southern Cross University.Christian Ware: Lecturer in the Tourism Program within the School of Businessat James Cook University.


ReferencesAC Nielsen. (1998). Seniors Card-Queensland Survey of Card Holders Report Brisbane:
Seniors Card, Office for the Ageing.AGB McNair. (1997). The Short Break Travel Market for Brisbane: a Market Appraisal.
Unpublished research for the Queensland Tourist and Travel Corporation (nowTourism Queensland).
Allen, P.M. (1998). Evolving complexity in social science. In G. Altmann & W. A. Koch(Eds.), Systems: New paradigms for the human sciences (pp. 1–38). New York:Walter de Gruyter.
AMR Interactive. (2000). Touring by Car Sydney: Tourism New South Wales.Ankomah, P.K., & Crompton, J. L. (1996) Influence of cognitive distance in vacation
choice Annals of Tourism Research 23(1) 138:150.Anonymous. Have no fear, the motorist is here (2001) Weekend Bulletin November
24–25. p33.Ansoff, H.I. (1965). Corporate Strategy. New York: McGraw-Hill.Ashworth, G. & Goodall, B. (1988). Tourism images: marketing considerations in B.
Goodall & G. Ashworth (eds.), Marketing in the tourism industry London:Routledge 213: 238.
Australian Bureau of Statistics. (1997). Population Projections: 1997-2051 Canberra:Commonwealth of Australia.
Baas, J.M., Manfredo, M.J., Lee, M.E. & Alien D.J. (1989) Evaluation of aninformational brochure for promoting charter boat trip opportunities along theOregon coast Journal of Travel Research 27 (3) 35: 37.
Bagozzi, R.P. (1979). Towards a formal theory of marketing exchanges. In S. W. Ferrell& S. W. Brown & C. W. Lamb Jr (Eds.), Conceptual and Theoretical Developmentsin Marketing (pp. 431–447). Chicago: American Marketing Association.
Bauer, H. & Herrmann, A. (1995). Market Demarcation: Theoretical framework andresults of an empirical investigation of the German car market. European Journal ofMarketing 29(11), 18–34.
Beeton, S. (1999) Hoof prints on the mind: an exploration of attitudinal relationshipsbetween bushwalkers and commercial horseback tours Tourism Management 20 255:259.
Bell, B. & Crilley, G. (2002). An Application Of The Cerm Performance IndicatorsProgram To Benchmarking In The Australian Caravan And Tourist Park Sector.Paper presented at the CAUTHE conference: Tourism and Hospitality on the Edge,Perth.
Berry, B.J.L. (1967). Geography of market centres and retail distribution EnglewoodCliffs, N.J.: Prentice Hall
Bourgeois, J.C., Haines, G.H., & Sommers, M.S. (1987). Product Market Structure:Problem, Definition and Issues. In M. Houston (Ed.), Review of Marketing (pp.327–384). Chicago: American Marketing Association.
Bovis Australia. (1996). Tourism Transport Needs Across Australia: A study of theFinancing and Development of Tourism Transport Infrastructure. Report preparedfor the Tourism Task Force.
Boyd, S.W. & Butler, R.W. (1996). Managing ecotourism: an opportunity spectrumapproach. Tourism Management, 17(8), 557–566.
Brodsky-Porges, E. (1981). The Grand Tour: Travel as an educational device 1600-1800.Annals of tourism research, 8(2), 171–186.
Bull, A. (1995). The Economics of Travel and Tourism Melbourne: Longman.

References
94
Bureau of Tourism Research. (1997). With my Swag Upon my Shoulder: a comprehensivestudy of international backpackers to Australia Canberra: Bureau of TourismResearch.
Bureau of Tourism Research. (1999). Domestic Tourism Monitor Canberra: Bureau ofTourism Research.
Bureau of Tourism Research. (2000). National Visitors Survey Canberra: Bureau ofTourism Research.
Bureau of Transport and Communications Economics. (1994). The Effects on SmallTowns of Being Bypassed by a Highway: A Case Study of Berrina and MittagongCanberra: Commonwealth of Australia.
Burke, J.F., and Gitelson, R. (1990). Conversion studies: Assumptions, applications,accuracy and abuse Journal of Travel Research 28 (3) 46:51.
Burton, R. (1994). Travel Geography London: Pitman.Butler, R.W. (1985). Evolution of tourism in the Scottish highlands. Annals of Tourism
Research, 12(3), 371–391.Butler, R.W., & Waldbrook, L.A. (1991). A new planning tool: The tourism opportunity
spectrum. The Journal of Tourism Studies 2(1) 2–14.Buttimer, A. (1980). Home, reach, and the sense of place in Buttimer, A. & Seamon, D.
(Ed.) The human experience of space and place London: Croom Helm 166:187.Charlton, C. (1998). Public transport and sustainable tourism: the case of the Devon and
Cornwall Rail Partnership in Hall, C.M. & Lew, A.A. Sustainable Tourism: ageographical perspective Essex: Longman 132:145
Chu Te, G. (1993). Airline deregulation and domestic tourism Papers of the AustralasianTransport Research Forum 18(1) 259–:275
Clark, A. & Black, N. (1996). Report on Tourism Numbers, Tourist Characteristics andTourist Flows in North West Queensland. Unpublished research paper.
CM Research. (1999). Brisbane to Reef Motoring Holiday Planner Study. Unpublishedresearch for Tourism Queensland.
Commonwealth Department of Tourism. (1992). Tourism: Australia’s Passport toGrowth. A National Tourism Strategy Canberra: Commonwealth Department ofTourism
Commonwealth of Australia. (1998). Tourism: a ticket to the 21st Century Canberra:Department of Industry Science and Resources
Coppock, J.T. (Ed.). (1977). Second homes; curse or blessing? 1(ed.) 12 Oxford, NewYork: Pergamon Press.
Craik, J. (1995). Is Cultural Tourism Viable? Smarts (2) 6:7.Creighton, M. (1997). Consuming rural Japan – the marketing of tradition and nostalgia
in the Japanese travel industry Ethnology 36(3) 235:246.Crompton, J.L. (1979). Motivations for pleasure travel Annals of Tourism Research 6
408:424.Cullingford, C. (1995). Children’s attitudes to holidays overseas Tourism Management
16(2) 121:127.Davidson, T.L., and Wiethauft, W.B. (1989). Accountability marketing research: An
increasingly vital tool for travel marketers Journal of Travel Research 27 (4) 42:44.Day, G.S., Shocker, A.D., & Srivastava, R.K. (1979). Customer oriented approaches to
identifying product-markets. Journal of Marketing, 43(4), 8–19.Dean, C.J. (1993). Travel by excursion coach in the United Kingdom. Journal of Travel
Research (Spring), 59–64.Dermott, B. & Associates. (2000). The Productive Marketing Approach. Unpublished
research prepared for Tourism Queensland.

References
95
Derrett, R., Tiyce, M., Mackellar, J. & Welch, J. (2000). Rainforest Way Strategy,Southern Cross University, Lismore
Dickson, P.R. (1992). Toward a General Theory of Competitive Rationality. Journal ofMarketing, 56(January), 69–83.
Dornbusch, D.M., & Kawczynska, C.J. (1992). Tourist Orientated Directional Signs: ASelf-Supporting program to promote Rural Business and Economic Development.Journal of Travel Research (Summer), 3–9.
Douglas, N., Douglas, N., & Derrett, R. (2001). Special Interest Tourism, Contexts andCases Brisbane: John Wiley
Drucker, P. (1974). Management: Tasks, Responsibilities, Practices. New York: Harperand Row.
Economic Associates and the National Centre for Tourism. (2000). Strategic TourismRoads Study. Unpublished report prepared for Tourism Queensland and theDepartment of Main Roads.
Etzel, M.J. & Wahlers. R.G. (1985). The use of requested promotional material bypleasure travellers Journal of Travel Research 23 (4) 2:6.
Faulkner, B. & Poole, M. (1989). Impacts on Tourism of the Disruption to DomesticAirline Services Canberra: Bureau of Tourism Research
Feifer, M. (1986). Tourism in History. New York: Stein and Day.Feldman, R. M. (1990) Settlement-identity: Psychological bonds with home places in a
mobile society Environment and Behavior 22(2) 183:229.Fesenmaier, D.F. (1994). Traveller use of visitor information centers: Implications for
development in Illinois. Journal of Travel Research 32 (1) 44:50.Fesenmaier, D.F. & Vogt, C.A. (1993). Evaluating the economic impact of travel
information provided at Indiana welcome centers. Journal of Travel Research 31 (3)33:39.
Fesenmaier, D.F., Vogt, C.A. & Stewart, W.P. (1993). Investigating the influence ofwelcome center information on travel behaviour. Journal of Travel Research 31 (3)47:52.
Foo Lee Mei & Rossetto, A. (1998). Cultural Tourism in Australia Occasional Paper 27:Bureau of Tourism Research.
Frederick, M. (1993). book reviews in Economic Development Quarterly 7(2) 215Friedmann, J. (1975). Urbanisation, planning and national development London: Sage.Gabbott, M., & Hogg, G. (1998). Consumers and services. Chichester: John Wiley and
Sons.Getz, D. & Page, S.J. (1997). Conclusions and implementations for rural business
development in S.J. Page & D. Getz (eds) The Business of Rural Tourism:International Perspectives International Thomson: London 191:205.
Getz, D. and Sailor, L. (1993). Design of destination and attraction - specific brochuresJournal of Travel & Tourism Marketing 2 (213) 111:13 1.
Gilbert, D. (1990). Conceptual issues in the meaning of tourism. In C. Cooper (Ed.),Progress in Tourism, Recreation and Hospitality Research. London: Belhaven Press.
Gitelson, R.A. & Crompton, J.L. (1983). The planning horizons and sources ofinformation used by pleasure vacationers Journal of Travel Research 21 (3) 2:7.
Gitelson, R.A., & Crompton, J.L. (1984). Insights into the repeat vacation phenomenonAnnals of Tourism Research 11 199:217.
Great Green Way Management Committee. (1996). Great Green Way Action Plan1996/1997 Townsville: Great Green Way Management Committee.
Greffe, X. (1994). Is Rural Tourism a Lever for Economic and Social Development?Journal of Sustainable Tourism 2(1/2) 22–40.
References
96
Gunn, C.A. (1988). Tourism planning (2nd ed.) New York: Taylor & Francis.Gyte, D.M., & Phelps, A. (1989). Patterns of destination repeat business: British tourists
in Mallorca, Spain Journal of Travel Research 28(1) 24:28.Hall, C.M. (1998). Introduction to Tourism (3rd edition) LongmanHall, C.M. & Page, S.J. (1999). The Geography of Tourism and Recreation London:
RoutledgeHall, C.M. & Weiler, B. (1992). Introduction. What’s special about special interest
tourism? In B. Weiler & C. M. Hall (Eds.), Special Interest Tourism (pp. 1–14).London: Belhaven Press.
Halseth, G. (1993). Communities within communities: changing ‘residential’ areas atCutlus Lake, British Columbia Journal of Rural Studies 9(2) 175:187.
Hawkins, G. & Backman, K. F. (1998). An exploration of sense of place as a possibleexplanatory concept in nature-based traveler conflict Tourism Analysis 3 89:102.
Hay, R. (1998). Sense of place in developmental context Journal of EnvironmentalPsychology 18(1) 5:29.
Henshall. (1977). Second homes in the Caribbean in J.T. Coppock (Ed.) Second homes;curse or blessing? New York: Pergamon Press 12.
Hensher, D.A. (1989). A Methodology for Investigating the Passenger Demand for HighSpeed Rail Sydney: Macquarie University Transport Research Group
Hodgson, P. (1993). Tour operator brochure design research revisited. Journal of TravelResearch (Summer), 50–52.
Horna, J. (1994). The study of leisure: An introduction New York: Toronto, London:Oxford University Press.
Hugill, P.J. (1985). The rediscovery of America: Elite automobile touring. Annals ofTourism Research, 12(3), 435–447.
Hunt, S. & Prosser, G. (1998). Regional Tourism Statistics in Australia Lismore: Centrefor Regional Tourism Research.
Hutchison, J. (1997). Tourism: getting it right for the millennium Canberra: Office ofNational Tourism.
Johnson, L. (2000). Tourism Expenditure by Domestic Visitors to Regional Australia(1998) Occasional paper 31 Canberra: Bureau of Tourism Research.
Jones, B. (1994). Tourism research: a public sector perspective Paper presented at theAustralian Tourism Conference Adelaide 22–23 September.
Jones, B. (1996). Reforming the system? A review of Australian tourism statistics Paperpresented at the Australian Tourism and Hospitality Research Conference, CoffsHarbour 6–9 February.
Jordan, J. W. (1980). The summer people and the natives: some effects of tourism in aVermont vacation village Annals of Tourism Research 7 34:53.
Kelly, I. (Ed.) (2002). Australian Regional Tourism Handbook: industry solutions 2001Gold Coast: CRC for Sustainable Tourism.
Kelly, I. & Dixon, W. (1991). Sideline Tourism Journal of Tourism Studies 2(1) 21:28.King, R.L. (1988). Coach transport to the year 2000 Frontiers in Australian Tourism
Conference, Canberra: Australian National University.Kotler, P., Haider, D.H. & Rein, I. (1993). Marketing Places: attracting investment,
industry and tourism to cities, states and nations. In C.M. Hall (1997) Geography,Marketing and the Selling of Places, Journal of Travel and Tourism Marketing6(3/4) 61:84.
Lamb, B. & Davison, S. (1996). Tourism and transportation in Ontario, Canada inHarrison, L. & Husbands, W. Practicing Responsible Tourism: Case Studies inTourism Planning, Policy and Development Chichester: Wiley 261:276.

References
97
Leiper, N. (1989). Tourism and Tourism Systems (Vol. Occasional Paper No 1).Department of Management Systems Palmerston North Massey University.
Leiper, N. (1990). Partial industrialisation of tourism systems. Annals of TourismResearch, 17, 600–605.
Leiper, N. (1995) Tourism Management Melbourne: RMIT Press.Lue, C.C., Crompton, J.L., & Stewart, W.P. (1996). Evidence of Cumulative Attraction in
Multidestination Recreational Trip Decisions. Journal of Travel Research (Summer),41–49.
Lynch, R.L., & Veal, A.J. (1996). Australian Leisure Melbourne: Addison WesleyLongman.
Marcouiller, D.W. (1997). Toward integrative tourism planning in rural America Journalof Planning Literature 11(3) 337:358.
Market and Communications Research: MCR (2002). Queensland Heritage TrailsNetwork research. Unpublished research prepared for Tourism Queensland.
Mazursky, D. (1989). Past experience and future tourism decisions Annals of TourismResearch 16 333:344.
McCool, S.F. (1991). Using probabilistic incentives to increase response rates to mail-return highway intercept diaries. Journal of Travel Research (Fall), 17–19.
McCool, S.F., & Martin, S.R. (1994). Community attachment and attitudes towardtourism developments Journal of Travel Research 32(3) 29:34.
McKercher, B. (1999). A chaos approach to tourism. Tourism Management 20(4),425–434.
McNamara, C. (1988). Tourism Priority Roads Study. Unpublished report for theQueensland Tourist and Travel Corporation.
Mill, R.C., & Morrison, A.M. (1985). The tourism system: An introductory text.Englewood Cliffs: Prentice Hall International.
Moore, R.L. (1994). Influencing human behaviour: theory and applications in recreation,tourism and natural resources management Journal of Leisure Research 26(2)189:191.
Moschis, G. (1988). The Last Word: A Mature Prospective Marketing and Media 23(3):168.
Moscovici, S. (1984). The phenomena of social representations. In R. M. Farr & S.Moscovici (Eds.), Social representation. Cambridge: Cambridge University Press.
Muller, T. & Cleaver, M. (2000). Targeting the CANZUS Baby Boomer Explorer andAdventurer Segments Journal of Vacation Marketing 6(2).
Murphy, P. E. (1985). Tourism: a community approach New York: Routledge.Murphy, P., Pritchard, M.P., & Smith, B. (2000). The destination product and its impact
on traveller perceptions. Tourism Management 21, 43–52.Niininen, O. & Riley, M. (1998). Repeat Tourism Australia and New Zealand Marketing
Academy Conference November 29 – December 3 (1998) New Zealand: Universityof Otago.
Oppermann, M. (1995). A model of travel itineries. Journal of Travel Research (Spring),57–61.
Oppermann, M. (1997). First-time and repeat visitors to New Zealand TourismManagement 18(3) 177:181.
Oppermann, M. (1998). Destination threshold potential and the law of repeat visitationJournal of Travel Research 37(2) 131:137.
Oppermann, M. (1999). Predicting destination choice – a discussion of destination loyaltyJournal of Vacation Marketing 5(1) 51:65.
Orams, M. (1996). A conceptual model of Tourist-Wildlife Interactions: the case for
References
98
education as a management strategy. Australian Geographer 27(1), 39–51.Page, S.J. (1999). Transport and Tourism Harlow: Longman.Page, S.J. & Getz, D. (1997). The business of rural tourism: international perspectives in
S.J. Page and D. Getz (eds) The Business of Rural Tourism: InternationalPerspectives London: International Thomson Publishing 3:37.
Parfitt, N. (1997). Developing the Drive Market in Capricorn and Gladstone.Unpublished research prepared for Tourism Queensland.
Pearce, D. (1995). Tourism Today: A Geographical Analysis (2nd edn) Harlow, Essex:Longman.
Perdue, R.R. (1986). The influence of unplanned attraction visits on expenditures bytravel-through visitors Journal of Travel Research 25 (1) 14:19.
Prideaux, B. (2000). The role of the transport system in destination development. TourismManagement 21 53:63
Prideaux, B. (2000a). The Resort Development Spectrum. Tourism Management 21(3)225–241.
Prideaux, B. (2001). Touring by Car: The Structure of Drive Tourism in AustraliaUnpublished Research Paper, Ipswich: The University of Queensland.
Prideaux, B. (2002). Building Visitor Attractions in Peripheral Areas – Can UniquenessOvercome Isolation to Produce Viability? International Journal of TourismResearch, forthcoming.
Prideaux, B., Wei, S. & Ruys, H. (2001). The Senior Drive Tour Market In AustraliaJournal of Vacation Marketing 7(3) 209:219.
Pritchard, M. P., & Howard, D. R. (1997) The loyal traveler: Examining a typology ofservice patronage Journal of Travel Research 35(4) 2:10.
Proshansky, H. M. (1978). The city and self-identity Environment and Behavior 10147:169.
Prosser, G. (2000). Regional Tourism Research: a scoping study Lismore: Centre forRegional Tourism Research.
Queensland Tourist and Travel Corporation. (1990). Queensland Road Market Strategy(Revised Ed.). Unpublished report.
Ramthun, R. (1995). Factors in user group conflict between hikers and mountain bikersLeisure Studies 17(3) 159:168.
Ratneshwar, S., Shocker, A. D., Cotte, J., & Srivastava, R. K. (1999). Product, person,and purpose: putting the consumer back into theories of dynamic market behaviour.Journal of Strategic Marketing, 7 191–208.
Read, S.E. (1980). A prime force in the expansion of tourism in the next decade: specialinterest travel in De Hawkins, E.L. & Shafer, J.M. Rovelstad (eds) TourismMarketing and Management issues Washington DC: George Washington University193: 202.
Reed, D., Hepper, J., & Tilley, P. (1999). The Tasmanian Attractions Study Hobart:Tourism Tasmania
Reggiani, A., & Nijkamp, P. (1994). Evolutionary dynamics in technological systems: amultilayer niche approach. In L. Leydesdorff & P. van den Besselaar (Eds.),Evolutionary economics and chaos theory (pp. 94–108). London: Pinter Publishers.
Richardson, J. & Cohen, J. (1993). State slogans: The case of the missing US P Journal ofTravel & Tourism Marketing 2 (2/3) 91:109 .
Richardson, J.I. (1999). Australian Travel and Tourism. Melbourne: Hospitality Press.Roberts, L. & Hall, D. (2001). Rural Tourism and Recreation: principles to practice UK:
CABI Publishing.Roehl, W.S., Fesenmaier, D.R., & Fesenmaier, J. (1993). Highway accessibility and

References
99
regional tourist expenditure. Journal of Travel Research (Winter), 58–63.Rosa, J.A., Porac, J.F., Spanjol, J.R., & Saxon, M.S. (1999). Sociocognitive dynamics in
a product market. Journal of Marketing, 63 (Special Issue), 64–77.Ruys, H. & Wei, S. (2001). Senior Tourism, in Douglas, N., Douglas, N. & Derrett, R.
(eds) Special Interest Tourism Brisbane: Wiley 407:430Ryan, C. (1991). Recreational tourism: a social science perspective London, New York:
Routledge.Ryan, C. (1995). Learning about tourists from conversations: the over-55s in Majorca
Tourism Management 16(3) 207:215.Sharma, P. & Carson, D. (2002). A Model of Australian Tourism Information:
Implications for Information Systems Ninth International Conference of InformationTechnology and Travel and Tourism. Austria: Springer-Verlag Wein 49:58
Smith, S. L. J. (1994). The Tourism Product. Annals of Tourism Research 21(3),582–595.
Snepenger, D., Meged, K., Snelling, M. & Worrall, K. (1990). Information searchstrategies by destination – naive tourists Journal of Travel Research 29 (1) 13:16.
Srivastava, R.K., Leone, R.P., & Shocker, A.D. (1981). Market Structure Analysis:hierarchical clustering of products based on substitution in use. Journal ofMarketing, 45(3), 38–48.
Stewart, W.P., Anderson, B.S., Fesenmaier, D.R., & Lue, C.C. (1993). HighwayWelcome Center Surveys: Problems with Nonresponse Bias. Journal of TravelResearch (Winter), 53–57.
Stewart, W.P., Lue, C.C., Fesenmaier, D.R., & Anderson, B.S. (1990). A comparisonbetween welcome center visitors and general highway auto travelers. Journal ofTravel Research (Winter), 40–46.
Stokols, D. & Shumaker, S.A. (1981). People in places: a transactional view of settings inJ. Harvey (Ed.) Cognition, social behavior and the environment Hillsdale, NJ:Lawrence Erlbaum Associates 441:488.
Taplin, J. H. & Qui, M. (1997). Car trip attraction and route choice in Australia. Annals ofTourism Research 24(3), 624–637.
Taylor, Nelson, and Sofres. (2001). Strategic Insights into the over 50s Motoring HolidayMarket. Unpublished research prepared for Tourism Queensland.
Taylor, S. (1999). Queensland Visitor Information Centre Study. Unpublished researchprepared for Tourism Queensland.
Tideswell, C. & Faulkner, B. (1999). Multi-destination travel patterns of internationalvisitors to Queensland Journal of Travel Research 37(4) 364:379.
Tierney, PT. (1993). The influence of state traveller information centers on tourist lengthof stay and expenditures Journal of Travel Research 31 (3) 28: 32.
Tourism New South Wales. (2000). Tourism Business Information: Understanding theBackpacker market Fact Sheet Sydney: Tourism NSW.
Tourism Tasmania. (2001). The Conversion Challenge, Strategic Plan for the TasmanianTourism Industry Hobart: Tourism Tasmania.
Tourism Tasmania. (2002). Tasmanian Visitor Survey Hobart: Tourism Tasmania.Towner, J. (1985). The Grand Tour: A key phase in the history of tourism. Annals of
Tourism Research, 12(3) 297–333.Trimble, K. (1999a). Distribution System Analysis: Stage One – Bookings and
Information. Unpublished research prepared for Tourism Queensland.Trimble, K. (1999b). Distribution System Analysis: Stage Two – Motoring and Touring.
Unpublished research prepared for Tourism Queensland.Tuan, Y.F. (1977). Space and place: the perspective of experience Minneapolis, U.S.A.:
References
100
University of Minnesota Press.Tulpute, A. (1999). Tourism Expenditure by International Visitors in Regional Australia
Occasional Paper 29: Bureau of Tourism ResearchTwining-Ward, L. (1999). Towards sustainable tourism development: observations from
a distance Tourism Management (20) 187:188.Vaske, J.J., Carothers, P., Donnelly, M.P., & Baird, B. (2000). Recreation conflict among
skiers and snowboarders Leisure Sciences 22 297:313.Vincent, V.C., & Santos, G. (1990). Winter Texans: wo segments of the senior travel
market. Journal of Travel Research (Summer), 9–12.Wahab, S., Crampon, L.J., & Rothfield, L.M. (1976). Tourism Marketing. London:
Tourism International Press.Wall, G. (1983). The economic value of cultural features : tourism in Toronto in S.R
Leiber & D.R Fesenmaier (eds.) Recreation planning and management London: E.& F.N. Spon 15:25.
Walsh, R.G., Sanderson, L.D., & McKean, J. R. (1990). The consumptive value of traveltime on recreation trips. Journal of Travel Research (Summer), 17–24.
Watson, A.E., Roggenbuck, J.W., & Williams, D.R. (1991). The influence of pastexperience on wilderness choice Journal of Leisure Research 23(1) 21:36.
Watson, A.E., Williams, D.R., & Daigle, J.J. (1991). Sources of conflict between hikersand mountain bike riders in the rattlesnake NRA Journal of Park and RecreationAdministration 9(3) 59:71.
Watson, J. (1993). The History of Leisure, Recreation and Tourism in New Zealand. InH. C. Perkins & G. Cushman (Eds.), Leisure, Recreation and Tourism (pp. 15–29).London: Longman Paul.
Weaver, D. & Oppermann, M. (2000). Tourism Management Milton, Qld: John Wiley &Sons.
Wei, S. & Ruys, H. (1998). Industry and Senior Perception Survey Brisbane: Office ofthe Ageing, Department of Families, Youth and Community Care, QueenslandGovernment.
Weiler, B. & Hall, C.M. (Eds.) (1992). Special Interest Tourism. London: BelhavenPress.
Western Rural Development Centre (WREP) (1998). Marketing the Uniqueness of SmallTowns, Oregon State University (http://www.msue.msu.edu).
Wicks, B.E. & Schuett, M.A. (1991). Examining the role of tourism promotion throughthe use of brochures Tourism Management 12 (4) 301:312.
Wicks, B.E. & Schuett, M.A. (1993). Using travel brochures to target frequent travellersand big spenders Journal of Travel & Tourism Marketing 2 (2/3) 77:90.
Williams, P.W., Penrose, R.W. & Hawkes, S. (1998). Shared Decision-Making inTourism Land Use Planning Annals of Tourism Research 25(4) 860:889.
Wood, C. (1992). Frameworks for Travellers Melbourne: Australian’s Studying Abroad.Wood, C. (1993). Package Tourism and New Tourism Compared Proceedings from
National Conference: Community Culture and Tourism July (1993) Melbourne.Woodley, B. (2002). Human despair behind road toll The Australian Monday January 7
1:5.Woodside, A., & King, B. (2001). An updated model of Travel and Tourism Purchase-
Consumption Systems. Journal of Travel and Tourism Marketing, 10(1), 3–27.Yann, Campbell, Hoare, & Wheeler (1993). Domestic Holiday Study Sydney: Tourism
New South Wales.Yann, Campbell, Hoare, & Wheeler (1999). Road Travellers Study – Research Report.
Unpublished research prepared for Tourism Queensland.

References
101
Zhou, Z. (1997). Destination marketing: measuring the effectiveness of brochures Journalof Travel & Tourism Marketing 6 (314) 143:158.

Editors
Dean Carson is the Senior Research Fellow at the Centre for Regional TourismResearch, Southern Cross University. His research interests include: managingregional tourism for economic and social gains; and the use of information andcommunications technology in tourism product distribution. Dean has degrees inhistory, communications, tourism, and science. He has worked in rural andregional Australia researching topics as varied as: infrastructure and housingneeds in remote Indigenous communities; health workforce retention in ruralareas; and the role of Local Government in tourism management. Email:[email protected]
Iain Waller is Academic Coordinator for the Centre for Regional TourismResearch, and is based at the Coffs Harbour Campus of Southern CrossUniversity. He has recently completed a PhD in marketing examining the impactsof pheromones on purchasing decisions. Iain has worked extensively in thetourism and hospitality sectors as restaurant and hotel manager, chef, and researchconsultant. His research interests include: services management and the role ofinnovators in product marketing. Email: [email protected]
Noel Scott, B.Sc., M.B.A. (Dist.), M.Bus. (Marketing) is currently studying for aPhD at the School of Tourism and Hospitality Management, Griffith University,Gold Coast on the topic of ‘Trends in Tourism’. He is the inaugural MartinOppermann Memorial Scholarship holder, funded by the Cooperative ResearchCentre for Sustainable Tourism. Prior to this, Noel was a Senior Manager ofResearch and Strategic Services at Tourism Queensland. He has also worked inresearch management in the Petroleum, Finance and Electricity industries. He hasrepresented Queensland on the Tourism Research Committee (ATC) of AustralianStanding Committee On Tourism (ASCOT) and is past Chairman of the MarketResearch Society in Queensland and on the Queensland committee of the PacificAsia Tourism Association (PATA). His current research interests are in strategictourism marketing, tourism product development and tourism trends. Email:[email protected]