Drive Sober or Get Pulled Over Campaign August 1 ... · Drive Sober or Get Pulled Over Campaign...
57
TECHNICAL REPORT March 2017 Evaluation of the 2016 Labor Day Drive Sober or Get Pulled Over Campaign August 1 - September 24, 2016 For more information please contact: Illinois Department of Transportation Bureau of Safety Programs and Engineering Evaluation Unit 2300 South Dirksen Parkway, Room 005 Springfield, Illinois 62764
Transcript of Drive Sober or Get Pulled Over Campaign August 1 ... · Drive Sober or Get Pulled Over Campaign...
TECHNICAL REPORT March 2017
Evaluation of the 2016 Labor Day
Drive Sober or Get Pulled Over Campaign
August 1 - September 24, 2016
For more information please contact:
Illinois Department of Transportation Bureau of Safety Programs and Engineering
Evaluation Unit 2300 South Dirksen Parkway, Room 005
Springfield, Illinois 62764
Illinois Department of Transportation Bureau of Safety Programs and Engineering
Evaluation Unit
The Evaluation Unit within the Bureau of Safety Programs and Engineering in the Illinois Department of Transportation focuses on evaluation and monitoring of various highway safety projects and programs in Illinois. The Evaluation Unit conducts research and analyses that enhance the safety and efficiency of transportation by understanding the human factors that are important to transportation programs in Illinois. The main functions of the Unit include the following: 1. Develop an in-depth analysis of motor vehicle related fatalities and injuries in Illinois using
several crash related databases (Crash data, FARS, Trauma Registry, and Hospital data, state and local police data).
2. Develop measurable long term and short term goals and objectives for the Highway Safety Program in Illinois using historical crash related databases.
3. Evaluate each highway safety project with an enforcement component (e.g., Sustained Traffic Enforcement Program and Local Alcohol Program projects) using crash and citation data provided by local and state police departments.
4. Evaluate several highway safety programs (e.g., Occupant Protection and Alcohol). This involves evaluating the effects of public policy and intervention programs that promote safe driving.
5. Design and conduct annual observational safety belt and child safety seat surveys for Illinois. This survey is based on a multi-stage random selection of Interstate Highways, US/IL Highways, and several local and residential streets.
6. Provide results of research and evaluation as well as annual enforcement activities to the National Highway Traffic Safety Administration (NHTSA) as part of the Federal Requirements of State Highway Safety Program in Illinois.
7. Provide statistical consultation to other Sections at the Bureau of Safety Programs and Engineering and other Divisions at IDOT.
8. Publish results of all research and evaluation at the Division and place them as PDF files at IDOT’s Website.
Using statewide public opinion survey of Illinois licensed drivers, this report evaluates the impact the Drive Sober or Get Pulled Over (a highly visible, massive enforcement effort designed to detect violators of Illinois traffic laws with special emphasis on alcohol) on drinking and driving issues during the August-September 2016 mobilization in Illinois. The main alcohol issues include self-reported belt use, motorists’ opinion and awareness of the existing local and state alcohol enforcement programs, such as roadside safety checks, drunken driving laws, and alcohol related media programs and slogans. The report was compiled and prepared by the Evaluation staff. Comments or questions may be addressed to Mehdi Nassirpour, Ph.D., Chief of Evaluation Unit, Bureau of Safety Programs and Engineering, Illinois Department of Transportation, 2300 South Dirksen Parkway, Room 005, Springfield, Illinois 62764.
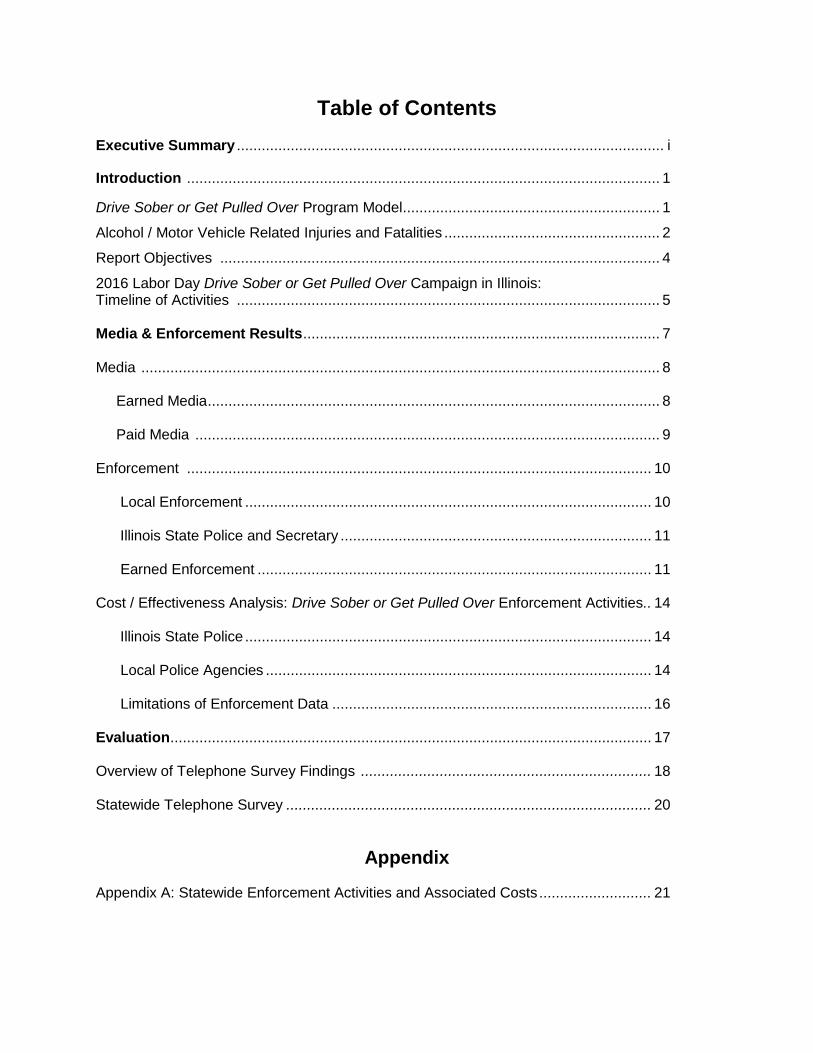
Table of Contents Executive Summary ....................................................................................................... i
Introduction .................................................................................................................. 1
Drive Sober or Get Pulled Over Program Model .............................................................. 1
Alcohol / Motor Vehicle Related Injuries and Fatalities .................................................... 2
Report Objectives .......................................................................................................... 4
2016 Labor Day Drive Sober or Get Pulled Over Campaign in Illinois: Timeline of Activities ...................................................................................................... 5 Media & Enforcement Results ...................................................................................... 7 Media ............................................................................................................................. 8 Earned Media ............................................................................................................. 8 Paid Media ................................................................................................................ 9 Enforcement ................................................................................................................ 10 Local Enforcement .................................................................................................. 10 Illinois State Police and Secretary ........................................................................... 11 Earned Enforcement ............................................................................................... 11 Cost / Effectiveness Analysis: Drive Sober or Get Pulled Over Enforcement Activities.. 14 Illinois State Police .................................................................................................. 14 Local Police Agencies ............................................................................................. 14 Limitations of Enforcement Data ............................................................................. 16 Evaluation .................................................................................................................... 17 Overview of Telephone Survey Findings ...................................................................... 18 Statewide Telephone Survey ........................................................................................ 20
Appendix
Appendix A: Statewide Enforcement Activities and Associated Costs ........................... 21
List of Diagrams Diagram 1: 2016 Drive Sober or Get Pulled Over Campaign Timeline .......................... 6
List of Figures
Figure 1: Theoretical Model of Drive Sober or Get Pulled Over Campaign. .................... 2 Figure 2: Percent Belted Occupants Among Fatally Injured in Motor Vehicle Crashes by Time of Day in Illinois in 2015 .......................................................................... 3 Figure 3: Percent Alcohol Related Fatalities and Percent Belted Occupants by Time of Day in Illinois in 2015 ...................................................................................... 3 Figure 4: Total Patrol Hours Per Citation by Citation Type During 2016 Drive Sober or Get Pulled Over Campaign in Illinois .................................................................... 10 Figure 5: Map of Roadside Safety Checks and Saturation Patrols During the 2016 Drive Sober or Get Pulled Over Campaign ............................................................. 13 Figure 6: Awareness of Drive Sober or Get Pulled Over Slogan in Illinois .................... 19
List of Tables Table 1: Earned Media Items Obtained During the Drive Sober or Get Pulled Over Campaign by Media Market ............................................................................. 8 Table 2: Labor Day Drive Sober or Get Pulled Over Campaign: Cost of Paid Media by Media Market .................................................................................................... 9 Table 3: Summary Results of Enforcement Activities .................................................... 12 Table 4: Enforcement Activities and Associated Costs by Type of Grantee ................... 15 Table 5: STEP Grantees Enforcement and Associated Costs ....................................... 22 Table 6: All Grant Enforcement and Associated Costs .................................................. 29
i
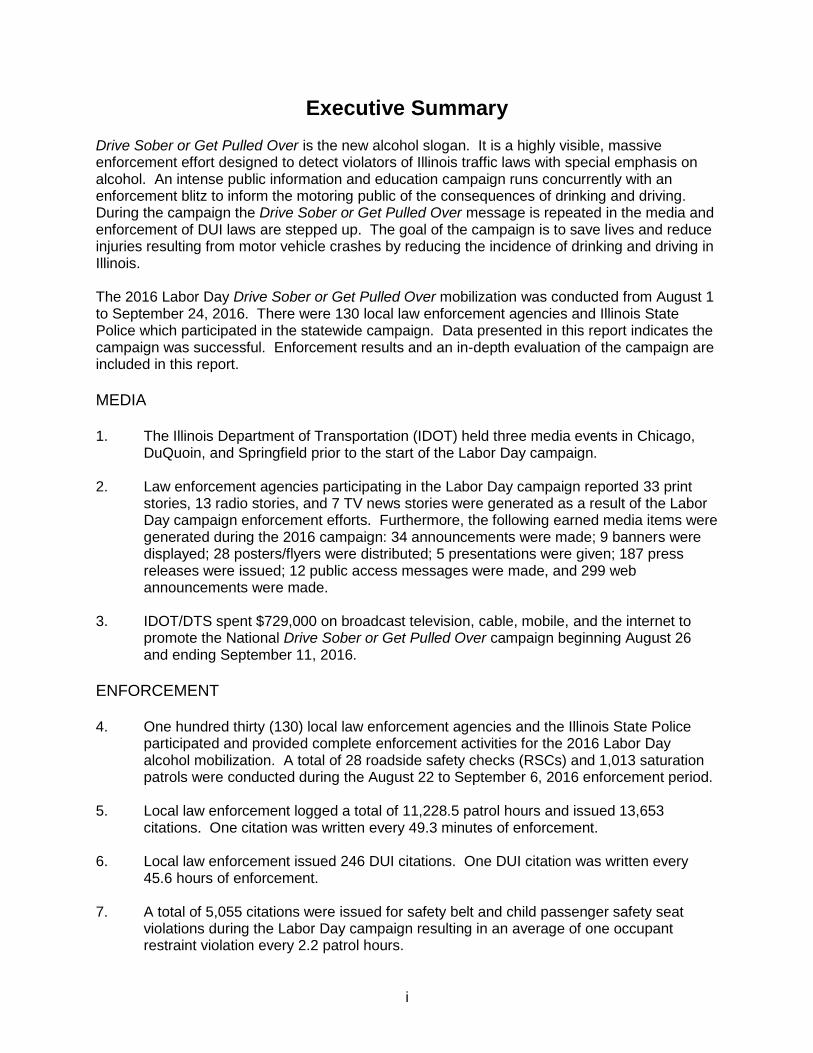
Executive Summary Drive Sober or Get Pulled Over is the new alcohol slogan. It is a highly visible, massive enforcement effort designed to detect violators of Illinois traffic laws with special emphasis on alcohol. An intense public information and education campaign runs concurrently with an enforcement blitz to inform the motoring public of the consequences of drinking and driving. During the campaign the Drive Sober or Get Pulled Over message is repeated in the media and enforcement of DUI laws are stepped up. The goal of the campaign is to save lives and reduce injuries resulting from motor vehicle crashes by reducing the incidence of drinking and driving in Illinois. The 2016 Labor Day Drive Sober or Get Pulled Over mobilization was conducted from August 1 to September 24, 2016. There were 130 local law enforcement agencies and Illinois State Police which participated in the statewide campaign. Data presented in this report indicates the campaign was successful. Enforcement results and an in-depth evaluation of the campaign are included in this report. MEDIA 1. The Illinois Department of Transportation (IDOT) held three media events in Chicago,
DuQuoin, and Springfield prior to the start of the Labor Day campaign. 2. Law enforcement agencies participating in the Labor Day campaign reported 33 print
stories, 13 radio stories, and 7 TV news stories were generated as a result of the Labor Day campaign enforcement efforts. Furthermore, the following earned media items were generated during the 2016 campaign: 34 announcements were made; 9 banners were displayed; 28 posters/flyers were distributed; 5 presentations were given; 187 press releases were issued; 12 public access messages were made, and 299 web announcements were made.
3. IDOT/DTS spent $729,000 on broadcast television, cable, mobile, and the internet to
promote the National Drive Sober or Get Pulled Over campaign beginning August 26 and ending September 11, 2016.
ENFORCEMENT 4. One hundred thirty (130) local law enforcement agencies and the Illinois State Police
participated and provided complete enforcement activities for the 2016 Labor Day alcohol mobilization. A total of 28 roadside safety checks (RSCs) and 1,013 saturation patrols were conducted during the August 22 to September 6, 2016 enforcement period.
5. Local law enforcement logged a total of 11,228.5 patrol hours and issued 13,653
citations. One citation was written every 49.3 minutes of enforcement. 6. Local law enforcement issued 246 DUI citations. One DUI citation was written every
45.6 hours of enforcement. 7. A total of 5,055 citations were issued for safety belt and child passenger safety seat
violations during the Labor Day campaign resulting in an average of one occupant restraint violation every 2.2 patrol hours.
ii
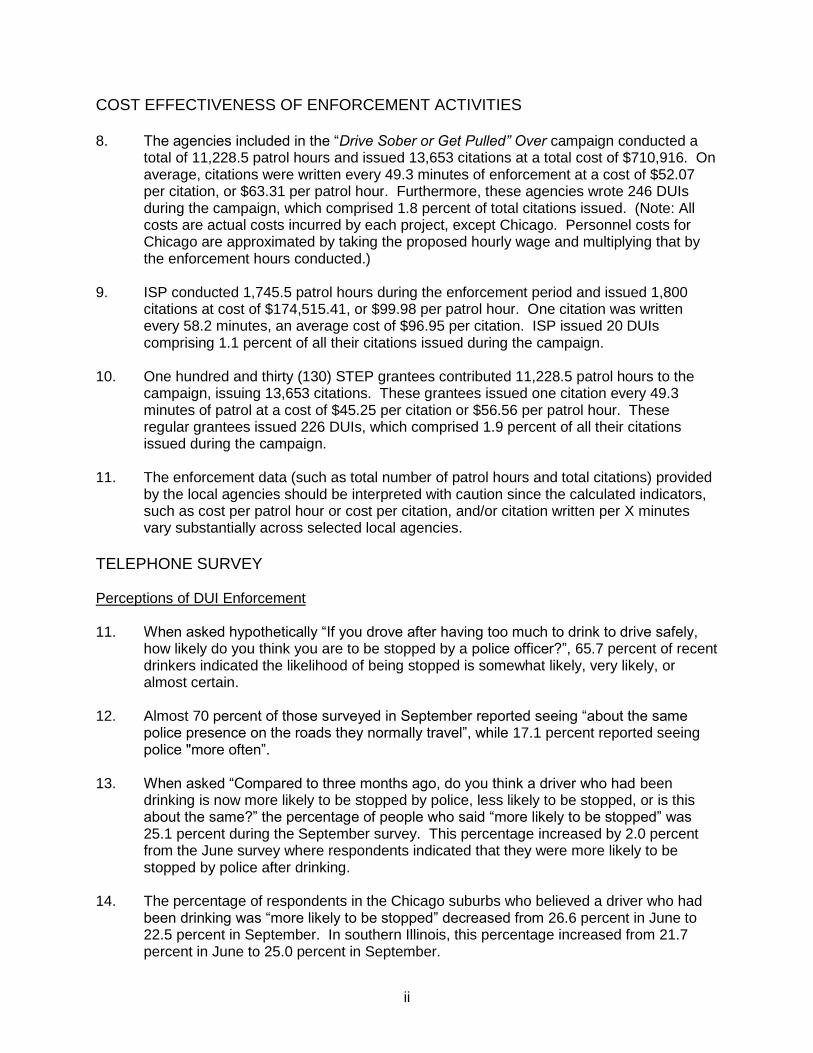
COST EFFECTIVENESS OF ENFORCEMENT ACTIVITIES 8. The agencies included in the “Drive Sober or Get Pulled” Over campaign conducted a
total of 11,228.5 patrol hours and issued 13,653 citations at a total cost of $710,916. On average, citations were written every 49.3 minutes of enforcement at a cost of $52.07 per citation, or $63.31 per patrol hour. Furthermore, these agencies wrote 246 DUIs during the campaign, which comprised 1.8 percent of total citations issued. (Note: All costs are actual costs incurred by each project, except Chicago. Personnel costs for Chicago are approximated by taking the proposed hourly wage and multiplying that by the enforcement hours conducted.)
9. ISP conducted 1,745.5 patrol hours during the enforcement period and issued 1,800
citations at cost of $174,515.41, or $99.98 per patrol hour. One citation was written every 58.2 minutes, an average cost of $96.95 per citation. ISP issued 20 DUIs comprising 1.1 percent of all their citations issued during the campaign.
10. One hundred and thirty (130) STEP grantees contributed 11,228.5 patrol hours to the
campaign, issuing 13,653 citations. These grantees issued one citation every 49.3 minutes of patrol at a cost of $45.25 per citation or $56.56 per patrol hour. These regular grantees issued 226 DUIs, which comprised 1.9 percent of all their citations issued during the campaign.
11. The enforcement data (such as total number of patrol hours and total citations) provided
by the local agencies should be interpreted with caution since the calculated indicators, such as cost per patrol hour or cost per citation, and/or citation written per X minutes vary substantially across selected local agencies.
TELEPHONE SURVEY Perceptions of DUI Enforcement 11. When asked hypothetically “If you drove after having too much to drink to drive safely,
how likely do you think you are to be stopped by a police officer?”, 65.7 percent of recent drinkers indicated the likelihood of being stopped is somewhat likely, very likely, or almost certain.
12. Almost 70 percent of those surveyed in September reported seeing “about the same
police presence on the roads they normally travel”, while 17.1 percent reported seeing police "more often”.
13. When asked “Compared to three months ago, do you think a driver who had been
drinking is now more likely to be stopped by police, less likely to be stopped, or is this about the same?” the percentage of people who said “more likely to be stopped” was 25.1 percent during the September survey. This percentage increased by 2.0 percent from the June survey where respondents indicated that they were more likely to be stopped by police after drinking.
14. The percentage of respondents in the Chicago suburbs who believed a driver who had
been drinking was “more likely to be stopped” decreased from 26.6 percent in June to 22.5 percent in September. In southern Illinois, this percentage increased from 21.7 percent in June to 25.0 percent in September.
iii
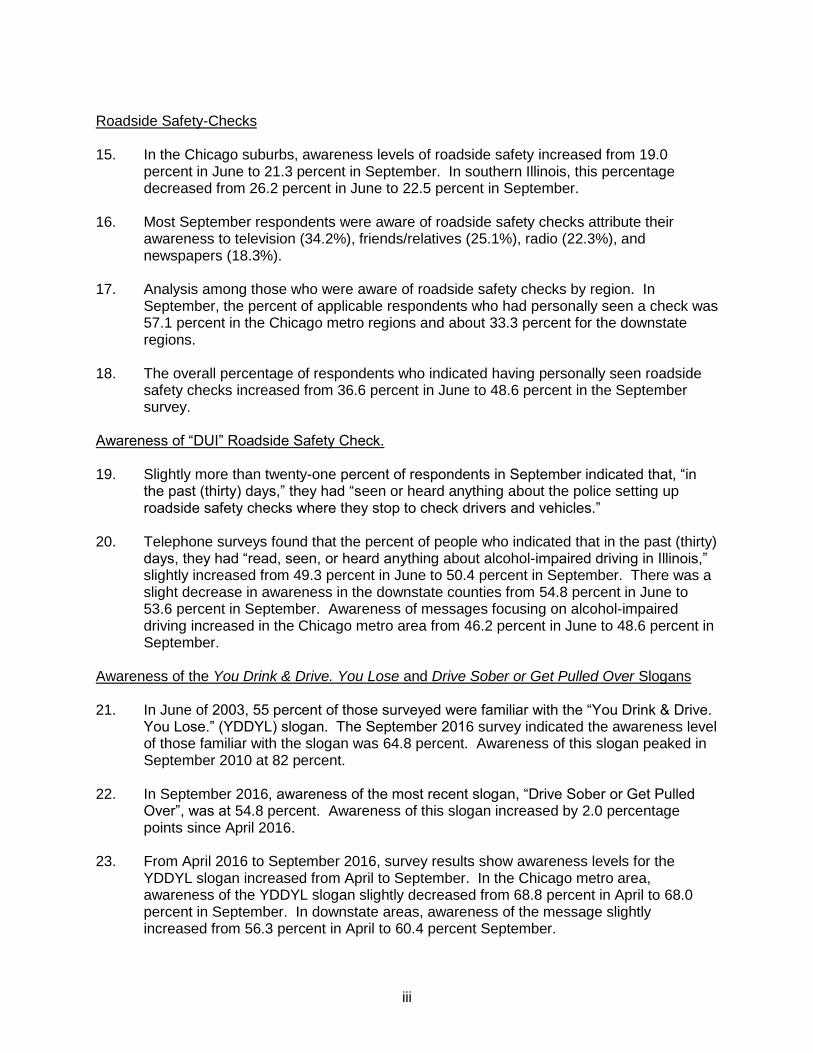
Roadside Safety-Checks 15. In the Chicago suburbs, awareness levels of roadside safety increased from 19.0
percent in June to 21.3 percent in September. In southern Illinois, this percentage decreased from 26.2 percent in June to 22.5 percent in September.
16. Most September respondents were aware of roadside safety checks attribute their
awareness to television (34.2%), friends/relatives (25.1%), radio (22.3%), and newspapers (18.3%).
17. Analysis among those who were aware of roadside safety checks by region. In
September, the percent of applicable respondents who had personally seen a check was 57.1 percent in the Chicago metro regions and about 33.3 percent for the downstate regions.
18. The overall percentage of respondents who indicated having personally seen roadside
safety checks increased from 36.6 percent in June to 48.6 percent in the September survey.
Awareness of “DUI” Roadside Safety Check. 19. Slightly more than twenty-one percent of respondents in September indicated that, “in
the past (thirty) days,” they had “seen or heard anything about the police setting up roadside safety checks where they stop to check drivers and vehicles.”
20. Telephone surveys found that the percent of people who indicated that in the past (thirty)
days, they had “read, seen, or heard anything about alcohol-impaired driving in Illinois,” slightly increased from 49.3 percent in June to 50.4 percent in September. There was a slight decrease in awareness in the downstate counties from 54.8 percent in June to 53.6 percent in September. Awareness of messages focusing on alcohol-impaired driving increased in the Chicago metro area from 46.2 percent in June to 48.6 percent in September.
Awareness of the You Drink & Drive. You Lose and Drive Sober or Get Pulled Over Slogans 21. In June of 2003, 55 percent of those surveyed were familiar with the “You Drink & Drive.
You Lose.” (YDDYL) slogan. The September 2016 survey indicated the awareness level of those familiar with the slogan was 64.8 percent. Awareness of this slogan peaked in September 2010 at 82 percent.
22. In September 2016, awareness of the most recent slogan, “Drive Sober or Get Pulled
Over”, was at 54.8 percent. Awareness of this slogan increased by 2.0 percentage points since April 2016.
23. From April 2016 to September 2016, survey results show awareness levels for the
YDDYL slogan increased from April to September. In the Chicago metro area, awareness of the YDDYL slogan slightly decreased from 68.8 percent in April to 68.0 percent in September. In downstate areas, awareness of the message slightly increased from 56.3 percent in April to 60.4 percent September.
1
Evaluation of the 2016 Labor Day Drive Sober or Get Pulled Over Campaign
August 1 - September 6, 2016
Introduction
Drive Sober or Get Pulled Over is a highly visible, massive enforcement effort designed to
detect violators of Illinois traffic laws with special emphasis on alcohol. An intense public
information and education campaign runs concurrently with an enforcement blitz to inform the
motoring public of the consequences of drinking and driving. During the campaign the Drive
Sober or Get Pulled Over message is repeated in the media and enforcement of DUI laws are
stepped up. The goal of the campaign is to save lives and reduce injuries resulting from motor
vehicle crashes by reducing the incidence of drinking and driving in Illinois. The Drive Sober or
Get Pulled Over mobilization includes the following components:
1. Earned Media1 2. Paid Media 3. Enforcement 4. Evaluation The 2016 Labor Day Drive Sober or Get Pulled Over mobilization was conducted from August 1
to September 6, 2016 with a special focus on impaired driving.
Drive Sober or Get Pulled Over Program Model
Drive Sober or Get Pulled Over is a model of the social marketing program that combines
enforcement with communication outreach (paid and earned media). The main message
regarding the benefits of not drinking and driving is not only to save lives and prevent injuries,
but to keep people from getting tickets by the police. Several alcohol-related laws, such
graduated licensing and .08 laws were passed by the Illinois legislature in the past that made it
possible for police to stop and ticket motorists who did not obey the law. As part of the Drive
Sober or Get Pulled Over campaign, several road side safety checks and saturation plans are
conducted by local and state police departments throughout the state where motorists are
stopped and checked for alcohol.
1 Earned media is coverage by broadcast and published news services. Earned media generally begins
two weeks before paid media and enforcement, and continues throughout other phases of the program. An earned media event, like a press conference and press release, typically is used to announce the ensuing enforcement program.
2
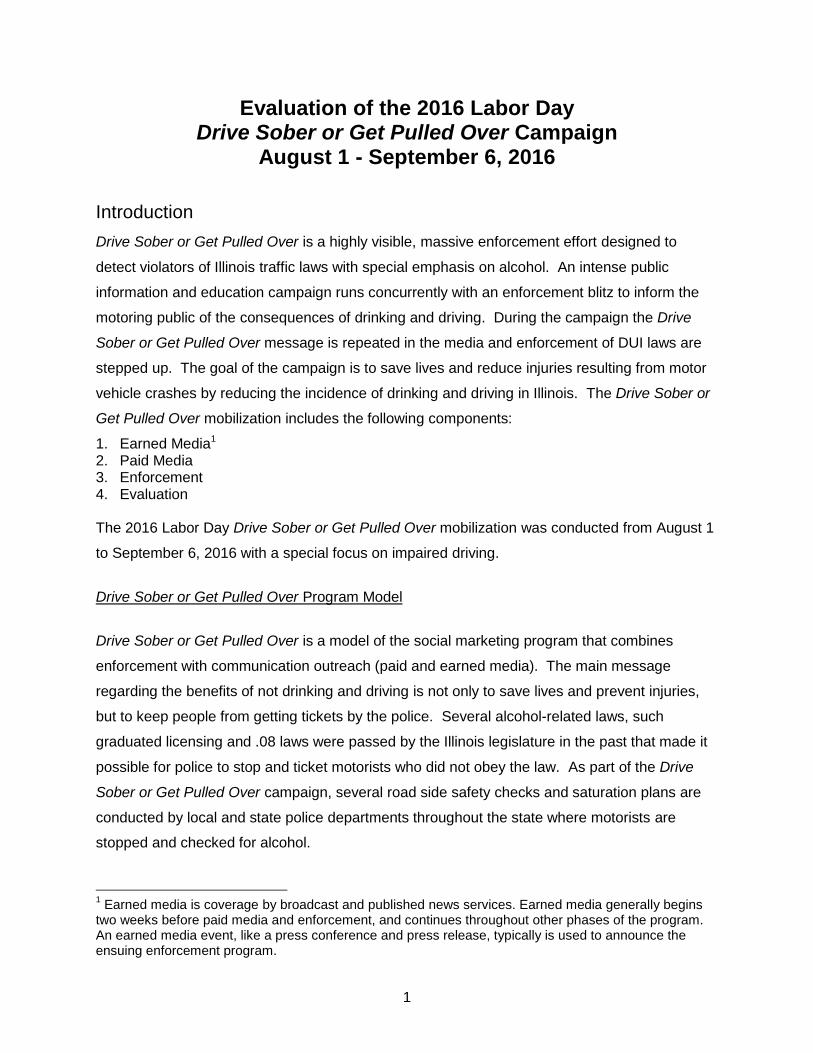
The components of the model are paid and earned media paired with local and state
enforcement to increase the public’s awareness of the consequences of drinking and driving.
These variables work together to reduce injuries and fatalities. Figure 1 shows the components
of the model.
Figure 1: Theoretical Model of “Drive Sober or Get Pulled
Over” Campaign
Earned
Media
Local
and State
Enforcement
Awareness
of Impaired
Driving
Fatalities
and
Injuries
Paid
Media +
-
+
+
+
+
Alcohol / Motor Vehicle Related Injuries and Fatalities
The relationship between drunk driving and fatalities has been well documented in the literature
(FARS, 2011). The severity of a motor vehicle crash increases when the driver is impaired.
Individuals who drive while impaired are more likely to drive recklessly and become involved in
fatal crashes. Plus, impaired drivers are less likely to use safety belts, thereby increasing their
own risk for serious injury in a crash.
3
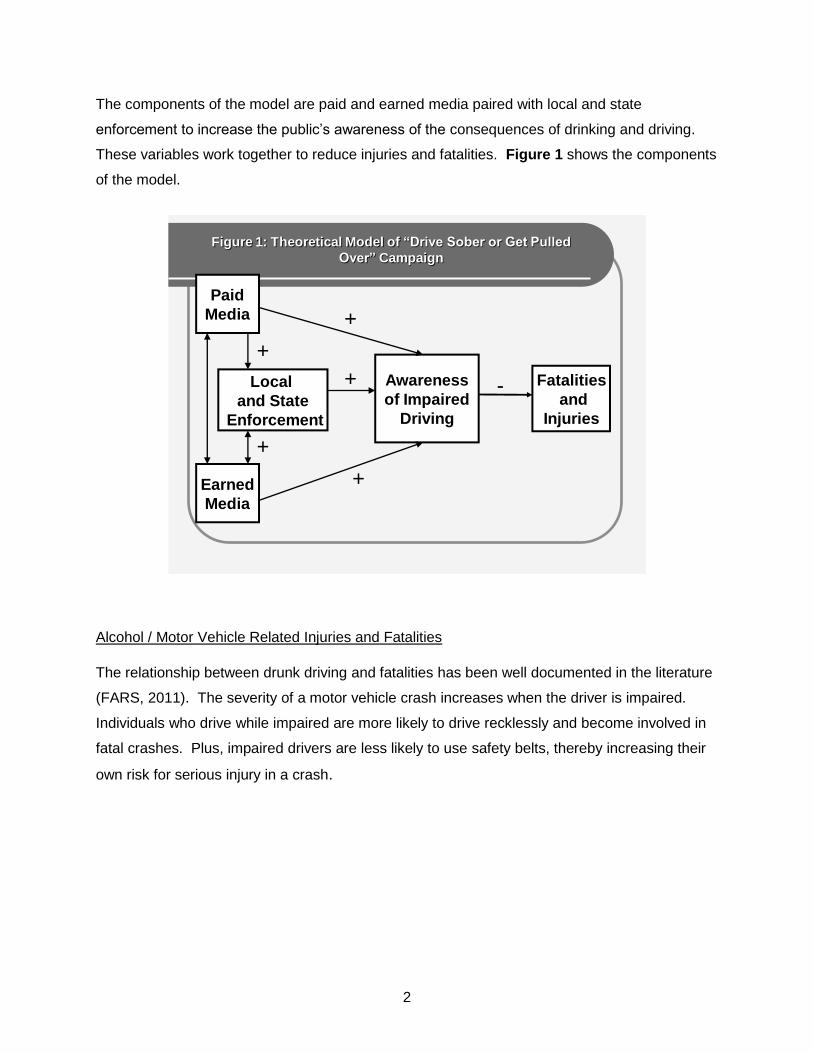
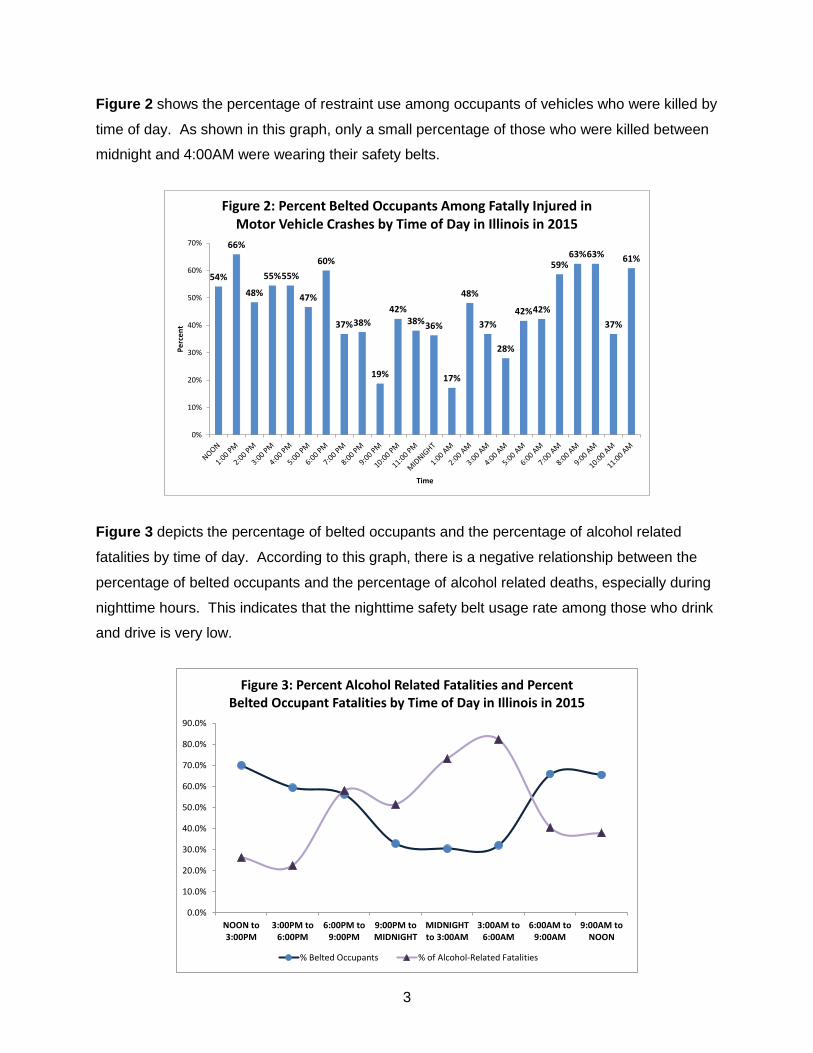
Figure 2 shows the percentage of restraint use among occupants of vehicles who were killed by
time of day. As shown in this graph, only a small percentage of those who were killed between
midnight and 4:00AM were wearing their safety belts.
Figure 3 depicts the percentage of belted occupants and the percentage of alcohol related
fatalities by time of day. According to this graph, there is a negative relationship between the
percentage of belted occupants and the percentage of alcohol related deaths, especially during
nighttime hours. This indicates that the nighttime safety belt usage rate among those who drink
and drive is very low.
54%
66%
48%
55%55%
47%
60%
37%38%
19%
42%38%36%
17%
48%
37%
28%
42%42%
59%63%63%
37%
61%
0%
10%
20%
30%
40%
50%
60%
70%
Pe
rce
nt
Time
Figure 2: Percent Belted Occupants Among Fatally Injured in Motor Vehicle Crashes by Time of Day in Illinois in 2015
0.0%
10.0%
20.0%
30.0%
40.0%
50.0%
60.0%
70.0%
80.0%
90.0%
NOON to3:00PM
3:00PM to6:00PM
6:00PM to9:00PM
9:00PM toMIDNIGHT
MIDNIGHTto 3:00AM
3:00AM to6:00AM
6:00AM to9:00AM
9:00AM toNOON
Figure 3: Percent Alcohol Related Fatalities and Percent Belted Occupant Fatalities by Time of Day in Illinois in 2015
% Belted Occupants % of Alcohol-Related Fatalities
4
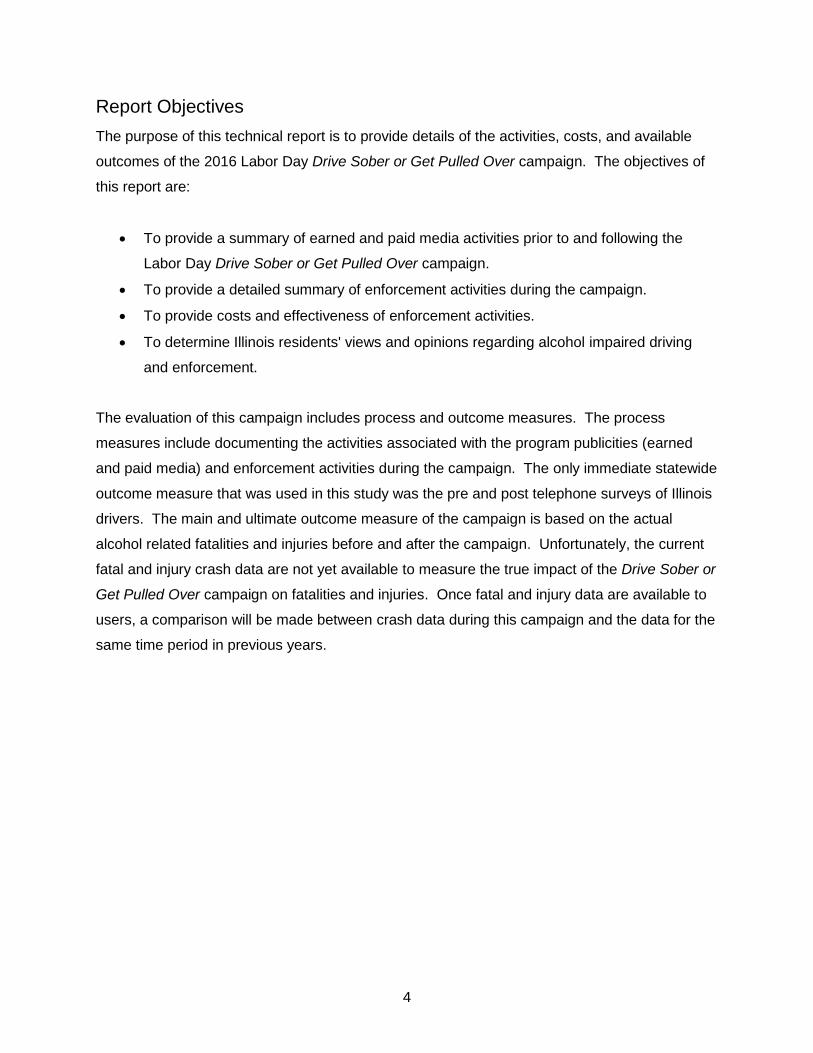
Report Objectives
The purpose of this technical report is to provide details of the activities, costs, and available
outcomes of the 2016 Labor Day Drive Sober or Get Pulled Over campaign. The objectives of
this report are:
To provide a summary of earned and paid media activities prior to and following the
Labor Day Drive Sober or Get Pulled Over campaign.
To provide a detailed summary of enforcement activities during the campaign.
To provide costs and effectiveness of enforcement activities.
To determine Illinois residents' views and opinions regarding alcohol impaired driving
and enforcement.
The evaluation of this campaign includes process and outcome measures. The process
measures include documenting the activities associated with the program publicities (earned
and paid media) and enforcement activities during the campaign. The only immediate statewide
outcome measure that was used in this study was the pre and post telephone surveys of Illinois
drivers. The main and ultimate outcome measure of the campaign is based on the actual
alcohol related fatalities and injuries before and after the campaign. Unfortunately, the current
fatal and injury crash data are not yet available to measure the true impact of the Drive Sober or
Get Pulled Over campaign on fatalities and injuries. Once fatal and injury data are available to
users, a comparison will be made between crash data during this campaign and the data for the
same time period in previous years.
5
2016 Labor Day Drive Sober or Get Pulled Over Campaign in Illinois:
Timeline of Activities
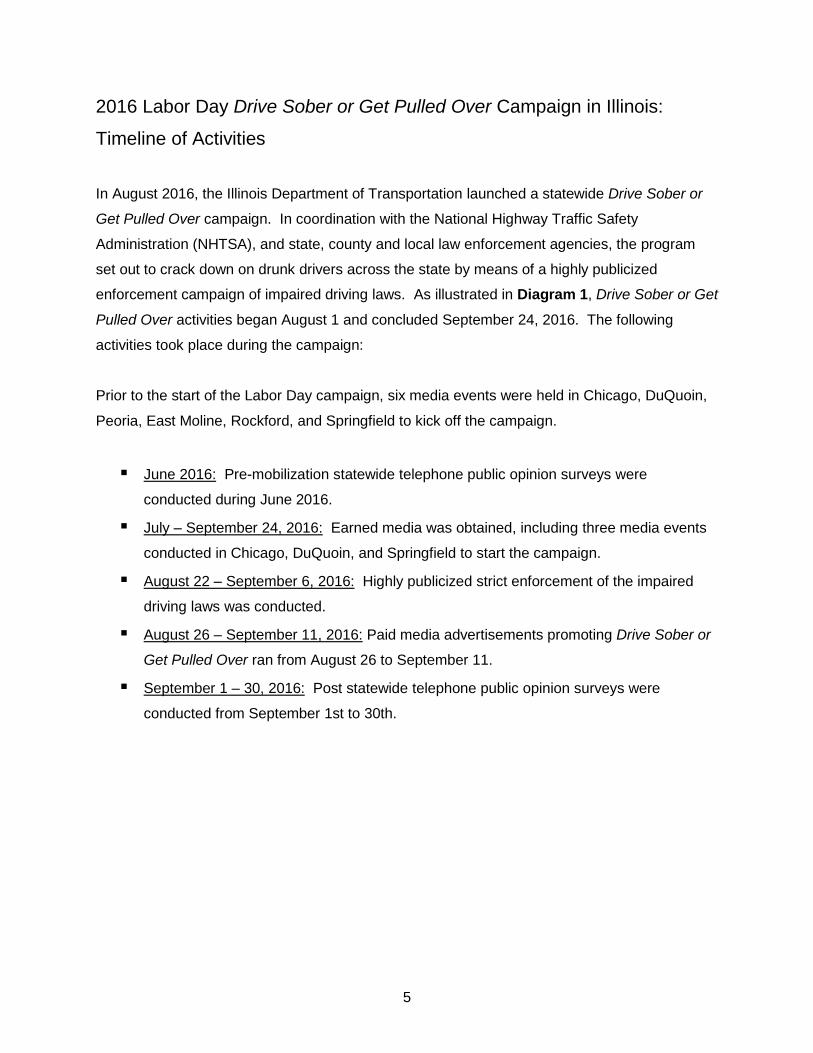
In August 2016, the Illinois Department of Transportation launched a statewide Drive Sober or
Get Pulled Over campaign. In coordination with the National Highway Traffic Safety
Administration (NHTSA), and state, county and local law enforcement agencies, the program
set out to crack down on drunk drivers across the state by means of a highly publicized
enforcement campaign of impaired driving laws. As illustrated in Diagram 1, Drive Sober or Get
Pulled Over activities began August 1 and concluded September 24, 2016. The following
activities took place during the campaign:
Prior to the start of the Labor Day campaign, six media events were held in Chicago, DuQuoin,
Peoria, East Moline, Rockford, and Springfield to kick off the campaign.
June 2016: Pre-mobilization statewide telephone public opinion surveys were
conducted during June 2016.
July – September 24, 2016: Earned media was obtained, including three media events
conducted in Chicago, DuQuoin, and Springfield to start the campaign.
August 22 – September 6, 2016: Highly publicized strict enforcement of the impaired
driving laws was conducted.
August 26 – September 11, 2016: Paid media advertisements promoting Drive Sober or
Get Pulled Over ran from August 26 to September 11.
September 1 – 30, 2016: Post statewide telephone public opinion surveys were
conducted from September 1st to 30th.
6
Diagram 1: 2016 Drive Sober or Get Pulled Over Campaign Timeline
Note: The pre-telephone survey was conducted during June 2016.
7
MEDIA & ENFORCEMENT RESULTS
8
Media
Earned Media
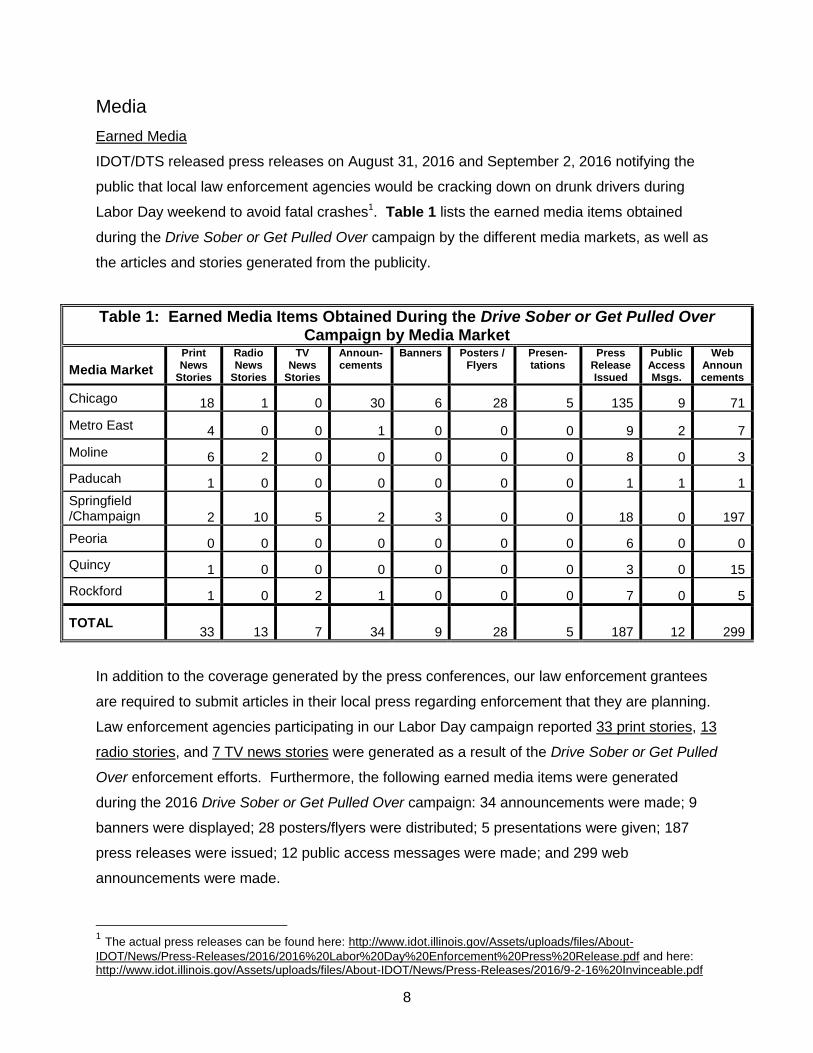
IDOT/DTS released press releases on August 31, 2016 and September 2, 2016 notifying the
public that local law enforcement agencies would be cracking down on drunk drivers during
Labor Day weekend to avoid fatal crashes1. Table 1 lists the earned media items obtained
during the Drive Sober or Get Pulled Over campaign by the different media markets, as well as
the articles and stories generated from the publicity.
Table 1: Earned Media Items Obtained During the Drive Sober or Get Pulled Over Campaign by Media Market
Media Market
Print News
Stories
Radio News
Stories
TV News
Stories
Announ-cements
Banners Posters / Flyers
Presen-tations
Press Release Issued
Public Access Msgs.
Web Announcements
Chicago 18 1 0 30 6 28 5 135 9 71
Metro East 4 0 0 1 0 0 0 9 2 7
Moline 6 2 0 0 0 0 0 8 0 3
Paducah 1 0 0 0 0 0 0 1 1 1
Springfield /Champaign 2 10 5 2 3 0 0 18 0 197
Peoria 0 0 0 0 0 0 0 6 0 0
Quincy 1 0 0 0 0 0 0 3 0 15
Rockford 1 0 2 1 0 0 0 7 0 5
TOTAL 33 13 7 34 9 28 5 187 12 299
In addition to the coverage generated by the press conferences, our law enforcement grantees
are required to submit articles in their local press regarding enforcement that they are planning.
Law enforcement agencies participating in our Labor Day campaign reported 33 print stories, 13
radio stories, and 7 TV news stories were generated as a result of the Drive Sober or Get Pulled
Over enforcement efforts. Furthermore, the following earned media items were generated
during the 2016 Drive Sober or Get Pulled Over campaign: 34 announcements were made; 9
banners were displayed; 28 posters/flyers were distributed; 5 presentations were given; 187
press releases were issued; 12 public access messages were made; and 299 web
announcements were made.
1 The actual press releases can be found here: http://www.idot.illinois.gov/Assets/uploads/files/About-
IDOT/News/Press-Releases/2016/2016%20Labor%20Day%20Enforcement%20Press%20Release.pdf and here: http://www.idot.illinois.gov/Assets/uploads/files/About-IDOT/News/Press-Releases/2016/9-2-16%20Invinceable.pdf
9
Paid Media
Paid alcohol enforcement messages are aired repeatedly during the Drive Sober or Get Pulled
Over campaign publicity period. Messages are focused on enforcement, reminding motorists to
not drink and drive. Drive Sober or Get Pulled Over paid advertisement campaigns usually last
two weeks, but, due to the online/mobile advertisements being ran, paid media ran an additional
two weeks. During this period, television and online/mobile advertisements run extensively.
Paid media targeted the Drive Sober or Get Pulled Over message in the 23 specified counties in
Illinois where about 85 percent of population resides and 70 percent of fatalities occur. Top-
rated stations and programming were chosen based on Arbitron and Nielson ratings systems
focusing on the 18-34 year old African-American, Hispanic and rural male demographic.
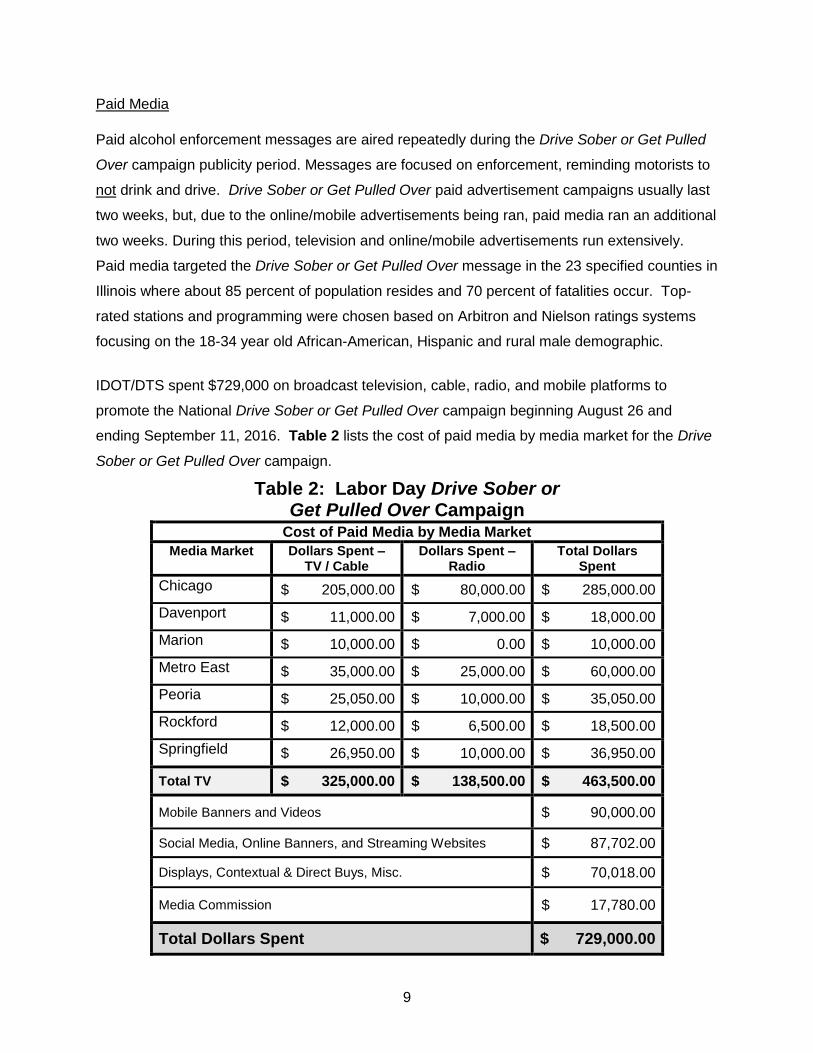
IDOT/DTS spent $729,000 on broadcast television, cable, radio, and mobile platforms to
promote the National Drive Sober or Get Pulled Over campaign beginning August 26 and
ending September 11, 2016. Table 2 lists the cost of paid media by media market for the Drive
Sober or Get Pulled Over campaign.
Table 2: Labor Day Drive Sober or Get Pulled Over Campaign
Cost of Paid Media by Media Market
Media Market Dollars Spent – TV / Cable
Dollars Spent – Radio
Total Dollars Spent
Chicago $ 205,000.00 $ 80,000.00 $ 285,000.00
Davenport $ 11,000.00 $ 7,000.00 $ 18,000.00
Marion $ 10,000.00 $ 0.00 $ 10,000.00
Metro East $ 35,000.00 $ 25,000.00 $ 60,000.00
Peoria $ 25,050.00 $ 10,000.00 $ 35,050.00
Rockford $ 12,000.00 $ 6,500.00 $ 18,500.00
Springfield $ 26,950.00 $ 10,000.00 $ 36,950.00
Total TV $ 325,000.00 $ 138,500.00 $ 463,500.00
Mobile Banners and Videos $ 90,000.00
Social Media, Online Banners, and Streaming Websites $ 87,702.00
Displays, Contextual & Direct Buys, Misc. $ 70,018.00
Media Commission $ 17,780.00
Total Dollars Spent $ 729,000.00
10
Enforcement
The Drive Sober or Get Pulled Over Labor Day enforcement campaign lasted two weeks.
During this period, zero-tolerance enforcement focusing on alcohol violations was carried out
statewide. One hundred thirty (130) local law enforcement agencies and Illinois State Police
participated in the 2016 Labor Day alcohol mobilization. A total of 28 roadside safety checks
and 1,013 saturation patrols were conducted during the August 22 to September 6, 2016
enforcement period.
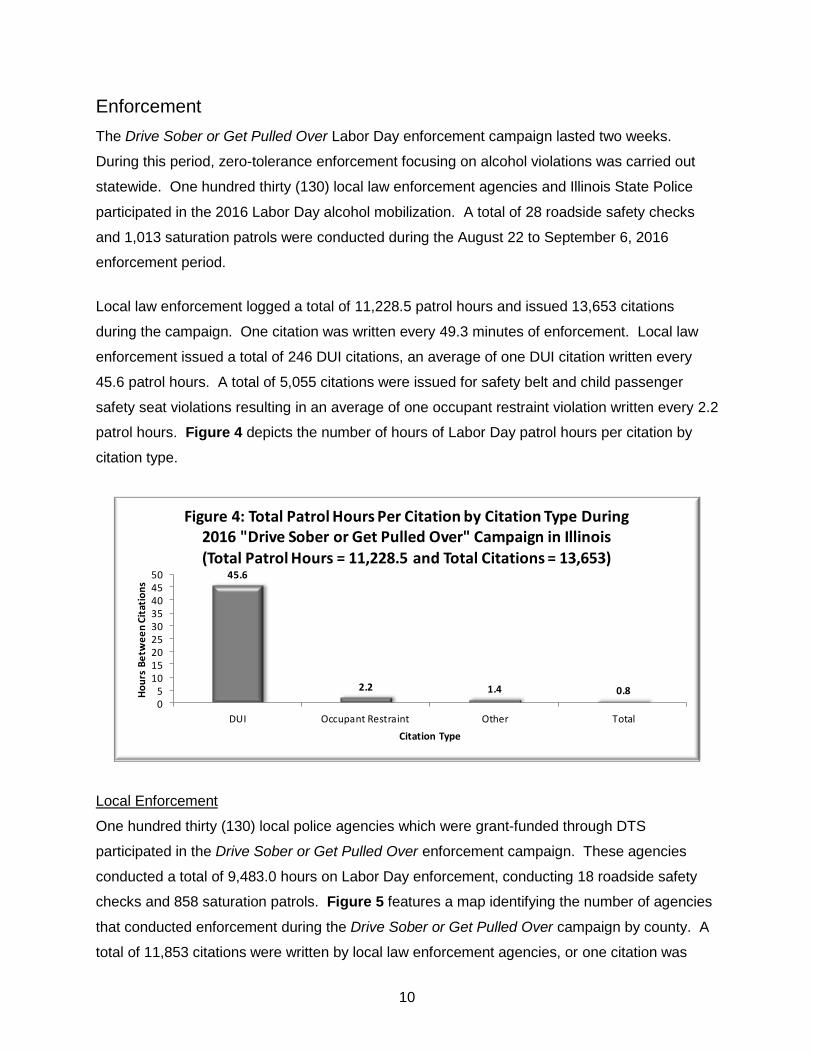
Local law enforcement logged a total of 11,228.5 patrol hours and issued 13,653 citations
during the campaign. One citation was written every 49.3 minutes of enforcement. Local law
enforcement issued a total of 246 DUI citations, an average of one DUI citation written every
45.6 patrol hours. A total of 5,055 citations were issued for safety belt and child passenger
safety seat violations resulting in an average of one occupant restraint violation written every 2.2
patrol hours. Figure 4 depicts the number of hours of Labor Day patrol hours per citation by
citation type.
45.6
2.2 1.4 0.805
101520253035404550
DUI Occupant Restraint Other Total
Ho
urs
Be
twe
en
Cit
atio
ns
Citation Type
Figure 4: Total Patrol Hours Per Citation by Citation Type During 2016 "Drive Sober or Get Pulled Over" Campaign in Illinois
(Total Patrol Hours = 11,228.5 and Total Citations = 13,653)
Local Enforcement
One hundred thirty (130) local police agencies which were grant-funded through DTS
participated in the Drive Sober or Get Pulled Over enforcement campaign. These agencies
conducted a total of 9,483.0 hours on Labor Day enforcement, conducting 18 roadside safety
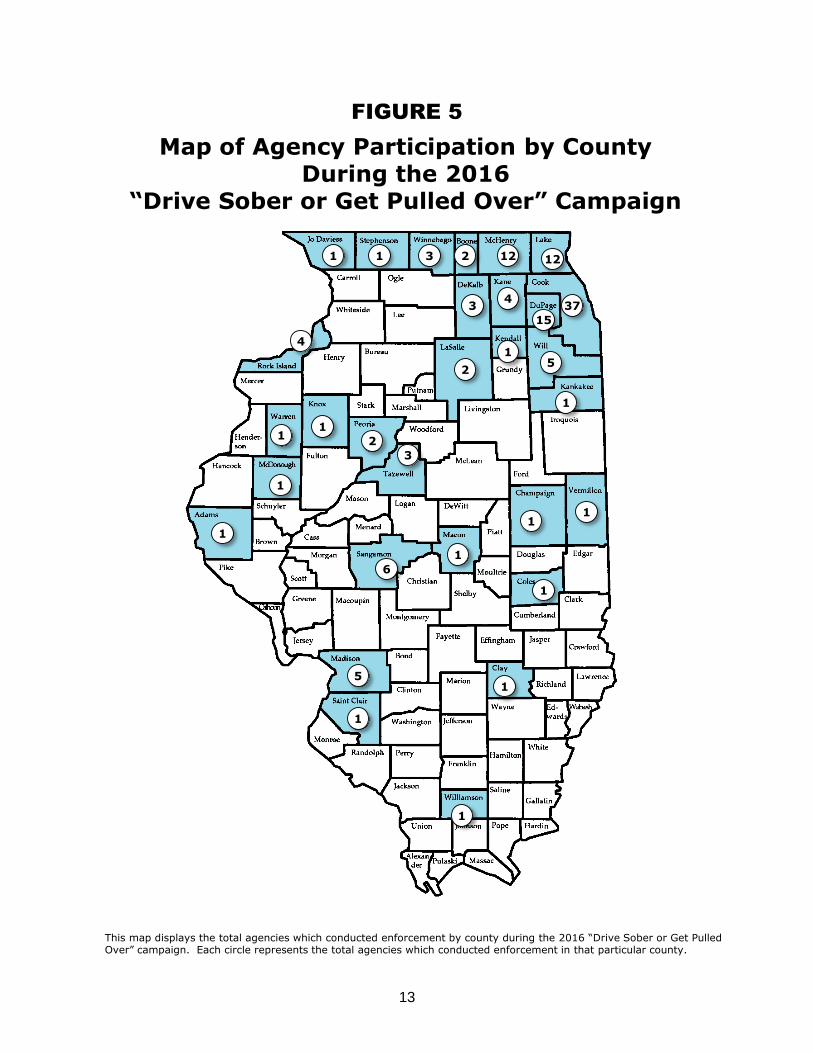
checks and 858 saturation patrols. Figure 5 features a map identifying the number of agencies
that conducted enforcement during the Drive Sober or Get Pulled Over campaign by county. A
total of 11,853 citations were written by local law enforcement agencies, or one citation was
11
written every 48.0 minutes of enforcement. Local law enforcement issued a combined total of
226 DUI citations, an average of one citation written for every 42.0 patrol hours. In addition,
4,294 occupant restraint violations were issued for failure to wear a safety belt or failure to
properly restrain a child in a safety seat. An average of one occupant protection citation was
written for every 2.2 patrol hours.
Illinois State Police Enforcement
All Illinois State Police Districts participated in statewide alcohol enforcement, covering 98 of
Illinois’ 102 counties. ISP conducted 1,745.5 hours of enforcement including 10 roadside safety
checks and 155 saturation patrols. Of the total 1,800 citations issued by the ISP, one hundred
and one (20) were DUI-related citations and 761 were safety belt and child safety seat citations.
On average ISP wrote one DUI for every 87.3 patrol hours and one safety belt / child safety seat
citation for every 2.3 patrol hours.
Earned Enforcement
There was no earned enforcement conducted during the FY16 Labor Day campaign.
12
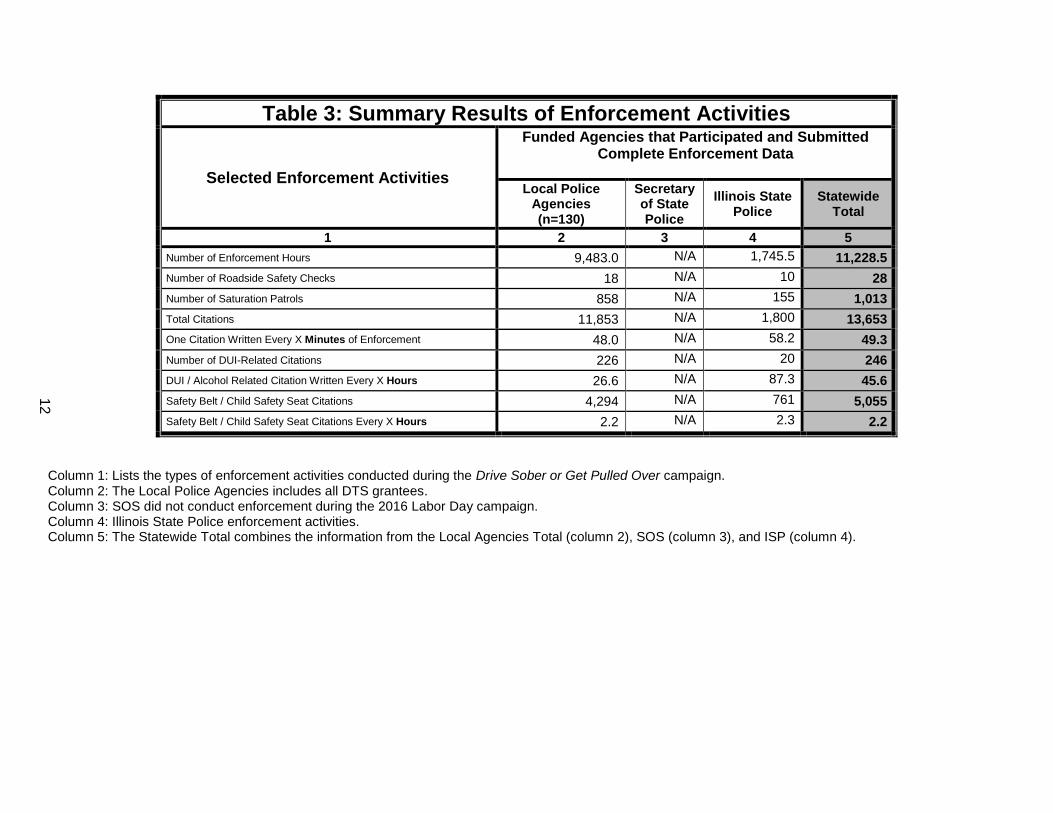
Table 3: Summary Results of Enforcement Activities
Selected Enforcement Activities
Funded Agencies that Participated and Submitted Complete Enforcement Data
Local Police Agencies (n=130)
Secretary of State Police
Illinois State Police
Statewide Total
1 2 3 4 5
Number of Enforcement Hours 9,483.0 N/A 1,745.5 11,228.5
Number of Roadside Safety Checks 18 N/A 10 28
Number of Saturation Patrols 858 N/A 155 1,013
Total Citations 11,853 N/A 1,800 13,653
One Citation Written Every X Minutes of Enforcement 48.0 N/A 58.2 49.3
Number of DUI-Related Citations 226 N/A 20 246
DUI / Alcohol Related Citation Written Every X Hours 26.6 N/A 87.3 45.6
Safety Belt / Child Safety Seat Citations 4,294 N/A 761 5,055
Safety Belt / Child Safety Seat Citations Every X Hours 2.2 N/A 2.3 2.2
Column 1: Lists the types of enforcement activities conducted during the Drive Sober or Get Pulled Over campaign. Column 2: The Local Police Agencies includes all DTS grantees. Column 3: SOS did not conduct enforcement during the 2016 Labor Day campaign. Column 4: Illinois State Police enforcement activities. Column 5: The Statewide Total combines the information from the Local Agencies Total (column 2), SOS (column 3), and ISP (column 4).
13
FIGURE 5
37
15
5
1
1
4
12231
2
1
4
1
2
1
3
1
1
6
1
5
1
Map of Agency Participation by County During the 2016
“Drive Sober or Get Pulled Over” Campaign
This map displays the total agencies which conducted enforcement by county during the 2016 “Drive Sober or Get Pulled Over” campaign. Each circle represents the total agencies which conducted enforcement in that particular county.
1
1
12
1
1
3
1
14
Cost / Effectiveness Analysis of Drive Sober or Get Pulled Over Enforcement
Activities
In an effort to assess the costs and effectiveness of enforcement activities, actual
reimbursement claims paid out for local and state agencies were used to calculate cost per hour
of enforcement and cost per citation during the Drive Sober or Get Pulled Over campaign.
A cost / effectiveness analysis was performed for those agencies participating in the Drive
Sober or Get Pulled Over campaign.
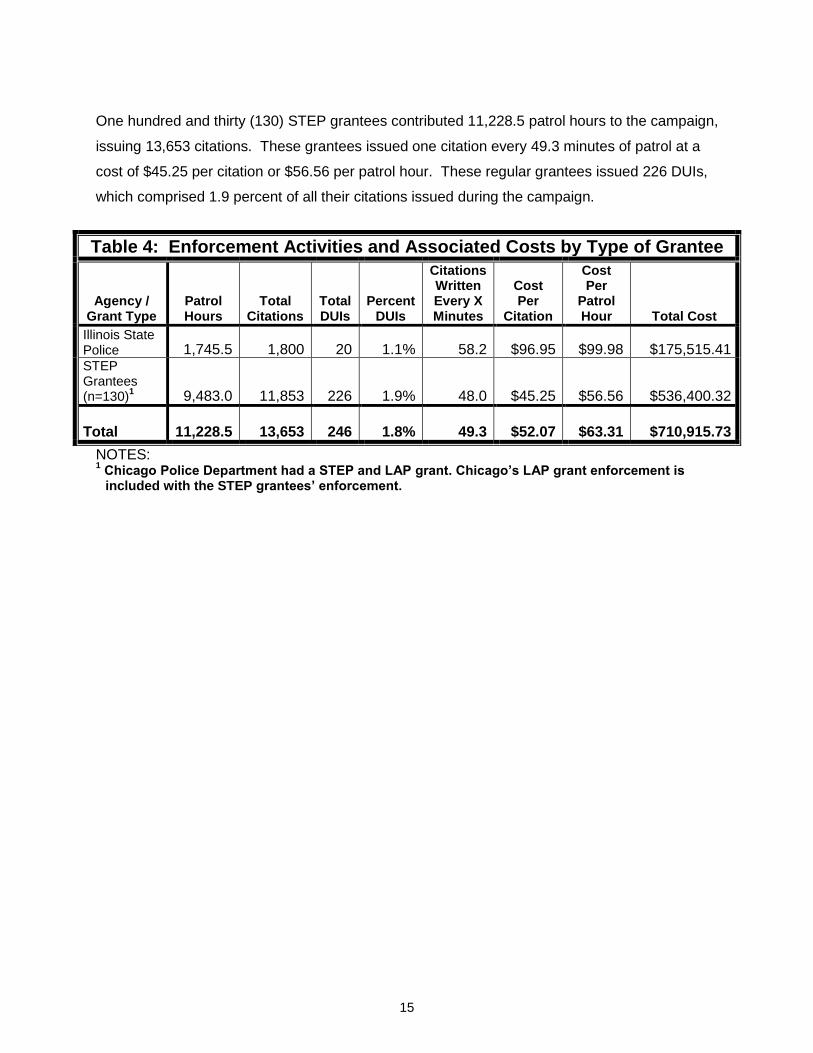
Table 4 summarizes enforcement activities (patrol hours, citations, total DUIs, percentage of
total citations that were DUIs, citation written every X minutes of patrol, cost per citation, cost
per patrol hour, and cost of project) by grant type. (Note: All costs are actual costs incurred by
each project, except Chicago. Personnel costs for Chicago are approximated by taking the
proposed hourly wage and multiplying that by the enforcement hours conducted.)
One hundred and thirty (130) STEP grantees and Illinois State Police were included in this cost /
effectiveness analysis. These agencies conducted a total of 11,228.5 patrol hours and issued
13,653 citations during enforcement at a total cost of $710,915.73. On average, one citation
was written for every 51.2 minutes during enforcement at an average cost of $52.07 per citation,
or $63.31 per patrol hour. Furthermore, the emphasis of the Drive Sober or Get Pulled Over
campaign was to reduce the drunk driving. A total of 246 DUIs were written by these agencies,
which comprised 1.8 percent of all citations issued during the campaign. See Appendix A for a
detailed listing of enforcement activities and costs by agency.
Illinois State Police
ISP conducted 1,745.5 patrol hours during the enforcement period and issued 1,800 citations at
cost of $174,515.41, or $99.98 per patrol hour. One citation was written every 58.2 minutes, an
average cost of $96.95 per citation. ISP issued 20 DUIs comprising 1.1 percent of all their
citations issued during the campaign.
Local Police Agencies
A total of 130 agencies STEP grants with DTS. Chicago Police Department had both a STEP
grant and LAP grant. Refer to Appendix A (Table 5) to see each agency’s enforcement
activities and associated costs. Table 6 shows the aggregate enforcement activities and their
associated costs by grant type.
15
One hundred and thirty (130) STEP grantees contributed 11,228.5 patrol hours to the campaign,
issuing 13,653 citations. These grantees issued one citation every 49.3 minutes of patrol at a
cost of $45.25 per citation or $56.56 per patrol hour. These regular grantees issued 226 DUIs,
which comprised 1.9 percent of all their citations issued during the campaign.
Table 4: Enforcement Activities and Associated Costs by Type of Grantee
Agency / Grant Type
Patrol Hours
Total Citations
Total DUIs
Percent DUIs
Citations Written Every X Minutes
Cost Per
Citation
Cost Per
Patrol Hour Total Cost
Illinois State Police 1,745.5 1,800 20 1.1% 58.2 $96.95 $99.98 $175,515.41 STEP Grantees (n=130)
1 9,483.0 11,853 226 1.9% 48.0 $45.25 $56.56 $536,400.32
Total 11,228.5 13,653 246 1.8% 49.3 $52.07 $63.31 $710,915.73
NOTES: 1 Chicago Police Department had a STEP and LAP grant. Chicago’s LAP grant enforcement is included with the STEP grantees’ enforcement.
16
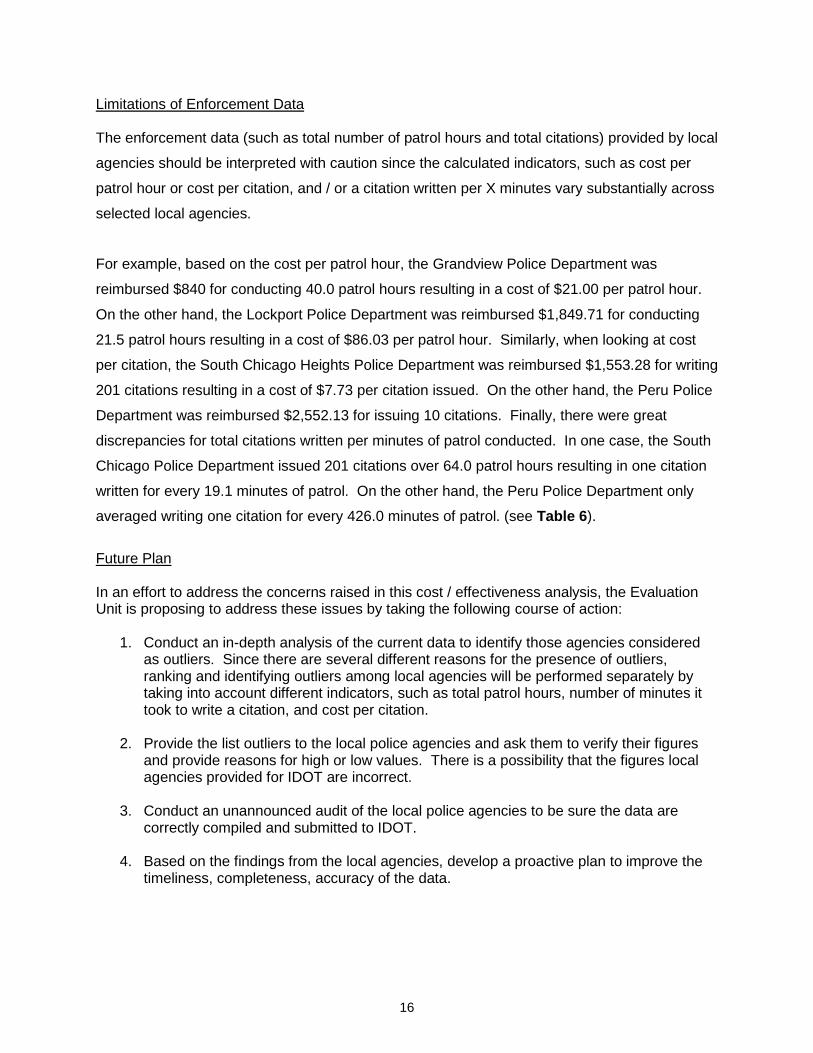
Limitations of Enforcement Data The enforcement data (such as total number of patrol hours and total citations) provided by local
agencies should be interpreted with caution since the calculated indicators, such as cost per
patrol hour or cost per citation, and / or a citation written per X minutes vary substantially across
selected local agencies.
For example, based on the cost per patrol hour, the Grandview Police Department was
reimbursed $840 for conducting 40.0 patrol hours resulting in a cost of $21.00 per patrol hour.
On the other hand, the Lockport Police Department was reimbursed $1,849.71 for conducting
21.5 patrol hours resulting in a cost of $86.03 per patrol hour. Similarly, when looking at cost
per citation, the South Chicago Heights Police Department was reimbursed $1,553.28 for writing
201 citations resulting in a cost of $7.73 per citation issued. On the other hand, the Peru Police
Department was reimbursed $2,552.13 for issuing 10 citations. Finally, there were great
discrepancies for total citations written per minutes of patrol conducted. In one case, the South
Chicago Police Department issued 201 citations over 64.0 patrol hours resulting in one citation
written for every 19.1 minutes of patrol. On the other hand, the Peru Police Department only
averaged writing one citation for every 426.0 minutes of patrol. (see Table 6).
Future Plan In an effort to address the concerns raised in this cost / effectiveness analysis, the Evaluation Unit is proposing to address these issues by taking the following course of action:
1. Conduct an in-depth analysis of the current data to identify those agencies considered as outliers. Since there are several different reasons for the presence of outliers, ranking and identifying outliers among local agencies will be performed separately by taking into account different indicators, such as total patrol hours, number of minutes it took to write a citation, and cost per citation.
2. Provide the list outliers to the local police agencies and ask them to verify their figures
and provide reasons for high or low values. There is a possibility that the figures local agencies provided for IDOT are incorrect.
3. Conduct an unannounced audit of the local police agencies to be sure the data are
correctly compiled and submitted to IDOT.
4. Based on the findings from the local agencies, develop a proactive plan to improve the timeliness, completeness, accuracy of the data.
17
EVALUATION
18
Evaluation
As indicated earlier in this report, an evaluation of the Drive Sober or Get Pulled Over campaign
includes process measures (e.g., documenting the activities associated with campaign media
and enforcement activities) and outcome measures, such as pre and post telephone surveys of
Illinois drivers. The pre and post telephone surveys were conducted in order to measure the
impact of paid/earned media and enforcement activities on the public’s knowledge and attitude
toward the mobilization. The surveys were conducted through the Survey Research Office at
the University of Illinois at Springfield. In addition to the evaluation of public perception on the
campaign, we will conduct an outcome evaluation of the campaign on motor vehicle related
injuries and fatalities when the actual crash data become available in the near future.
Overview of Telephone Survey Findings
Telephone surveys showed that the percent of people who indicated that “in the past (thirty)
days, they had read, seen, or heard anything about alcohol-impaired driving in Illinois,” slightly
decreased statewide from 50.4 percent in June to 49.3 percent in September. Similar changes
were seen among those surveyed in the Chicago area where awareness increased from 46.2
percent in June to 48.6 percent in September. In the downstate areas, awareness of those
messages decreased from 54.8 percent in June to 53.6 percent in September. Of those
telephone respondents who had heard or seen messages about alcohol-impaired driving, by far
the greatest exposure source was television (68.1 percent).
Telephone survey respondents were asked about their awareness of sixteen selected traffic
safety slogans in June and September. Eight slogans related to drinking and driving.
Awareness of the “Drive Sober or Get Pulled Over” slogan slightly increased by 2.0 percentage
points from 52.8 percent in April to 54.8 percent in September. Awareness of the “Drunk
Driving. Over the Limit. Under Arrest.” slogan increased from 18.9 percent in April to 26.4
percent in September. Awareness of the “You Drink and Drive. You Lose.” slogan slightly
increased from 64.3 percent in April to 64.8 percent in September.
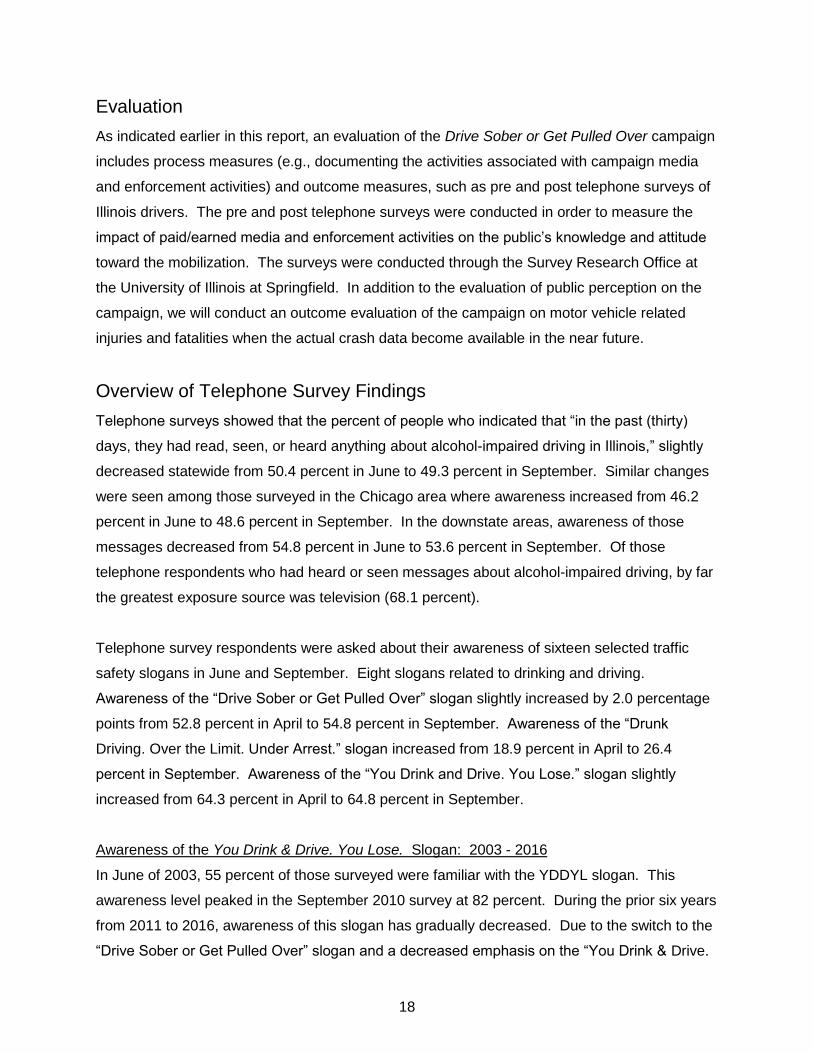
Awareness of the You Drink & Drive. You Lose. Slogan: 2003 - 2016
In June of 2003, 55 percent of those surveyed were familiar with the YDDYL slogan. This
awareness level peaked in the September 2010 survey at 82 percent. During the prior six years
from 2011 to 2016, awareness of this slogan has gradually decreased. Due to the switch to the
“Drive Sober or Get Pulled Over” slogan and a decreased emphasis on the “You Drink & Drive.
19
You Lose.,” it is not surprising to see decreased awareness of the “You Drink & Drive. You
Lose.” slogan in most recent years. Figure 6 displays the awareness of the YDDYL slogan
from 2003 to 2016.
Awareness of the Drive Sober or Get Pulled Over slogan: 2016
The Drive Sober or Get Pulled Over slogan is the new national slogan for alcohol awareness. It
was recently incorporated into Illinois’s Labor Day enforcement campaign within the last few
years. In April 2016, awareness of this message was 52.8 percent. In September 2016,
awareness of this message increased to 54.8 percent. Awareness of this message has shown
an increase over previous years.
Detailed results of the pre / post telephone survey will be presented in the next section.
0%
10%
20%
30%
40%
50%
60%
70%
80%
90%
Per
cen
tage
Aw
aren
ess
Survey Month and Year
Figure 6: Awareness of You Drink & Drive. You Lose. Slogan in Illinois
(June 2003 through September 2016)
20
STATEWIDE TELEPHONE SURVEY
0
ILLINOIS STATEWIDE LABOR DAY 2016 ALCOHOL IMPAIRED DRIVING ENFORCEMENT CAMPAIGN SURVEYS
Conducted for:
Division of Traffic Safety
October 24, 2016 Summary Report
Results from the June and September 2016 Surveys
(Supplemented with Selected Findings from the April 2016 Survey)
Conducted by the:
1
Introduction The Illinois Department of Transportation, Division of Traffic Safety, contracted with the Survey
Research Office, located in the Center for State Policy and Leadership of the University of
Illinois Springfield to conduct three statewide telephone surveys from April through September,
2016 relating to either seat belt or DUI-related enforcement and media campaigns. The first
survey was conducted from late March to May (hereinafter, the “April survey”) prior to the
Memorial Day weekend; the second was conducted in June and early July (the “June survey”),
after the Memorial Day weekend; and the third survey was conducted in September and
October (the “September survey”), after the Labor Day weekend.
The April survey contained questions regarding seat belt-related opinions and behaviors
and was administered prior to an enforcement and media campaign that took place in a time
period surrounding the Memorial Day weekend. The September survey was administered after
a DUI enforcement campaign that took place in a time period surrounding Labor Day weekend.
Thus, the April survey serves as a “pre-test” for the Memorial Day seat belt enforcement and
media campaign, while the June survey serves as a “post-test” for this campaign. Similarly, the
June survey serves as a “pre-test” for the Labor Day DUI enforcement campaign, with the
September survey serving as a “post-test” for this campaign.
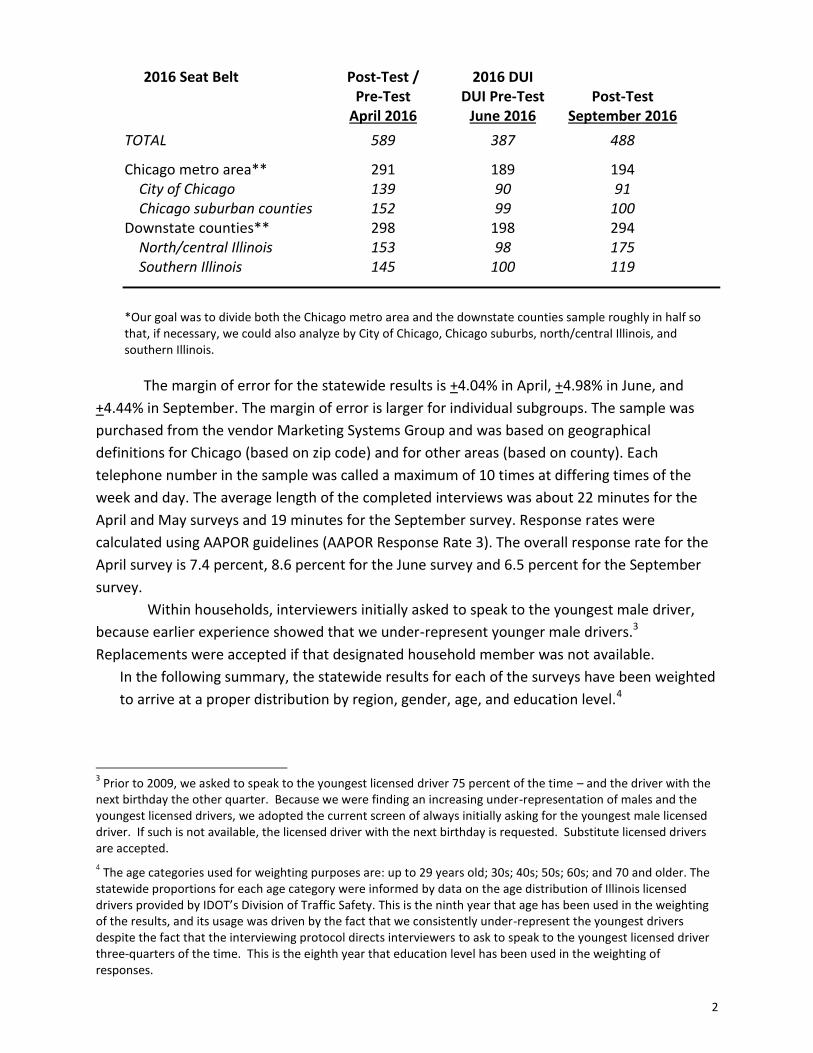
Methodology The sampling methodology for the three surveys was similar to that of other recent telephone
surveys on seat belt and DUI initiative topics conducted for IDOT’s Division of Traffic Safety.
The state was first stratified into the Chicago metro area and the remaining Illinois counties,
known as “downstate.” The Chicago metro area was further stratified into the City of Chicago
and the Chicago area suburbs, which included the Cook County suburbs and the suburbs in the
five “collar” counties. The downstate area was further subdivided into north/central Illinois and
southern Illinois. Thus, the statewide surveys had four stratified geographic regions: City of
Chicago, Chicago suburban counties, and the downstate counties, subdivided into north/central
Illinois and southern Illinois. Random samples of telephone numbers were purchased for each
of the four stratification areas (City of Chicago, Chicago suburban counties, north/central
Illinois, and southern Illinois).
Field interviewing for the latest September survey was conducted from September 14
September 28, with 488 licensed drivers. Field interviewing for the June statewide survey was
conducted from June 16 through July 8, 2016 with 387 licensed drivers. And, field interviewing
for the April survey was conducted from March 28 through May 8, 2016, with 589 licensed
drivers.
The numbers of completions for each stratification group are presented below for the
three surveys. It should be noted that statewide results reported in this summary have been
weighted to correct for the intentional over/under-representation of the respective regions.
2
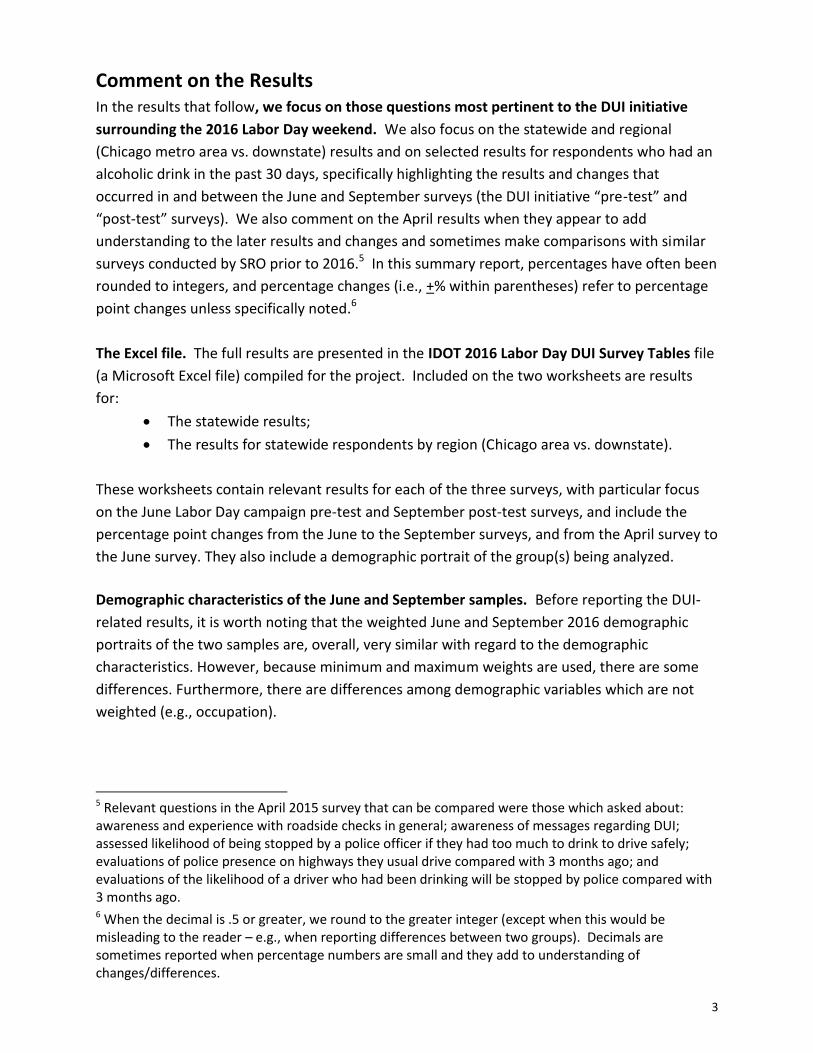
2016 Seat Belt Post-Test / 2016 DUI Pre-Test DUI Pre-Test Post-Test April 2016 June 2016 September 2016
TOTAL 589 387 488 Chicago metro area** 291 189 194 City of Chicago 139 90 91 Chicago suburban counties 152 99 100 Downstate counties** 298 198 294 North/central Illinois 153 98 175 Southern Illinois 145 100 119 *Our goal was to divide both the Chicago metro area and the downstate counties sample roughly in half so that, if necessary, we could also analyze by City of Chicago, Chicago suburbs, north/central Illinois, and southern Illinois.
The margin of error for the statewide results is +4.04% in April, +4.98% in June, and
+4.44% in September. The margin of error is larger for individual subgroups. The sample was
purchased from the vendor Marketing Systems Group and was based on geographical
definitions for Chicago (based on zip code) and for other areas (based on county). Each
telephone number in the sample was called a maximum of 10 times at differing times of the
week and day. The average length of the completed interviews was about 22 minutes for the
April and May surveys and 19 minutes for the September survey. Response rates were
calculated using AAPOR guidelines (AAPOR Response Rate 3). The overall response rate for the
April survey is 7.4 percent, 8.6 percent for the June survey and 6.5 percent for the September
survey.
Within households, interviewers initially asked to speak to the youngest male driver,
because earlier experience showed that we under-represent younger male drivers.3
Replacements were accepted if that designated household member was not available.
In the following summary, the statewide results for each of the surveys have been weighted
to arrive at a proper distribution by region, gender, age, and education level.4
3 Prior to 2009, we asked to speak to the youngest licensed driver 75 percent of the time – and the driver with the
next birthday the other quarter. Because we were finding an increasing under-representation of males and the youngest licensed drivers, we adopted the current screen of always initially asking for the youngest male licensed driver. If such is not available, the licensed driver with the next birthday is requested. Substitute licensed drivers are accepted. 4 The age categories used for weighting purposes are: up to 29 years old; 30s; 40s; 50s; 60s; and 70 and older. The
statewide proportions for each age category were informed by data on the age distribution of Illinois licensed drivers provided by IDOT’s Division of Traffic Safety. This is the ninth year that age has been used in the weighting of the results, and its usage was driven by the fact that we consistently under-represent the youngest drivers despite the fact that the interviewing protocol directs interviewers to ask to speak to the youngest licensed driver three-quarters of the time. This is the eighth year that education level has been used in the weighting of responses.
3
Comment on the Results
In the results that follow, we focus on those questions most pertinent to the DUI initiative
surrounding the 2016 Labor Day weekend. We also focus on the statewide and regional
(Chicago metro area vs. downstate) results and on selected results for respondents who had an
alcoholic drink in the past 30 days, specifically highlighting the results and changes that
occurred in and between the June and September surveys (the DUI initiative “pre-test” and
“post-test” surveys). We also comment on the April results when they appear to add
understanding to the later results and changes and sometimes make comparisons with similar
surveys conducted by SRO prior to 2016.5 In this summary report, percentages have often been
rounded to integers, and percentage changes (i.e., +% within parentheses) refer to percentage
point changes unless specifically noted.6
The Excel file. The full results are presented in the IDOT 2016 Labor Day DUI Survey Tables file
(a Microsoft Excel file) compiled for the project. Included on the two worksheets are results
for:
The statewide results;
The results for statewide respondents by region (Chicago area vs. downstate).
These worksheets contain relevant results for each of the three surveys, with particular focus
on the June Labor Day campaign pre-test and September post-test surveys, and include the
percentage point changes from the June to the September surveys, and from the April survey to
the June survey. They also include a demographic portrait of the group(s) being analyzed.
Demographic characteristics of the June and September samples. Before reporting the DUI-
related results, it is worth noting that the weighted June and September 2016 demographic
portraits of the two samples are, overall, very similar with regard to the demographic
characteristics. However, because minimum and maximum weights are used, there are some
differences. Furthermore, there are differences among demographic variables which are not
weighted (e.g., occupation).
5 Relevant questions in the April 2015 survey that can be compared were those which asked about: awareness and experience with roadside checks in general; awareness of messages regarding DUI; assessed likelihood of being stopped by a police officer if they had too much to drink to drive safely; evaluations of police presence on highways they usual drive compared with 3 months ago; and evaluations of the likelihood of a driver who had been drinking will be stopped by police compared with 3 months ago. 6 When the decimal is .5 or greater, we round to the greater integer (except when this would be misleading to the reader – e.g., when reporting differences between two groups). Decimals are sometimes reported when percentage numbers are small and they add to understanding of changes/differences.
4
Region of state – Thirty nine percent of respondents are from downstate in the
September survey compared to 34.6 percent in June.
Age of respondent – Substantially fewer respondents in June were less than thirty
years old. Whereas 19.3 percent in the June survey are younger than thirty, only 7.9
percent in September are in this age group.
Type of community – Less respondents said they lived in a “big city” in the
September survey (21.6 percent) than in the June survey (26.5 percent).
Additionally, less respondents in the September survey report living in a “medium
sized city” (7.8 percent) than in the June survey (12.6 percent).
Employment status – More respondents identified as a full-time employee in the
September survey (42.3 percent) than in the June survey (30.5 percent). This is a
sizeable increase of 11.8 percentage points.
Results In the following summary of results for each question, we comment first upon the statewide
results, including changes that occurred from June to September. Where applicable, we then
summarize the results for those statewide respondents who reported having had an alcoholic
drink in the past thirty days. We then summarize the regional findings, focusing on the
dichotomous regional breakdown of the Chicago metro area vs. “downstate.”7 At times,
portions of these summaries are omitted either because they lack relevance or because the
sub-sample numbers are too small to warrant comment.
Behaviors relating to drinking and driving
Frequency of drinking: “How often did you drink alcoholic beverages in the past thirty days?”
Statewide, 49.4 percent of the September respondents reported having had any alcoholic drink
(including beer, wine, and liquor) in the past thirty days compared to 46.1 percent in June8 ”
7 For this report, the Chicago metro area includes the City of Chicago, the rest of Cook County, and the “collar
counties” of Lake, McHenry, Kane, DuPage and Will. 8 During the remaining portions of this report, we sometimes refer to those who indicated having any alcoholic
drink in the past thirty days as “drinkers” or “recent drinkers” and their counterparts as “non-drinkers.”
5
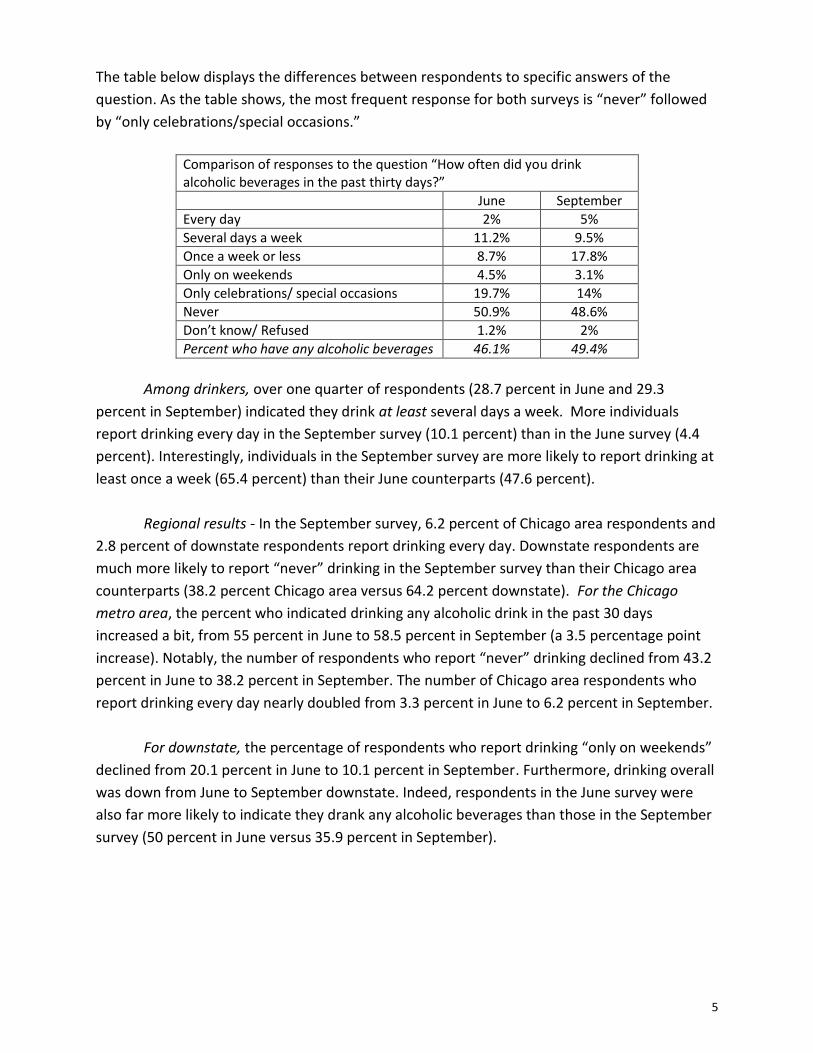
The table below displays the differences between respondents to specific answers of the
question. As the table shows, the most frequent response for both surveys is “never” followed
by “only celebrations/special occasions.”
Comparison of responses to the question “How often did you drink alcoholic beverages in the past thirty days?”
June September
Every day 2% 5%
Several days a week 11.2% 9.5%
Once a week or less 8.7% 17.8%
Only on weekends 4.5% 3.1%
Only celebrations/ special occasions 19.7% 14%
Never 50.9% 48.6%
Don’t know/ Refused 1.2% 2%
Percent who have any alcoholic beverages 46.1% 49.4%
Among drinkers, over one quarter of respondents (28.7 percent in June and 29.3
percent in September) indicated they drink at least several days a week. More individuals
report drinking every day in the September survey (10.1 percent) than in the June survey (4.4
percent). Interestingly, individuals in the September survey are more likely to report drinking at
least once a week (65.4 percent) than their June counterparts (47.6 percent).
Regional results - In the September survey, 6.2 percent of Chicago area respondents and
2.8 percent of downstate respondents report drinking every day. Downstate respondents are
much more likely to report “never” drinking in the September survey than their Chicago area
counterparts (38.2 percent Chicago area versus 64.2 percent downstate). For the Chicago
metro area, the percent who indicated drinking any alcoholic drink in the past 30 days
increased a bit, from 55 percent in June to 58.5 percent in September (a 3.5 percentage point
increase). Notably, the number of respondents who report “never” drinking declined from 43.2
percent in June to 38.2 percent in September. The number of Chicago area respondents who
report drinking every day nearly doubled from 3.3 percent in June to 6.2 percent in September.
For downstate, the percentage of respondents who report drinking “only on weekends”
declined from 20.1 percent in June to 10.1 percent in September. Furthermore, drinking overall
was down from June to September downstate. Indeed, respondents in the June survey were
also far more likely to indicate they drank any alcoholic beverages than those in the September
survey (50 percent in June versus 35.9 percent in September).
6
Drinking and driving: “Have you ever driven a motor vehicle within two hours after drinking
alcoholic beverages?” [Of those who indicated they drank alcoholic beverages in the past
thirty days.] Under twenty percent of respondents report having driven a motor vehicle within
two hours after drinking alcoholic beverages (16.9 percent in June and 17.7 percent in
September).
Regional results. Consistent with previous findings, the number of Chicago area
respondents who report driving after drinking is higher in both surveys (21.7 percent in June;
18.3 percent in September) than the number of downstate respondents who report doing this
(11.1 percent in June; 15 percent in September).
Number of times: “About how many times [in this time period] did you drive within two
hours after drinking?” [For the 10.1 percent and 9.9 percent of total sample members in each
survey who had an alcoholic beverage in the recent past AND who indicated they had driven a
motor vehicle after drinking during this time.] Of the 16.9 percent in June and 17.7 percent in
September who report driving after drinking, 49.5 percent in June and 37.7 percent in
September said they did this only once. The percentage of respondents who report doing this
two times increased by seven percentage points from June to September (31.8 percent and
38.9 percent, respectively). However, the percentage of respondents reporting driving within
two hours after drinking 5 to 9 times decreased slightly from 1.5 percent in June to 0 percent in
September.
Regional results. For the Chicago area, the number of respondents who report driving
after drinking decreased by 3.4 percentage points (from 21.7 percent in June to 18.3 percent in
September). Additionally, the number of respondents who report driving after drinking “once”
in the past thirty days decreased 28.4 percentage points for respondents in the Chicago area
from 60 percent in June to 31.6 percent in September, while the number who reported doing
this twice increased 35.4 percent from 5.7 percent in June to 42.1 percent in September.
Among downstate respondents, the percentage who report driving after drinking increased
from 11.1 percent in June to 15 percent in September.
Number of drinks on last occasion. “On the most recent occasion (driving within two hours of
drinking), about how many drinks did you have?” [For the approximately 10 percent of the
full sample who indicated they had driven within two hours of drinking in the past month.]
The most frequent response given by respondents in the June and September surveys is “one”
(55.7 percent in the June survey; 56.2 percent in the September survey). The second most
frequent response given by respondents in both surveys is 2 (32.2 percent in the June survey,
40.2 percent in the September survey). Less than one percent of respondents in the June survey
(0.7 percent) and no respondents in the September survey indicated they had 5 or more drinks
on the last occasion they drove after drinking.
7
Frequency of driving when respondent had too much to drink: “About how many times [in
this time period] did you drive when you thought you had too much to drink?” [For those who
indicated they have had an alcoholic drink in the past 30 days.]
In the June survey, 89.1 percent of respondents said they “never” drove after drinking
too much while this number is slightly higher in the September survey (94 percent).
Additionally, 1.4 percent in June and 4.9 percent in September say they did this “once” while
9.5 percent in June and 1.2 percent in September say they did this “more than once.”
By region. In the Chicago area, 89.2 percent of respondents in June and 94.3 percent of
respondents in September indicated they did this “never.” By contrast, 88.9 percent of
downstate respondents in June and 94.1 percent in September say they did this “never.”
Assessed trend in personal drinking and driving: “Compared to three months ago, are
you now driving after drinking: more often, less often, or about the same?” [For those who
indicated they have had an alcoholic drink in the past 30 days.] For both the June and
September surveys, a majority of respondents indicated they “did not drive after drinking”
(80.7 percent in June; 65.7 percent in September). 11.6 percent of respondents in June and
19.8 percent of respondents in September indicate they are driving after drinking “about the
same.” The percentage of respondents who report driving after drinking “less often” stayed
about the same (7.3 percent in June; 7.9 percent in September). No respondents in the June
Survey and 2.8 percent of respondents in the September survey say they are drinking “more
often” now than they were three months ago.
By region. In the Chicago area the percentage of respondents who report driving after
drinking “less often” stayed about the same (8.2 percent in June; 9.2 percent in September).The
percentage who report driving after drinking “about the same as three months ago increased
from 10.6 percent in June to 18.3 percent in September (an increase of 7.7 percentage points).
The number who say they “never” drive after drinking decreased 16.1 percent from 81.2
percent in September to 65.1 percent in June. Downstate, the percent who report “never”
driving after drinking decreased by 10 percentage points from 80 percent in June to 70 percent
in September. The number who report that this is “about the same” increased by 8.3
percentage points downstate from 16.7 percent in June to 25 percent in September.
Perceptions of and attitudes about police presence and enforcement
Perceptions of DUI enforcement. Three questions in the interview solicited
respondents’ perceptions about general police presence on roads and police enforcement of
DUI laws. In the first question, respondents were asked how likely it is they would be to be
stopped if they drove after having too much to drink. In the second question, respondents
were asked about the relative frequency they see police on the roads they drive (compared to
three months ago). In the third question, respondents were asked another relative frequency
question, this time regarding how likely it is that a driver who had been drinking will be
8
stopped, compared to three months ago. 9 (Also see the next section for questions specifically
relating to roadside checks).
Police enforcement of drinking laws -- a hypothetical, personalized-wording question:
“If you drove after having too much to drink to drive safely, how likely do you think you are to
be stopped by a police officer?” For the results of this question, we will focus on the results for
those respondents who gave a substantive answer to the question.10
Of the 66.5 percent in June and 65.7 percent in September who answered the above
question, 16.1 percent in June and 13.2 percent in September report being stopped by police
after having too much to drink would be “almost certain.” An additional 34.3 percent in June
and 35.5 percent in September said this would be “very likely.” Only 5.1 percent in June and 9.6
percent in September said this would be “very unlikely.”
Among recent drinkers who gave a substantive response, the percent who indicated that
their likelihood of being stopped is “almost certain” has changed throughout the years. In June
2011, only 6.2 percent reported that getting stopped was “almost certain.” This nearly doubled
from June to September 2011 (11.5 percent). The 2012 results continue this upward trajectory
with 17.1 percent reporting in the April survey that getting stopped is almost certain, 17
percent reported the same in the June survey, and 14 percent in the September survey. Over
the past year, the percent of individuals who believe that they would almost certainly get
stopped if they drove after drinking too much has more than doubled from 6.2 percent in June
2011 to 14 percent in September 2012. In 2015, among recent drinkers who gave a substantive
response, 15.7 percent in June and 23.4 percent in September said this was almost certain.
Additionally, 34.2 percent in June and 23.5 percent in September report their likelihood of
being stopped as “very likely.” In 2016, among recent drinkers who offered a response, 9.7
percent of respondents in June indicated that the likelihood of being stopped is “almost
certain” whereas 12.2 percent of respondents in September said this.
In terms of regions – and among those giving substantive responses, the number of
respondents who report their likelihood of being stopped as “almost certain” is 20.5 percent in
June and 13.4 percent in September for the Chicago area, a decrease of 7.1 percent. For
downstate, the number who report their likelihood of being stopped as “almost certain” is 20.7
percent in June and 9.5 percent in September, a decrease of 11.2 percentage points. When we
examine the combined responses of “almost certain” and “very likely” we find that in Chicago
49 percent in June and 39.6 percent in September reported one of these two responses,
whereas downstate these figures are 46.6 percent in June and 46 percent in September. It
9 Because of possible question order effects here, we kept the order of these questions the same as in the national survey template. 10
In each of the 3 surveys, about 1 to 2 percent said “don’t know” or refused to answer. In addition, another 30 to 33 percent were coded as “not drinking so they cannot relate to the question” (30 percent for April, 33 percent for June, and 32.6 percent for September). So, instead of asking, “if you drove after having too much to drink …,” it might be better to ask respondents how likely police are to stop drivers who do this behavior. This is in line with the wording of the third question in this section. However, our wording is based on suggested federal guidelines here.
9
should be noted that by focusing only on drinkers who live in a certain region and provided a
substantive response to the question, the n decreases substantially, affecting the margin of
error.
Among recent drinkers generally, we find that 7.9 percent in June and 9.3 percent in
September report their likelihood of being stopped as “almost certain.” This compares with
13.4 percent in June and 8 percent in September for nondrinkers.
Police presence on roads. “Compared with three months ago, do you see police on the
roads you normally drive more often, less often, or about the same? “
Nearly three-quarters (69.2 percent) of the September respondents reported seeing
police “about the same” on the roads they normally drive compared with three months ago,
while about one in five (17.1 percent) said they see police “more often” and 9.1 percent said
“less often.”
Overall, results in June are very similar; 71.4 percent said that compared to three
months ago they police on the roads “about the same” while 16.9 percent report seeing police
“more often” and 6.6 percent report seeing police “less often.”
Among recent drinkers, 14.9 percent report seeing police on the roads they normally
drive “more often,” whereas 74 percent say they police on the roads “about the same” and 4.7
percent say they see police “less often.” By region, in the Chicago area, there was a slight
increase of 1.7 percentage points from those who saw police on the roads “more often” (14.6
percent in June; 16.3 percent in September). Downstate, there was also a slight increase (2.5
percent) in the percentage of respondents who report seeing police on the roads they normally
drive “more often” (10 percent in June; 12.5 percent in September).
Police enforcement of drinking laws -- comparative, general evaluation. “Compared to
three months ago, do you think a driver who had been drinking is now more likely to be
stopped by police, less likely to be stopped, or is this about the same?”
The percentage of respondents who indicate that compared to three months ago, a
driver who had been drinking is now “more likely” to be stopped is consistent from June to
September (25.1 percent in June; 23.1 percent in September). The percentage who indicate a
driver who had been drinking is now “less likely” to be stopped increased from 3.4 percent in
June to 6.2 percent in September. In both surveys, respondents most frequently respond that a
driver who had been drinking has “about the same” likelihood now as being stopped as
compared to three months ago (63.4 percent in June; 62.8 percent in September).
Among recent drinkers, 19.8 percent in September and 17.6 percent in June report that
a driver who had been drinking is now “more likely” to be stopped by police than three months
ago. By region. In the Chicago area in September, 22.1 percent indicated a driver would be
“more likely” to be stopped compared to 21 percent in June. Downstate, 15 percent of
respondents indicate that a drive would be “more likely” compared to 10.3 percent in June.
10
Roadside safety checks
Respondents were asked about their awareness and experience with roadside safety checks in
general. Later in the survey, they were asked about their awareness and experience with safety checks
whose primary purpose was to check for alcohol-impaired driving.
It should be noted that this departs a bit from the national survey template. This was done
intentionally for reasons of obtaining comparable Illinois trend data and because Illinois roadside checks
are somewhat different than those in many other states.11
General roadside safety-check questions
Awareness of roadside safety checks. The percent who indicated that, “in the past
thirty days,” they had “seen or heard anything about the police setting up roadside safety
checks where they stop to check drivers and vehicles” is 20.2 percent in the September survey,
up from 16.3 percent in June and 15.2 percent in April.12
Analysis by region. The level of reported awareness of roadside safety checks in
September is greater downstate than in the Chicago area (21.6 percent vs 19.6 percent). The
difference in the June survey was greater: 12 percent of respondents in Chicago and 24.9
percent of respondents reported awareness of the roadside checks.
Sources of awareness.13 Of those who had seen or heard anything about roadside
safety checks, in the September survey, more respondents (34.2 percent) indicate they have
seen or heard about roadside safety checks from television than from any other mentioned
source. Additionally, 25.1 percent and 22.3 percent, respectively indicate seeing or hearing
about roadside safety checks from friends or relatives and radio. Also in September, 18.3
percent report seeing or hearing about checks via the newspaper and 30.8 percent report
another source not mentioned.
In the June survey, 45.1 percent of respondents indicate they have seen or heard about
safety checks via television, the most popular source, 32 percent report seeing or hearing about
via friends and relatives, while 21.4 percent report reading about the checks in the newspaper.
An additional 16.3 percent in the June survey report hearing about the checks on the radio
while 24.9 percent say they have learned about the checks via another source.
11 In terms of obtaining comparable data, we had asked the general roadside check question in surveys for the past several years. The wording itself is a bit different from the national template because of the nature of Illinois road checks, checking vehicles which pass through a road check for all possible traffic violations. To make the Illinois data comparable, we added a later question which asked about road safety checks which appeared to be primarily targeted for alcohol-impaired driving. We believe these questions reflect the actual situation in Illinois while also giving us comparable data. 12
For awareness of roadside safety checks, we used the final percentages after a follow-up question that confirmed the meaning of “roadside safety checks.” 13
Respondents were allowed to choose multiple selections. Thus, a respondent may indicate she heard about the roadside safety checks from both television and radio.
11
Among those who indicated they heard about the checks via television, 92.2 percent in
June and 69.8 percent in September said they heard about these checks via a news story or
news program. An additional 26.2 percent in June and 30.8 percent in September said they
heard about these checks via a commercial or advertisement.14
Among those who indicated they heard about the checks via radio, 75.1 percent in June
and 43.1 percent in September cite a commercial or advertisement. An additional 20.2 percent
in June and 36.9 percent in September in report hearing about these via a news story or news
program while 8.7 percent and 20.4 percent in June and September respectively cite
“something else.”
Among those who indicated they read about these checks in a newspaper, 57.4 percent
in June and 82.4 percent in September report the newspaper source as being a news story or
news program. Smaller numbers report a commercial or advertisement (43.4 percent in June;
24.3 percent in September) and “something else” (2.1 percent in June; 1.4 percent in
September).
By region. In the Chicago area, 35 percent in the June survey and 37.1 percent in the
September survey indicate hearing or seeing information about the checks via television
Downstate, 55 percent in June and 29.2 percent in September report hearing or seeing about
the checks via television, a 25.8 percent decrease which may be attributable to small subgroup
size.
Personally seeing roadside checks. [Of those who had seen or heard anything about
roadside safety checks]
In 2016, the statewide percent who report that they have personally seen such checks is
36.6 percent in June and 47.6 percent in September. The September figure is consistent with
our findings for June and September across recent years while the June percentage is
somewhat lower. In 2015, 49.1 percent of June respondents and 47.6 percent of September
respondents report personally seeing police doing roadside safety checks. In 2013, 49.7 percent
of June 2013 respondents and 44.3 percent of September 2013 respondents report that they
have personally seen such checks compared to 49.4 percent of June 2014 respondents and 48.7
percent of September 2014 respondents. However, it should be noted that in the April 2014
(pre-Memorial) survey, 34.2 percent reported seeing such checks, a figure much lower than
those reported in the June and September surveys of recent years.
By region. Chicago area respondents are far more likely than their downstate
counterparts in both surveys to report personally seeing a roadside safety check. Whereas 50
percent in June and 57.1 percent in September of Chicago area respondents report personally
seeing the checks, only 20 percent of June downstate respondents and 37.5 percent of
September downstate respondents report having seen these checks.
14 Respondents were allowed to select as many sources as applicable.
12
Personally going through a roadside check. When those who had personally seen a
roadside check were asked whether they have “personally been through a roadside check in the
past (thirty) days, either as a driver or as a passenger,” 36.6 percent in June and 47.6 percent in
September report having been through a check. This is an 11 percentage point increase from
June to September.
By region. Among those who had personally seen a roadside check, the proportion who
reported actually going through a check in the Chicago area decreased 10 percentage points
from 50 percent in June to 40 percent in September. Downstate, the percentage increased by
17.5 percentage points from 20 percent in June to 37.5 percent in September.
Messages about alcohol-impaired driving
Awareness of messages about alcohol-impaired driving. The percent who indicated
that, “in the past thirty days,” they had “read, seen or heard anything about alcohol impaired
driving in Illinois,” is 50.4 percent in the September survey and 49.3 percent in the June survey.
Among recent drinkers, awareness of these messages decreased from 51.6 percent in
June to 49.6 percent in September. Awareness was similar for nondrinkers for both surveys
(47.6 percent in June; 51.3 percent in September).
By region. In the Chicago metro area, we find a 2.4 percentage point increase from June
(46.2 percent) to September (48.6 percent). Downstate, we find a small decrease of
1.2percentage points from June (54.8 percent) to September (53.6 percent).
Sources of messages. Of those who had seen or heard such messages, the greatest
source of awareness in September was television (68.1 percent) while an additional 57.1
percent report seeing messages on a billboard or road sign, 35.2 percent report seeing these
messages in a newspaper, 34.2 percent report hearing these messages on the radio, and 31.9
percent report seeing them on a poster or bumper sticker. For June, 72.3 percent say they saw
messages on television, 59.7 percent say they saw these messages on a billboard or road sign,
31.1 percent say they saw a bumper sticker or poster, and 26.9 percent say the read a message
in the newspaper.
Respondents who said they were exposed through television, radio, or newspapers
were asked whether this was through a commercial/advertisement, through a news program or
story, or something else. For television, 66.3 percent of September respondents were
primarily exposed through a commercial or advertisement while 40.8 percent indicate they
were exposed via a news story or news program. For radio, most (72.9 percent) report learning
13
about the campaigns through a commercial or advertisement while slightly over one third (34.6
percent) report a news story or news program.15
For recent drinkers who indicated awareness of these messages in the September survey,
we also find that television is the most frequent source of exposure (64.6 percent) followed by
a billboard or sign on a bus (60.9 percent), the radio (33.8 percent), and a bumper sticker (30
percent).
The following presents September results by region and based on those who are aware
of any messages.
For the Chicago area, exposure through television is most frequent (69.8 percent)
followed by exposure via billboards or road signs (62.8 percent). Next are exposure through a
poster or bumper sticker (32.2 percent), radio (30.6 percent), and newspaper (26.7 percent).
For the downstate area, exposure through television is most frequent (66.1 percent) followed
by exposure through billboards or bus signs (50 percent), newspaper (46.7 percent), radio (32.2
percent), posters or bumper stickers (31.7 percent), and friends and relatives (25.2 percent).
Reported trend in number of messages. Those who said they were exposed to
messages about alcohol impaired driving (50.4 percent in the September sample, 49.3 percent
of the June sample, and 48.7 percent of the April sample) were asked whether, “the number of
messages that [they] have seen or heard about alcohol impaired driving in the past (thirty) days
is more than usual, fewer than usual, or about the same as usual.”
In September, 3.7 percent of the statewide respondents said the number of messages
they had seen/heard was “more than usual,” down from 6.8 percent in June and also slightly
less than in April (9.8 percent). Over three-quarters of the September respondents (79.2
percent) said the number is “about the same,” up from 76.9 percent in June and 74.1 in April
who indicated this. The percentage who said “less than usual” is 11 percent in September, 12.7
percent in June, and 11.4 percent in April.
Among recent drinkers who had seen/heard of these messages, the proportion saying
“more than usual” in the September survey is 2.2 percent and 4.1 percent in the June survey.
By contrast, 11.9 percent of recent drinkers in the September survey and 17.1 percent of recent
drinkers in the June survey say that the number of messages they have seen regarding alcohol
impaired driving is “fewer than usual.”
By region. The Chicago metro area percentage who indicated the number of messages
they had seen was “more than usual” decreased from7.6 percent in June to 2.8 percent in
September. Downstate, 6 percent in June and 4.5 percent in September say that the number of
15
Note that percentage results for commercials and news stories can add to more than 100 percent because respondents could indicate they were exposed through both types.
14
messages they have seen regarding alcohol impaired driving in the past three months is “more
than usual.”
Awareness of selected traffic safety slogans
The question. Respondents were asked about their awareness of selected traffic safety
slogans. April and June respondents were asked about their awareness of 13 slogans. Nine of
the slogans are related to drinking and driving, with three of the eight having been used in
recent media campaigns: “You drink and drive. You lose.” (or its variant “You drink. You drive.
You lose”)16 “Drunk driving. Over the limit. Under arrest.” and the newest, “Drive sober or get
pulled over.”
The September results. The following Table S-1 presents the most recent September
results, ordered by level of awareness. The DUI-related slogans are in italics, except for the
three most recent slogans which are in non-italic bold.
16 It appears that the wording of the first of these slogans has alternated over the years and over varying formats and communication modes between “You drink and drive, you lose” and “You drink. You drive. You lose.” Currently, both variants of this slogan can be seen in Illinois. We have used the first wording for the 2007 through the most recent telephone surveys.
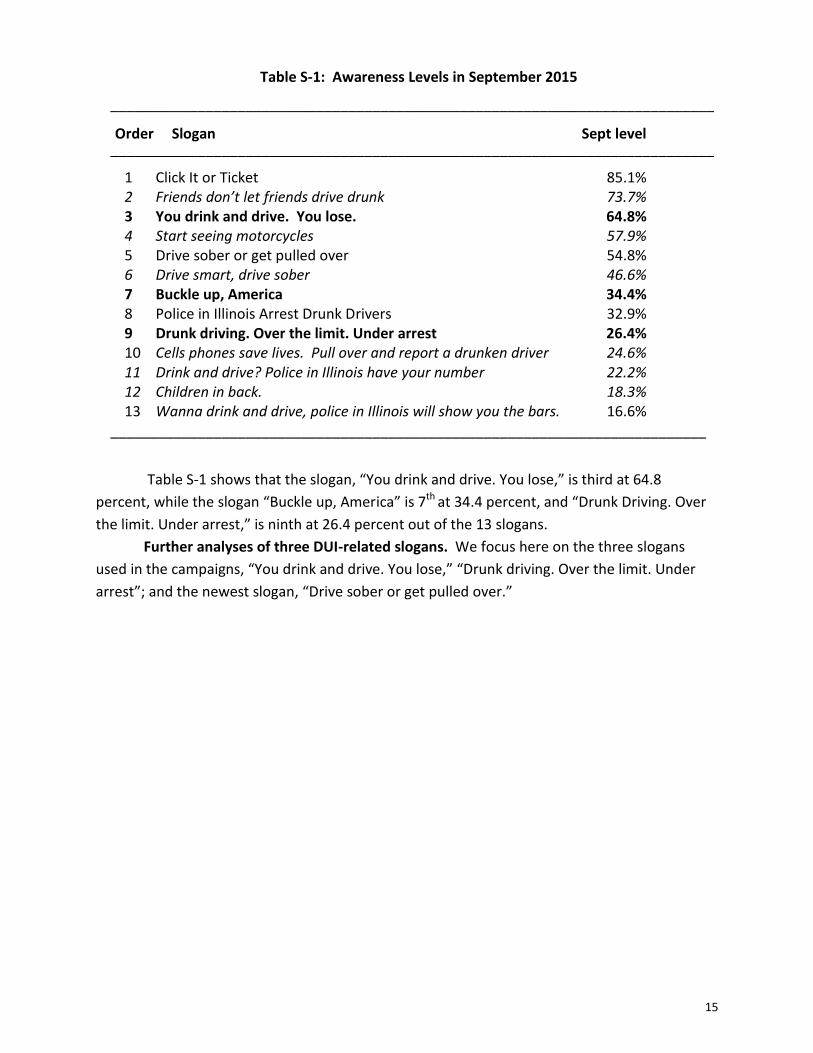
15
Table S-1: Awareness Levels in September 2015
____________________________________________________________________________
Order Slogan Sept level ____________________________________________________________________________
1 Click It or Ticket 85.1% 2 Friends don’t let friends drive drunk 73.7% 3 You drink and drive. You lose. 64.8% 4 Start seeing motorcycles 57.9% 5 Drive sober or get pulled over 54.8% 6 Drive smart, drive sober 46.6% 7 Buckle up, America 34.4% 8 Police in Illinois Arrest Drunk Drivers 32.9% 9 Drunk driving. Over the limit. Under arrest 26.4% 10 Cells phones save lives. Pull over and report a drunken driver 24.6% 11 Drink and drive? Police in Illinois have your number 22.2% 12 Children in back. 18.3% 13 Wanna drink and drive, police in Illinois will show you the bars. 16.6%
___________________________________________________________________________
Table S-1 shows that the slogan, “You drink and drive. You lose,” is third at 64.8
percent, while the slogan “Buckle up, America” is 7th at 34.4 percent, and “Drunk Driving. Over
the limit. Under arrest,” is ninth at 26.4 percent out of the 13 slogans.
Further analyses of three DUI-related slogans. We focus here on the three slogans
used in the campaigns, “You drink and drive. You lose,” “Drunk driving. Over the limit. Under
arrest”; and the newest slogan, “Drive sober or get pulled over.”
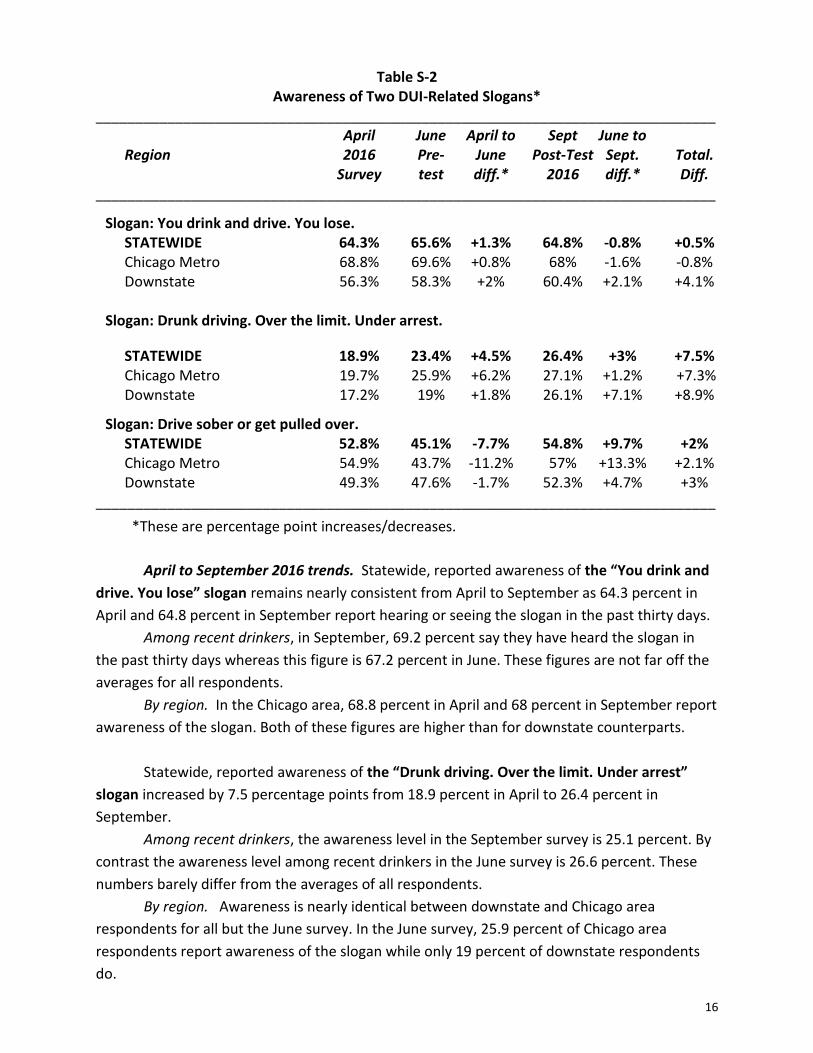
16
Table S-2 Awareness of Two DUI-Related Slogans*
______________________________________________________________________________ April June April to Sept June to Region 2016 Pre- June Post-Test Sept. Total. Survey test diff.* 2016 diff.* Diff.
______________________________________________________________________________
Slogan: You drink and drive. You lose. STATEWIDE 64.3% 65.6% +1.3% 64.8% -0.8% +0.5% Chicago Metro 68.8% 69.6% +0.8% 68% -1.6% -0.8% Downstate 56.3% 58.3% +2% 60.4% +2.1% +4.1%
Slogan: Drunk driving. Over the limit. Under arrest.
STATEWIDE 18.9% 23.4% +4.5% 26.4% +3% +7.5% Chicago Metro 19.7% 25.9% +6.2% 27.1% +1.2% +7.3% Downstate 17.2% 19% +1.8% 26.1% +7.1% +8.9%
Slogan: Drive sober or get pulled over.
STATEWIDE 52.8% 45.1% -7.7% 54.8% +9.7% +2% Chicago Metro 54.9% 43.7% -11.2% 57% +13.3% +2.1% Downstate 49.3% 47.6% -1.7% 52.3% +4.7% +3%
______________________________________________________________________________ *These are percentage point increases/decreases.
April to September 2016 trends. Statewide, reported awareness of the “You drink and
drive. You lose” slogan remains nearly consistent from April to September as 64.3 percent in
April and 64.8 percent in September report hearing or seeing the slogan in the past thirty days.
Among recent drinkers, in September, 69.2 percent say they have heard the slogan in
the past thirty days whereas this figure is 67.2 percent in June. These figures are not far off the
averages for all respondents.
By region. In the Chicago area, 68.8 percent in April and 68 percent in September report
awareness of the slogan. Both of these figures are higher than for downstate counterparts.
Statewide, reported awareness of the “Drunk driving. Over the limit. Under arrest”
slogan increased by 7.5 percentage points from 18.9 percent in April to 26.4 percent in
September.
Among recent drinkers, the awareness level in the September survey is 25.1 percent. By
contrast the awareness level among recent drinkers in the June survey is 26.6 percent. These
numbers barely differ from the averages of all respondents.
By region. Awareness is nearly identical between downstate and Chicago area
respondents for all but the June survey. In the June survey, 25.9 percent of Chicago area
respondents report awareness of the slogan while only 19 percent of downstate respondents
do.
17
Statewide, reported awareness of the “Drive sober or get pulled over” slogan stayed
about the same (a 2 percent increase) from 52.8 percent in April to 54.8 percent in September.
By region. Awareness is higher in the Chicago metro area in April (54.9 percent versus
49.3 percent downstate awareness). However, in June downstate awareness is higher (47.6
percent downstate and 43.7 percent in the Chicago area). Awareness is higher in Chicago in the
September survey compared to downstate by about five percentage points (52.3 percent
downstate, 57 percent Chicago area). Both regions saw very slight increases from April to
September.
Among recent drinkers, 53.7 percent in September and 41.1 percent in June reported
awareness of the slogan.
The 2002 through 2016 trends. Tables S-3A and B present awareness information for
numerous selected traffic safety slogans for both seat belt and DUI campaigns from 2002 to the
most recent 2016 survey. The three DUI-related slogans focused upon above are in bold.
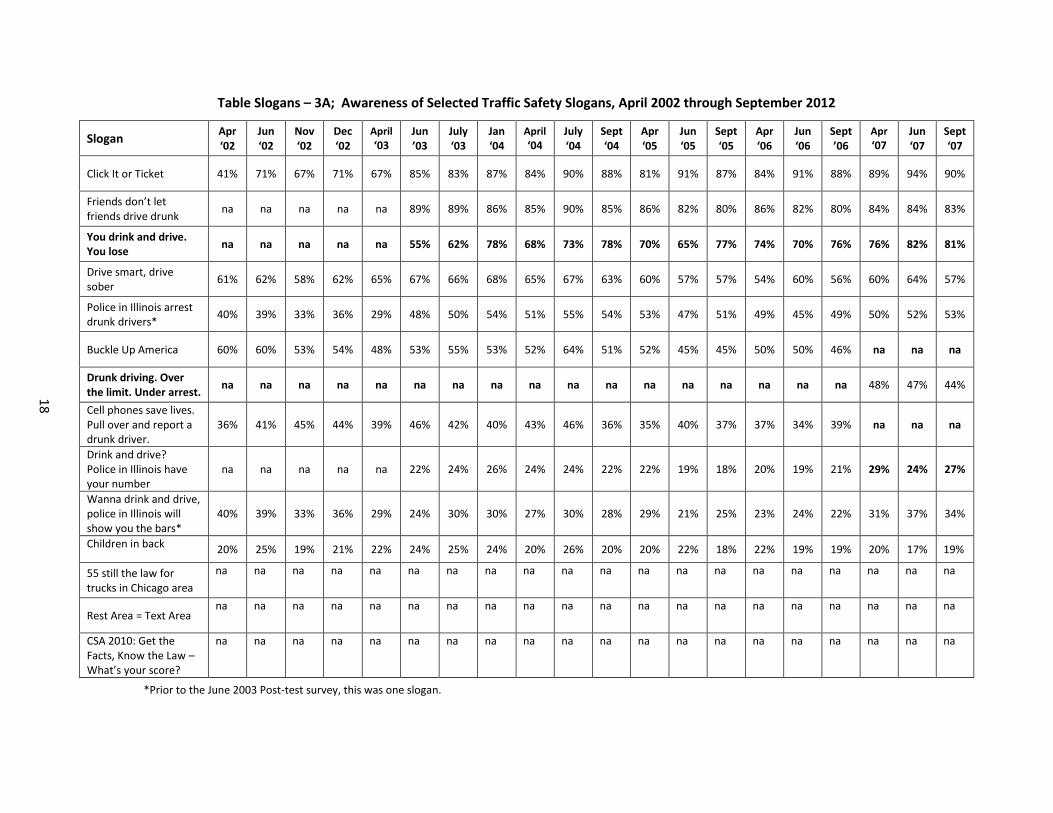
18
Table Slogans – 3A; Awareness of Selected Traffic Safety Slogans, April 2002 through September 2012
Slogan Apr ‘02
Jun ‘02
Nov ‘02
Dec ‘02
April ‘03
Jun ’03
July ‘03
Jan ‘04
April
‘04 July ‘04
Sept ‘04
Apr ‘05
Jun ‘05
Sept ‘05
Apr ‘06
Jun ‘06
Sept ’06
Apr
‘07 Jun ‘07
Sept ‘07
Click It or Ticket 41% 71% 67% 71% 67% 85% 83% 87% 84% 90% 88% 81% 91% 87% 84% 91% 88% 89% 94% 90%
Friends don’t let friends drive drunk
na na na na na 89% 89% 86% 85% 90% 85% 86% 82% 80% 86% 82% 80% 84% 84% 83%
You drink and drive. You lose
na na na na na 55% 62% 78% 68% 73% 78% 70% 65% 77% 74% 70% 76% 76% 82% 81%
Drive smart, drive sober
61% 62% 58% 62% 65% 67% 66% 68% 65% 67% 63% 60% 57% 57% 54% 60% 56% 60% 64% 57%
Police in Illinois arrest drunk drivers*
40% 39% 33% 36% 29% 48% 50% 54% 51% 55% 54% 53% 47% 51% 49% 45% 49% 50% 52% 53%
Buckle Up America 60% 60% 53% 54% 48% 53% 55% 53% 52% 64% 51% 52% 45% 45% 50% 50% 46% na na na
Drunk driving. Over the limit. Under arrest.
na na na na na na na na na na na na na na na na na 48% 47% 44%
Cell phones save lives. Pull over and report a drunk driver.
36% 41% 45% 44% 39% 46% 42% 40% 43% 46% 36% 35% 40% 37% 37% 34% 39% na na na
Drink and drive? Police in Illinois have your number
na na na na na 22% 24% 26% 24% 24% 22% 22% 19% 18% 20% 19% 21% 29% 24% 27%
Wanna drink and drive, police in Illinois will show you the bars*
40% 39% 33% 36% 29% 24% 30% 30% 27% 30% 28% 29% 21% 25% 23% 24% 22% 31% 37% 34%
Children in back 20% 25% 19% 21% 22% 24% 25% 24% 20% 26% 20% 20% 22% 18% 22% 19% 19% 20% 17% 19%
55 still the law for trucks in Chicago area
na na na na na na na na na na na na na na na na na na na na
Rest Area = Text Area na na na na na na na na na na na na na na na na na na na na
CSA 2010: Get the Facts, Know the Law – What’s your score?
na na na na na na na na na na na na na na na na na na na na
*Prior to the June 2003 Post-test survey, this was one slogan.
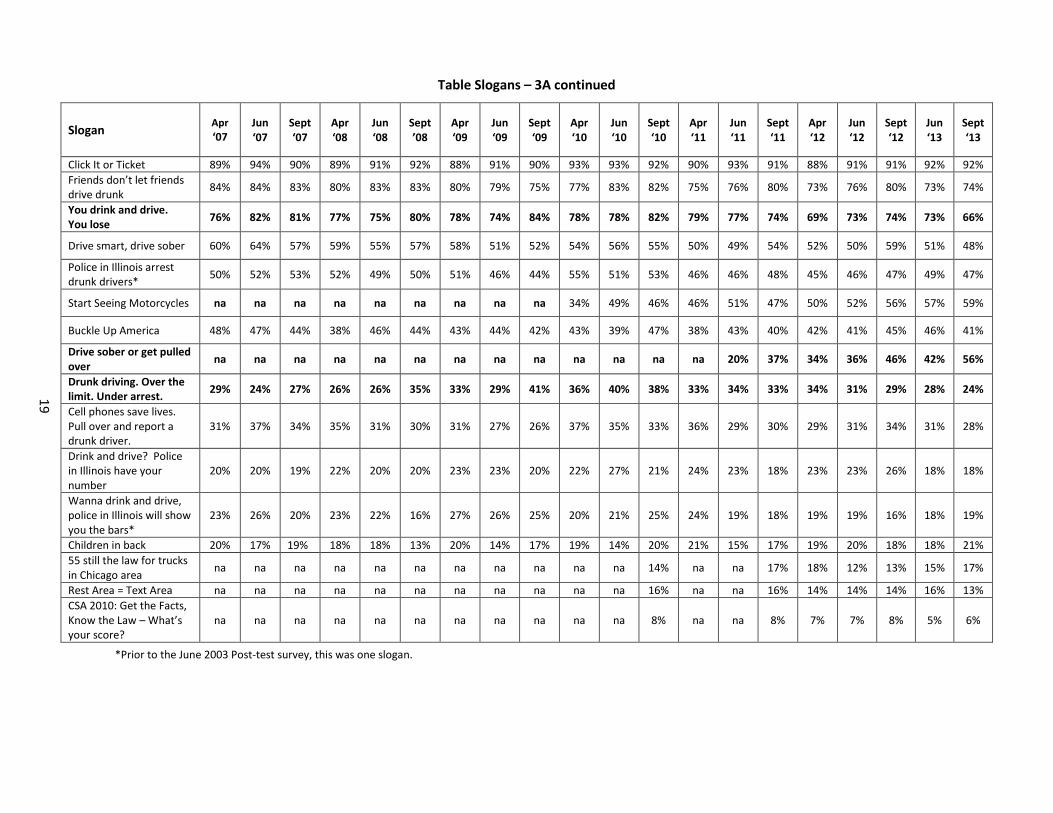
19
Table Slogans – 3A continued
Slogan Apr
‘07 Jun ‘07
Sept ‘07
Apr ‘08
Jun ‘08
Sept ’08
Apr ‘09
Jun ‘09
Sept ‘09
Apr ‘10
Jun ‘10
Sept ‘10
Apr ‘11
Jun ‘11
Sept ‘11
Apr ‘12
Jun ‘12
Sept ‘12
Jun ‘13
Sept ‘13
Click It or Ticket 89% 94% 90% 89% 91% 92% 88% 91% 90% 93% 93% 92% 90% 93% 91% 88% 91% 91% 92% 92%
Friends don’t let friends drive drunk
84% 84% 83% 80% 83% 83% 80% 79% 75% 77% 83% 82% 75% 76% 80% 73% 76% 80% 73% 74%
You drink and drive. You lose
76% 82% 81% 77% 75% 80% 78% 74% 84% 78% 78% 82% 79% 77% 74% 69% 73% 74% 73% 66%
Drive smart, drive sober 60% 64% 57% 59% 55% 57% 58% 51% 52% 54% 56% 55% 50% 49% 54% 52% 50% 59% 51% 48%
Police in Illinois arrest drunk drivers*
50% 52% 53% 52% 49% 50% 51% 46% 44% 55% 51% 53% 46% 46% 48% 45% 46% 47% 49% 47%
Start Seeing Motorcycles na na na na na na na na na 34% 49% 46% 46% 51% 47% 50% 52% 56% 57% 59%
Buckle Up America 48% 47% 44% 38% 46% 44% 43% 44% 42% 43% 39% 47% 38% 43% 40% 42% 41% 45% 46% 41%
Drive sober or get pulled over
na na na na na na na na na na na na na 20% 37% 34% 36% 46% 42% 56%
Drunk driving. Over the limit. Under arrest.
29% 24% 27% 26% 26% 35% 33% 29% 41% 36% 40% 38% 33% 34% 33% 34% 31% 29% 28% 24%
Cell phones save lives. Pull over and report a drunk driver.
31% 37% 34% 35% 31% 30% 31% 27% 26% 37% 35% 33% 36% 29% 30% 29% 31% 34% 31% 28%
Drink and drive? Police in Illinois have your number
20% 20% 19% 22% 20% 20% 23% 23% 20% 22% 27% 21% 24% 23% 18% 23% 23% 26% 18% 18%
Wanna drink and drive, police in Illinois will show you the bars*
23% 26% 20% 23% 22% 16% 27% 26% 25% 20% 21% 25% 24% 19% 18% 19% 19% 16% 18% 19%
Children in back 20% 17% 19% 18% 18% 13% 20% 14% 17% 19% 14% 20% 21% 15% 17% 19% 20% 18% 18% 21%
55 still the law for trucks in Chicago area
na na na na na na na na na na na 14% na na 17% 18% 12% 13% 15% 17%
Rest Area = Text Area na na na na na na na na na na na 16% na na 16% 14% 14% 14% 16% 13%
CSA 2010: Get the Facts, Know the Law – What’s your score?
na na na na na na na na na na na 8% na na 8% 7% 7% 8% 5% 6%
*Prior to the June 2003 Post-test survey, this was one slogan.
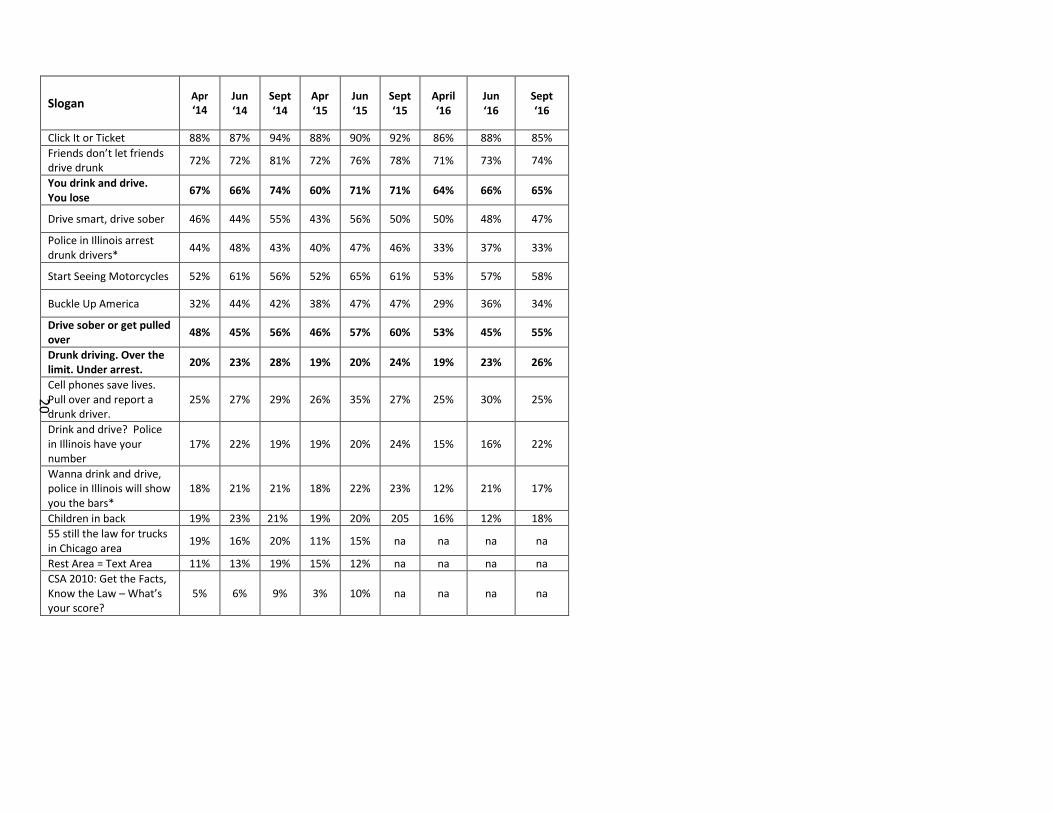
20
Slogan Apr
‘14 Jun ‘14
Sept ‘14
Apr ‘15
Jun ‘15
Sept ‘15
April ‘16
Jun ‘16
Sept ‘16
Click It or Ticket 88% 87% 94% 88% 90% 92% 86% 88% 85%
Friends don’t let friends drive drunk
72% 72% 81% 72% 76% 78% 71% 73% 74%
You drink and drive. You lose
67% 66% 74% 60% 71% 71% 64% 66% 65%
Drive smart, drive sober 46% 44% 55% 43% 56% 50% 50% 48% 47%
Police in Illinois arrest drunk drivers*
44% 48% 43% 40% 47% 46% 33% 37% 33%
Start Seeing Motorcycles 52% 61% 56% 52% 65% 61% 53% 57% 58%
Buckle Up America 32% 44% 42% 38% 47% 47% 29% 36% 34%
Drive sober or get pulled over
48% 45% 56% 46% 57% 60% 53% 45% 55%
Drunk driving. Over the limit. Under arrest.
20% 23% 28% 19% 20% 24% 19% 23% 26%
Cell phones save lives. Pull over and report a drunk driver.
25% 27% 29% 26% 35% 27% 25% 30% 25%
Drink and drive? Police in Illinois have your number
17% 22% 19% 19% 20% 24% 15% 16% 22%
Wanna drink and drive, police in Illinois will show you the bars*
18% 21% 21% 18% 22% 23% 12% 21% 17%
Children in back 19% 23% 21% 19% 20% 205 16% 12% 18%
55 still the law for trucks in Chicago area
19% 16% 20% 11% 15% na na na na
Rest Area = Text Area 11% 13% 19% 15% 12% na na na na CSA 2010: Get the Facts, Know the Law – What’s your score?
5% 6% 9% 3% 10% na na na na
21
APPENDIX A
Statewide Enforcement Activities and Associated Costs
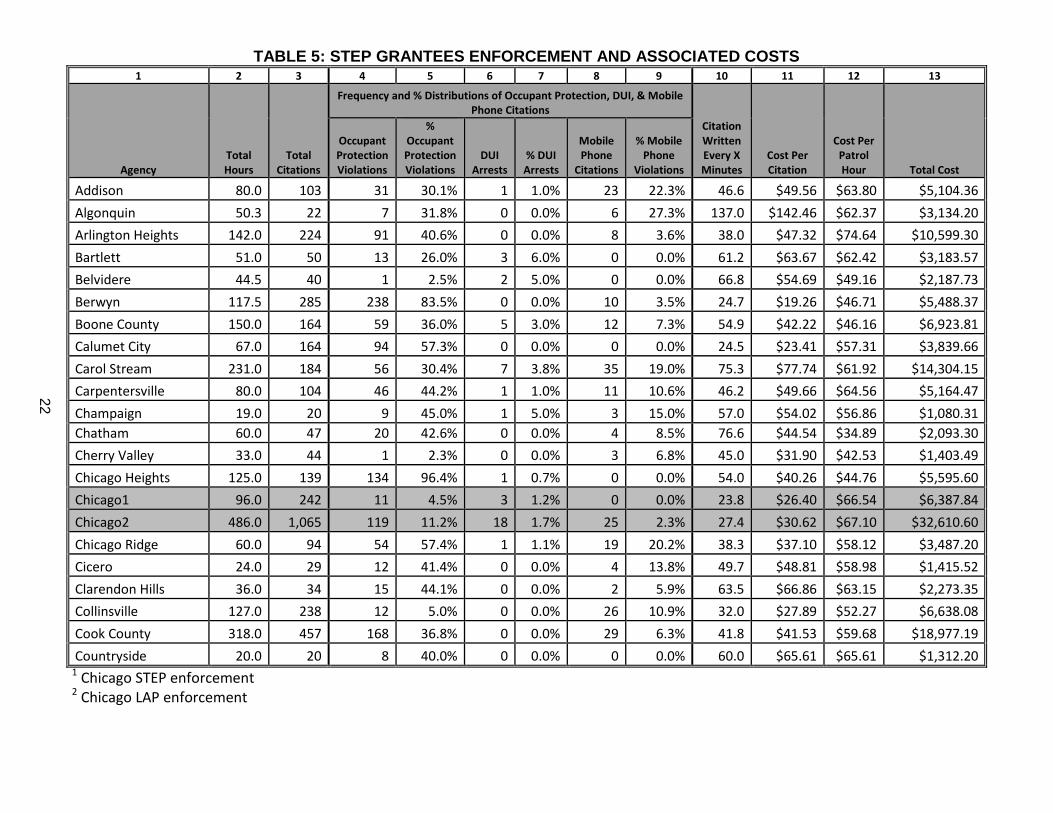
22
TABLE 5: STEP GRANTEES ENFORCEMENT AND ASSOCIATED COSTS 1 2 3 4 5 6 7 8 9 10 11 12 13
Agency Total Hours
Total Citations
Frequency and % Distributions of Occupant Protection, DUI, & Mobile Phone Citations
Citation Written Every X Minutes
Cost Per Citation
Cost Per Patrol Hour Total Cost
Occupant Protection Violations
% Occupant Protection Violations
DUI Arrests
% DUI Arrests
Mobile Phone
Citations
% Mobile Phone
Violations
Addison 80.0 103 31 30.1% 1 1.0% 23 22.3% 46.6 $49.56 $63.80 $5,104.36
Algonquin 50.3 22 7 31.8% 0 0.0% 6 27.3% 137.0 $142.46 $62.37 $3,134.20
Arlington Heights 142.0 224 91 40.6% 0 0.0% 8 3.6% 38.0 $47.32 $74.64 $10,599.30
Bartlett 51.0 50 13 26.0% 3 6.0% 0 0.0% 61.2 $63.67 $62.42 $3,183.57
Belvidere 44.5 40 1 2.5% 2 5.0% 0 0.0% 66.8 $54.69 $49.16 $2,187.73
Berwyn 117.5 285 238 83.5% 0 0.0% 10 3.5% 24.7 $19.26 $46.71 $5,488.37
Boone County 150.0 164 59 36.0% 5 3.0% 12 7.3% 54.9 $42.22 $46.16 $6,923.81
Calumet City 67.0 164 94 57.3% 0 0.0% 0 0.0% 24.5 $23.41 $57.31 $3,839.66
Carol Stream 231.0 184 56 30.4% 7 3.8% 35 19.0% 75.3 $77.74 $61.92 $14,304.15
Carpentersville 80.0 104 46 44.2% 1 1.0% 11 10.6% 46.2 $49.66 $64.56 $5,164.47
Champaign 19.0 20 9 45.0% 1 5.0% 3 15.0% 57.0 $54.02 $56.86 $1,080.31
Chatham 60.0 47 20 42.6% 0 0.0% 4 8.5% 76.6 $44.54 $34.89 $2,093.30
Cherry Valley 33.0 44 1 2.3% 0 0.0% 3 6.8% 45.0 $31.90 $42.53 $1,403.49
Chicago Heights 125.0 139 134 96.4% 1 0.7% 0 0.0% 54.0 $40.26 $44.76 $5,595.60
Chicago1 96.0 242 11 4.5% 3 1.2% 0 0.0% 23.8 $26.40 $66.54 $6,387.84
Chicago2 486.0 1,065 119 11.2% 18 1.7% 25 2.3% 27.4 $30.62 $67.10 $32,610.60
Chicago Ridge 60.0 94 54 57.4% 1 1.1% 19 20.2% 38.3 $37.10 $58.12 $3,487.20
Cicero 24.0 29 12 41.4% 0 0.0% 4 13.8% 49.7 $48.81 $58.98 $1,415.52
Clarendon Hills 36.0 34 15 44.1% 0 0.0% 2 5.9% 63.5 $66.86 $63.15 $2,273.35
Collinsville 127.0 238 12 5.0% 0 0.0% 26 10.9% 32.0 $27.89 $52.27 $6,638.08
Cook County 318.0 457 168 36.8% 0 0.0% 29 6.3% 41.8 $41.53 $59.68 $18,977.19
Countryside 20.0 20 8 40.0% 0 0.0% 0 0.0% 60.0 $65.61 $65.61 $1,312.20 1 Chicago STEP enforcement 2 Chicago LAP enforcement
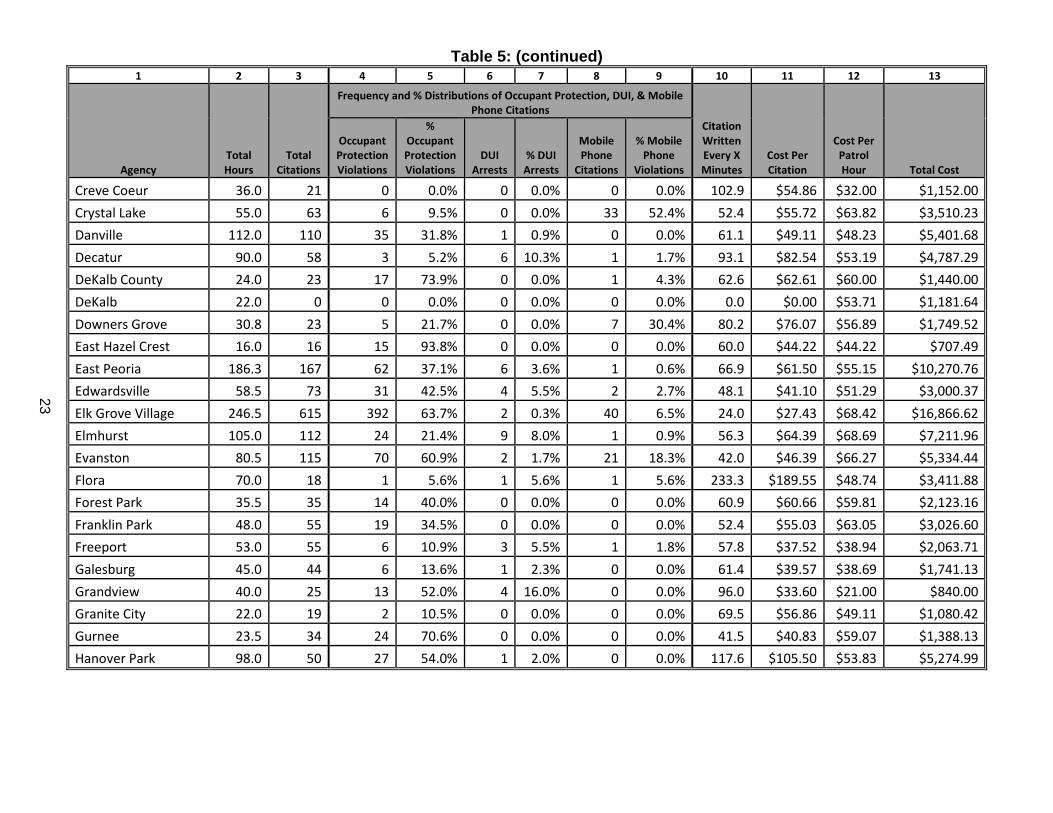
23
Table 5: (continued) 1 2 3 4 5 6 7 8 9 10 11 12 13
Agency Total Hours
Total Citations
Frequency and % Distributions of Occupant Protection, DUI, & Mobile Phone Citations
Citation Written Every X Minutes
Cost Per Citation
Cost Per Patrol Hour Total Cost
Occupant Protection Violations
% Occupant Protection Violations
DUI Arrests
% DUI Arrests
Mobile Phone
Citations
% Mobile Phone
Violations
Creve Coeur 36.0 21 0 0.0% 0 0.0% 0 0.0% 102.9 $54.86 $32.00 $1,152.00
Crystal Lake 55.0 63 6 9.5% 0 0.0% 33 52.4% 52.4 $55.72 $63.82 $3,510.23
Danville 112.0 110 35 31.8% 1 0.9% 0 0.0% 61.1 $49.11 $48.23 $5,401.68
Decatur 90.0 58 3 5.2% 6 10.3% 1 1.7% 93.1 $82.54 $53.19 $4,787.29
DeKalb County 24.0 23 17 73.9% 0 0.0% 1 4.3% 62.6 $62.61 $60.00 $1,440.00
DeKalb 22.0 0 0 0.0% 0 0.0% 0 0.0% 0.0 $0.00 $53.71 $1,181.64
Downers Grove 30.8 23 5 21.7% 0 0.0% 7 30.4% 80.2 $76.07 $56.89 $1,749.52
East Hazel Crest 16.0 16 15 93.8% 0 0.0% 0 0.0% 60.0 $44.22 $44.22 $707.49
East Peoria 186.3 167 62 37.1% 6 3.6% 1 0.6% 66.9 $61.50 $55.15 $10,270.76
Edwardsville 58.5 73 31 42.5% 4 5.5% 2 2.7% 48.1 $41.10 $51.29 $3,000.37
Elk Grove Village 246.5 615 392 63.7% 2 0.3% 40 6.5% 24.0 $27.43 $68.42 $16,866.62
Elmhurst 105.0 112 24 21.4% 9 8.0% 1 0.9% 56.3 $64.39 $68.69 $7,211.96
Evanston 80.5 115 70 60.9% 2 1.7% 21 18.3% 42.0 $46.39 $66.27 $5,334.44
Flora 70.0 18 1 5.6% 1 5.6% 1 5.6% 233.3 $189.55 $48.74 $3,411.88
Forest Park 35.5 35 14 40.0% 0 0.0% 0 0.0% 60.9 $60.66 $59.81 $2,123.16
Franklin Park 48.0 55 19 34.5% 0 0.0% 0 0.0% 52.4 $55.03 $63.05 $3,026.60
Freeport 53.0 55 6 10.9% 3 5.5% 1 1.8% 57.8 $37.52 $38.94 $2,063.71
Galesburg 45.0 44 6 13.6% 1 2.3% 0 0.0% 61.4 $39.57 $38.69 $1,741.13
Grandview 40.0 25 13 52.0% 4 16.0% 0 0.0% 96.0 $33.60 $21.00 $840.00
Granite City 22.0 19 2 10.5% 0 0.0% 0 0.0% 69.5 $56.86 $49.11 $1,080.42
Gurnee 23.5 34 24 70.6% 0 0.0% 0 0.0% 41.5 $40.83 $59.07 $1,388.13
Hanover Park 98.0 50 27 54.0% 1 2.0% 0 0.0% 117.6 $105.50 $53.83 $5,274.99
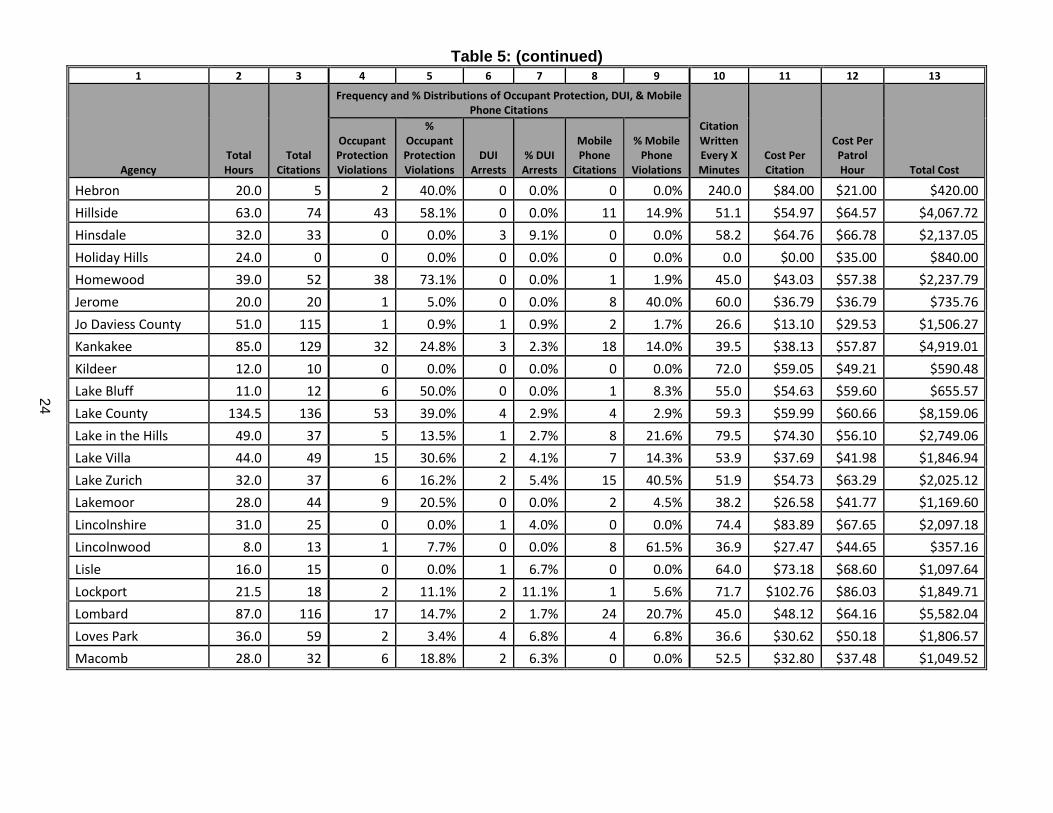
24
Table 5: (continued) 1 2 3 4 5 6 7 8 9 10 11 12 13
Agency Total Hours
Total Citations
Frequency and % Distributions of Occupant Protection, DUI, & Mobile Phone Citations
Citation Written Every X Minutes
Cost Per Citation
Cost Per Patrol Hour Total Cost
Occupant Protection Violations
% Occupant Protection Violations
DUI Arrests
% DUI Arrests
Mobile Phone
Citations
% Mobile Phone
Violations
Hebron 20.0 5 2 40.0% 0 0.0% 0 0.0% 240.0 $84.00 $21.00 $420.00
Hillside 63.0 74 43 58.1% 0 0.0% 11 14.9% 51.1 $54.97 $64.57 $4,067.72
Hinsdale 32.0 33 0 0.0% 3 9.1% 0 0.0% 58.2 $64.76 $66.78 $2,137.05
Holiday Hills 24.0 0 0 0.0% 0 0.0% 0 0.0% 0.0 $0.00 $35.00 $840.00
Homewood 39.0 52 38 73.1% 0 0.0% 1 1.9% 45.0 $43.03 $57.38 $2,237.79
Jerome 20.0 20 1 5.0% 0 0.0% 8 40.0% 60.0 $36.79 $36.79 $735.76
Jo Daviess County 51.0 115 1 0.9% 1 0.9% 2 1.7% 26.6 $13.10 $29.53 $1,506.27
Kankakee 85.0 129 32 24.8% 3 2.3% 18 14.0% 39.5 $38.13 $57.87 $4,919.01
Kildeer 12.0 10 0 0.0% 0 0.0% 0 0.0% 72.0 $59.05 $49.21 $590.48
Lake Bluff 11.0 12 6 50.0% 0 0.0% 1 8.3% 55.0 $54.63 $59.60 $655.57
Lake County 134.5 136 53 39.0% 4 2.9% 4 2.9% 59.3 $59.99 $60.66 $8,159.06
Lake in the Hills 49.0 37 5 13.5% 1 2.7% 8 21.6% 79.5 $74.30 $56.10 $2,749.06
Lake Villa 44.0 49 15 30.6% 2 4.1% 7 14.3% 53.9 $37.69 $41.98 $1,846.94
Lake Zurich 32.0 37 6 16.2% 2 5.4% 15 40.5% 51.9 $54.73 $63.29 $2,025.12
Lakemoor 28.0 44 9 20.5% 0 0.0% 2 4.5% 38.2 $26.58 $41.77 $1,169.60
Lincolnshire 31.0 25 0 0.0% 1 4.0% 0 0.0% 74.4 $83.89 $67.65 $2,097.18
Lincolnwood 8.0 13 1 7.7% 0 0.0% 8 61.5% 36.9 $27.47 $44.65 $357.16
Lisle 16.0 15 0 0.0% 1 6.7% 0 0.0% 64.0 $73.18 $68.60 $1,097.64
Lockport 21.5 18 2 11.1% 2 11.1% 1 5.6% 71.7 $102.76 $86.03 $1,849.71
Lombard 87.0 116 17 14.7% 2 1.7% 24 20.7% 45.0 $48.12 $64.16 $5,582.04
Loves Park 36.0 59 2 3.4% 4 6.8% 4 6.8% 36.6 $30.62 $50.18 $1,806.57
Macomb 28.0 32 6 18.8% 2 6.3% 0 0.0% 52.5 $32.80 $37.48 $1,049.52
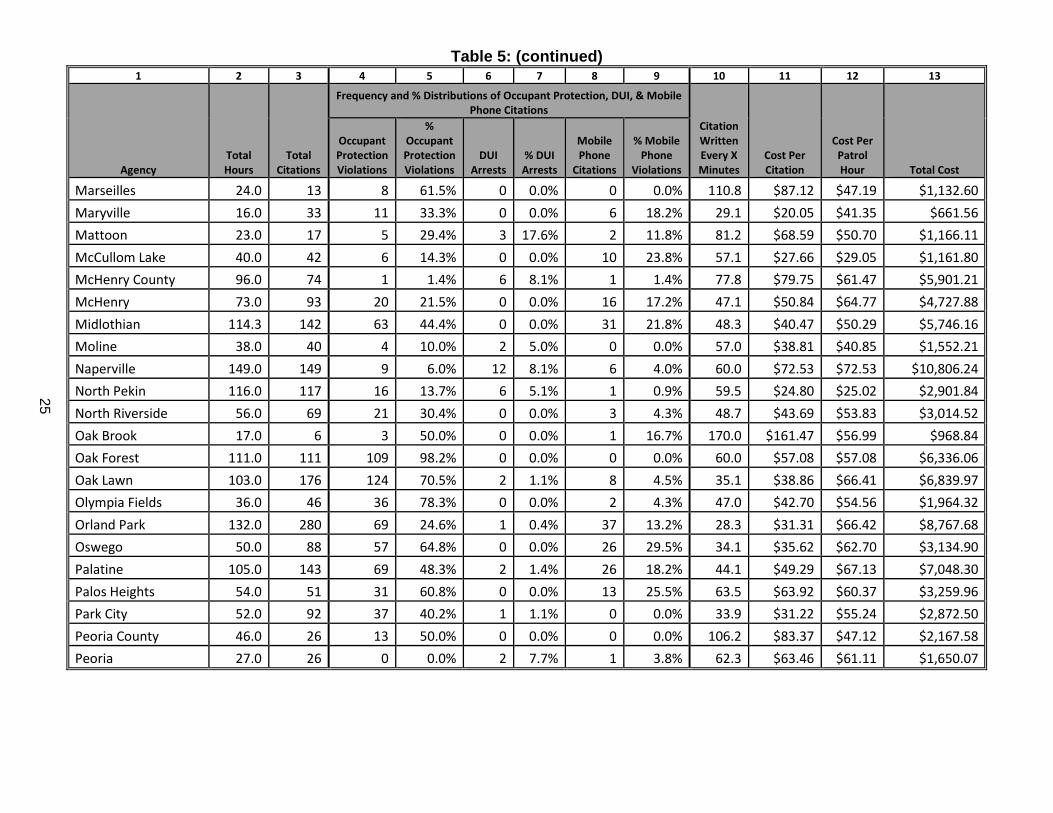
25
Table 5: (continued) 1 2 3 4 5 6 7 8 9 10 11 12 13
Agency Total Hours
Total Citations
Frequency and % Distributions of Occupant Protection, DUI, & Mobile Phone Citations
Citation Written Every X Minutes
Cost Per Citation
Cost Per Patrol Hour Total Cost
Occupant Protection Violations
% Occupant Protection Violations
DUI Arrests
% DUI Arrests
Mobile Phone
Citations
% Mobile Phone
Violations
Marseilles 24.0 13 8 61.5% 0 0.0% 0 0.0% 110.8 $87.12 $47.19 $1,132.60
Maryville 16.0 33 11 33.3% 0 0.0% 6 18.2% 29.1 $20.05 $41.35 $661.56
Mattoon 23.0 17 5 29.4% 3 17.6% 2 11.8% 81.2 $68.59 $50.70 $1,166.11
McCullom Lake 40.0 42 6 14.3% 0 0.0% 10 23.8% 57.1 $27.66 $29.05 $1,161.80
McHenry County 96.0 74 1 1.4% 6 8.1% 1 1.4% 77.8 $79.75 $61.47 $5,901.21
McHenry 73.0 93 20 21.5% 0 0.0% 16 17.2% 47.1 $50.84 $64.77 $4,727.88
Midlothian 114.3 142 63 44.4% 0 0.0% 31 21.8% 48.3 $40.47 $50.29 $5,746.16
Moline 38.0 40 4 10.0% 2 5.0% 0 0.0% 57.0 $38.81 $40.85 $1,552.21
Naperville 149.0 149 9 6.0% 12 8.1% 6 4.0% 60.0 $72.53 $72.53 $10,806.24
North Pekin 116.0 117 16 13.7% 6 5.1% 1 0.9% 59.5 $24.80 $25.02 $2,901.84
North Riverside 56.0 69 21 30.4% 0 0.0% 3 4.3% 48.7 $43.69 $53.83 $3,014.52
Oak Brook 17.0 6 3 50.0% 0 0.0% 1 16.7% 170.0 $161.47 $56.99 $968.84
Oak Forest 111.0 111 109 98.2% 0 0.0% 0 0.0% 60.0 $57.08 $57.08 $6,336.06
Oak Lawn 103.0 176 124 70.5% 2 1.1% 8 4.5% 35.1 $38.86 $66.41 $6,839.97
Olympia Fields 36.0 46 36 78.3% 0 0.0% 2 4.3% 47.0 $42.70 $54.56 $1,964.32
Orland Park 132.0 280 69 24.6% 1 0.4% 37 13.2% 28.3 $31.31 $66.42 $8,767.68
Oswego 50.0 88 57 64.8% 0 0.0% 26 29.5% 34.1 $35.62 $62.70 $3,134.90
Palatine 105.0 143 69 48.3% 2 1.4% 26 18.2% 44.1 $49.29 $67.13 $7,048.30
Palos Heights 54.0 51 31 60.8% 0 0.0% 13 25.5% 63.5 $63.92 $60.37 $3,259.96
Park City 52.0 92 37 40.2% 1 1.1% 0 0.0% 33.9 $31.22 $55.24 $2,872.50
Peoria County 46.0 26 13 50.0% 0 0.0% 0 0.0% 106.2 $83.37 $47.12 $2,167.58
Peoria 27.0 26 0 0.0% 2 7.7% 1 3.8% 62.3 $63.46 $61.11 $1,650.07
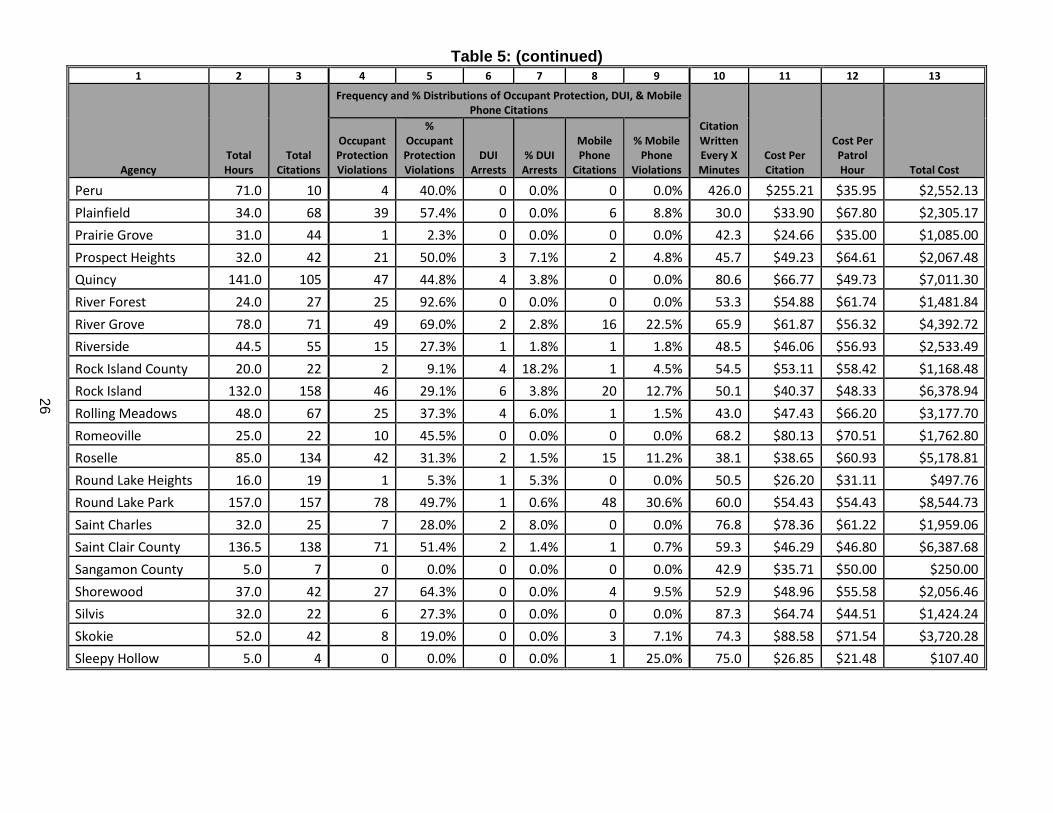
26
Table 5: (continued) 1 2 3 4 5 6 7 8 9 10 11 12 13
Agency Total Hours
Total Citations
Frequency and % Distributions of Occupant Protection, DUI, & Mobile Phone Citations
Citation Written Every X Minutes
Cost Per Citation
Cost Per Patrol Hour Total Cost
Occupant Protection Violations
% Occupant Protection Violations
DUI Arrests
% DUI Arrests
Mobile Phone
Citations
% Mobile Phone
Violations
Peru 71.0 10 4 40.0% 0 0.0% 0 0.0% 426.0 $255.21 $35.95 $2,552.13
Plainfield 34.0 68 39 57.4% 0 0.0% 6 8.8% 30.0 $33.90 $67.80 $2,305.17
Prairie Grove 31.0 44 1 2.3% 0 0.0% 0 0.0% 42.3 $24.66 $35.00 $1,085.00
Prospect Heights 32.0 42 21 50.0% 3 7.1% 2 4.8% 45.7 $49.23 $64.61 $2,067.48
Quincy 141.0 105 47 44.8% 4 3.8% 0 0.0% 80.6 $66.77 $49.73 $7,011.30
River Forest 24.0 27 25 92.6% 0 0.0% 0 0.0% 53.3 $54.88 $61.74 $1,481.84
River Grove 78.0 71 49 69.0% 2 2.8% 16 22.5% 65.9 $61.87 $56.32 $4,392.72
Riverside 44.5 55 15 27.3% 1 1.8% 1 1.8% 48.5 $46.06 $56.93 $2,533.49
Rock Island County 20.0 22 2 9.1% 4 18.2% 1 4.5% 54.5 $53.11 $58.42 $1,168.48
Rock Island 132.0 158 46 29.1% 6 3.8% 20 12.7% 50.1 $40.37 $48.33 $6,378.94
Rolling Meadows 48.0 67 25 37.3% 4 6.0% 1 1.5% 43.0 $47.43 $66.20 $3,177.70
Romeoville 25.0 22 10 45.5% 0 0.0% 0 0.0% 68.2 $80.13 $70.51 $1,762.80
Roselle 85.0 134 42 31.3% 2 1.5% 15 11.2% 38.1 $38.65 $60.93 $5,178.81
Round Lake Heights 16.0 19 1 5.3% 1 5.3% 0 0.0% 50.5 $26.20 $31.11 $497.76
Round Lake Park 157.0 157 78 49.7% 1 0.6% 48 30.6% 60.0 $54.43 $54.43 $8,544.73
Saint Charles 32.0 25 7 28.0% 2 8.0% 0 0.0% 76.8 $78.36 $61.22 $1,959.06
Saint Clair County 136.5 138 71 51.4% 2 1.4% 1 0.7% 59.3 $46.29 $46.80 $6,387.68
Sangamon County 5.0 7 0 0.0% 0 0.0% 0 0.0% 42.9 $35.71 $50.00 $250.00
Shorewood 37.0 42 27 64.3% 0 0.0% 4 9.5% 52.9 $48.96 $55.58 $2,056.46
Silvis 32.0 22 6 27.3% 0 0.0% 0 0.0% 87.3 $64.74 $44.51 $1,424.24
Skokie 52.0 42 8 19.0% 0 0.0% 3 7.1% 74.3 $88.58 $71.54 $3,720.28
Sleepy Hollow 5.0 4 0 0.0% 0 0.0% 1 25.0% 75.0 $26.85 $21.48 $107.40
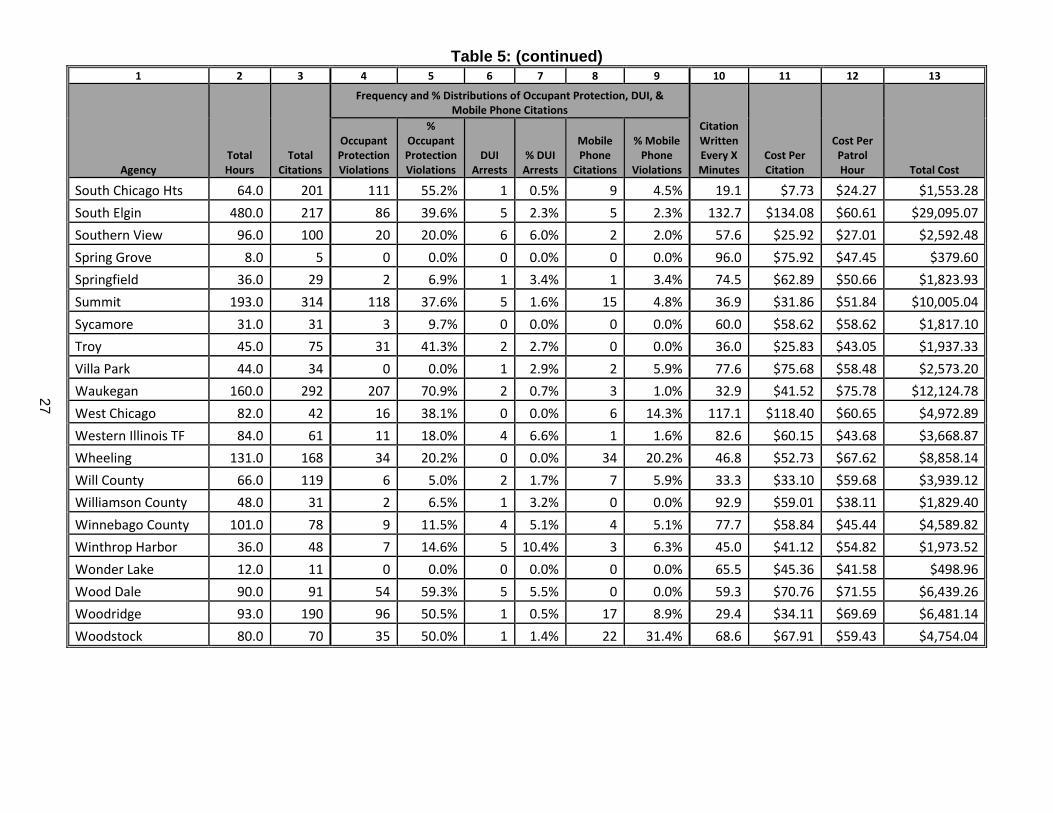
27
Table 5: (continued) 1 2 3 4 5 6 7 8 9 10 11 12 13
Agency Total Hours
Total Citations
Frequency and % Distributions of Occupant Protection, DUI, & Mobile Phone Citations
Citation Written Every X Minutes
Cost Per Citation
Cost Per Patrol Hour Total Cost
Occupant Protection Violations
% Occupant Protection Violations
DUI Arrests
% DUI Arrests
Mobile Phone
Citations
% Mobile Phone
Violations
South Chicago Hts 64.0 201 111 55.2% 1 0.5% 9 4.5% 19.1 $7.73 $24.27 $1,553.28
South Elgin 480.0 217 86 39.6% 5 2.3% 5 2.3% 132.7 $134.08 $60.61 $29,095.07
Southern View 96.0 100 20 20.0% 6 6.0% 2 2.0% 57.6 $25.92 $27.01 $2,592.48
Spring Grove 8.0 5 0 0.0% 0 0.0% 0 0.0% 96.0 $75.92 $47.45 $379.60
Springfield 36.0 29 2 6.9% 1 3.4% 1 3.4% 74.5 $62.89 $50.66 $1,823.93
Summit 193.0 314 118 37.6% 5 1.6% 15 4.8% 36.9 $31.86 $51.84 $10,005.04
Sycamore 31.0 31 3 9.7% 0 0.0% 0 0.0% 60.0 $58.62 $58.62 $1,817.10
Troy 45.0 75 31 41.3% 2 2.7% 0 0.0% 36.0 $25.83 $43.05 $1,937.33
Villa Park 44.0 34 0 0.0% 1 2.9% 2 5.9% 77.6 $75.68 $58.48 $2,573.20
Waukegan 160.0 292 207 70.9% 2 0.7% 3 1.0% 32.9 $41.52 $75.78 $12,124.78
West Chicago 82.0 42 16 38.1% 0 0.0% 6 14.3% 117.1 $118.40 $60.65 $4,972.89
Western Illinois TF 84.0 61 11 18.0% 4 6.6% 1 1.6% 82.6 $60.15 $43.68 $3,668.87
Wheeling 131.0 168 34 20.2% 0 0.0% 34 20.2% 46.8 $52.73 $67.62 $8,858.14
Will County 66.0 119 6 5.0% 2 1.7% 7 5.9% 33.3 $33.10 $59.68 $3,939.12
Williamson County 48.0 31 2 6.5% 1 3.2% 0 0.0% 92.9 $59.01 $38.11 $1,829.40
Winnebago County 101.0 78 9 11.5% 4 5.1% 4 5.1% 77.7 $58.84 $45.44 $4,589.82
Winthrop Harbor 36.0 48 7 14.6% 5 10.4% 3 6.3% 45.0 $41.12 $54.82 $1,973.52
Wonder Lake 12.0 11 0 0.0% 0 0.0% 0 0.0% 65.5 $45.36 $41.58 $498.96
Wood Dale 90.0 91 54 59.3% 5 5.5% 0 0.0% 59.3 $70.76 $71.55 $6,439.26
Woodridge 93.0 190 96 50.5% 1 0.5% 17 8.9% 29.4 $34.11 $69.69 $6,481.14
Woodstock 80.0 70 35 50.0% 1 1.4% 22 31.4% 68.6 $67.91 $59.43 $4,754.04
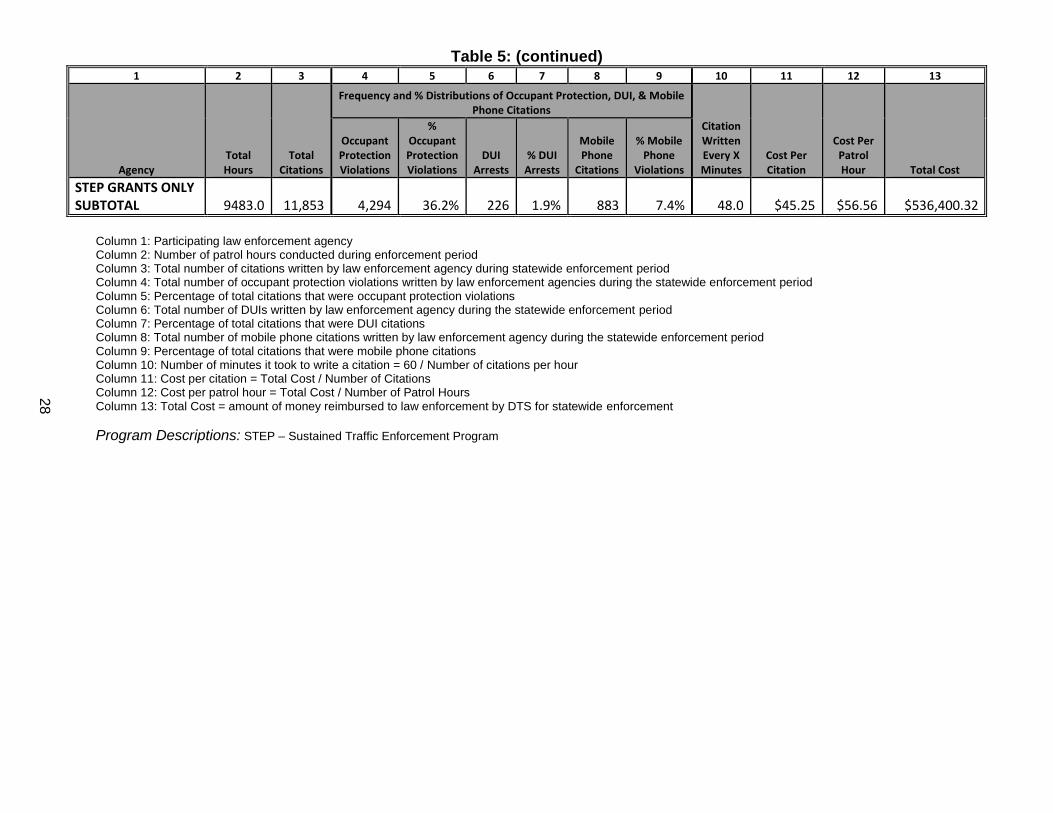
28
Table 5: (continued) 1 2 3 4 5 6 7 8 9 10 11 12 13
Agency Total Hours
Total Citations
Frequency and % Distributions of Occupant Protection, DUI, & Mobile Phone Citations
Citation Written Every X Minutes
Cost Per Citation
Cost Per Patrol Hour Total Cost
Occupant Protection Violations
% Occupant Protection Violations
DUI Arrests
% DUI Arrests
Mobile Phone
Citations
% Mobile Phone
Violations
STEP GRANTS ONLY SUBTOTAL 9483.0 11,853 4,294 36.2% 226 1.9% 883 7.4% 48.0 $45.25 $56.56 $536,400.32
Column 1: Participating law enforcement agency Column 2: Number of patrol hours conducted during enforcement period Column 3: Total number of citations written by law enforcement agency during statewide enforcement period Column 4: Total number of occupant protection violations written by law enforcement agencies during the statewide enforcement period Column 5: Percentage of total citations that were occupant protection violations Column 6: Total number of DUIs written by law enforcement agency during the statewide enforcement period Column 7: Percentage of total citations that were DUI citations Column 8: Total number of mobile phone citations written by law enforcement agency during the statewide enforcement period Column 9: Percentage of total citations that were mobile phone citations Column 10: Number of minutes it took to write a citation = 60 / Number of citations per hour Column 11: Cost per citation = Total Cost / Number of Citations Column 12: Cost per patrol hour = Total Cost / Number of Patrol Hours Column 13: Total Cost = amount of money reimbursed to law enforcement by DTS for statewide enforcement
Program Descriptions: STEP – Sustained Traffic Enforcement Program
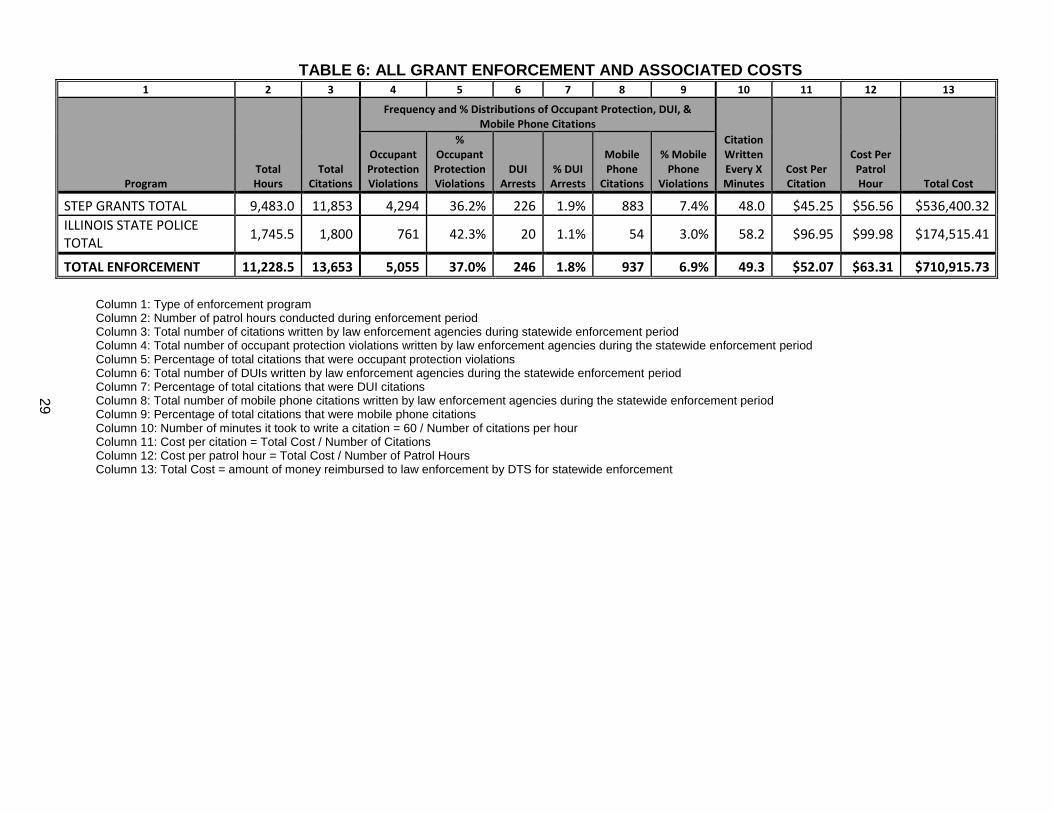
29
TABLE 6: ALL GRANT ENFORCEMENT AND ASSOCIATED COSTS 1 2 3 4 5 6 7 8 9 10 11 12 13
Program Total Hours
Total Citations
Frequency and % Distributions of Occupant Protection, DUI, & Mobile Phone Citations
Citation Written Every X Minutes
Cost Per Citation
Cost Per Patrol Hour Total Cost
Occupant Protection Violations
% Occupant Protection Violations
DUI Arrests
% DUI Arrests
Mobile Phone
Citations
% Mobile Phone
Violations
STEP GRANTS TOTAL 9,483.0 11,853 4,294 36.2% 226 1.9% 883 7.4% 48.0 $45.25 $56.56 $536,400.32
ILLINOIS STATE POLICE TOTAL
1,745.5 1,800 761 42.3% 20 1.1% 54 3.0% 58.2 $96.95 $99.98 $174,515.41
TOTAL ENFORCEMENT 11,228.5 13,653 5,055 37.0% 246 1.8% 937 6.9% 49.3 $52.07 $63.31 $710,915.73
Column 1: Type of enforcement program Column 2: Number of patrol hours conducted during enforcement period Column 3: Total number of citations written by law enforcement agencies during statewide enforcement period Column 4: Total number of occupant protection violations written by law enforcement agencies during the statewide enforcement period Column 5: Percentage of total citations that were occupant protection violations Column 6: Total number of DUIs written by law enforcement agencies during the statewide enforcement period Column 7: Percentage of total citations that were DUI citations Column 8: Total number of mobile phone citations written by law enforcement agencies during the statewide enforcement period Column 9: Percentage of total citations that were mobile phone citations Column 10: Number of minutes it took to write a citation = 60 / Number of citations per hour Column 11: Cost per citation = Total Cost / Number of Citations Column 12: Cost per patrol hour = Total Cost / Number of Patrol Hours Column 13: Total Cost = amount of money reimbursed to law enforcement by DTS for statewide enforcement