DRIs - ILSI Indiailsi-india.org/Expert Consultation On Nutrient Risk Assessment For... · DRIs...
52
DRIs Dietary Reference Intakes Dietary Reference Intakes 119-02 Allison A. Yates, PhD, RD Procedures for Development of Tolerable Upper Intake Levels for Nutrients 1994-2004
Transcript of DRIs - ILSI Indiailsi-india.org/Expert Consultation On Nutrient Risk Assessment For... · DRIs...
DRIs Dietary Reference Intakes Dietary Reference Intakes
119-02
Allison A. Yates, PhD, RD
Procedures for Development of Tolerable Upper Intake Levels for Nutrients
1994-2004
Today’s Presentation
Previous discussions/reports impacting need to develop a new process for setting reference values
Overview of US/Canada DRI Process In-depth look at steps in developing ULs Examples of UL derivation
Previous Reports that Set the Stage for the Development ULs
1983 Risk Assessment Report—U.S. NRC 1983 Recommended Nutrient Intakes—Health
& Welfare, Canada 1991 UK Dietary Reference Values Report—
COMA 1994 Risk Assessment of Essential Elements
Report—ILSI 143-01
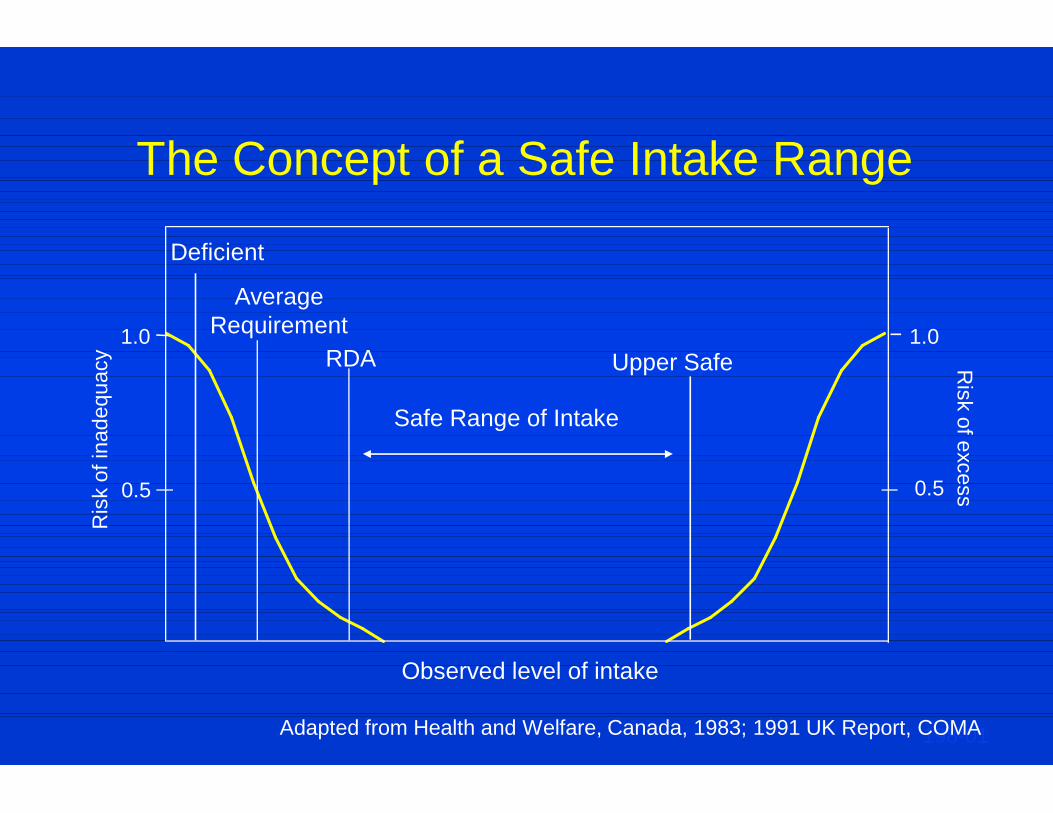
The Concept of a Safe Intake Range
Observed level of intake
Ris
k of
inad
equa
cy
Risk of excess 0.5 0.5
RDA
Average Requirement
198-01
Safe Range of Intake
1.0 1.0 Upper Safe
Deficient
Adapted from Health and Welfare, Canada, 1983; 1991 UK Report, COMA
DRI Framework
Reference values to meet variety of uses Concepts of reduction of risk to chronic
disease Reviews of other food components In-depth rationale for functional end points
used Open dialog with interested groups Estimates of upper limits of intake
143-01
Why DRIs? Conceptual Approach
Quantitative dietary reference values need to address multiple users and meet multiple needs —Labeling —Limits for fortification —Assessing adequacy of diets of population
groups One number can’t do it all if a science-based
approach is to be followed 142-02
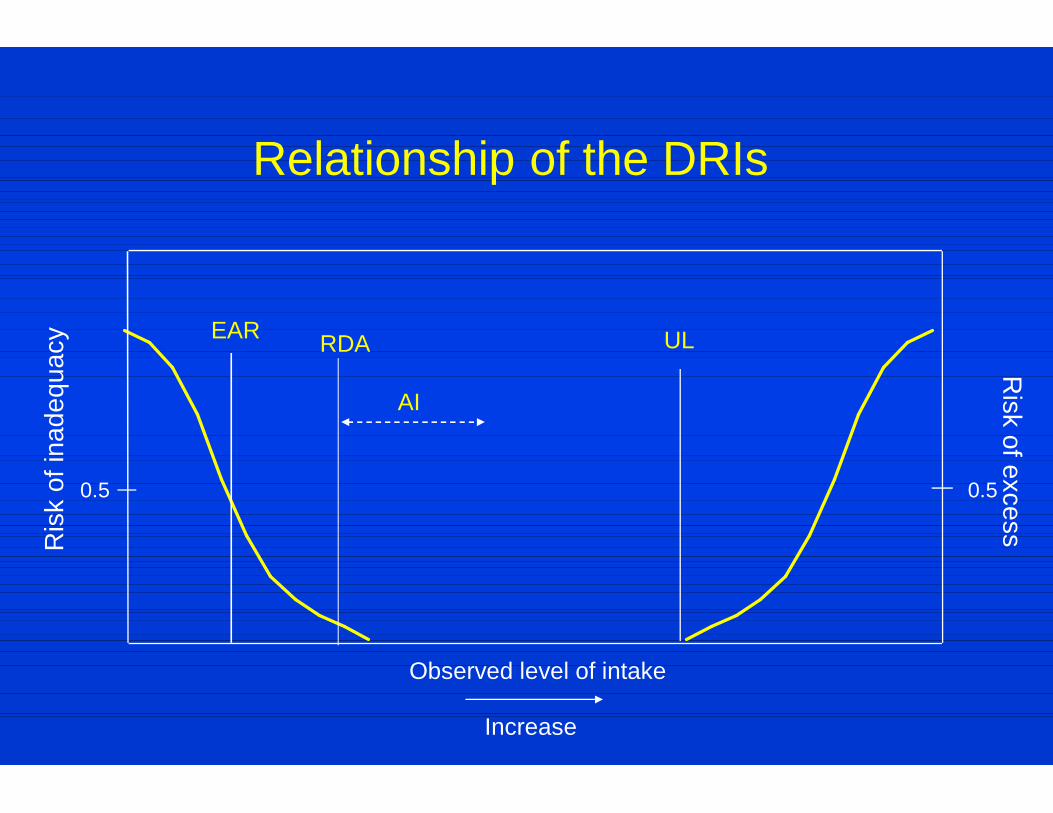
Observed level of intake
UL
Ris
k of
inad
equa
cy
Risk of excess
0.5 0.5
RDA
AI
EAR
Increase
Relationship of the DRIs
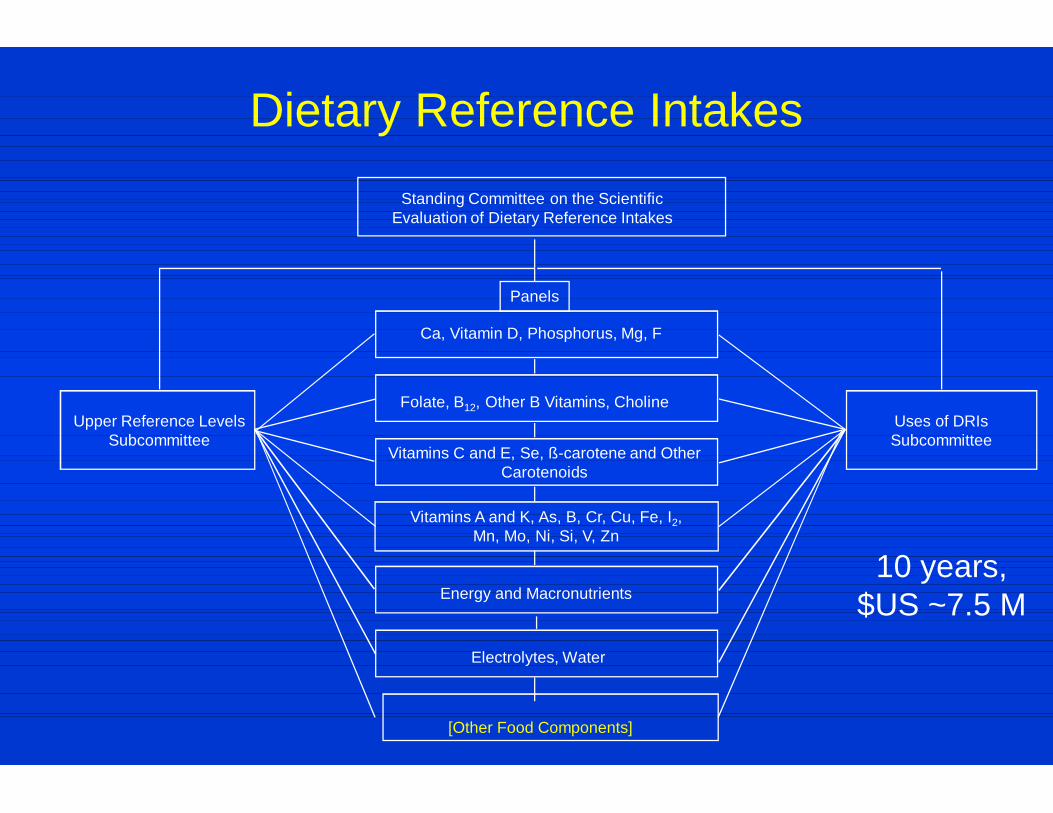
Dietary Reference Intakes
Upper Reference Levels Subcommittee
Uses of DRIs Subcommittee
Standing Committee on the Scientific Evaluation of Dietary Reference Intakes
Panels
Ca, Vitamin D, Phosphorus, Mg, F
Folate, B12, Other B Vitamins, Choline
Vitamins C and E, Se, ß-carotene and Other Carotenoids
Vitamins A and K, As, B, Cr, Cu, Fe, I2, Mn, Mo, Ni, Si, V, Zn
Energy and Macronutrients
Electrolytes, Water
[Other Food Components]
10 years, $US ~7.5 M

Flow Chart of DRI Activities—FNB/IOM Process NRC REVIEW
UPPER REFERENCE
LEVELS SUBCOMMITTEE
DRI COMMITTEE- Scientific
Evaluation of DRIs
NUTRIENT GROUP PANEL(S)
SCIENTIFIC AND USER
COMMUNITIES
Reports Released
Recommends Appointments to
Panel and Guides Forwards Drafts
Solicits Nominees
Input USES OF DRIs SUBCOMMITTEE
1) Holds Workshops and Meetings 2) Develops Scientific Basis for Nutrient Needs and Sets Tentative Reference Values, Including EARs, Variances, RDAs, AIs, and ULs
Forwards Drafts
Forwards Drafts
Develops Guidelines for use with Emphasis on Policy,
Guidance & Education
158-01
DRIs Dietary Reference Intakes Dietary Reference Intakes
119-02
Allison A. Yates, PhD, RD
Development of Tolerable Upper Intake Levels for Nutrients
1994-2004
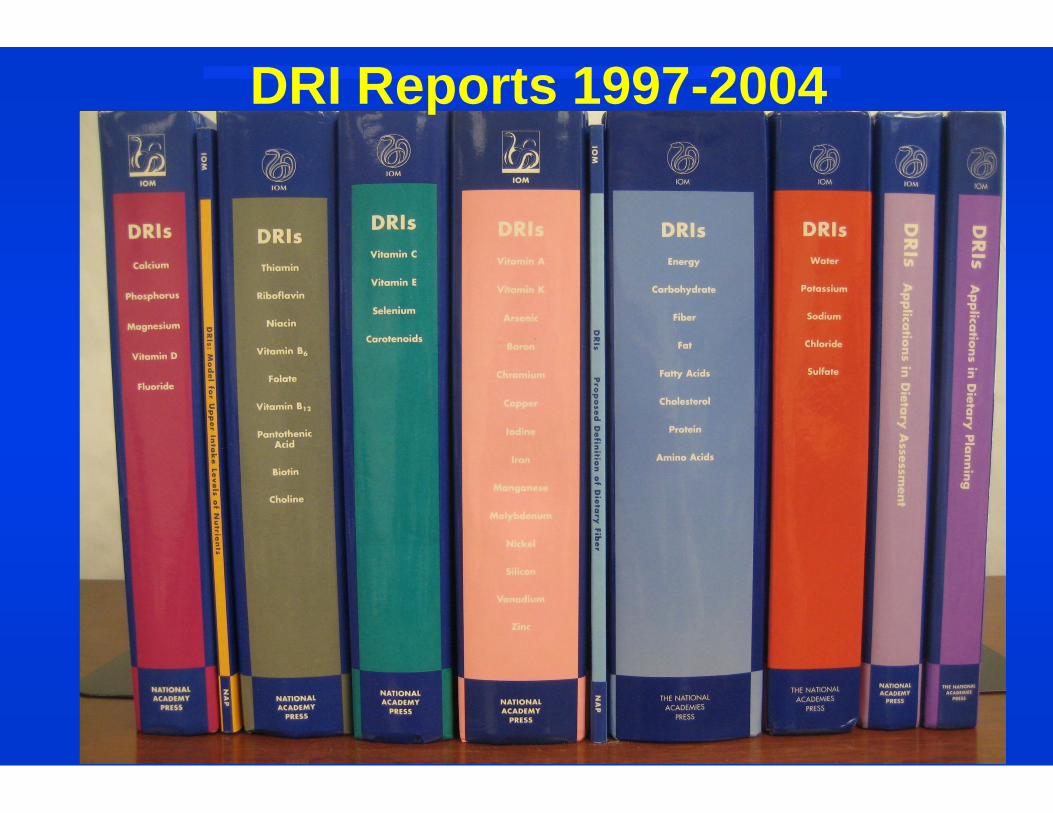
DRI Reports 1997-2004
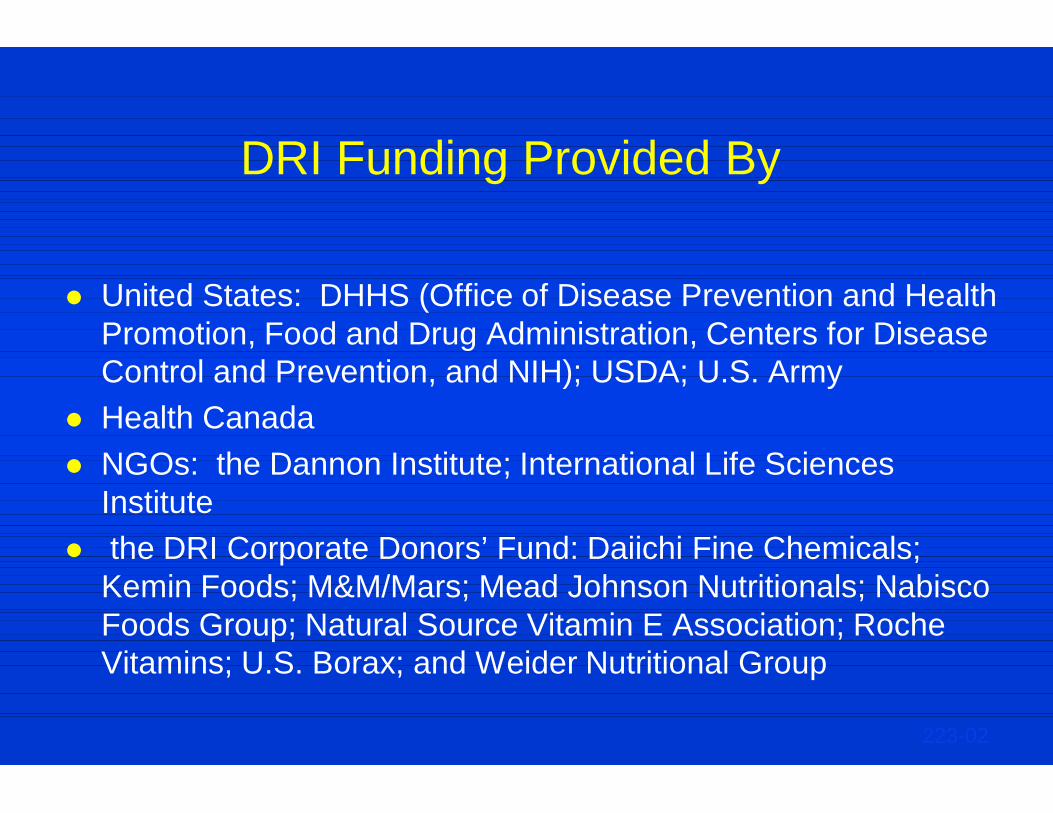
DRI Funding Provided By
United States: DHHS (Office of Disease Prevention and Health Promotion, Food and Drug Administration, Centers for Disease Control and Prevention, and NIH); USDA; U.S. Army
Health Canada NGOs: the Dannon Institute; International Life Sciences
Institute the DRI Corporate Donors’ Fund: Daiichi Fine Chemicals;
Kemin Foods; M&M/Mars; Mead Johnson Nutritionals; Nabisco Foods Group; Natural Source Vitamin E Association; Roche Vitamins; U.S. Borax; and Weider Nutritional Group
223-02
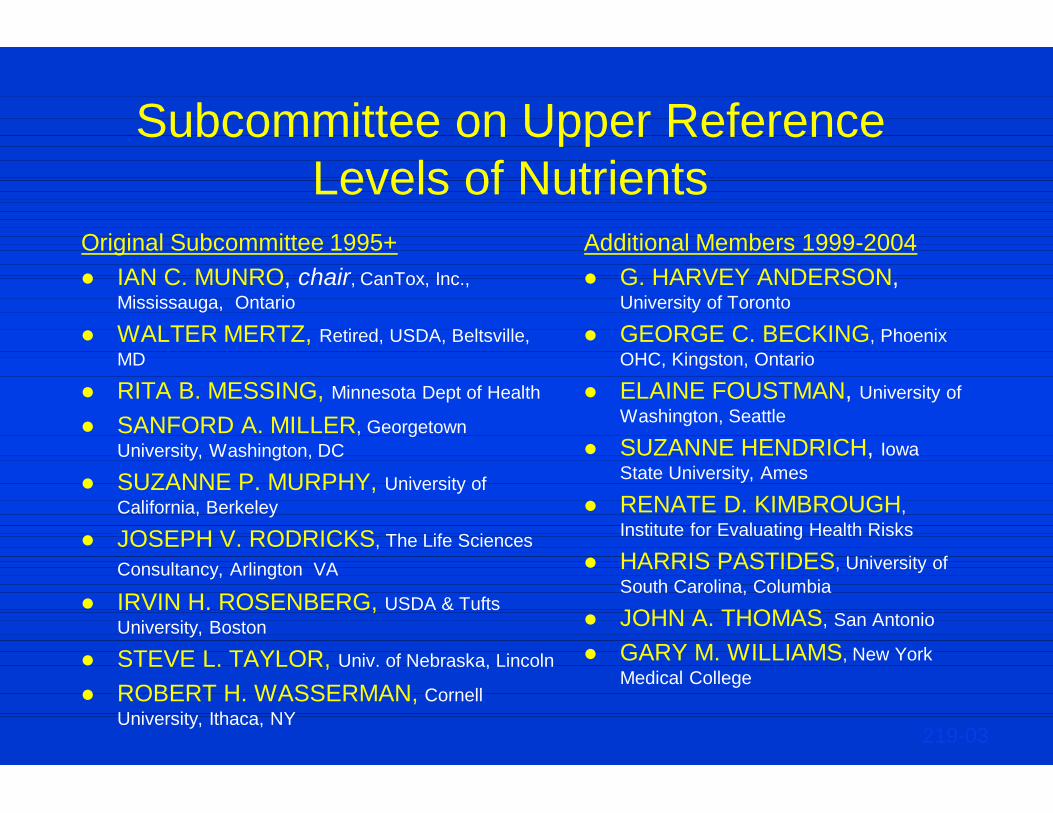
Subcommittee on Upper Reference Levels of Nutrients
Original Subcommittee 1995+ IAN C. MUNRO, chair, CanTox, Inc.,
Mississauga, Ontario
WALTER MERTZ, Retired, USDA, Beltsville, MD
RITA B. MESSING, Minnesota Dept of Health
SANFORD A. MILLER, Georgetown University, Washington, DC
SUZANNE P. MURPHY, University of California, Berkeley
JOSEPH V. RODRICKS, The Life Sciences Consultancy, Arlington VA
IRVIN H. ROSENBERG, USDA & Tufts University, Boston
STEVE L. TAYLOR, Univ. of Nebraska, Lincoln
ROBERT H. WASSERMAN, Cornell University, Ithaca, NY
Additional Members 1999-2004 G. HARVEY ANDERSON,
University of Toronto
GEORGE C. BECKING, Phoenix OHC, Kingston, Ontario
ELAINE FOUSTMAN, University of Washington, Seattle
SUZANNE HENDRICH, Iowa State University, Ames
RENATE D. KIMBROUGH, Institute for Evaluating Health Risks
HARRIS PASTIDES, University of South Carolina, Columbia
JOHN A. THOMAS, San Antonio
GARY M. WILLIAMS, New York Medical College
219-03
Key Issues in the Development of a Model for Upper Levels of Nutrients
Safety versus risk Limitations of traditional models Unique characteristics of nutrients Sparse documentation of adverse effects
of chronic overconsumption Coordinating the work of the nutrient
review panels with the subcommittees
220-02
Characteristics of the Concept of Safety
Safety is: An intellectual concept Not an inherent biological property A point on a continuum
221-02
UK DRV Report in 1991 had used the term “Upper Safe Level of Intake”
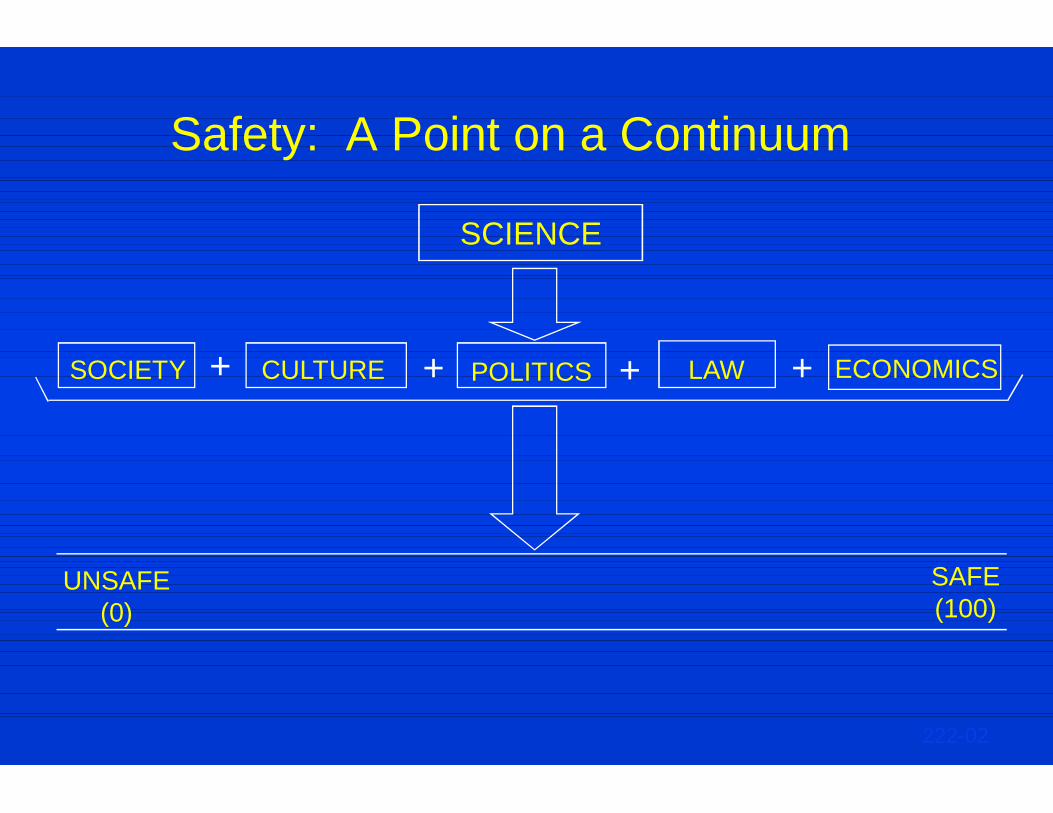
Safety: A Point on a Continuum
+ + + + SOCIETY CULTURE POLITICS LAW ECONOMICS
UNSAFE (0)
SAFE (100)
222-02
SCIENCE

Definition of Risk
Risk is defined as the probability of an adverse effect occurring at some specified level of exposure
Risk assessment is a scientific exercise, not influenced by value judgments
Risk management = approaches to take to mitigate identified risk --- not part of risk assessment
223-02
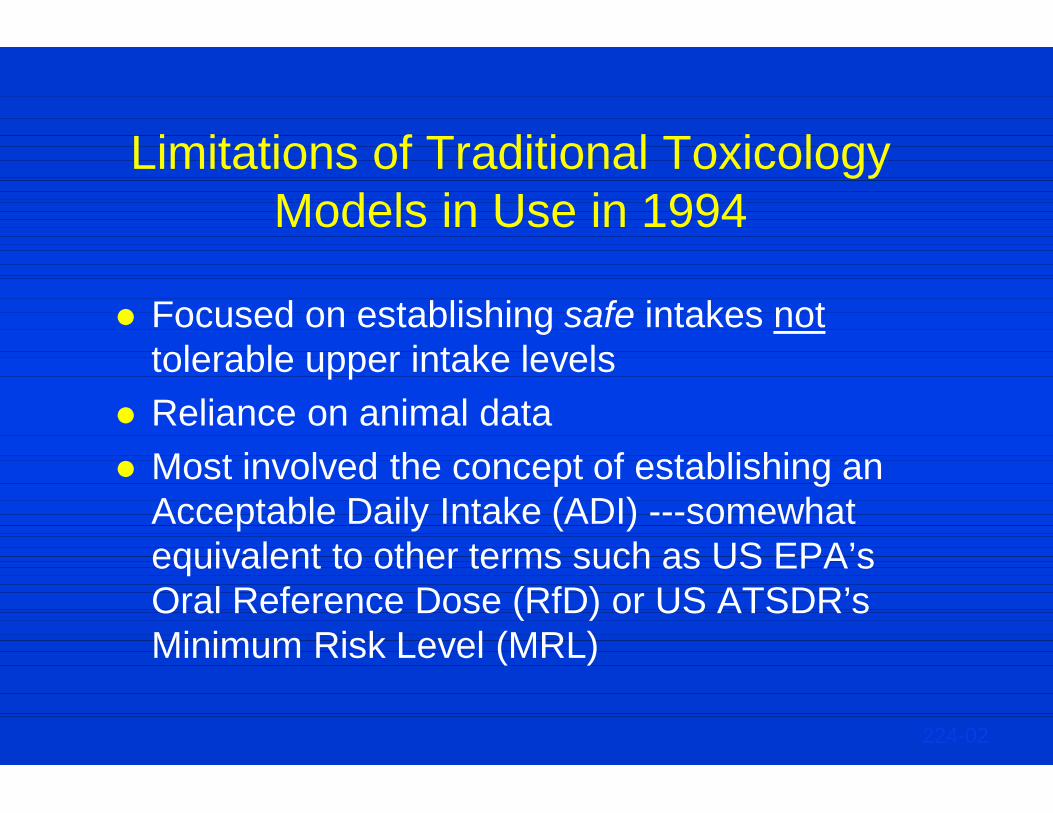
Limitations of Traditional Toxicology Models in Use in 1994
Focused on establishing safe intakes not tolerable upper intake levels
Reliance on animal data Most involved the concept of establishing an
Acceptable Daily Intake (ADI) ---somewhat equivalent to other terms such as US EPA’s Oral Reference Dose (RfD) or US ATSDR’s Minimum Risk Level (MRL)
224-02
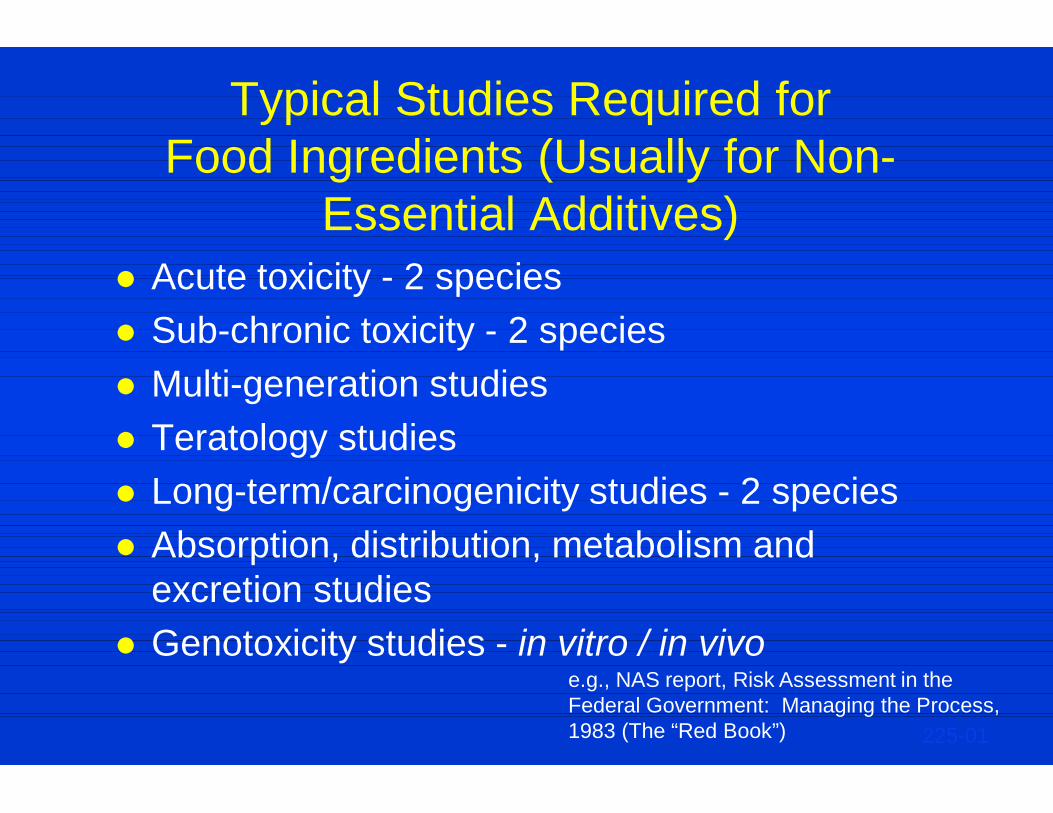
Typical Studies Required for Food Ingredients (Usually for Non-
Essential Additives) Acute toxicity - 2 species Sub-chronic toxicity - 2 species Multi-generation studies Teratology studies Long-term/carcinogenicity studies - 2 species Absorption, distribution, metabolism and
excretion studies Genotoxicity studies - in vitro / in vivo
225-01
e.g., NAS report, Risk Assessment in the Federal Government: Managing the Process, 1983 (The “Red Book”)
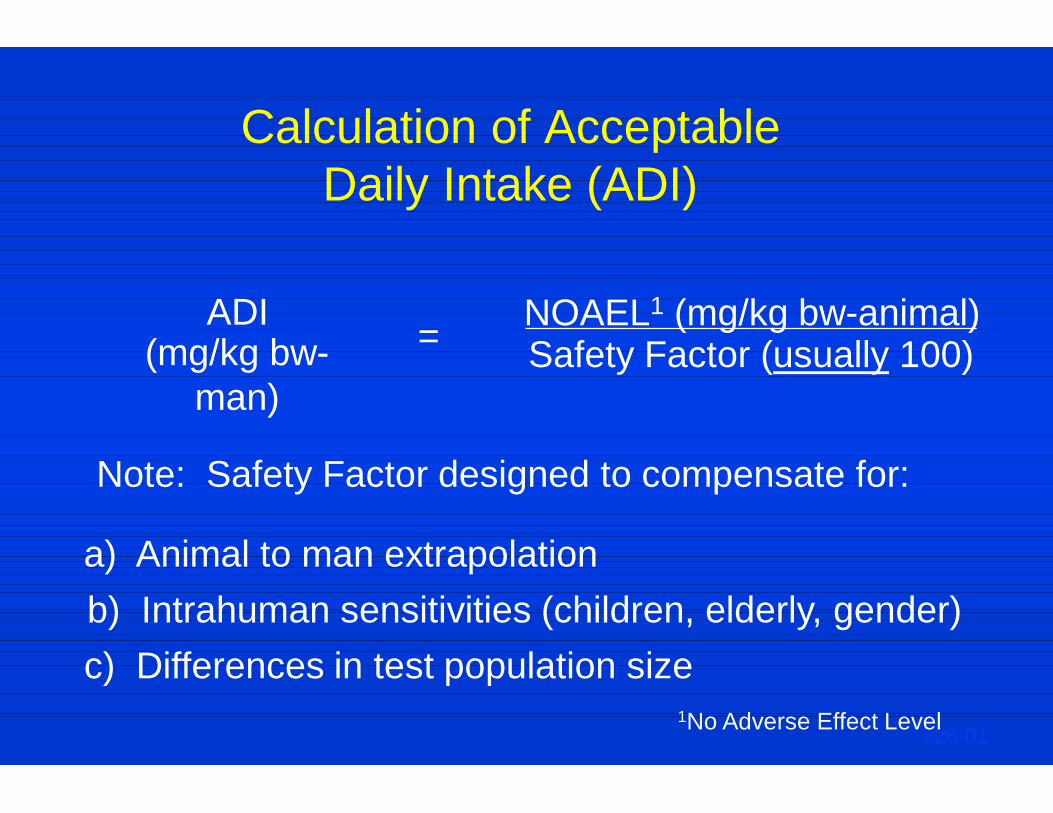
Calculation of Acceptable Daily Intake (ADI)
ADI
(mg/kg bw-man)
= NOAEL1 (mg/kg bw-animal) Safety Factor (usually 100)
Note: Safety Factor designed to compensate for:
a) Animal to man extrapolation b) Intrahuman sensitivities (children, elderly, gender) c) Differences in test population size
226-01 1No Adverse Effect Level
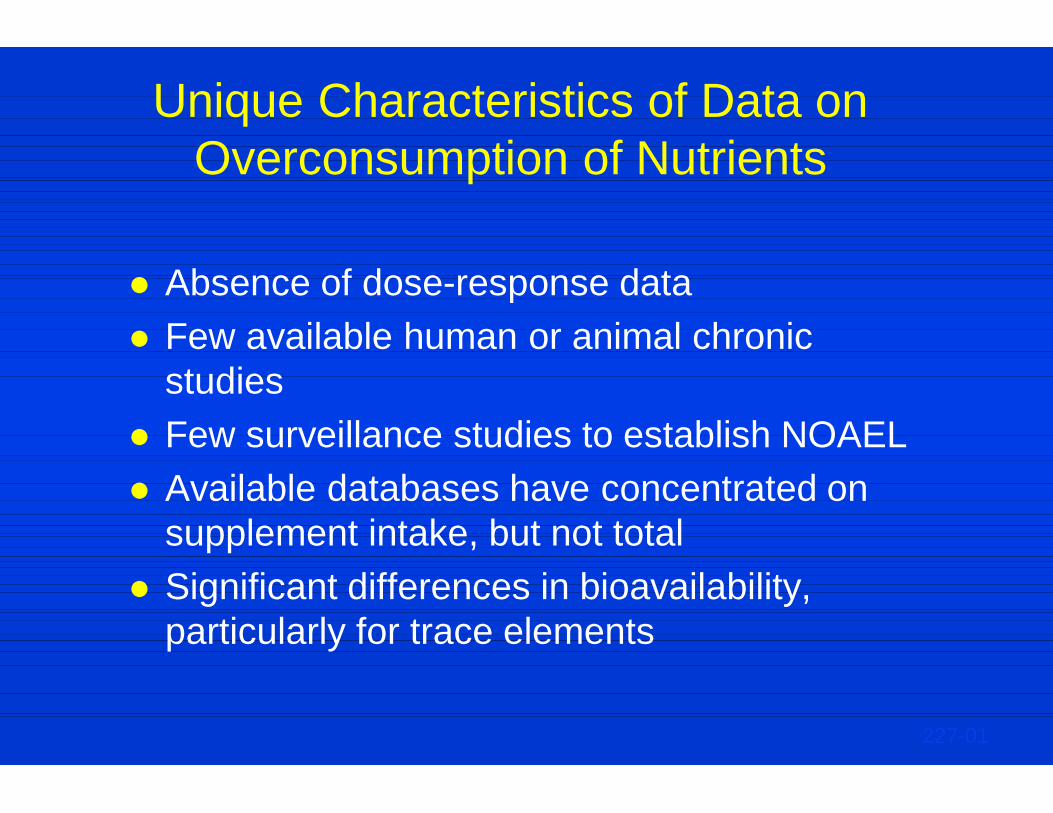
Unique Characteristics of Data on Overconsumption of Nutrients
Absence of dose-response data Few available human or animal chronic
studies Few surveillance studies to establish NOAEL Available databases have concentrated on
supplement intake, but not total Significant differences in bioavailability,
particularly for trace elements
227-01
Problem Identified When Standard Uncertainty Factors Used with
Essential Nutrients
US EPA’s RfD (oral reference dose) for zinc for children was less than the 1989 RDA for zinc for young boys

Risk Assessment Model
Hazard Identification Dose-Response Assessment Exposure Assessment Risk Characterization Risk Management
231-01
DRI UL Tolerable Upper Intake Level--Definition
The highest daily nutrient intake level that is likely to pose no risk of adverse health effects to almost all individuals in the general population. As intake increases above the UL, the potential risk of adverse effects may increase(s). The UL is not a recommended level of intake and is not a level that is desirable to attain.
228-04
NOTE: Words in italics added in later DRI reports
UL Tolerable Upper Intake Level
Aspects Important to Consider when Applying to Nutrients
Limited data available due to few human studies Depending on clinical significance of observed
adverse effects, uncertainty factor used will vary Observed effects may vary depending on form of
intake
229-03
Step 1: Hazard Identification
Components Evidence of adverse effects in humans Causality Relevance of experimental data Mechanism of toxic action Quality and completeness of the data base Identification of distinct and highly sensitive
subpopulations
232-01
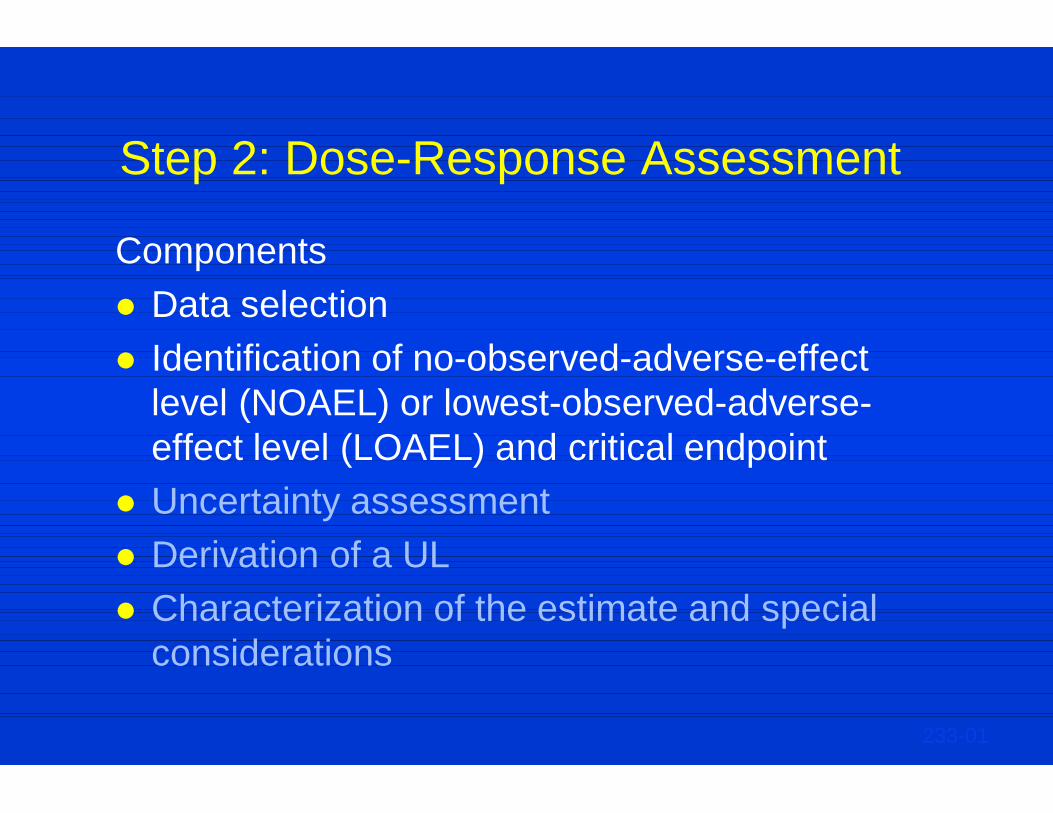
Step 2: Dose-Response Assessment
Components Data selection Identification of no-observed-adverse-effect
level (NOAEL) or lowest-observed-adverse-effect level (LOAEL) and critical endpoint
Uncertainty assessment Derivation of a UL Characterization of the estimate and special
considerations
233-01

Step 3: Uncertainty Assessment
Depends on Inter-individual variation in sensitivity Experimental animal data extrapolated to
humans LOAEL used in absence of NOAEL Sub-chronic NOAEL used to predict chronic
NOAEL
234-01
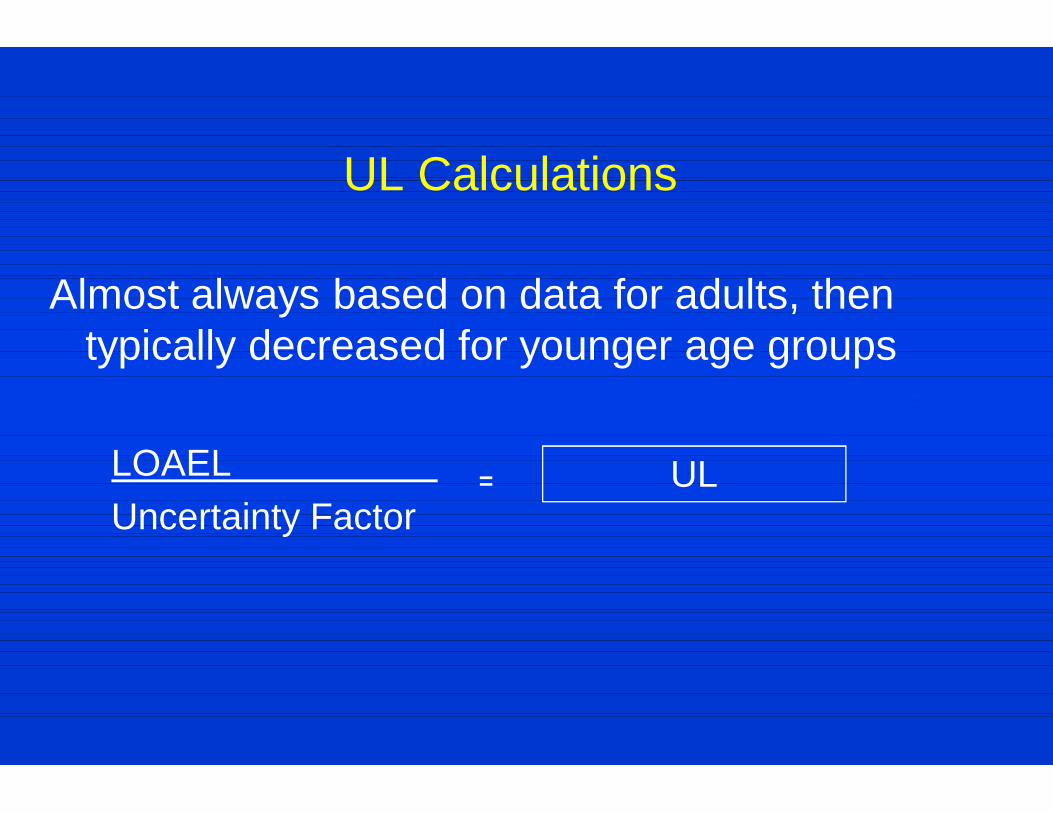
UL Calculations
Almost always based on data for adults, then typically decreased for younger age groups
LOAEL = Uncertainty Factor
= =
UL
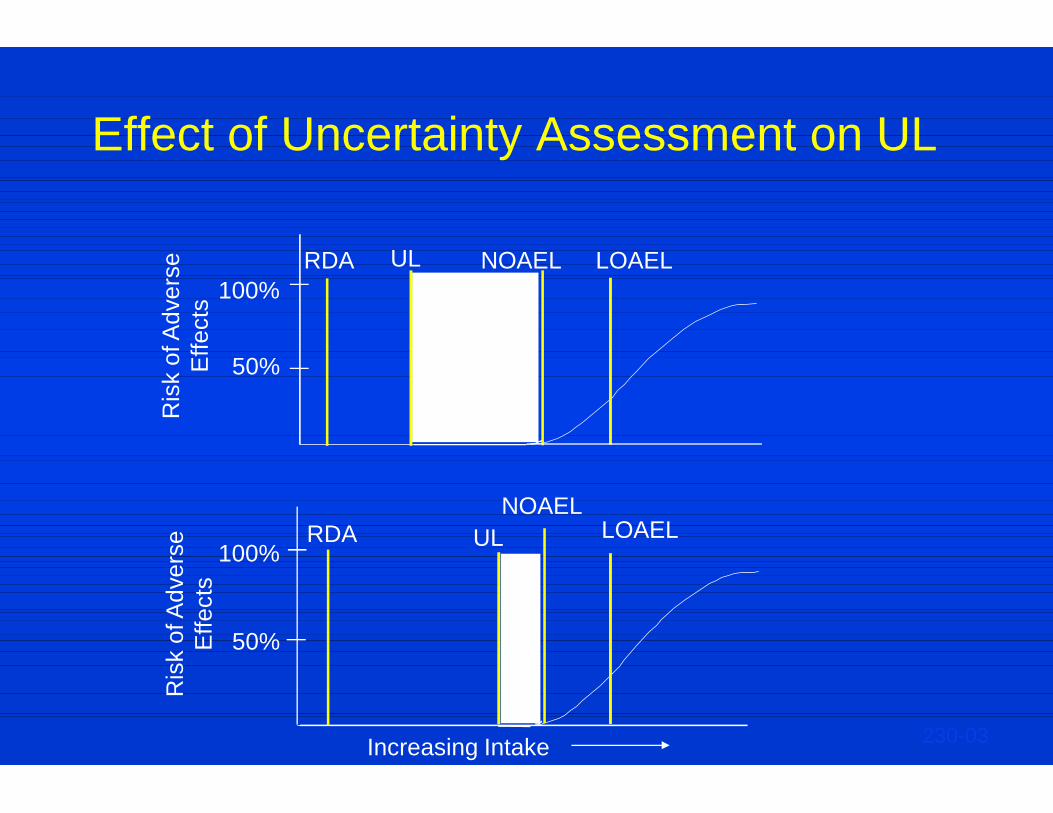
Effect of Uncertainty Assessment on UL
100%
50%
RDA UL NOAEL LOAEL
100%
50%
RDA UL NOAEL
LOAEL
Ris
k of
Adv
erse
E
ffect
s R
isk
of A
dver
se
Effe
cts
Increasing Intake 230-03
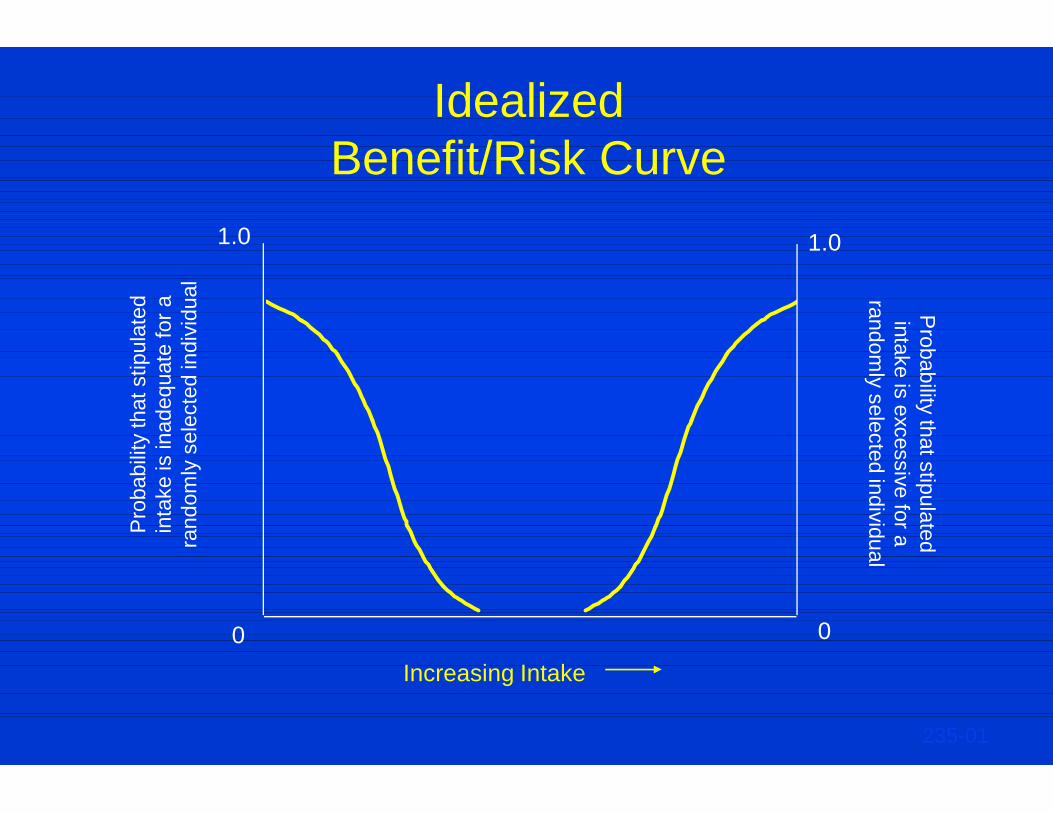
Idealized Benefit/Risk Curve
Pro
babi
lity
that
stip
ulat
ed
inta
ke is
inad
equa
te fo
r a
rand
omly
sel
ecte
d in
divi
dual
Probability that stipulated
intake is excessive for a random
ly selected individual
0
1.0 1.0
0
Increasing Intake
235-01
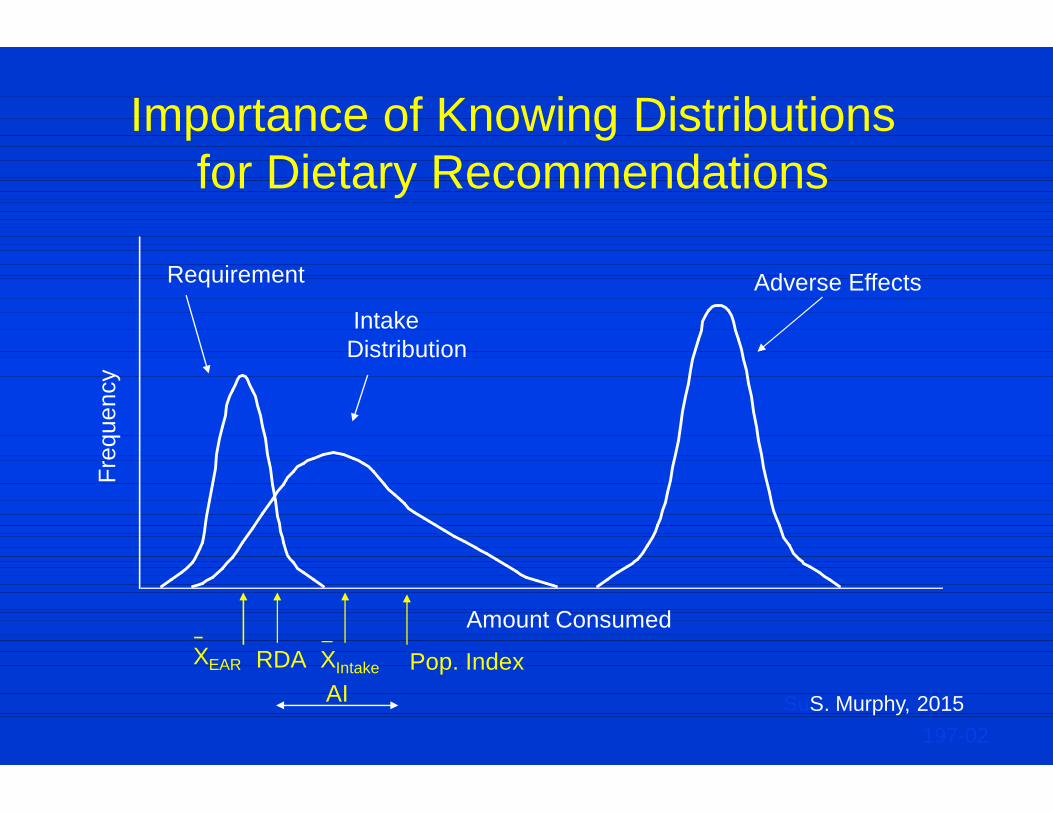
Importance of Knowing Distributions for Dietary Recommendations
Freq
uenc
y
Requirement Adverse Effects Intake Distribution
XEAR RDA XIntake
Amount Consumed
Pop. Index AI
197-02 SuS. Murphy, 2015

Distributions for Dietary Recommendations—Possibly
Overlapping Distributions
Freq
uenc
y
Requirement Idealized Adverse Effects Intake
Distribution
XEAR RDA XIntake
Amount Consumed
Pop. Index AI
197-02
SuS. Murphy, 2015
Actual Adverse Effects
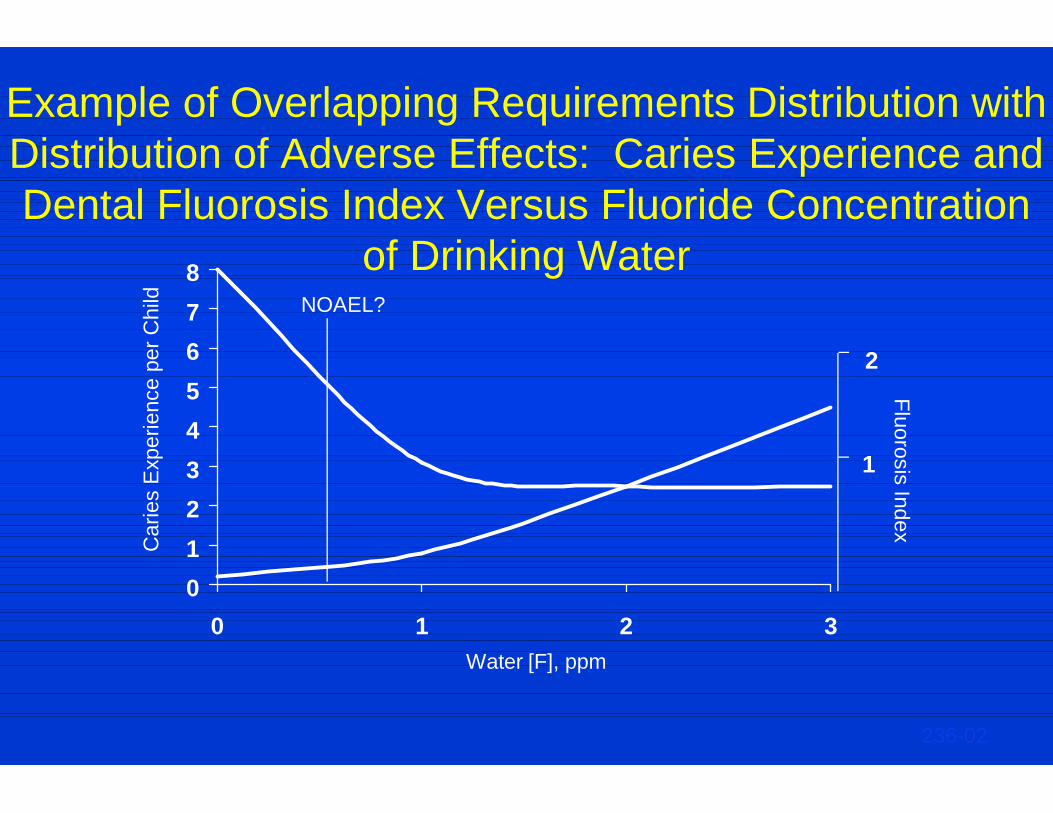
Example of Overlapping Requirements Distribution with Distribution of Adverse Effects: Caries Experience and Dental Fluorosis Index Versus Fluoride Concentration
of Drinking Water
012345678
0 1 2 3
2
1
Car
ies
Exp
erie
nce
per C
hild
Fluorosis Index
Water [F], ppm
236-02
NOAEL?
Example: Establishing a UL For Folate
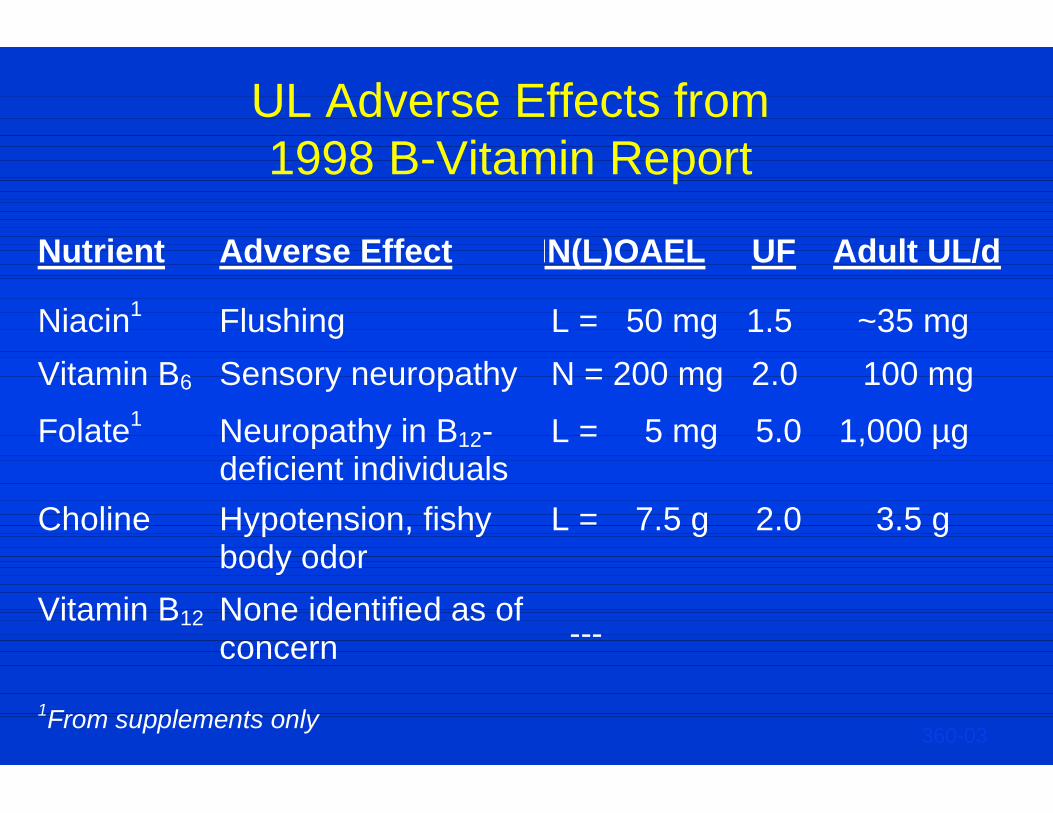
UL Adverse Effects from 1998 B-Vitamin Report
Nutrient Adverse Effect NN(L)OAEL UF Adult UL/d
Niacin1 Flushing L = 50 mg 1.5 ~35 mg Vitamin B6 Sensory neuropathy N = 200 mg 2.0 100 mg
Folate1 Neuropathy in B12- deficient individuals
L = 5 mg 5.0 1,000 µg
Choline Vitamin B12
Hypotension, fishy body odor None identified as of concern
L = 7.5 g 2.0 3.5 g ---
1From supplements only 360-03
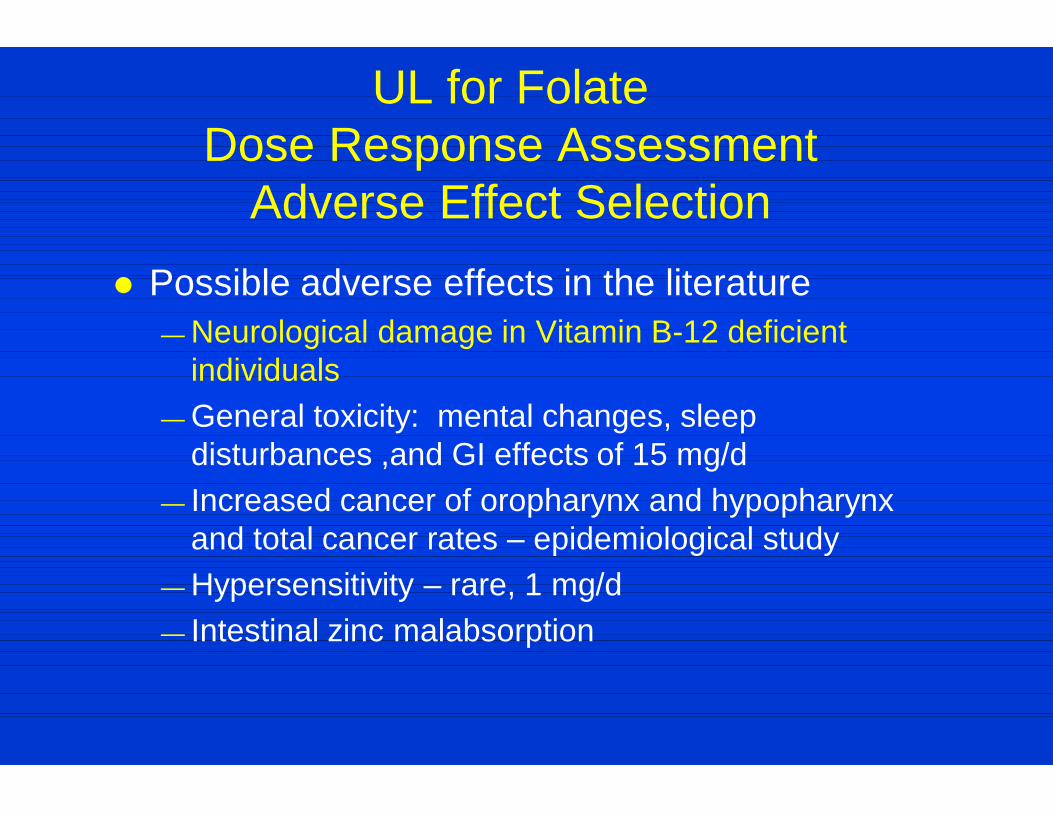
UL for Folate Dose Response Assessment
Adverse Effect Selection Possible adverse effects in the literature
— Neurological damage in Vitamin B-12 deficient individuals
— General toxicity: mental changes, sleep disturbances ,and GI effects of 15 mg/d
— Increased cancer of oropharynx and hypopharynx and total cancer rates – epidemiological study
— Hypersensitivity – rare, 1 mg/d — Intestinal zinc malabsorption
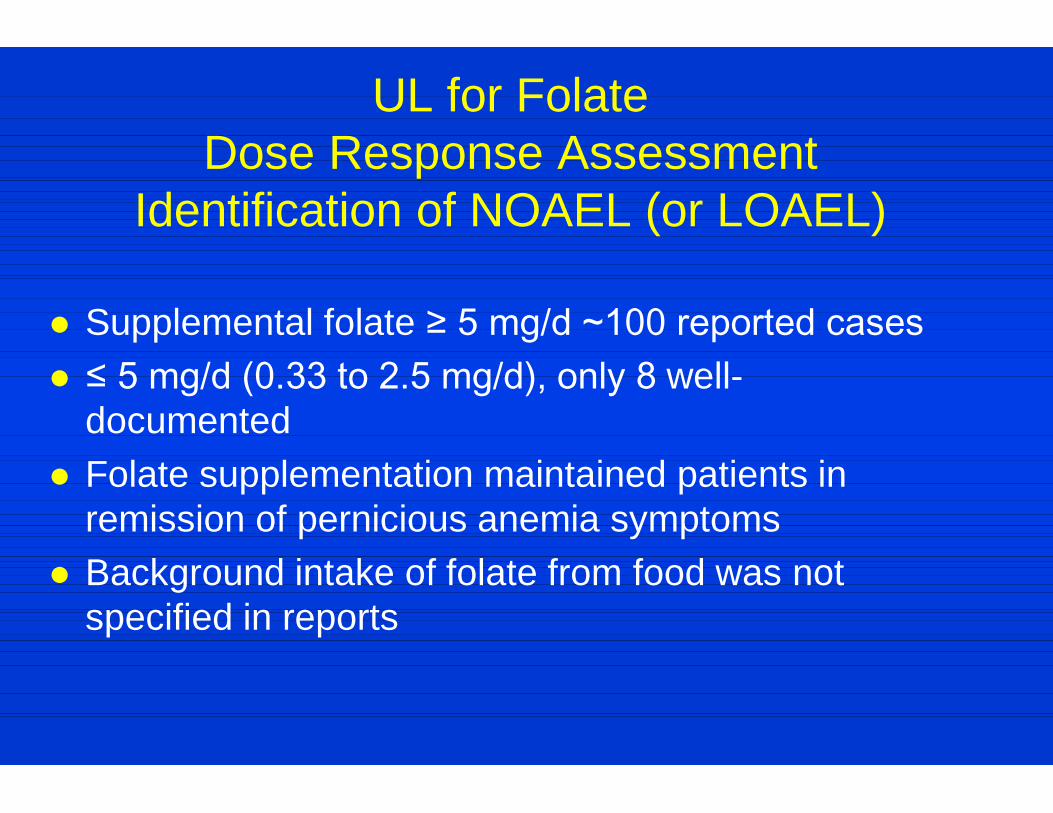
UL for Folate Dose Response Assessment
Identification of NOAEL (or LOAEL)
Supplemental folate ≥ 5 mg/d ~100 reported cases ≤ 5 mg/d (0.33 to 2.5 mg/d), only 8 well-
documented Folate supplementation maintained patients in
remission of pernicious anemia symptoms Background intake of folate from food was not
specified in reports
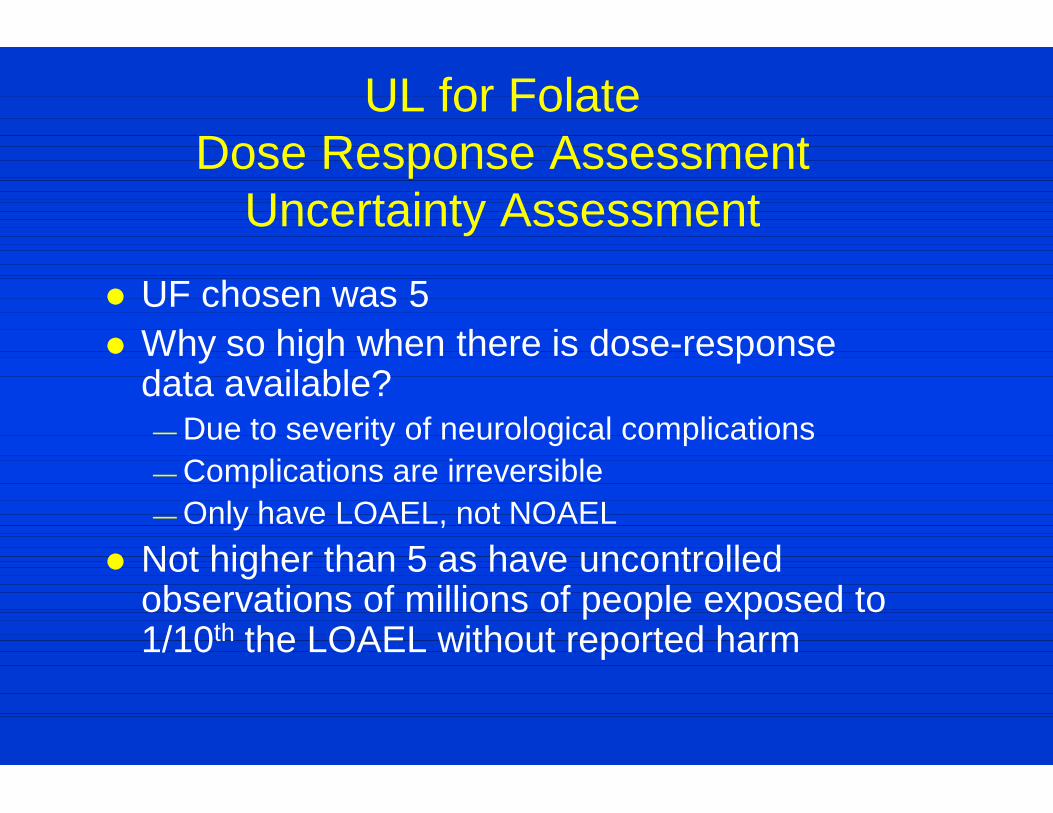
UL for Folate Dose Response Assessment
Uncertainty Assessment UF chosen was 5 Why so high when there is dose-response
data available? — Due to severity of neurological complications — Complications are irreversible — Only have LOAEL, not NOAEL
Not higher than 5 as have uncontrolled observations of millions of people exposed to 1/10th the LOAEL without reported harm
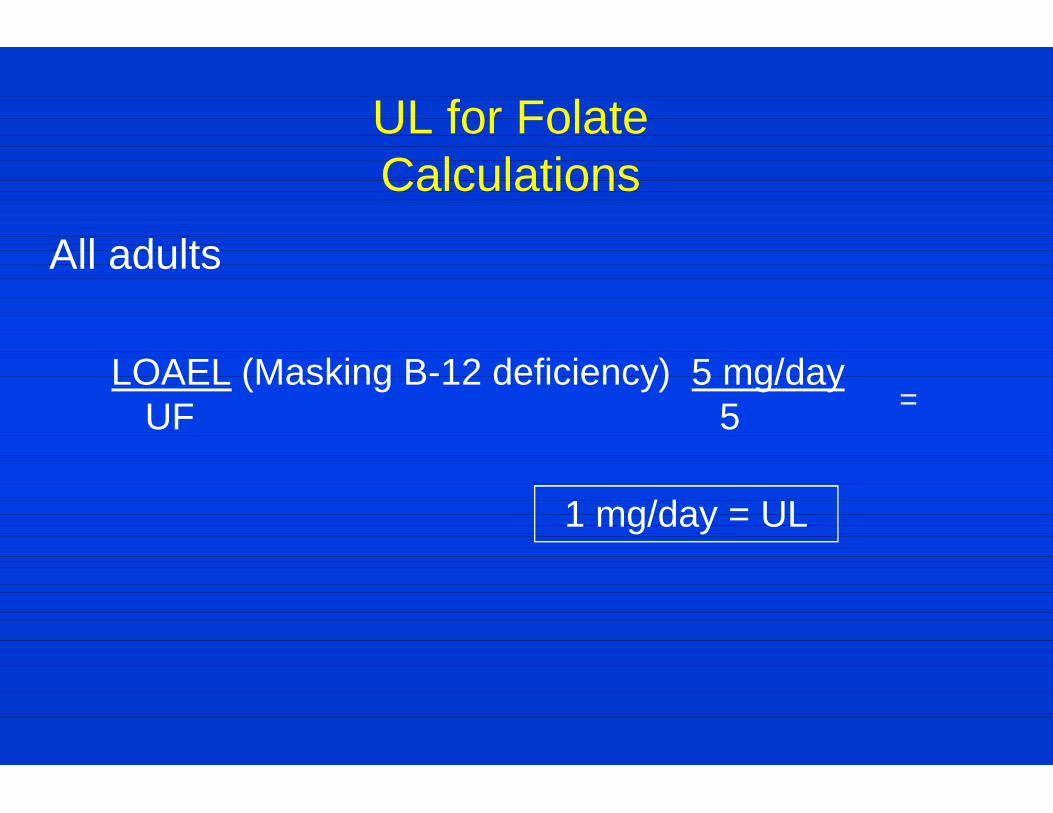
UL for Folate Calculations
All adults LOAEL (Masking B-12 deficiency) 5 mg/day
UF 5
= ==
1 mg/day = UL

Example: Establishing a UL For β-Carotene
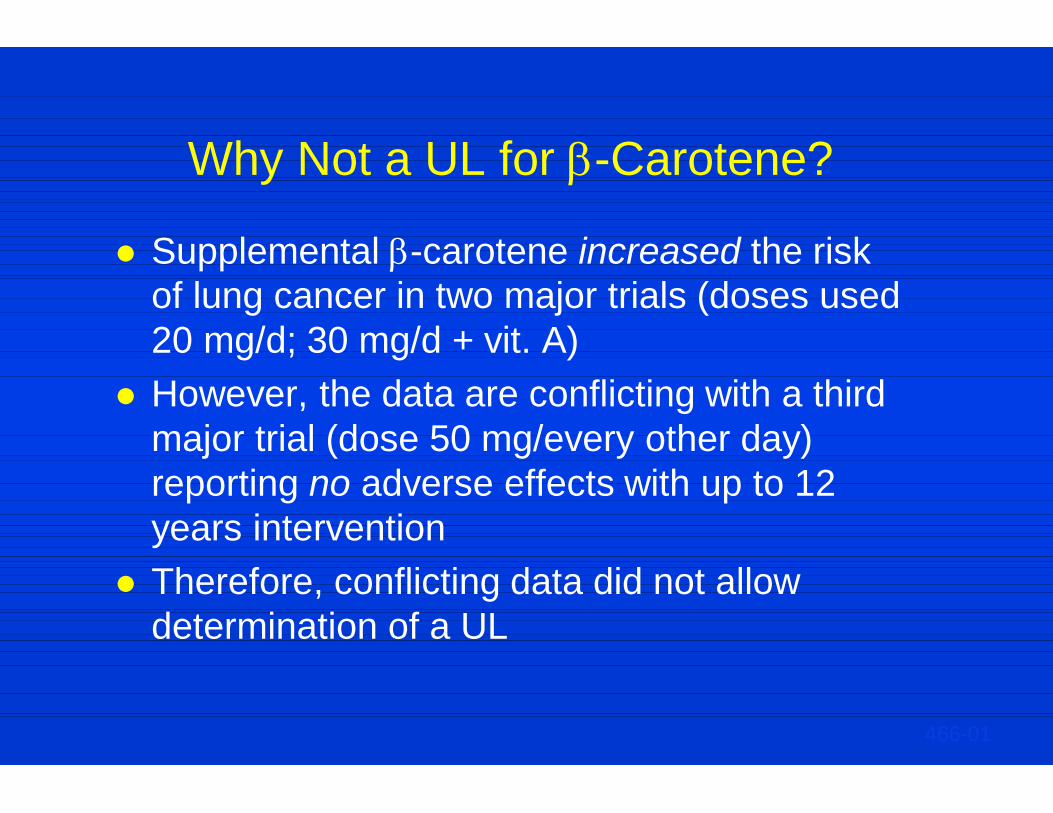
Why Not a UL for -Carotene?
Supplemental -carotene increased the risk of lung cancer in two major trials (doses used 20 mg/d; 30 mg/d + vit. A)
However, the data are conflicting with a third major trial (dose 50 mg/every other day) reporting no adverse effects with up to 12 years intervention
Therefore, conflicting data did not allow determination of a UL
466-01
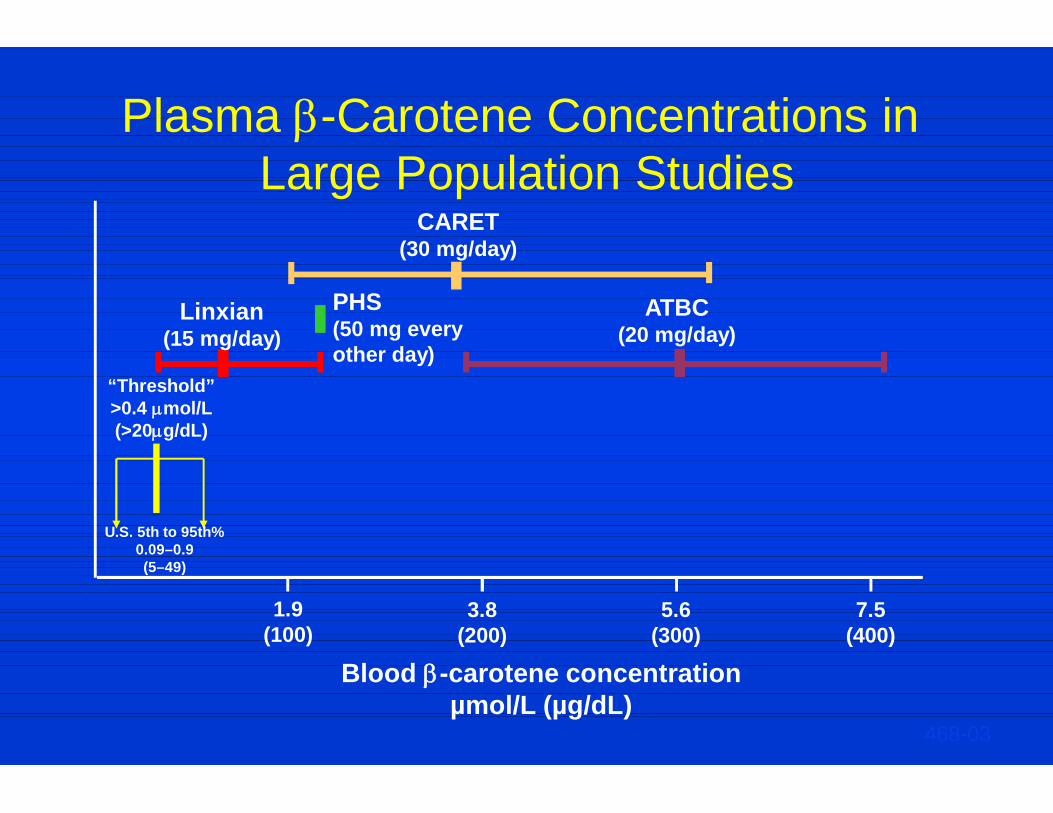
Plasma -Carotene Concentrations in
Large Population Studies
U.S. 5th to 95th% 0.09–0.9 (5–49)
“Threshold” >0.4 mol/L (>20g/dL)
1.9 (100)
5.6 (300)
3.8 (200)
7.5 (400)
Linxian (15 mg/day)
PHS (50 mg every other day)
CARET (30 mg/day)
ATBC (20 mg/day)
Blood -carotene concentration µmol/L (µg/dL)
468-03
Supplemental -Carotene and Lung Cancer Risk
Report conclusion: “Based on evidence that -carotene supplements have not been shown to confer any benefit…and may cause harm in certain subgroups (possible lung cancer risk in smokers), it is concluded that -carotene supplements are not advisable, other than as a provitamin A source and for the prevention and control of vitamin A deficiency in at-risk populations.”
467-02
Example: Establishing a UL For Vitamin A
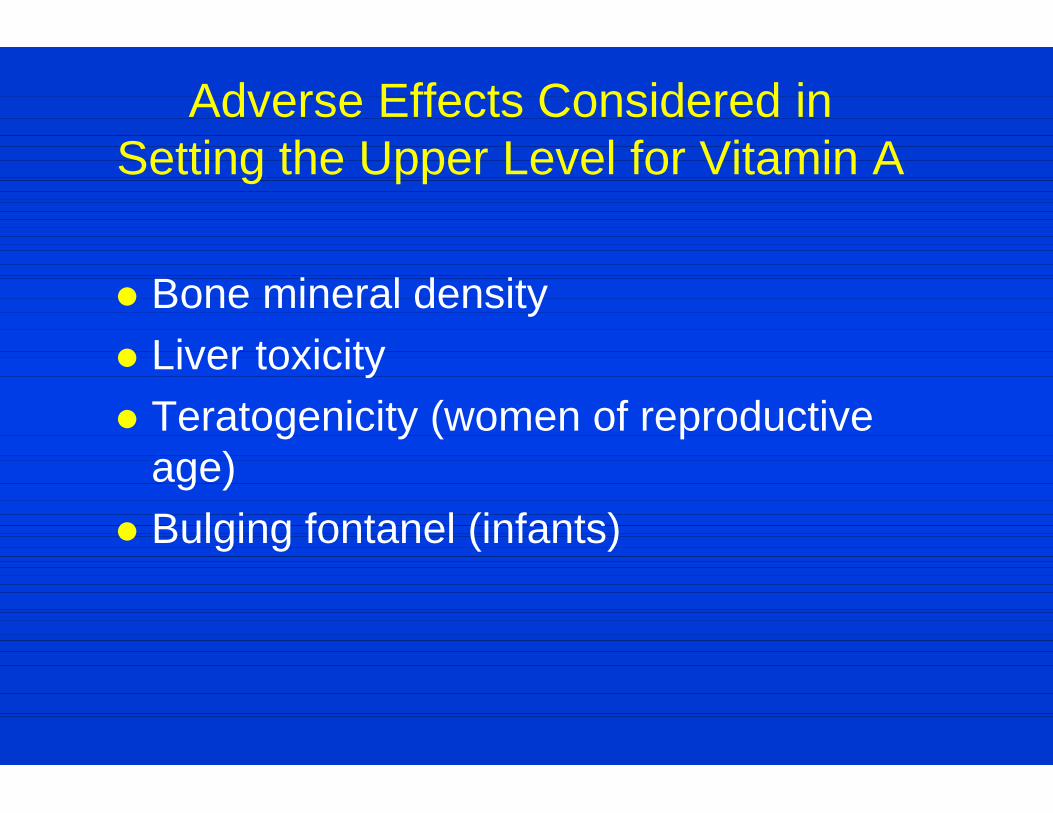
Adverse Effects Considered in Setting the Upper Level for Vitamin A
Bone mineral density Liver toxicity Teratogenicity (women of reproductive
age) Bulging fontanel (infants)
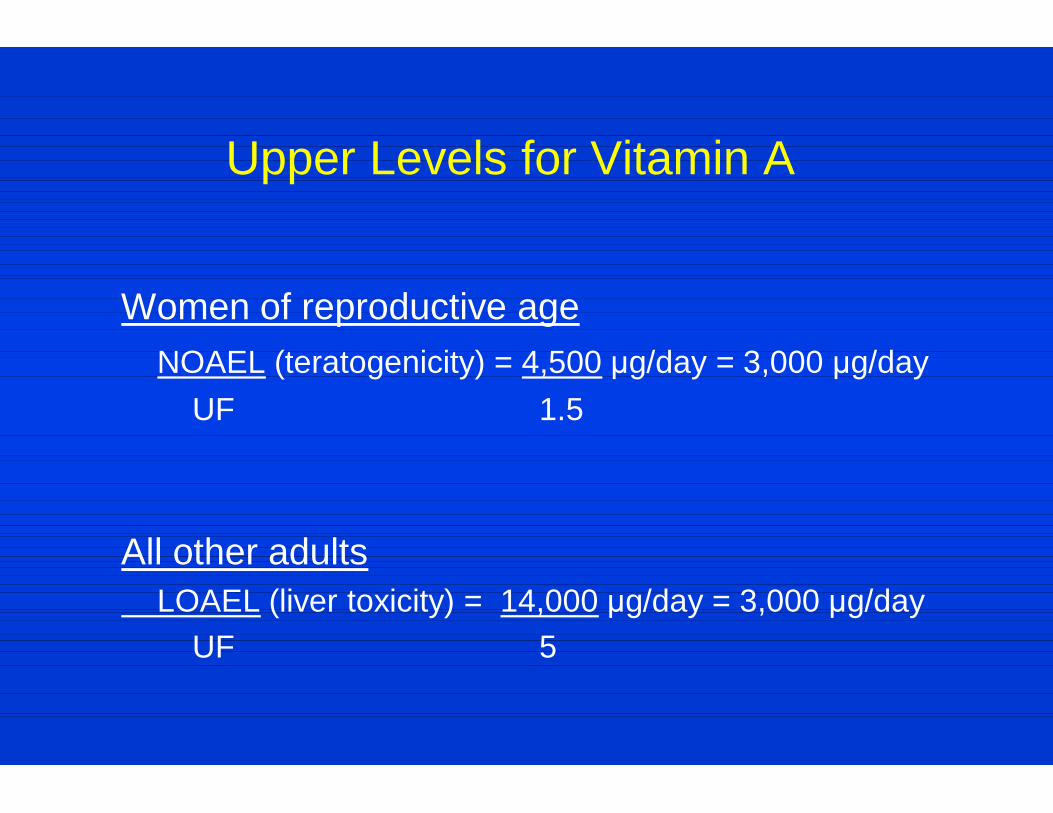
Upper Levels for Vitamin A
Women of reproductive age NOAEL (teratogenicity) = 4,500 μg/day = 3,000 μg/day UF 1.5 All other adults LOAEL (liver toxicity) = 14,000 μg/day = 3,000 μg/day UF 5
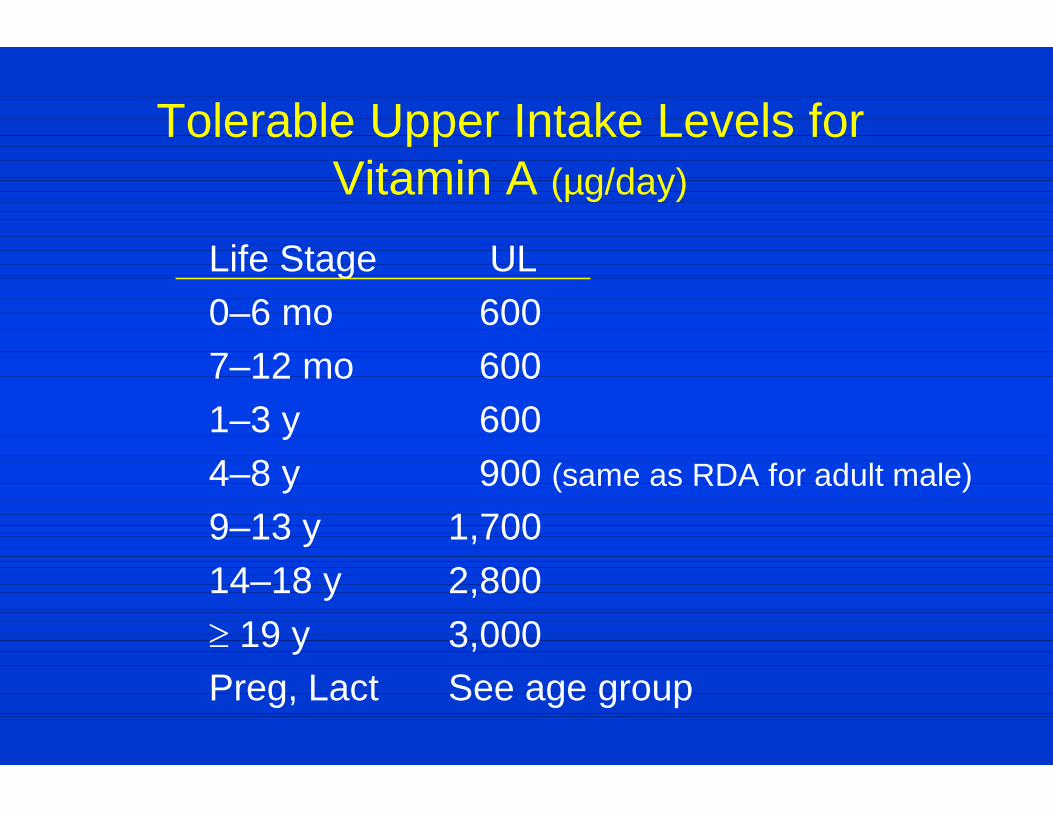
Tolerable Upper Intake Levels for Vitamin A (µg/day)
Life Stage UL 0–6 mo 600 7–12 mo 600 1–3 y 600 4–8 y 900 (same as RDA for adult male)
9–13 y 1,700 14–18 y 2,800 19 y 3,000 Preg, Lact See age group

Example: Establishing a UL For Iron
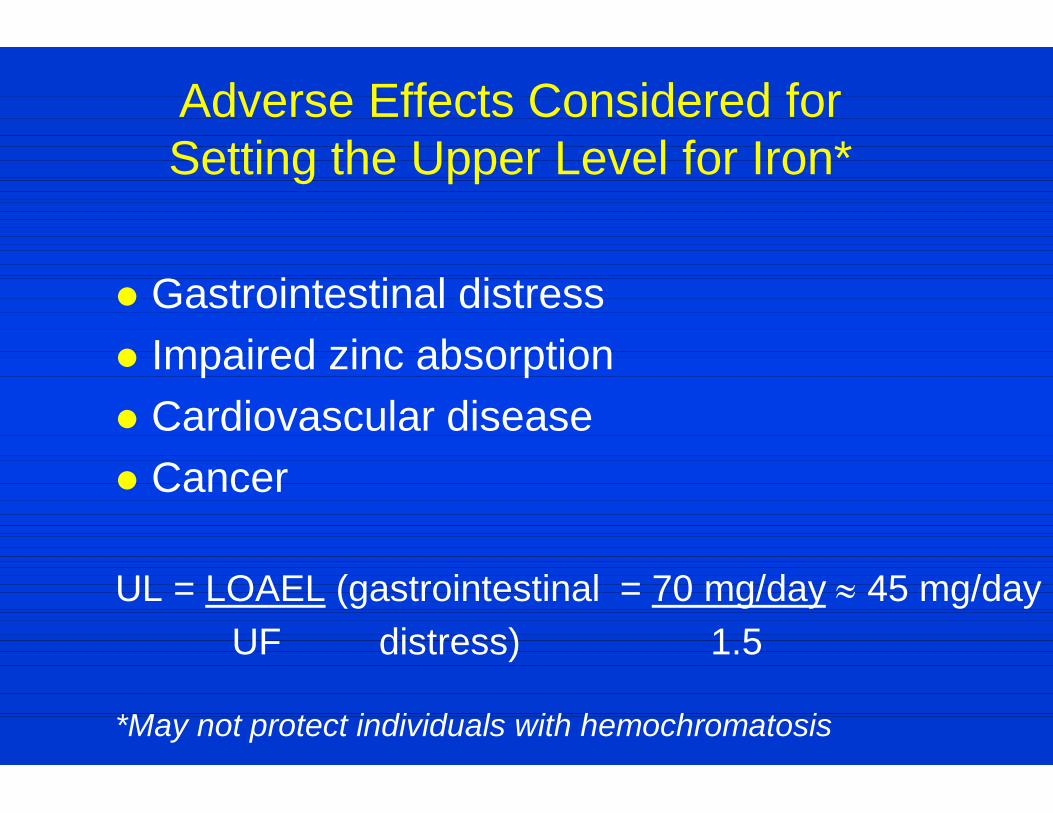
Adverse Effects Considered for Setting the Upper Level for Iron*
Gastrointestinal distress Impaired zinc absorption Cardiovascular disease Cancer
UL = LOAEL (gastrointestinal = 70 mg/day 45 mg/day UF distress) 1.5
*May not protect individuals with hemochromatosis
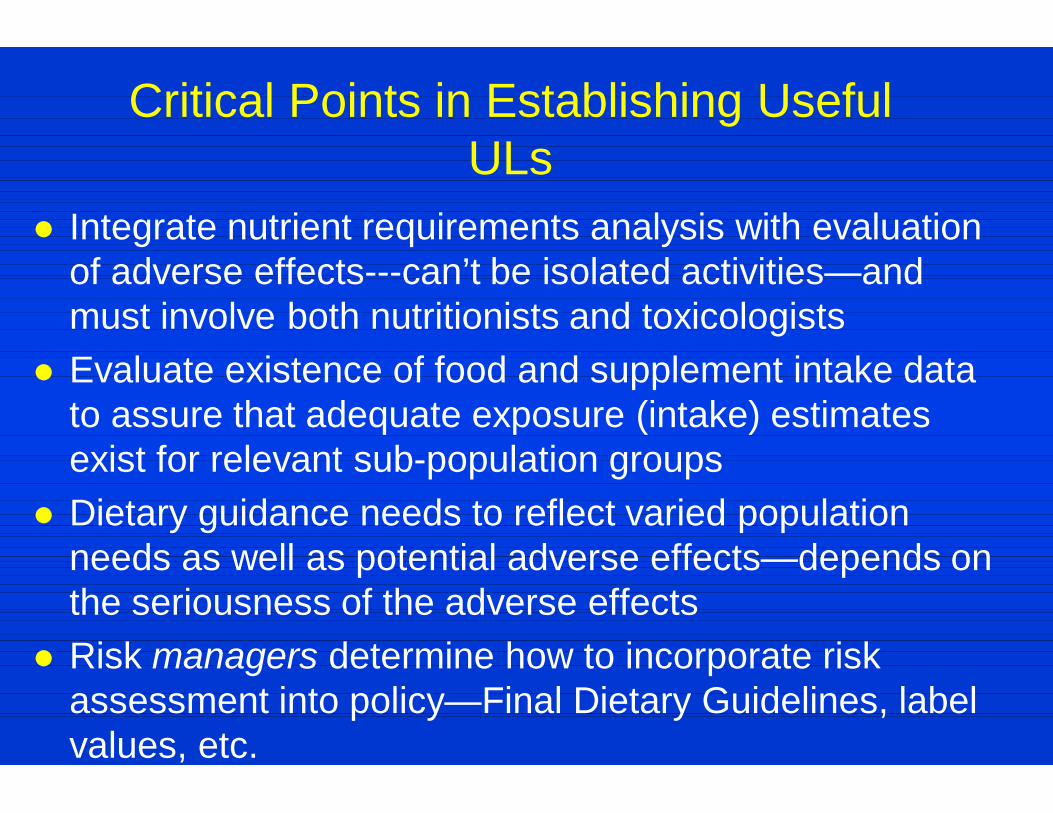
Critical Points in Establishing Useful ULs
Integrate nutrient requirements analysis with evaluation of adverse effects---can’t be isolated activities—and must involve both nutritionists and toxicologists
Evaluate existence of food and supplement intake data to assure that adequate exposure (intake) estimates exist for relevant sub-population groups
Dietary guidance needs to reflect varied population needs as well as potential adverse effects—depends on the seriousness of the adverse effects
Risk managers determine how to incorporate risk assessment into policy—Final Dietary Guidelines, label values, etc.
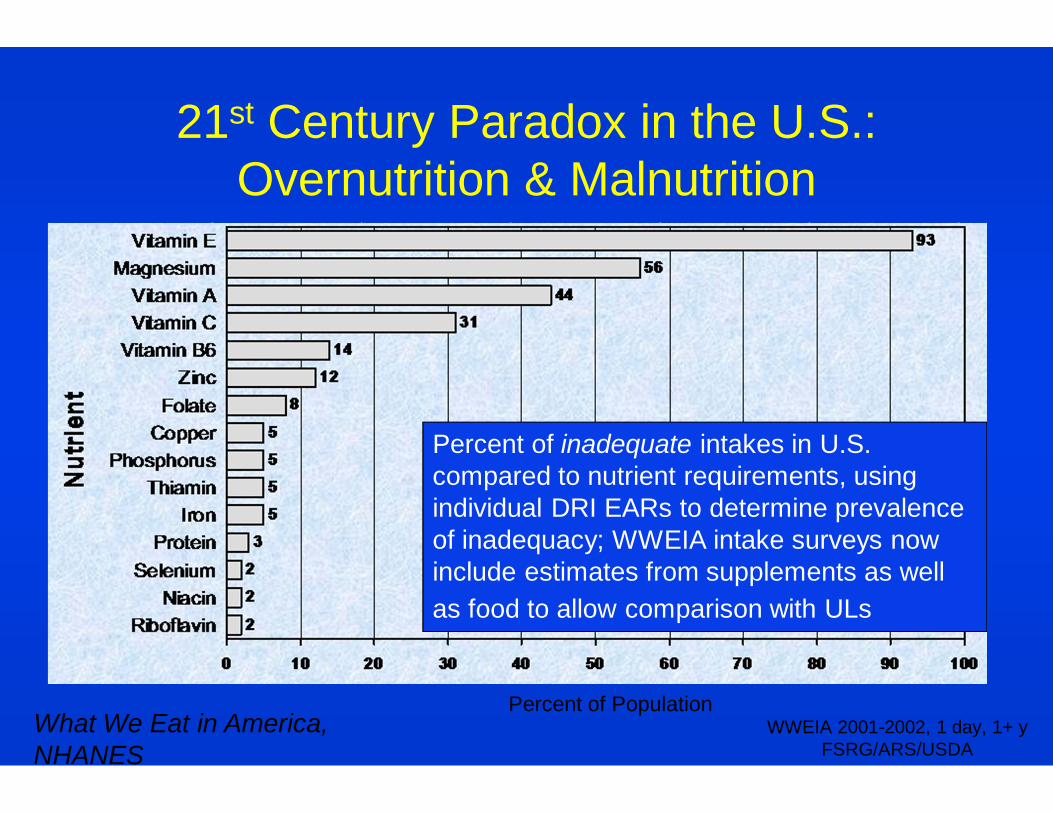
93 56
44 31
14 12
8 5 5 5 5
3 2 2 2
0 20 40 60 80 100
Vitamin EMagnesium
Vitamin AVitamin C
Vitamin B6Zinc
FolateCopper
PhosphorusThiamin
IronProtein
SeleniumNiacin
Riboflavin
Nut
rient
Percent of inadequate intakes in U.S. compared to nutrient requirements, using individual DRI EARs to determine prevalence of inadequacy; WWEIA intake surveys now include estimates from supplements as well as food to allow comparison with ULs
21st Century Paradox in the U.S.: Overnutrition & Malnutrition
What We Eat in America, NHANES
Percent of Population WWEIA 2001-2002, 1 day, 1+ y
FSRG/ARS/USDA
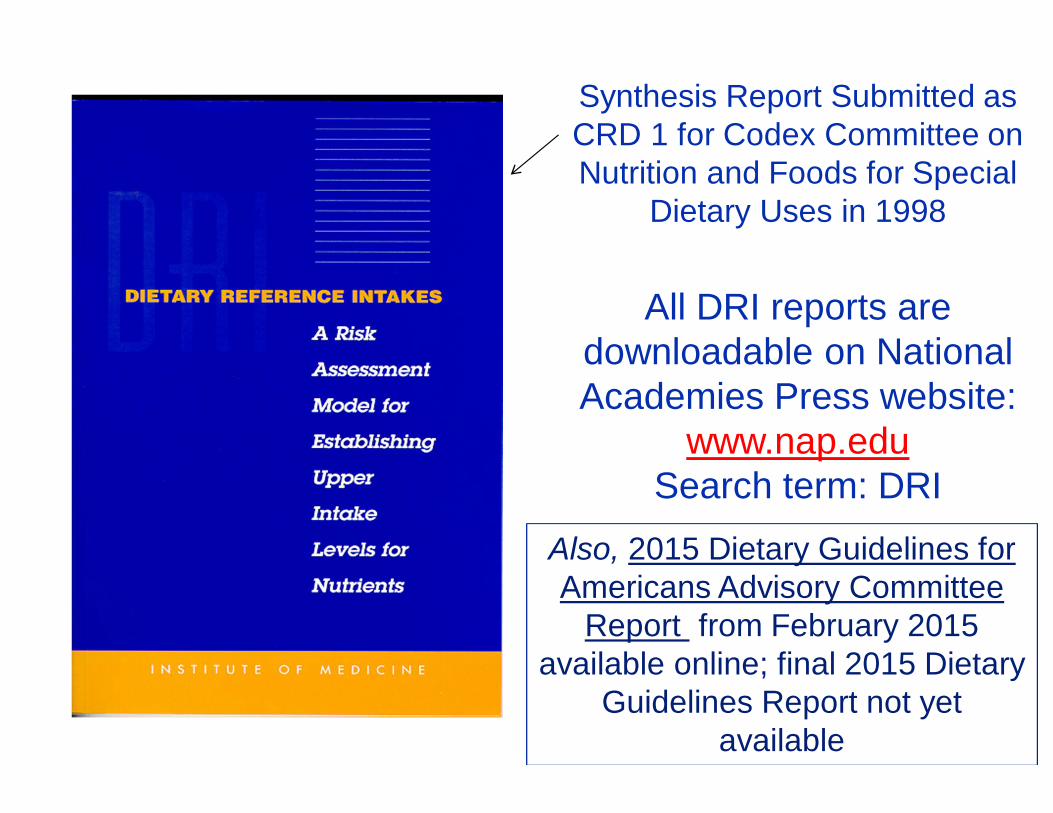
Synthesis Report Submitted as CRD 1 for Codex Committee on Nutrition and Foods for Special
Dietary Uses in 1998
All DRI reports are downloadable on National Academies Press website:
www.nap.edu Search term: DRI
Also, 2015 Dietary Guidelines for Americans Advisory Committee
Report from February 2015 available online; final 2015 Dietary
Guidelines Report not yet available