DRG 121: Circulatory Disorders with Acute Myocardial Infarction and ...
32
DRG 121: CIRCULATORY DISORDERS WITH ACUTE MYOCARDIAL INFARCTION AND CARDIOVASCULAR COMPLICA TIONS 1t-lIr"Ia OFFICE OF INSPECTOR GENERAL OFFICE OF ANALYSIS AND INSPECTIONS AUGUST 1989
Transcript of DRG 121: Circulatory Disorders with Acute Myocardial Infarction and ...

DRG 121: CIRCULATORY DISORDERSWITH ACUTE MYOCARDIAL
INFARCTION AND CARDIOVASCULARCOMPLICA TIONS
1t-lIr"Ia
OFFICE OF INSPECTOR GENERAL OFFICE OF ANALYSIS AND INSPECTIONS
AUGUST 1989

DRG 121 CIRCULATORYDISORDERS WITH ACUTE
MYOCARDIAL INFARCTION ANDCARDIOVASCULAR COMPLICATIONS
RICHARD P. KUSSEROW INSPECTOR GENERAL
OAI-12-801210 AUGUST 1989

Contractor BOTEC Analysis Corporation 36 JF Strt Cmnbridge, 02138
Contract
fUS-100-88-0019
Contract Information
Project Officer
David Hsia, J.D., M.D., M. Health Car Brach Offce of Inspector General 330 Independence Ave., SW Washington, D.C. 20201

EXECUTIVE SUMMARY
BACKGROUND
Under the prospective payment system, the diagnosis related group (DRG) 121 represents hear attcks with complications. Prelinar data from the National DRG Validation Study suggeste that discharges incorrctly biled as DRG 121 comprise a disproportonate share of the Medcar overpayments attbutable to disease codng errrs.
FINDINGS
Of discharges biled as DRG 121, 17.7 percent should have grouped to a dierent DRG. Ths errr rate approximates that for al DRGs, as measured in the National DRG Valdation Study.
Of these elTors, 89.3 percent overpaid the hospita. This rate significantly exceed the 59. 6 percent for all DRGs.
Reasons for elTors include physicians mis-specification of a naIative diagnosis, other," and resequencing in that order. Miscodng caused no DRG
mis-assignents.
RECOMMENDATIONS
The Health Car Financing Admnistrtion (HCF A) should diect the peer review organzations (PROs) to review DRG 121 bils for codg accurcy.
The HCF A should diect the PROs to educate physicians and hospitas about the diagnoses that properly grup to DRG 121.
The HCFA disagrees with the fist recommendation and agres with the second. The Offce of Inspector Genera modfied the drt of this report to accommodte the HCFA comments, but continues to believe that implementation of these recommendations could recover $42.2 mi-lion annually.

. . . . . . . . . . . . . . . . . . . . . . . . . . . . . . . . . . . . . . . . . . . .. . . . . . . . . . . . . . . . . . . . . . . . . . . . . . . . . . . . . . . . . . . . . . . . . .. . . . . . . . . . . . . . . . . . . . . . . . . . . . . . . . . . . . . . . . . . . . . . . . . .. . . . . . . . . . . . . . . . . . . . . . . . . . . . . . . . . . . . . . . . . . . . . . . . . .. . . . . . . . . . . . . . . . . . . . . . . . . . . . . . . . . . . . . . . . . . . . .. . . . . . . . . . . . . . . . . . . . . . . . . .. . . . . . . . . . . . . . . . . . . . . . . . . . . . . . . . . . . . . . . . . . . . . . . . .. . . . . . . . . . . . . . . . . . . . . . . . . . . . . . . . . . . . . . . . . . . . . . . . . . . . . . .. . . . . . . . . . . . . . . . . . . . . . . . . . . . . . . . . . . . . . . . . . . . . . .. . . . . . . . . . . . . . . . . . . . . . . . . . . . . . . . . . . . . . . . . . . . .. . . . . . . . . . . . . . . . . . . . . . . . . . . . . . . . . . . . . . . . . . . . . . . . .. . . . . . . . . . . . . . . . . . . .. . . . . . . . . . . . . . . . . . . . . . . . . .. . . . . . . . . . . . . . .. . . . . . . . . . . . . . . . . . . . . . . . . . . . . . . . . . . . . . . . . : . . . . . . . . . .. . . . . . . . . . ............................................... . . . . . . . . . . . . . . . . . . . . . . . . . . . . . . . . . . . . . . . . . . . . . . . . . .. .. . . ........
TABLE OF CONTENTS
EXECUTIVE SUMMARY.
INTRODUCTION Background. . . . . . PPS vuerabilties
Clai processing. . . . . . DRG 121 . . . . . . . . . . . . . . . . . . . . . . . . . . . . . . . .
Methodology. . . . . .
FINDINGS Smnple charteristics.
DRG assignent errrs. . Dirtion of errrs. . Soure of elTors . . . . . . . . . . . . . . . . . . . . . . . . . . . . . . . . . Reasons for assignment errrs
Financial effects Corrct DRG assignments. . . . . . . . . . . . . . . . . . . . . . . . . . . . . . . . . .
. RECOMMENDATIONS
Appendix A-I: DRG 121 discharges frm al PPS hospitas . . . . . . . . . . . . . . . . . . . . . . . A-
Appendix A-2: DRG 121 smnpling frame . . A-
Appendix A-3: DRG 121 hospita demogrphy . . . . . . . . . . . . . . . . . . . . . . . . . . . . . . . . . A-
Appendix A-4: DRG 121 hospita demogrphy comparson . . . . . . . . . . . . . . . . . . . . . . . A-
Appendix S: DRG 121 patient demography. . . . . . . . . . . . . . . . . . . . . . . . . . . . . . . . . . A-
Appendix A-6: DRG 121 patient demography comparson . . . . . . . . . . . . . . . . . . . . . . . . A-
Appendix B-1: DRG 121 assignment errrs. . . . . . . . . . . . . . . . . . . . . . . . . . . . . . . . . . . . B-
Appendix B-2: DRG 121 assignment elTors comparson. . . . . . B-
Appendix B-3: DRG 121 assignment errrs by patient demography. . . . . . . . . . . . . . . . . B-
Appendix C-I: DRG 121 diection of elTor . . . . . . . . . . . . . . . . . . . . . . . . . . . . C-
Appendix C-2: DRG 121 of diection of elTor comparson . . . . . . . . . . . . . . . . . . . . . . . . C

...................... ....... .. . ........ ..... . . . . . . . . . . . . . . . . . . . . . . . . . . . . . . . . . . .
Appendix C-3: DRG 121 diection of elTor by patient demogrphy . . . . . . . . . . . . . . . . . C-
Appendix D-l: DRG 121 hospita deparent makg elTor ....................... D-
Appendix D-2: DRG 121 hospita deparent makg elTor comparson . . . . . . . . . . . . . D-
Appendix D-3: DRG 121 hospita deparent makg elTor by patient demogrphy . . . . D-
Appendix E-l: DRG 121 reasons for elTors . . . . . . . . . . . . . . E-
Appendix E-2: DRG 121 reasons for elTors by hospita demography . . . . . . . . . . . . . . . . E-
Appendix E-3: DRG 121 reasons for elTors comparson . . . . . . . . . . . . . . . . . . ; . . . . . . . E-
Appendix E-4: DRG 121 reasons for DRG assignment elTors by patient demography. . . E-
Appendix F-l: DRG 121 corrted relative weights . . .. . F-
AppendixF-2: DRG 121 corrcted reimbursement .............................. F-
AppendixF-3: DRG 121 estiate overpayments ............................... F-
Appendix G-l: Major Diagnostic Categories for discharges incolTectly assigned to DRG 121 ......................................... G-
Appendix G-2: DRGs fruently miscoded to DRG 121 ............... . . . . . . . . . . . G-
Appendix H-l: DRG 121 clical incidents . H-
Appendix H-2: DRG 121 clinical incidents comparson . . . . . . . . . . . . . . . . . . . . . . . . . . H

INTRODUCTION
Background
On October 1, 1983, the Health Car Financing Admistrtion (HCFA) began implementing a new system of payment for inpatient hospita servces under the Medicar program The new
prospective payment system (PPS) replaced the cost-based reimbursement system. Congrss mandated ths change because of rapid growth in health care costs, parcularly inpatient expenses under Medicare.
Under PPS, hospitas reeived a pre-established payment for each discharge, based upon the diagnosis related group (DRG) to which the discharge is assigned. The PPS classified discharges into clicaly coherent grups which used simiar mnounts of hospital resources, based on varables such as diagnosis; evaluation and tratment procedurs; and patient age, sex, and discharge status. Each of the 475 DRGs had an associate relative weight, which represented the average cost for hospita care provided to patients with diagnoses grouping to that DRG as a proporton of the cost of the average patient The hospita received this payment, independent of the actual lengt of hospitazation or cost of treatment for the individual patient. With cert exceptions, the hospita retaned any surlus from patients consumig less than the expected mnount of resources, and suffered losses on those patients consuming more.
The shit from cost-based, retrospective reimburement to prospective payment constituted one of the most drmntic changes in health car reimburement since the creation of Medicare. A fied paymnt per dischare induced hospitas to implement economies and reduce unnecessar servces. The tota payments to the hospitas provided the smne financial resources for patient car. In effect, PPS revers the financial incentives for hospitas. Where the cost-reimbursement system rewar longer hospita stays and more costly tratments, PPS rewared earlier discharges and less costly proedures. One of the first consequences of the new payment system was a drop in average length of hospita stay for Medicar patients.
PPS vulnerabilties
The advent ofPPS crated new opportnities for manipulation or "gamng" to increase hospita revenues frm Medcar patients. To protect the integrty of PPS and maitain quality of care Congress established the peer review organizations (PROs) to monitor hospita activities.
The Offce of the Inspector Genera (OIG) conducted The National DRG Valdation Study (NDRGVS) to surey the genera accurcy of DRG assignment and qualty of car performed by hospitas under PPS. Its examnation of 700 medical records and established that assignment errrs resulted in $300 milion in overpayments to hospitals and that the majority of overpayments could be trced to assignment errrs afectig a small number ofDRGs. This report is one in a series examning assignment accuracy of one of the DRGs identified as having the highest impact on overpayments under PPS and the gratest potential for cost recovery.

The PPS gamg taes two pricipal forms: optimization and creep. "Optization strategies adere to codng rules, but maximize hospita reimburements by selecting the ost expensive mnong viable alternative principal diagnoses or adding more seconda diagnoses. The PPS permts optimiation, which flows frm the basic incentive strctue of the PPS sys
tem.
DRG crp" results frm codg practices which do not conform to codng rules. Sources of DRG crp include:
Mis-specifcation: The attndig physician wrtes an incolTect pricipal diagnosis (defied by the Uniorm Hospita Discharge Data Set (UDS) as "that condition established after study to be chiefly responsible for occasioning the admssion of the patient to the hospita for care ), seconda diagnoses, or proedures on the attestation sheet
Miscoding: The hospita assigns incorrct numeric codes to diseases or proedures corrtly attste to by the attndig physician.
Resequencing: The hospita substitutes a seconda diagnosis for the corrct principal diagnosis.
Auditig and review practices seek to curl ilegal crep by identiying discharges in ,?hichcodg rules ar misapplied or ignored.
Claims processing
Under PPS, the hospita fies a clai for Medcar reimbursement upon dischargig the beneficiar. At the time of discharge, the attndig physician attests to the principal diagnosis which caused the patient s adssion to the hospita, seconda diagnoses, and procedurs (diagnostic and therapeutic) provided. The hospita translates the naIative diagnoses of the physician s attestation statement into numeric codes based on the International Classification of Diseases, Ninth Revision, Clinical Modcation (ICD- CM), and prepars a claim. Fiscalintermedar (F organizations, working under contract with HCFA, enter the hospital' s codes into the GROUPER computer progr which assigns the appropriate DRG for reimbursement
Hospita reimbursement is calculated by multiplying the "relative weight" of each DRG category by a stadaze amount, as moded by certn hospital-specific factors. The relative weight of each DRG vares above or below the mean relative weight for all DRGs (approxiately 1.00) accordng to the average amount of hospital resoures used by patients in that diagnostic group. The higher the relative weight, the greater the reimbursement. Mis-as-signment of the ICD- CM categories, or errneous assignment or sequencing of patient diagnoses, can thus have signifcant financial implications.

--- ------ ------ - - : - _-._..---:: ::::::::::::::: ::: :::::::::: :::: :::::::::::::.....--- -- ..::::: _------- - --- --------- - -- .=-.= =======-. ". .. . ::_.._.._.._"".._.._. -:....._.. - - ~~~~~-- --- ------------ -- ------------------- --- -- - -- - ----- - --------- ----- - ------- ----- ------ ---- - --- - ----- -- - -- - ---- -- ------- -- - - - - -- - -- --- ---------- --- ---------......-.., .. :;-....
DRG 121
Ths inspection exames errneous assignment in DRG 121 , Circulatory Disorders with Myocardial Inartion and Cardiovascular Complications. In order to grup to DRG 121 , a bil must have codes for both (1) a myocaral infartion and (2) a carovascular complication. Either diagnosis may appear as the principal diagnosis or as a seconda diagnosis. The order in which they appear doesn t matter.
Relatie Weight
12 -- ----------- ------ ----------------- ------ ---- Discharges (10 K)
Chares ($100 M).....0.....
Payment ($100 M)
Mea payment ($1 K)6 -- ----- -.e:--..-6-..-..-..-..-..-..-..-.... 4 --
2 -- -
198 198 198 1987 Fisc Yesr
Figure 1: DRG 121
The number ofDRG 121 bils and their dollar reimburement has risen steadly thughout the history of the prospective payment system. Decreases in the relative weight from 1.8648 to 1.7687 have not offset these incrases. The DRG 121 bils constitute 1.2 percent of discharges, but 1.8 percent of reimbursement (Appendix A-
Methodology
Ths study used a strtied two-stage sampling design based on hospitas to select medical record for review. The fist stage used simple random smnpling without replacement to select up to 80 hospitas in each of thee bed size strata: Less than 100 beds (small), 100 to 299 bed (medum), and 300 or more beds (large). The second tage of the design employed systematic random sampling to select up to 25 DRG 121 bils from each strta for Medicar discharges between October 1, 1984 and Marh 31, 1985. (Appendix A

!::::::::::::::
100 beds
10029 beds
30+ beds
DRG 121 All DRGs
Figure 2: Sampling frame
The OIG contrcted with the Health Data Institute (HI) of Lexington, Massachusetts to reabstrct the medcal record. Upon receipt, the contrctor "blinded" the ICD- CM codes by coverig them, and assigned an identification number to each record. An Accredited Record Technician or Registere Record Admnistrator proficient in ICD- CM codng reviewed the enti record to substatiate the principal diagnosis, other diagnoses, and procedurs indicated by the attendig physician in the naItive attestation form. Any records which did not support the assigned DRG classification were refeITd to physician reviewers. The physician reviewer designated the corrct UHDS principal diagnosis, and addtional diagnoses and/or proedures which' were substantiated by the patient record. The GROUPER computer progr proessed the reabstracted ICD- CM codes to determe COlTect DRGs.
fu discussion of the methodology and findings of the contrctor record review ' is available the fial report of the National DRG Valdation Study (available from OIG Public Mfai).
The OIG contrcted with BOTEC Analysis of Cabridge, MA to exame this data to identify sources of assignent elTors and formulate recommendations for recovery of overpayments.

~~~~ -:;: ~~~~~ ==' :=:---..: --- ::-::-' '---' ""' ",:=,, ;:':'- ':' .. :;.-:
FINDINGS
Sample characteristics
In Fiscal Year (F) 1985, 96,443 of the 8.3 millon prospective payment discharges (1.2 percent) gruped to DRG 121. The National DRG Validation Study estimates that larger hospitas submitted more DRG 121 bils, but that smaller hospitas had a higher proporton of their bils group to DRG 121. In the fist half ofFY 1985, the 239 hospitals selected in stage-one of the sample design (the smnpling frame) biled for 222,396 discharges of which 2,591 came frm DRG 121 (1.2 percent). The stratication into bed-size classes ilustrtes the higher volume of larger hospitas and the higher smnpling frction of smaler hospitals.
The two-stage sample design pennts calculation of separte results for Medicare beneficiares (the probabilty of something happening to a person) and hospitals (the odds of an event at a parcular hospita). Therefore the appendices, tables, and chars report individual totals by both discharges and hospitas.
Of the discharges assigned to D RG 121, 21.1 percent came from small hospitas (c: 1 00 beds), 36.2 percent from mid-sized hospitas (100-299 beds), and 42.7 percent from large hospitas (300+ beds). Ths distrbution paralels the proportons for all Medicar discharges with slightly more discharges from smal hospitas and slightly fewer from large hospitas. For this inspectioR, DRG 121 discharges were chosen radomly from equal number of hospitas from each strtu, thereby intentionaly oversmnpling small hosp tas and pr04ucing sampling frctions of 13.3 percent frm sma hospitas, 3.3 percent from mid-sized hospitas, and 1.5 from 1 n Tge hospitas.
Yea
DRG 121: Urban
All DRGs: Urb
DRG 121: Teaching
All DRGs: Teaching
DRG 121: Profi
All DRGs: Profi - R
100Per Figure 3: Hospital demography
The majority of DRG 121 discharges, weighted by discharge, came from urban, nonteaching, and nonprofit hospitas. (Appendi A-3) These findings did not significantly differ from those in the National DRG Validation Study. (Appendix A-4)

-- - - - - - - - - - - - -- - - - - - -- - - - - - - - - - - - - -- - - - - - - - - - - --- - - - - - - - - - - - - - - - - - - - - - - - - - - - - - - - - -
DRG 121 National DRG All Medicare Validation Study
Age (year) 74. 73. not available
Sex (%male) 54. 46. 42.
LOS (days) 10.4
Payment ($) 4894 3115 2985 urban 2381
Mortty 6.4 not avaiable
Table I: Patient characteristics
The DRG 121 discharges (discharge-weighted) averaged almost the days longer length of stay in the hospita than either discharges in the National DRG Validation Study or Medcar discharges. (Appendi A-5) The fonner discharges were more also more likely to be mae (Mantel-Haenszel chi-squar 2.52, df 1, P 25). DRG 121 discharges also
averaged over $1 700 more in payment than discharges in the National DRG Validation Study and over $2,00 more than discharges for the Medicar population as a whole. (Appendix A-
Percent
DRG121
All DRGs
-=100 ()29 30+ Bed size
Figure 4: Coding mis-assignments
DRG assignment errors
Overal, 17.7 percent of discharges paid as DRG 121 changed to a different DRG after reabstrction. This rate did not significantly differ than the average for all DRGs in the National DRG Validation Study (Mantel-Haenszel chi-square 0. 13, df 1, P 75). Small hospi
tals had a 30. 8 percent errr rate, 53. 3 percent of the sample s elTors. Mid-sized and large hospitas had elTor rates of 16.0 and 18.0 percent respectively. These findigs parlel the proportons of the National DRG Valdation Study in which smal hospitals also contrbuted the largest shar of assignment elTors. (Appendi B

------------ ------------------ -------- :::::::::.--------. . .. ----------------------------------------------------------------- .... ----------------------------------------------------------------- .... ----------------------------------------------------------
.25
Analyzed by hospita demogrphy, the proporton of errrs was largest mnong urban, nonteachig, and nonprofit hospitas. Analysis of hospita demogrphy in the National DRG Valdation Study indicate that acss all DRGs, hospital charcteristics were not associated with significant differences in assignment accuracy when controllng for bed size. (Appendix
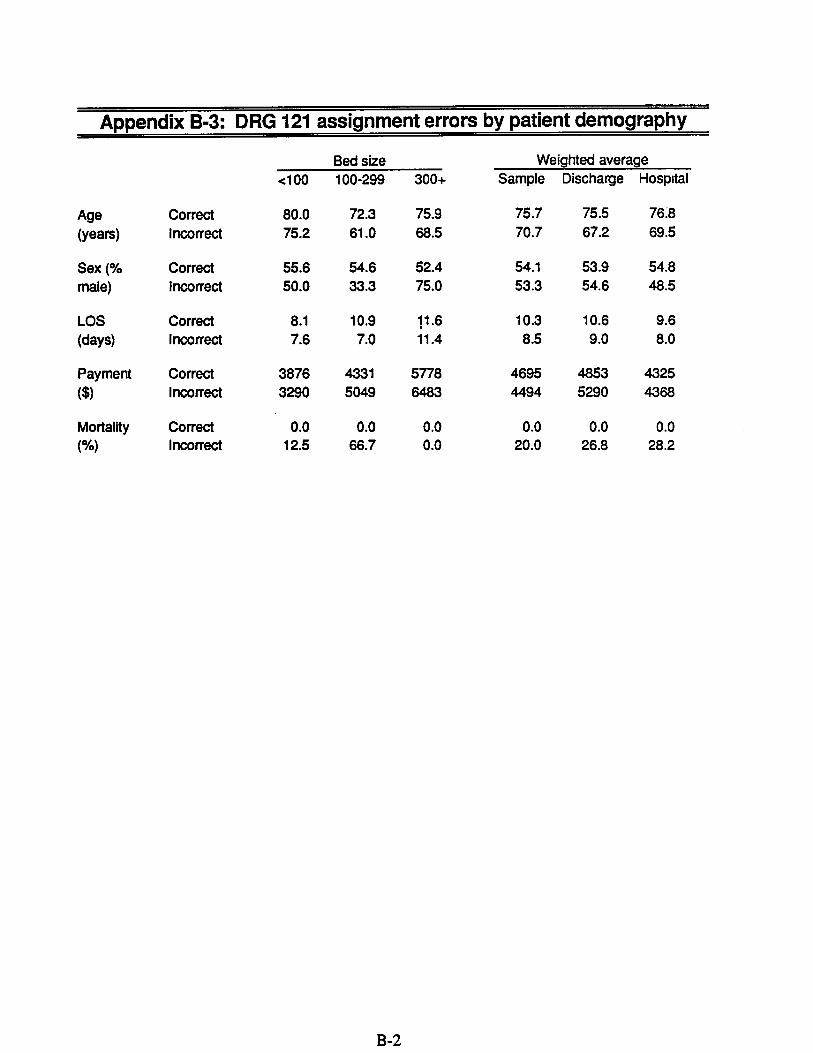
Patients incolTectly assigned to DRG 121 were younger (75.5 years to 67.2 year), and ex
perienced shortr lengths of stay in the hospita (10.6 days to 9.0 days) than those corrctly assigned In adtion, incolTectly assigned discharges paid, on averagt?, over $400 more than those COlTectly assigned All patients in the sample discharged as expird had been incolTectly assigned (Appendi B-
Percnt
c: DRG 121 underpayment
DRG 121 overpayment
All DRGs overpay
All DRGs underpay
100 10029 30+ Bed size
Figure 5: Direction of errors
Direction of errors
Weighted by discharge, 89.3 percent of errrs in the DRG 121 sample resulted in overpayments to hospitas. (Appendi C- l) This rate signifcantly exceeded the 59.6 percent of overpayments reported in the National DRG Validation Study (Mantel-Haenszel chi-squar 5.21, df 1 , P .c 0.025). (Appendi C-2) Weighted by discharge, however, the rate of overpayment exceeded that of the National DRG Validation Study only in ur an and nonprofit hospitas. When combined with the rate of elTor for DRG 121 (17.7 percent), the effective rate of overpayment for DRG 121 was 15.8 percent, compard to an effective overpayment rate of 11. percent for the National DRG Valdation Study.
Source of errors
In this smnple, 9 of the 15 assignment elTors occUled when the medical records deparent incorrctly accepted and coded discharges as DRG 121 and biled accordigly. (Appendix D-Six errrs, resulted when the medical records deparent corrctly selected codes that did not group to DRG 121 , but the hospita biled the discharge as DRG 121 anyway. This 51.8 per

cent of errrs (discharge weighted) due to biling errrs greatly exceeds the 8. 8 percent for the National DRG Validation Study. (Appendix D-
Discharges biled incorrctly had a lower average age (71.4 year to 64.7 years) and lengths of stay alost twce that of dischares with codng elTors (11.0 days to 6.5 days). Discharges
with bilg elTors averaged nearly $1,00 more than discharges with codng errrs. Biling errors also included al of the cases reportd expird. (Appendi D-
Reasons for assignment errors
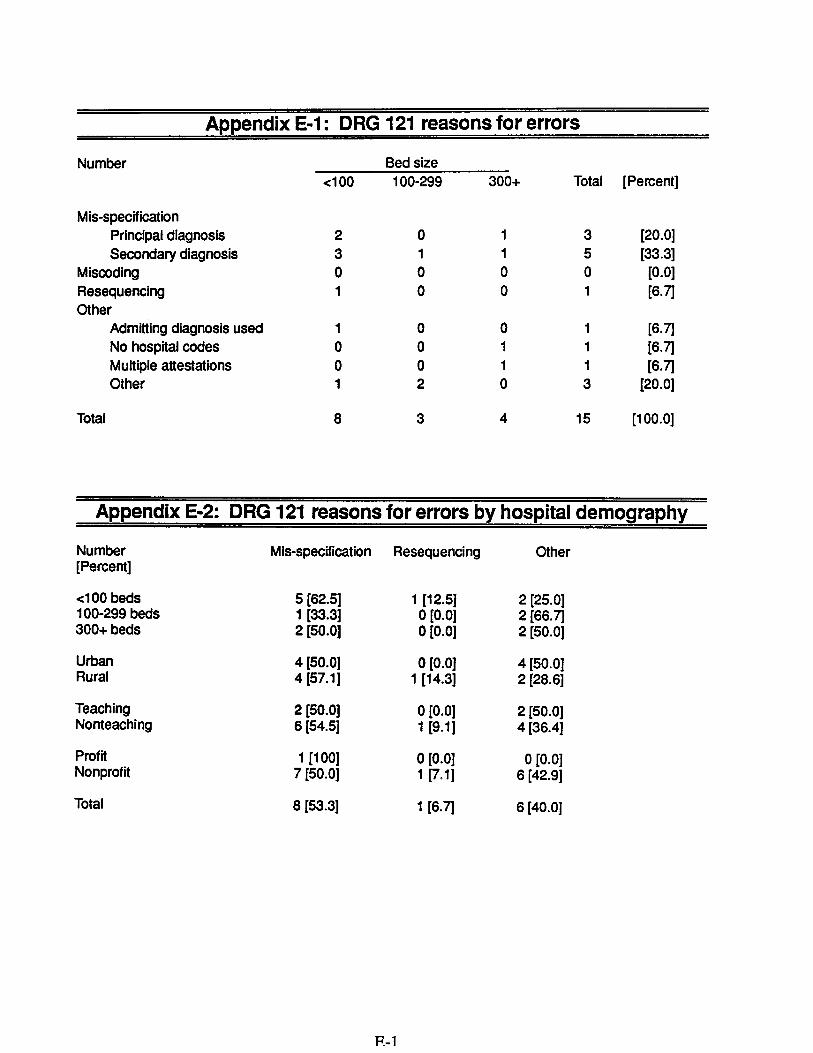
Of the 15 elTors in the DRG 121 smnple, al but one resulted from either mis-specification error by attndig physicians or "other" elTors. When examned using an exclusive analysis that selects identig the fist errr to occur chronologically, physicians mis-specifed a diagnosis in 53.3 percent of the mis-assignments. Aside from one resequencing errr, the rest of the errs in ths sample (40.0 percent) were categorized as "other" elTors. (Appendix E-
Misspeclfcation
Miscing
f::::::::::::::::::::::::::::
Resuenclng
Oter
DRG 121 All DRGs
Figure 6: Reasons for coding
The majority of mis-specifcation elTors by physicians occulTed in smal hospitas. (Appendix 2J Mis-specifcation elTors were also more likely in nonteaching and nonprofit hospitas.
The bulk of "other" elTors occUld in urban, nonteaching, and nonprofit hospitals. The discharge weighted 50. 8 percent distrbution of "other" errrs exceeded the 13. 8 percent for the National DRG Validation Study. (Appendix E-
Patients with "other" errrs were younger (66.3 year to 74. 3), had a longer average length of stay (9.5 days to 8. 1 days) and a higher average payment ($5486 to $3843) than discharges with mis-specifcation elTors. (Appendix E-4J

- - - - - - - - - - - - - - - - - -- - - - - - - - - - - - - - - - - - - - - - - -- - - - - - - - - - - - - - - - - - - - - - - - - - - --- - --- - - - - - - - - - - - - - -- - - - - - - - - - - - - - - - - - - - - - - - - - - - - - - -- - - - - - - - - - - - - - - - - - - - - - - - - - - - - - - - - - - - - - - - - - - - - - - - - - - - - - - - - - - - - - - - - - - - - - - - - - - - - - - - - - - - - - - - --- - - - - - - - - - - - - -- - - - - - - - - - - - - - - - -- - - - - - - --- - --- - - - - - - -- - - - - ----- - - -- - - - -- -- - - - -- - --- - -- -- - - ----- - ---- --- -- -- --------- - - - -- ---- ------- - - ------ - -- --- ----- - - - - -- -- - - - -- - - - - - -- - --- - - - -- - - - - - - -- - - - - - - - - - - - -- - -- - - - - - - - - - - - - - - - - - - - - - - - - - - - - - - - --- - -- - -- - - - - - - - - - - - - - - - - - - - - - - -- - - - - - - - - - - - - - - - - - - - - - - - - - - - - - - - - --- - -- - - - - - - - - - - - - - - -- - - -- - - - - - -- -- - - - - - - - - - - - - - - - - - - - - - - - - - - - -- - - - - - - - - - - - - - - - - - - - - - - - - - - - - - - - - - - - --- - - - - - - - - - - - - - - - - - - - - - - - - - - - - - - - - - - - - - - - - - - - - - - - - - - - - - - - - - - - - - - - - - - -
Financial effects
Mter reabstrtion, the average relative weight for DRG 121 discharges in this sample droppe frm 1.8454 to 1.7298. For the 76 discharges in this smnple, this mnounted to an ag
gregate drp in relative weight of 8.7833 (4.4 percent weighted by discharges). (Appendix F-
Smlllon
198 198 198 1987 198 198 1990 Fiscl Year
Figure 7: Overpayments
Based on the stadaze mnount for reimbursement in FY 1985 ($2985 urban and $2381ru), the average change in relative weight for discharges assigned to DRG 121 resulted in mean overpayments to hospitas of $601 (smal hospitas), $218 (mid-sized hospitals), and $83 (large hospitas) on each discharge. Two-thirds of these overpayments came frm small hospitas. (Appendix F-
Extrpolate to the enti Medcar population, if the rate of elTors and urbanrual discharges remas constat, mis-assignment ofDRG 121 results in $42.2 millon anually. Extrpolating by be siz, mid-sizd and large hospitals together would account for over the-quarers of the overpayments. (Appendi F-
Correct DRG assignments
All the discharges incolTectly assigned to DRG 121 cmne frm Major Diagnostic Category (MDC) 05, the ciculatory system. The DRG 121 also falls into this MDC. The DRG 121 is unique in that the attstation must contan both a principal diagnosis of acute myocardial infartion and a carovascular complication mnong its diagnoses, but not in a parcular order. Reabstraction confied myocaral infarction, but not a cardiovascular complication, in 33.3 percent of assignment errrs. (Appendix G-
These discharges recoded to DRG 122 (relative weight 1.3509). In 20.0 percent of errrs, the patient died, reassigning the bil to DRG 123 (relative weight 1.1242). In another 33. 3 percent

----------------- ---- --- -- -- --- -- - - - -- -- - -- - -- - -- - -- -- - - - - - -- - - - - - - -- - - - - - - - - - - -- - - - ------------------------------------ - - - -- - - - - - - - --- - - - - - - - - - - - - - - - - - - - -------------------- ----- -- ----- ---- ------ ----- ------- ---
of errrs the patient not actualy suffer a hear attack, but had angina or a cardiac aIhythmia. (Appendi G-
In adtion, the ICD- CM cods for ischemic hear disease can group to DRG 121 if the patient subseuently suffers a hear attack within 8 weeks of discharge. However, only one erroneous bil caIed such a cod, suggesting that such events occur only raely.
Percent
DRG 121
f= 0 All DRGs
Unneeed admissions Poor quality of care Premature dIscharge
Figure 8: Clinical incidents
Clinical review results
The DRG 121 had 2.3 percent rate of poor quality care. (Appendi H-l) This-rate is less than hal that in the National DRG Valdation Study. (Appendi H-2) It found no premature discharges or unnecessar adssions.

RECOMMENDATIONS
The Health Care Financing Admnistration should dict the peer review organizations to review DRG 121 bils for codg accurcy.
The HCFA should dict the PROs to educate physicians and hospitals about the diagnoses that properly grup to DRG 121.
The HCFA disagrees with the fit recommendation and agres with the second. The Offce of Inspector Genera modfied the drt of ths report to accommodte the HCFA comments, but contiues to believe that implementation of these recommendations could recover $42;2 mi-lion anualy.

Appendix A-1: DRG 121 discharges from all PPS hospitals
Fiscal Year 1984 1985 1986 1987
Relative weight 864 8454 8145 7687 Number of discharges 365 96, 113,963 122,068 Total charges ($ milion) 370. 722. 896. 022. Total reimbursement ($ milion) 259. 487. 567. 590. Average reimbursement ($) 764 567 982 836
Appendix A-2: DRG 121 sampling frame
Number Bed size .:100 100-299 300+ Total
Medicare population 20,350 912 41, 181 96, Sampling frame 196 762 633 591 Sample Sampling fraction (%) 13.
Appendix A-3: DRG 121 hospital demography
Number Bed size Weighted percentage
(Percent) .:100 100-299 300+ Total Sample Discharge Hospital
Urban Rural
7 (26.
19 (73. 18 (72. 7 (28.
24 (96. 1 (4.
(64. (35.
(72. (27.
(52. (47.
Teaching Nonteaching
2 (7. 24 (92.
1 (4. 24 (96.
19 (76. 6 (24.
(28. (71.
(35. (64.
(17. (81.
Profit Nonprofit
(15.4) 22 (84.
4 (16.
21 (84. 0 (0.
25 (100)
(10. (89.
(9. (91.
(13. (86.
Total 26 (100) 25 (100) 25 (100) (100) (100) (100)

Appendix A-4: DRG 121 hospital demography comparison
Percent Bed size Weighted percentage
-:100 100-299 300+ Sample Discharge Hospital
Urban DRG 121 26. 72. 96. 64. 72. 52. NDRGVS 19. 70. 94. 62. 71. 48.
Rural DRG 121 73. 28. 35. 27. 47. NDRGVS' 80. 29. 38. 28. 52.
Teaching DRG 121 76. 28. 35. 17. NDRGVS 18. 55. 25. 31. 16.
Non- DRG 121 92. 96. 24. 71. 64. 82. teaching NDRGVS 97.4 81. 44. 74. 68. 83.
Profit DRG 121 15. 16. 10. 13. NDRGVS 17. 10.
Non- DRG 121 84. 84. 100. 89. 91. 86. profit NDRGVS 90. 82. 97. 90. 90. 89.
Appendix A-5: DRG 121 patient demography
Bed size Weighted average
-:100 100-299 300+ Sample Discharge Hospital
Age (years) 78. 71. 74. 74. 74. 75. Sex (% male) 53. 52. 56. 54. 54. 53. LOS (days) 10. 11. 10:0 10.4 Payment ($) 3696 4417 5891 4655 4894 4278 Mortaliy (%)
9.4

($)(%)
Appendix A-6: DRG 121 patient demography comparison
Bed size Weighted average
c:100 100-299 300+ Sample Discharge Hospital
Age DRG 121 78. 71. 74. 74. 74. 75.4
(years) NDRGVS 76. 74. 72. 74. 73. 74.
Sex DRG 121 53. 52. 56. 54. 73. 74.
(% male) NDRGVS 43. 45. 48. 45. 46. 44.
LOS DRG 121 10. 11. 10. 10.
(days) NDRGVS
Payment DRG 121 3696 4417 5891 4668 4894 4278 NDRGVS 1849 2923 3807 2860 3074 2508
Mortality DRG 121 NDRGVS

Appendix B-1: DRG 121 assignment errors
Number Bed size Weighted percentage
(Percent) -:100 100-299 300+ Total Sample Discharge Hospital
Urban 1 (14. 3 (16. 4 (16. (16. (16. (15. Rural 7 (36. 0 (0. 0 (0. (25. (7. (19.
Teaching 0 (0. 0 (0. 4 (21. (18. (9. (3. Nonteaching 8 (33. 3 (12. 0 (0. (20.4) (11. (21.
Profit 1 (25. 0 (0. (12. (5. (12. Nonprofit 7 (31. 3 (14. 4 (16. (20. (18. (23.
Total 8 (30. 3 (12. 4 (16. (19. (17. (22.
Appendix B-2: DRG 121 assignment errors comparison
Percent Bed size Weighted percentage
-:100 100-299 300+ Sample Discharge Hospital
Urban DRG 121 14. 16. 16. 16. 16. 15. NDRGVS 22. 19. 16. 18. 17. 20.4
Rural DRG 121 36. 25. 19. NDRGVS 23. 16. 22. 21. 20. 21.
Teaching DRG 121 21. 12. NDRGVS 20. 20. 15. 17.4 17. 19.
Non- DRG 121 33. 12. 20.4 11. 21. teaching NDRGVS 23. 17. 17. 20. 19. 20.
Profit DRG 121 25. 12. 12. NDRGVS 23. 18. 18. 20. 19. 21.
Non- DRG 121 31. 14. 16. 20. 18. 23. profit NDRGVS 23. 18. 16. 19.4 18. 20.
Total DRG 121 30. 12. 16. 19. 17. 22. NDRGVS 23. 18. 16. 19. 18. 20.
($)(%)
Appendix B-3: DRG 121 assignment errors by patient demography
Bed size Weighted average
-:100 100-299 300+ Sample Discharge Hospital
Age Correc 80. 72. 75. 75. 75.
(years) Incorrec 75. 61. 68. 70. 67. 69.
Sex (% Correct 55. 54. 52.4 54. 53. 54. male) Incorrect 50. 33. 75. 53. 54. 48.
LOS Correct 10. 11. 10. 10.
(days) Incorrec 11.4
Payment Correct 3876 4331 5778 4695 4853 4325 Incrrect 3290 5049 643 4494 5290 4368
Mortality Correct Incrrec 12. 66. 20. 26. 28.

Appendix C-1: DRG 121 direction of error
Number of Bed size Weighted percentage
overpayments oe100 100-299 300+ Total Sample Discharge Hospital (Percent of errors)
Urban 1 (100. 3 (100. 3 (75. (87. (89. (96. Rural 7 (100. (100) (21. (51.
Teaching 3 (75. (75. (32. (11. Nonteaching 8 (100. 3 (100. (100) (57. (84.
Profit 1 (100. (100) (21. (51. Nonprofit 7 (100. 3 (100. 3 (75. (92. (89. (96.
Total 8 (100. 3 (100. 3 (75. (93. (89. (96.
Appendix C-2: DRG 121 of direction of error comparison
Percent Bed size Weighted percentage
of errors oe100 100-299 300+ Sample Discharge Hospital
Urban DRG 121 100 100 75. 87. 89. 96. NDRGVS 53. 60.4 57. 58. 57. 56.
Rural DRG 121 75. 75. 21. 51. NDRGVS 66. 57. 65. 64. 62. 63.
Teaching DRG 121 75. 75. 32. 11. NDRGVS 66. 59. 56. 57. 59. 62.
Non- DRG 121 100 100 100 57. 84. teaching NDRGVS 64. 59. 59. 61. 60. 61.
Profit DRG 121 100 100 21. 51. NDRGVS 68. 55. 63. 60. 61. 63.
Non- DRG 121 100 100 75. 92. 89. 96. profit NDRGVS 63. 60. 57. 60. 59. 61.
Total DRG 121 100 100 75. 93. 89. 96. NDRGVS 64. 59. 57. 60. 59. 61.
($)(%)
Appendix C-3: DRG 121 direction of error by patient demography
Bed size Weighted average
-=100 100-299 300+ Sample Discharge Hospital
Age Overpaid 75. 61. 69. 71. 67. 69.
(years) Underpaid 65. 65. 27. 10.
Sex Overpaid 50. 33. 66. 50. 51. 47.
(% male) Underpaid 100. 100. 42. 15.
LOS Overpaid (days) Underpaid 21. 21.
Payment Overpaid 3290 5049 5304 4098 4787 4182 Underpaid 10020 10020 4279 1583
Mortalit Overpaid not available Underpaid

Appendix D-1: DRG 121 hospital department making error
Coding depart- Bed size Weighted percentage
ment errors 100 100-299 300+ Total Sample Discharge Hospital
(Percent of errors)
Urban 1 (100) 1 (33. 2 (50. (50. (54. (70.4) Rural 5 (71.4) (71.4) (15. (36.
Teaching 2 (50. (50. (21.4) (7. Nonteaching 6 (75. 1 (33. (63. (27. (49.
Profit 1 (100) (100) (21. (51. Nonprofit 5 (74. 1 (33. 2 (50. (57. (49. (57.
Total 6 (75. 1 (33. 2 (50. (60. (49. (57.
Balance of errors made by billng department.
Appendix 0.2: DRG 121 hospital department making error comparison
Percent coing Bed size Weighted percentage
department 100 100-299 300+ Sample Discharge Hospital errors
Urban DRG 121 100 33. 50. 50. 54. 70.4 NDRGVS 89. 88. 90. 89. 89. 89.
Rural DRG 121 71. 71.4 15. 36. NDRGVS 94. 95. 90. 94. 93. 94.
Teaching DRG 121 50. 50. 21. NDRGVS 91. 92. 89. 90. 91. 91.
Non- DRG 121 75. 33. 63. 27. 49. teaching NDRGVS 93. 90. 92. 92. 91. 92.
Profit DRG 121 100 100 21. 51. NDRGVS 86. 92.4 81. 89. 86. 87.
Non- DRG 121 74. 33. 50. 57. 49. 57. profit NDRGVS 94. 90. 90. 92. 91.4 92.
Total DRG 121 75. 33. 50. 60. 49. 57. NDRGVS 93. 90. 90. 91. 91. 92.

($)(%)
Appendix D-3: DRG 121 hospital department making error by patient demography
Bed size Weighted average
100 100-299 300+ Sample Discharge Hospital
Age Coding 75. 69. 71. 73. 71. 72.
(years) Billng 76. 57. 65. 66. 64. 68.
Sex Coding 66. 50. 55. 35.4 42.
(% male) Billng 50. 100 50. 60. 32.
LOS Coding (days) Billng 18. 11.
Payment Coding 3074 5534 5254 3832 4895 4220 Biling 3940 4807 7713 5486 5865 4819
Mortality Coding Billing 50. 100 50. 46. 58.4
Appendix E-1: DRG 121 reasons for errors
Number Bed size -=100 100-299 300+ Total (Percent)
Mis-specification Principal diagnosis (20.
Secndary diagnosis (33. Miscoding (0.
Resequencing (6.
Other Admiting diagnosis used (6.
No hospital codes (6.
Multiple attestations (6.
Other (20.
Total (100.
Appendix E-2: DRG 121 reasons for errors by hospital demography
Number Mis-specification Resequencing Other (Percent)
-=100 beds 5 (62. 1 (12. 2 (25.
100-299 beds 1 (33. 0 (0. 2 (66.
300+ beds 2 (50. 0 (0. 2 (50.
Urban 4 (50. 0 (0. 4 (50.
Rural 4 (57. 1 (14. 2 (28.
Teaching 2 (50. 0 (0. 2 (50.
Nonteaching 6 (54. 1 (9. 4 (36.4)
Profit 1 (100) 0 (0. 0 (0.Nonprofit 7 (50. 1 (7. 6 (42.
Total 8 (53. 1 (6. 6 (40.

Appendix E-3: DRG 121 reasons for errors comparison
Percent Bed size Weighted percentage
.c100 100-299 300+ Sample Discharge Hospital
Mis-speci- DRG 121 33. 13. 53. 46. 51. fication NDRGVS 48. 47. 48.
Resequencing DRG 121 12. NDRGVS 31. 24. 24. 27. 25. 28.
Other DRG 121 25. 66. 50. 40. 50. 42. NDRGVS 15. 14. 12. 13. 11.
Appendix E-4: DRG 121 reasons for DRG assignment errors by patient demography
Narrative Resequencing Other
Age (years) 74. 69. 66. Sex (% male) 50. 100 50. LOS (days) Payment ($) 3843 3734 5486 Mortality (%)

Appendix F-1: DRG 121 corrected relative weights
Relative Bed size Average-weight 100 100-299 300+ Total
Avera Paid 8454 8454 1 .8454 8454 Correct 6092 7679 8172 7298 Difference 2362 0775 0282 1156
Total Paid 47.9800 46. 1350 46. 1350 140.2500 Corrected 41.8392 44. 1975 45.4300 131.4667 Diference 1408 9375 7050 7833
(Percent) (12. (4. (1. (4.
* Discharge weighted.
Appendix F-2: DRG 121 corrected reimbursement
Bed size Average100 100-299 300+ Total
Avera Paid 656 167 439 082 Correc 060 950 356 764 Diference 596 217 318
Total Paid 121 069 129, 182 135,980 386,231 Correct 92,899 82,677 75,613 255,757 Diference 28,170 46,505 60,367 130,474
(Percent) (23. (36. (44.4)
* Discharge weighted.

Appendix F-3: DRG 121 estimated overpayments
Fiscal Year Reimbursement Overpayment ($ milion) ($ milion)
259. 11.41984 1985 487. 21. 1986 567. 25. 1987 590. 26. 1988 est. 744. 32. 1989 est. 852. 37. 1990 est. 959. 42.
Overpayment is calculated as 4.4 percent of reimbursement. Estimates based on linear regression.

Appendix G-1: Major Diagnostic Categories for discharges incorrectly assigned toDRG 121
MDC Bed size .:100 100-299 300+ Total
05 Circulatory
Appendix G-2: DRGs frequently miscoded to DRG 121
DRG Bed size .:100 100-299 300+ Total (Percent)
122 uncomplicated myocardial infarction (33.
123 myocardial infarction, expired (20. 138 arrhythmias (13. 140 angina (20.
other (13.
Total (100.

Appendix H-1: DRG 121 clinical incidents
Number Bed size Weighted percentage
(Percent) oe100 100-299 300+ Total Sample Discharge Hospital
Unnecessary 0 (0. 0 (0. 0 (0. (0. (0. (0.
admissions
Poor quality 1 (3. 1 (4. 0 (0. (2. (2. (3.
of care
Premature 0 (0. 0 (0. 0 (0. (0. (0. (0.
discharge
Appendix H-2: DRG 121 clinical incidents comparison
Bed size Weighted percentagePercent oe100 100-299 300+ Sample Discharge Hospital
Unnecessary DRG 121 10. 10. 11.admissions NDRGVS 12. 10.
Poor quality DRG 121 of care NDRGVS 11.
Premature DRG 121 discharge NDRGVS 0.4 1.4