DREDGING WATERWAY CHANNELS BY MOVABLE/ STATIONARY JET · PDF fileDREDGING WATERWAY CHANNELS BY...
15
Tenth International Water Technology Conference, IWTC10 2006, Alexandria, Egypt 377 DREDGING WATERWAY CHANNELS BY MOVABLE/ STATIONARY JET PUMP Alaa El-Shaikh * , Imam El-Sawaf ** , Nabiel El-Menshawy ** and Nageh Gad El-hak *** * Engineer, Follow up and Control Dept., Suez Canal Authority, Egypt. ** Professor, Mechanical Power Eng. Dept., Faculty of Engineering, Suez Canal University, Egypt. *** Dr. Eng., Follow up and Control Dept., Suez Canal Authority, Egypt. ABSTRACT This research covers the experimental results obtained in the current work. A set of experiments were carried out to study the effect of some parameters on the performance of the suggested jet pump. These parameters such as: area ratio (four different area ratios of 0.16, 0.22, 0.26 and 0.3 were used), driving nozzle outlet diameter to mixing chamber diameter ratios (four ratios were tested with values of 1, 1.5, 2 and 2.5). Also, two suction inlet configuration were selected (one with cylindrical inlet part, and the another with conical inlet part) and two vertical level positions for jet pump at 10 and 30 mm from sand bed were studied. In addition, the experimental study also includes the performance of the slurry jet pump in two cases (stationary and movable), for the movable case, two speeds for jet pump of 0.7 and 0.35 m/min were tested. One type of quartz sand was used with 0.52 mm mean particle size diameter and with a specific gravity of 2.65. Furthermore, one suction nozzle of semi cone angle 24° was used with one diffuser of semi cone angle 5.5°. One fluidizer of 3 mm holes diameter was used too. A special experimental test rig has been designed and built to study the effect of these parameters experimentally. The performance of slurry jet pump is described by two sets of curves. The first shows the relationship between the head ratio (N) and the mass flow ratio (M). The second set shows the relationship between the jet pump efficiency (η) and the mass flow ratio. Keywords: Jet pump, Slurry, Fluidization, Dredging INTRODUCTION The current work is directed to evaluate the results obtaind from a study of movable/stationary jet pump. The study was divided into two main parts. The first part (theoretical investigation) was to drive a formula that could predict the performance of jet pump. Recently, the research works tend to use the slurry jet pump aided by a centrifugal pump for solid-liquid mixture transport because the jet pumps haven’t any
Transcript of DREDGING WATERWAY CHANNELS BY MOVABLE/ STATIONARY JET · PDF fileDREDGING WATERWAY CHANNELS BY...
Tenth International Water Technology Conference, IWTC10 2006, Alexandria, Egypt
377
DREDGING WATERWAY CHANNELS BY MOVABLE/ STATIONARY
JET PUMP
Alaa El-Shaikh*, Imam El-Sawaf **, Nabiel El-Menshawy** and Nageh Gad El-hak***
*Engineer, Follow up and Control Dept., Suez Canal Authority, Egypt.
** Professor, Mechanical Power Eng. Dept., Faculty of Engineering, Suez Canal University, Egypt.
*** Dr. Eng., Follow up and Control Dept., Suez Canal Authority, Egypt. ABSTRACT This research covers the experimental results obtained in the current work. A set of experiments were carried out to study the effect of some parameters on the performance of the suggested jet pump. These parameters such as: area ratio (four different area ratios of 0.16, 0.22, 0.26 and 0.3 were used), driving nozzle outlet diameter to mixing chamber diameter ratios (four ratios were tested with values of 1, 1.5, 2 and 2.5). Also, two suction inlet configuration were selected (one with cylindrical inlet part, and the another with conical inlet part) and two vertical level positions for jet pump at 10 and 30 mm from sand bed were studied. In addition, the experimental study also includes the performance of the slurry jet pump in two cases (stationary and movable), for the movable case, two speeds for jet pump of 0.7 and 0.35 m/min were tested. One type of quartz sand was used with 0.52 mm mean particle size diameter and with a specific gravity of 2.65. Furthermore, one suction nozzle of semi cone angle 24° was used with one diffuser of semi cone angle 5.5°. One fluidizer of 3 mm holes diameter was used too. A special experimental test rig has been designed and built to study the effect of these parameters experimentally. The performance of slurry jet pump is described by two sets of curves. The first shows the relationship between the head ratio (N) and the mass flow ratio (M). The second set shows the relationship between the jet pump efficiency (η) and the mass flow ratio. Keywords: Jet pump, Slurry, Fluidization, Dredging INTRODUCTION The current work is directed to evaluate the results obtaind from a study of movable/stationary jet pump. The study was divided into two main parts. The first part (theoretical investigation) was to drive a formula that could predict the performance of jet pump. Recently, the research works tend to use the slurry jet pump aided by a centrifugal pump for solid-liquid mixture transport because the jet pumps haven’t any
Tenth International Water Technology Conference, IWTC10 2006, Alexandria, Egypt
378
moving parts, economic in manufacture, simple to use and worn parts of jet pump can be easily and inexpensively replaced. Fluidization; the injection of fluid into sediment sand helps the grains of sand to disintegrate and separate. Once the sediment sand has been fluidized it behaves as dense fluid and can be transferred by suitable slurry jet pump followed by a centrifugal pump through pipes to the outside of the channel. The main target of fluidization in dredging waterway channels is to create a long deep way after the removal of the fluidized sand-water slurry. Zandi and Govatos [1] presented experimental work on water and slurry jet pumps. They developed comprehensive equations which may be used in designing a slurry (water-sand mixture) jet pump taking into consideration the effects of slip velocity of particles. Also, Fish [2] presented theoretical and experimental studies on a water and slurry jet pumps. He developed a governing equation which predicts the performance of the jet pump using two types of solid material (low grade iron ore and cast steel shot). Govatos [3] extended his previous work with Zandi [1] where the performance equations for slurry jet pump have been developed. Richardson [4] carried out full-scale laboratory tests on a center-drive water and slurry jet pump. Shaheen [5] carried out experimental study on a water and slurry jet pump. The aim of his research was to experimentally study the effect of some design parameters on slurry jet pump performance. El-Shaikh et al. [6] studied theoretically the performance of slurry jet pump under the effect of some parameters. They recommended that the maximum efficiency is achieved at area ratio R = 0.26. El-Sawaf et al. [7] studied the theoretical and experimental investigation for slurry jet pump performance and fluidization system. They concluded that the maximum efficiency is achieved at area ratio equals 0.22 and weight flow ratio M = 1. Wakefield [8] described application of jet pumps in many fields for different purposes because of its simple construction and easy operation. He designed many jet pumps that have been used frequently in dredging, deep pumping, booster pumping, tail water suppressors, as a recirculation device in atomic reactors and in many other systems. El-Sawaf et al. [9] studied theoretically and experimentally the effect of some parameters on the performance of slurry jet pump using two area ratios. El-Shaikh [10] presented theoretical and experimental studies on the slurry jet pump using three area ratios of 0.16, 0.22 and 0.3 and the experimental results are compared with the theoretical results and the other previous works, which showed a relatively good agreement. Most of the previous researches did not study the jet pump performance when and as it moves. Consequently, the current research is directed to study movable and stationary jet pump performance using fluidization system which when scale up or evaluated can be used to dredge sandy soil waterway channels. By moving the jet pump that is equipped with fluidizer (as one part), the suction concentration ratio of the sand is expected to be continuous with constant value approximately. Furthermore, the research is directed also to study the effect of each design parameter independently on the performance of the movable and stationary jet pump. Finally the
Tenth International Water Technology Conference, IWTC10 2006, Alexandria, Egypt
379
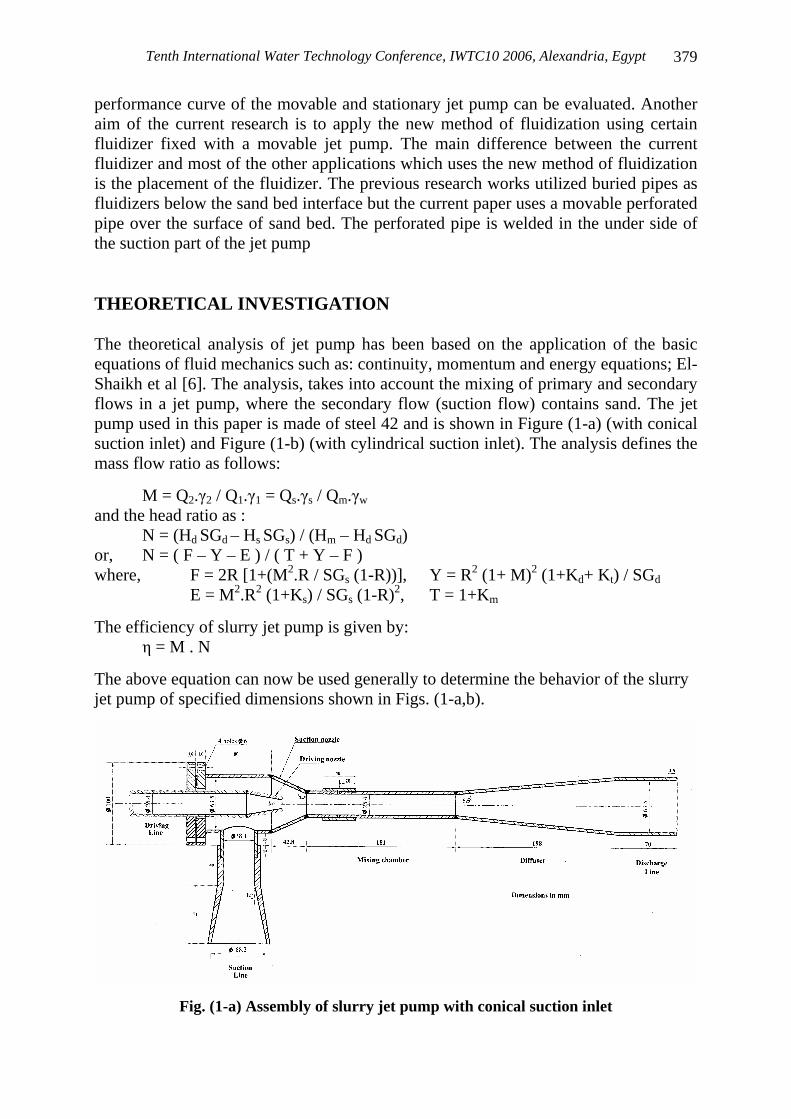
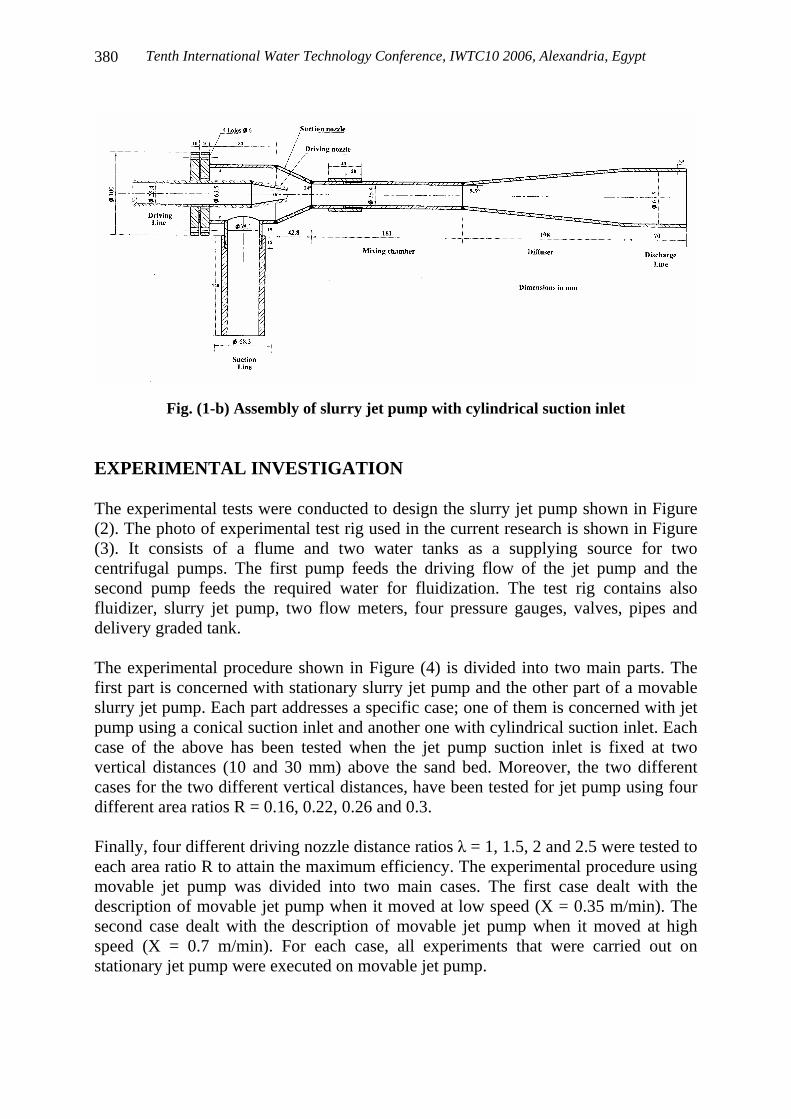
performance curve of the movable and stationary jet pump can be evaluated. Another aim of the current research is to apply the new method of fluidization using certain fluidizer fixed with a movable jet pump. The main difference between the current fluidizer and most of the other applications which uses the new method of fluidization is the placement of the fluidizer. The previous research works utilized buried pipes as fluidizers below the sand bed interface but the current paper uses a movable perforated pipe over the surface of sand bed. The perforated pipe is welded in the under side of the suction part of the jet pump THEORETICAL INVESTIGATION The theoretical analysis of jet pump has been based on the application of the basic equations of fluid mechanics such as: continuity, momentum and energy equations; El-Shaikh et al [6]. The analysis, takes into account the mixing of primary and secondary flows in a jet pump, where the secondary flow (suction flow) contains sand. The jet pump used in this paper is made of steel 42 and is shown in Figure (1-a) (with conical suction inlet) and Figure (1-b) (with cylindrical suction inlet). The analysis defines the mass flow ratio as follows:
M = Q2.γ2 / Q1.γ1 = Qs.γs / Qm.γw
and the head ratio as : N = (Hd SGd – Hs SGs) / (Hm – Hd SGd)
or, N = ( F – Y – E ) / ( T + Y – F ) where, F = 2R [1+(M2.R / SGs (1-R))], Y = R2 (1+ M)2 (1+Kd+ Kt) / SGd
E = M2.R2 (1+Ks) / SGs (1-R)2, T = 1+Km
The efficiency of slurry jet pump is given by: η = M . N
The above equation can now be used generally to determine the behavior of the slurry jet pump of specified dimensions shown in Figs. (1-a,b).
Fig. (1-a) Assembly of slurry jet pump with conical suction inlet
Tenth International Water Technology Conference, IWTC10 2006, Alexandria, Egypt
380
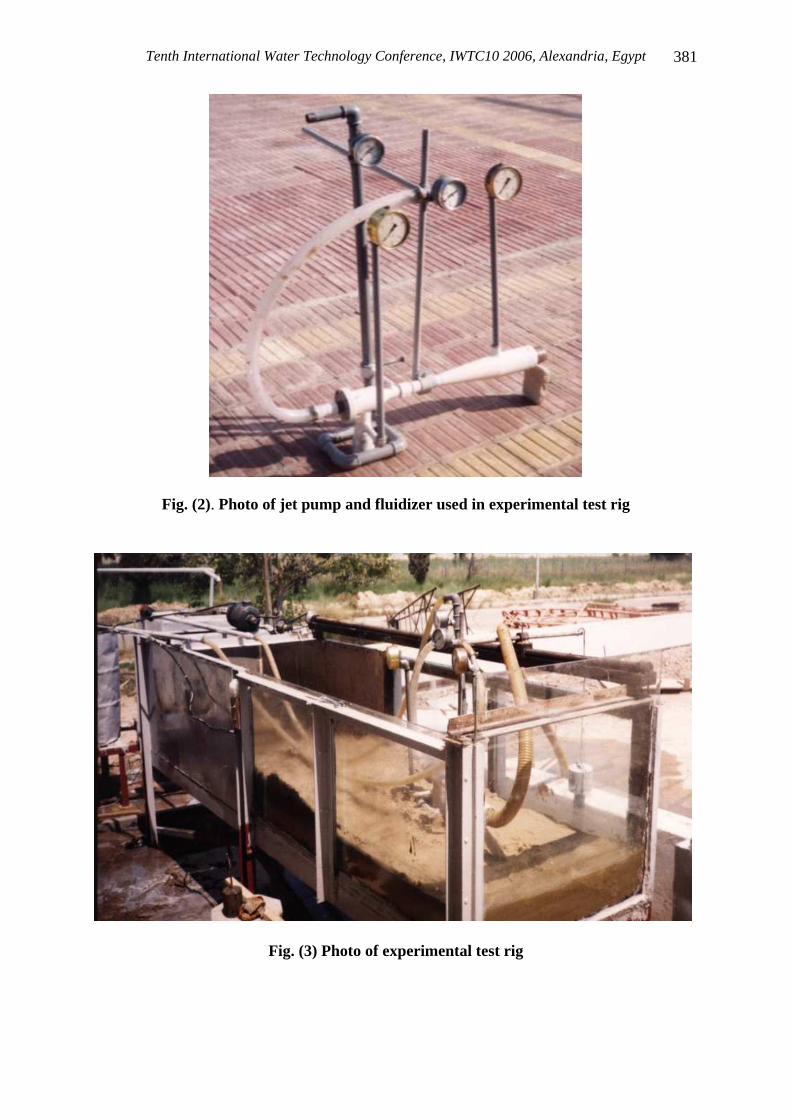
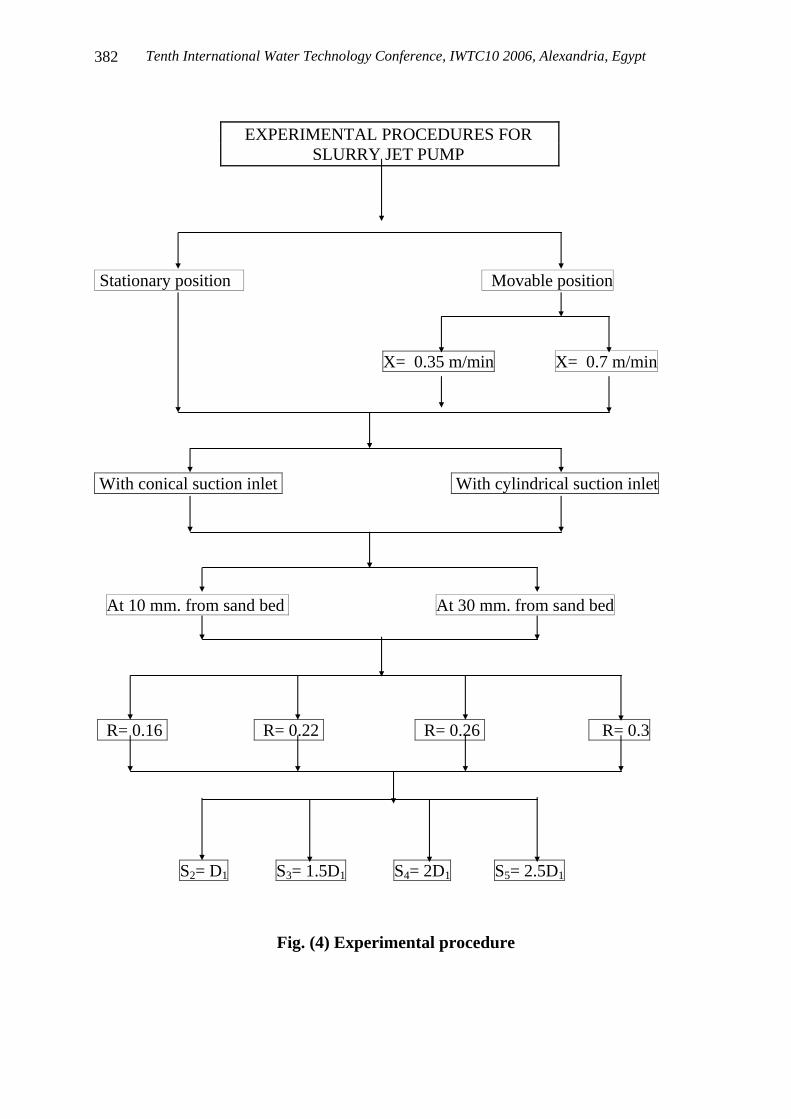
Fig. (1-b) Assembly of slurry jet pump with cylindrical suction inlet EXPERIMENTAL INVESTIGATION The experimental tests were conducted to design the slurry jet pump shown in Figure (2). The photo of experimental test rig used in the current research is shown in Figure (3). It consists of a flume and two water tanks as a supplying source for two centrifugal pumps. The first pump feeds the driving flow of the jet pump and the second pump feeds the required water for fluidization. The test rig contains also fluidizer, slurry jet pump, two flow meters, four pressure gauges, valves, pipes and delivery graded tank. The experimental procedure shown in Figure (4) is divided into two main parts. The first part is concerned with stationary slurry jet pump and the other part of a movable slurry jet pump. Each part addresses a specific case; one of them is concerned with jet pump using a conical suction inlet and another one with cylindrical suction inlet. Each case of the above has been tested when the jet pump suction inlet is fixed at two vertical distances (10 and 30 mm) above the sand bed. Moreover, the two different cases for the two different vertical distances, have been tested for jet pump using four different area ratios R = 0.16, 0.22, 0.26 and 0.3. Finally, four different driving nozzle distance ratios λ = 1, 1.5, 2 and 2.5 were tested to each area ratio R to attain the maximum efficiency. The experimental procedure using movable jet pump was divided into two main cases. The first case dealt with the description of movable jet pump when it moved at low speed (X = 0.35 m/min). The second case dealt with the description of movable jet pump when it moved at high speed (X = 0.7 m/min). For each case, all experiments that were carried out on stationary jet pump were executed on movable jet pump.
Tenth International Water Technology Conference, IWTC10 2006, Alexandria, Egypt
381
Fig. (2). Photo of jet pump and fluidizer used in experimental test rig
Fig. (3) Photo of experimental test rig
Tenth International Water Technology Conference, IWTC10 2006, Alexandria, Egypt
382
EXPERIMENTAL PROCEDURES FOR SLURRY JET PUMP
Stationary position Movable position
X= 0.35 m/min X= 0.7 m/min
With conical suction inlet With cylindrical suction inlet
At 10 mm. from sand bed At 30 mm. from sand bed
R= 0.16 R= 0.22 R= 0.26 R= 0.3
S2= D1 S3= 1.5D1 S4= 2D1 S5= 2.5D1
Fig. (4) Experimental procedure
Tenth International Water Technology Conference, IWTC10 2006, Alexandria, Egypt
383
In this paper, many trials have been carried out to determine the suitable pressure and flow rate of the fluidization system to fluidize the sand bed in the flume. Also the direction and size of perforated pipe were carried out before starting the tests so as to achieve the highest delivered volumetric concentration and the best condition to form the trench. After these trials, the best conditions for achieving the highest delivered volumetric concentration were detected at a fluidization pressure of 2.8 bar, when the diameter of perforated pipe holes was 3 mm and in which the direction of these holes is as shown in Fig. (5). These conditions were attained when the distance between the surface of water and the sand bed surface was 20 cm inside the flume for all experimental tests.
Fig. (5) Schematic diagram of the perforated pipe holes direction. RESULTS AND DISCUSSIONS EXPERIMENTAL RESULTS In this research paper, the effect of changing driving nozzle distance on the slurry jet pump performance for four different area ratios R= 0.16, 0.22, 0.26 and 0.3 were studied experimentally at the following conditions:
� Four driving nozzle distances, S= D1, 1.5D1, 2 D1 and 2.5 D1. � Two speeds for jet pump, X= 0.35 and 0.7 m/min (movable case) and X= 0
(stationary case). � Two vertical level positions for jet pump at 10 and 30 mm from sand bed.
16o 16o
flume 27o 27o
sand bed
134 mm
perforated pipes
200
mm
1000 mm
Tenth International Water Technology Conference, IWTC10 2006, Alexandria, Egypt
384
� Two different jet pump suction inlet configuration (with conical and cylindrical inlet part).
Some of experimental results are plotted by curves showed in previous work [10] and in current work as shown in Figure (6) as relationship between mass flow ratio (M) versus head ratio (N) and efficiency (η) respectively for each area ratio. These figures stated that the highest maximum efficiency is achieved at driving nozzle distance S = 1.5:2D1 at R = 0.16, S = 1.5D1 at R = 0.22, S = 1.5:2.5D1 at R = 0.26 and S = D1 at R = 0.3 for all cases. Further more, the mass flow ratio M that gives the maximum efficiency is ranged from 1.07 to 2.11, 1.539 to 2.017, 1.14 to 1.73 and from 0.952 to 1.52 for R = 0.16, 0.22, 0.26 and 0.3 respectively. From the previous Figures, the study of the effect of changing driving nozzle distance on the performance curve of suggested jet pump stated that the nozzle distance corresponding to highest maximum efficiency point depends on the area ratio, jet pump speed, suction inlet configuration and vertical level position for jet pump. The best conditions that give the highest efficiency points for jet pump with its corresponding suggested area ratios in this work are stated as shown in Table (1).
Table (1) The best conditions of jet pump performance
Table (1) stated also that the area ratio of 0.3 gives the best performance compared to three area ratios of 0.16, 0.22 and 0.26 and area ratio of 0.16 gives the lower performance. This may be because the jet pump with area ratio 0.3 draws more driving fluid than that with area ratios 0.16, 0.22 and 0.26 for the same conditions. On the contrary, the experimental tests reveal that, the higher area ratio gives the lower delivery concentration. This may be because the higher area ratio the higher driving flow rate that dilutes the sand concentration at suction side.
Nozzle distance ratio (λ) Highest maximum value
With conical With cylindrical η Cvd
Area ratio (R)
Pump speed (X)
m/min 10 mm 30 mm 10 mm 30 mm % %
0.35 1.5 11.65 12.8
0.70 2.0 11.01 10.37 0.16
stationary 1.5 11.45 8.5
0.35 15.64 10.25
0.70 13.51 8.23 0.22
stationary
1.5
15.41 7.54
0.35 2.5 1.5 19.12 10.15
0.70 1.5 2 16.54 7.73 0.26
stationary 2.5 1.5 17.64 6.51
0.35 24.4 7.95
0.70 20.58 7.004 0.30
stationary
1.0
21.72 6.76
Tenth International Water Technology Conference, IWTC10 2006, Alexandria, Egypt
385
R=0.26, X=0.35 m/min, 30 mm, cylindrical
0
0.05
0.1
0.15
0.2
0.25
0.3
0 0.5 1 1.5 2
M
N
S=D1
S=1.5D1
S=2D1
S=2.5D1
(S=D1) trend
(S=1.5D1) trend
(S=2D1) trend
(S=2.5D1) trend
R=0.26, X=0.35 m/min, 30 mm, cylindrical
0
2
4
6
8
10
12
14
16
18
0 0.5 1 1.5 2
M
η %S=D1
S=1.5D1
S=2D1
S=2.5D1
(S=D1) trend
(S=1.5D1) trend
(S=2D1) trend
(S=2.5D1) trend
R=0.26, X=0.7 m/min, 10 mm, conical
0
0.05
0.1
0.15
0.2
0.25
0 0.5 1 1.5 2M
N
S=D1
S=1.5D1
S=2D1
S=2.5D1
(S=D1) trend
(S=1.5D1) trend
(S=2D1) trend
(S=2.5D1) trend
R=0.26, X=0.7 m/min, 10 mm, conical
0
2
4
6
8
10
12
14
16
18
0 0.5 1 1.5 2M
η %S=D1
S=1.5D1
S=2D1
S=2.5D1
(S=D1) trend
(S=1.5D1) trend
(S=2D1) trend
(S=2.5D1) trend
R=0.26, stationary, 30 mm, cylindrical
0
0.05
0.1
0.15
0.2
0.25
0.3
0 0.5 1 1.5M
N
S=D1
S=1.5D1
S=2D1
S=2.5D1
(S=D1) trend
(S=1.5D1) trend
(S=2D1) trend
(S=2.5D1) trend
R=0.26, stationary, 30 mm, cylindrical
0
2
4
6
8
10
12
14
16
18
0 0.5 1 1.5
M
η %
S=D1
S=1.5D1
S=2D1
S=2.5D1
(S=D1) trend
(S=1.5D1) trend
(S=2D1) trend
(S=2.5D1) trend
Fig. (6) Effect of changing driving nozzle distance (S) on the experimental performance
of slurry jet pump (with conical and cylindrical suction inlet) at constant area ratio (R = 0.26).
Tenth International Water Technology Conference, IWTC10 2006, Alexandria, Egypt
386
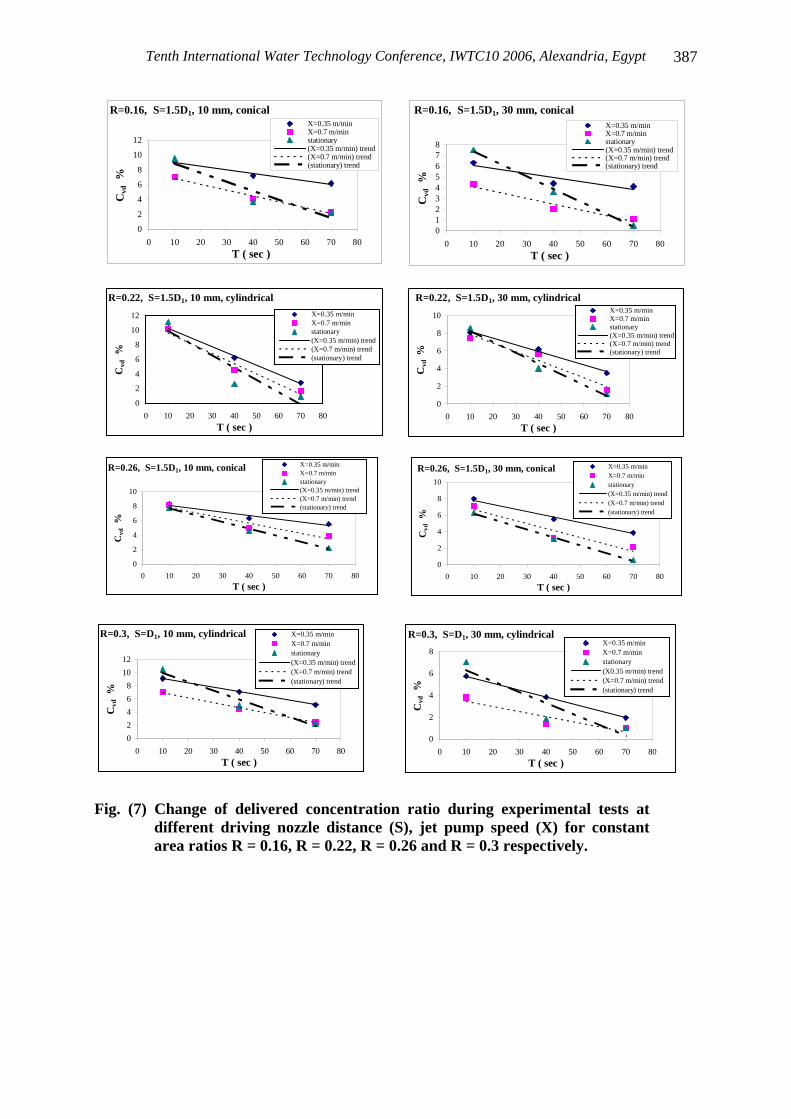
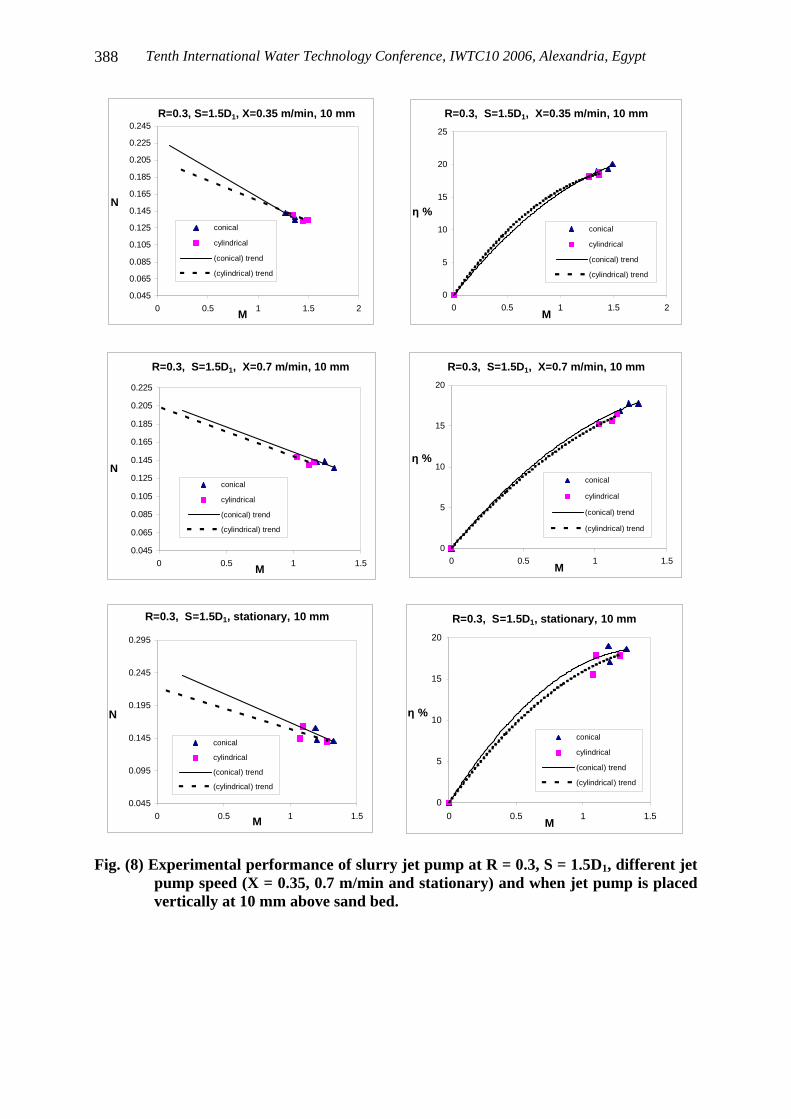
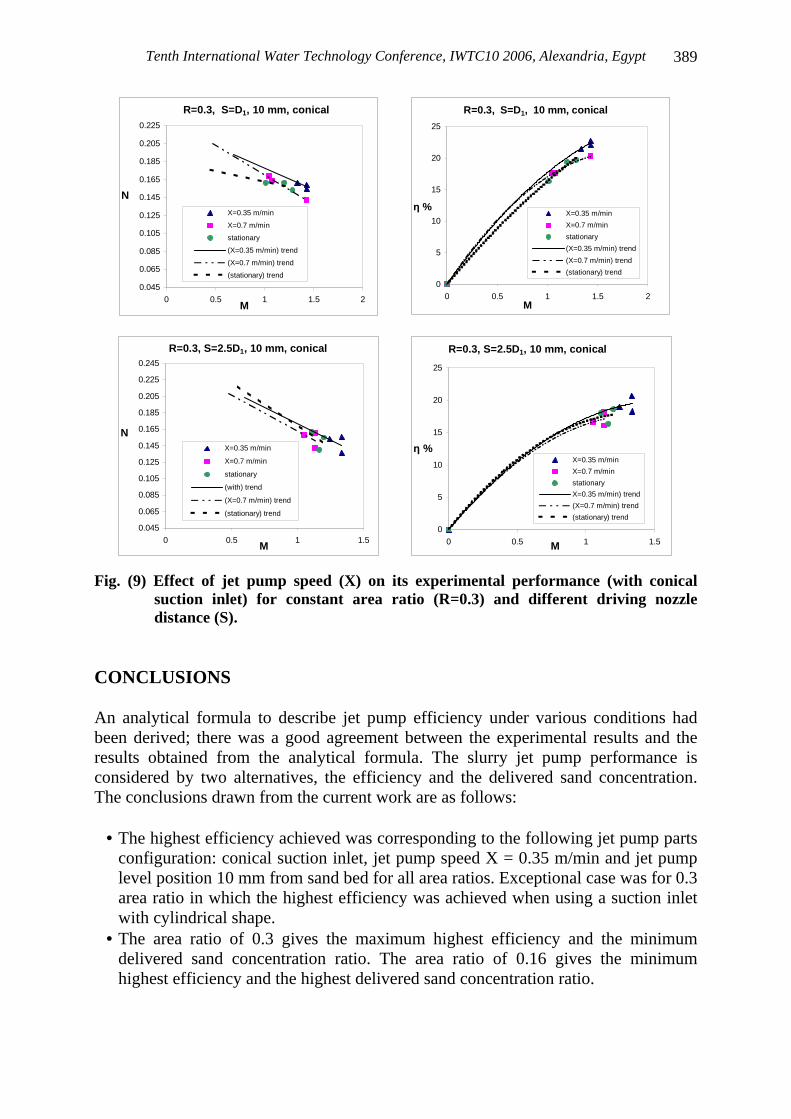
Figure (7) shows the effect of changing jet pump speed on delivered sand concentration ratio for area ratios 0.16, 0.22, 0.26 and 0.3. Three samples from the discharge flow have been taken at time intervals of T = 10, 40 and 70 second during the experimental tests at every position of driving valve. After that, the delivered concentration ratios were calculated for these samples in each separate test. Then, the experimental results are plotted by curves in Fig. (7) as relationship between delivered concentration ratio (Cvd) and time of experimental test (T). All set of curves shown in Fig. (7) stated that, the highest value of concentration ratio (Cvd) is achieved at first sample (after 10 second from beginning of test). After that and during the test, this value is decreased gradually with the time for the four chosen area ratios, jet pump speed, nozzle distance, vertical level of jet pump above sand bed and with changing suction inlet configuration too. In addition the slope of most curves in case of the movable jet pump (X=0.35 m/min) is found to be lower than that of case at speed X=0.7 m/min or stationary jet pump. This difference in curves slopes due to decrease of suction concentration ratio with time during the test in case of stationary jet pump. But in case of movable jet pump the suction concentration ratio of sand was nearly constant during tests. The previous results reveal that, by moving the jet pump which is equipped with fluidizer (as one part), the suction/delivery concentration ratios of the sand is approximately constant. In this research, two different suction inlet configuration were tested; the first, with conical suction inlet and the second, cylindrical suction inlet. Figure (8) shows the effect of changing different suction inlet configuration on the performance of the slurry jet pump for area ratio 0.3 as example. The curves shown in Fig. (8) stated that the highest maximum efficiency value in case of jet pump with conical shape is higher than that of the case with cylindrical shape under the same conditions. In this research also, two vertical level positions for jet pump at 10 and 30 mm from sand bed were studied. From the experiments, the highest efficiency is obtained when jet pump was placed at level position of 10 mm from sand bed for all cases. Figure (9) shows the effect of changing jet pump speed (X) on its performance for area ratio R = 0.3 and different driving nozzle distances (S). All experimental tests for all chosen area ratios show that the highest efficiency value is attained at movable jet pump of speed X = 0.35 m/min. Furthermore, the highest value of efficiency at speed X = 0.35 m/min is higher than that of the case at X = 0.7 or of case of stationary jet pump {i.e., η)X = 0.35 > η)X = 0.7 }.
Tenth International Water Technology Conference, IWTC10 2006, Alexandria, Egypt
387
R=0.16, S=1.5D1, 10 mm, conical
0
2
4
6
8
10
12
0 10 20 30 40 50 60 70 80
T ( sec )
Cvd
%X=0.35 m/minX=0.7 m/minstationary(X=0.35 m/min) trend(X=0.7 m/min) trend(stationary) trend
R=0.16, S=1.5D1, 30 mm, conical
012345678
0 10 20 30 40 50 60 70 80
T ( sec )
Cvd
%
X=0.35 m/minX=0.7 m/minstationary(X=0.35 m/min) trend(X=0.7 m/min) trend(stationary) trend
R=0.22, S=1.5D1, 10 mm, cylindrical
0
2
4
6
8
10
12
0 10 20 30 40 50 60 70 80
T ( sec )
Cvd
%
X=0.35 m/minX=0.7 m/minstationary(X=0.35 m/min) trend(X=0.7 m/min) trend(stationary) trend
R=0.22, S=1.5D1, 30 mm, cylindrical
0
2
4
6
8
10
0 10 20 30 40 50 60 70 80
T ( sec )C
vd %
X=0.35 m/minX=0.7 m/minstationary(X=0.35 m/min) trend(X=0.7 m/min) trend(stationary) trend
R=0.26, S=1.5D1, 10 mm, conical
0
2
4
6
8
10
0 10 20 30 40 50 60 70 80
T ( sec )
Cvd
%
X=0.35 m/minX=0.7 m/minstationary(X=0.35 m/min) trend(X=0.7 m/min) trend(stationary) trend
R=0.26, S=1.5D1, 30 mm, conical
0
2
4
6
8
10
0 10 20 30 40 50 60 70 80
T ( sec )
Cvd
%
X=0.35 m/minX=0.7 m/minstationary(X=0.35 m/min) trend(X=0.7 m/min) trend(stationary) trend
R=0.3, S=D1, 10 mm, cylindrical
0
2
4
6
8
10
12
0 10 20 30 40 50 60 70 80
T ( sec )
Cvd
%
X=0.35 m/minX=0.7 m/minstationary(X=0.35 m/min) trend(X=0.7 m/min) trend(stationary) trend
R=0.3, S=D1, 30 mm, cylindrical
0
2
4
6
8
0 10 20 30 40 50 60 70 80
T ( sec )
Cvd
%
X=0.35 m/minX=0.7 m/minstationary(X0.35 m/min) trend(X=0.7 m/min) trend(stationary) trend
Fig. (7) Change of delivered concentration ratio during experimental tests at
different driving nozzle distance (S), jet pump speed (X) for constant area ratios R = 0.16, R = 0.22, R = 0.26 and R = 0.3 respectively.
Tenth International Water Technology Conference, IWTC10 2006, Alexandria, Egypt
388
R=0.3, S=1.5D1, X=0.35 m/min, 10 mm
0.045
0.065
0.085
0.105
0.125
0.145
0.165
0.185
0.205
0.225
0.245
0 0.5 1 1.5 2M
N
conical
cylindrical
(conical) trend
(cylindrical) trend
R=0.3, S=1.5D1, X=0.35 m/min, 10 mm
0
5
10
15
20
25
0 0.5 1 1.5 2M
η %conical
cylindrical
(conical) trend
(cylindrical) trend
R=0.3, S=1.5D1, X=0.7 m/min, 10 mm
0.045
0.065
0.085
0.105
0.125
0.145
0.165
0.185
0.205
0.225
0 0.5 1 1.5M
Nconical
cylindrical
(conical) trend
(cylindrical) trend
R=0.3, S=1.5D1, X=0.7 m/min, 10 mm
0
5
10
15
20
0 0.5 1 1.5M
η %
conical
cylindrical
(conical) trend
(cylindrical) trend
R=0.3, S=1.5D1, stationary, 10 mm
0
5
10
15
20
0 0.5 1 1.5M
η %
conical
cylindrical
(conical) trend
(cylindrical) trend
R=0.3, S=1.5D1, stationary, 10 mm
0.045
0.095
0.145
0.195
0.245
0.295
0 0.5 1 1.5M
N
conical
cylindrical
(conical) trend
(cylindrical) trend
Fig. (8) Experimental performance of slurry jet pump at R = 0.3, S = 1.5D1, different jet
pump speed (X = 0.35, 0.7 m/min and stationary) and when jet pump is placed vertically at 10 mm above sand bed.
Tenth International Water Technology Conference, IWTC10 2006, Alexandria, Egypt
389
R=0.3, S=D1, 10 mm, conical
0
5
10
15
20
25
0 0.5 1 1.5 2M
η %X=0.35 m/min
X=0.7 m/min
stationary
(X=0.35 m/min) trend
(X=0.7 m/min) trend
(stationary) trend
R=0.3, S=D1, 10 mm, conical
0.045
0.065
0.085
0.105
0.125
0.145
0.165
0.185
0.205
0.225
0 0.5 1 1.5 2M
N
X=0.35 m/min
X=0.7 m/min
stationary
(X=0.35 m/min) trend
(X=0.7 m/min) trend
(stationary) trend
R=0.3, S=2.5D1, 10 mm, conical
0.045
0.065
0.085
0.105
0.125
0.145
0.165
0.185
0.205
0.225
0.245
0 0.5 1 1.5M
NX=0.35 m/min
X=0.7 m/min
stationary
(with) trend
(X=0.7 m/min) trend
(stationary) trend
R=0.3, S=2.5D1, 10 mm, conical
0
5
10
15
20
25
0 0.5 1 1.5M
η %X=0.35 m/min
X=0.7 m/min
stationary
X=0.35 m/min) trend
(X=0.7 m/min) trend
(stationary) trend
Fig. (9) Effect of jet pump speed (X) on its experimental performance (with conical suction inlet) for constant area ratio (R=0.3) and different driving nozzle distance (S).
CONCLUSIONS An analytical formula to describe jet pump efficiency under various conditions had been derived; there was a good agreement between the experimental results and the results obtained from the analytical formula. The slurry jet pump performance is considered by two alternatives, the efficiency and the delivered sand concentration. The conclusions drawn from the current work are as follows:
• The highest efficiency achieved was corresponding to the following jet pump parts configuration: conical suction inlet, jet pump speed X = 0.35 m/min and jet pump level position 10 mm from sand bed for all area ratios. Exceptional case was for 0.3 area ratio in which the highest efficiency was achieved when using a suction inlet with cylindrical shape.
• The area ratio of 0.3 gives the maximum highest efficiency and the minimum delivered sand concentration ratio. The area ratio of 0.16 gives the minimum highest efficiency and the highest delivered sand concentration ratio.
Tenth International Water Technology Conference, IWTC10 2006, Alexandria, Egypt
390
• The jet pump speed of X = 0.35 m/min attained a higher efficiency compared to that results in case of jet pump speed X = 0.7 m/min or stationary jet pump.
• The jet pump level position of 10 mm above sand bed found to have the higher efficiency than level position of 30 mm for the three tested area ratios.
• For the four tested area ratios the jet pump suction inlet with conical shape attained a higher performance compared to that results of suction inlet with cylindrical shape.
• A jet pump with conical suction inlet gives a higher delivered sand concentration compared to jet pump with the suction inlet of cylindrical shape.
• Dredging by current system can preserve surrounding environment from dredging side effects specially when used in wetlands, shallow water, lakes, harbours, shore lines and under bridges because the fluidized area is sucked momentary during operation.
NOTATIONS
Roman letters
A = area (m2) Cvs, Cvd = concentration by volume on suction and discharge lines
respectively (volume of solid divided by volume of slurry)
(-) D = diameter (m) H = total head (m) K = loss coefficient (-) M = mass flow ratio = Q2 γ2 / Q1 γ1 = Qs γs / Qm γw (ـ) N = head ratio = (Hd SGd – Hs SGs) / (Hm – Hd SGd) (ـ ) Q = volume flow rate (m3/s) R = area ratio =A1/A3, (driving nozzle area/mixing chamber area) (-) S = driving nozzle to mixing chamber distance (m) SG = specific gravity (-) X = jet pump speed (m/s)
Greek letters
η = efficiency = M . N (-) γ = specific weight (N/m3) λ = ratio of nozzle distance S to driving nozzle exit diameter (-)
Subscripts
d, m, s : discharge, driving (main) and suction lines respectively t : mixing chamber ( throat ) w : water 1, 2 : driving and suction nozzles exit at mixing chamber entrance 2΄
: suction nozzle inlet 3 : exit of mixing chamber
Tenth International Water Technology Conference, IWTC10 2006, Alexandria, Egypt
391
REFERENCES 1. Zandi, I., and Govatos, G., Jet Pump Slurry Transport, Hydrotransport 1,
1st International Conference on the Hydraulic Transport of Solids in Pipes, BHRA, paper L2, pp. L2-17: L2-32, September, 1970.
2. Fish, G., The Solids-Handling Jet Pump, Hydrotransport 1, 1st International
Conference on the Hydraulic Transport of Solids in Pipes, BHRA, paper L1, pp. L1-1: L1-15, 1st September, 1970.
3. Govatos, G.C., The Slurry Jet Pump, Journal of Pipelines, Elsevier Scientific
Publishing Company, Amsterdam, pp. 145-157, 1981. 4. Richardson, T.W., Performance of Center-Drive Jet Pump in Water and in Sand,
World Dredging Congress 1983, BHRA, paper D1, pp. 157-168, April 9-22, 1983. 5. Shaheen, Y., Experimental Investigations of a Slurry Jet Pump, M.Sc. Thesis,
Mechanical Power Engineering Dept., Cairo University, Egypt, 1988. 6. El-Shaikh, A., El-Menshawy, N., El-Sawaf, I.A., and Gad El-Hak, N.,
Economically and Environmentally Acceptable Alternative to Dredge Waaterway Channels by Fluidization and Jet Pump, Part 1, Theoretical Investigation. 6th International Water Technology Conference, IWTC 2001, Alexandria, Egypt, 23-25 March, pp. 401-415, 2001.
7. El-Sawaf, I. A. and El-shaikh, A., A Fluidization System Equipped with Central-
Type Jet Pump for Dredging Channel, Port Said Engineering Research Journal, Faculty of Engineering, Suez Canal University, Vol. 5, No. 2, September, 2001.
8. Wakefield, A.W., An Introduction to the Jet Pump, 5th Edition, Published by Genflo
Technology Limited, Mansfield, England, 2002. 9. El-Sawaf, I.A., El-Menshawy, N., Gad El-Hak, N., and El-Shaikh, A., An
Innovative Movable Jet Pump Equipped By A Fixed Fluidizer for Dredging. 12th International Conference on Transport and Sedimentation of Solid Particles, Prague, Czech Republic, 20-24 September, pp. 277-291, 2004.
10. El-Shaikh, A., El-Menshawy, N., El-Sawaf, I.A., and Gad El-Hak, N.,
Economically and Environmentally Acceptable Alternative to Dredge Waterway Channels by Fluidization and Jet Pump, 9th International Water Technology Conference, IWTC9 2005, Sharm El-Sheikh, Egypt, 17-20 March, pp. 609-625, 2005.