DREAM Young Stars Program Evaluation_Fall 2012_FINAL
39
1 IMPACT OF DREAM PROGRAMMING ON STUDENT ACADEMIC PERFORMANCE IN THE DOMINICAN REPUBLIC An Evaluation of the Young Stars Program in Cabarete, Dominican Republic September 2012
-
Upload
janae-bushman -
Category
Documents
-
view
153 -
download
0
Transcript of DREAM Young Stars Program Evaluation_Fall 2012_FINAL
1
IMPACT OF DREAM PROGRAMMING ON
STUDENT ACADEMIC PERFORMANCE IN THE DOMINICAN REPUBLIC
An Evaluation of the Young Stars Program in Cabarete, Dominican Republic
September 2012
2
Prepared for the DREAM Project by Master students from Columbia University’s Teachers College and School for International and Public Affairs (SIPA)
Teachers College, Columbia University
Molly Hamm – Project Leader Steve Arrieta Janae Bushman Jenifer Duarte Yumiko Locussol Rebeca Martinez Katrina Pierre
Emily Richardson
School for International and Public Affairs (SIPA), Columbia University
Gillian Bower Niccolina Clements
Savannah Honerkamp-‐Smith Shannon Malone Megann Mielke Lila Wade Mia Yuasa
The research team would like to thank the entire staff at DREAM, most notably Catherine DeLaura and Ani Yanachkova, for providing us with valuable information, insight and time throughout the evaluation process. We are particularly grateful for the warm welcome we
received while on-‐site in Cabarete.
3
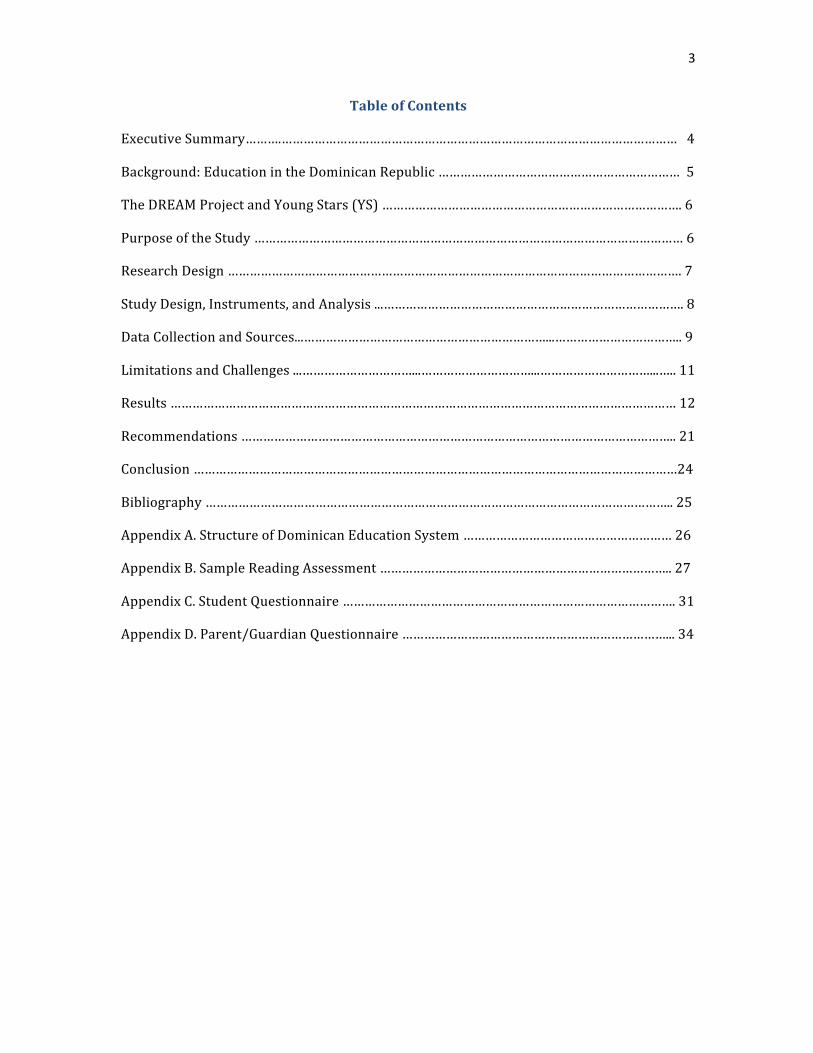
Table of Contents
Executive Summary……….……………………………………………………………………………………………… 4
Background: Education in the Dominican Republic ………………………………………………………… 5
The DREAM Project and Young Stars (YS) ………………………………………………………………………. 6
Purpose of the Study ……………………………………………………………………………………………………… 6
Research Design ……………………………………………………………………………………………………………. 7
Study Design, Instruments, and Analysis ...………………………………………………………………………. 8
Data Collection and Sources...…………………………………………………………...…………………………….. 9
Limitations and Challenges ...…………………………...…………………………...…………………………...….. 11
Results ………………………………………………………………………………………………………………………… 12
Recommendations ……………………………………………………………………………………………………….. 21
Conclusion ……………………………………………………………………………………………………………………24
Bibliography ……………………………………………………………………………………………………………….. 25
Appendix A. Structure of Dominican Education System ………………………………………………… 26
Appendix B. Sample Reading Assessment …………………………………………………………………….. 27
Appendix C. Student Questionnaire ………………………………………………………………………………. 31
Appendix D. Parent/Guardian Questionnaire ………………………………………………………………... 34
4
Executive Summary
Despite drastic improvements in the access to and quality of education in the Dominican Republic, there is much room for improvement in the Dominican education system. In addition, many opportunities to increase student learning achievement both within and outside of the formal education system remain. In highly economically imbalanced societies, students from financially disadvantaged households often receive fewer instructional hours and poorer quality schooling than their richer peers. This is certainly true in the Dominican Republic, where students enrolled in public schools attend school on a shift schedule for approximately four hours in either the morning or afternoon. However, studies have shown that only 65 percent of this time is actually used for instructional purposes (Abadzi, 2009; EDUCA, 2005).
The Dominican Republic Education And Mentoring Project (DREAM), a US-‐based nonprofit organization, operates early childhood and youth development programs in several communities on the North coast of the Dominican Republic. One of these programs is Young Stars (YS), or Estrellas Jóvenes, an extracurricular program that serves students from local primary schools. The Young Stars program serves as a response to the low number of instructional hours students receive on a daily basis. The program is intended to complete the academic school day for primary school students, providing additional academic classes and enrichment activities during the shift when students do not attend their regular school program.
In March 2012, DREAM sought the assistance of 15 Columbia University graduate students to conduct an impact evaluation of the Young Stars program in Cabarete. The researchers incorporated both quantitative and qualitative data collection methods that involved both students and their families. The study aimed to comprehensively assess the extent to which YS programming is associated with improved results in academic performance and/or attitudes about school and self among DREAM program participants as compared to non-‐participants.
Results varied depending on the data, but quantitative data show that Young Stars participants overall performed better than non-‐Young Stars participants in both Spanish and Math. Through qualitative data analysis, a striking difference was evident in the ability of Young Stars students to communicate, follow directions, and work in a group as compared to non-‐Young Stars participants. Although the Young Stars program currently operates in three sites, this study focused on the most comprehensive site at the DREAM Center in Cabarete, Puerto Plata.
Based on the results, the research team makes seven recommendations to the DREAM Project:
• Provide teachers, be they foreign volunteers or local Dominican staff, with robust literacy training and resources to better serve students;
• Align Young Stars curriculum with the public school curriculum so that there is more consistency between what students learn in both contexts;
• Find strategies to help improve Young Stars retention rates to ensure that the program can have long lasting impact on the children that it serves;
• Promote critical thinking skills activities in Young Stars programming; • Incorporate goal-‐setting activities in the Young Stars curricula;
5
• Continue to strengthen and maintain regular student assessments and program impact evaluations;
• Strengthen opportunities for family and community involvement to reinforce program goals and enhance student support systems.
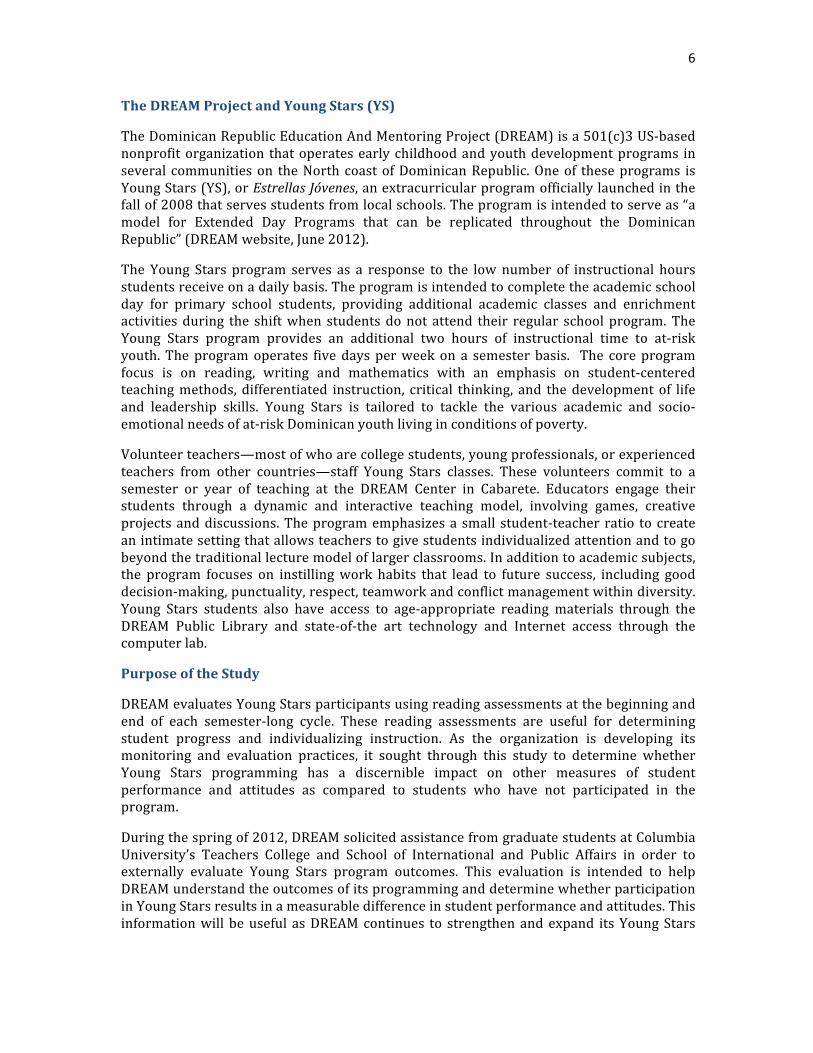
Background: Education in the Dominican Republic
Like many countries in the Latin America and Caribbean (LAC) region, the Dominican Republic has managed to improve access to education, notably at the primary level. However, for the period between 2007 and 2010, net enrolment rates decrease dramatically at the secondary level, dropping from an average of 82 percent at the primary level to a mere 57 percent in secondary school (UNICEF, n.d). When disaggregated by student socio-‐economic status (SES), the difference in retention rates is even starker, with only 20 percent of students from lower SES attending secondary school as compared to about 70 percent of students from more privileged households (PREAL, 2010). One contributing factor to this decrease is that enrolment stops being compulsory at the secondary level, and students with greater economic responsibilities towards their families and communities often leave the school system upon graduating from primary school. Furthermore, the quality of schooling that Dominican students receive is among the lowest in the region as highlighted by student performance on international and regional assessments. For example, in Latin America, the Second Regional Comparative and Explanatory Study (SERCE)—administered to third and sixth graders in 2006—has served as a foundational indicator of student achievement across the region in reading, mathematics, and science. SERCE exam results show significant differences in achievement levels between and among students in sixteen countries, with students in the Dominican Republic receiving the lowest mean achievement scores in all three tested subjects (UNESCO, 2008). In the Dominican Republic, an overwhelming 90 percent of third graders scored at Level I or below in mathematics and 78 percent at Level I or below in reading (Ganimian, 2009; LLECE, 2008). Notably, the results are equally poor among rural, urban, public, and private schools, showing a countrywide need for improved education quality. In both reading and math, students in the Dominican Republic scored lower than students from countries with notably higher poverty rates, including Guatemala and Nicaragua (World Bank, 2010). Indeed, the Dominican Republic ranked below the regional average by at least 1 standard deviation in Math and Reading scores for both third and sixth graders (PREAL, 2010).
Evidence shows that there is much room for improvement in the country’s education system, and that many opportunities for increasing student learning achievement both within and outside of the formal education system remain. In highly economically imbalanced societies, students from financially disadvantaged households often receive fewer instructional hours and poorer quality schooling than their richer peers. This is certainly true in the Dominican Republic, where students enrolled in public schools attend school on a shift schedule for approximately four hours in either the morning or afternoon. However, studies have shown that only 65 percent of this time is actually used for instructional purposes (Abadzi, 2009; EDUCA, 2005). There are therefore great internal inefficiencies within the formal education system that should be addressed to ensure that all students benefit from a meaningful educational experience. However, given that students are involved in the formal school system for only half of a day, important learning opportunities can take place in non-‐formal educational settings as a means of supplementing the low quality education often offered by the formal system.
6
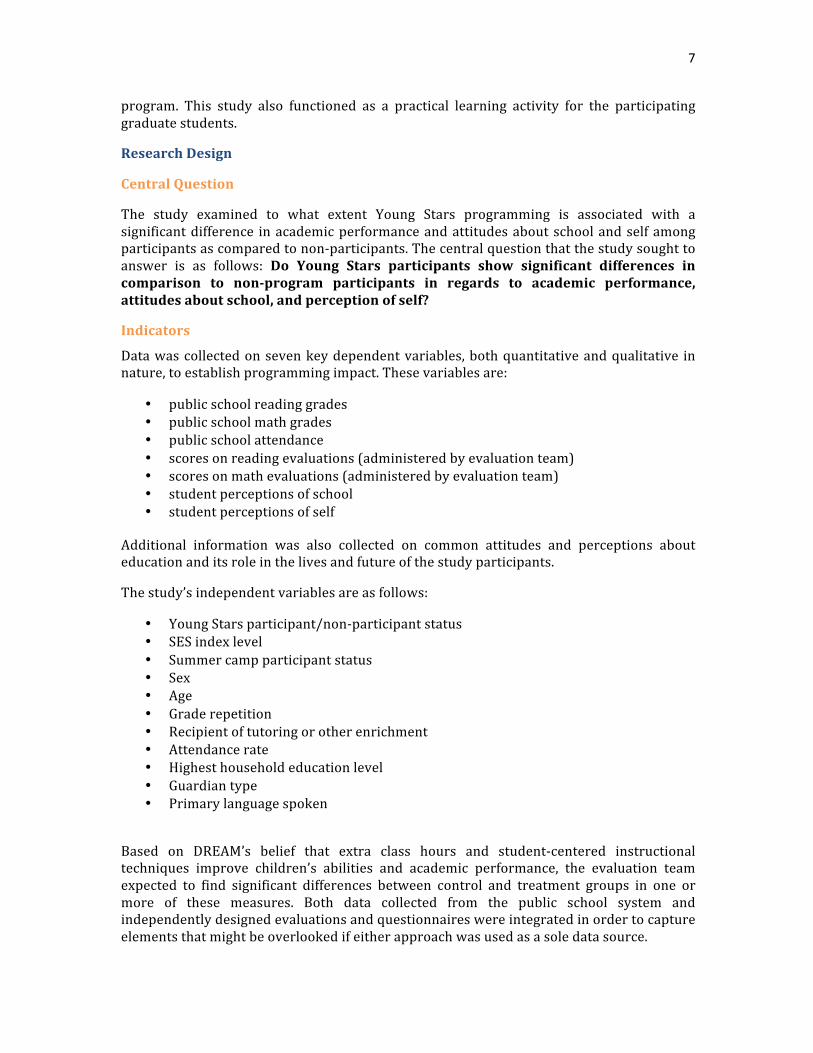
The DREAM Project and Young Stars (YS)
The Dominican Republic Education And Mentoring Project (DREAM) is a 501(c)3 US-‐based nonprofit organization that operates early childhood and youth development programs in several communities on the North coast of Dominican Republic. One of these programs is Young Stars (YS), or Estrellas Jóvenes, an extracurricular program officially launched in the fall of 2008 that serves students from local schools. The program is intended to serve as “a model for Extended Day Programs that can be replicated throughout the Dominican Republic” (DREAM website, June 2012).
The Young Stars program serves as a response to the low number of instructional hours students receive on a daily basis. The program is intended to complete the academic school day for primary school students, providing additional academic classes and enrichment activities during the shift when students do not attend their regular school program. The Young Stars program provides an additional two hours of instructional time to at-‐risk youth. The program operates five days per week on a semester basis. The core program focus is on reading, writing and mathematics with an emphasis on student-‐centered teaching methods, differentiated instruction, critical thinking, and the development of life and leadership skills. Young Stars is tailored to tackle the various academic and socio-‐emotional needs of at-‐risk Dominican youth living in conditions of poverty.
Volunteer teachers—most of who are college students, young professionals, or experienced teachers from other countries—staff Young Stars classes. These volunteers commit to a semester or year of teaching at the DREAM Center in Cabarete. Educators engage their students through a dynamic and interactive teaching model, involving games, creative projects and discussions. The program emphasizes a small student-‐teacher ratio to create an intimate setting that allows teachers to give students individualized attention and to go beyond the traditional lecture model of larger classrooms. In addition to academic subjects, the program focuses on instilling work habits that lead to future success, including good decision-‐making, punctuality, respect, teamwork and conflict management within diversity. Young Stars students also have access to age-‐appropriate reading materials through the DREAM Public Library and state-‐of-‐the art technology and Internet access through the computer lab.
Purpose of the Study
DREAM evaluates Young Stars participants using reading assessments at the beginning and end of each semester-‐long cycle. These reading assessments are useful for determining student progress and individualizing instruction. As the organization is developing its monitoring and evaluation practices, it sought through this study to determine whether Young Stars programming has a discernible impact on other measures of student performance and attitudes as compared to students who have not participated in the program.
During the spring of 2012, DREAM solicited assistance from graduate students at Columbia University’s Teachers College and School of International and Public Affairs in order to externally evaluate Young Stars program outcomes. This evaluation is intended to help DREAM understand the outcomes of its programming and determine whether participation in Young Stars results in a measurable difference in student performance and attitudes. This information will be useful as DREAM continues to strengthen and expand its Young Stars
7
program. This study also functioned as a practical learning activity for the participating graduate students.
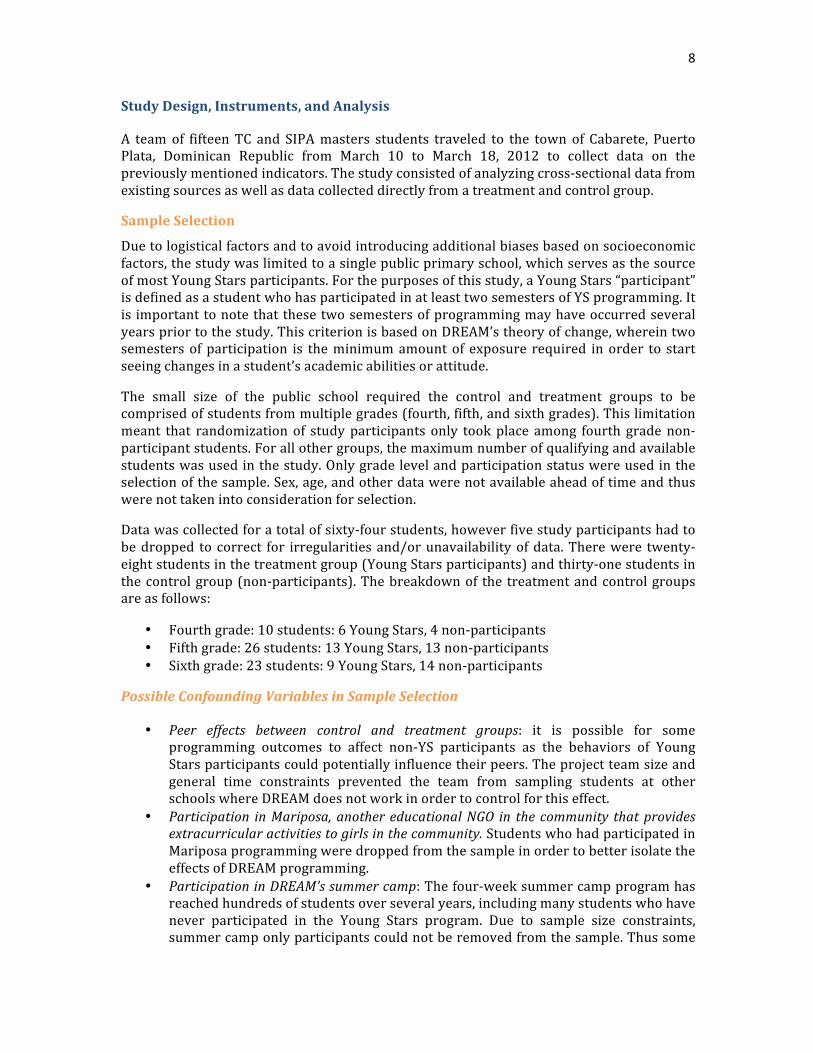
Research Design
Central Question
The study examined to what extent Young Stars programming is associated with a significant difference in academic performance and attitudes about school and self among participants as compared to non-‐participants. The central question that the study sought to answer is as follows: Do Young Stars participants show significant differences in comparison to non-‐program participants in regards to academic performance, attitudes about school, and perception of self?
Indicators
Data was collected on seven key dependent variables, both quantitative and qualitative in nature, to establish programming impact. These variables are:
• public school reading grades • public school math grades • public school attendance • scores on reading evaluations (administered by evaluation team) • scores on math evaluations (administered by evaluation team) • student perceptions of school • student perceptions of self
Additional information was also collected on common attitudes and perceptions about education and its role in the lives and future of the study participants.
The study’s independent variables are as follows:
• Young Stars participant/non-‐participant status • SES index level • Summer camp participant status • Sex • Age • Grade repetition • Recipient of tutoring or other enrichment • Attendance rate • Highest household education level • Guardian type • Primary language spoken
Based on DREAM’s belief that extra class hours and student-‐centered instructional techniques improve children’s abilities and academic performance, the evaluation team expected to find significant differences between control and treatment groups in one or more of these measures. Both data collected from the public school system and independently designed evaluations and questionnaires were integrated in order to capture elements that might be overlooked if either approach was used as a sole data source.
8
Study Design, Instruments, and Analysis
A team of fifteen TC and SIPA masters students traveled to the town of Cabarete, Puerto Plata, Dominican Republic from March 10 to March 18, 2012 to collect data on the previously mentioned indicators. The study consisted of analyzing cross-‐sectional data from existing sources as well as data collected directly from a treatment and control group.
Sample Selection
Due to logistical factors and to avoid introducing additional biases based on socioeconomic factors, the study was limited to a single public primary school, which serves as the source of most Young Stars participants. For the purposes of this study, a Young Stars “participant” is defined as a student who has participated in at least two semesters of YS programming. It is important to note that these two semesters of programming may have occurred several years prior to the study. This criterion is based on DREAM’s theory of change, wherein two semesters of participation is the minimum amount of exposure required in order to start seeing changes in a student’s academic abilities or attitude.
The small size of the public school required the control and treatment groups to be comprised of students from multiple grades (fourth, fifth, and sixth grades). This limitation meant that randomization of study participants only took place among fourth grade non-‐participant students. For all other groups, the maximum number of qualifying and available students was used in the study. Only grade level and participation status were used in the selection of the sample. Sex, age, and other data were not available ahead of time and thus were not taken into consideration for selection.
Data was collected for a total of sixty-‐four students, however five study participants had to be dropped to correct for irregularities and/or unavailability of data. There were twenty-‐eight students in the treatment group (Young Stars participants) and thirty-‐one students in the control group (non-‐participants). The breakdown of the treatment and control groups are as follows:
• Fourth grade: 10 students: 6 Young Stars, 4 non-‐participants • Fifth grade: 26 students: 13 Young Stars, 13 non-‐participants • Sixth grade: 23 students: 9 Young Stars, 14 non-‐participants
Possible Confounding Variables in Sample Selection
• Peer effects between control and treatment groups: it is possible for some programming outcomes to affect non-‐YS participants as the behaviors of Young Stars participants could potentially influence their peers. The project team size and general time constraints prevented the team from sampling students at other schools where DREAM does not work in order to control for this effect.
• Participation in Mariposa, another educational NGO in the community that provides extracurricular activities to girls in the community. Students who had participated in Mariposa programming were dropped from the sample in order to better isolate the effects of DREAM programming.
• Participation in DREAM’s summer camp: The four-‐week summer camp program has reached hundreds of students over several years, including many students who have never participated in the Young Stars program. Due to sample size constraints, summer camp only participants could not be removed from the sample. Thus some
9
non-‐participants may have had limited, short-‐term exposure to DREAM programming at some point.
• DREAM’s YS participant selection: DREAM has an open inscription process; any student interested in participating in the program can enroll, but parental or guardian permission is needed. Priority is given to former DREAM participants. Currently DREAM does not actively seek out certain types of students, though teachers from local schools occasionally refer particular students with academic or behavioral problems. DREAM removes students from the program with low attendance rates or repeated and/or extreme behavior problems. The inscription process thus has the potential of resulting in selection bias among participants, which could result in a disproportionate number of highly motivated and/or low-‐performing students to be enrolled.
• Irregularities in data collection: Due to a limited number of evaluation team members having advanced Spanish skills in addition to low family turnout on the days allocated to socio-‐economic data collection, many evaluators were moved from their original assessment administration duties in order to collect parent questionnaires. This change could have affected the test-‐taking environment for the final groups of student participants, thus influencing outcomes on the mathematics assessment.
Data Collection and Sources
All data collection instruments, except for the reading assessment, were designed and developed in English and were then translated into Spanish by a native Spanish speaker. The instruments were piloted and modified in the Dominican Republic before being implemented for the study. Modifications to the instruments included changing the structure and format, adjusting the response scales, and rephrasing questions to be appropriate to participant education levels and local culture and vocabulary. The reading assessment was purchased through the Columbia University library system and all reading excerpts and assessment questions were originally published in Spanish.
Public School Records: Student Grades and Attendance
Spanish and Math semester grades and attendance rates for Fall 2011 were obtained from the local public school during the research visit and research team members entered all data into spreadsheets. In this case, course grades were given using a 100-‐point grading scale. Attendance rates were recorded as a percentage. This data was critical to examining differences between the attendance rates and academic grades of study participants. This component tested the hypothesis that Young Stars students would have higher public school attendance rates and would receive higher marks in Reading and Math than their non-‐participant peers.
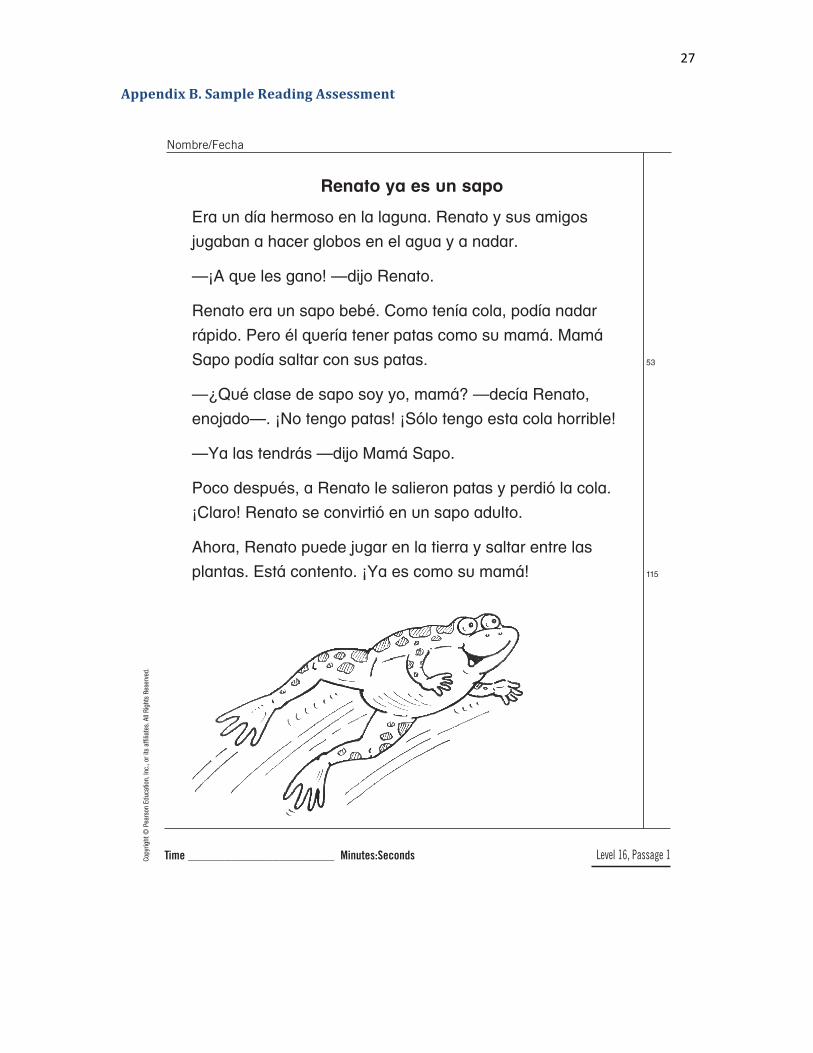
Reading Assessments
Reading assessments were conducted at DREAM facilities during the data collection phase. The selected assessment tool was the Pearson Learning Group Second Edition “Evaluación del desarrollo de la lectura” (EDL2). This tool is a one-‐on-‐one reading assessment that consists of timed oral reading and oral response to selected texts. It is similar to the Rigby assessment tool used regularly by The DREAM Project, however different content and assessment components ensured that Young Stars participants would not have an advantage due to prior exposure to particular texts and comprehension questions. It is
10
important to note that the EDL2 assessment tool was developed in the United States for dual language, immersion or bilingual programs in North America. It was therefore crafted with the needs of Spanish-‐speaking students in the US, and is not specifically targeted for students acquiring literacy in Spanish-‐speaking countries. Nonetheless, the EDL2 assessment was deemed an appropriate tool as it is research-‐based and it allowed researchers to measure important components of literacy including word study (phonics and word analysis), fluency, and comprehension.
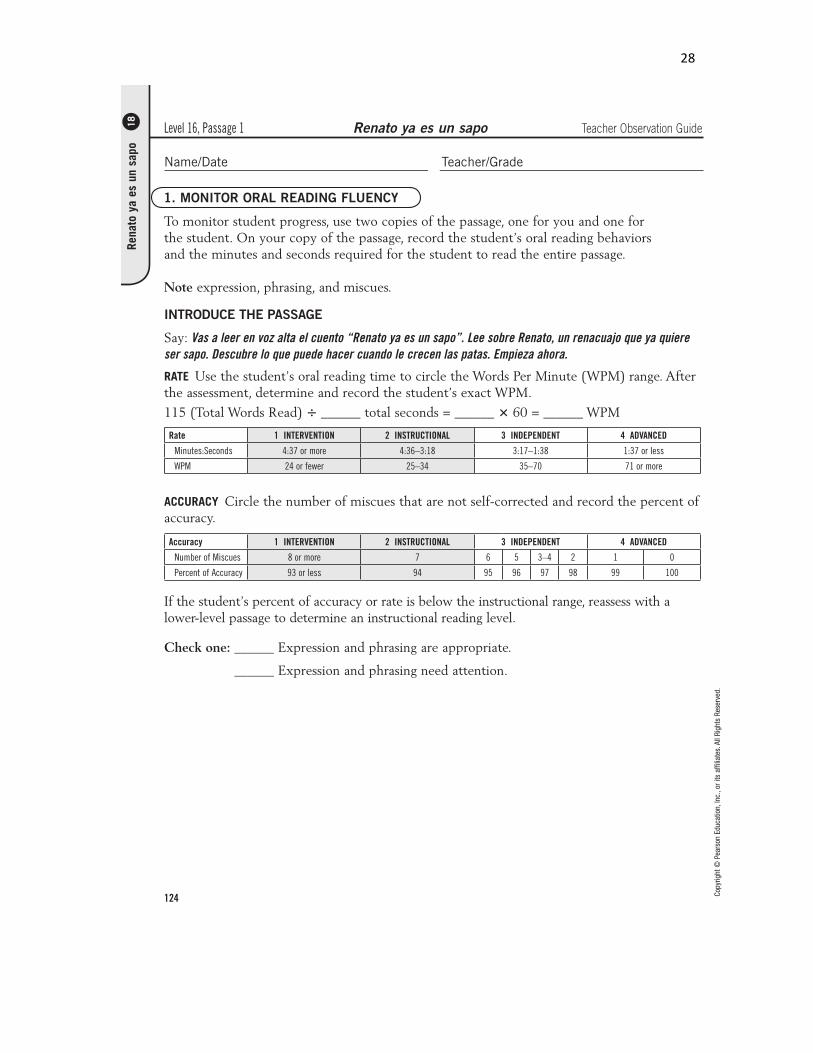
The reading assessment was administered to study participants on an individual basis. Administrators were native or highly fluent Spanish speakers who had received training on the administration and scoring of the EDL2 tool. Scoring consistency among administrators was ensured through a piloting process wherein researchers equilibrated their administration/scoring practices and made important decisions regarding issues related to pronunciation and speech patterns that are specific to the Dominican Republic. EDL2 scores consist of a fluency level and a comprehension level for each student using Pearson’s Developmental Reading Assessment scale of A-‐60. For the study, the scale was recoded as 0-‐60 to better facilitate analysis. A sample assessment can be found in the Appendix of this report.
Mathematics Assessments
Mathematics assessments were conducted immediately following the reading assessments. Study participants completed a short, written mathematics test based on content included in the curriculum for fourth, fifth, and sixth graders. The math assessment included thirty-‐six problems, incorporating addition, subtraction, multiplication and division problems of varying degrees of difficulty. In order to account for time limitations, questions were ordered by level of difficulty. This structure enabled the majority of students to complete the first few sets of questions even if unable to complete the entire assessment. Since the assessment covered a wide range of skills for multiple grades, the structure also accounted for the fact that some classes had not yet covered certain math processes. The assessment was administered in a group setting (5-‐12 students) and was proctored by several research team members. Scores were given as a percentage out of 100.
Student Questionnaires
Student attitudes about school and perceptions of self were assessed using a questionnaire designed by the research team that was administered to student participants in large groups. The various questions were read out loud by a facilitator to ensure that student literacy levels did not prevent full participation. Students rated their agreement or disagreement with statements using a scale of “Yes,” “Sometimes,” and “No.” Questionnaires addressed various constructs including attitudes toward school, self-‐confidence in school-‐related activities, and perceptions of school-‐related support provided by important figures in their lives. A copy of the student questionnaire can be found in the Appendix.
Focus Groups
The focus groups also measured student attitudes about school and perceptions of self, and were conducted to obtain more detailed, qualitative information to inform quantitative results. Two groups of five students were randomly selected from the pool of children participating in the study and participated in the focus group for approximately forty-‐five minutes. One focus group consisted of all Young Stars participants, and the other focus
11
group consisted of non-‐participants. The two focus group facilitators were native/bilingual Spanish speakers. The focus groups included an icebreaker, setting of ground rules, a facilitated conversation, and a mapping activity. Students spent 15-‐20 minutes discussing the following questions:
• What do you see yourself doing as an adolescent? • What do you see yourself doing as an adult? • How will you achieve your goals?
Students discussed these questions in pairs and then with the larger group. After the conversation, students were instructed to draw a map of their school including all locations they thought were important. In addition, they were instructed to list any words that describe their feelings, experiences and general thoughts about school. The focus group leader modeled what this would look like on the chalkboard, drawing a map of Columbia University to prevent students from merely copying the facilitator’s drawing. Students completed this task individually at their tables while the facilitators monitored their work to ensure that students completed the activity independently.
Parent/Guardian Questionnaires
The parent/guardian questionnaire was administered orally to one parent or guardian of each student in the study. Oral administration was chosen based on generally low levels of education and adult literacy in the community. Questionnaires were administered both at the DREAM Center and through home visits conducted by the research team.
The survey included measures of socio-‐economic status based on several established income proxies that included house construction material, type of bathroom, and type of cooking material. Additional questions included estimations of parent/guardians earnings, employment type, and information on all household contributors to income. Parent/guardians were also asked questions related to their perceptions of the child’s academic abilities and educational aspirations for the child.
Questionnaire information was coded on a scale and included as a discrete, quantitative variable among the independent variables, which permitted researchers to control for socioeconomic status when evaluating grades, attendance, and performance on researcher-‐conducted math and reading assessments. Information on levels of support and encouragement related to academic study and information on perceptions and attitudes toward schools were collected in order to more qualitatively understand the results. A copy of the survey can be found in the Appendix of this report.
Limitations and Challenges
The researchers faced several challenges in both designing and implementing the evaluation. Limitations in staff capacity and public school data (all written records) meant that researchers were not able to access most student data until arrival in Cabarete. In addition, Young Stars participant lists included several inconsistencies (variations in name spelling, missing identifying information), which limited the ability of the research team to select the full sample in advance. These factors meant that a larger than expected portion of dedicated fieldwork time had to be used to refine the sample and collect basic student information from teachers (grades and attendance). Research capacity was ultimately affected, limiting the ability to reach more students, involve more students in focus groups, and administer questionnaires to teachers and DREAM staff.
12
Although the Pearson’s Learning Assessment used to evaluate reading levels is a well-‐recognized, professional, and research-‐based literacy assessment, it may not have been culturally relevant for students in the Dominican Republic. Many of the questions, mostly those related to comprehension, may have been difficult for students to answer as they have not received instruction to respond in the way that US curriculum guides students to do so. This ultimately affected student abilities to answer questions correctly as defined by the reading assessment. As previously noted, it is also a tool developed for educators assessing students in the US, not one made specifically for Latin American or Dominican students, which could affect results. Moreover, the research team prepared the math assessment with limited access to and input from public school teachers, national curriculum, and DREAM staff. This resulted in a lack of concrete knowledge about general benchmarks for student learning in mathematics, which complicated the assessment development process. As a result, many students were unable to answer certain types of math problems, especially towards the end of the test.
Limited fieldwork time and Spanish-‐speaking capacity among research team members resulted in several personnel changes during reading and math assessments. The inconsistency in team members assigned to administer each assessment could have an effect on results including grading practices, inadvertent coaching or student assistance, and differences in explanation of instructions. Opportunities to thoroughly pilot each data collection tool in the field were also limited by time constraints. Lastly, limited space to conduct the assessments resulted in distractions caused by noise and overcrowding. Nevertheless, the research team worked diligently to address any challenges or limitations in order to analyze the data, which produced the results as discussed below.
Results
For the purpose of reporting results, data have been organized by quantitative and qualitative results and by the method of data collection. Throughout the analysis process, the research team cross-‐analyzed the variables to determine the impact of DREAM’s Young Stars program on its participants.
13
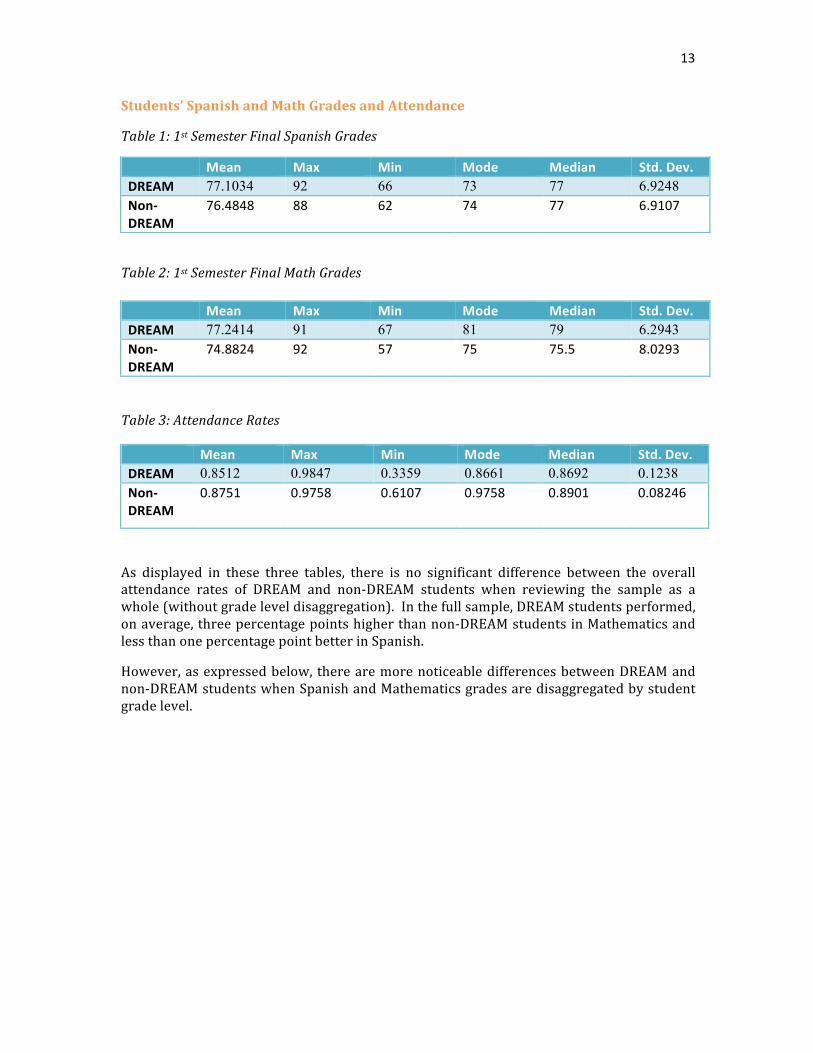
Students’ Spanish and Math Grades and Attendance
Table 1: 1st Semester Final Spanish Grades
Table 2: 1st Semester Final Math Grades
Table 3: Attendance Rates
As displayed in these three tables, there is no significant difference between the overall attendance rates of DREAM and non-‐DREAM students when reviewing the sample as a whole (without grade level disaggregation). In the full sample, DREAM students performed, on average, three percentage points higher than non-‐DREAM students in Mathematics and less than one percentage point better in Spanish.
However, as expressed below, there are more noticeable differences between DREAM and non-‐DREAM students when Spanish and Mathematics grades are disaggregated by student grade level.
Mean Max Min Mode Median Std. Dev. DREAM 77.1034 92 66 73 77 6.9248 Non-‐DREAM
76.4848 88 62 74 77 6.9107
Mean Max Min Mode Median Std. Dev. DREAM 77.2414 91 67 81 79 6.2943 Non-‐DREAM
74.8824 92 57 75 75.5 8.0293
Mean Max Min Mode Median Std. Dev. DREAM 0.8512 0.9847 0.3359 0.8661 0.8692 0.1238 Non-‐DREAM
0.8751 0.9758 0.6107 0.9758 0.8901 0.08246
14
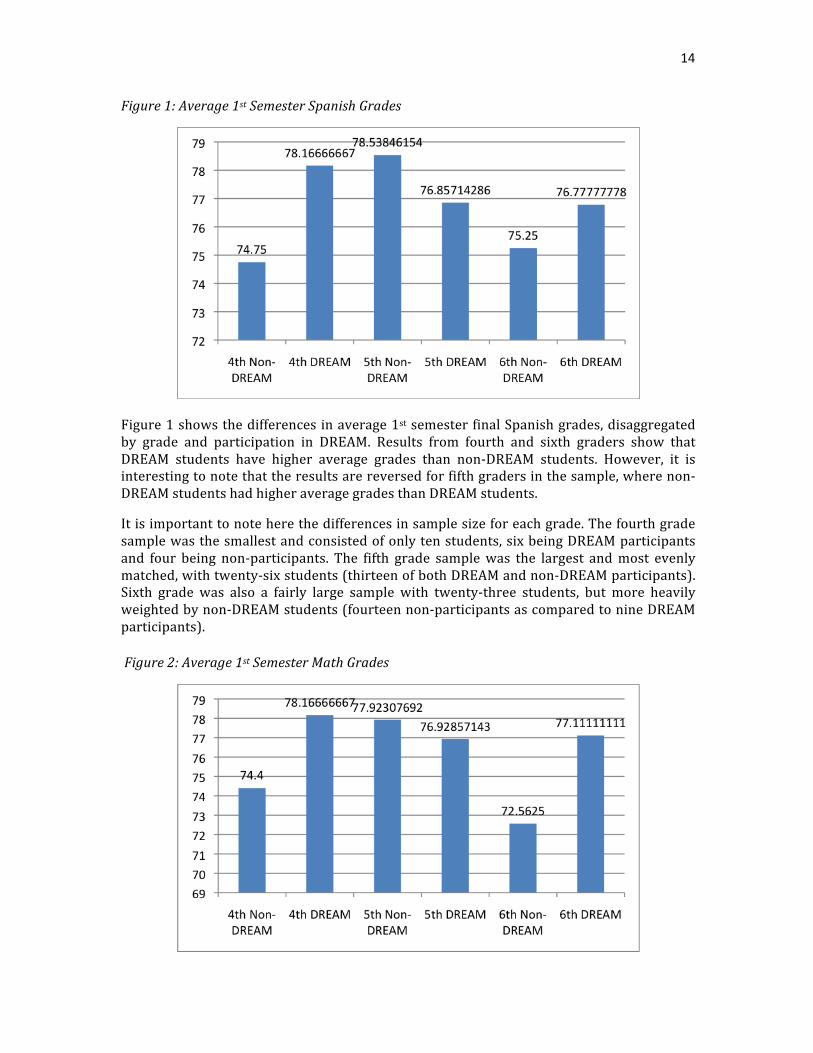
Figure 1: Average 1st Semester Spanish Grades
Figure 1 shows the differences in average 1st semester final Spanish grades, disaggregated by grade and participation in DREAM. Results from fourth and sixth graders show that DREAM students have higher average grades than non-‐DREAM students. However, it is interesting to note that the results are reversed for fifth graders in the sample, where non-‐DREAM students had higher average grades than DREAM students.
It is important to note here the differences in sample size for each grade. The fourth grade sample was the smallest and consisted of only ten students, six being DREAM participants and four being non-‐participants. The fifth grade sample was the largest and most evenly matched, with twenty-‐six students (thirteen of both DREAM and non-‐DREAM participants). Sixth grade was also a fairly large sample with twenty-‐three students, but more heavily weighted by non-‐DREAM students (fourteen non-‐participants as compared to nine DREAM participants). Figure 2: Average 1st Semester Math Grades
15
Figure 2 shows the differences in average 1st semester final math grades disaggregated by grade and participation in DREAM. The mathematics results were similar to reading results, wherein fourth and sixth grade DREAM participants had higher average grades than non-‐participants, whereas among fifth-‐graders the non-‐DREAM participants earned higher average marks.
Reading Evaluation Results
Table 4: Reading Assessment: Fluency Results
Table 5: Reading Assessment: Comprehension Results
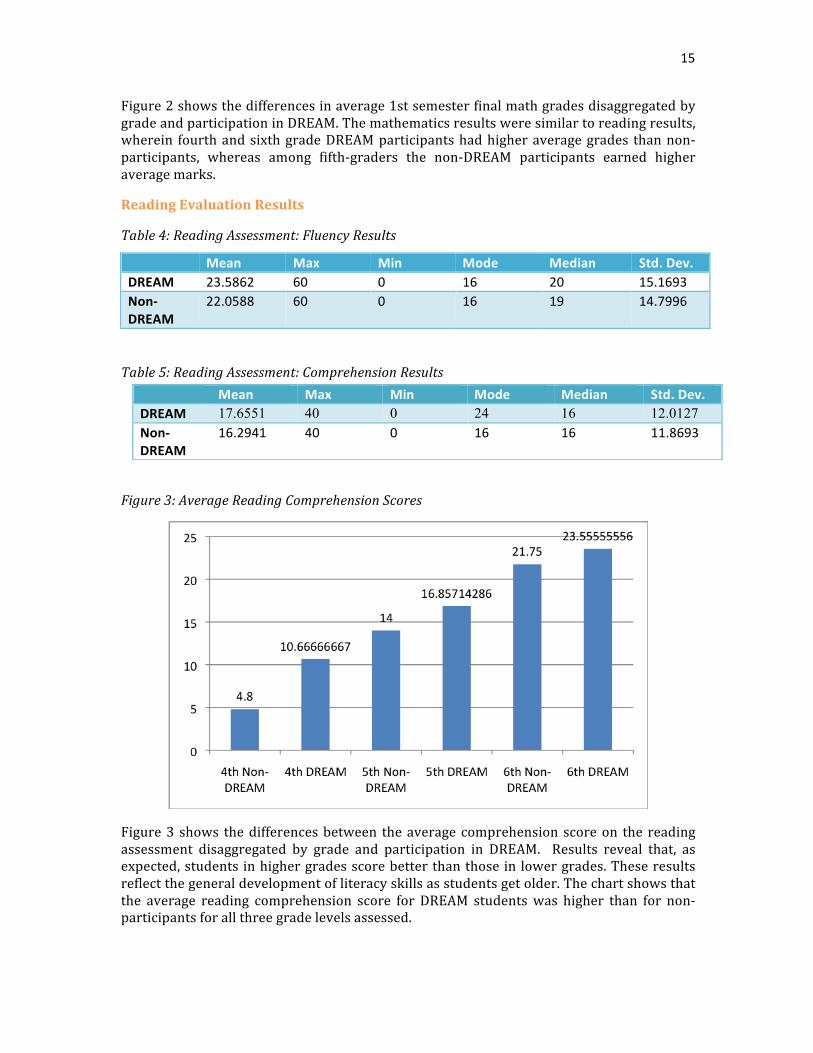
Figure 3: Average Reading Comprehension Scores
Figure 3 shows the differences between the average comprehension score on the reading assessment disaggregated by grade and participation in DREAM. Results reveal that, as expected, students in higher grades score better than those in lower grades. These results reflect the general development of literacy skills as students get older. The chart shows that the average reading comprehension score for DREAM students was higher than for non-‐participants for all three grade levels assessed.
Mean Max Min Mode Median Std. Dev. DREAM 23.5862 60 0 16 20 15.1693 Non-‐DREAM
22.0588 60 0 16 19 14.7996
Mean Max Min Mode Median Std. Dev. DREAM 17.6551 40 0 24 16 12.0127 Non-‐DREAM
16.2941 40 0 16 16 11.8693
16
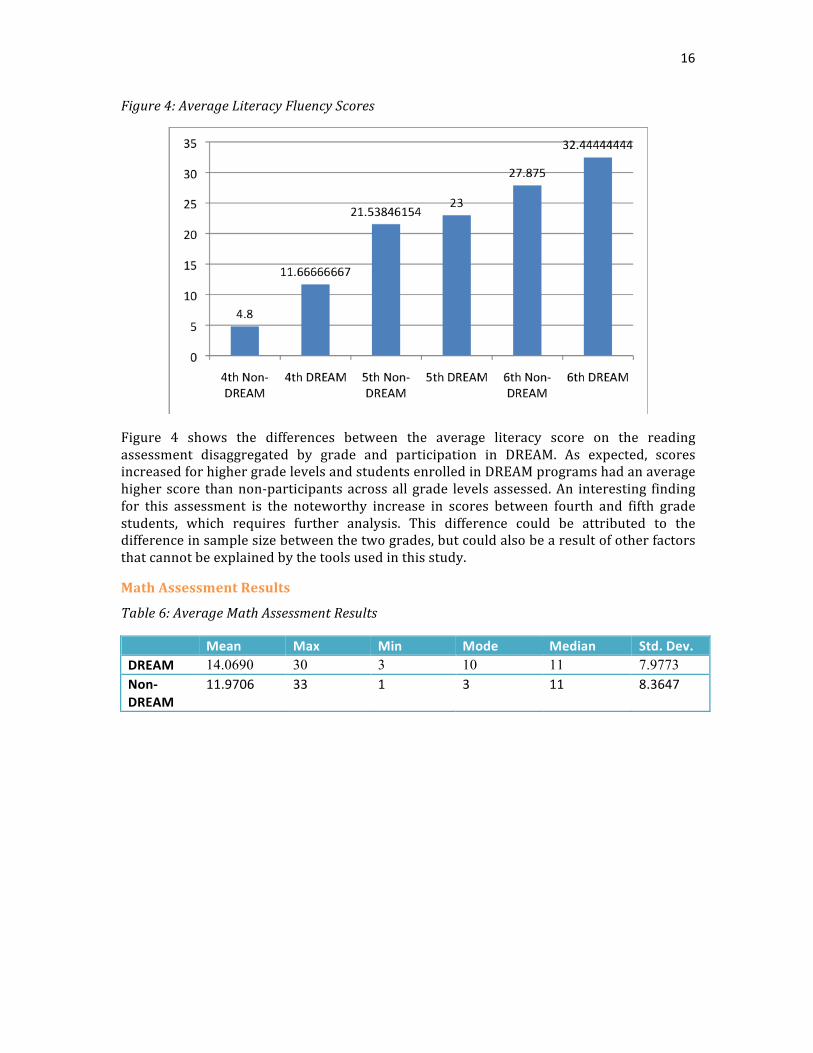
Figure 4: Average Literacy Fluency Scores
Figure 4 shows the differences between the average literacy score on the reading assessment disaggregated by grade and participation in DREAM. As expected, scores increased for higher grade levels and students enrolled in DREAM programs had an average higher score than non-‐participants across all grade levels assessed. An interesting finding for this assessment is the noteworthy increase in scores between fourth and fifth grade students, which requires further analysis. This difference could be attributed to the difference in sample size between the two grades, but could also be a result of other factors that cannot be explained by the tools used in this study.
Math Assessment Results
Table 6: Average Math Assessment Results
Mean Max Min Mode Median Std. Dev. DREAM 14.0690 30 3 10 11 7.9773 Non-‐DREAM
11.9706 33 1 3 11 8.3647
17
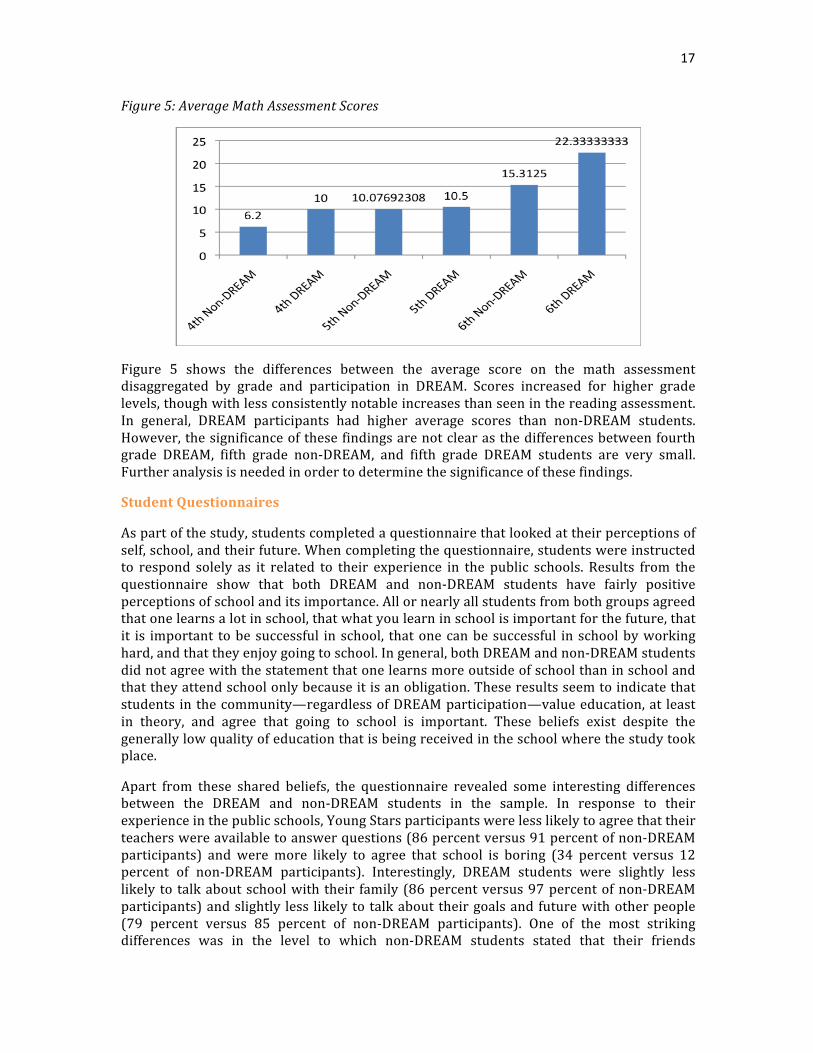
Figure 5: Average Math Assessment Scores
Figure 5 shows the differences between the average score on the math assessment disaggregated by grade and participation in DREAM. Scores increased for higher grade levels, though with less consistently notable increases than seen in the reading assessment. In general, DREAM participants had higher average scores than non-‐DREAM students. However, the significance of these findings are not clear as the differences between fourth grade DREAM, fifth grade non-‐DREAM, and fifth grade DREAM students are very small. Further analysis is needed in order to determine the significance of these findings.
Student Questionnaires
As part of the study, students completed a questionnaire that looked at their perceptions of self, school, and their future. When completing the questionnaire, students were instructed to respond solely as it related to their experience in the public schools. Results from the questionnaire show that both DREAM and non-‐DREAM students have fairly positive perceptions of school and its importance. All or nearly all students from both groups agreed that one learns a lot in school, that what you learn in school is important for the future, that it is important to be successful in school, that one can be successful in school by working hard, and that they enjoy going to school. In general, both DREAM and non-‐DREAM students did not agree with the statement that one learns more outside of school than in school and that they attend school only because it is an obligation. These results seem to indicate that students in the community—regardless of DREAM participation—value education, at least in theory, and agree that going to school is important. These beliefs exist despite the generally low quality of education that is being received in the school where the study took place.
Apart from these shared beliefs, the questionnaire revealed some interesting differences between the DREAM and non-‐DREAM students in the sample. In response to their experience in the public schools, Young Stars participants were less likely to agree that their teachers were available to answer questions (86 percent versus 91 percent of non-‐DREAM participants) and were more likely to agree that school is boring (34 percent versus 12 percent of non-‐DREAM participants). Interestingly, DREAM students were slightly less likely to talk about school with their family (86 percent versus 97 percent of non-‐DREAM participants) and slightly less likely to talk about their goals and future with other people (79 percent versus 85 percent of non-‐DREAM participants). One of the most striking differences was in the level to which non-‐DREAM students stated that their friends
18
influenced their success in school. While nearly all non-‐DREAM participants agreed that their friends influenced their academic success (91 percent), only two-‐thirds of DREAM students agreed (66 percent). Results do not show whether this influence can be categorized as negative or positive (e.g. encouraging absences versus attendance), but does show the differences in the strength of peer influences among the sample population. Additionally, while more than half of non-‐DREAM students felt that schoolwork is difficult for them, only 41 percent of DREAM participants were in agreement. The questionnaire did not reveal whether these differences can be attributed to DREAM programming (e.g. efforts to build self-‐esteem and academic confidence) or whether they could be results of self-‐selection bias (e.g. DREAM students tend to already be more confident, independent, or academically successful). Though the small sample size prevents this information from being generalized to the larger DREAM and non-‐DREAM population, peer influence and academic confidence appear to be two areas of interest for further investigation by the organization.
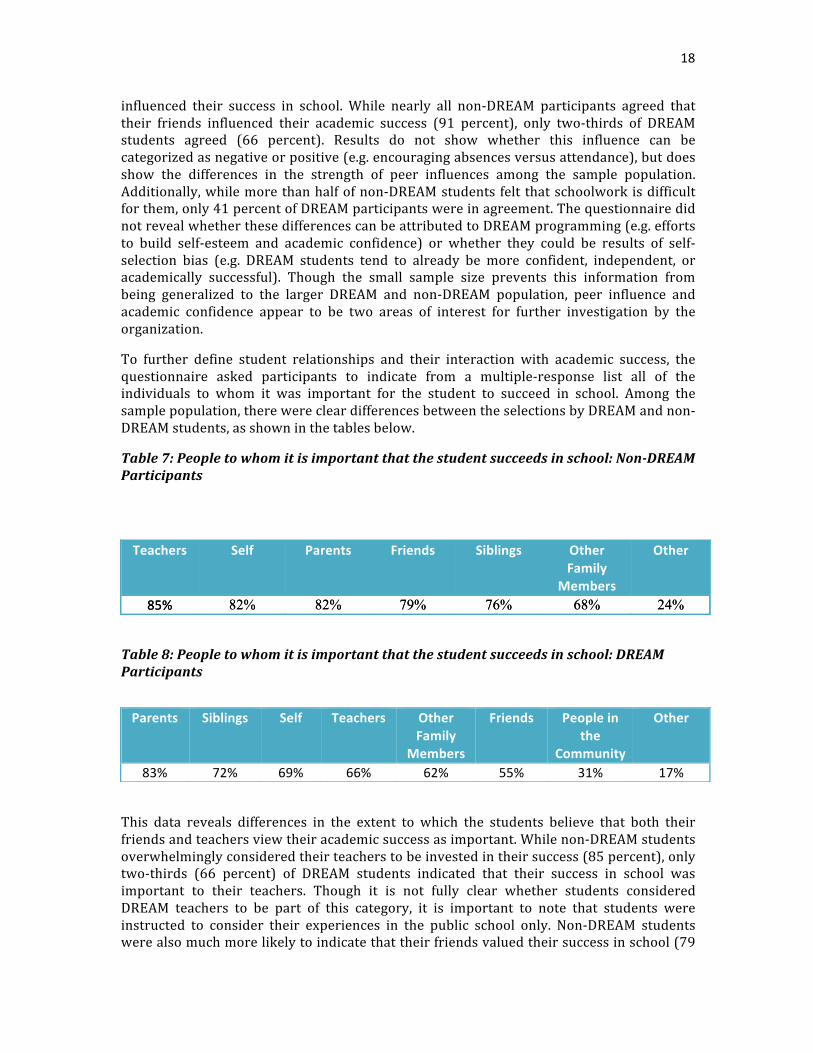
To further define student relationships and their interaction with academic success, the questionnaire asked participants to indicate from a multiple-‐response list all of the individuals to whom it was important for the student to succeed in school. Among the sample population, there were clear differences between the selections by DREAM and non-‐DREAM students, as shown in the tables below.
Table 7: People to whom it is important that the student succeeds in school: Non-‐DREAM Participants
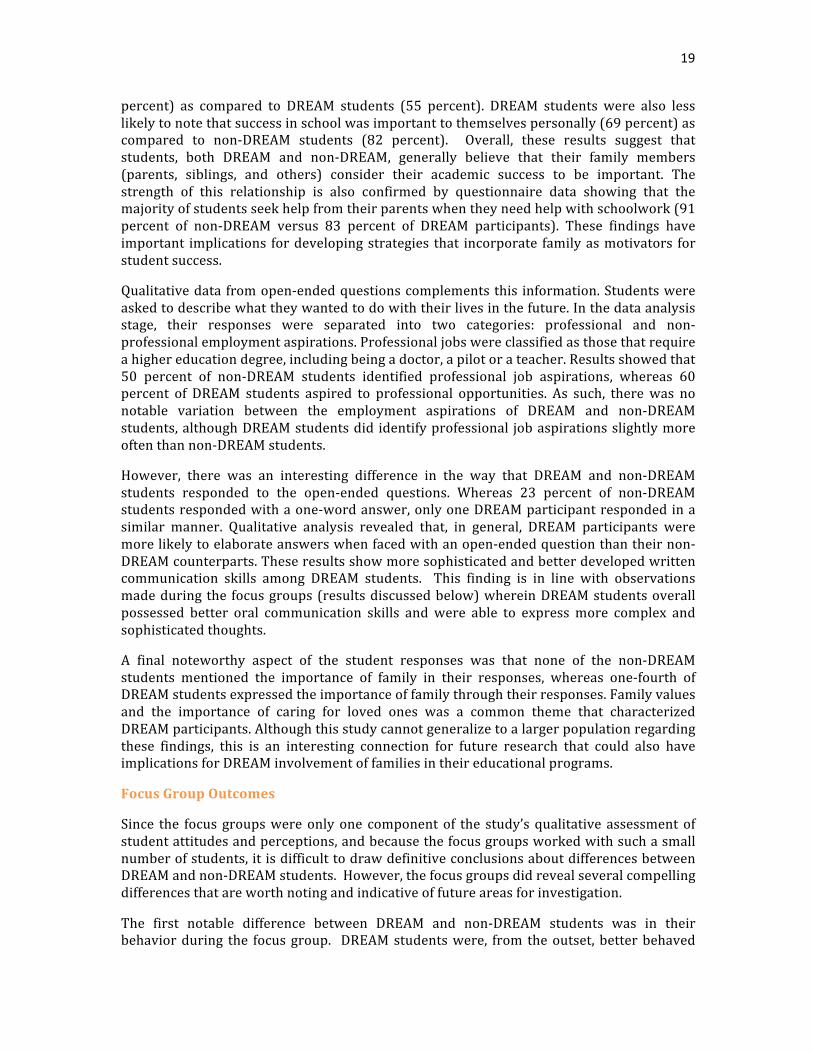
Table 8: People to whom it is important that the student succeeds in school: DREAM Participants
This data reveals differences in the extent to which the students believe that both their friends and teachers view their academic success as important. While non-‐DREAM students overwhelmingly considered their teachers to be invested in their success (85 percent), only two-‐thirds (66 percent) of DREAM students indicated that their success in school was important to their teachers. Though it is not fully clear whether students considered DREAM teachers to be part of this category, it is important to note that students were instructed to consider their experiences in the public school only. Non-‐DREAM students were also much more likely to indicate that their friends valued their success in school (79
Teachers Self Parents Friends Siblings Other Family
Members
Other
85% 82% 82% 79% 76% 68% 24%
Teachers Self Parents Friends Siblings Other Family
Members
Other
85% 82% 82% 79% 76% 68% 24%
Parents Siblings Self Teachers Other Family
Members
Friends People in the
Community
Other
83% 72% 69% 66% 62% 55% 31% 17%
19
percent) as compared to DREAM students (55 percent). DREAM students were also less likely to note that success in school was important to themselves personally (69 percent) as compared to non-‐DREAM students (82 percent). Overall, these results suggest that students, both DREAM and non-‐DREAM, generally believe that their family members (parents, siblings, and others) consider their academic success to be important. The strength of this relationship is also confirmed by questionnaire data showing that the majority of students seek help from their parents when they need help with schoolwork (91 percent of non-‐DREAM versus 83 percent of DREAM participants). These findings have important implications for developing strategies that incorporate family as motivators for student success.
Qualitative data from open-‐ended questions complements this information. Students were asked to describe what they wanted to do with their lives in the future. In the data analysis stage, their responses were separated into two categories: professional and non-‐professional employment aspirations. Professional jobs were classified as those that require a higher education degree, including being a doctor, a pilot or a teacher. Results showed that 50 percent of non-‐DREAM students identified professional job aspirations, whereas 60 percent of DREAM students aspired to professional opportunities. As such, there was no notable variation between the employment aspirations of DREAM and non-‐DREAM students, although DREAM students did identify professional job aspirations slightly more often than non-‐DREAM students.
However, there was an interesting difference in the way that DREAM and non-‐DREAM students responded to the open-‐ended questions. Whereas 23 percent of non-‐DREAM students responded with a one-‐word answer, only one DREAM participant responded in a similar manner. Qualitative analysis revealed that, in general, DREAM participants were more likely to elaborate answers when faced with an open-‐ended question than their non-‐DREAM counterparts. These results show more sophisticated and better developed written communication skills among DREAM students. This finding is in line with observations made during the focus groups (results discussed below) wherein DREAM students overall possessed better oral communication skills and were able to express more complex and sophisticated thoughts.
A final noteworthy aspect of the student responses was that none of the non-‐DREAM students mentioned the importance of family in their responses, whereas one-‐fourth of DREAM students expressed the importance of family through their responses. Family values and the importance of caring for loved ones was a common theme that characterized DREAM participants. Although this study cannot generalize to a larger population regarding these findings, this is an interesting connection for future research that could also have implications for DREAM involvement of families in their educational programs.
Focus Group Outcomes
Since the focus groups were only one component of the study’s qualitative assessment of student attitudes and perceptions, and because the focus groups worked with such a small number of students, it is difficult to draw definitive conclusions about differences between DREAM and non-‐DREAM students. However, the focus groups did reveal several compelling differences that are worth noting and indicative of future areas for investigation.
The first notable difference between DREAM and non-‐DREAM students was in their behavior during the focus group. DREAM students were, from the outset, better behaved
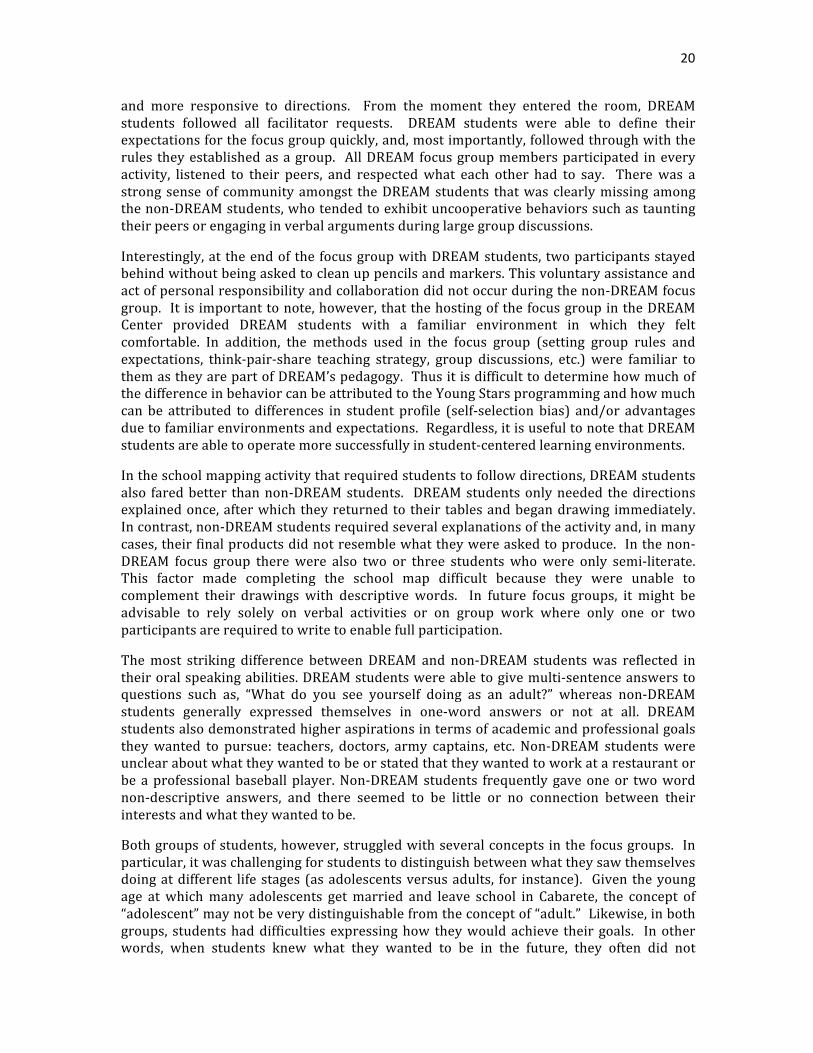
20
and more responsive to directions. From the moment they entered the room, DREAM students followed all facilitator requests. DREAM students were able to define their expectations for the focus group quickly, and, most importantly, followed through with the rules they established as a group. All DREAM focus group members participated in every activity, listened to their peers, and respected what each other had to say. There was a strong sense of community amongst the DREAM students that was clearly missing among the non-‐DREAM students, who tended to exhibit uncooperative behaviors such as taunting their peers or engaging in verbal arguments during large group discussions.
Interestingly, at the end of the focus group with DREAM students, two participants stayed behind without being asked to clean up pencils and markers. This voluntary assistance and act of personal responsibility and collaboration did not occur during the non-‐DREAM focus group. It is important to note, however, that the hosting of the focus group in the DREAM Center provided DREAM students with a familiar environment in which they felt comfortable. In addition, the methods used in the focus group (setting group rules and expectations, think-‐pair-‐share teaching strategy, group discussions, etc.) were familiar to them as they are part of DREAM’s pedagogy. Thus it is difficult to determine how much of the difference in behavior can be attributed to the Young Stars programming and how much can be attributed to differences in student profile (self-‐selection bias) and/or advantages due to familiar environments and expectations. Regardless, it is useful to note that DREAM students are able to operate more successfully in student-‐centered learning environments.
In the school mapping activity that required students to follow directions, DREAM students also fared better than non-‐DREAM students. DREAM students only needed the directions explained once, after which they returned to their tables and began drawing immediately. In contrast, non-‐DREAM students required several explanations of the activity and, in many cases, their final products did not resemble what they were asked to produce. In the non-‐DREAM focus group there were also two or three students who were only semi-‐literate. This factor made completing the school map difficult because they were unable to complement their drawings with descriptive words. In future focus groups, it might be advisable to rely solely on verbal activities or on group work where only one or two participants are required to write to enable full participation.
The most striking difference between DREAM and non-‐DREAM students was reflected in their oral speaking abilities. DREAM students were able to give multi-‐sentence answers to questions such as, “What do you see yourself doing as an adult?” whereas non-‐DREAM students generally expressed themselves in one-‐word answers or not at all. DREAM students also demonstrated higher aspirations in terms of academic and professional goals they wanted to pursue: teachers, doctors, army captains, etc. Non-‐DREAM students were unclear about what they wanted to be or stated that they wanted to work at a restaurant or be a professional baseball player. Non-‐DREAM students frequently gave one or two word non-‐descriptive answers, and there seemed to be little or no connection between their interests and what they wanted to be.
Both groups of students, however, struggled with several concepts in the focus groups. In particular, it was challenging for students to distinguish between what they saw themselves doing at different life stages (as adolescents versus adults, for instance). Given the young age at which many adolescents get married and leave school in Cabarete, the concept of “adolescent” may not be very distinguishable from the concept of “adult.” Likewise, in both groups, students had difficulties expressing how they would achieve their goals. In other words, when students knew what they wanted to be in the future, they often did not
21
understand or were unable to articulate the steps it would take to get there. For instance, DREAM students typically had some idea that they would need to succeed in school to achieve their goals, but were uncertain about what type or how many years of schooling it would require.
Parent/Guardian Questionnaires
Questionnaires were provided to one parent or guardian per student participant in order to collect data to control for socio-‐economic status when reviewing assessment scores, student attendance, and public school grades. At the same time, the questionnaires provided an opportunity to triangulate data and understand parent or guardian perceptions about education and their perceptions of the student’s experience in school and academic abilities.
Results from the questionnaire show that the parents or guardians of DREAM and non-‐DREAM students held similar perceptions on several questions. For example, the majority of respondents agreed that it was important for their child to get good grades, that getting grades equates to better future economic opportunities, that school is discussed at home, and that they support their child in their academic pursuits. Additionally, the majority of respondents agreed that school is the most important location for education. This information has important implications for the role of the school (or educational organization) in involving parents who, although they might value and be committed to their student’s education, do not continue educational efforts in the home.
Despite these similarities, there were several areas in which the responses of parents or guardians of DREAM and non-‐DREAM participants differed. In general, the parents or guardians of DREAM participants were more likely to agree that their child likes to go to school (97 percent versus 85 percent of non-‐DREAM participants) and feels comfortable asking their teachers for help when they need it (97 percent versus 74 percent of non-‐DREAM participants). In addition, the parents or guardians of DREAM participants were more likely to agree that their children had good reading and/or math abilities. The questionnaire does not provide information about whether these results are connected to impacts of DREAM programming or whether they are more descriptive of personal differences among students. However, the generally positive feelings towards education held by all parents studied and the relatively more positive feelings about their child’s academic confidence and abilities held by DREAM parents provide helpful information for organizational programming.
Recommendations
Based on these results, the evaluation team recommends several actions that DREAM can undertake in order to continue strengthening its Young Stars program and provide high quality educational opportunities for at-‐risk Dominican youth.
1. Provide teachers, be they yearlong foreign volunteers or local Dominican staff, with robust literacy training and resources to better serve students. There are a number of skills and abilities required of teachers to be able to adequately teach literacy. This need is especially high for individuals who may not be teaching in their native language. As such, it is crucial for DREAM to provide all staff with continuous professional development (PD) opportunities to ensure that the time that teachers spend with students is used effectively and results in improved academic skills. In particular, given the wide range of abilities encountered amongst DREAM students,
22
it will be crucial to train literacy teachers in guided reading, the use of literacy stations and other differentiated instruction techniques. Although DREAM currently provides literacy professional development opportunities through the Academic Director and other staff, other full-‐time responsibilities of these staff members severely limits organizational capacity to develop a robust, scaffolded PD program that can provide adequate instructional support and produce the necessary student results. Hiring a literacy specialist fully dedicated to this task would enable the organization to provide better staff training, develop a strong literacy curriculum, and create a wealth of literacy resources for more inexperienced staff. All staff members should have the opportunity to become intimately familiar with different literacy techniques and methodologies appropriate for students of varying levels. Continuing to identify local educators for the Young Stars program (perhaps requiring the co-‐teacher model to include one local and one international teacher) would ensure that trainings were a long-‐term investment in staff that would be able to teach for more than one academic year. Finally it is important that teachers are trained to maximize the amount of time their students actually spend reading. DREAM has a vast amount of literary resources that can and should be used during guided, independent or group readings as much as possible. DREAM has put significant work into developing a balanced literacy model and book club curriculum. The key is to ensure that a literacy specialist monitors staff and student involvement in such activities on a regular basis, ensuring that efforts can be amplified effectively.
2. Align Young Stars curriculum with the public school curriculum so that there is more consistency between what students learn in both contexts. Such integration would ensure less of a disconnect between what students learn throughout the school day and would enable students to perform better on national assessments, such as the Pruebas Nacionales. To date, the DREAM Project has not designed a general curriculum or scope and sequence for its programs. This limits the ability to assess what students achieve as a result of their participation in Young Stars. The organization has expressed interest in developing such guidance materials that incorporate national curriculum. It is recommended that development of this material, either internally or externally, be prioritized for the current academic year.
3. Find strategies to help improve Young Stars retention rates to ensure that the
program can have a long lasting impact on the children that it serves. The sample of Young Stars participants included students who had participated several semesters ago, even if they were not participating in the program at the time of the evaluation. DREAM could have an even better impact on the achievement of its students by implementing a strategy that targets retention among students. The organization should reconsider policies that remove students from its programs due to repeated absences or behavior problems with limited intervention. A follow-‐up process for absences and/or additional socio-‐emotional support for behavior problems should be instituted to keep retention of students a top priority. This also ensures that the organization continues to serve the most at-‐risk youth and not only those who are more self-‐motivated, have more involved families, or who have fewer socio-‐emotional or behavior problems. Long-‐term interventions could increase the
23
impact of DREAM programs on participants as compared to non-‐participants, and would facilitate the tracking of students to facilitate their ability to remain active for the entire period for which they are eligible.
4. Promote critical thinking skills activities in Young Stars programming and curricula. Although often overlooked in favor of reading and writing, research shows that the ability to express and discuss complex thoughts orally is the first step in developing critical thinking skills and is a foundation of reading and writing. Thus, DREAM should continue to encourage and place a greater focus on developing these skills within its students. The study results show that DREAM students already have an excellent foundation as compared to non-‐DREAM students, but further bolstering their abilities to express their thoughts and reasoning is critical for future success. Some effective methods to continue practicing or start to integrate include accountable talk and sentence stems. In particular, accountable talk is useful as it links specific sentence structure to levels of Bloom’s taxonomy, thereby imbedding critical thought processes in the very structure of the sentence. It may also be useful for literacy teachers to work on developing a series of questions related to different cognitive skills that can be used in all classes. For example, if students are consistently asked to compare and contrast two characters in a book, they will improve their critical thinking skills as related to comparison.
5. Incorporate goal-‐setting activities in Young Stars curricula. One area in which both DREAM and non-‐DREAM students struggled was in expressing how to achieve their academic and professional goals. This difficulty was evident in responses on the student questionnaire and during the focus groups. Thus, a strong complement to DREAM programming would include dedicated time to helping older students set realistic goals for themselves based on their current needs and future aspirations. The Young Stars program used to include an apprenticeship program in which students intentionally focused on these areas, however this focus has been phased out over the years. This recommendation calls for the re-‐incorporation of such a program to help students with practical needs. Some options include integrating “professional days” in which students learn about the steps to becoming a professional in certain fields, inviting local community members to speak about their occupations, facilitating student interviews with local businesses, and coordinating site visits to expose students to various employment opportunities.
6. Continue to strengthen and maintain regular student assessments and programming impact evaluations. Systematic evaluations are vital in continuously strengthening programs. DREAM currently implements reading assessments at three intervals throughout the Young Stars academic year and tracks student progress using the results. It is recommended that the organization seek ways to formally and informally assess student progress even more regularly throughout the year to further improve student results and help teachers individualize instruction. A once-‐a-‐month evaluation day when all students are given a quick one minute fluency test may be a means by which teachers could better monitor the progress of their students’ reading abilities and modify their instruction to respond to specific needs. As DREAM is currently transitioning to a new reading evaluation system (Reading A-‐Z) and is looking to implement the EGRA assessment for students with emerging literacy, it is critical that all these tools be aligned into a comprehensive assessment package that is easy for teachers to
24
understand and that enables the organization to assess its impact. In addition, DREAM should invest in more extensive training on the administration of reading assessments to ensure consistency and the validity and reliability of results. Staff should undergo at least one full day of training in the Reading A-‐Z assessment and another training (two days) for the EGRA assessment. Teachers should also be better empowered to maintain personal records of assessment results at the same time the results are logged in the organizational M&E system (Salesforce).
7. Strengthen opportunities for family and community involvement to reinforce program goals and enhance student support systems. Results from both the student and parent/guardian questionnaires indicate that parents and family members have the potential to reinforce DREAM programming and contribute to the achievement of its goals. Both students and parents/guardians alike expressed strong appreciation for the importance of school itself and the importance of academic success. DREAM should consider implementing additional programs and activities that capitalize on the family support system and its ability to influence the educational outcomes of students. The organization currently hosts several opportunities for parent involvement including parent volunteers in the Montessori program, parent meetings, workshops, and events. A more systematic structure for parent involvement in the Young Stars program could improve the effectiveness of these isolated activities. Incorporating more regular house visits, keeping parents better informed about academic goals and student progress, empowering parents to personally assist and/or seek help for their students, and defining additional parent volunteer opportunities would be useful additions. Any parent program should be well-‐structured and responsive to parent scheduling needs. The organization’s impact will be enhanced by thoughtful and strategic parent involvement not only in academic areas but especially in the development of life skills, self-‐esteem, and behavior management.
Conclusion
DREAM provides students with a unique and critical opportunity for improving their academic and social skills. Given the fact that many of these students are at-‐risk and have significantly fewer academic, socio-‐emotional, and economic opportunities than their wealthier peers, the importance of an enrichment program such as Young Stars cannot be underestimated.
While the study shows that the organization has had a positive impact on students, there is still great room for growth and improvement. Making a few key changes to areas including training and capacity building, curriculum, assessment, and parent involvement, will increase the potential to further improve the academic skills of students. DREAM should continue to focus on organizational learning through the evaluation of program results in order to identify successful practices and quickly address areas of weakness. It is through such evaluation that DREAM will be best positioned to produce its desired impact along the North Coast of the Dominican Republic.
25
Bibliography
Abadzi, 2009. Instructional time loss in developing countries: concepts, measurement, and implications. World Bank Research Observer, 24 (2), 267-‐290.
EDUCA, 2005. Uso del Tiempo en la Escuela Dominicana. Encuesta EDUCA-‐ GALLUP, Santo Domingo, Dominican Republic.
Ganimian, A.J. (2009). How Much Are Latin American Children Learning? Highlights from the Second Regional Student Achievement Test (SERCE). Partnership for Educational Revitalization in the Americas (PREAL).
Latin America Laboratory for Assessment of the Quality of Education (LLECE). (2008). Student achievement in Latin America and the Caribbean: Results of the Second Regional Comparative and Explanatory Study (SERCE). Santiago, Chile: UNESCO.
PREAL, 2010. Informe de progreso educativo – Republica Dominica. Retrieved from http://www.preal.org/NoticiaDetalleNN.asp?Id_Noticia=561.
UNESCO, 2008. Los aprendizajes de los estudiantes de America Latina y el Caribe -‐ Primer reporte de los resultados del Segundo Estudio Regional Comparativo y
Explicativo. Retrieved from unesdoc.unesco.org/images/0016/001606/160660s.pdf
UNESCO, 2010. World Data on Education – Dominican Republic. Retrieved from http://www.google.com/url?sa=t&rct=j&q=&esrc=s&source=web&cd=1&ved=0CFgQFjAA&url=http%3A%2F%2Fwww.ibe.unesco.org%2Ffileadmin%2Fuser_upload%2FPublications%2FWDE%2F2010%2Fpdf-‐versions%2FDominican_Republic.pdf&ei=DI20T_7nN7Oe6QG0rYHQDw&usg=AFQjCNHB4_HVZCGdXR0jsRHQgz_DOF4VoA
UNICEF, n.d. At a glance: Dominican Republic. Retrieved from www.unicef.org/infobycountry/domrepublic_statistics.html
World Bank. (2010) World Bank Development Indicators: Country Briefs. Online statistics database. Retrieved from: http://web.worldbank.org/WBSITE/EXTERNAL/ COUNTRIES/LACEXT/0,,contentMDK:20338297~pagePK:146736~piPK:146830~theSitePK:258554,00.html.
26
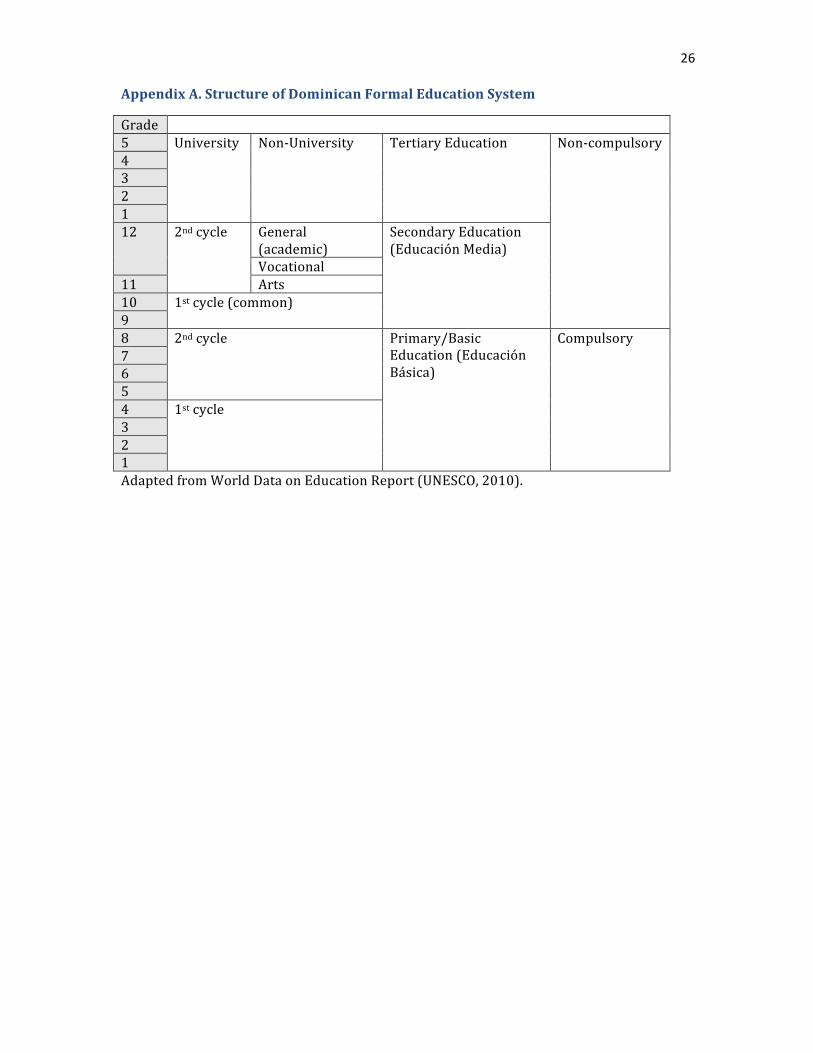
Appendix A. Structure of Dominican Formal Education System
Grade 5 University Non-‐University Tertiary Education Non-‐compulsory 4 3 2 1 12 2nd cycle General
(academic) Secondary Education (Educación Media)
Vocational 11 Arts 10 1st cycle (common) 9 8 2nd cycle Primary/Basic
Education (Educación Básica)
Compulsory 7 6 5 4 1st cycle 3 2 1 Adapted from World Data on Education Report (UNESCO, 2010).
27
Appendix B. Sample Reading Assessment
Copy
right
© P
ears
on E
duca
tion,
Inc.
, or i
ts a
ffilia
tes.
All
Righ
ts R
eser
ved.
Nombre/Fecha
Time ________________________ Minutes:Seconds Level 16, Passage 1
Era un día hermoso en la laguna. Renato y sus amigos jugaban a hacer globos en el agua y a nadar.
—¡A que les gano! —dijo Renato.
Renato era un sapo bebé. Como tenía cola, podía nadar rápido. Pero él quería tener patas como su mamá. Mamá Sapo podía saltar con sus patas.
—¿Qué clase de sapo soy yo, mamá? —decía Renato, enojado—. ¡No tengo patas! ¡Sólo tengo esta cola horrible!
—Ya las tendrás —dijo Mamá Sapo.
Poco después, a Renato le salieron patas y perdió la cola. ¡Claro! Renato se convirtió en un sapo adulto.
Ahora, Renato puede jugar en la tierra y saltar entre las plantas. Está contento. ¡Ya es como su mamá!
53
115
Renato ya es un sapo
ELD11_CD01_SP.indd 13 7/22/11 4:11:10 PM
28
Level 16, Passage 1 Teacher Observation Guide
Copy
right
© P
ears
on E
duca
tion,
Inc.
, or i
ts a
ffilia
tes.
All
Righ
ts R
eser
ved.
124
Rena
to y
a es
un
sapo
18 Renato ya es un sapo
Name/Date Teacher/Grade
To monitor student progress, use two copies of the passage, one for you and one for the student. On your copy of the passage, record the student’s oral reading behaviors and the minutes and seconds required for the student to read the entire passage.
Note expression, phrasing, and miscues.
INTRODUCE THE PASSAGE
Say: Vas a leer en voz alta el cuento “Renato ya es un sapo”. Lee sobre Renato, un renacuajo que ya quiere ser sapo. Descubre lo que puede hacer cuando le crecen las patas. Empieza ahora.
RATE Use the student’s oral reading time to circle the Words Per Minute (WPM) range. After the assessment, determine and record the student’s exact WPM.115 (Total Words Read) ______ total seconds = ______ 60 = ______ WPM
Rate 1 INTERVENTION 2 INSTRUCTIONAL 3 INDEPENDENT 4 ADVANCEDMinutes:Seconds 4:37 or more 4:36–3:18 3:17–1:38 1:37 or less
WPM 24 or fewer 25–34 35–70 71 or more
ACCURACY Circle the number of miscues that are not self-corrected and record the percent of accuracy.
Accuracy 1 INTERVENTION 2 INSTRUCTIONAL 3 INDEPENDENT 4 ADVANCEDNumber of Miscues 8 or more 7 6 5 3–4 2 1 0
Percent of Accuracy 93 or less 94 95 96 97 98 99 100
If the student’s percent of accuracy or rate is below the instructional range, reassess with a lower-level passage to determine an instructional reading level.
Check one: ______ Expression and phrasing are appropriate.
______ Expression and phrasing need attention.
1. MONITOR ORAL READING FLUENCY
ELD11_CD01_TOG_16_P01.indd 124 8/22/11 5:36:24 PM
29
125Copy
right
© P
ears
on E
duca
tion,
Inc.
, or i
ts a
ffilia
tes.
All
Righ
ts R
eser
ved.
Teacher Observation GuideLevel 16, Passage 1
Renato ya es un sapo18
Renato ya es un sapo
Name/Date Teacher/Grade
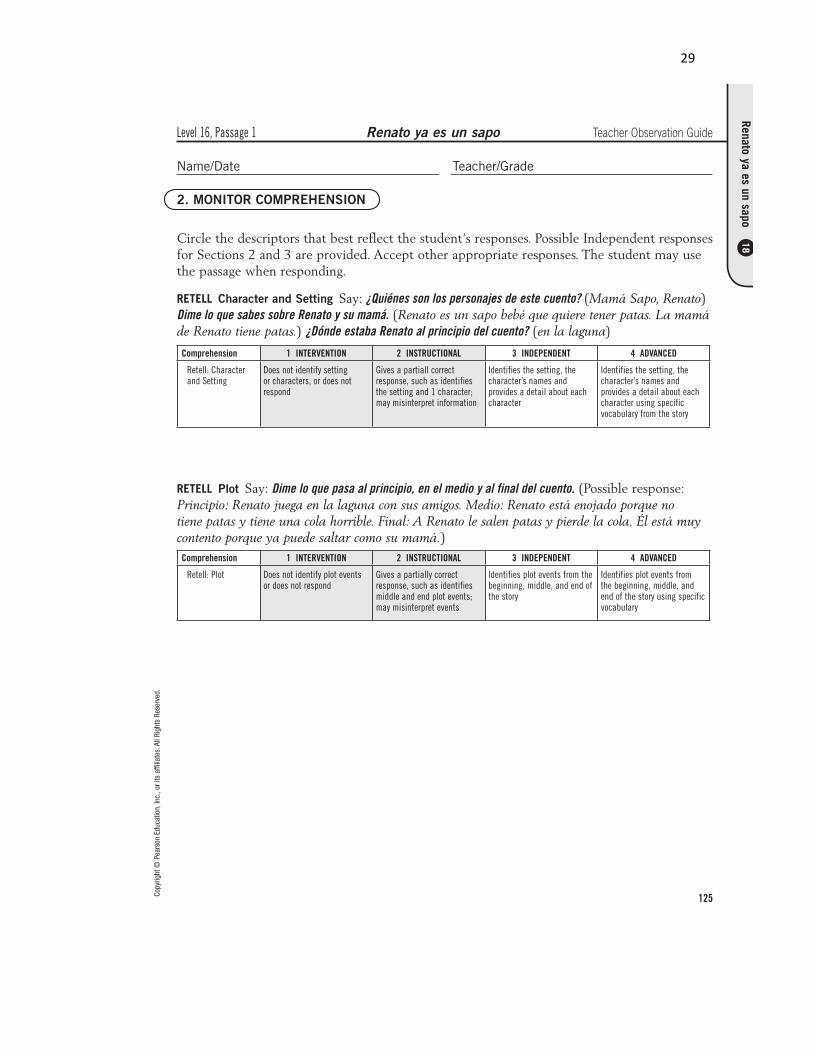
Circle the descriptors that best reflect the student’s responses. Possible Independent responses for Sections 2 and 3 are provided. Accept other appropriate responses. The student may use the passage when responding.
RETELL Character and Setting Say: ¿Quiénes son los personajes de este cuento? (Mamá Sapo, Renato) Dime lo que sabes sobre Renato y su mamá. (Renato es un sapo bebé que quiere tener patas. La mamá de Renato tiene patas.) ¿Dónde estaba Renato al principio del cuento? (en la laguna)
Comprehension 1 INTERVENTION 2 INSTRUCTIONAL 3 INDEPENDENT 4 ADVANCED
Retell: Character and Setting
Does not identify setting or characters, or does not respond
Gives a partiall correct response, such as identifies the setting and 1 character; may misinterpret information
Identifies the setting, the character’s names and provides a detail about each character
Identifies the setting, the character’s names and provides a detail about each character using specific vocabulary from the story
RETELL Plot Say: Dime lo que pasa al principio, en el medio y al final del cuento. (Possible response: Principio: Renato juega en la laguna con sus amigos. Medio: Renato está enojado porque no tiene patas y tiene una cola horrible. Final: A Renato le salen patas y pierde la cola. Él está muy contento porque ya puede saltar como su mamá.)
Comprehension 1 INTERVENTION 2 INSTRUCTIONAL 3 INDEPENDENT 4 ADVANCED
Retell: Plot Does not identify plot events or does not respond
Gives a partially correct response, such as identifies middle and end plot events; may misinterpret events
Identifies plot events from the beginning, middle, and end of the story
Identifies plot events from the beginning, middle, and end of the story using specific vocabulary
2. MONITOR COMPREHENSION
ELD11_CD01_TOG_16_P01.indd 125 8/9/11 12:03:05 PM
30
Level 16, Passage 1 Teacher Observation Guide
Copy
right
© P
ears
on E
duca
tion,
Inc.
, or i
ts a
ffilia
tes.
All
Righ
ts R
eser
ved.
126
Rena
to y
a es
un
sapo
18 Renato ya es un sapo
Name/Date Teacher/Grade
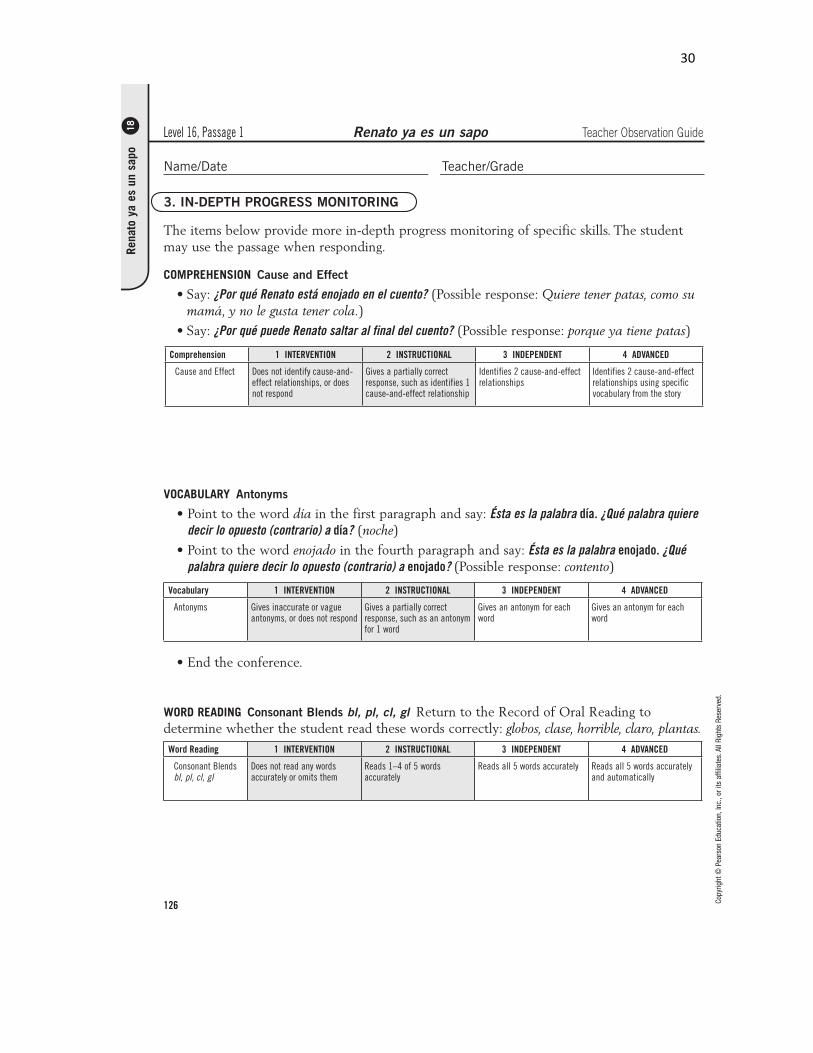
The items below provide more in-depth progress monitoring of specific skills. The student may use the passage when responding.
COMPREHENSION Cause and Effect
Say: ¿Por qué Renato está enojado en el cuento? (Possible response: Quiere tener patas, como su mamá, y no le gusta tener cola.)
Say: ¿Por qué puede Renato saltar al final del cuento? (Possible response: porque ya tiene patas)
Comprehension 1 INTERVENTION 2 INSTRUCTIONAL 3 INDEPENDENT 4 ADVANCED
Cause and Effect Does not identify cause-and-effect relationships, or does not respond
Gives a partially correct response, such as identifies 1 cause-and-effect relationship
Identifies 2 cause-and-effect relationships
Identifies 2 cause-and-effect relationships using specific vocabulary from the story
VOCABULARY Antonyms
Point to the word día in the first paragraph and say: Ésta es la palabra día. ¿Qué palabra quiere decir lo opuesto (contrario) a día? (noche) Point to the word enojado in the fourth paragraph and say: Ésta es la palabra enojado. ¿Qué palabra quiere decir lo opuesto (contrario) a enojado? (Possible response: contento)
Vocabulary 1 INTERVENTION 2 INSTRUCTIONAL 3 INDEPENDENT 4 ADVANCED
Antonyms Gives inaccurate or vague antonyms, or does not respond
Gives a partially correct response, such as an antonym for 1 word
Gives an antonym for each word
Gives an antonym for each word
WORD READING Consonant Blends bl, pl, cl, gl Return to the Record of Oral Reading to determine whether the student read these words correctly: globos, clase, horrible, claro, plantas.
Word Reading 1 INTERVENTION 2 INSTRUCTIONAL 3 INDEPENDENT 4 ADVANCED
Consonant Blends bl, pl, cl, gl
Does not read any words accurately or omits them
Reads 1–4 of 5 words accurately
Reads all 5 words accurately Reads all 5 words accurately and automatically
3. IN-DEPTH PROGRESS MONITORING
ELD11_CD01_TOG_16_P01.indd 126 8/22/11 5:37:26 PM
31
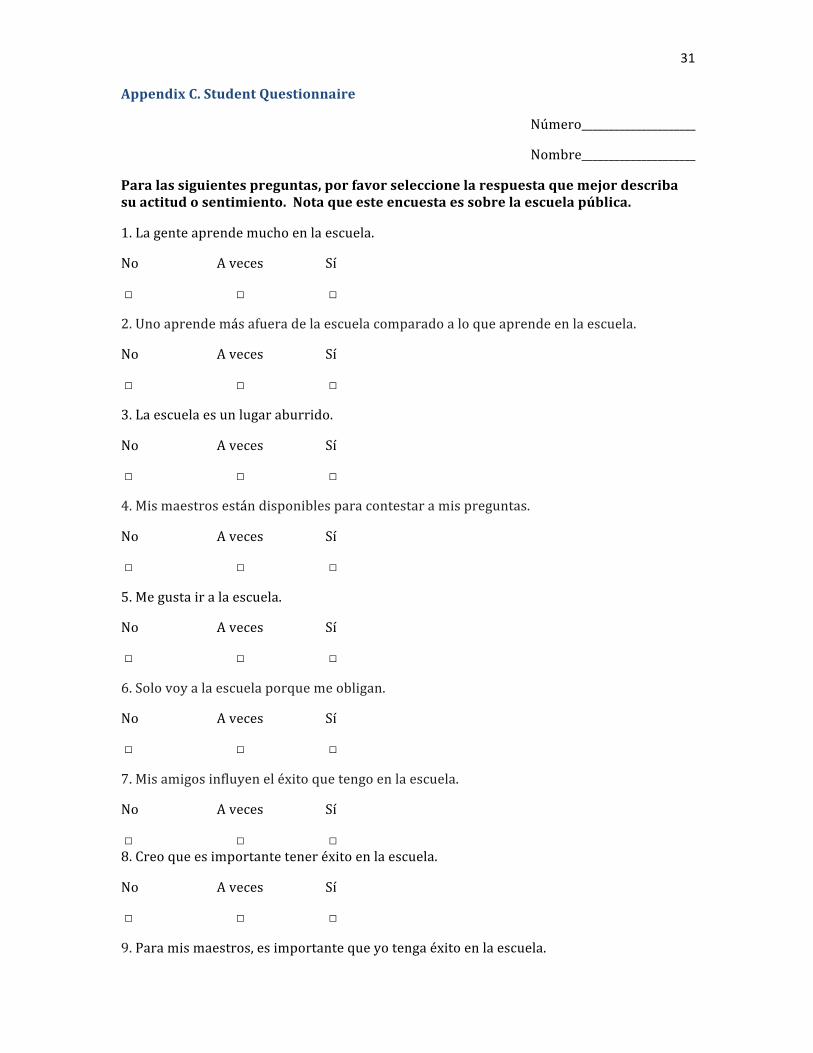
Appendix C. Student Questionnaire
Número_____________________
Nombre_____________________
Para las siguientes preguntas, por favor seleccione la respuesta que mejor describa su actitud o sentimiento. Nota que este encuesta es sobre la escuela pública.
1. La gente aprende mucho en la escuela.
No A veces Sí
□ □ □
2. Uno aprende más afuera de la escuela comparado a lo que aprende en la escuela.
No A veces Sí
□ □ □
3. La escuela es un lugar aburrido.
No A veces Sí
□ □ □
4. Mis maestros están disponibles para contestar a mis preguntas.
No A veces Sí
□ □ □
5. Me gusta ir a la escuela.
No A veces Sí
□ □ □
6. Solo voy a la escuela porque me obligan.
No A veces Sí
□ □ □
7. Mis amigos influyen el éxito que tengo en la escuela.
No A veces Sí
□ □ □ 8. Creo que es importante tener éxito en la escuela.
No A veces Sí
□ □ □
9. Para mis maestros, es importante que yo tenga éxito en la escuela.
32
No A veces Sí
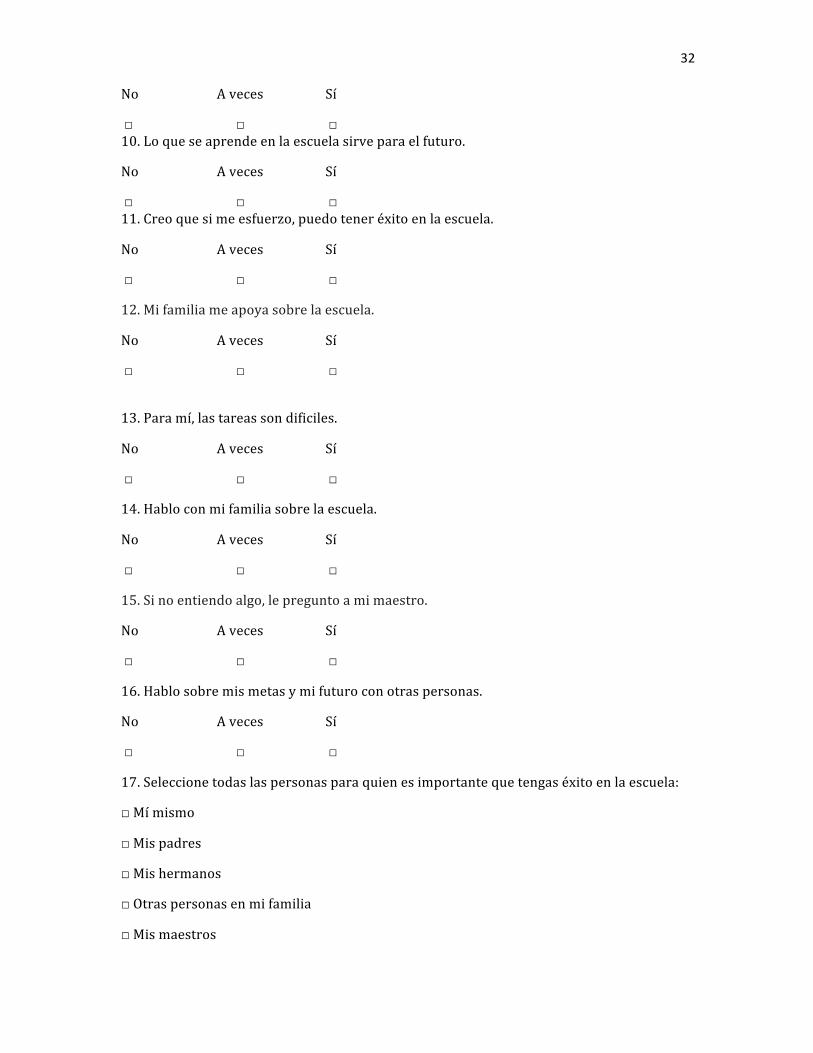
□ □ □ 10. Lo que se aprende en la escuela sirve para el futuro.
No A veces Sí
□ □ □ 11. Creo que si me esfuerzo, puedo tener éxito en la escuela.
No A veces Sí
□ □ □
12. Mi familia me apoya sobre la escuela.
No A veces Sí
□ □ □
13. Para mí, las tareas son dificiles.
No A veces Sí
□ □ □
14. Hablo con mi familia sobre la escuela.
No A veces Sí
□ □ □
15. Si no entiendo algo, le pregunto a mi maestro.
No A veces Sí
□ □ □
16. Hablo sobre mis metas y mi futuro con otras personas.
No A veces Sí
□ □ □
17. Seleccione todas las personas para quien es importante que tengas éxito en la escuela:
□ Mí mismo
□ Mis padres
□ Mis hermanos
□ Otras personas en mi familia
□ Mis maestros
33
□ Mis amigos
□ La gente de mi barrío_____________
□ Otras personas __________________
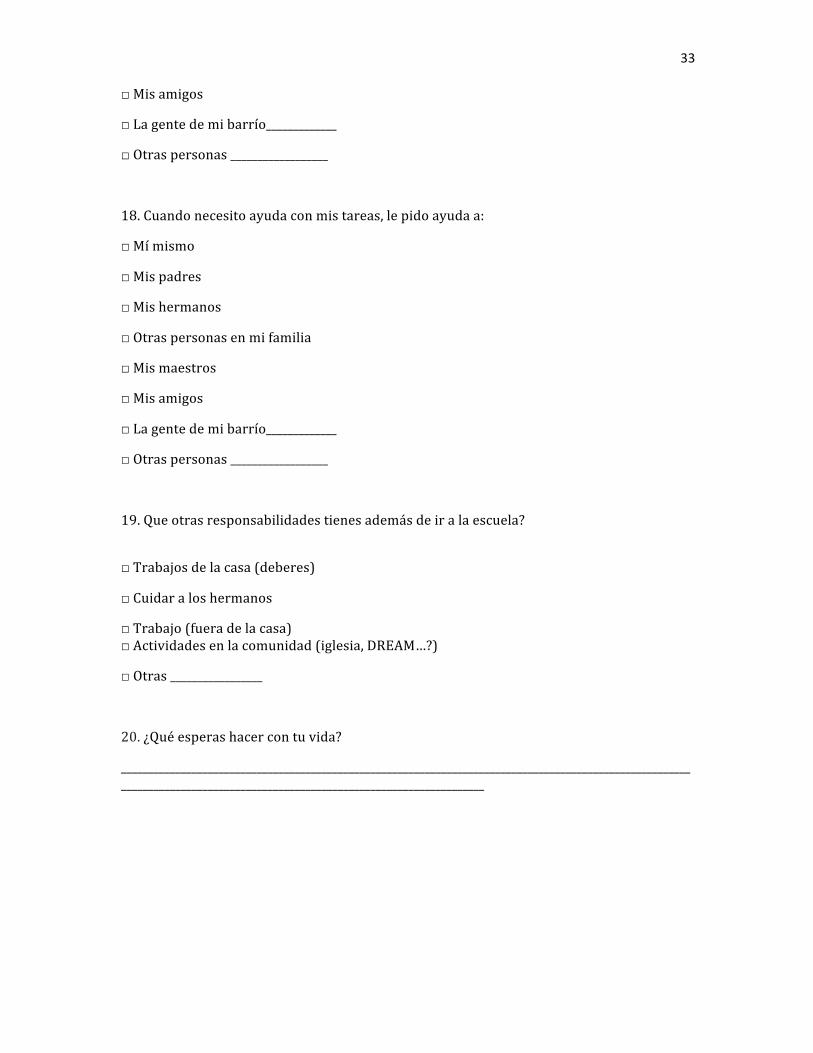
18. Cuando necesito ayuda con mis tareas, le pido ayuda a:
□ Mí mismo
□ Mis padres
□ Mis hermanos
□ Otras personas en mi familia
□ Mis maestros
□ Mis amigos
□ La gente de mi barrío_____________
□ Otras personas __________________
19. Que otras responsabilidades tienes además de ir a la escuela?
□ Trabajos de la casa (deberes)
□ Cuidar a los hermanos
□ Trabajo (fuera de la casa) □ Actividades en la comunidad (iglesia, DREAM…?)
□ Otras _________________
20. ¿Qué esperas hacer con tu vida?
____________________________________________________________________________________________________________________________________________________________________________
34
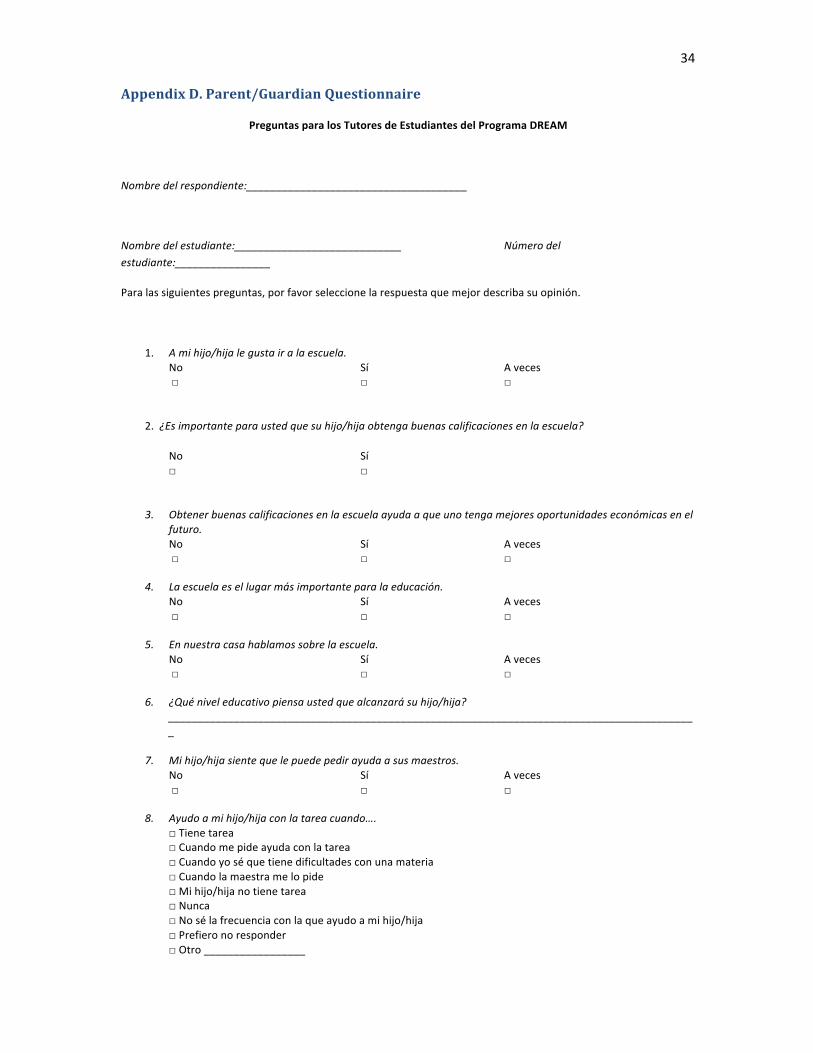
Appendix D. Parent/Guardian Questionnaire
Preguntas para los Tutores de Estudiantes del Programa DREAM
Nombre del respondiente:_____________________________________
Nombre del estudiante:____________________________ Número del estudiante:________________
Para las siguientes preguntas, por favor seleccione la respuesta que mejor describa su opinión.
1. A mi hijo/hija le gusta ir a la escuela. No Sí A veces □ □ □
2. ¿Es importante para usted que su hijo/hija obtenga buenas calificaciones en la escuela?
No Sí □ □
3. Obtener buenas calificaciones en la escuela ayuda a que uno tenga mejores oportunidades económicas en el futuro. No Sí A veces □ □ □
4. La escuela es el lugar más importante para la educación. No Sí A veces □ □ □
5. En nuestra casa hablamos sobre la escuela. No Sí A veces □ □ □
6. ¿Qué nivel educativo piensa usted que alcanzará su hijo/hija? _________________________________________________________________________________________
7. Mi hijo/hija siente que le puede pedir ayuda a sus maestros. No Sí A veces □ □ □
8. Ayudo a mi hijo/hija con la tarea cuando…. □ Tiene tarea □ Cuando me pide ayuda con la tarea □ Cuando yo sé que tiene dificultades con una materia □ Cuando la maestra me lo pide □ Mi hijo/hija no tiene tarea □ Nunca □ No sé la frecuencia con la que ayudo a mi hijo/hija □ Prefiero no responder □ Otro _________________
35
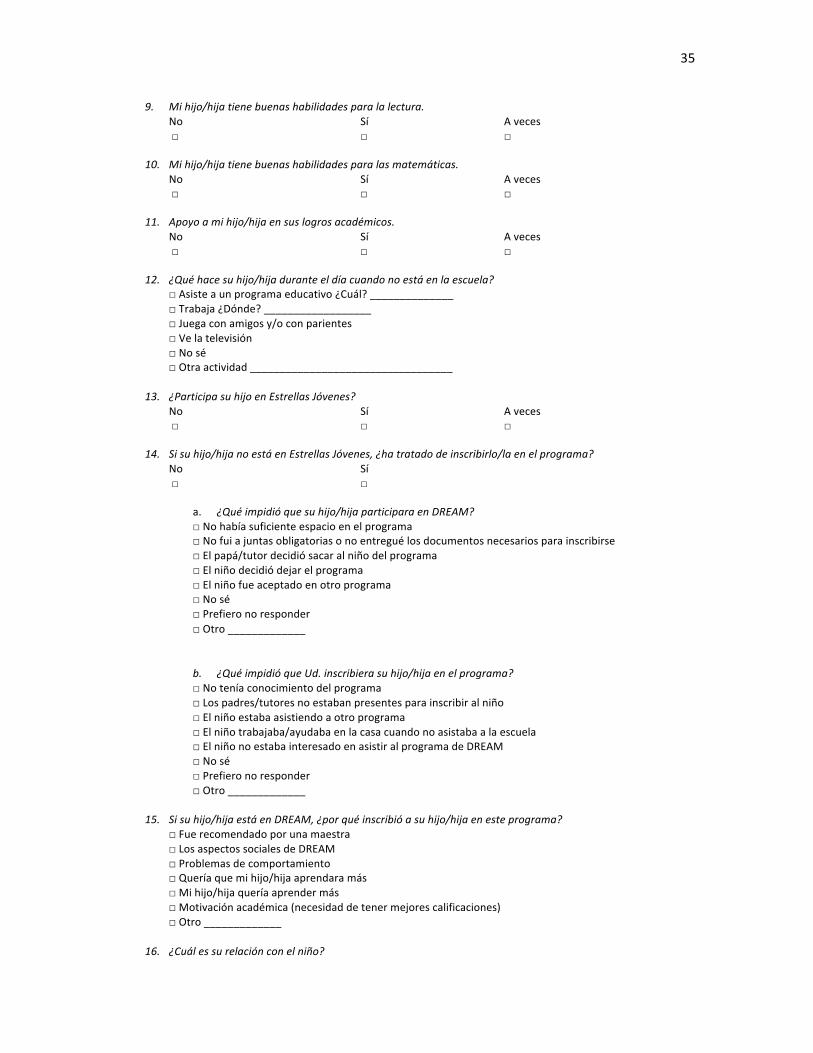
9. Mi hijo/hija tiene buenas habilidades para la lectura.
No Sí A veces □ □ □
10. Mi hijo/hija tiene buenas habilidades para las matemáticas. No Sí A veces □ □ □
11. Apoyo a mi hijo/hija en sus logros académicos. No Sí A veces □ □ □
12. ¿Qué hace su hijo/hija durante el día cuando no está en la escuela? □ Asiste a un programa educativo ¿Cuál? ______________ □ Trabaja ¿Dónde? __________________ □ Juega con amigos y/o con parientes □ Ve la televisión □ No sé □ Otra actividad __________________________________
13. ¿Participa su hijo en Estrellas Jóvenes? No Sí A veces □ □ □
14. Si su hijo/hija no está en Estrellas Jóvenes, ¿ha tratado de inscribirlo/la en el programa? No Sí □ □
a. ¿Qué impidió que su hijo/hija participara en DREAM? □ No había suficiente espacio en el programa □ No fui a juntas obligatorias o no entregué los documentos necesarios para inscribirse □ El papá/tutor decidió sacar al niño del programa □ El niño decidió dejar el programa □ El niño fue aceptado en otro programa □ No sé □ Prefiero no responder □ Otro _____________
b. ¿Qué impidió que Ud. inscribiera su hijo/hija en el programa? □ No tenía conocimiento del programa □ Los padres/tutores no estaban presentes para inscribir al niño □ El niño estaba asistiendo a otro programa □ El niño trabajaba/ayudaba en la casa cuando no asistaba a la escuela □ El niño no estaba interesado en asistir al programa de DREAM □ No sé □ Prefiero no responder □ Otro _____________
15. Si su hijo/hija está en DREAM, ¿por qué inscribió a su hijo/hija en este programa?
□ Fue recomendado por una maestra □ Los aspectos sociales de DREAM □ Problemas de comportamiento □ Quería que mi hijo/hija aprendara más □ Mi hijo/hija quería aprender más □ Motivación académica (necesidad de tener mejores calificaciones) □ Otro _____________
16. ¿Cuál es su relación con el niño?
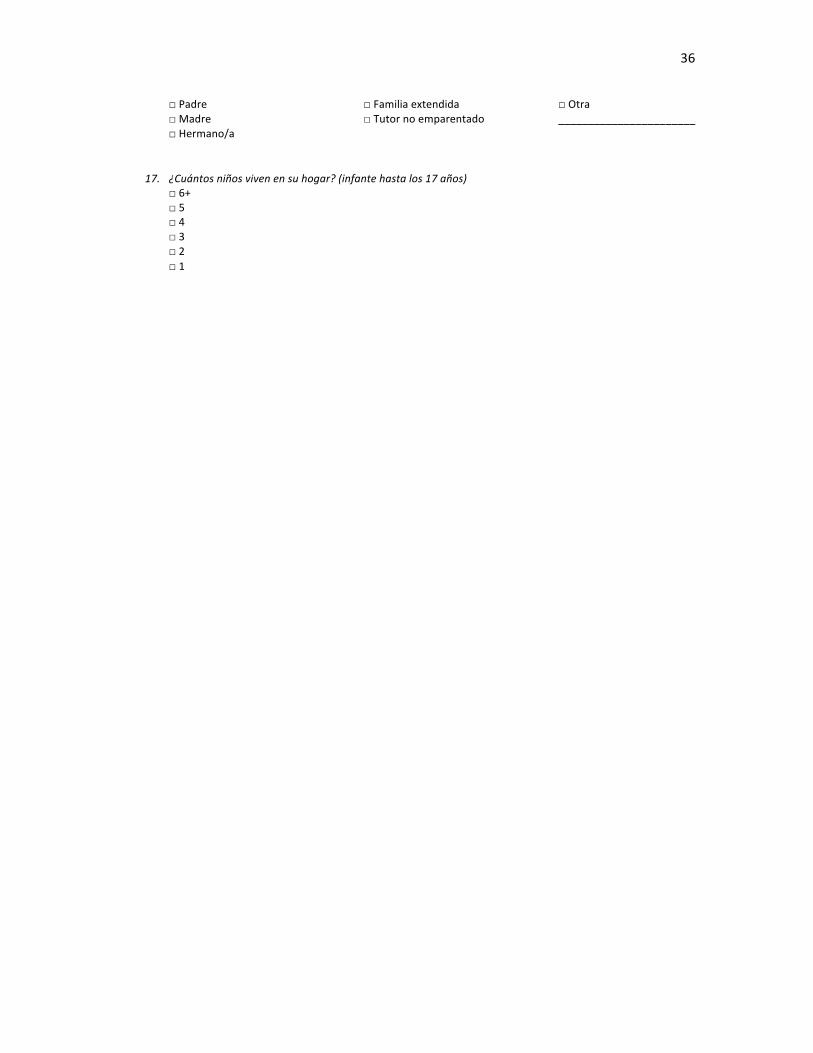
36
□ Padre □ Madre □ Hermano/a
□ Familia extendida □ Tutor no emparentado
□ Otra _______________________
17. ¿Cuántos niños viven en su hogar? (infante hasta los 17 años) □ 6+ □ 5 □ 4 □ 3 □ 2 □ 1
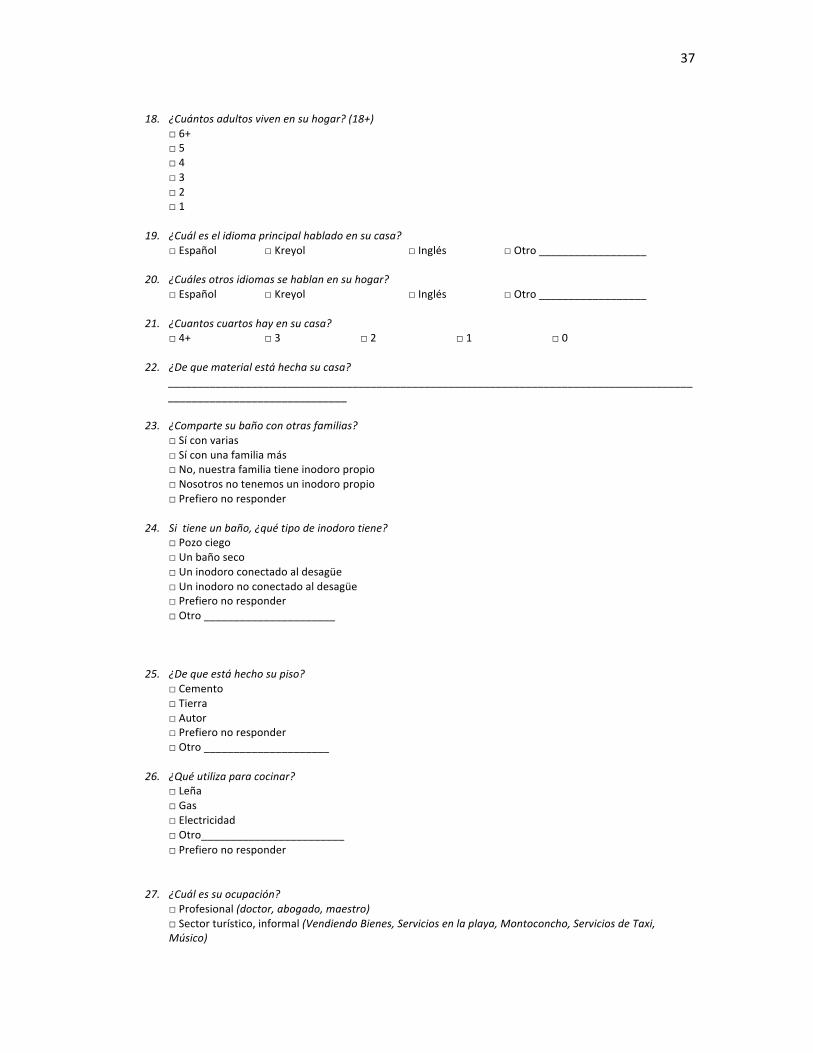
37
18. ¿Cuántos adultos viven en su hogar? (18+)
□ 6+ □ 5 □ 4 □ 3 □ 2 □ 1
19. ¿Cuál es el idioma principal hablado en su casa? □ Español □ Kreyol □ Inglés □ Otro __________________
20. ¿Cuáles otros idiomas se hablan en su hogar? □ Español □ Kreyol □ Inglés □ Otro __________________
21. ¿Cuantos cuartos hay en su casa? □ 4+ □ 3 □ 2 □ 1 □ 0
22. ¿De que material está hecha su casa? ______________________________________________________________________________________________________________________
23. ¿Comparte su baño con otras familias? □ Sí con varias □ Sí con una familia más □ No, nuestra familia tiene inodoro propio □ Nosotros no tenemos un inodoro propio □ Prefiero no responder
24. Si tiene un baño, ¿qué tipo de inodoro tiene? □ Pozo ciego □ Un baño seco □ Un inodoro conectado al desagüe □ Un inodoro no conectado al desagüe □ Prefiero no responder □ Otro ______________________
25. ¿De que está hecho su piso? □ Cemento □ Tierra □ Autor □ Prefiero no responder □ Otro _____________________
26. ¿Qué utiliza para cocinar? □ Leña □ Gas □ Electricidad □ Otro________________________ □ Prefiero no responder
27. ¿Cuál es su ocupación? □ Profesional (doctor, abogado, maestro) □ Sector turístico, informal (Vendiendo Bienes, Servicios en la playa, Montoconcho, Servicios de Taxi, Músico)
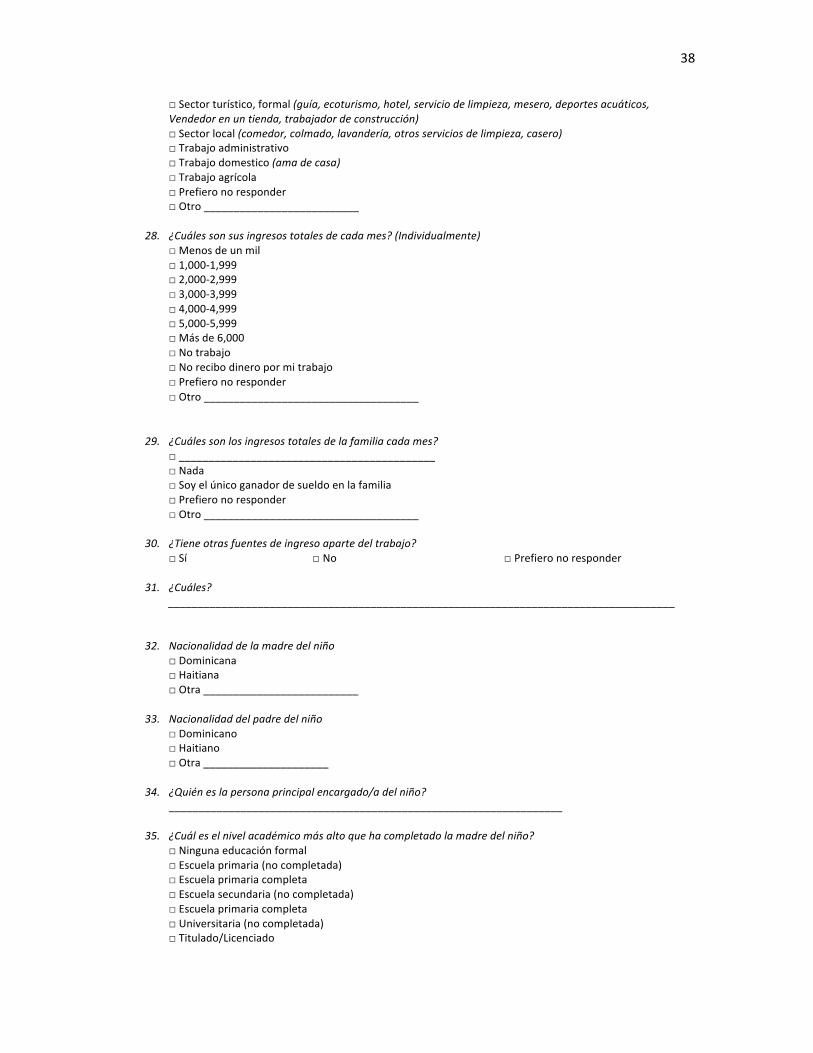
38
□ Sector turístico, formal (guía, ecoturismo, hotel, servicio de limpieza, mesero, deportes acuáticos, Vendedor en un tienda, trabajador de construcción) □ Sector local (comedor, colmado, lavandería, otros servicios de limpieza, casero) □ Trabajo administrativo □ Trabajo domestico (ama de casa) □ Trabajo agrícola □ Prefiero no responder □ Otro __________________________
28. ¿Cuáles son sus ingresos totales de cada mes? (Individualmente) □ Menos de un mil □ 1,000-‐1,999 □ 2,000-‐2,999 □ 3,000-‐3,999 □ 4,000-‐4,999 □ 5,000-‐5,999 □ Más de 6,000 □ No trabajo □ No recibo dinero por mi trabajo □ Prefiero no responder □ Otro ____________________________________
29. ¿Cuáles son los ingresos totales de la familia cada mes? □ ___________________________________________ □ Nada □ Soy el único ganador de sueldo en la familia □ Prefiero no responder □ Otro ____________________________________
30. ¿Tiene otras fuentes de ingreso aparte del trabajo? □ Sí □ No □ Prefiero no responder
31. ¿Cuáles? _____________________________________________________________________________________
32. Nacionalidad de la madre del niño □ Dominicana □ Haitiana □ Otra __________________________
33. Nacionalidad del padre del niño □ Dominicano □ Haitiano □ Otra _____________________
34. ¿Quién es la persona principal encargado/a del niño? __________________________________________________________________
35. ¿Cuál es el nivel académico más alto que ha completado la madre del niño? □ Ninguna educación formal □ Escuela primaria (no completada) □ Escuela primaria completa □ Escuela secundaria (no completada) □ Escuela primaria completa □ Universitaria (no completada) □ Titulado/Licenciado
39
□ Otro ______________________________________
36. ¿Cuál es el nivel académico más alto que ha completado el padre del niño/a? □ Ninguna educación informal □ Escuela primaria (no completada) □ Escuela primaria completa □ Escuela secundaria (no completada) □ Escuela primaria completa □ Universitaria (no completada) □ Titulado/Licenciado □ Otro ______________________________________
37. ¿Cuántas personas en su casa saben leer? □ 6+ □ 5 □ 4 □ 3 □ 2 □ 1 □ 0