Dream Chemistry 21 Chemical Industry of JAPAN 2012 Chemical Industry of JAPAN 2012 Chemical Industry...
15
Chemical Industry of JAPAN 2012
Transcript of Dream Chemistry 21 Chemical Industry of JAPAN 2012 Chemical Industry of JAPAN 2012 Chemical Industry...

Chemical Industry of JAPAN 2012
Sumitomo Rokko Building, 1-4-1 Shinkawa, Chuo-ku, Tokyo 104-0033, Japan
Tel: +81-3-3297-2555 Fax: +81-3-3297-2615URL http://www.nikkakyo.org/
Japan Chemical Industry Association
12.08.DEN1000
Dream Chemistry 21Chemistry and chemical products play an extremely important role
in many aspects of daily living. To raise the awareness and
understanding of such chemical technology and its various
products, the Japan Chemical Industry Association has
established the “Dream Chemistry 21” Organizing Committee. The
“Dream Chemistry 21” campaign aims at promoting the
importance of chemical technology and the usefulness of chemical
products, particularly by appealing to young people’s interest in
the wonders of chemistry and, at the same time, fostering
internationally-active chemists.
The activities of this Committee will include “Dream Chemistry
21” Children’s Chemical Experiment Show, “Dream Chemistry 21”
Weekend Experiment Classroom, Chemical Experiments in the
Classroom program, Chemistry Grand Prix, and support for the
participation in the International Chemistry Olympiad.

Chemistry – Our Life, Our Future
03
05
07
09
11
12
13
15
CONTENTS
GREEN economy&
Sustainability
Automobiles, cellular phones, home electric appliances, clothes…. There are a variety of things around us, most of which are produced by using the “power of chemistry” (that is, chemical reactions and chemical technologies). In fact, the presence of chemistry is much closer to us than many realize. The chemical industry produces diversified products, from those which we directly use, to raw materials that other industries use by utilizing the power of chemistry. The industry, in particular, has helped strengthen advanced technologies and continues to create high-quality, highly original value-added products. The industry also invests a large amount of resources and money for research and development every year to create innovative technologies and products. The constant evolution of Japan’s chemical industrycontinues to support the country’s manufacturing industry, and also helps to contribute to Japan’s international
competitiveness. At the same time, the chemical industry also works to create solutions for more global-scale issues,including issues of climate change, energy, safe food and water consumption, and environmental preservation.The chemical industry is a very important industry which not only supports our daily lives and the development of new industries and economies, but also protects the future of the earth.
Note: Since the chemical industry is vast, with a wide range and scope of work, content may vary depending on different classifications. Therefore, in this brochure, we have conformed to Japan Standard Industrial Classification (second classification : chemical industry). Throughout the brochure, we have provided footnotes regarding these variances. For reference, the chemical industry in wider meaning is the “chemical industry” based on Japan Standard Industrial Classification based on the additions of the “plastic product manufacturing industry” and the “rubber product manufacturing industry”.
Japan’s chemical industry viewed by figures and graphs
1 . Total production (shipments) of chemical industry amounts to 40 trillion yen
2 . Chemical products that meet the needs of various fields
3 . Shipments by prefecture
4 . 880,000 workers are employed
5 . Labor productivity / Working hours
6 . 2.3 trillion yen spent for research and development
7 . Chemical industry ranks 1st in operating profit margin
16
17
19
21
22
23
25
8 . Chemical industry ranks 3rd in capital investment
9 . Japan’s chemical industry ranks 3rd in global chemical shipments
10 . Change of the amount of exports and imports
11 . Outward direct investment amounts to 1.5 trillion yen
12 . Continued progress seen in overseas business activity
13 . Efforts to conserve energy and prevent global warming
★Do you know about Responsible Care?
Chemical industry supports people’s lives and industry
Water
Air
Salt
Oil (Naphtha)
Natural gas
Coal
Ore
Animals and plants
Raw materials Intermediates Primary products
Hydrogen
Nitrogen
Oxygen
Chlorine
Carbonic acid gas
Carbon oxide
Inactive gas
Caustic soda
Soda ash
Hydrochloric acid
Nitric acid
Sulfuric acid
Phosphoric acid
Methanol
Ethanol
Ethylene
Pigments
Industrial gas
Printing ink
Synthetic fiber
Cosmetics
Solvents
Bleach
Oil and fat products
Dyes
Fertilizers
Paints
Synthetic rubbers
Tooth-powder
Fuel
Adhesives
Photo-sensitive chemicals
Surfactants
Agricultural chemicals
Petrochemicals
Plastics
Pharmaceuticals
Sterilizer
Synthetic detergents
Propylene
Butylene
Butadiene
Benzene
Toluene
Xylene
Styrene
Japanese chemical industrysupports to make the future better
Cathode materials(market size: 83.4 billion yen)
Smartphone
Solar power
Tablet PC
LED light
PET bottleCosmetics
Clothes
LED signal
EV
Airplane
Seawater desalination
Wind power generation
FertilizerFlat-panel television
DetergentTooth powderHeat insulatingmaterial
Anode materials(market size: 34.5 billion yen)
Electrolyte solution(market size: 34.4 billion yen)
Separator(market size: 57.5 billion yen)
52%
58%
48%
Japanesecompanies
Japanese companies
92%
Japanese companies
90%
Japanese companies
84%
Japanese companies
Other
Medicine
Responsible Care P25
Source: Ministry of Economy, Trade and Industry [White Paper on Industrial Infrastructure in 2012]
Lithium-ion battery(market size: 779.4 billion yen)
Chemical Indust r y of JAPAN 201201 Chemical Indust r y of JAPAN 2012 02
Chemical Indust r y of JAPAN 20120� Chemical Indust r y of JAPAN 2012 0�
Value of shipments(2010)
40trillion yen
15trillion yen
(¥ billion)Source: Ministry of Economy, Trade and Industry
0
50,000
100,000
150,000
200,000
250,000
54,214 40,14424,114
289,108300,000
Transportationmachinery
Chemical industry including plastic and
rubber products
Foods Total manufacturing
Amount of value added(2010) (¥ billion)
Source: Ministry of Economy, Trade and Industry
Note: Value added = Production amount minus cost for using raw materials, etc. minus domestic consumption tax, etc. minus depreciation cost.
Note: The energy efficiency is calculated by dividing the amount of consumed energy by the amount of production. The lower the value of this number, the more efficient the production is, with a lesser burden on the environment.
0
13,65215,3588,662
90,667100,000
80,000
60,000
40,000
20,000
0
1,000
800
600
400
200
Transportationmachinery
Chemical industry including plastic and
rubber products
Foods Total manufacturing
Global chemical shipments(2010) ($ billion)
Source: American Chemistry Council
903.4
338.2
720.0
228.8
China JapanUnited States Germany
Exports and imports(2011) (¥ billion)
Source: Ministry of Finance
0
7,745
ExportsImports
3 greenhouse gases such as freonStandard Year : 1995CO 2 Standard Year : FY1990
Difference
5,471
2,274
7,269
5,737
1,532
5,780
4,583
1,197
6,925
5,379
1,546
6,7986,098
700
10,000
6,000
8,000
4,000
2,000
2007 2008 2009 2010 2011
Japan’s chemical industry viewed by figures and graphs
Chemical industry contributes to the reduction of GHG Chemical Industry Looks to Minimize Chemical Risks
Aiming at Achieving WSSD 2020 Target
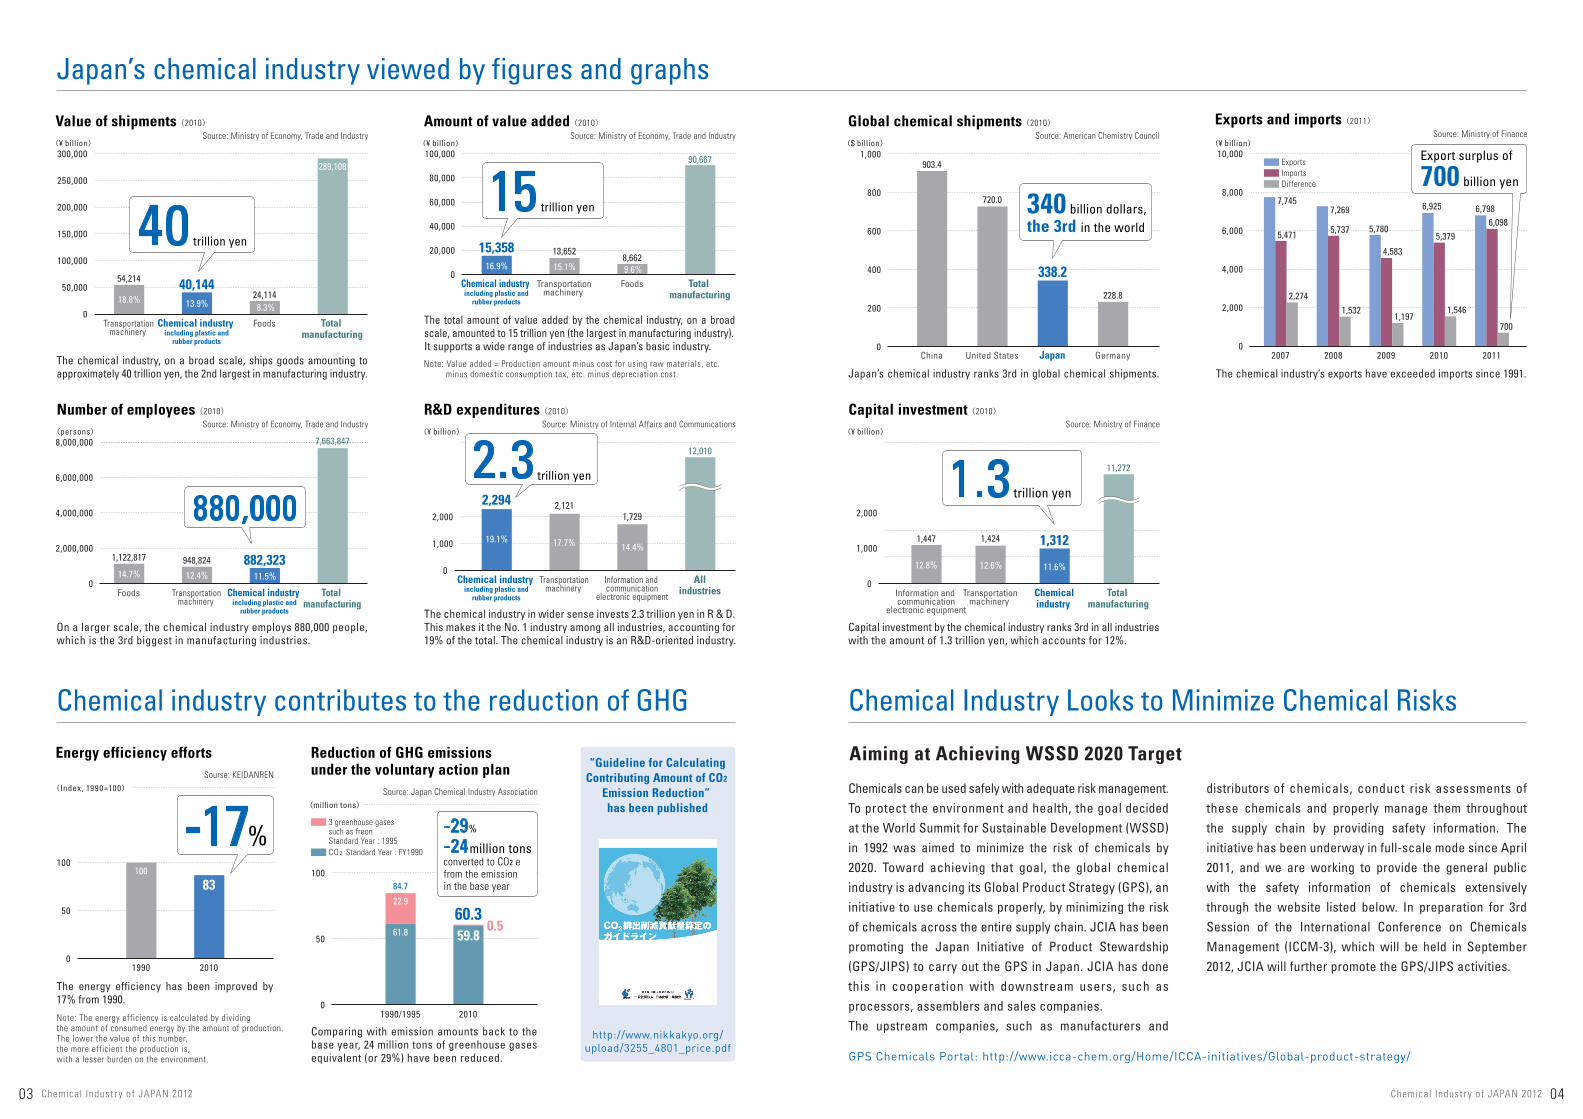
The total amount of value added by the chemical industry, on a broad scale, amounted to 15 trillion yen (the largest in manufacturing industry).It supports a wide range of industries as Japan’s basic industry.
The chemical industry, on a broad scale, ships goods amounting toapproximately 40 trillion yen, the 2nd largest in manufacturing industry.
Energy efficiency efforts
-29%
-24million tons -17%
(Index, 1990=100)Sourse: KEIDANREN
0
100
50
100
83
1990 2010
Reduction of GHG emissionsunder the voluntary action plan “Guideline for Calculating
Contributing Amount of CO2
Emission Reduction” has been published(million tons)
Source: Japan Chemical Industry Association
0
61.8
22.9
84.7
59.80.5
60.3
100
50
20101990/1995
The energy efficiency has been improved by 17% from 1990.
Comparing with emission amounts back to the base year, 24 million tons of greenhouse gases equivalent (or 29%) have been reduced.
The chemical industry’s exports have exceeded imports since 1991.Japan’s chemical industry ranks 3rd in global chemical shipments.
Chemicals can be used safely with adequate risk management.To protect the environment and health, the goal decided at the World Summit for Sustainable Development (WSSD) in 1992 was aimed to minimize the risk of chemicals by 2020. Toward achieving that goal, the global chemical industry is advancing its Global Product Strategy (GPS), an initiative to use chemicals properly, by minimizing the risk of chemicals across the entire supply chain. JCIA has beenpromoting the Japan Initiative of Product Stewardship (GPS/JIPS) to carry out the GPS in Japan. JCIA has done this in cooperation with downstream users, such asprocessors, assemblers and sales companies. The upstream companies, such as manufacturers and
distributors of chemicals, conduct risk assessments of these chemicals and properly manage them throughout the supply chain by providing safety information. The initiative has been underway in full-scale mode since April 2011, and we are working to provide the general public with the safety information of chemicals extensively through the website listed below. In preparation for 3rd Session of the International Conference on Chemicals Management (ICCM-3), which will be held in September 2012, JCIA will further promote the GPS/JIPS activities.
Export surplus of
700 billion yen
340 billion dollars,the 3rd in the world
Number of employees(2010) (persons)
Source: Ministry of Economy, Trade and Industry
0
948,824 882,3231,122,817
7,663,8478,000,000
6,000,000
4,000,000
2,000,000
2,000
1,000
Transportationmachinery
Chemical industry including plastic and
rubber products
Foods Total manufacturing
R&D expenditures(2010)
2.3trillion yen
(¥ billion)Source: Ministry of Internal Affairs and Communications
0
2,1212,2941,729
12,010
Transportationmachinery
Chemical industry including plastic and
rubber products
Information and communication
electronic equipment
Allindustries
The chemical industry in wider sense invests 2.3 trillion yen in R & D. This makes it the No. 1 industry among all industries, accounting for 19% of the total. The chemical industry is an R&D-oriented industry.
On a larger scale, the chemical industry employs 880,000 people, which is the 3rd biggest in manufacturing industries.
880,000
Capital investment(2010) Source: Ministry of Finance
Capital investment by the chemical industry ranks 3rd in all industries with the amount of 1.3 trillion yen, which accounts for 12%.
converted to CO2 efrom the emission in the base year
18.8% 13.9% 8.3%
14.7% 12.4% 11.5%
16.9% 15.1% 9.6%
19.1% 17.7% 14.4%
2,000
1,000
1.3trillion yen
(¥ billion)
0
1,447 1,3121,424
11,272
Information and communication
electronic equipment
Chemicalindustry
Transportationmachinery
Total manufacturing
11.6%12.8% 12.6%

Chemical Indust r y of JAPAN 20120� Chemical Indust r y of JAPAN 2012 0�
(Year)1990 1995 2000 2005 2010
Chemical industry Plastic products Rubber productsChemical industry including plastic and rubber products Foods Petroleum & coal productsIron & steel Non-ferrous metals & products Fabricated metal productsIndustrial machinery General-purpose machinery Production machinery Business oriented machinery Electrical machinery Information and communication electronic equipment Electronic parts and devices Transportation machinery OthersTotal manufacturing
(Source) Ministry of Economy, Trade and Industry [Census of Manufactures] (Note) 1. Statistics of facilities with more than four employees.
2. Electrical machinery was divided into electrical machinery, information and communication electronic equipment, and electronic parts and devices in 2002.Industrial machinery was divided into general-purpose machinery, production machinery, and business oriented machinery in 2008.
3. Because "other revenues" have been added to the amount of total shipment since the survey conducted in 2007, the total shipment amount cannot be compared with that in 2006.
¥ bil l ion
¥ bil l ion
(Source) Ministry of Economy, Trade and Industry [Census of Manufactures]
3,029(1.0%)
6,873(2.4%)
8,911(3.1%)
10,100(3.5%)
(¥ billion)
0
10,000
20,000
30,000
40,000
50,000
60,000
70,000
60,00050,00040,00030,00020,00010,0000
Indus tr y
year Every 5th year Recent three years1990
23,50310,466
3,65637,62422,748
8,29818,269
7,82218,57433,225
---
54,529--
46,85875,427
323,373
1995
23,36310,530
3,27537,16824,117
7,63514,073
6,49617,64629,884
---
54,831--
44,21569,965
306,030
2000
23,76210,486
3,10737,35623,888
9,43411,927
6,19115,14329,972
---
59,449--
44,36762,752
300,478
2005
25,02710,906
3,09939,03222,67813,42916,896
6,71214,01631,211
---
18,81211,53418,26554,00048,760
295,346
2008
28,13112,074
3,48843,69224,94214,00624,33210,48015,149
-12,54119,133
8,57416,83814,48120,56063,76747,084
335,579
2009
24,27610,057
2,64936,98224,44810,48715,988
6,94012,427
-9,849
12,0157,068
13,71311,45714,88947,18741,810
265,259
26,21210,903
3,02940,14424,11414,99218,146
8,91112,292
-10,10013,646
6,87315,12012,58516,58054,21441,391
289,108
9.1%3.8%1.0%
13.9%8.3%5.2%6.3%3.1%4.3%
-3.5%4.7%2.4%5.2%4.4%5.7%
18.8%14.3%
100.0%
2010
1Shipment value of chemical industry in manufacturing industries in 2010
Trend in shipment value
Rubber products
10,903(3.8%)Plastic products
40,144(13.9%)Chemical industry
including plastic andrubber products
26,212(9.1%)Chemical industry
Business orientedmachinery
Non-ferrous metals& products
General-purposemachinery
12,292(4.3%)Fabricated metal products
12,585(4.4%)Information and communicationelectronic equipment
13,646(4.7%)Production machinery
14,992(5.2%)Petroleum & coal products
15,120(5.2%)Electrical machinery
16,580(5.7%)Electronic parts and devices
18,146(6.3%)Iron & steel
24,114(8.3%)Foods
54,214(18.8%)Transportation machinery
Chemical industry 9.1%
Plastic products3.8% 1%
Chemical industry's total shipment value in 2010 amounted to 40 trillion yen, accounting for 13.9% of entire manufacturing industry.
Total production (shipments) of chemical industry amounts to 40 trillion yen
Rubber products
Transportation machinery
Electrical machinery
Electrical machinery
Electronic parts and devices
Industrial machinery
Business oriented machinery
Production machinery
General-purpose machinery
Fabricated metal products
Non-ferrous metals & products
Petroleum & coal products
Foods Chemical industry
Plastic products
Rubber products
Chemical industry including plastic andrubber products
Iron & steel Information and communication electronic equipment

Chemical Indust r y of JAPAN 20120� Chemical Indust r y of JAPAN 2012 0�
%
(¥ billion)(%)
(Year)
100
90
80
70
60
50
40
30
20
10
01990 1995 2000 2005 2008 2009 2010
Indus tr y
year Every 5th year Recent three years200920082005200019951990 2010
Inorganicchemicals
Organicchemicals
Total26,212in 2010
Chemical fibers
End products
FertilizersInorganic chemicalsOrganic chemicals
▲
Basic petrochemicals
▲
Aliphatic intermediates
▲
Cyclic intermediates, dyestuff, pigment
▲
Plastics
▲
Synthetic rubbers
▲
Other organic chemicals Chemical fibers End products
▲
Oil and fats, soap, detergents, surfactants
▲
Paints
▲
Drugs & medicines
▲
Agricultural chemicals
▲
Cosmetics, tooth-powder, other cosmetics
▲
Gelatins & adhesives
▲
Photo-sensitized materials
▲
Other chemical end productsChemical industry
Chemical industry Plastic products Rubber products Chemical industry in a broad sense(including palstic and rubber products)
(Source) Ministry of Economy, Trade and Industry [Census of Manufactures](Note) 1. Statistics of facilities with more than four employees.
2. Chemical fibers have been moved to textile industry since 2008.
1.45.9
37.85.14.56.9
15.42.33.64.4
50.44.14.9
21.91.65.91.04.16.9
100
62.527.8
9.7
100
1.46.4
34.02.65.56.9
14.01.73.33.8
54.44.04.6
25.71.66.41.04.66.6
100
62.928.3
8.8
100
1.26.1
35.02.97.16.1
13.61.53.83.1
54.63.54.1
27.01.46.01.04.47.2
100
63.628.1
8.3
100
1.16.4
37.76.36.17.6
11.02.04.71.8
53.04.13.7
28.01.15.61.02.57.0
100
64.127.9
7.9
100
1.27.8
42.17.47.46.9
12.82.15.5-
48.93.53.9
25.11.15.21.02.07.1
100
64.427.6
8.0
100
1.47.2
36.64.45.16.6
12.82.05.6-
54.94.03.8
30.51.15.81.11.76.8
100
65.627.2
7.2
100
1.26.9
39.76.65.96.8
13.21.65.5-
52.24.24.0
28.11.05.31.21.76.8
100
65.327.2
7.5
100
Indus tr y
Major indices Composition(%)
Value ofshipments
FertilizersInorganic chemicalsOrganic chemicals
▲Basic petrochemicals
▲
Aliphatic intermediates
▲
Cyclic intermediates, dyestuff, pigment
▲
Plastics
▲
Synthetic rubbers
▲
Other organic chemicals End products
▲
Oil and fats, soap, detergents, surfactants
▲
Paints
▲
Drugs & medicines
▲
Agricultural chemicals
▲
Cosmetics, tooth-powder, other cosmetics
▲
Gelatins & adhesives
▲
Photo-sensitized materials
▲
Other chemical end productsChemical industry
Chemical industry Plastic products Rubber products Chemical industry in a broad sense(including palstic and rubber products)
Number ofestablishments
150816740
1171
151228
16263
3,036269392822
67440144
57845
4,742
4,74214,085
2,782
21,609
Number ofemployees
4,21933,15587,797
4,06210,27815,08732,492
5,06620,812
219,79715,16417,77296,144
4,24732,009
6,30210,72337,436
344,968
344,968420,179117,176
882,323
Value ofshipments(¥ billion)
3041,811
10,4191,7381,5521,7923,468
4201,448
13,6791,1011,0397,356
2661,385
312446
1,77526,212
26,21210,903
3,029
40,144
Amount ofvalue added
(¥ billion)
79622
2,758174612495944138394
6,721499400
4,043106816120113624
10,180
10,1804,0211,158
15,358
Number ofestablishments
3.217.215.6
0.21.53.24.80.35.5
64.05.78.3
17.31.49.33.01.2
17.8100.0
21.965.212.9
100.0
Number ofemployees
1.29.6
25.51.23.04.49.41.56.0
63.74.45.2
27.91.29.31.83.1
10.9100.0
39.147.613.3
100.0
1.26.9
39.76.65.96.8
13.21.65.5
52.24.24.0
28.11.05.31.21.76.8
100.0
65.327.2
7.5
100.0
Amount ofvalue added
0.86.1
27.11.76.04.99.31.43.9
66.04.93.9
39.71.08.01.21.16.1
100.0
66.326.2
7.5
100.0
Trend of shipments composition in chemical industry
2 Composition of chemical products shipped in 2010
Major chemical industry indices with breakdown by product in 2010
50.4
4.4
37.8
5.9
1.4
54.4
3.8
34.0
6.4
1.4
54.6
3.1
35.0
6.1
1.2
53.0
1.8
37.7
6.4
1.1
48.9
42.1
7.8
54.9
36.6
7.2
1.2
52.2 13,679
39.7
6.9
1.2304
1,811
10,419
1.4
(Source) Ministry of Economy, Trade and Industry [Census of Manufactures](Note) Statistics of facilities with more than four employees.
39.7%
Organicchemicals
52.2%
Endproducts
6.9%
Inorganicchemicals
1.2%
Fertilizers
Basic petrochemicals 6.6%
Aliphatic intermediates 5.9%
Plastics 13.2%
Synthetic rubbers 1.6%
Other organic chemicals 5.5%Oil and fats, soap, detergents, surfactants 4.2%
Drugs & medicines 28.1%
Agricultural chemicals 1.0%
5.3%
Gelatins & adhesives 1.2%
Photo-sensitized materials 1.7%
Other chemical end products 6.8%
Paints 4.0%
6.8%Cyclic intermediates, dyestuff, pigment
Chemical products that meet the needs of various fields
Cosmetics,tooth-powder, other cosmetics
Fertilizers

Chemical Indust r y of JAPAN 20120� Chemical Indust r y of JAPAN 2012 10
Chiba
Osaka
Kanagawa
Hyogo
Yamaguchi
Saitama
Shizuoka
Ibaraki
Aichi
Okayama
Mie
Shiga
Tochigi
Tokushima
Gunma
Fukushima
Niigata
Oita
Fukuoka
Toyama
Ehime
Tokyo
Gifu
Hiroshima
Wakayama
Fukui
Kyoto
Kumamoto
Hokkaido
Miyazaki
Yamagata
Saga
Kagawa
Nagano
Ishikawa
Nara
Akita
Miyagi
Iwate
Yamanashi
Aomori
Kagoshima
Shimane
Nagasaki
Okinawa
Kochi
Tottori
(Source) Ministry of Economy, Trade and Industry [Census of Manufactures](Note) Statistics of facilities with more than four employees.
Hokkaido
Iwate
PrefectureValue of
shipments(¥100 million)
27,395
20,592
19,332
16,273
15,043
14,526
14,039
13,064
11,521
11,380
10,505
8,792
6,637
5,201
5,173
4,874
4,870
4,520
4,452
4,437
4,231
3,962
3,563
3,461
109.1%
104.6%
113.9%
113.8%
102.1%
101.7%
96.5%
114.6%
106.8%
115.0%
100.7%
110.2%
118.9%
99.7%
118.7%
107.6%
118.3%
109.5%
115.3%
103.8%
120.9%
106.8%
106.9%
106.7%
19,458
33,400
24,628
21,425
13,787
20,853
24,537
13,442
14,023
9,602
13,507
6,382
7,016
6,374
7,111
8,101
6,694
2,610
8,433
12,047
3,859
10,769
5,571
5,544
3,018
2,771
1,981
1,800
1,613
1,534
1,508
1,487
1,432
1,207
1,041
852
844
807
667
558
342
268
227
120
108
73
20
262,120
106.9%
112.2%
106.0%
118.3%
99.9%
117.0%
107.9%
104.3%
108.3%
108.2%
105.6%
110.6%
85.9%
92.9%
97.1%
103.3%
99.6%
102.2%
137.1%
118.7%
97.2%
113.5%
185.9%
108.0%
4,806
3,568
5,117
3,605
3,402
1,847
2,336
2,024
3,352
2,083
1,540
3,147
1,417
1,649
1,601
1,195
619
461
580
349
824
201
72
344,968
Change from2009
Number ofemployees Prefecture
Value ofshipments
(¥100 million)
Change from2009
Number ofemployees
MiyagiYamagata
Fukushima
TochigiGunma
Saitama
Tokyo
Osaka
Wakayama
Chiba
Kanagawa
Shizuoka
Yamanashi
Nagano
ToyamaIshikawa
Fukui
ShigaHyogo
Kagawa
Kochi
TottoriShimane
Kyoto
Nara
Okayama
Yamaguchi
Fukuoka
Oita
Saga
NagasakiKumamoto
Miyazaki
Okinawa
Kagoshima
TokushimaEhime
Hiroshima
Mie
Gifu
Aichi
Ibaraki
Niigata
Aomori
Akita
3Shipments of chemical products by prefecture in 2010
Shipments of chemical products by prefecture in 2010
1
2
3
4
5
6
7
8
9
10
11
12
13
14
15
16
17
18
19
20
21
22
23
24
25
26
27
28
29
30
31
32
33
34
35
36
37
38
39
40
41
42
43
44
45
46
47
Total
Over ¥ 2 trillion
¥ 1 trillion - ¥ 2 trillion
¥ 300 billion - ¥ 1 trillon
¥ 10 billion - ¥ 300 billion
Less than ¥ 10 billion
Petrochemical complex
Chiba, Osaka and Kanagawa rank among top three prefectures in the shipment of chemical products in 2010.
Shipments by prefecture

Chemical Indust r y of JAPAN 201211 Chemical Indust r y of JAPAN 2012 12
(Year)1990 1995 2000 2005 2010
Chemical industry Plastic products Rubber productsChemical industry including plastic and rubber products
Foods Printing & alliedCeramics, clay & stone productsIron & steel Fabricated metal productsIndustrial machinery General-purpose machinery Production machinery Business oriented machinery Electrical machinery Information and communication electronic equipment Electronic parts and devices Transportation machinery OthersTotal manufacturing
(Source) Ministry of Economy, Trade and Industry [Census of Manufactures](Note) 1. Statistics of facilities with more than four employees.
2. Electrical machinery was divided into electrical machinery, information and communication electronic equipment, and electronic parts and devices in 2002.Industrial machinery was divided into general-purpose machinery, production machinery, and business oriented machinery in 2008.
persons
(persons)
Industrial machinery
Total manufacturing
All industries
0
2,000,000
1,500,000
1,000,000
500,000
Indus tr y
year Every 5th year Recent three years1990
401,076435,523172,284
1,008,883
1,090,403554,155459,040337,811846,915
1,192,406- - -
1,939,729- -
942,7952,800,692
11,172,829
1995
392,109448,939151,601
992,649
1,136,236541,688429,023296,824816,694
1,086,575- - -
1,750,103- -
913,5352,357,256
10,320,583
2000
365,953433,177131,532
930,662
1,127,177502,184363,997236,525722,425
1,037,079- - -
1,573,683- -
849,5171,840,5849,183,833
2005
342,481436,897124,613
903,991
1,104,292340,890293,013213,056657,942983,449- - -
559,413205,331490,140944,352
1,461,1238,156,992
2008
349,748454,316125,088
929,152
1,138,327326,476280,263235,300654,160-
362,465613,130243,075511,670238,808521,471
1,029,6521,280,6588,364,607
2009
347,103419,936116,266
883,305
1,125,413308,878255,159220,518584,127-
323,766536,630218,516476,765217,348462,543947,704
1,175,1177,735,789
344,968420,179117,176
882,323
1,122,817299,038250,001219,983578,559-
324,636543,070211,834483,979212,466452,169948,824
1,134,1487,663,847
4.5%5.5%1.5%
11.5%
14.7%3.9%3.3%2.9%7.5%-
4.2%7.1%2.8%6.3%2.8%5.9%
12.4%14.8%
100.0%
2010
4Changes in the number of employees by industry
(Source) Japan Productivity Center(Note) Since 2010, petrochemical and coal product manufactures
have been included in the chemical industry.
(Index, 2005=100)
(Index, 2005=100)
0
120
100
80
60
40
20
1990 1995 2000 2005 (Year)201120102009
year
Indus tr y
73.3
76.8
88.8
100.0
85.0
94.0
94.2
2.8%
4.6%
6.6%
1.8%
−16.0%
10.6%
0.2%
5Index of physical labor productivity
Every5th
year
Recentthreeyears
1990
1995
2000
2005
2009
2010
2011General-purpose machinery
Production machinery
Business oriented machinery
Electronic parts and devices
Electrical machinery
Transportation machinery
Iron & steel
Printing & allied
Fabricated metal products
Ceramics, clay & stone products
Foods
Chemical industry including plastic andrubber products
Rubber products
Chemical industry
Plastic products
Total manufacturing
Index Increaserate
68.6
79.4
91.2
100.0
89.7
103.5
90.1
4.6%
8.2%
2.1%
−0.5%
−7.0%
15.4%
−12.9%
Chemical industry
Index Increaserate
Total manufacturingChemical industry
94.290.1
(Source) Ministry of Health, Labour and Welfare [Monthly Labour Survey](Note) Since 2010, petrochemical and coal product manufactures
have been included in the chemical industry.
(hours)
(hours)
140
180
170
160
150
1990 1995 2000 2005 (Year)2010 2011
year
Indus tr y
Working hours(monthly average of total net working hours)
Every5th
year
Recentthreeyears
1990
1995
2000
2005
2009
2010
2011
163.9
156.1
156.6
157.0
153.8
156.1
155.9
176.6
163.9
164.7
166.8
155.9
163.3
162.2
171.0
159.1
154.9
152.4
147.3
149.8
149.0
Chemicalindustry
TotalmanufacturingAll industries
The number of employees in chemical industry accounted for 11.5% in entire manufacturing industry.
880,000 workers are employedIn 2011, the labor productivity index of chemical industry has dropped.
Labor productivity / Working hours
Information and communication electronic equipment
Chemical industry

Chemical Indust r y of JAPAN 20121� Chemical Indust r y of JAPAN 2012 1�
Chemical industryDrugs & medicinesChemical Industry including drugs & medicinesPlastic productsRubber productsChemical industry including plastic products and rubber productsFoodsTextilesPrinting & alliedCeramics, clay & stone productsIron & steelNon-ferrous metals & productsFabricated metal productsGeneral-purpose machineryProduction machineryBusiness oriented machineryElectrical machineryInformation and communication electronic equipmentElectronic parts and devicesTransportation machineryTotal manufacturing
(Source) Ministry of Internal Affairs and Communications [Survey of Research and Development]
(Source) Ministry of Internal Affairs and Communications [Survey of Research and Development](Note) Drugs & medicines are excluded from the chemical industry.
%
(Source) Japan Patent Office
Totalmanufacturing
87 .1 %10.47
trillion yen
Non-manufacturing industry
12 .9 %1.54 trillion yen
Plastic and rubber products 274 billion yen 2.3%
Chemical industry744 billion yen 6.2%
Chemical industry including drugs & medicines2.02 trillion yen 16.8%
Chemical industry in a broad sense including plastic and rubber products2.29 trillion yen 19.1%
Drugs & medicines1.28 trillion yen 10.6%
Transportation machinery2.12 trillion yen 17.7%
Information and communication electronic equipment1.73 trillion yen (appliciation)
(%)
(Fiscal Year)
Chemistry ; Metallurgy
Performing operations ; Transporting
Electricity
Physics
Human necessities
Mechanical engineering ; Lighting ; Heating ; Weapons ; Blasting
Fixed constructions
Textiles ; Paper
14.4%
Electronic parts and devices992 billion yen
0
0
1
2
3
4
5
6
7
8
9
10
11
12
5,000
2000 2001 2002 2003 2004 2005 2006 2007 2008 2009
1990 1995 2000 2005 2010
10,000
20,000
30,000
40,000
50,000
60,000
70,000
80,000
90,000
100,000
110,000
8.3%
Business oriented machinery948 billion yen 7.9%
Electronic parts and devices519 billion yen 4.3%
Production machinery424 billion yen 3.5%
General-purpose machinery268 billion yen 2.2%
Foods238 billion yen
Other manufacturing industries
2.0%
3,276
9,512
41,401
54,778
29,387
86,157
80,538
41,976
Indus tr y
f iscal year Every 5th year Recent three years200920082005200019951990
4.08.04.92.43.24.41.01.80.92.62.31.81.6---5.4--3.73.4
4.38.05.32.63.44.81.01.80.92.42.02.41.4---5.8--3.33.4
4.18.65.42.43.64.81.02.21.12.51.62.41.7---5.6--3.93.7
3.910.0
5.92.14.35.21.32.41.42.31.11.81.9---4.76.75.84.53.9
3.711.7
6.32.54.15.61.03.61.52.81.02.01.12.83.78.35.76.65.85.03.9
3.911.7
6.52.54.55.81.04.11.33.11.42.01.03.54.59.46.16.35.74.54.1
3.612.0
6.42.63.85.71.13.81.32.71.32.11.63.23.98.45.55.84.54.53.9
2010
Trend of number of applications for patents by sector
6Ratio of R&D expenditures by industry in FY 2010
Ratio of R&D expenditures to sales by industry
Research and development expenditures of chemical industryamounted to 2.3 trillion yen, accounting for 19.1% of all industry R&D expenditures.
2.3 trillion yen spent for research and development
Transportation machinery
Electronic parts and devices
Information and communication electronic equipment
Electrical machinery
Business oriented machinery
Production machinery
General-purpose machinery
Fabricated metal products
Non-ferrous metals & products
Ceramics, clay & stone products
Textiles
Iron & steel
Drugs & medicines
Chemical industry
Plastic products
Rubber products
Chemical industry including plastic and rubber products
FoodsPrinting & allied
Total manufacturing

Chemical Indust r y of JAPAN 20121� Chemical Indust r y of JAPAN 2012 1�
(Fiscal Year)1990 1995 2000 2005 2010
(Fiscal Year)1990 1995 2000 2005 2010
Operating profit margin remains high compared to other manufacturing industries.
Chemical industryTextiles Ceramics, clay & stone products Iron & steel Non-ferrous metals & products Fabricated metal products Industrial machinery General-purpose machineryProduction machinery Business oriented machinery Electrical machinery Information and communication electronic equipmentTransportation machinery Precision machinery Total manufacturing
(Source) Ministry of Finance [Financial Statements Statistics of Corporations by Industry](Note) Rubber & plastic products are excluded from the chemical industry.
%
(%)
-3
12
11
10
9
8
7
6
5
4
3
2
1
0
-1
-2
Indus tr y
f iscal year Every 5th year Recent three years200920082005200019951990
6.92.15.08.15.15.86.4---4.6-3.55.84.8
6.51.02.43.63.03.33.1---3.5-2.65.13.3
8.10.83.04.34.72.04.0---3.9-3.06.03.8
7.81.44.6
11.1 4.83.75.2---3.02.84.87.64.5
5.0-0.81.45.70.32.62.7---
-0.5-2.1-1.25.31.5
6.30
1.1-0.70.30.3-1.2
-1.32.50.4
-0.5-0.1-1.5
7.51.63.52.82.82.3-3.53.25.03.02.01.6-3.2
2010
7 Chemical industry ranks 1stin operating profit margin
Trend of operating profit margin by industry
Plant investment by chemical industry accounted for 11.6% of all manufacturing industries.
Chemical industry Foods Printing & alliedCeramics, clay & stone products Iron & steel Non-ferrous metals & products Fabricated metal products Industrial machinery General-purpose machinery Production machinery Business oriented machinery Electrical machinery Information and communication electronic equipmentTransportation machinery OthersTotal manufacturing
(Source) Ministry of Finance [Financial Statements Statistics of Corporations by Industry](Note) Rubber & plastic products are excluded from the chemical industry.
¥ bil l ion
(¥ billion)
0
4,000
3,000
2,000
1,000
Indus tr y
f iscal year
2,2471,569
991802
1,479610
1,2931,552---
3,737-
2,8612,291
21,483
1,2601,285
537548770537781705---
3,265-
1,3461,840
13,849
1,3681,376
507480463603430692---
3,927-
1,3521,032
13,238
1,3141,246
563404627455582
1,266---
1,3471,4072,605
78414,343
1,9531,090
321403
1,113621780
1,503---
1,7421,1762,705
57615,978
1,328923420373
1,058328721-188444387898700
1,3701,754
10,893
1,312947414333802350545-78
461364966
1,4471,4241,828
11,272
11.6%8.4%3.7%3.0%7.1%3.1%4.8%-
0.7%4.1%3.2%8.6%
12.8%12.6%16.2%
100.0%
8 Chemical industry ranks 3rd in capital investment
Trend of plant investment by industry
Every 5th year Recent three years1990 1995 2000 2005 2008 2009 2010
Precision machinery
Transportation machinery
Information and communication electronic equipment
Electrical machinery
Production machinery
Fabricated metal products
Electrical machinery
Production machinery
Industrial machinery
Fabricated metal products
Ceramics, clay & stone products
Transportation machinery
Information and communication electronic equipment
Chemical industry
Foods
Printing & allied
Iron & steel
Non-ferrous metals & products General-purpose
machinery
Business oriented machinery
Chemical industry
Textiles
Ceramics, clay & stone products
Iron & steel
Non-ferrous metals & products
Industrial machinery
General-purpose machinery
Business oriented machinery

Chemical Indust r y of JAPAN 20121� Chemical Indust r y of JAPAN 2012 1�
(Source) American Chemistry Council
9Shipments of chemical products by country in 2010
(Source) Chemical & Engineering News(Note) 1.Drugs & medicines are excluded.
2.na=not available. nm= not meaningful.
Ranking Company
Chemical sales Chemical operating profits
Change from2009(%)
Chemicalsales as oftotal sales
2010($ million)
Change from2009(%)
Operatingprofit
margin
2010($ million)
Country
The world's leading chemical companies in 2010
0 100 200 300 400 500 600 700 800 900 1,000
China
United States
Japan
Germany
Brazil
Korea
France
India
Italy
United Kingdom
903.41
2
3
4
5
6
7
8
9
10
720.0
338.2
228.8
149.6
138.7
137.3
125.3
105.1
93.5
$ billion
TOP 10
Global chemical shipments 2010 [$ billion]
720.0 42.8 55.2
818.0
United StatesCanadaMexicoTotal
North America
83.4 64.7
148.1
RussiaOtherTotal
Central and Eastern Europe
157.2 TotalAfrica and Middle East
4124.5 Total
149.6 114.5 264.0
BrazilOtherTotal
Latin America
137.3 228.8 105.1
93.5 56.7 51.7 73.0 70.2 20.6 53.0 64.7
954.5
FranceGermanyItalyUnited KingdomBelgiumIrelandNetherlandsSpainSwedenSwitzerlandOtherTotal
Western Europe
338.2 903.4 125.3
26.2 138.7
42.2 79.3
129.5 1782.7
JapanChinaIndiaAustraliaKoreaSingaporeTaiwanOther Asia-PacificTotal
Asia-Pacific
1
2
3
4
5
6
7
8
9
10
11
12
13
14
15
16
17
18
19
20
21
22
23
24
25
26
27
28
29
30
BASF
Dow Chemical
Sinopec
Exxon Mobil
Royal Dutch / Shell
Formosa Plastics
SABIC
DuPont
LyondellBasell Industries
Mitsubishi Chemical
Ineos Group Holdings
Total
Bayer
AkzoNobel
Mitsui Chemicals
Sumitomo Chemical
Evonik Industries
LG Chem
Air Liquide
Reliance Industries
Toray Industries
Braskem
Linde
PPG Industries
Shin-Etsu Chemical
DSM
Asahi Kasei
Chevron Phillips
Yara
Praxair
Germany
U.S.
China
U.S.
Netherlands
Taiwan
Saudi Arabia
U.S.
Netherlands
Japan
Switzerland
France
Germany
Netherlands
Japan
Japan
Germany
South Korea
France
India
Japan
Brazil
Germany
U.S.
Japan
Netherlands
Japan
U.S.
Norway
U.S.
70,391
53,674
47,444
35,521
35,277
34,663
33,712
31,312
27,682
26,021
24,817
23,193
22,522
19,414
18,519
17,377
17,167
17,138
16,890
14,828
14,758
14,485
13,563
12,438
12,056
12,001
11,499
11,204
10,814
10,116
34.9%
19.6%
50.2%
32.3%
43.5%
30.0%
46.0%
20.6%
38.5%
45.6%
32.2%
18.8%
21.1%
5.4%
34.6%
24.1%
28.6%
24.9%
16.0%
14.4%
11.1%
58.0%
14.5%
9.2%
15.5%
15.1%
14.0%
33.3%
6.4%
13.0%
83.1%
100.0%
12.1%
9.6%
9.6%
64.9%
83.2%
99.4%
67.3%
72.1%
68.1%
11.0%
48.4%
100.0%
100.0%
76.9%
97.3%
100.0%
94.4%
25.5%
84.1%
100.0%
91.2%
92.7%
100.0%
100.0%
63.1%
100.0%
100.0%
100.0%
7,197
3,625
2,221
4,913
na
3,810
11,490
4,578
2,666
1,646
2,194
1,278
1,380
1,578
491
923
3,126
2,441
3,132
2,090
1,197
1,315
3,668
1,648
1,700
1,164
944
1,501
1,621
3,087
291.0%
108.2%
8.9%
112.8%
na
118.1%
85.8%
85.0%
325.2%
nm
66.6%
74.3%
95.7%
44.8%
nm
256.2%
47.1%
34.5%
15.9%
10.4%
223.2%
78.7%
16.3%
34.5%
27.3%
146.6%
171.2%
112.3%
32.4%
11.8%
10.2%
6.8%
4.7%
13.8%
na
11.0%
34.1%
14.6%
9.6%
6.3%
8.8%
5.5%
6.1%
8.1%
2.7%
5.3%
18.2%
14.2%
18.5%
14.1%
8.1%
9.1%
27.0%
13.2%
14.1%
9.7%
8.2%
13.4%
15.0%
30.5%
Japan's chemical industryranks 3rd inglobal chemical shipments

Chemical Indust r y of JAPAN 20121� Chemical Indust r y of JAPAN 2012 20
1995 2000 2005 (Year)2010 2011 1995 2000 2005 (Year)2010 2011
10Exports and imports of chemicals
(¥ 10 0 mil l ion)
Exports and imports of chemicals by region in 2011
Exports and imports of chemicals by region
Exports Imports
In 2011, while exports decreased, imports increased with resulting trade surplus of 700 billion yen.
Change of the amount ofexports and imports
■Exports
Fertilizers
Inorganic chemicals
Organic chemicals
Plastics
Dyes & paints
Drugs & medicines
Essential oil , perfume & cosmetics
Other chemical products
Total chemicals
(Source) Ministry of Finance [Trade Statistics](Note) Chemical fiber products are excluded from the chemical industry.
¥ 10 0 mill ion
Articles Every 5th year Recent three years
ImportsExports
1995
496
1,834
6,969
2,171
856
4,615
1,410
4,741
23,092
2000
570
2,287
7,993
3,476
948
5,149
1,944
6,183
28,550
2005
783
3,935
11,843
5,324
1,187
9,060
2,909
8,172
43,212
2009
807
3,907
12,302
4,920
1,054
13,286
2,827
6,723
45,826
2010
745
5,237
13,496
6,542
1,343
15,226
3,087
8,119
53,794
2011
841
6,294
14,295
7,410
1,426
17,250
3,137
10,324
60,976
Every 5th year Recent three years
1995
115
1,589
10,317
8,091
1,814
1,729
838
3,800
28,293
2000
100
2,221
11,927
10,575
2,626
2,944
1,292
6,361
38,047
2005
121
3,109
18,832
17,157
3,323
3,677
1,820
10,442
58,480
2009
92
3,175
17,015
18,441
3,255
3,844
2,091
9,886
57,799
2010
128
3,772
18,728
23,360
3,255
3,787
2,479
13,743
69,253
2011
163
3,710
19,080
21,878
4,036
3,590
2,520
13,004
67,980
Asia
Middle East
Western Europe
North America
Latin America
Africa
Oceania
CIS, Central Europe,Eastern Europe
Total
(Source) Ministry of Finance [Trade Statistics](Note) Chemical fiber products are excluded from the chemical industry.
¥ 10 0 mill ion
Region Every 5th year Recent three years
ImportsExports
1995
3,894
564
10,122
7,040
790
80
455
147
23,092
2000
6,414
521
12,065
8,198
694
54
457
147
28,550
2005
12,974
692
17,398
9,364
1,790
177
520
298
43,212
2009
12,714
615
20,704
9,072
1,861
93
491
276
45,826
2010
17,474
652
21,413
11,190
2,013
128
595
330
53,794
2011
22,151
794
23,197
11,462
2,103
245
625
400
60,976
Every 5th year Recent three years
1995
17,203
191
4,939
4,641
661
142
450
66
28,293
2000
22,742
224
5,948
7,065
1,402
163
419
84
38,047
2005
40,150
364
7,609
7,743
1,629
196
586
204
58,480
2009
42,089
523
6,394
5,995
1,770
268
509
251
57,799
2010
51,799
580
7,084
6,824
1,819
278
494
374
69,253
2011
51,244
610
7,051
6,181
1,776
299
461
360
67,980
(¥ 100 million)
0
80,000
70,000
60,000
50,000
40,000
30,000
20,000
10,000
■Imports(¥ 100 million)
0
80,000
70,000
60,000
50,000
40,000
30,000
20,000
10,000 Other chemical products
610 794
6,181
11,462
1,776 2,103
299 245
461 625
CIS, Central Europe,Eastern Europe
360 400
51,244
22,151
7,051
23,197
Fertilizers
Western Europe
Middle East
Asia
Africa
OceaniaLatin America
North America
Essential oil, perfume & cosmetics
Drugs & medicines
Plastics
Organic chemicals
Inorganic chemicals
Other chemical products
Essential oil, perfume & cosmetics
Drugs & medicinesDyes & paints
Plastics
Organic chemicals
Total chemicals
Fertilizers
Inorganic chemicals
Total chemicals
Dyes & paints

Chemical Indust r y of JAPAN 201221 Chemical Indust r y of JAPAN 2012 22
(Year)2005 2006 2007 2008 2009 2010 2011
(Fiscal Year)200520001995 200620011996 200720021997 200820031998 200920041999 2010
(Fiscal Year)200520001995 200620011996 200720021997 200820031998 200920041999 2010
11 12Outward direct investment of Japanese chemical industry and inward direct investment to chemical industry in Japan in 2011
(Source) Bank of Japan [Balance of Payments]
(Source) Bank of Japan [Balance of Payments]
(¥ 100 million)
(¥ 100 million)
2,000
0
-5,000
-10,000
-15,000
Actual outward direct investment of Japanese chemical industry and inward direct investment to chemical industry in Japan
-15,407
(¥ 100 million)10,000
(%)10
9,000 9
8,000 8
7,000 7
6,000 6
5,000 5
4,000 4
3,000 3
2,000 2
1,000 1
0
(Source) Ministry of Economy, Trade and Industry [Basic Survey of Overseas Business Activities](Note) Chemical fiber products are excluded from the chemical industry.
Sales of Japanese chemical companies based overseas and its percentage of all overseas Japanese manufacturing companies' sales
(Note) 1. When there are no reports, it is indicated as “N.A.”.2. As regards to direct investment, there are “outward direct investment”, in which Japanese companies make direct investment abroad, and “inward direct investment”,
in which overseas companies make direct investment in Japan. The amount of direct investment by Japanese chemical industry is the amount of “inflow of capital to Japan” from which “outflow of capital to overseas” is subtracted. Minus figures show the outflow of capital (outward direct investment is the implementation of investment by companies in Japan while inward direct investment is the repatriation of investment by overseas companies).
3. Drugs & medicines are included in the chemical industry.
Percentage of chemical companies
Sales amount of overseas Japanese chemical companies
(Source) Ministry of Economy, Trade and Industry [Basic Survey of Overseas Business Activities](Note) Chemical fiber products are excluded from the chemical industry.
(%)20
15
10
5
0
0
Trend of overseas production of Japanese companies
359
-11,145
-93
N.A.
-200
N.A.
-1
N.A.
-197
N.A.
-1,505
3
-2,191
9
Outward direct investment from Japan
Inward direct investment to Japan
9.0
8,073
Overseas production of Japanese chemical industry accounted for 17.4% in 2010.
Continued progress seen in overseas business activity
In 2011, outward direct investment of Japanese chemical industry amounted to 1.5 trillion yen.
Outward direct investment amounts to 1.5 trillion yen
Europe
Middle East
Asia
Africa
OceaniaLatin America
North America
Total manufacturing
18.1
Outward direct investment from Japan
Inward direct investment to Japan
621
Chemical industry
17.4

Chemical Indust r y of JAPAN 20122� Chemical Indust r y of JAPAN 2012 2�
(Fiscal Year)1990 1997 2000 2005 2010(Fiscal Year)
1997 2000 2005 2010
1990/1995 1997 2000 2005(Fiscal Year/Year)
2010
(Year)1990 1995 2000 2005 20092008
(Source) KEIDANREN [Results of the Fiscal 2011 Follow-up to the Keidanren Voluntary Action Plan on the Environment]
(Index, 1990=100)120
(¥100 million)500
400
300
200
100
060
70
80
90
100
110
13 Efforts to conserve energy and prevent global warming
World's primary energy consumption per GDP
Energy efficiency among major industries in Japan
CO 2 Standard Year : FY1990
3 greenhouse gases such as freonStandard Year : 1995
Greenhouse gases emissions under the voluntary action plan of chemical industry
-17
(Source) Japan Chemical Industry Association
(Source) Japan Chemical Industry Association
(Source) Japan Chemical Industry Association
(million tons)Converted to CO2
0
10
20
30
40
50
60
70
80
90
100
Energy conservation capital investment (FY2010)
Energy conservation capital investment (cumulative, FY1997-FY2010)
-29 orAs against CO² - equivalent emission in the base year
-24 million tons
FY2010
358number of cases
604¥100 million
Improvement in efficiency of facilities and equipment
Improvement in operation method
157
109
44
3018
Rationalization ofmanufacturing process
Recovery of emitted energy
Others
(Source) The Energy Conservation Center, Japan [Handbook of Energy & Economic Statistics in Japan]
(tons in crude oil equivalent / 2000 price, $ million)
0
100
200
300
400
500
1,000
1,500
India
569
China
699
Paper & pulp
75
Iron & steel
91
Auto parts
62
Electrical machinery
62
Chemical industry
83
5,0844,480
4,1913,836
3,404
2,7942,718
2,3782,169
1,7991,548
1,336
699
218
Korea304
Italy 148175
France
Germany
159United Kingdom
117
Brazil
Canada
United States
Japan98
190213
300
World Consumption(average)
280

Do You Know about Responsible Care?Efforts of chemical industry to preserve health, safety and the environment
What is Responsible Care?
History of Responsible Care
In the chemical industry, each company that handles chemicals voluntarily conducts an activity to preserve “environment/safety/health” in all the processes, fromthe development of chemicals to production, distribution, use, and final consumption, to disposal
and recycling. Furthermore, the industry maintains dialogue and communications with the general public by disclosing the results of the activity. We call this activity “Responsible Care” (RC).
Procedures for Implementing Responsible Care
Responsible Care Implementation Items
The RC Committee and its members collectively take action in five principal areas:
Responsible Care Logo
The logo, depicting a pair of hands and a model of a molecule, expresses the key message in handling chemical substances with care, and theICCA has adopted the logo as an international mark to be used bycorporations and associations that implement Responsible Care. Permission to use the logo has been granted to chemical industry associations in all ICCA member countries, as well as the respective members of thoseassociations. In Japan, the Responsible Care logo can be used only by the JCIA, RC committee and RC committee members.
Responsible Care was initiated in Canada.
International Council of Chemical Associations (ICCA) was established and global development of Responsible Care activity began.
Japan Responsible Care Council (JRCC) was established in Japan Chemical Industry Association (JCIA) and activities concerning environment/safety/health were unified and revitalized in the chemical industry as a whole.
JRCC started to promote Responsible Care activity in other Asian countries.
Responsible Care Global Charter was approved.
JRCC was integrated into JCIA, and its organization was changed to JCIA Responsible Care Committee.
1985
1989
1995
2001
2006
2010
Development Manufacturing Distribution Use FinalConsumption
Disposal・
Recycle
protecting nature and health globally
Environmental Protection
Oath of thePresident
Publicationof the Result
striving to prevent disasters at industrial facilities andenacting countermeasures for natural disasters
Process Safety and Disaster Prevention
protecting the safety and health of workers
Occupational Safety and Health
OccupationalSafety and Health
clearly identifying the properties and handling methods ofchemical products and protecting health, safety and the environment of
all persons who handles these products, including customers
Chemicals and Product Safety
Chemicals andProduct Safety
preventing accidents during the transportation of chemicals andprotecting human safety and the environment
Distribution Safety
DistributionSafety
Process Safety andDisaster Prevention
Society
EnvironmentalProtection
Communicationwith the Society●Publication of
the RC performance●Community Dialogue
Codes of Responsible Care
Planning ofImplementation
Program
Implemen-tation
ImplementationReport
Performance DateReview and
Improvement
Internal Audit(Self-Assessment)
・Management System・Environmental Protection・Process Safety and
Disaster Prevention・Occupational Safety and Health・Chemicals and Product Safety・Distribution Safety・Communication with the society
P
A D
C
The RC Committee and its members publicly report the results of these efforts to promote interaction and .
Member companies of the RC Committee implement RC in accordance with the Codes and Guidelines for the Implementation of Responsible Care. RC should be implemented in accordance with the Plan-Do-Check-Act (PDCA) cycle. Membercompanies of the RC Committee must present their implementation plans and performance results to the RC Committee annually by submitting a Responsible Care Implementation Plan, a Responsible Care Implementation Report, and a Responsible Care Internal Audit Certificate.
The RC Committee compiles the RC Report on the activities and achievements of member companies and publishes it for the public. Most of the member companies publish their own RC Report and CSR Report. Thereby making their activities and achievements known to the public.
Communication with the Society
Chemical Indust r y of JAPAN 20122� Chemical Indust r y of JAPAN 2012 2�
Chemical Industry of JAPAN 2012
Sumitomo Rokko Building, 1-4-1 Shinkawa, Chuo-ku, Tokyo 104-0033, Japan
Tel: +81-3-3297-2555 Fax: +81-3-3297-2615URL http://www.nikkakyo.org/
Japan Chemical Industry Association
12.08.DEN1000
Dream Chemistry 21Chemistry and chemical products play an extremely important role
in many aspects of daily living. To raise the awareness and
understanding of such chemical technology and its various
products, the Japan Chemical Industry Association has
established the “Dream Chemistry 21” Organizing Committee. The
“Dream Chemistry 21” campaign aims at promoting the
importance of chemical technology and the usefulness of chemical
products, particularly by appealing to young people’s interest in
the wonders of chemistry and, at the same time, fostering
internationally-active chemists.
The activities of this Committee will include “Dream Chemistry
21” Children’s Chemical Experiment Show, “Dream Chemistry 21”
Weekend Experiment Classroom, Chemical Experiments in the
Classroom program, Chemistry Grand Prix, and support for the
participation in the International Chemistry Olympiad.