DRAINAGE REPORT INTERSTATE WAREHOUSE FACILITY …
18
201200731 DRAINAGE REPORT INTERSTATE WAREHOUSE FACILITY FRANKLIN, INDIANA Prepared by: American Structurepoint, Inc. 7260 Shadeland Station Indianapolis, Indiana 46256-3957 Prepared: June 12, 2012 Submitted by: William A. Butz, Jr., PE Jessica Zartman, EI
Transcript of DRAINAGE REPORT INTERSTATE WAREHOUSE FACILITY …

201200731
DRAINAGE REPORT
INTERSTATE WAREHOUSE FACILITY
FRANKLIN, INDIANA
Prepared by:
American Structurepoint, Inc. 7260 Shadeland Station
Indianapolis, Indiana 46256-3957
Prepared: June 12, 2012
Submitted by:
William A. Butz, Jr., PE Jessica Zartman, EI

1 201200731
TABLE OF CONTENTS
Overall Project Description
Existing Drainage Conditions
Proposed Drainage Conditions
Conclusion
Appendices
Appendix A: Aerial Photograph and Existing Topography Exhibit
Appendix B: Flood Insurance Rate Map
Appendix C: Existing Soils Map
Appendix D: Storm Sewer and Structure Data Table Calculations
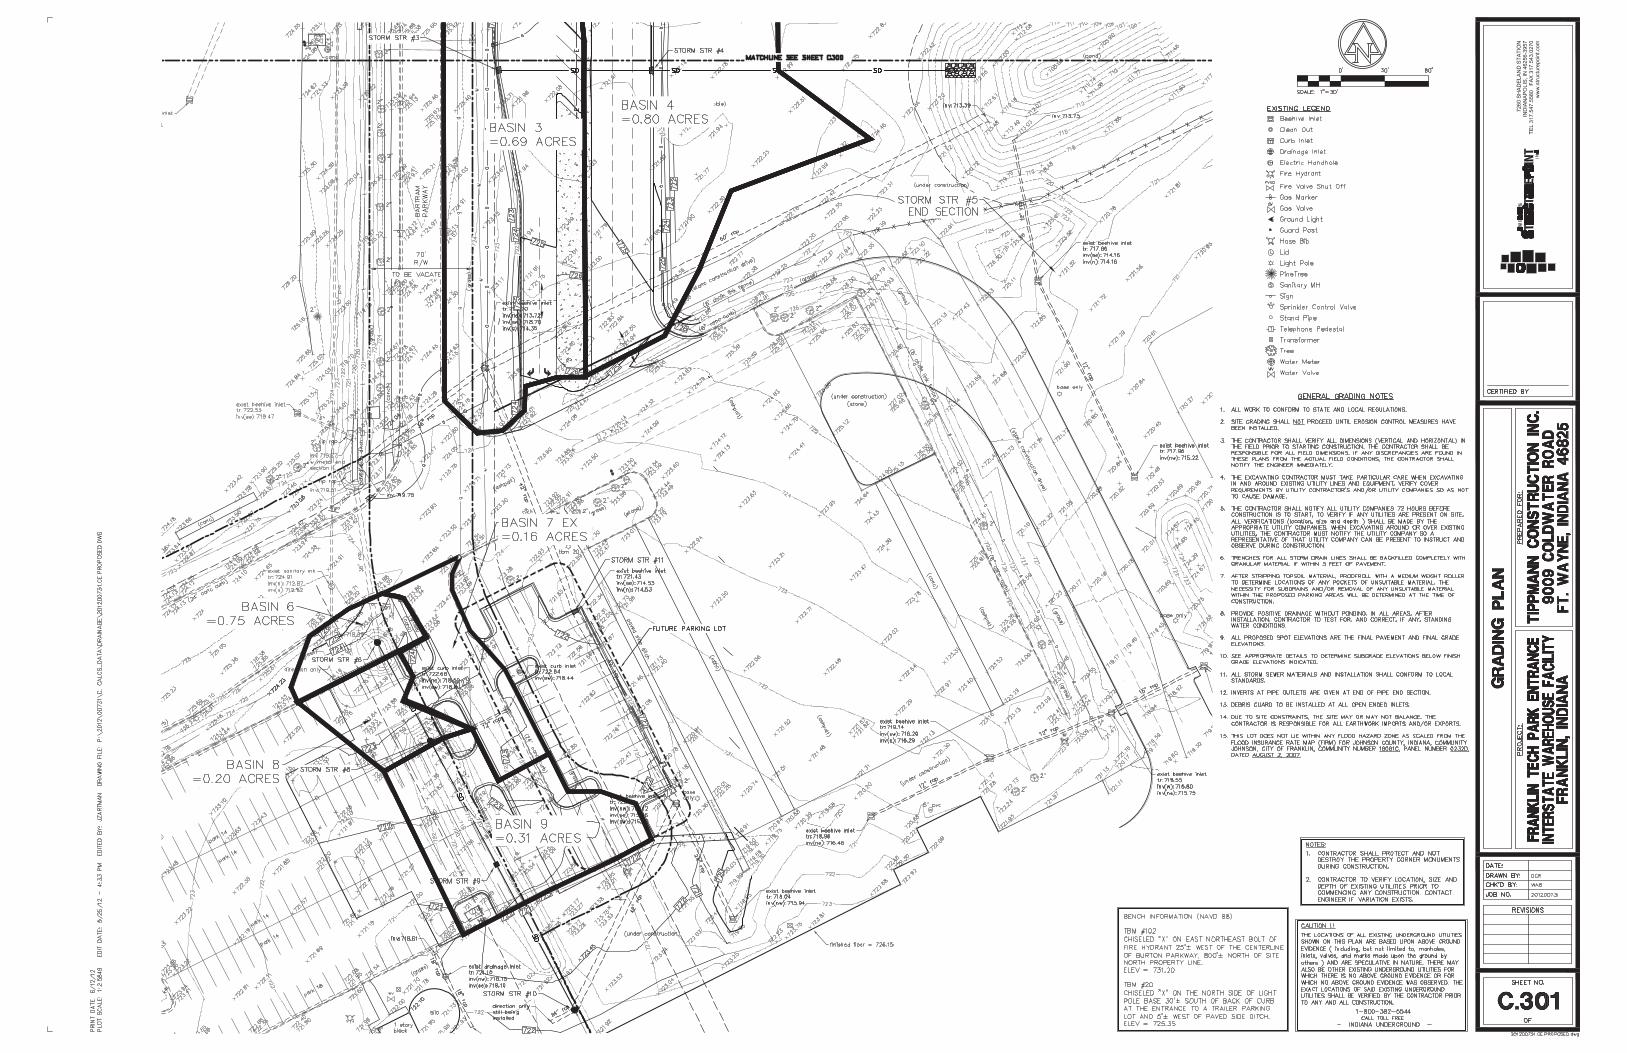
Appendix E: Proposed Drainage Map
2 201200731
AVON HEALTH CAMPUS
Overall Project Description
The project is located in the City of Franklin in Johnson County, Indiana. The proposed project site is located near the southeast corner of Bartram Drive and Bartram Parkway in Franklin, Indiana. The site is a part of the previously submitted master drainage plan for the Interstate Warehouse Facility prepared by Schneider. The previously submitted master drainage plan has been approved by the City and County. This project includes the addition of a truck drive on the east side of the vacated Bartram Parkway and additional parking spaces on the east side of the current parking lot.
The proposed site is not located within any flood zone, as indicated on the Johnson County, Indiana, Flood Insurance Rate Map 18081C0232D, dated August 2, 2007, found in Appendix B.
Existing Drainage Conditions
The current property is an undeveloped field in the area of the proposed truck drive. The area of the proposed parking lot addition and renovation is paved to the west of the drive way and grass cover to the east of the drive way. Based on existing topography, stormwater runoff from the area where the truck drive is proposed sheet flows east to a pond. The stormwater runoff from the parking area is collected in inlets by an existing storm sewer which discharges to the pond east of the site. A ditch is located east of the parking area and conveys stormwater from the swale east of Bartram Parkway to the existing storm sewer system.
The Natural Resources Conservation Service (NRCS) Web Soil Survey of Johnson County, Indiana, indicates Brookston silty clay loam and Crosby silt loam exist on the proposed site. A soils map can be found in Appendix C.
Proposed Drainage Conditions
The proposed project consists of a disturbed area of approximately 2.21 acres for construction of the truck drive and parking area. The drainage plan previously submitted by Schneider and approved by the City and County accounted for the increase in impervious area from this proposed project. The proposed design conveys stormwater during the 10-year storm event.
Once constructed, the truck drive will be drained by a proposed storm sewer system which will discharge to the pond. The proposed parking area will require filling in the ditch which conveyed stormwater from the swale east of Bartram Parkway to the existing storm sewer. Therefore a storm sewer system is proposed in the parking lot to convey existing drainage as well as runoff from the proposed parking lot. The east portion of the parking area will drain to an existing inlet and also the paved side ditch through the use of a curb turn out. All stormwater runoff from the parking lot will eventually be conveyed by the existing storm sewer and discharge to the pond as it does in the existing condition. A Proposed Site Conditions Map is included in Appendix E.

3 201200731
The proposed storm sewer systems were designed to convey to the 10-year storm event. Calculations can be found in Appendix D.
Post-Construction BMPs
Water quality calculations can be found in the previously submitted and approved drainage report by Schneider.
Conclusion
No adverse impacts are expected from the construction of the proposed project.

201200731
APPENDIX A AERIAL PHOTOGRAPH AND EXISTING TOPOGRAPHY EXHIBIT

PROJECT LOCATION

201200731
APPENDIX B FLOOD INSURANCE RATE MAP


201200731
APPENDIX C EXISTING SOILS MAP

Bertr
am P
kwy
Br
CrA
CrA
CrA
Br
Br
CrA
585250
585250
585300
585300
585350
585350
585400
585400
585450
585450
585500
585500
4369
650
4369
650
4369
700
4369
700
4369
750
4369
750
4369
800
4369
800
4369
850
4369
850
4369
900
4369
900
4369
950
4369
950
4370
000
4370
000
0 100 200 30050Feet
0 30 60 9015Meters
39° 28' 32''
86° 0
' 19''
39° 28' 19''
86° 0
' 19''
39° 28' 19''
39° 28' 32''86
° 0' 3
2''86
° 0' 3
2''
Map Scale: 1:1,930 if printed on A size (8.5" x 11") sheet.
Hydrologic Soil Group—Johnson County, Indiana
Natural ResourcesNatural ResourcesNatural ResourcesNatural ResourcesConservation ServiceConservation ServiceConservation ServiceConservation Service
Web Soil SurveyNational Cooperative Soil Survey
6/12/2012Page 1 of 4

MAP LEGEND MAP INFORMATION
Area of Interest (AOI)Area of Interest (AOI)
SoilsSoil Map Units
Soil RatingsA
A/D
B
B/D
C
C/D
D
Not rated or not available
Political FeaturesCities
Water FeaturesStreams and Canals
TransportationRails
Interstate Highways
US Routes
Major Roads
Local Roads
Map Scale: 1:1,930 if printed on A size (8.5" × 11") sheet.
The soil surveys that comprise your AOI were mapped at 1:15,840.
Warning: Soil Map may not be valid at this scale.
Enlargement of maps beyond the scale of mapping can causemisunderstanding of the detail of mapping and accuracy of soil lineplacement. The maps do not show the small areas of contrastingsoils that could have been shown at a more detailed scale.
Please rely on the bar scale on each map sheet for accurate mapmeasurements.
Source of Map: Natural Resources Conservation ServiceWeb Soil Survey URL: http://websoilsurvey.nrcs.usda.govCoordinate System: UTM Zone 16N NAD83
This product is generated from the USDA-NRCS certified data as ofthe version date(s) listed below.
Soil Survey Area: Johnson County, IndianaSurvey Area Data: Version 16, Dec 12, 2011
Date(s) aerial images were photographed: 8/18/2003
The orthophoto or other base map on which the soil lines werecompiled and digitized probably differs from the backgroundimagery displayed on these maps. As a result, some minor shiftingof map unit boundaries may be evident.
Hydrologic Soil Group–Johnson County, Indiana
Natural ResourcesConservation Service
Web Soil SurveyNational Cooperative Soil Survey
6/12/2012Page 2 of 4

Hydrologic Soil Group
Hydrologic Soil Group— Summary by Map Unit — Johnson County, Indiana (IN081)
Map unit symbol Map unit name Rating Acres in AOI Percent of AOI
Br Brookston silty clay loam B/D 2.9 40.0%
CrA Crosby silt loam, 0 to 2 percentslopes
C/D 4.3 60.0%
Totals for Area of Interest 7.1 100.0%
Description
Hydrologic soil groups are based on estimates of runoff potential. Soils areassigned to one of four groups according to the rate of water infiltration when thesoils are not protected by vegetation, are thoroughly wet, and receive precipitationfrom long-duration storms.
The soils in the United States are assigned to four groups (A, B, C, and D) andthree dual classes (A/D, B/D, and C/D). The groups are defined as follows:
Group A. Soils having a high infiltration rate (low runoff potential) when thoroughlywet. These consist mainly of deep, well drained to excessively drained sands orgravelly sands. These soils have a high rate of water transmission.
Group B. Soils having a moderate infiltration rate when thoroughly wet. Theseconsist chiefly of moderately deep or deep, moderately well drained or well drainedsoils that have moderately fine texture to moderately coarse texture. These soilshave a moderate rate of water transmission.
Group C. Soils having a slow infiltration rate when thoroughly wet. These consistchiefly of soils having a layer that impedes the downward movement of water orsoils of moderately fine texture or fine texture. These soils have a slow rate of watertransmission.
Group D. Soils having a very slow infiltration rate (high runoff potential) whenthoroughly wet. These consist chiefly of clays that have a high shrink-swellpotential, soils that have a high water table, soils that have a claypan or clay layerat or near the surface, and soils that are shallow over nearly impervious material.These soils have a very slow rate of water transmission.
If a soil is assigned to a dual hydrologic group (A/D, B/D, or C/D), the first letter isfor drained areas and the second is for undrained areas. Only the soils that in theirnatural condition are in group D are assigned to dual classes.
Rating Options
Aggregation Method: Dominant Condition
Hydrologic Soil Group–Johnson County, Indiana
Natural ResourcesConservation Service
Web Soil SurveyNational Cooperative Soil Survey
6/12/2012Page 3 of 4

Aggregation is the process by which a set of component attribute values is reducedto a single value that represents the map unit as a whole.
A map unit is typically composed of one or more "components". A component iseither some type of soil or some nonsoil entity, e.g., rock outcrop. For the attributebeing aggregated, the first step of the aggregation process is to derive one attributevalue for each of a map unit's components. From this set of component attributes,the next step of the aggregation process derives a single value that represents themap unit as a whole. Once a single value for each map unit is derived, a thematicmap for soil map units can be rendered. Aggregation must be done because, onany soil map, map units are delineated but components are not.
For each of a map unit's components, a corresponding percent composition isrecorded. A percent composition of 60 indicates that the corresponding componenttypically makes up approximately 60% of the map unit. Percent composition is acritical factor in some, but not all, aggregation methods.
The aggregation method "Dominant Condition" first groups like attribute values forthe components in a map unit. For each group, percent composition is set to thesum of the percent composition of all components participating in that group. Thesegroups now represent "conditions" rather than components. The attribute valueassociated with the group with the highest cumulative percent composition isreturned. If more than one group shares the highest cumulative percentcomposition, the corresponding "tie-break" rule determines which value should bereturned. The "tie-break" rule indicates whether the lower or higher group valueshould be returned in the case of a percent composition tie.
The result returned by this aggregation method represents the dominant conditionthroughout the map unit only when no tie has occurred.
Component Percent Cutoff: None Specified
Components whose percent composition is below the cutoff value will not beconsidered. If no cutoff value is specified, all components in the database will beconsidered. The data for some contrasting soils of minor extent may not be in thedatabase, and therefore are not considered.
Tie-break Rule: Higher
The tie-break rule indicates which value should be selected from a set of multiplecandidate values, or which value should be selected in the event of a percentcomposition tie.
Hydrologic Soil Group–Johnson County, Indiana
Natural ResourcesConservation Service
Web Soil SurveyNational Cooperative Soil Survey
6/12/2012Page 4 of 4

201200731
APPENDIX D STORM SEWER AND STRUCTURE DATA TABLE CALCULATIONS

Franklin, IndianaInterstate Warehouse Facility201200731
DATE 06/12/12
MANNINGS n = 0.012 RCPDESIGN STORM 10-year
10-yr PIPE PIPE FULL PIPE TRAVEL ELEV. ELEV. ELEV. ELEV. U.S. D.S. STR. TO STR. LENGTH c AREA cA CUM. cA Tc Tcum i Q DIAMETER SLOPE CAPACITY VELOCITY TIME U.S. D.S. U.S. D.S. COVER COVER
(ft) (acres) (min) (min) (in/hr) (CFS) (inches) (%) (cfs) (ft/sec) (min) (ft) (ft) (ft) (ft) (ft) (ft)1 2 107 0.90 0.48 0.43 0.43 5.00 5.00 7.60 3.30 12 1.20 4.23 5.38 0.33 724.21 723.23 720.24 718.96 2.80 3.112 4 140 0.90 0.44 0.40 0.83 5.00 5.33 7.48 6.22 18 0.30 6.23 3.53 0.66 723.23 723.98 718.86 718.44 2.67 3.843 4 105 0.90 0.69 0.62 0.62 5.00 5.00 7.60 4.70 12 1.70 5.03 6.41 0.27 724.07 723.98 720.23 718.44 2.68 4.384 5 207 0.90 0.80 0.72 2.17 5.00 5.99 7.25 15.72 24 0.65 19.68 6.27 0.55 723.98 - 718.34 717.00 3.39 -
6 8 76 0.90 7.50 6.75 6.75 5.00 5.00 7.60 51.30 36 0.51 51.60 7.30 0.17 723.00 722.71 717.54 717.15 2.13 2.237 EX 8 29 0.90 0.16 0.14 0.14 5.00 5.00 7.60 1.07 12 2.00 5.46 6.95 0.07 722.69 722.71 718.59 718.00 2.93 3.54
8 9 96 0.90 0.20 0.18 7.07 5.00 5.17 7.54 53.29 36 0.55 53.59 7.58 0.21 722.71 721.50 717.05 716.52 2.33 1.649 10 113 0.90 0.31 0.28 7.34 5.00 5.38 7.47 54.83 36 0.58 55.03 7.79 0.24 721.50 - 716.52 715.87 1.64 -
RIM INVERT
PROPOSED STORM SEWER SYSTEM STORM SEWER DESIGN TABLE - RATIONAL METHOD
JOB TITLEJOB NUMBER
LOCATION
Prelim Storm Desing,Design

201200731
APPENDIX E PROPOSED DRAINAGE MAP