Draft Wildlife and Water 4-H Curriculum Early Disemination ...
156
Unpublished Draft_3/23/2020 0 Wildlife and Water Habitats: 4H Youth Curriculum Jim Ekins, Area Water Educator, University of Idaho Extension, Coeur d’Alene, ID Marcie Galbreath, Founder/Executive Director, NexGen Learning Institute, Coeur d’Alene, ID
Transcript of Draft Wildlife and Water 4-H Curriculum Early Disemination ...

Unpublished Draft_3/23/2020
0
Wildlife and Water Habitats: 4H Youth Curriculum Jim Ekins, Area Water Educator, University of Idaho Extension, Coeur d’Alene, ID Marcie Galbreath, Founder/Executive Director, NexGen Learning Institute, Coeur
d’Alene, ID

Unpublished Draft_3/23/2020
1
Contents
Contents
Section 1 ................................................................................................................................... 3
Introduction .......................................................................................................................... 3
Chapter 1: What Is a Habitat? .............................................................................................. 4
Habitat Diversity .................................................................................................................. 4
Who Lives There? .................................................................................................................. 7
Habitat Modeling ...................................................................................................10
Looking at Pieces of the Whole ..........................................................................................11
Taking a Different View ......................................................................................................13
Chapter 2: Human Impacts, Yesterday and Today ............................................................15
People and the Environment ..............................................................................................15
Science in Action ...............................................................................................................18
Chapter 3: Soil Science .......................................................................................................22
Erosion: Where and Why? .................................................................................................22
Changes, Big and Small .....................................................................................................24
Soil at Work ...........................................................................................................................27
Section 2 ..................................................................................................................................30
Water Habitat ...........................................................................................................................30
Introduction .........................................................................................................................30
Chapter 1: Watersheds........................................................................................................34
What Is the Water Cycle? ..................................................................................................34
Exploring your Watershed ..................................................................................................36
Functions of Watersheds ...................................................................................................41
Chapter 2: Water Quantity and Quality ..............................................................................44
How Do We Use Water? ....................................................................................................44
What is Water Quality? ......................................................................................................48
What is Water Pollution? ....................................................................................................54
Chapter 3: Water Walk ........................................................................................................64
Aquatic Habitats: An Overview ...........................................................................................64
Stream Habitats (Option 3-A) .............................................................................................71

Unpublished Draft_3/23/2020
2
Pond/Lake Habitats (Option 3-B) .......................................................................................75
Extra Considerations for Urban Stream and Pond/Lake Habitats (Relates to Options 3-A and 3-B) .............................................................................................................................78
Aquatic Macroinvertebrates Tell a Story .............................................................................80
Chapter 4: Presentations and Community Engagement ..................................................87
Appendices: Detailed Instructions, Advanced Activities, and Additional Information ...91
Appendix 1: Detailed Instructions for Activities ...................................................................91
........................................................................................................................................ 121
Figure 37. Example of a macroinvertebrate Kick Net. ...................................................... 121
Appendix 2: Advanced Activities ...................................................................................... 122
Appendix 3: Data Sheets and Things to Print ...................................................................... 133
Soil Erosion Data Recording Sheet .................................................................................. 134
Soil-Filtering Data Recording Sheet ................................................................................. 135
Water Cycle Poster .......................................................................................................... 136
........................................................................................................................................ 136
Crayfish Study Assessment Form ........................................................................................ 150
Collection Information ............................................................................................................. 151
Crayfish Information ................................................................................................................ 151
Aquatic Macroinvertebrate Identification Key ....................................................................... 152

Unpublished Draft_3/23/2020
3
Section 1 Marcie Galbreath created all the activities in Section 1 and are used with author’s permission.
Introduction Logan and Emily grew up as neighbors in Boise. By the time they were eleven, they
were old friends. Both of their parents moved to different parts of the state. Logan’s family lives in Sandpoint, and Emily’s family lives in Twin Falls, but they stayed in touch and visit each other a couple of times each year. Sandpoint: Logan lives in a small house in town with a yard six blocks from the shore of Lake Pend Oreille. Sandpoint receives about 32 inches of precipitation each year, including over 70 inches of snow. When it rains, hardscape like roofs, sidewalks, and streets prevents water from seeping into the ground. Instead, water runs into the street, along the gutter, and into a storm drain. Permeable surfaces like lawns, garden beds, and gravel driveways are better at accepting rainwater into the soil. Many of the neighborhood yards along the lake, Logan’s included, are mostly lawns that run all the way to the shore. Natural vegetation that exists along this shore, which some of the families have taken the time to maintain, helps to prevent rain runoff. During the winter, dealing with the runoff becomes more challenging. Sometimes after a snow, the weather warms above freezing, making it possible for Sandpoint to receive rain. If the storm drains are clogged, these rain-on-snow events cause local flooding. Widespread flooding in low-lying areas can also occur. This is due to natural stream channels or undersized driveways and road culverts that can’t handle the precipitation and meltwater. Twin Fa lls: Emily lives in a farmhouse built in the early 1900s just outside of Twin Falls. Her family’s house sits next to a potato farm and across the street from a local dairy. Emily’s close proximity to the Snake River, farms, and natural spaces provides her with different habitat types to explore. Twin Falls only gets about 9.5 in of precipitation a year, including about 28 in of snow. So rain-on-snow events happen here, too. But flooding because of them occurs less frequently than in Sandpoint. During the winter of 2016–17, however, a series of severe rain events that melted snow caused widespread flooding in the area, the worst of which caused a dairy lagoon in the nearby town of Shoshone to overflow and almost burst. Both are learning about the water cycle, and how water moves around the Earth—that it’s been recirculating since shortly after the planet was formed. That is, the Earth uses and reuses its water over and over again.

Unpublished Draft_3/23/2020
4
Chapter 1: What Is a Habitat?
Habitat Diversity Emily is studying ecosystems in her science class at school. Ecosystems contain many
different types of organisms (e.g., plants, animals, and people) as well as natural resources (soil, water, and air). There are several different kinds of ecosystems—for example, forest, grassland, desert, and freshwater. Each ecosystem plays an important role in the subsistence (maintenance or support) of living things. Biodiversity, which is diversity within an ecosystem or the diversity of several ecosystems within the world, is important. The stability of an ecosystem largely depends on the diversity of the organisms and natural resources that thrive within it. Next time you are outside take some time to notice the diversity that exists in your location. How many different plants and animals can you identify?
You may have heard the term habitat, but do you know what it means? Emily does. In her science class, she learned that a habitat is often defined as the natural environment or home base within which an organism lives—or as a natural place that supports the growth and life of an organism. After also learning that ecosystems contain several habitats, she decided to use the internet to compare what kind of habitats exist along the Snake River near her home with those along Lake Pend Oreille near Logan’s. In her journal, Emily took notes and made sketches about the similarities and differences, particularly some of the plants and animals found in both the Snake River and Lake Pend Oreille regions. How can you discover what kind of habitats are near your home or school? This activity will help you answer that question while exploring more about habitats.
Procedure What is a habitat? To answer this question, watch and discuss the Habitat PowerPoint. Next, take two cardstock paper halves and punch three holes down the left edge. Punch three holes in the plain paper halves to match the holes in the cardstock. Use clasps or string to attach your field journal together. If you would like a larger field journal, use a small 3-ring binder. In addition to the presentation, we expect you to develop one of the following research tools to record the information you gather during your field investigations:
● Design Portfolio ● Engineering Notebook ● Field Journal
Learning/Inquiry Activity 1: All Kinds of Homes Anticipated time: 45–60 min
Learning Objectives
To understand habitat assessment. To understand and construct arguments around animal behavior, survival, and reproduction.
Materials
Habitat PowerPoint, paper (plain and cardstock), hole punch, colored pens or pencils, clasps or string

Unpublished Draft_3/23/2020
5
The exact “look” or content style of your portfolio, notebook, or journal is less important than the completeness and faithful documentation of your learning experiences in it as you progress through the program. These are commonly used types of project documentation (see Figure 1). Do what feels right for you; the goal is to capture all that you did with this project in an easily accessible and organized format. A person with a more artistic bent might develop a design portfolio, heavy on labeled drawings, sketches with written descriptions, and other images with some context. There are many ways to create a design portfolio, including using a 3-ring binder, plain paper (no lines) drawing journal, or hardcover composition notebook. Whatever you choose, it will need to have enough pages to complete this three-year curriculum. Make sure you create a label for your portfolio--include your name, 4-H club or other affiliation, title: Wildlife and Water Habitats Curriculum Design Portfolio, and any other identifying information. A person with a more mathematical mind might develop an engineering notebook with formulas, graphs, tables, and scale drawings, again with notations and context included. Like the portfolio, there are many ways to create an engineering notebook. You can use a hardcover or softcover graph paper notebook, 3-ring binder, plain (drawing) or lined (writing) journal, or hardcover composition notebook. Whatever you choose, it will need to have enough pages to complete this three-year curriculum. Make sure you create a label for your notebook that includes your name, 4-H club or other affiliation, title: Wildlife and Water Habitats Curriculum Engineering Notebook, and any other identifying information. A person who likes to write narrative descriptions might develop a field journal with written reflections about her/his experiences, but also include sketches, drawings, and mathematical formulas. There are many ways to create a field journal, including using a plain (no lines) drawing journal, hardcover or softcover graph paper notebook, 3-ring binder, or journal you create from scratch (described at the beginning of this Procedure section) using cardstock (or other equally thick paper) for the cover and plain paper for the inside. Whatever you choose, it will need to have enough pages to complete this three-year curriculum. Make sure you create a label for your journal that includes your name, 4-H club or other affiliation, title: Wildlife and Water Habitats Curriculum Field Journal, and any other identifying information. Remember, the research tool you create will house and show all your work, including drafts of your maps and any and all of your reflections as you work through each assignment.

Unpublished Draft_3/23/2020
6
Figure 1. Portfolio/Notebook/Journal example. Photo Credit: Marcie Galbreath.
In addition to your portfolio/notebook/journal, you will also develop and keep a regular 4-H Record Book. Note: You can substitute internet research and/or other visual media (e.g., pictures, books) for the Habitat PowerPoint.
Let’s Do It! Use colored pens or pencils to decorate the cover of your field portfolio/notebook/journal. Make sure to include a title for you portfolio/notebook/journal and your name. On page 1 of your field portfolio/notebook/journal, answer (in your own words) the following question: What is a habitat? On page 2, list at least five different habitats and who or what lives in them.
Reflection In your portfolio/notebook/journal: Choose one of the habitats you listed on page 2 of your portfolio/notebook/journal. Write a description of that habitat. Include what (animal or person) lives there, what plants live in or near the habitat, what the habitat is made of, what food and water is in or near the habitat, and any other details you can think of. _____________________________________________________________________________________ So, now that you have explored different habitats, look around your house and yard and think about all the habitats that are located there. Reflect on the ways they affect you. List as many of these ways as you can.

Unpublished Draft_3/23/2020
7
Who Lives There? Emily decided to continue exploring habitats in and around her community by observing
and comparing those in urban and rural areas. She took walks around town after school and hiked places near her house on weekends. After spending two afternoons walking around town, Emily noticed that human habitats are not all the same. Although she noticed some single-story houses, most people near her school live in two-story dwellings. The area further from the school, toward the downtown area, showed even more diversity. There are many apartment buildings, some older single-story houses, and some of the older houses are now businesses. Soon, Emily started to think about what makes a home.
Take a moment and think about your idea of what makes a home. During her walks around town, Emily stopped to journal about the different kinds of human habitats she was seeing. She also drew pictures and wrote notes about the animal habitats she saw. She recorded several bird nests near the school. A few blocks from the downtown area, she observed a dog sitting outside his doghouse under a tree behind a small single-story house. While waiting to cross the street, she looked down and observed ants busily running in and out of a small mound in the dirt.
When Saturday came, Emily woke up early. She was excited to go on a hike. At breakfast, Emily told her family she wanted to hike up to the top of the ridge behind their house. Her parents said it was okay. With the family dog running ahead, Emily headed out toward the ridge. She knew there was a narrow trail that would take her to the top of the ridge. As she walked through her family’s property, she noticed several habitats. Every time she spotted one she stopped and recorded it in her field journal. She wanted to capture as much information as she could about each habitat she saw so when she talked to Logan on the phone the next day she could tell him all about it. By the time Emily reached the bottom of the ridge, she had documented a snake hole, three bird nests, and the henhouse her chickens live in. With her dog staying nearby, Emily began walking up the rocky ridge, stopping to record any habitat she saw. When she reached the top of the ridge, she sat on a large rock and looked around. She could see much of the valley from here. Opening her field journal, she took another look at the habitats whose details she had just documented. Emily started to notice the differences between the habitats on the ridge compared to the ones in the grassy fields below. Habitats higher up the ridge are largely located in the trees (such as squirrel and bird nests) or hidden among the rocks (such as spider or snake holes). Low on the ridge, Emily spotted evidence of deer living in an “edge” habitat. An edge habitat is a natural or humanmade habitat break. Emily was very excited to share with Logan everything she had seen in town and around her home.
Learning/Inquiry Activity 2: Habitat Hike Anticipated time: 45–90 min
Learning Objectives
To develop reasoning and critical thinking skills. To understand and construct arguments around environmental phenomena as well as cause and effect relationships. To understand interdependent relationships in ecosystems.
Materials
Your field journal and pencil/pen

Unpublished Draft_3/23/2020
8
Procedure Find a natural location (hiking trail, urban forest, unpaved/natural area of your schoolyard, etc.) to explore with your education leaders, clubmates, family, or friends. Bring your field portfolio/notebook/journal and pencil/pen so you can record your observations, and make sure you are wearing appropriate clothing for the location.
Let’s Do It! Think about the Habitat PowerPoint you watched during Activity 1. What can be a habitat? What signs can you see in nature that a habitat is nearby? Hike the location, looking for different kinds of habitats. Stop and record the habitats as you find them. You can record them many ways: (a) draw the habitat, (b) write a poem or short story about the habitat, or (c) write a song about the habitat. Include as much information about the habitat itself, the surrounding area (is it protected from weather, predators, etc.?), the availability of food and water, and so on. Find and record at least six different habitats.
Figure 2. Students hiking. Photo Credit: Jim Ekins.

Unpublished Draft_3/23/2020
9
Reflection In your portfolio/notebook/journal: Answer the following question based on your reflections from the beginning of this activity. What makes a home? ____________________________________________________________________________ Are habitats (human and animal) impacted by the geography around them? Explain. ____________________________________________________________________________ Does weather impact how and/or where animals build their habitats? Explain. ____________________________________________________________________________ Activity Extension: You may choose to hike more than one location and compare the habitats you see across them.

Unpublished Draft_3/23/2020
10
Habitat Modeling
Procedure Gather all supplies needed for model making. Put butcher paper or other protective material on your table. Have your portfolio/notebook/journal and any pictures (as a resource/reference) of habitats you’d like to refer to near your workspace.
Let’s Do It! Look at the different habitats you recorded in your portfolio/notebook/journal. Select one that you want to create as a 3-D model using the supplies you have collected for this activity. Create the 3-D model in your protected workspace. If you have the time and supplies, include environmental elements into your model. Examples of environmental elements are plants, geographic markers (rocks, rivers, hills, etc.), and manmade structures.
Figure 3. Outdoor science activity. Photo Credit: Jim Ekins.
Reflection In your portfolio/notebook/journal Explain why you chose that habitat from all the ones you recorded in your portfolio/notebook/journal.
Learning/Inquiry Activity 3: Create Your Own Habitat Model Anticipated time: 30–60 min
Learning Objectives
To understand modeling: design, materials, construction. To understand measurements and engineering principles.
Materials
Various materials that can be used to construct a 3-D model of a habitat. Materials include: clay, sand, feathers, string, moss, small rocks/polished glass, twigs (If you choose to collect materials from nature, make sure you do not collect on private land or in state parks. Also, only collect items that are already on the ground.)

Unpublished Draft_3/23/2020
11
____________________________________________________________________________
Looking at Pieces of the Whole When her science class began exploring biodiversity, Emily started looking at the areas
around her home and community differently. She noticed that many kinds of plants and animals inhabit her neighborhood. Since she lives several miles out of town, there are few manmade features near her home. The area around her school, however, barely contains any natural space. It is threaded mostly with sidewalks, blacktop, and other concrete areas, with few manicured grass areas. A notable exception is a small creek located a short walk from her school. Just as she remembered that it runs through town and ends at the Snake River, Emily noticed landscapers spraying insecticide on the school grass. She began to think about how what happens at her school may impact the small creek.
A few days later she called Logan to discuss her thoughts on ecosystem interactions. Logan’s science class had just finished a unit on human impact in natural settings. He told Emily about a project he did, as a part of that unit, which focused on microhabitats within an ecosystem. A microhabitat is a small area that differs from nearby larger areas. Logan and his classmates each chose an area of the school campus and examined it in detail. They journaled about various aspects of the microhabitat, including plants, animals/insects, geography, and evidence of erosion. His class then came together and discussed how changes in one member’s chosen microhabitat impacts neighboring habitats and the larger ecosystem.
Procedure Take all your supplies outside to a location you have chosen to hike. Find a spot you want to hike that is near, but not right next to, other members/participants. Leaders: If your group size is small, have members increase the inches they hike (e.g., 18”–24”), giving them a larger view of the area. Or, as an activity extension, have members complete multiple “hikes” at all three lengths.
Let’s Do It! All members/participants go out to a field location (e.g., a natural location, community nature trail, or unpaved schoolyard/campus area). Think about the kinds of things you should be recording in your portfolio/notebook/journal (education leaders may help with prompts). Lay your string/marker on the ground in the area you selected to “hike” and, beginning at one end, use
Learning/Inquiry Activity 4: MicroHike Anticipated time: 20–30 min
Learning Objectives To understand and interpret effects of resource availability on populations in an ecosystem. To understand and explain biodiversity and interactions among differing ecosystems.
Materials
12 in (possibly 18–24 in for larger “hikes”) of string/cord, a ruler, a marker, magnifying glass, field journal, and pencil/pen

Unpublished Draft_3/23/2020
12
the magnifying glass to view your part of the “place.” Record your observations in your field portfolio/notebook/journal as you “hike.” Note: Make sure you are within earshot or eyesight of the adult leader at all times.
Figure 4. Outdoor science activity. Photo Credit: Jim Ekins.
Reflection Come back together with the other members/participants for a postactivity discussion. The instructor/facilitator will begin the discussion by posing inquiry questions (e.g., Did hiking only 12, 18, or 24 in of the place make you see it differently? Did you see organisms like insects or plants that you didn't know would be there?) Share your observations about your 12, 18, or 24 in of the place with all members/participants. Then, tie all the individual hikes together by focusing on how any individual part makes up one larger place (make connections to which fellow students will relate; i.e., a town is a part of the state, a state is a part of the United States). If you are completing this activity on your own, answer the above questions in your portfolio/notebook/journal. Include any other thoughts you have at activity’s end.

Unpublished Draft_3/23/2020
13
Taking a Different View Now that she is studying ecosystems in school and on her own, Emily is beginning to understand the deep connections among all types of resources and living things. She has learned about water and habitat environments near her home in southern Idaho as well as those near her best friend Logan, who lives in the northern part of the state. The impact humans have on the environment has become an important concept for Emily. Recently, she began keeping track of her water usage. She asked Logan to do the same, so they could compare their usage. She also talked with her dad about the impact of the family’s gardening and animal husbandry on the land and nearby Snake River. One Saturday afternoon, Emily walked down to the river’s edge. She found a shady spot and sat down on a large rock. Journal in hand, Emily sat quietly, hoping to see local wildlife. She wanted to observe how the wildlife interacted in the natural space. Emily had previously noticed that animals such as deer were prevalent on her family’s property. They did not seem to be afraid of her and her family, yet they were frightened by the family dog. Take a moment and think about wildlife you have seen near your home. What kind of animals have you seen? How do they behave? The following activity will help you to gain a deeper understanding of the relationship between humans and animals when they inhabit the same places.
Procedure Go to a natural or seminatural area in your community (e.g., a park, schoolyard, etc.).
Let’s Do It! How do animals view the world they live in? Are animals impacted by living near/among humans? Discuss with your fellow members, volunteer, and/or family the animals that you think live in or near the area. Discuss and document in your portfolio/notebook/journal the needs of the animals you discussed and how being close to and/or interacting with humans may impact all aspects of those animals (e.g., resources, behaviors). Choose one animal from your portfolio/notebook/journal. Imagine for a few minutes how that animal sees the area you are in (e.g., a bird sees the tops of buildings, trees, etc.). Using the graph paper (or your journal if you do not have graph paper), draw the area the way you—as the animal—see it. Include as many details as possible.
Learning/Inquiry Activity 5: What Do You See? Anticipated time: 30–40 min
Learning Objectives
To understand interdependent relationships in an ecosystem. To understand stability in an ecosystem and how small changes can lead to large impacts.
Materials
Field journal, graph paper, and pencil/pen

Unpublished Draft_3/23/2020
14
Reflection Come together as a group. Take turns discussing the animal each member chose, including how it sees the world. Share your drawings with the group.
Figure 5. Outdoor classroom example. Photo Credit: Marcie Galbreath.
In your portfolio/notebook/journal, answer the following questions: How are animals impacted by human presence in their environment? ____________________________________________________________________________ How are humans impacted by living in remote, rural, or natural spaces near/among animals? ____________________________________________________________________________

Unpublished Draft_3/23/2020
15
Chapter 2: Human Impacts, Yesterday and Today
People and the Environment As part of its social studies unit, Emily’s class has also been learning about Idaho’s early
history. She and her fellow students first studied the early culture of the Shoshones, which included how they traveled and lived off the land. Next, they studied the time when Europeans entered the region. She found out that Europeans (mostly fur traders) came to Idaho during the early 1800s and that they established their first permanent settlement in 1860. Emily began wondering about how people have lived in southern Idaho over time. Imagine it’s 1860. What would your life be like? Do you have electricity? How does your family heat your home?
Emily soon wanted to combine what she was learning about Idaho’s early history with her field project, specifically by considering the historical impact of Shoshone and European settlement on the area’s water quality. Emily remembered her teacher said that the Shoshones did not build permanent homes, though Europeans did. They also relied on riding horses, but didn’t use wagons, a type of transport Europeans favored. Wagon use drove deep grooves in the land. However, time and erosion diminished them, causing many of them to disappear. Eventually, roads threaded the landscape, and developers constructed more and bigger buildings. Meanwhile, farmers irrigated crops using the Snake River.
When Emily called Logan and told him what she was learning in her social studies class, he recommended she do her own research on water quality in the Snake River. Logan had done a similar research project in his social studies class. Logan and his fellow students had to keep a journal, recording their individual and family water use for a month. Logan told Emily that for the final assignment he had to create a story (from all the information he had collected) that depicted the human impact in his area over time. Emily thought this was a great idea and made a mental note to suggest it to her teacher.
Procedure Consider/list possible subsistence activities that previous generations living in your area may have engaged in. Use the internet and/or locate other various media materials (e.g., books) to find out more. Identify people and companies in your area that work with or impact natural resources. Gather supplies for creating a storyboard.
Learning/Inquiry Activity 6: Human Impacts, Yesterday and Today Anticipated time: 3–5 hrs
Learning Objectives
To obtain and understand information from different media sources. To understand the human impact on Earth’s systems and how individuals and communities are helping to protect resources and environments.
Materials
Different media types (e.g., internet, books, magazines, etc.), poster board (optional), field journal, pencil/pen

Unpublished Draft_3/23/2020
16
Let’s Do It! Conduct research on the human history and activity in your county or surrounding area using various media types. Document your findings in your field portfolio/notebook/journal. Include printed pictures, drawings, or other visuals. After gathering the historical information, collect information on current agricultural and natural resource use and management practices. Interview farmers, ranchers, business owners, and natural resource employees—such as those working for the Bureau of Land Management (BLM), the U.S. Forest Service, or the U.S. Fish and Wildlife Service—about practices that potentially impact the environment and resources in your county or surrounding area. Record each interview and/or keep notes in your field journal. Based on your research findings, create a storyboard (using digital media such as PowerPoint or nondigital media such as poster board) that portrays the impact of human activities and current practices (positive and negative) on the resources and environment in which you live (see Figure 6). Share your storyboard with family, friends, and clubmates.
Figure 6. Storyboard example. Photo Credit: Marcie Galbreath.
Figure 7. Storyboarding activity. Photo Credit: Marcie Galbreath.

Unpublished Draft_3/23/2020
17
Figure 8. Outdoor science activity. Photo Credit: Jim Ekins.
Reflection In your portfolio/notebook/journal, answer the following questions: How have human activities concerning natural resources and the environment changed over the years? ____________________________________________________________________________ What changes can you make today that will have a positive impact on the environment tomorrow? ____________________________________________________________________________

Unpublished Draft_3/23/2020
18
Science in Action At Emily’s school, teachers often work together to create a project that 4-H members can
work on collaboratively while earning school credit for multiple subjects/courses. This year, Emily’s science and social studies teachers decided to team up on a project where members explore the human causes or impacts driving an environmental issue. Teachers advised members to work on this project not only during both science and social studies classes but also outside of school. All told, the project’s completion would take four weeks.
Both of Emily’s teachers helped her and her classmates come up with a research project. The members were asked to present a topic they would like to explore or a real-world problem they would like to solve. Emily spent the weekend reading the newspaper, watching the evening news, and searching the internet for ideas. On Sunday evening she called Logan. Emily told him about the project and how her research had led her to several topics of interest. She asked him to help her narrow down the possibilities. After talking with Logan for nearly an hour, Emily decided she would like to explore how soil use is impacting the Snake River.
During this activity, choose a topic to explore or a real-world problem to solve. Make an observation and/or hypothesis to guide the project. Like Emily, you will collect data, analyze your findings, and present them. You are the leader for this activity. Because you have chosen your own topic or problem and decided the best way to present your findings, you are the expert: educate your family, friends, clubmates, and community. The Scientific Method: A process to guide experimentation. Scientists use the scientific method to guide how they explore an inquiry or conduct an experiment, but they don’t always follow it exactly. You can do the same! Below are the steps of the scientific method:
● Ask a question/make an observation ● Do research ● Construct a hypothesis ● Experiment ● Ask, “is the procedure working?” ● If yes, analyze the data, accept or reject the hypothesis, and report the findings ● If no, troubleshoot/adjust the procedure and run the experiment again until answer is yes
There are multiple ways scientists and researchers examine phenomena (observable facts, circumstances, or occurrences). Quantitative methods use numerical data to measure and define something. For example, how many pieces of gum are in a package? Qualitative methods do not use numbers. Instead, they explain/describe the characteristics of something (a phenomenon) without measuring or proving anything. For example, how soft is a teddy bear? You can also combine quantitative and qualitative methods. This is known as a mixed methods approach. An example of a mixed methods approach may involve collecting numeric data about the pH levels and temperature of several different bodies of water, then writing down observations of those same bodies of water (color, clarity, types of plants and animals in or around them, etc.).

Unpublished Draft_3/23/2020
19
Data collected are then analyzed. There are several ways you can analyze data. Often, scientists and researchers use software programs. For quantitative data, you can use Excel to create tables and charts to examine data and report findings. For qualitative data, you might hand code your documentation, a procedure which researchers often rely on. Hand coding involves going through interview transcripts, or other qualitative (text) data, and looking for commonalities in the words/text.
Materials Internet (or other reliable research source); computer or portable device capable of using the internet and Excel (or other software program) for analyzing data; field portfolio/notebook/journal for recording hypothesis or research question and collecting data; visual and/or audio recording device (optional); PowerPoint or other means of displaying research findings (e.g., poster board).
Procedure Use the internet or other reliable source to identify an environmental issue/concern that has a human cause (human behaviors or practices impacting the environment). If possible, choose something that is happening near where you live. Form a hypothesis about the environmental issue you chose. Using the information above, design a method, either quantitative, qualitative, or mixed methods, to collect and analyze the data.
Let’s Do It! Using your research material(s), decide on an environmental issue with a human cause. Develop a hypothesis (if doing quantitative research) or research question (if doing qualitative research) to guide your project. If you are doing a mixed methods study, you can use either a hypothesis or research question to guide your study. Depending on your question/hypothesis, you may want to follow the steps of the scientific method. Begin collecting the data. How you collect it will be determined by which type of research study you are doing and what hypothesis you are trying to prove/disprove or question you are trying to answer. Use the descriptions about data collection above as well as your parents, 4-H leader, professionals in environmental science, and/or the internet to help you determine what data to collect and how to collect it. Record your data in your field portfolio/notebook/journal or on data sheets you design (based on examples provided in chapter 3). If you run your experiment more
Learning/Inquiry Activity 7: Evidence of You and Me: Tracking Human Impact Anticipated time: will vary, conduct over multiple days
Learning Objectives
To explain an environmental issue related to human behaviors/practices. To use scientific principles to design a method for collecting data and tracking human impact on the environment.
Unpublished Draft_3/23/2020
20
than once or use multiple data sources (e.g., questionnaire and pH levels) to answer your question, use a different portfolio/notebook/journal page or data sheet for each. Note: If you use separate data sheets, include them in your portfolio/notebook/journal. If need be, run your experiment again or collect more data until you can answer your question and/or accept or reject your hypothesis. Analyze your data. Depending on the data you have collected, you will need to use one or more of the analyzing methods/tools described above. Often entering quantitative data in Excel and hand coding qualitative data is all that is needed. Feel free to explore different ways of analyzing your data. Report your findings. Use a variety of ways. Quantitative researchers and scientists often write a research report, including graphics (tables, charts, etc.). Qualitative researchers often organize their findings by themes they’ve identified. They often quote directly from interviews and/or questionnaires and include tables or other graphics to help support the text. No matter what method you choose, keep your reporting simple but emphasize the interesting findings, provide answers to your research questions, and indicate if you accepted or rejected your hypothesis.
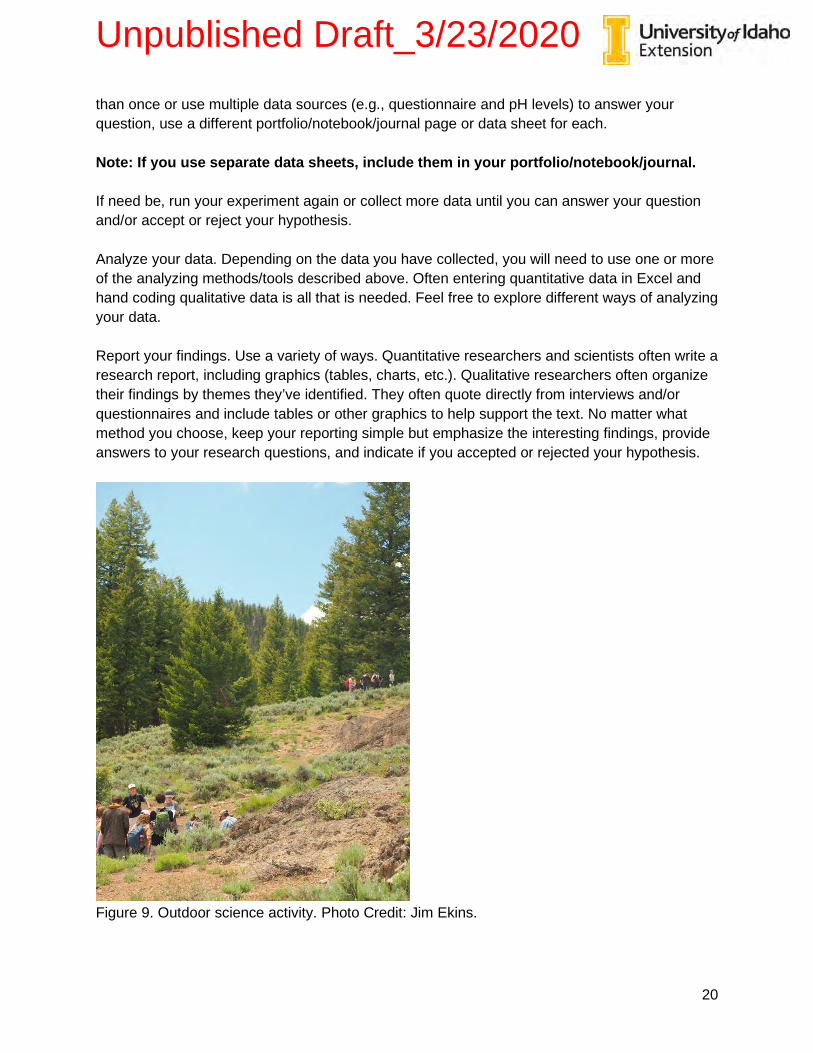
Figure 9. Outdoor science activity. Photo Credit: Jim Ekins.

Unpublished Draft_3/23/2020
21
Reflection In your portfolio/notebook/journal, write and finish each of the following statements: During this activity, I learned how to use the scientific method to research a problem and ... ____________________________________________________________________________ This activity helped me to understand scientific data and how to use that data for ... ____________________________________________________________________________ Based on the data I collected, I found ... ____________________________________________________________________________

Unpublished Draft_3/23/2020
22
Chapter 3: Soil Science
Erosion: Where and Why? “Soil is not dirt!” Emily’s science teacher said when they began their unit on soil. “It is a living thing.” Emily knew that as a living thing soil is complex and important to all other living things, but she also understood its basic textbook definition: the loose top layer of the earth in which plants grow, a layer made up of mineral and rock particles mixed with organic material. When they began to learn about erosion, Emily and her class took a field trip to a local park that has both human-made and natural spaces. The class participated in an erosion hike, recording data and their observations in their field journals. Many of her classmates were interested in comparing evidence of erosion caused by human activity with erosion caused by natural factors such as wind. The class hiked for about an hour. After the hike they gathered together in the manicured lawn of the park and discussed their observations. As soon as she got home from school that day, Emily called Logan. She was excited to share with him what she had observed on the hike. Emily told Logan how surprised she was to see evidence of a lot of erosion caused by rain. Before hanging up, Emily and Logan decided to take erosion hikes—Logan would take his along the shore of the lake, while Emily would trace the river’s edge. They agreed to record their observations and talk again in a week to compare notes.
Procedure Hike a chosen location near where you live (preferably a site with both human activity/structures and wilderness/natural space) and document your observations. Wear appropriate clothing for the location.
Let’s Do It! Once at the location, begin by observing and noting in your portfolio/notebook/journal any features which may cause or increase erosion—for example, a human-made path, a paved walkway, or a trail cut by repeated animal activity. As you hike, look for evidence of erosion. Stop and record your observations in your portfolio/notebook/journal. Make sure to include which type of erosion you see and as many other details as you can. You may want to include drawings as well.
Reflection
Learning/Inquiry Activity 8: Erosion Hike Anticipated time: 1–2 hrs
Learning Objectives
To observe and document various forms of erosion. To understand and explain how erosion caused by natural forces (wind, water, ice) and human activity impacts and changes the landscape.
Materials Pencil or pen Field journal or clipboard with paper

Unpublished Draft_3/23/2020
23
In your portfolio/notebook/journal, answer the following questions: How many types of erosion were you able to identify during your hike? List an example of each. ____________________________________________________________________________ Which type of erosion seems to be the most prevalent in the area you hiked? Explain. ____________________________________________________________________________
Activity Extension: Hike multiple locations (wilderness and urban), observing and noting varying evidence of erosion. Compare the different locations. How does erosion caused by human activity differ from erosion caused by natural forces?

Unpublished Draft_3/23/2020
24
Changes, Big and Small During the erosion hike, Emily and her classmates were able to identify types of erosion
in the area in which they live. They discussed the causes and effects of erosion on the ecosystems around Twin Falls. After the hike, Emily’s teacher directed the class to participate in a hands-on activity to further explore the concept of erosion. During the activity, Emily collected and recorded general data. As she analyzed it, she wondered how the erosion she documented was similar to and/or different from that which exists around Twin Falls in general. She was eager to call Logan and ask him about the data he collected for his class and later when he went hiking along the lakeshore. Does Sandpoint have similar types of erosion compared to Twin Falls? How does wind erosion in Sandpoint compare to wind erosion in Twin Falls? Does wind erosion have the same impact on the Sandpoint landscape as the experiment she did in class modeled?
Materials Large Ziploc (or other type) bags Hand shovel (trowel) Sand, potting soil Disposable aluminum pans (or other container) Water Measuring cup Ruler/measuring tape Blow dryer Butcher paper or other table cover Field portfolio/notebook/journal or clipboard with data sheets
Procedure Gather all the supplies needed for the activity. Using the hand shovel, fill the bags with different soil samples (you may want to purchase sand and potting soil as well). This activity is messy, so if you prefer, place butcher paper or other protective material on your table and work on the floor or work outside (if a power outlet is available). Make sure your field portfolio/notebook/journal and/or data sheets are near your workspace. Note: If you use separate data sheets, include them in your portfolio/notebook/journal. A data sheet is located in appendix 3, Soil Erosion Data Recording Sheet
Let’s Do It!
Learning/Inquiry Activity 9: The Changing Landscape (Erosion) Anticipated time: 30–45 min
Learning Objectives
To construct scientific explanations based on valid and reliable evidence from various sources (including your own observations and experimentation). To understand and explain landscape changes directly related to erosion.

Unpublished Draft_3/23/2020
25
Pile half of each soil sample in individual disposable pans/containers (saving the other half for the second part of activity). Follow steps 1–4. 1. Record the height and width of pile. 2. Determine the exact amount of water you will use (e.g., 6, 8, or 10 oz) and gently pour water over the first pile of soil. 3. Record the height and width again, then note any changes to the “landscape” of the soil. 4. Pour water from the disposable pan back into the measuring cup (being careful not to include any soil) and record the amount. Subtract this amount from the original amount poured over the soil and record that number in your field journal or on your data sheets as “amount of water absorbed.” Repeat steps 1–4 for each pan of soil. One at a time, pile the remaining soil from bags onto the table (or other hard space you are working on). 1. Record the height and width of pile. 2. Holding the hair dryer about 12–14 in away from pile (using the lowest setting), blow “wind” over the pile for 15–20 sec. 3. Record the height and width of pile again. Also, record the distance the soil traveled from the pile (if applicable). 4. Note any changes in the “landscape” of the soil. Repeat steps 1–4 for each soil type. In order to have accurate data, make sure you blow “wind” for the exact same amount of time.
Figure 10. Outdoor soil science activity. Photo Credit: Jim Ekins.

Unpublished Draft_3/23/2020
26
Reflection Compare your data results by type of erosion (water and wind) and type of soil. Discuss with your leader or parent the following questions: Was water absorbed into any of the soils? If so, was the same amount of water absorbed in each soil? Did the water cause the same type of erosion to the piles as the wind? In your portfolio/notebook/journal, answer the following questions: Did you observe changes to the landscape of the soil that had water poured over it? Explain. ____________________________________________________________________________ Did you notice changes to the landscape of the soil that had wind (applied with the hair dryer) blown over it? Explain. ____________________________________________________________________________ Have you noticed signs of water or wind erosion in your neighborhood? Explain. ____________________________________________________________________________

Unpublished Draft_3/23/2020
27
Soil at Work After studying soil and carrying out other related activities for two weeks, Emily’s class
concluded the soil unit with a final project. Each member completed an inquiry-based project that incorporated what they had learned in class. Emily chose “soil as a filter,” which required her to explore how different kinds of liquids move through various soil types. She was interested in knowing how much rain and irrigation water made it from her family’s land to the nearby river, and whether or not the soil cleaned it before it entered the river. Because soil retains water, it is subject to liquefaction. Although soil is a solid, when it gets saturated with water it can act like a liquid—hence, it subject to liquefaction. Have you seen news stories about houses sinking or hillsides sliding across roads or into buildings? These are examples of soil liquefaction. A soil’s pores, or open spaces, enable the water to move through soil. They even vary in size, depending on the kind of soil. The following activity approximates the one that Emily completed.
Materials Cups of “dirty” water [e.g., Kool-Aid, food-colored water, water with “floaters or chunks of debris” (optional)] 5-oz disposable cups, one for sand, one for sand/topsoil mix 3-oz Solo cup for every cup of “dirty” water Field portfolio/notebook/journal or data sheet to record results Stopwatch (optional) Instead of using disposable cups, you can reuse 2-l plastic bottles (one for each soil type) by cutting them in half, discarding the bottom half, covering the opening in the top half with a coffee filter, flipping it upside down, and adding the soil/soil mix in.
Procedure Filter different types of “dirty” water through sand and sand/topsoil mix. Record and compare the results.
Let’s Do It! Begin by hypothesizing what will happen when “dirty” water is poured through the sand and sand/topsoil mix. Question examples: What color of water will filter out on the bottom of the cup? What will happen to the floaters? Write your hypothesis in your portfolio/notebook/journal or on your data recording sheets.
Learning/Inquiry Activity 10: The Cleaning Power of Soil Anticipated time: 30–45 min
Learning Objectives To understand various components of Earth systems (geosphere, biosphere, atmosphere, and hydrosphere). To understand and form arguments around how Earth systems are connected. To understand and apply mathematics and computational thinking.

Unpublished Draft_3/23/2020
28
Note: If you use separate data sheets for recording, include them in your portfolio/notebook/journal. A data sheet is located in appendix 3, Soil-Filtering Data Recording Sheet Poke several holes (with a toothpick) in the bottom of the larger disposable cups (no additional holes are needed if using bottles), then fill one cup halfway with sand and the other cup with about 1 in of sand and enough sand/topsoil mix to fill the cup halfway. Place the cups into the smaller disposable cups (place a toothpick, or other support, between the cups to allow air in the bottom cup to escape). The idea is that the top cup, once set inside the bottom cup, will not fall into the bottom cup and sit on the bottom (this would interfere with the water moving from the top cup to the bottom cup. Filter: Pour your first colored water into the sand, allow it to drain into the bottom cup; then inspect the liquid in the bottom cup. Record its color and amount. Optional: you can also record how long it took the water to filter (seconds or minutes). Repeat the filter step for each “dirty” water type filtering through sand. Record whether the floaters were found in the smaller cup after filtering each. Repeat each step above with the sand/topsoil mix and record the results. Compare the results.
Figure 11. Outdoor science activity. Photo Credit: Jim Ekins.

Unpublished Draft_3/23/2020
29
Figure 12. Outdoor soil science activity. Photo Credit: Jim Ekins.
Reflection In your portfolio/notebook/journal, answer the following questions: Were your results what you expected? Explain. ____________________________________________________________________________ Is rain filtered before it enters rivers, lakes, or other bodies of water? Explain. ____________________________________________________________________________
Activity Extension: Do all soil types filter the same way? Use a variety of soils as filters. Compare the results based on soil type.

Unpublished Draft_3/23/2020
30
Section 2
Water Habitat Some activities in this section are adapted from the IDAH2O Master Water Stewards Handbook, University of Idaho Extension Bulletin 882 (2013). Other activities are created by Jim Ekins. Used with permission.
Introduction Logan and Emily grew up as neighbors in Boise. By the time they were eleven, they had
become old friends. But then each other’s family moved to a different part of the state—Logan’s in Sandpoint and Emily’s in Twin Falls. Despite the lengthy distance, they continued to stay in touch, even visiting each other a couple of times each year. Sandpoint: Logan lives in a small house in town with a yard that is six blocks from the shore of Lake Pend Oreille. The yard contains some lawn, some bushes, and two garden beds. Sandpoint receives about 32 in of precipitation each year, including over 70 in of snow. When it rains, water runs off hard surfaces in the yard and into the street, along the gutter, and into a storm drain. Logan learned that the storm drain connects to a big pipe that carries all the neighborhood’s rain runoff directly into the lake. The wastewater treatment plant a few miles away, however, does not receive storm water from the storm drains. Instead it discharges wastewater (water affected by human use) into the lake, which is a water-quality rule.
Many of the neighborhood yards along the lake, Logan’s included, are mostly lawns that run all the way to the shore. Natural vegetation along this shore, which some of the families have maintained, helps prevent rain runoff. During the winter, dealing with the runoff becomes more challenging. Sometimes after a snow, the weather warms above freezing, making it possible for Sandpoint to receive rain. If the storm drains are clogged, these rain-on-snow events cause local flooding. Widespread flooding in low-lying areas can also occur. This is due to natural stream channels or undersized driveway and road culverts that can’t handle the precipitation and meltwater. Twin Falls: Emily lives in a farmhouse built in the early 1900s just outside of town. Her family’s house sits next to a potato farm and across the street from a local dairy. Twin Falls only gets about 9.5 in of precipitation a year, including about 28 in of snow. So rain-on-snow events happen here, too. But flooding because of them occurs less frequently than in Sandpoint. During the winter of 2016–17, however, a series of severe snowmelt and rain events caused widespread flooding in the area, the worst of which caused a dairy lagoon in the nearby town of Shoshone to overflow and almost burst. Engineers straightened some of the Twin Falls area’s natural streams from their original meandering courses to enable more efficient farming operations. Other alterations over time for other streams include the reduction or removal of the protective riparian vegetation that fringes them. Some streams, however, continue to exist in a relatively natural condition.

Unpublished Draft_3/23/2020
31
Concerned about the Twin Falls area’s water habitat health, many farm owners in the area have applied combinations of “best management practices” (BMPs) to stop soil and other pollutants from eroding and entering local waterways. Controlling livestock access to streams is another important BMP that some ranchers have followed. Irrigation canals and pump systems, which pull water from the Snake River and transport it across the broad valley, have also been vital aids. Indeed, the enormous effort put into creating the canal system turned the desert into one of the country’s most productive agricultural areas. But these structures can complicate water habitat health. When BMPs are not applied, the water warms after the returning to the river via the canals, possibly causing an increase in sediment and nutrient loads.
Can you identify some of the pollution sources that might affect the water quality of Lake Pend Oreille in Sandpoint or the Snake River in the Twin Falls area? Where might the water quality be better? Or, perhaps after studying the water, you might find that the quality is different, but not necessarily better or worse in either area.
Figure 13. Shoshone Falls at high water. Photo credit: Jim Ekins.

Unpublished Draft_3/23/2020
32
In addition to the presentation, we expect you to develop one of the following record types of your field investigations:
● Design Portfolio ● Engineering Notebook ● Field Journal
The exact “look” or content style of your portfolio, notebook, or journal, is less important than the completeness to which you faithfully document your learning experiences as you progress through the program. These are commonly used types of project documentation. Do what feels right for you; the goal is to capture all that you did with this project in an easily accessible and organized format. A person with a more artistic bent might develop a design portfolio, heavy on labeled drawings, sketches with written descriptions, and other images with some context. There are many ways to create a design portfolio, including using a 3-ring binder, plain paper (no lines) drawing journal, or hardcover composition notebook. Whatever you choose, it will need to have enough pages to complete this three-year curriculum. Make sure you create a label for your portfolio--include your name, 4-H club or other affiliation, title: Wildlife and Water Habitats Design Portfolio, and any other identifying information. A person with a more mathematical mind might develop an engineering notebook with formulas, graphs, tables, and scale drawings, again with notations and context written with each. Like the portfolio, there are many ways to create an engineering notebook. You can use a hardcover or softcover graph paper notebook, 3-ring binder, plain (drawing) or lined (writing) journal, or hardcover composition notebook. Whatever you choose, it will need to have enough pages to complete this three-year curriculum. Make sure you create a label for your notebook with your name, 4-H club or other affiliation, title: Wildlife and Water Habitats Curriculum Engineering Notebook, and any other identifying information. A person who likes to write narrative descriptions might develop a field journal with written reflections about her/his experiences, but also include sketches, drawings, and mathematical formulas. There are many ways to create a field journal, including a plain (no lines) drawing journal, hardcover or softcover graph paper notebook, 3-ring binder, or journal you create from scratch (described at the beginning of this Procedure section) using cardstock (or other equally thick paper) for the cover and plain paper for the inside. Whatever you choose, it will need to have enough pages to complete this three-year curriculum. Make sure you create a label for your journal with your name, 4-H club or other affiliation, title: Wildlife and Water Habitats Curriculum Field Journal, and any other identifying information. Remember, the research tool you create will house and show your work, including drafts of your maps and any and all of your reflections as you work through each assignment.

Unpublished Draft_3/23/2020
33
Figure 14. Portfolio/Notebook/Journal Example. Photo credit: Marcie Galbreath. In addition to your portfolio/notebook/journal, you will also develop and keep a regular 4-H Record Book.

Unpublished Draft_3/23/2020
34
Chapter 1: Watersheds
What Is the Water Cycle? Emily pours a glass of water on a warm, late summer day, as does Logan four hundred miles to the north. Neither really thinks about where the water comes from nor the endless journey around and around the Earth it travels—they simply enjoy a cold, refreshing glass of water.
Last spring, Emily and her family traveled to Shoshone Falls, on the Snake River. They marveled as the rapids poured over the falls, causing clouds of mist to rise well above its lip. Amid its roar, she didn’t even think about the high mountain source of much of that water, dozens of miles away. Around the same time, Logan walked down to Lake Pend Oreille to gape at its vast body of water, yet he also never stopped to think about its origins, and how its outflow travels down the Pend Oreille River. Neither of them ever realized that these waters eventually come together hundreds of miles downstream to reach the Pacific Ocean. Even more significantly, the pair also didn’t realize the cyclical nature of water: that all of this water ultimately circles back and fills the rivers and lakes over and over again, enabling them to quench their thirst.
But that lack of understanding is about to change, ever so gradually, for Logan and Emily. Their school year starts with basic lessons about the water cycle, how water moves around the Earth: On a geologic time scale, all of Earth’s water has been circulating since shortly after the planet formed—it is used and reused over and over again. In fact, no new water exists on Earth (check out the 4-H curriculum, There’s No New Water! for a more in-depth study of the water cycle). Like most people, Logan and Emily have a lot to learn about the water cycle before they can fully grasp it. After the initial lessons, they still don’t really think about where the water all around them comes and goes. Nor do they think about what might affect the water, or how they might affect the quality or quantity of water.
Learning/Inquiry Activity 1: The Water Cycle Goes Round and Round Anticipated time: 60–90 min
Learning Objectives
To describe the concept of the water cycle, by drawing or explaining how water moves around the Earth and is recycled on the large scale.
Materials
Paper of any size (the bigger the better, up to poster size) Markers/crayons/colored pencils

Unpublished Draft_3/23/2020
35
Figure 15. National Resources Conservation Service (NCRS) depiction of the water cycle. Source: USDA, NRCS. https://www.nrcs.usda.gov/wps/portal/nrcs/detail/national/water/?cid=stelprdb1046868
Procedure Learn about the water cycle. Draw the water cycle in your portfolio/notebook/journal or on a large piece of paper. You can find an example at the U.S. Geological Survey’s (USGS) website: https://water.usgs.gov/edu/watercycle.html. You can find another USGS water cycle poster to print in appendix 3, Water Cycle Poster. Make sure your poster includes and describes all four major parts of the water cycle (evaporation, condensation, precipitation, and runoff) and that it demonstrates how water flows across the landscape. Be sure to include the following vocabulary terms and concepts:
● Evaporation ● Transpiration ● Condensation ● Clouds ● Precipitation ● Rain/snow/other precipitation forms ● Runoff ● Infiltration
● Groundwater ● Streams ● Lake/pond ● Glaciers/snow/ice ● Plants/vegetation ● Human uses (a well, an
impoundment, an irrigation channel, etc.)

Unpublished Draft_3/23/2020
36
Let’s Do It! Think about all the places around the world, especially around the area with which you’re most familiar, where water can be found. In your portfolio/notebook/journal, or on a large piece of paper, draw the water cycle in the way you understand it. Your version might be very different from other members, since we all find water useful in different ways. Also, water moves around the Earth through many different pathways; sometimes water gets stuck in the ocean, in an aquifer, or in a glacier for many years. Other times, it moves long distances in a short time. Be ready to explain why you emphasized any given water-cycle part or feature.
Reflection Think about how the water cycle looks in your hometown. Squint your eyes a little and see if you can identify places in your county or town that might fit within your water-cycle drawing. Add some place names to your water-cycle drawing if they seem to fit. You might want to ask a local water expert to help you think about the water cycle as it applies to your area. Local water experts can be found at a local irrigation district, your town’s (or the nearest town’s) water department, the town’s wastewater treatment plant, a fish and game or other natural resources management office, an agricultural pump supply or well-drilling company, or at a University Extension office. Ask the expert thoughtful questions: how the water cycle affects their job, what part of the water cycle they pay the closest attention to, how they got their jobs, and if they have advice for a member who might want to work in a similar job. Maybe ask whether your water- cycle diagram is accurate, or if they have any recommendations for adding more or other details.
Exploring your Watershed As the school year proceeded, Logan and Emily learned even more about how water flows across the landscape, particularly after it falls as precipitation. Although the places they live in look very different, they soon realized that each of them lives in a watershed. Understanding just what the word “watershed” meant, however, proved a bit challenging.
For instance, both live in the same watershed, called the Columbia River Basin, but it contains a variety of smaller subwatersheds. Logan learned that the one in which he lives is called the Pend Oreille River watershed, while Emily’s is called the Snake River watershed. However, all the water in both of their smaller watersheds eventually runs into the larger Columbia River and on to the Pacific Ocean.
A watershed is an area of land that contributes water to a specific point, usually a creek, river, or lake. Watersheds are separated by high ground, ridges, or mountains. Like any other feature on the landscape (towns, roads, streams, etc.), watersheds can be mapped and measured. To better understand watersheds and how creeks flow across the landscape and

Unpublished Draft_3/23/2020
37
form larger bodies of water (rivers and lakes), look closely at the ridges that surround each creek.
Notice where precipitation falls along a ridge. Some trickles down one side of a ridge while some go down its other side, thus separating the flow to reach different streams. The two watersheds remain separate until the two streams flow together or flow into a common water body, like a lake or bigger river. At this point, the two watersheds have connected within one, larger watershed. In this way, watersheds are “nested.” That is, smaller watersheds are part of a potentially growing network, connected when its streams come together to form ever larger basins. For example, a tiny stream near the top of a southern Idaho ridge might have a watershed of only a few acres contributing to it. When the Columbia River flows into the ocean at Astoria, Oregon, however, the watershed’s total water load skyrockets to 259,000 sq mi (668,000 km2). Comparatively, Emily’s Snake River (sub)watershed is less than half that figure, 108,000 sq mi (280,000 km2) while Logan’s Pend Oreille River (sub)watershed is even smaller, 25,792 sq mi (66,800 km2). Nevertheless, the combined land area of the Snake River and Pend Oreille River watersheds is sizable at 133,792 sq mi (346,800 km2), representing almost 52% of the Columbia River’s watershed.
Learning/Inquiry Activity 2: Basic Watershed Mapping Anticipated time: 60–90 min
Learning objectives
To describe the concept of a watershed. To comprehend that everyone lives within a watershed, that watersheds are nested, and that we all live downstream from a potential pollution source.
Materials: Paper of any size (the larger the better, up to half poster–size) Markers/crayons/colored pencils Maps and other sources of information (to help draw the boundaries of the watershed and to fill in the details of what’s going on within the watershed)

Unpublished Draft_3/23/2020
38
Figure 16. Watershed diagram. Illustration by Noah Kroese.
Procedure Learn about your watershed by using observational skills learned from section 1, chapter 1 (“What is a Habitat?”). Where does water come from? On another page, or two-page spread, of your portfolio/notebook/journal, hand-draw a map of your watershed. List and locate where you can find water in your watershed.

Unpublished Draft_3/23/2020
39
As you draw your map, identify potential pollution sources. Which places might have better water quality? Or, possibly a better way to think about it, perhaps the water quality is different in each place, but not necessarily “better” or “worse.”
Let’s Do It! First, define “your watershed.” You may choose to define your watershed based on a local stream, or for any other scale (like two local streams that converge or a larger river) that works for where you live. Remember that the smaller the watershed area you choose, the more local detail you will be able to add to your map. The larger the watershed area means you will need to add fewer details from more distant places. Where are the boundaries of your watershed? Can you figure out how big the watershed is? Some online mapping websites have watershed information. Look up “Waters GeoViewer” (https://www.epa.gov/waterdata/waters-geoviewer), click OK, and enter your town name into the “Find surfacewater or place” search bar at the top-right. Then click on the “Feature Layers” expansion arrow at left to find and then turn on “Surface Water Features;” next, click the expansion arrow next to “Surface Water Features” to find the “Hydrologic Units” tab so that you can activate (with a click/check) the lines showing watershed edges; lastly, zoom into your watershed. As you zoom in and out, smaller and/or larger watersheds will appear, nested within yet larger watersheds. Smaller watersheds remain hidden until you zoom in. With the cursor inside any watershed boundary, a mouse click will bring up information about the watershed, including its size. In the United States, land is usually measured in acres, but the GeoViewer also provides the area in square meters, too.
Essential elements in creating a map: Maps are visual representations of a land area. No map is a perfect model of a land area but it highlights the important elements of a place. Any map needs to include the following basic elements:
Data frame (the map itself) Legend (decodes the symbols used to represent land features) Title (a succinct description of what the map shows) North arrow (to orient the viewer. Most commonly located toward the top of the page) Scale [explains the size of the map compared to the real world as a ratio. A map with a scale of 1:10,000 means that one unit of distance on the map (in, cm, ft, etc.) equals 10,000 of the same unit on the ground. Or, different unit types can be compared (e.g., 1 in = 100 ft). The ratio can be displayed as a scale bar. A map can be made “not to scale.” That is, the map does not necessarily depict the landscape as a ratio to the real world. These maps may emphasize some areas over others by making them appear bigger than others.] Citation (information about the data used in making the map, the type of map projection, and other information about making the map that could be useful to the reader. This is the “small print” often located in a bottom corner of the map)

Unpublished Draft_3/23/2020
40
Locate political and geographical boundaries precisely, plus the locations of streams and roads. Locate your house and your school. See if you can locate your friends’ houses and other landmarks that you are interested in. Locate all the land uses you can think of (farms, ranches, forest areas, towns, etc). Once you are satisfied with your map, be sure to add a note or explain how your watershed is nested within larger watersheds, and what are the neighboring watersheds. Keep in mind that the next activity will require you to redraw your map.
Reflection Think about how much water falls on the land area of your watershed. Answer the following questions on another page of your portfolio/notebook/journal:
● How much precipitation (inches of rain) falls where you are? ● How does that precipitation fall (as rain or as snow)? ● Does more fall in some places than others?
See appendix 2, Advanced Activity 1 to learn how to calculate the total volume of water that falls as precipitation within your watershed.

Unpublished Draft_3/23/2020
41
Functions of Watersheds As Logan and Emily continued to learn about watersheds (and the watershed in which they live), they realized that thinking about watersheds is a useful way to learn about their communities. It’s also fun to think about how their communities developed around the water that was available to early settlers.
Logan looked around at the mountains that feed water to Lake Pend Oreille. He thought about how Sandpoint and other nearby towns are situated on the more level lands between the base of the mountains and the lakeshore. He recognized that, besides the larger streams and rivers, like the Pack River and the Clark Fork, many small streams flow through parts of these towns as they wend their way from the mountains to the Pend Oreille River. Soon he started to wonder how all the hubbub of the city streets and parking lots affect the streams.
Emily looked around instead at the irrigation canals that deliver precious water to local farms and dairies. She also noticed the mountains beyond the Snake River Plain and the agricultural lands that lay below their base, which sparked her curiosity. Somehow the canals are able to bring water to farmland that is far away from and at a higher elevation than the river. She knew that water can’t flow uphill, so how, she wondered, does it get up there from the river?
Logan and Emily next learned about how people have worked the land for thousands of years in both north and south Idaho. American Indian tribes managed the landscape with fire and agriculture to increase their food sources and to improve transportation routes; later settlers used other means.
They also learned about Idaho’s geology and its relation to the state’s agricultural development. North Idaho landscapes vary greatly, with desert canyons in the Snake and lower Salmon River areas, rich Palouse soils in north central Idaho, the Rathdrum Prairie bounded on the east by Lake Coeur D’Alene and Pend Oreille, and the deep, far north Idaho valleys of the Purcell Trench, Selkirk, and Cabinet Mountains. The diversity didn’t initially prove beneficial for farming. The first farmers in southern Idaho had to rely on meager stream water from the mountains to irrigate crops and water livestock that lived on the high desert range. But the big water-channel projects that arrived later sparked the conversion of larger areas of high desert land into farms and dairies. Think like a Hydrologist
Watersheds help everyone. Land managers, town leaders, farmers, ranchers, and irrigation district staff in particular appreciate the value of water use and availability. Hydrologists are scientists who study how water moves through a landscape. Hydrology is a complicated science, since there are many ways for water to flow through a watershed. For these chapter activities, you’ll need to think like a hydrologist to be able to look at your watershed and to understand the behavior of water through it. You’ll need to consider the role of topography, terrain, even basic plant biology. One of the ways water “moves” is by transpiration—transforming into vapor that releases into the atmosphere. From there, it can change again, often into rain, and fall somewhere else. Water taken up by plants also returns to the atmosphere through transpiration. In this instance, transpiration resembles perspiration in people, except that in plants water evaporates through small pores on the underside of leaves.
Another way that water behaves through a watershed involves snow. Water that forms into snowfall is stored in the mountains until it thaws in the spring and summer. Some of the

Unpublished Draft_3/23/2020
42
precipitation filters into the soil and is processable by plants, but some of it flows even deeper into the ground, eventually recharging the Snake River Aquifer. Here it flows slowly, trickling within small spaces, like rock cracks, and spaces that are even tinier, like those between sand grains and other deep soils. The flow into an aquifer or groundwater reservoir is vital for the watershed, for it supplies water for wells and for the springs that recharge the Snake River downstream.
Streams are important conduits for the movement of water through a watershed. Some of them flow from the highlands before reaching the broad Snake River Plain. Although most streams go dry during the summer, some of their water naturally seeps into the ground to recharge the aquifer, a process known as a “losing reach” because the stream is leaking water into the aquifer. True to the cyclic nature of water, aquifer water reenters the stream farther down in “gaining reaches,” where the stream obtains water from the ground.
Thus watersheds cyclically capture and transport water across a variety of landscapes. They also store and slowly release it. When doing the latter, water seeps into the soil, where it is stored in the way a sponge soaks up water and holds it. Then, over time, gravity pulls the water downhill through the soil. The process eventually circulates the water into streams and lakes through groundwater and springs. In fact, streams are usually located where the level of the groundwater intersects with low points on the landscape.
Procedure Take some time to imagine how water flows through the ground. Add details to your watershed map to visualize where water exists on the map and how water flows across the landscape. In a sense, you will become a hydrologist for a short time.
Let’s Do It! Using your previous watershed map as a rough draft, build a new, revised, and neater watershed map with details about how water moves through the watershed, how and where water is used, and other landscape details. Add the details from the watershed map you started in the previous chapter by redrawing it on a larger sheet of paper or poster board and preparing to include the items from this chapter. Suggested items for inclusion:
● List and identify on your watershed map where you can find water in your watershed ● List and identify on your watershed map the different ways humans use the landscape
and how water supports these uses. Note historic and current uses of the land and the
Learning/Inquiry Activity Three: Advanced Watershed Mapping Anticipated time: 60-90 minutes
Learning Objectives
To learn various ways water moves through the watershed. To learn the beneficial uses of water in the watershed.
Materials
Half-sheet of poster board (14” x 22” a half-sheet of standard poster board)
Markers/crayons/colored pencils Students will need maps and other
sources of information to help draw the boundaries of the watershed, and to fill in the details of what’s going on within the watershed.

Unpublished Draft_3/23/2020
43
water. Make a list of all the human uses of water, or “beneficial uses” within the watershed.
● Identify where forests exist (if they do exist in your watershed). Where are farms? Where are cities?
● List and identify where water is stored for future use, including soil moisture, groundwater (aquifers), and surface lakes and ponds.
● Identify irrigation canals and rivers. If you can, add smaller tributary streams that flow out of the high country.
Reflection The next time you are outside or are in a car, look at the landscape around you. Find the highest ridges you can see. Try to see the lower ridges, and even high areas, in a relatively flat landscape. Imagine water flowing from those high to low areas. Notice that streams flow downhill while irrigation channels flow across slopes to deliver water to as many farms as possible. Notice that mountain streams or streams in steeper hills are relatively straight, but when they get to lowland, flatter areas, they begin to meander across the landscape in S-shaped curves. In some places, streams that used to meander have been straightened to make it easier to farm. While increasing the amount of farmland, alterations like these also reduce stream habitats and the amount of water that can seep into the ground. Water that is stored in the ground is essential later in the year, especially the driest part of summer, when it will seep back into the stream. In your portfolio/notebook/journal, briefly describe one of the areas (think, small-scale, here) you looked at and included in your map.

Unpublished Draft_3/23/2020
44
Chapter 2: Water Quantity and Quality
How Do We Use Water? Logan and Emily have learned a lot about the water that flows across the landscape near where they live. They’ve learned its origins, where it goes, and how it all cycles back eventually to flow across the landscape again and again. They have also learned a little bit about how the agricultural industry, other industries, and people use that water. One day, as Emily poured a glass of water from the tap, she realized that the water flowing into her glass was very clear. She wondered about why this water was safe and tasty to drink and how it came to be that way. She brought this thought up with Logan the next time they talked. They struggled to understand why some water was okay to drink and other water was not. Logan thought that his tap water came from a well that drew from an underground source, was naturally filtered, and thus was innately cleaner. But if all water on Earth cycles everywhere, Emily figured that the water that is currently underground must have been aboveground at some point. Similarly, Logan wondered why it was okay for animals to drink stream water, but not for people. He and Emily had noticed that most livestock in their areas preferred clear water pumped to a stock tank than muddy water from the closest stream. Cows in Emily’s neighboring farm would even walk farther to drink clean water than scramble down the bank to drink muddy creek water. Along with wondering how changes in water quality affected other animals, Logan was also curious about how they affected crops that rely on irrigation water. He had heard that some industry sectors required extra-clean water for manufacturing processes. He questioned how that was possible, and how industry was able to find extremely clean water before modern technology made it possible to produce it.
Learning/Inquiry Activity 4: Water-Use Calculations Anticipated time: 4 hrs (2.5 hrs indoors, 1.5 hrs outdoors)
Learning Objectives
To describe how water is used domestically, both inside the home and outside of the home. To describe how water is also used in agriculture, industry, power generation, and other societal uses. To explain why some water is left in the streams for fish and wildlife.
Materials: Measuring cup(s) Containers of known volume (e.g., buckets, gallon jugs, quart and/or pint jars) Stopwatch or timer At least 8 tuna-type cans (cat food cans or other similarly shaped cans) Information about your household’s appliances

Unpublished Draft_3/23/2020
45
During their phone calls, Logan and Emily told each other how much they enjoyed spending free time near the lakes and rivers near their homes. The look and feel of the landscape by the Snake River, Clark Fork River, or Lake Pend Oreille brought each of them peace and provided them with a quiet, reflective place. These shoreline spaces were entertaining, too, with ducks and fish and bugs and all sorts of sounds. One day, a water manager from Emily’s and Logan’s city came to either’s classroom and gave a presentation on the way water is transported and used within the city. Emily and Logan learned that one of the first things they could do to protect their area water resources was to understand how they use water inside and outside of their homes. From that knowledge, they could find ways to reduce their water use. You can do this exercise, too, by remembering the scientific method you learned in section 1, chapter 2, Science in Action section. The water-use calculator (see instructions below) will help you to do that.
Procedure Carefully read the following instructions from appendix 1, Indoor Water-Use Calculation Instructions and Outdoor Water-Use Calculation Instructions. In this activity, you will calculate all the water you use inside and outside of your house each day. But before you begin it, read through the questions listed below. Then work with everyone in your household to calculate how much water your entire household uses each day. The tables in appendix 3, Indoor Water-Use Calculation Table and Outdoor Water-Use Calculation Table, give you an idea about how to set up your own data tables, but they may not be perfectly suited for your situation. In that case, follow the structure of these tables to create your own, preferably using a computerized spreadsheet. You may add columns or rows as needed to neatly collect and write down your water-use data. For instance, you may wish to add columns for each of your family members and/or other people who currently occupy the house. You may also identify additional water usage not mentioned in the text and tables above; in that case, determine the amount of water typically used in an average household for that new use and calculate the amount of water used in your household to the best of your ability.
Let’s Do It! Wasting Water? Or, Using Water Wisely? 1. Form a hypothesis: In your portfolio/notebook/journal, try to guess how much water you think you use in a day. Note that a big soda bottle is 2 l, or about a half gallon. You probably know what a 1-gal milk jug looks like; same with a 5-gal bucket. Record your prediction in your portfolio/notebook/journal (in liters or gallons). 2. In your portfolio/notebook/journal, write down each daily activity during which you use water. You may also use the data sheets/forms you’ve created or that are provided in the calculation instructions from appendix 1. Note: if you use separate data sheets for recording, include them in your portfolio/notebook/journal.

Unpublished Draft_3/23/2020
46
3. Use the charts in appendix 3, Indoor Water-Use Calculation Table, and Outdoor Water-Use Calculation Table to calculate the water used for each activity. 4. Calculate the actual amount of water your household uses indoors daily. Record the amount in your portfolio/notebook/journal. 5. In your portfolio/notebook/journal, create a chart or spreadsheet to determine how much water your family uses on the lawn and for any other outdoor use on a given day. If your parents wash a car once a week, for example, you can divide that water use by 7 to average the usage out per day (it’s not really fair to calculate washing a car every day if it’s only done once a week). Make sure to add a space in the table for determining how much water your family uses for washing cars and other outdoor items. 6. Calculate the amount of water used outdoors in a day. Write that down in your data sheet. 7. Add your indoor use to your outdoor use. This will provide a close estimate of your total water use each day. Write that down in your data sheet. 8. Compare your results with the prediction you made in your response to the first question, above. In your portfolio/notebook/journal, reflect on them: How did your prediction compare with your findings? Did anything surprise you? Note: Lawn irrigation isn’t the only way we use water outside of the home. In fact, many houses don’t have lawns! Or, if you live in an apartment, you might not be able to do this activity without contacting the apartment management. Additionally, your family might irrigate some plants using drip hoses or some similar method. If you have a garden, your family might use other types of irrigation techniques. If your parents wash their cars in the yard, that is a significant use of water. You can roughly determine how much water your family uses for each of these via the techniques suggested above or via the following: For instance, determine how much water comes out of the hose per minute by using a stopwatch to measure how long it takes to fill a bucket of known volume. Then, time how many minutes your parents keep the water on while washing the car. Drip hoses and emitters will be difficult to directly measure the water output, but you might be able to figure out a way to calculate those measurements. For example, use a measuring cup and a timer to measure the emitter’s output, then multiply that by the number of emitters on the system. Coil up a new drip hose in a bucket or other container of known volume; then, using a stopwatch or timer, measure how long it takes to fill that known volume. Whatever situation you face, do the best you can to estimate how much water is used outside of your house.
Reflection In your portfolio/notebook/journal, respond to the following prompts:
● How can you use less water? ● Name at least three things you can do to use less water right away.

Unpublished Draft_3/23/2020
47
● Will using less water result in any serious discomfort? Next steps: Keep track of everything you do for an entire week that involves the use of water. What differences do you see day to day? Write or draw your experiences in using less water in your portfolio/notebook/journal. Beyond the water used directly in and around the home, water is used in industry, agriculture, electricity generation, mining for minerals, and many other sectors of the economy and society. Determining a person’s direct water use in and around the house is relatively straightforward. But that is only one part of your water footprint. Everything you purchase or consume requires water in its production. Fortunately, there are websites that can help you to determine your indirect water use. The Water Footprint Network provides a calculator program here: http://waterfootprint.org/en/water-footprint/personal-water-footprint/. Keep in mind that every “water footprint calculator” uses assumptions to determine water use for a given product. The assumptions may or may not be accurate for your particular situation, so try to identify the assumption related to each step in the water footprint calculator; in other words, don’t take its assessment literally. Nevertheless, calculating your indirect water footprint is a good exercise so you can begin to realize how much water the United States uses. As an “extra credit” exercise, in your portfolio/notebook/journal make a list of the contents in your refrigerator and determine how much water was used to make all of that. In fact, how much water was used to make your refrigerator? How about other things in your household, like televisions, video game consoles, appliances, etc.?

Unpublished Draft_3/23/2020
48
What is Water Quality? Logan and Emily soon noticed that completing all of the latest assignments had strengthened their understanding of their watersheds and how humans use the landscape within them. They comprehended more about how water flows across the landscape within each of their watersheds, and more easily appreciated that it’s a cyclical relationship intimately related to how people use the land, where they live, and the locations of farms, forests, and the high country.
While driving around with their parents, they started to notice that water flowing in the mountains “looks” different than the water that flows through the lowlands. Mountain streams were clearer, with rocky stream bottoms. Water in lowland streams often appeared cloudy or took on the color of the soil it flowed through. River and lake water also looked different to them. River water flowed in smaller amounts; and it often looked cloudier than lake water, though sometimes in the heat of summer, water in smaller lakes looked greenish. Captivated by their observations, they began to write to each other about their observations, particularly regarding the streams, rivers, and lakes located near each of their homes.
Logan started off by focusing on Lake Pend Oreille, which he said is big and deep and seemed to be clear, except near the shore where streams flow in, or when a storm seems to kick up bottom sediments. The Clark Fork River, which flows into the lake, explained some of the lake’s cloudy appearance. Plus, it is sometimes muddy itself, with what looks like soil that eroded from somewhere upstream. He also noted that the Clark Fork flows out of a large area of Montana. Smaller streams and rivers flow from the mountains and feed the lake, too. He learned that one of these streams supplies some of Sandpoint’s water. He added that people are not allowed to enter the entire watershed that flows into this stream in order to protect its water quality so that it can be treated for the city’s residents to use.
Emily focused her letter on the Snake River, how it begins in the east, including Wyoming and parts of Yellowstone and Grand Teton National Park. As it arcs across southern Idaho, streams and smaller rivers add to its flow, she wrote, particularly those from mountains to the south. Streams and smaller rivers flow from the northern mountains, too. But their contribution is more complicated. Most of these waterways “disappear” into the wide, flat Snake River plain, where their water percolates through the soil and cracks in the underlying rocks into a vast aquifer. Eventually, this water, she learned, resurfaces into the Snake River from big springs located along the river’s canyon. She also learned that Snake River water reaches farms across the valley via irrigation channels. Below these diversions, a small amount of water remains in the river for the fish and aquatic bugs that live there.
You have heard about the concept of “water quality.” But what is water quality, anyway? Can you define it? It’s not too easy or obvious, because it is a relative term. That is, water quality can still be acceptable for one use, but not for another, or acceptable in one location but not in another. Indeed, water habitats vary widely among different types of water bodies, which complicates its meaning. The remainder of the activities in this book will help you to appreciate that complexity. With its focus on water quality, its measurement, and the various habitats that exist in water bodies, this program will help you to explore the relationship between water quality and differing water habitats. Along with learning some basic water-quality testing techniques, you’ll also investigate some of the living organisms that inhabit our waterways,

Unpublished Draft_3/23/2020
49
particularly macroinvertebrates (aquatic insects, snails, etc.). Their condition helps us to determine the health of a given body of water—its habitat—and hence its water quality. You’ll also gain knowledge about other important criteria that affects water-quality assessments, such as the amount of dissolved oxygen available for fish. Because water contains many dissolved and suspended substances, conditions like this need to be assessed.
Natural processes constantly add substances to the water through the breakdown of rocks, plant matter, and soil. If that doesn’t muddy a body of water enough, people add other materials, much of them pollutants, like drops of oil from cars. Toxins like these enter a waterway via hard surfaces like rooftops and parking lots, whose “impervious surfaces” prevent rainwater and snowmelt from filtering through soil. Without soil as a filter, pollution all too easily flows directly into the nearest stream or lake.
When we manage water carelessly, we reduce its quality and therefore the amount available for use. The U.S. Environmental Protection Agency (EPA) sets the recommended standards which all states either comply with or improve on in the hopes that we will allow our streams and rivers to continue to thrive or be supportive of “beneficial use.” Recreational use (like fishing or swimming), irrigation, or the existence of diverse aquatic life are a few examples indicative of beneficial use. Pollution or low water supply potentially indicate otherwise. Standards are set so that streams or lakes should support beneficial uses. If the stream doesn’t meet the standards, or doesn’t support the beneficial uses, it is considered “sick” and a prescription is written for it, as a doctor would write a prescription for you when you are ill. In either case, if you follow the prescription, conditions should improve.
Regionally, the Idaho Department of Environmental Quality (IDEQ) sets and monitors water-quality standards for surface water (lakes and streams) across the state. It also designates each stream and other body of water in the state as providing a range of beneficial uses. One of the beneficial uses requires the cleanest water as a top priority, meaning that water-quality assessments must meet that criteria first. For instance, a stream provides a spawning habitat for trout (a cold-water fishery), but it also provides irrigation water. Since irrigation water requires a lower level of quality, the use requiring the cleanest water prioritizes trout. Yet the benefits to protecting water quality go beyond a simple metric of fish health. As an example, according to Idaho Department of Fish and Game, “in 2003, anglers spent $438 million in direct expenses while fishing in Idaho. It means the state's 400,800 anglers each spent an average of $150 per trip in 2003, or $112 per day while averaging nearly 10 days of fishing” (Source: https://idfg.idaho.gov/press/survey-fishing-has-major-impact-idaho-economy.)
Some of the criteria set by these agencies (temperature, pH (acidic or basic), and clarity) we can easily assess with inexpensive and readily available equipment. Other criteria are more difficult to measure, such as specific pollutants, nutrients, conductivity (amount of dissolved

Unpublished Draft_3/23/2020
50
solids), dissolved oxygen, and hardness (amount of calcium and similarly dissolved minerals). But we can obtain their measure by using equipment or materials that are available online.
As you work through this activity, think about what influences the quality of our water. How does “stuff” get into the water in the first place? Focus on the concept of “assessment” more so than “criteria,” but remember that the concept of water-quality criteria allows us to compare our assessments from one place to another. A few safety rules: Overall, always consider your well-being your top priority.
● Always conduct monitoring with a “buddy” or team member. Never approach streams alone.
● Always let someone know where you are going and how long you will be gone.
● Use caution when entering a stream, making sure you can get out, that the current is not too strong, and that the bottom will support you safely.
● Do not attempt to enter water if the stream is too deep. As a general rule, above your knees is probably too high.
● Always conduct monitoring during daylight hours. ● Wear waders or river shoes (old tennis shoes) to avoid cutting your feet on submerged
glass, metal, or sharp rocks. ● Be aware of possible dangers, such as poisonous plants, unstable banks, wildlife,
stinging insects, and livestock. ● Dress appropriately for the weather. Know how to recognize the signs and symptoms of
both heat exhaustion and hypothermia and know how to treat them. Most importantly, know how to prevent them.
● Wash up thoroughly with hot water and soap when you get home. If you are monitoring in areas with potential contamination, such as mine wastes or harmful cyanobacteria (blue-green algae) blooms, you may want to participate in additional safety training before entering the stream.
Learning/Inquiry Activity 5: Physical/Chemical Water Quality Assessment Anticipated time: 3 hrs (1 hr planning, 2 hrs outdoors)
Learning Objectives
To list and describe how beneficial uses of water are impacted by water-quality standards. To perform specific water-quality tests and document the results.

Unpublished Draft_3/23/2020
51
Figure 17. Always monitor water quality with someone else present. Photo: Jim Ekins.
Materials ● Monitoring Plan form (see appendix 3, “Monitoring Plan Worksheet,”; complete this
before you begin monitoring your water body) ● Assessment form (see appendix 3, “Physical/Chemical Assessment Form,”; also, you
might print it on Rite in the Rain Paper) ● Clipboard, pen or pencil ● Thermometer (any waterproof thermometer should work, not the bimetal type with a dial,
but the liquid-filled type works best. You can also use a digital-probe type, too, if you have one handy.)
● Transparency tube if you are assessing a stream (see instructions for building one below) or Secchi disk if you are assessing a lake or pond (Oklahoma State 4-H program has good instructions for making a Secchi disk for measuring lake water clarity: http://nrem.okstate.edu/Extension/documents/sport%20fishing/aquatic%20ecology/7c_homemade_sampling_gear_secchi_disk.pdf
● pH Test strips or a pH meter: any test strip used for aquariums, pools, or hot tubs will work. University of Idaho Extension’s IDAH2O program uses a specific type that works better in “un-buffered” solutions and can be purchased directly from the Hach company: https://www.hach.com/ph-test-strips-4-9-ph-units/product?id=7640211607&callback=pf

Unpublished Draft_3/23/2020
52
(pH meters can be purchased from a number of online stores. Your local Extension office might have pH meters or strips available for checkout.)
● Meter stick (you can use a yardstick, but you will need to recalculate your measurements into metric units)
● 30-m (100-ft) tape measure ● Clothing appropriate for the weather and stream ● Tennis ball with string to measure stream velocity (but any floating object, measured
over a given distance, will work)
Procedure Use the “Physical/Chemical Assessment Form” located in appendix 3 to help you organize your water-quality assessment. Detailed directions and reporting procedures for each assessment are found in appendix 1, “Physical/Chemical Assessment Instructions.” These assessments are adapted from the statewide IDAH2O Master Water Stewards program, a University of Idaho Extension citizen science volunteer program.
Let’s Do It! Before you get started, you’ll need to do some planning and pre-preparation. Add the water site whose water quality you’ve chosen to assess to the IDAH2O Master Water Stewards online system for collecting water-quality data. You will also need to spend some time thinking through why and how you will do the monitoring, so that you can be more efficient—that is, avoid duplicating someone else’s efforts. Please email the IDAH2O Program Coordinator ([email protected]) about your intent to start monitoring, then answer the questions in the Monitoring Plan Worksheet, appendix 3 to plan out your activities.
Figure 18. IDAH2O web data upload application. Here’s where you will go to upload any water-quality data.

Unpublished Draft_3/23/2020
53
Use the monitoring plan questions to build your outline. Send your answers via email to the IDAH2O Program Coordinator ([email protected]). You will need to receive permission before you can begin monitoring. The IDAH2O program will assign your site a site number and will enter it into the system, which is used by trained volunteers known as Master Water Stewards. You will also receive a username and password to access the IDAH2O data upload webpage. Once the IDAH2O Program Coordinator has granted you permission, begin monitoring your site. Using the “Physical/Chemical Assessment Instructions” found in appendix 1, conduct your assessment; enter your findings on the “Physical/Chemical Assessment Form” from appendix 3. Each time you collect monitoring data at your site, you will also need to enter the data from the form into the online site. The online form looks just like the form, so your copying it off should be a fairly simple, though repetitive, task. We recommend monitoring no more than three sites; furthermore, we suggest that you start with only one and then work your way up to a second and maybe a third site after the monitoring techniques have become more familiar and your confidence about your ability to do it properly have grown.
Reflection What were your first impressions of the water quality at your monitoring site? In your portfolio/notebook/journal, reflect on the following prompts:
● Did the water quality appear better or worse than you had thought before you measured it?
● Do the data support your initial opinion about the water quality? ● Write down all your thoughts about how you felt about the water body before and how
you feel about it now within the context of what you know about the watershed in which it’s nested.

Unpublished Draft_3/23/2020
54
What is Water Pollution? Emily and Logan had taken quite the journey in learning about water habitats. They never knew how complex the subject of water could be—how water flows across the landscape and around the world, how people use water in many different ways, and how they use water themselves. Capable of conducting objective studies of the water quality of streams and lakes, they could also determine some of the basic physical properties of water bodies. One day, Logan’s newfound curiosity drew him to read a newspaper article about a far-away chemical spill. The spill had killed a lot of fish and had rendered the river unfit for drinking for weeks. The story sparked his interest in the effect humans can have on the quality of water in lakes, rivers, and in the ground. Soon he searched for other news stories about water quality that had been negatively affected by accidents or human action. He discovered that throughout history people have caused great damage to streams, lakes, and groundwater by releasing pollution either accidentally or intentionally. He shared with Emily an old story about how some rivers in America caught fire way back in the late 1960s because various industries had allowed large amounts of petroleum (like oil and gas) and coal dust to release into nearby waterways. Emily could scarcely believe that people could be so callous. But in reading further, both Emily and Logan discovered that, historically, dumping waste into the streams and rivers was “just the way things were done,” an unfortunately normal response that even today is used to justify similarly risky or questionable acts by humanity. In preparation for a guest speaker in their classes, Emily and Logan worked on separate reports about the history of water resources in Idaho and America. They found out that the first law to protect water quality was the Rivers and Harbors Act of 1899 (a section of which is called the Refuse Act). Before its passage, all sorts of waste debris, including derelict buildings, solid waste, dead horses and oxen, and other awful things, were simply dumped into rivers without penalty and washed out to sea. With populations increasing in cities with harbors, this practice began to interfere with shipping commerce—loaded ships couldn’t dock safely because of all the discarded debris floating around them. Encroachments like bridges and piers, whose installation increased as the nation’s cities grew, only added more hazards as navigational blocks. This act was a first step toward trying to solve this problem, for it prohibited dumping debris or creating channel hazards without a permit. It was revised numerous times, eventually providing the foundation for the Clean Water Act of 1972. Emily was surprised to learn that the Clean Water Act started as a weak law in the years right after World War II before Congress passed it in 1948. Initially, it funded research projects on the water-pollution problem. Researchers discovered that the problem was so big and complex that legislators scripted additional versions of the act that Congress passed during the 1950s and 1960s. By the 1960s, the problem became even more visible. In 1968, four U.S. rivers in the caught fire. Time magazine published a cover story about one of them at the Cuyahoga River, in Cleveland, Ohio.

Unpublished Draft_3/23/2020
55
With news coverage like this, Americans grew direly concerned about the condition of the nation’s rivers and streams. Logan discovered that, charged by the public outcry, Congress united on the issue over the next four years, a solidarity which led to the creation of the modern Clean Water Act. This legislation passed courtesy of a big bipartisan majority (that is, lots of support from Democrats and Republicans). Although it was vetoed by President Nixon, another strong bipartisan congressional vote easily overrode it.
After reading the actual bill, Emily and Logan were impressed. It really seemed comprehensive. Researching further, they discovered that environmental historians pretty much agree: the act established the basic approach still largely in use today to regulate the release of pollutants in the nation’s waterways. It funded state-of-the-art wastewater treatment plants to get rid of sewage safely, provided a framework for assessing how pollution affects rivers, established a permit system for municipalities and industries that need to discharge pollutants, and, perhaps most importantly, it established a system of fines for those entities that violate allowable wastewater loads. The resulting reduction of pollution after the act’s 1972 passage allowed many water bodies to recover from decades of pollution.
But then they learned that the recovery it had established hit a plateau after about a decade of success. The act addressed only one type of pollution, “Point Source Pollution,” which comes from a single location. The second type of pollution, “NonPoint Source Pollution,” sometimes also called “stormwater,” is sneakier. It collects in small amounts from many places within a watershed, and is difficult to track and thus regulate effectively in most cases. Because members appreciated that there are ways to naturally treat pollution before it gets to waterways, Congress passed in 1987 an updated version of the act that funds more eco-friendly projects, including bioengineered stormwater pollution treatments, bioretention ponds, and engineered wetlands. The revised approach has proved quite durable. Today, the Clean Water Act remains very much the same as its 1987 version; thus its policies continue to protect our water resources in very efficient and effective ways. Exhausted but invigorated by all of this research, Logan and Emily brought their respective history reports to class. They felt well prepared for their guest speaker.
A water-quality educator from the IDEQ visited each of their classrooms during Water Awareness Week in early May. The water expert talked about how the Clean Water Act protects water quality, and how pollution impacts water. She explained that the genius of the Clean Water Act is that it regulates pollution so that the it does not adversely impact a water body’s “beneficial uses.” She listed some of the types of beneficial uses: agriculture; domestic water supply; aquatic life, like fish; wildlife; and even aesthetics. Each of these, Logan and Emily realized, are protected by the Clean Water Act of 1972 and 1987. The educator stressed that every water body helps to support many of these important uses. She said that IDEQ designates each stream and body of water in the state as a source for a range of beneficial uses, like the cleanest water. This is a basic and important beneficial use for the agency because standards and assessments of water quality are based on it. For instance, a stream may provide spawning habitat for trout (a cold-water fishery), but also irrigation water. Since irrigation water requires a lower level of quality, the use requiring the cleanest water prioritizes cold-water aquatic life like trout.

Unpublished Draft_3/23/2020
56
She provided the group with other examples of beneficial use that her agency deals with. When determining which beneficial uses a water body should support, a water manager must consider many factors, especially how humans, other living things, and natural resources actually use it; the ability of the water to support a range of those uses in the future; and whether or not it can support aquatic life and recreation where attainable (the basic goal of the Clean Water Act for all water sources). She also made it clear that the dumping or dilution of wastewater or pollution is never a beneficial use in Idaho, and that while few water bodies are managed for all of the state’s identified beneficial uses, all water bodies are managed to support more than one beneficial use. IDEQ sets minimum water-quality criteria so that it can manage the most sensitive water body’s designated beneficial uses. She closed by going over a list of potential beneficial uses in Idaho and how pollution affects a waterway’s retention of beneficial-use status.
Aquatic life. Animals and plants also use water and, of course, the fish and aquatic bugs they eat must have enough water to live in.
Cold water: Water quality appropriate for the protection and maintenance of a viable aquatic life community (cold-water species) Salmonid spawning: Provides or could provide a habitat for active, self-propagating populations of salmonid fishes Seasonal cold water: Water quality appropriate for the protection and maintenance of a viable aquatic life community of cool and cold-water species, where cold-water aquatic life may be absent during seasonally warm temperatures or tolerant of them Warm water: Water quality appropriate for the protection and maintenance of a viable aquatic life community for warm water species
Figure 19. Cold-water aquatic life. Photo Credit: Jim Ekins.

Unpublished Draft_3/23/2020
57
Recreation. Primary Contact Recreation (PCR): Water quality appropriate for prolonged and intimate contact by humans or for recreational activities where the ingestion of small quantities of water is likely to occur. Such activities include, but are not restricted to, those used for swimming, water skiing, or skin diving. Secondary Contact Recreation (SCR): Water quality appropriate for recreational uses on or about the water and which are not included in the primary contact category. These activities may include fishing, boating, wading, infrequent swimming, and other activities where ingestion of raw water is not likely to occur.
Figure 20. Fishing is a form of secondary contact recreation. Photo credit: Jim Ekins. Water Supply. Public drinking water is treated before it is delivered to the tap; a separate set of standards governs treated drinking water. Domestic Water Supply: Water quality appropriate for drinking water supplies Agricultural: Water quality appropriate for the irrigation of crops or as drinking water for livestock. This use applies to all surface waters of the state. Industrial: Water quality appropriate for industrial water supplies. This use applies to all surface waters of the state.
Figure 21. Water used in agriculture to irrigate crops. Photo credit: Jim Ekins.

Unpublished Draft_3/23/2020
58
Wildlife Habitats. Water quality appropriate for wildlife habitats. This use applies to all surface waters of the state. Aesthetics. This use applies to all surface waters of the state; water is pleasing to the eye, so aesthetics (natural beauty) is important, too.
Figure 22. Aesthetics is an important beneficial use of Idaho waterways. Photo credit: Jim Ekins. For more information, check out IDEQ’s web page about Beneficial Uses: http://www.deq.idaho.gov/water-quality/surface-water/beneficial-uses/. Other states may manage their water bodies for additional beneficial uses: Mining Fishery Fire protection Dust suppression Culinary Erosion control Geothermal Groundwater recharge Instream flows
Milling Pollution abatement Power/power generation Sediment control Silvicultural Snowmaking Storage Waterfowl

Unpublished Draft_3/23/2020
59
Water is considered polluted when it cannot support one or more beneficial uses because concentrations of one or more substances is too high (or, too low, in some cases like dissolved oxygen). If, for instance, a water body is designated for drinking water purposes, and some sort of chemical spill has occurred, it would no longer support that beneficial use since chemicals can be toxic to people, and the toxins cannot be easily removed from water. Pollution can come from a single point that is identifiable and can be managed or eliminated. Wastewater treatment plant outfalls are one example, where treated wastewater is discharged into a water body. While usually rather clean, treated wastewater can retain some bacteria and a higher temperature than a water body. Bacteria and temperature increases can thus impair a water body’s ability to support beneficial uses. If point-source discharges are improperly managed, the owner or manager can be fined or imprisoned. Pollution can come from multiple small sources across the landscape. This nonpoint source of pollution is more difficult to manage. A few drops of oil from cars in parking lots, rubber dust from tire wear on the streets, erosion from improperly maintained roads, soapy water from people washing cars in the driveway or street, wearings from brake pads, pet waste not picked up, and a long list of other contaminants often mix in with stormwater, creating complex concentrations of pollution in waterways. Like Emily and Logan, you will write up a small-scale research project about water quality and how it is affected by pollution in your local area. “Local” can be defined as happening in your town, your county, or your region of the state (in your report, describe how you define “local”). Peruse news stories to find a local water-quality problem or issue that is particularly interesting to you. In your report, you will describe the water-quality news story, the source of pollution, the type of pollution, and which beneficial use(s) were impacted. Your report should include the issue’s connection or relevance to at least one item from each column below. Your report should also include information about how the pollution problem can be solved, both in implementing best practices or physical barriers, and cleaned up.
Learning/Inquiry Activity 6: Water-Quality Issue Report Anticipated time: 4 hrs
Learning Objectives
To learn about specific water-quality issues in the local area. To articulate, through a report, how a water-quality issue happened, which source of pollution the issue is related to, the type of pollution it is, and which beneficial use was impacted by the problem. To increase investigative skills and writing skills.
Materials Newspaper and other news media stories about water- quality issues in the student’s local area (town, county, or region of the state) Other informational materials from sources that can be verified as scientific or fact-based

Unpublished Draft_3/23/2020
60
Pollution Source Pollution Type Impact on Beneficial Use
Point Source Sediment Recreation
Nonpoint Source Nutrients Water Supply
Temperature Aquatic Life
Petroleum and chemicals Wildlife Habitat
Metals Aesthetics
Toxins (like PCBs) Table 1. Pollution sources, types, and impacts.
Figure 23. Nonpoint source stormwater outflow into a river. Photo credit: Jim Ekins. Optional stormwater pollution videos for viewing:
● Elementary School: https://www.youtube.com/watch?v=c_6pltuqspo&feature=youtu.be (“Keeping Our Drinking Water Clean Spokane Aquifer,” by Ponderosa Elementary School member, Jordan Neilson) and https://vimeo.com/51603152 (“Drained: Urban Stormwater Pollution” with scuba diver Laura James)
● Middle and High Schools: http://www.seattlechannel.org/misc-video?videoid=x24436 (Follows three teens who lose a key down a storm drain. As they search for the key they learn about stormwater pollution in Puget Sound and they discover they can do something about it.)
● https://www.youtube.com/watch?v=r50TqjaBPEY (video with scuba diver Laura James on stormwater and career awareness)

Unpublished Draft_3/23/2020
61
● https://www.youtube.com/watch?v=bsNjk0gpir4 (Boise stormwater runoff issues and solutions)
Procedure Write a 2–3-pg report about a local water-quality issue or problem. Consider this a research project that you can expand as a larger personal growth project or potentially (e.g., if your teacher allows) tie into a school research project. Note: you will need to add this report to your portfolio/notebook/journal, once you are finished with the final draft.
Let’s Do It! If you have never written a research paper, you should start with an outline of some sort. The following provides an example of its parts: Introduction. State the problem you are learning about, why it’s important, how you will approach the research, what are your conclusions, and suggestions for solving or reducing the problem. Problem overview. In this section, you go into depth about what the problem is, its history, whether it is unique to your area or if it is a global problem happening locally, how it affects your community or favorite swimming hole, etc., and what organization or agency is working to ameliorate (make better) the problem. Literature review. List and explain the sources of information you used to research the problem or issue. You should include at least five different sources of information; the more the better. Write a paragraph or a few sentences about what you learned about your issue or problem from each article, website, textbook chapter, or expert interview you’ve read or conducted. Organize your thoughts neatly in your writing to help the reader (and you) better understand the issue/problem and to spur thought about possible solutions.
Read a variety of types of information sources. Wikipedia might be okay for a quick overview and to begin finding additional sources. Newspapers can be helpful, but news reporters are not science experts and often do not accurately report complex science information; sometimes they report only minimally on science topics or rely on opinions. Interviews with experts are very helpful, if you are comfortable talking on the phone or in person; go into any interview with a list of questions that is approved by your teacher, parents, or other science-knowledgeable or science-minded person. Textbooks can be helpful but are sometimes somewhat out-of-date. Online sources should be carefully scrutinized for scientific rigor (that is, are the articles based on a science research project, on analysis of a variety of science projects, or on opinions). Generally, government agency websites provide good basic science information about water-quality issues. Nonprofit organizations can provide helpful information online but may carry a bias or may be trying to increase membership through exaggerating portions of science research that supports the organization’s bias.
After you are done writing about what you’ve learned from each source, you need to make it easy for the reader to find that information. You should, in parentheses, list the source author’s last name and the year it was published: (Author’s Last Name, year). If no author is listed, then the first two or three words of the title followed by the date is acceptable: (“Polluted Waters,” 1983). The idea is that

Unpublished Draft_3/23/2020
62
a reader who is really interested in learning more about the tidbit of information you’ve shared can find the source in the list of references and then retrieve that source of information to learn more. Just make sure you fully cite the source in the “References” section at the end of your report. Discussion. Share your own conclusions about the issue or problem here, based on the literature review you did. You might propose additional research that may help solve the problem or help you and others better understand the issue. You can also use the knowledge you’ve gained by researching the issue to develop your own solution. If it’s already been tried before, develop your own unique version or twist. Your solution might never have been tried before, and it might not be practical, so make sure you address its potential limitations. Finally, write about the reading or research that you weren’t able to do or did not read through. This is where you can think about how to grow your research project into a more robust one for yourself or maybe for somebody else. Conclusion. In this section, provide a recap of your project. Restate the problem, why it’s important, what conclusions you came up with, and where the project could go in the future. References. List each source of information that you used in preparing your research report. Academics follow very specific rules for citing (listing and describing) the references they’ve used to find information about their projects. People list the references to avoid plagiarism, which is a critical error in any sort of creative endeavor like writing. You are not required to strictly follow any of the set rules for citing the sources of information you use, but in general your reference list should include the author(s), title, year of publication, who published the source, and where it can be found. You start with the name of the author to make it easier to cross-reference with the literature review located earlier in your report. An interview reference entry should include the name of the interviewee, what their job title is, who they work for, and the date you interviewed them. The following are a few examples:
Author, A. 1983. Title of a Newspaper or Magazine Article or Chapter. Published by So-and-So Press. Found online: http://www.website….. Expert, Person. In person interview on October 1, 1996. Title of Document of Interest (no author). May 1959. Published by So-and-So Press. Organization Published Website. Accessed on February 5, 2018. Website address: http://www.website…..
Remember, other people might be interested in what you are learning about. Having properly referenced sources of information makes it much easier for them (and for you in the future) to find that information. You can try to adhere to the reference list citation rules that scientific papers follow; the University of Idaho’s library is a good place to learn more: https://www.uidaho.edu/member-affairs/dean-of-members/member-conduct/academic-integrity/members/cite-sources.

Unpublished Draft_3/23/2020
63
Reflection You have now learned about water resources and water quality through a variety of investigative means and just learned how to write a formal research paper about an issue. You’ve also made your own scientific observations. These are all steps that will help you to become more science-literate. While you may or may not eventually become a scientist when you grow up, knowing about how science works is important to everyone. Reflect in your portfolio/notebook/journal on the following fourteen statements by writing a short paragraph or other drafting some other creative response.
1. I am learning a lot about science. 2. I can help others with science-related subjects. 3. I am learning how to use the scientific method/process to research a problem. 4. I feel more comfortable talking with others about scientific topics. 5. I am learning to use my own observations to create hypotheses about how the world works. 6. I am learning how to write about or talk with others about science projects I have been involved
with. 7. I know more about water resources. 8. Water-quality impacts where I play. 9. I like learning about the natural world. 10. My observations of nature bring up even more questions about how the world works. 11. I know more about designing science experiments. 12. I know more about understanding scientific data. 13. I can identify water-resource issues or problems in my community. 14. I know where to find reliable information for my research projects.

Unpublished Draft_3/23/2020
64
Chapter 3: Water Walk
Aquatic Habitats: An Overview One of Logan’s friends lives in a house near Grouse Creek. At first, Logan had fun splashing in the shallow summer flow, because it allowed him to cool off on hot summer days. But then he got curious about the area as a watershed. He wondered where the stream came from and where it went. After asking his parents for help, they found some maps that showed that the creek started as many small streams located high in the nearby Cabinet Mountains. The small headwater streams merged together on their way down the mountain to form ever larger streams. Eventually, these tributaries formed Grouse Creek. Grouse Creek, in turn, is a tributary to the Pack River, which flows into Lake Pend Oreille and ultimately into the Pend Oreille River. As with the small headwater tributaries, Grouse Creek itself is a tributary within a much larger river system. Indeed, the Pend Oreille River flows into the Columbia River and eventually to the Pacific Ocean.
Figure 24. Grouse Creek, Bonner County, ID. Photo credit: Jim Ekins. Meanwhile, Emily’s parents moved to a house in Twin Falls, one that is farther away from the kind of small streams Logan had been frolicking in. But sometimes she and her family would drive up into the nearby South Hills Mountains, via the road that follows Rock Creek. Rock Creek starts in the Monument Peak and Magic Mountain Ski Area, whose mountains are historically known as the Goose Creek Mountains (see www.idahoaclimbingguide.com/bookupdates/goose-creek-mountains for more information about the area). Rock Creek starts in much the same way that Grouse Creek starts in the

Unpublished Draft_3/23/2020
65
Cabinets. Emily enjoyed exploring the edge of the creek and comparing those places with public access points on the big Snake River and that of a small pond near her house. She caught frogs and watched the dragonflies fly over while little fish swam below the water’s surface. But who or what else lives here, she thought, and what else is happening with these waterways? Emily and her parents were able to find some maps to give her a good start to answering these questions. They showed the headwater streams that form the Snake River also start high up in mountain ranges. But these ranges lie farther away, in Wyoming and the northernmost portions of eastern Idaho. The Snake River follows a curving path through southern Idaho, then heads north near Boise, eventually reaching Lewiston, where it turns west and joins with the Columbia River, many many miles below the Columbia’s confluence with the Pend Oreille River.
Figure 25. Rock Creek, South Hills of Twin Falls County, ID. Photo Credit: Jim Ekins. Logan and Emily were fascinated by the fact that the water flowing through each of their distant home areas eventually merges far downstream. This meant that pollution could move long distances and could potentially affect communities far away. Each decided to study their streams and local ponds in more detail, but they had to figure out how to do that. Stream and lake/pond habitats share some similarities but are also very different in many ways. For instance, when Emily and Logan compared snapshots of the creek bugs they found, they noticed that the bugs were different, or looked different. They also noticed that Grouse Creek water looked cool and clear, compared to the big river and the small pond, whose water is warm in the summer and has a brownish-green tint. Once they learned how to do the basic physical/chemical water testing from chapter 5, they discovered that the pond’s temperature was consistently higher during the spring,

Unpublished Draft_3/23/2020
66
summer, and fall. Meantime, both streams’ cloudiness, via the spring runoff, cleared up by midsummer when the flow was much smaller. The pond was clearer in the spring too, but seemed to grow more tiny algae in the water, contributing to greener and less clear water later in the summer. You will also monitor a stream or pond—in fact, you’ll do it for the remainder of the activities in this book. The stream or pond you’ll focus on is the one you used earlier for the Physical/Chemical assessments activity (section 2, chapter 2, activity 5). Again, your stream transect (cross section of the stream) is at this location, but with these additional assessments, you will be spending some time looking at the stream some distance above and below your transect location. If you are assessing a pond or lake, see below for instructions related to pond habitats. Your transect has several parts that may be more or less easily identified in your particular situation. The bed of the stream is the bottom. The bed transitions to form left and right stream banks; this transition might be very obvious or might be so subtle that the bed seems to extend up and out of the water as a sand or gravel bar. What is more important is to determine the location of the normal high-water mark. This is the point at which the regular inundation or scouring action of the stream prevents terrestrial (land-based) plants from growing. There are more specific legal definitions of “normal high water” but this definition will do for your needs. The left and right banks are defined as those on your right and left, as you stand in the middle of the stream, looking upstream. Orienting yourself in this way is important, because you are interested in the watershed above your monitoring location, which is where the water you are studying is coming from.

Unpublished Draft_3/23/2020
67
Figure 26. Stream Transect. Illustration by Noah Kroese Figure 27. Stream reach and the four major stream habitat types. Illustration by Noah Kroese. Streams contain flowing water and thus can have a number of different habitats in any segment. But streams can be long; how do you break the stream into segments that a regular person can study without being overwhelmed? By visually dividing the stream into segments that conceptually transforms each into what stream professionals call a “stream reach.” These experts define a reach differently, depending on what they are studying, but in a perfect world, your stream reach will have each of the four major types of habitats: riffle, run, pool, and glide (these habitats will be described in more detail in the next chapter). Many streams, however, only have one or two types of these habitats, so determine a set distance, say 25 m up and down from your monitoring site. Some professionals define a stream reach much longer, say 100 m or more. Nevertheless, keep your investigations of the stream to a shorter, more manageable length of no more than 100 total m. Fifty total meters (25 m above, 25 m below your transect) is likely to be just fine. Since Idaho contains numerous lakes and reservoirs, it is worthwhile to introduce some of the terminology you’ll soon be running into. Lentic waters is a broad term that encompasses all standing waters, whether naturally formed or constructed. Naturally formed lakes include glacial lakes and oxbow lakes. Glacial lakes form after advances of glacial ice stagnate and deposit large blocks of ice on the landscape. Glacial till—unsorted glacial material—deposited around these blocks of ice creates kettle lakes, land depressions that fill with water when the ice melts. Oxbow lakes and backwater marshes form after meandering streams cut themselves off from their own curving meanders, leaving behind a U-shaped, temporary body of standing water. Lastly, reservoirs result from building a dam across a waterway.

Unpublished Draft_3/23/2020
68
Figure 28. Pond monitoring. Illustration by Noah Kroese. For the purposes of your water monitoring, refer to standing waters as lakes. Lakes serve as “sinks” or storage areas. Everything (sediments, chemicals, nutrients, etc.) transported through watersheds eventually finds its way into standing waters, where pollutants may become concentrated

Unpublished Draft_3/23/2020
69
and their effects thus more easily observed. Lakes are direct reflections of the watersheds around them because their natural functions are to collect water, clean it, and then release it. Lakes and ponds are ecologically diverse water bodies with nearshore shallow areas and deeper water farther out. These different environments sustain many different types of habitats that are in turn lived in by a variety of species types. Each of these habitats and species react to changes in the lake in their own way. Nearshore areas of lakes may be the first to show impairment due to pollution. Deeper locations tend to exhibit more long-term water-quality trends. A mixture of nearshore and open-water sites would thus be best for the type of monitoring you are going to be doing.
Procedure You will build a two- or three-dimensional (3-D) model (like a pop-up book or a diorama) to help describe how you will explore stream or pond habitats. Learn how to find a stream’s headwaters and where the stream’s watershed extends to (it might be on the map you created in chapter 1). The size of the stream and watershed does not matter; what is important is to create a working model of the stream. Use existing maps, “windshield tours” (get your parents to drive around a little bit), and library resources to understand about your stream’s location and direction. Note: you will keep this model for display at your public project presentation. Let’s Do It! Make your model fun and interesting to look at, and also as representative of your chosen water body as you can. Learn as much as you can about the site itself, its history, and what it looked like long ago. If you can find historic photos of the area, paste copies of them into your model. In your portfolio/notebook/journal, describe your first impressions. Include your experiences doing the physical/chemical monitoring, too. Then use the procedure from chapter 5 and the new information you’ve gathered about our water body’s various habitats to continue developing your monitoring plan for your stream or pond site. You may be able to add more planning information to your monitoring plan because of these recent information-gathering and modeling efforts.
Learning/Inquiry Activity 7: Exploring and Modeling Your Water Habitat Anticipated time: 4 hrs (1 hr planning, 1 hr touring the site, 2 hrs building the map/model)
Learning Objectives
To identify and describe a stream or pond-monitoring location. To identify various habitat types within a monitoring location. To identify the differences between stream and pond/lake habitat types. To quantify spatial and geographic representations of the stream or pond monitored.
Materials
Cardboard sheet or small box Cutouts/photos of fish, rocks, aquatic vegetation, and other things found underwater Tape or glue and other bits of material to help secure the stream/lake features in your model

Unpublished Draft_3/23/2020
70
Reflection Consider how much more you know about your stream- or pond-monitoring site. Write or draw in your portfolio/notebook/journal any changes in your initial impressions when you first visited the site. Elaborate on these by sharing your thoughts and impressions now that you have begun studying it. For instance:
● How would you describe the pond or stream to a friend? ● How would you describe it to an adult? ● What are the most interesting or surprising findings you’ve discovered? ● Write down any additional questions you have about the stream or pond.

Unpublished Draft_3/23/2020
71
Stream Habitats (Option 3-A) If you don’t live near a stream, or it’s easier to explore a pond or lake, skip to Pond/Lake Habitats (Option 3-B). If you live in an urban area, also refer to and include the reflection for the exercise in Extra Considerations for Urban Stream and Pond/Lake Habitats. When Logan and Emily talked on the phone, they often struggled to describe how their streams were similar yet different. They decided to learn how to better describe and assess the characteristics of their streams in a more accessible way. Emily discovered that scientists who study stream use standard protocols to properly describe stream characteristics. Logan agreed that learning or developing a protocol would be a valuable tool. It would allow him to communicate all the interesting discoveries about the stream he’d be making in the coming weeks. You will also need to develop a protocol or practice on which to rely to adequately describe your stream’s characteristics. Start by learning to look at your stream from two different perspectives, the transect and the reach. The transect is a cross section of the stream that starts above the normal high-water mark and crosses perpendicularly (at a 90°angle) to the stream flow. This is the location you want your site coordinates to pinpoint or “georeference.” Knowing the exact geographic location of your study site (transect) adds valuable context to your study.
Figure 29: Stream transect. Illustration by Noah Kroese. The reach is a segment of stream that you’ve chosen to study. A healthy stream reach contains multiple types of habitats (see Figures 25 and 26). Stream habitats are divided into four main types:
Pool: A deep spot in a creek where water flows slowly (usually at stream channel bends, upstream of riffles, and on the downstream sides of obstructions such as boulders or fallen trees). A place where fish find refuge from hot temperatures by seeking deeper, cool water seeping in from the groundwater. Often the best swimming hole in the stream. Glide: The area at the downstream end of a pool that transitions to another habitat (e.g., riffle or run) by progressively getting shallower and looking less and less like a pool. An important habitat for fish eggs and certain macroinvertebrates because the water moves predictably, thus keeping fine sediment from depositing. Riffle: A swift water current that is normally “bubbling” due to a rocky streambed. The water in this habitat type has relatively high dissolved-oxygen levels from tumbling over and around the rocks. Riffles typically contain large numbers of invertebrates and the small fish that feed on them. Run: A smooth- but fast-flowing part of the stream, with no bottom features protruding into the flow to cause turbulence. Runs can have diverse mixtures of aquatic life depending on the quality and quantity of the instream habitat (boulders, logs, root wads, etc.). Sometimes this smooth but fast flow is referred to as “laminar” flow.

Unpublished Draft_3/23/2020
72
pools, glides, riffles, and runs. A variety of habitats within a stream usually enhances the diversity of aquatic life that you find there. However, pool, glide, riffle, and run habitats may not be present at all monitoring sites. Lower-quality streams generally consist of long, continuous runs. In this case, you should define your stream reach as a set distance (e.g., 25 m upstream and 25 m downstream) from your transect. The reach can also be the length of stream that you can see from your georeferenced transect. Do your best to define the length of the stream reach for which you make your observations and measurements; the reporting technique section for each parameter can be helpful in this definition. Healthy streams also provide a variety of habitats for different bugs, fish, and other critters to live in. Some aquatic macroinvertebrates (insects, crustaceans, snails, worms, etc.) like to live on or among small pebbles, some like big rocks, and some others prefer algae mats or leaf packs. Most cold-water fish (especially trout and salmon) require gravel stream bottoms to lay eggs in. Little baby fish fry need little nooks and crannies in which to hide from predators. Bigger fish look for deep spots to escape the summer heat. Generally, streams that are made up of a variety of material and provide different shaped–areas provide better habitat for fish. To evaluate your chosen habitat, use the Stream Habitat Assessment Form in appendix 3 and follow the procedures detailed below to make a comprehensive assessment of your stream or river site. Learning/Inquiry Activity 8: Assessing Stream Habitat Anticipated time: 3 hrs (45 min planning, 2 hrs assessing habitat, 15 min uploading data)
Learning Objectives After completing this exercise, you will be able to
● List the difference between a stream transect and reach ● Describe the four major habitat types in a stream ● Describe and assess a variety of stream structure/habitat conditions, including:
○ Streambed materials ○ Stream-bank shape and conditions ○ Canopy and riparian area characteristics ○ Stream-reach shape and characteristics ○ Microhabitats located within a stream reach ○ Land-use characteristics adjacent to and distant from a stream
● Collect qualitative and quantitative data related to a stream habitat and structure
Materials ● Stream Assessment Form (located in appendix 3, Stream Habitat Assessment Form) ● Clipboard ● Pen or pencil ● Measuring tape ● Camera or phone with a camera ● An assistant or two

Unpublished Draft_3/23/2020
73
Procedure Do this assessment only about once a year and at a time when the stream is flowing at a low level. Since you will be wading into and across the stream several times, do not attempt this at high water or whenever the stream water flows above your knees. A few safety rules: Overall, always consider your well-being your top priority.
● Always conduct monitoring with a “buddy” or team member. Never approach streams alone. ● Always let someone know where you are going and how long you will be gone. ● Use caution when entering a stream, making sure you can get out, that the current is not too
strong, and that the bottom will support you safely. ● Do not attempt to enter water if the stream is too deep. As a general rule, above your knees is
probably too high. ● Always conduct monitoring during daylight hours. ● Wear waders or river shoes (old tennis shoes) to avoid cutting your feet on submerged glass,
metal, or sharp rocks. ● Be aware of possible dangers, such as poisonous plants, unstable banks, wildlife, stinging
insects, and livestock. ● Dress appropriately for the weather. Know how to recognize the signs and symptoms of both
heat exhaustion and hypothermia and know how to treat them. Most importantly, know how to prevent them.
● Wash up thoroughly with hot water and soap when you get home. If you are monitoring in areas with potential contamination, such as mine wastes or harmful cyanobacteria (blue-green algae) blooms, you may want to participate in additional safety training before entering the stream. When (or before) you arrive at your monitoring site, you first need to be sure you have everything you need, that your equipment is organized and ready to use, and that you’ve set up your data collection sheet so that you’re ready to document the site conditions. As with the physical and chemical assessment, it is important to include the metadata that provides context for your assessment. Read and reread as necessary all of section 2, chapters 2 and 3 carefully to understand the various assessment protocols (described in appendix 1, Stream Habitat Assessment Instructions) you will follow. Follow the procedures carefully and consistently. Print and use the assessment form from appendix 3, Stream Habitat Assessment Form to collect your data and to help you better understand your stream. Note: once you have finished uploading the data to the IDAH2O website, add this data form to your portfolio/notebook/journal.

Unpublished Draft_3/23/2020
74
Figure 30. Working together to collect data on a stream. Photo credit: Jim Ekins.
Let’s Do It! Before you leave home to visit your stream site, make absolutely sure that your parents/guardian or an appropriate adult knows exactly where you are going and how long you expect to be there. Also, travel to your stream with an assistant. When you get there, check to make sure it is safe enough to approach and wade into. If it isn’t safe, you will need to return to the site on another day or at another time when it is safe to approach. You may find that you need to select a new site that is safer to approach and enter. You are always invited to take photographs from a safe distance. Remember to always follow safety rules—collecting data is not worth risking your well-being. You should complete the habitat assessment during periods of relatively low water, since you need to cross the stream at least once (and likely more). Dress properly for cold or hot weather.
Reflection Once you have returned from the stream, ponder what you learned about the conditions in the stream. Remember, there are no value judgments associated with any specific stream habitat condition. For instance, valley streams are often known for winding around the valley bottoms in big loops, with high sinuosity, compared to high mountain streams, which may have low or no sinuosity. On your watershed map, note the location of your stream transect and approximate the reach. Use what you know about the larger watershed to write a two-page essay that discusses the relationship of watershed land use to the condition of your stream. Include a description of what you learned about your stream and about any elements in the surrounding landscape that might have favorably or adversely affected its condition. You may photo-journal or include other artistry as you see fit about these connections and add notes to your map, too.

Unpublished Draft_3/23/2020
75
Pond/Lake Habitats (Option 3-B) If you don’t live near a pond, or it’s easier to explore a stream, go back to Stream Habitats (Option 3-A). If you live in an urban area, also refer to and include the reflection for the exercise in Extra Considerations for Urban Stream and Pond/Lake Habitats. When Logan and Emily talked on the phone, they often struggled to describe how their local lakes were similar and different. They decided to learn how to better describe and assess the characteristics of their lakes and ponds in a more accessible way. Emily discovered that scientists who study standing water like ponds and lakes use standard protocols to properly describe pond/lake characteristics. Logan agreed that learning or developing a protocol would be a valuable tool. It would allow him to communicate all the interesting discoveries about area lakes he’d be making in the coming weeks. Like Logan and Emily, you will learn to look at your local lake or pond from two different perspectives, the nearshore area and one farther out in deeper water. For a nearshore area study, pinpoint or “georeference” your site coordinates to the primary place where you access the edge of the pond or lake. If you also go out on the water in a boat to study a deeper water area, you should also note your coordinates. Knowing the exact geographic location of your study site (transect) adds valuable context to your study. Learning/Inquiry Activity 9: Assessing Pond/Lake Habitat Anticipated time: 3 hrs (45 min planning, 2 hrs assessing habitat, 15 min uploading data)
Learning Objectives After completing this exercise, you will be able to
● List unique characteristics of pond and lake habitats ● Describe the major habitat types in a lake ● Describe and assess a variety of pond-structure/habitat conditions, including:
○ Shoreline, nearshore, deeper water ○ Animal and macroinvertebrate diversity ○ Plankton (phytoplankton and zooplankton) ○ Lakes and lake habitats ○ Nearshore ○ Deep water ○ Cyanobacteria blooms ○ Nutrient balance: nitrogen and phosphorous ○ Stratification and turnover
● Collect qualitative and quantitative data related to the pond/lake habitat and structure
Materials ● Pond/Lake (Standing Water) Habitat Assessment Form (see appendix 3) ● Clipboard ● Pen or pencil

Unpublished Draft_3/23/2020
76
● Measuring tape ● Camera or phone with a camera ● An assistant or two
Procedure Because ponds differ from streams in structure, habitat, and monitoring procedures, combine your pond/lake habitat assessments that you report in the form with many of those that you did for the chemical/physical assessments you completed for activity 5. You can find detailed assessment instructions in appendix 1, Pond/Lake Habitat Assessment Instructions. Some assessments will also be referenced or described in appendix 1, Stream Habitat Assessment Instructions. A few safety rules: Overall, always consider your well-being your top priority.
● Always conduct monitoring with a “buddy” or team member. Never approach streams alone. ● Always let someone know where you are going and how long you will be gone. ● Use caution when entering a stream. Make sure you can get out, the current is not too strong,
and the water bottom will safely support you. ● Do not attempt to enter a stream if it is too deep. As a general rule, above your knees is
probably too high. ● Always conduct monitoring during daylight hours. ● Wear waders or river shoes (old tennis shoes) to avoid cutting your feet on submerged glass,
metal, or sharp rocks. ● Be aware of possible dangers, such as poisonous plants, unstable banks, wildlife, stinging
insects, and livestock. ● Dress appropriately for the weather. Know how to recognize the signs and symptoms of both
heat exhaustion and hypothermia and know how to treat them. Most importantly, know how to prevent them.
● Wash up thoroughly with hot water and soap when you get home. If you are monitoring in areas with potential contamination, such as mine wastes or harmful cyanobacteria (blue-green algae) blooms, you may want to participate in additional safety training before entering the stream. Read all of the above chapter carefully and understand the various assessment protocols (described below) you will follow. Follow the procedures carefully and consistently. Print and use the Pond/Lake Habitat Assessment Form in appendix 3 to document your data and to help you better understand your stream. Note: once you have finished uploading your data to the IDAH2O website, add this data form to your portfolio/notebook/journal.

Unpublished Draft_3/23/2020
77
Figure 31. Working together to identify aquatic macroinvertebrates. Photo credit: Jim Ekins.
Let’s Do It! Before you leave home to study the pond/lake, make absolutely sure that your parents/guardian or an appropriate adult knows exactly where you are going and how long you expect to be there. Better yet, bring them along to see you doing all this good work! Otherwise, travel to your pond/lake with a different but equally trustworthy assistant. When you get there, check to make sure it is safe enough to approach and to wade into a short distance. If it isn’t safe, you will need to return to the site on another day or at another time when it is safe to approach. You may find that you need to select a new site that is safer to approach and enter. You are always invited to take photographs from a safe distance. Remember to always follow safety rules—collecting data is not worth risking your well-being. You should complete the habitat assessment during periods of normal or relatively low-water levels, since you will need to access the pond’s edge at one or more places (likely more). Dress properly for cold or hot weather.
Reflection Once you have returned from the lake/pond, ponder what you learned about the conditions you observed. Remember, there are no value judgements associated with any specific lake/pond habitat condition. For instance, some ponds are small and unaffected by wind but might be warmer due to being shallow; others have more or less vegetation along their banks. On your watershed map, note your pond-monitoring location(s) and the areas you visually assessed. Use what you know about the larger watershed to write a two-page essay that discusses the relationship of watershed land use to the condition of your pond/lake. Include a description of what you learned about your pond/lake, particularly any elements or features in the surrounding landscape that

Unpublished Draft_3/23/2020
78
might have favorably or adversely affected its condition. You may photo-journal or include other artistry as you see fit about these connections and add notes to your map, too.
Extra Considerations for Urban Stream and Pond/Lake Habitats (Relates to Options 3-A and 3-B) Exploring urban lakes and streams can be fascinating, informative, and uplifting. They often serve as a migration corridor or an oasis of sorts for beneficial wildlife like birds and pollinators. As a result, some urban park architects have been able to incorporate a pond or segment of stream within its urban setting in ecologically safe and aesthetically pleasing ways. These are the types of urban waterways you should seek out to do urban water-quality monitoring. However, urbanized waterways can also pose unique hazards, including less beneficial wildlife; increased pollution; sharps hazards, like broken glass or exposed rebar (steel rods embedded in concrete that have, over time, begun to stick out); and unsafe banks, not intended for people to approach. Other dangers might involve streams that have channelized into concrete sluices inaccessible from outside the stream; if you get caught alone in their flow they are almost impossible to escape. Because they are not necessarily built to allow passage through, bridges can become impediments for aquatic creatures or birds. And stormwater outfalls deliver high levels of pollution, trash, and the occasional sharp item (e.g., hypodermic needles, rusty metal, broken glass, nails, etc.). We recommend that you leave the water monitoring of these sorts of waterway areas to the professionals, whose protective personal gear and specialized training enables them to safely and accurately conduct difficult urban waterway assessments like these. Note, however, that you might be able to do some minimal assessments from the safety of a footbridge over an urban, channelized stream. Perhaps you can tie a thermometer to a string and lower it into the water to see if the lack of shade or a riparian buffer increases the water temperature. You might do the same with a pH test strip. You can also note those animal species you observe in and around an urban waterway. To learn more about how urban waterways are managed, find the city stormwater utility manager. City parks staff can also provide information about waterways and ponds in and adjacent to city parks. Many streams and ponds have been altered to reduce flooding, make more land available for development, allow bridge and other infrastructure construction, and reduce other hazards. Do some research about the history of the stream or pond by seeking out archival air photos, old “reclamation” project information, and historic town plats. Use these resources to help you make your own watershed map more complex by incorporating human history with the stream’s or pond’s monitored condition. If you live in an urban area, take great care in selecting a water body and a specific monitoring location. Make adjustments in how you monitor it and what you monitor it for. For each assessment that you are unable to complete due to safety or access considerations, figure out another piece of information/data you can substitute in, even if it is of a different type. For instance, if you can’t directly measure a stream’s flow, determine the watershed size and precipitation amount after the last rainstorm. Perhaps

Unpublished Draft_3/23/2020
79
create a photo-essay of the creek rising and falling with the passing weather. Include interview information after talking with city park or stormwater managers about dissolved oxygen and other chemical assessments. Maybe you can find a previous study of the aquatic macroinvertebrates in the stream or pond instead of capturing and identifying them yourself. The possibilities are endless; let your curiosity lead the way!
Reflection Urban waterways require more creativity to study, though they shouldn’t require more overall work. A good way to begin to manage those demands is to write down your observations about how an urban waterway differs from rural or forested waterways of similar size and shape. Another might be to determine what pollutants might be entering the urban stream, then see if you can identify the best ways to eliminate one or more of them. Or you might consider a larger perspective. Look for historic air photographs and old maps of the area that show the original location and shape of the stream or pond. If the stream channel or lakeshore has been dramatically altered, figure out when that alteration happened, how it happened, who did the work, how was it funded, and what were the objectives of the alteration. Imagine what the landscape would look like today if the stream/pond hadn’t been altered by humans. Record your ideas by drawing some images on your watershed map or on the back side of it if there isn’t room on the front. Or create a list based on a question or interest you have, like the benefits of having urban waterways. List the drawbacks, too, and discuss them with club members, clubmates, family, or friends.

Unpublished Draft_3/23/2020
80
Aquatic Macroinvertebrates Tell a Story Over the last year, Logan and Emily have learned a lot about their watershed and their place within it. They’ve learned about the different land habitats they contain and the animals that live in them, and about those that exist underwater. Through all the weekly phone calls, scientific investigations, and creative projects, Emily and Logan have become much stronger scientists and have more strongly developed their creative skills. Emily realized that her southern Idaho home is a fascinating landscape, with interesting plants and animals both large and small. Having explored her own backyard in detail, she noticed that whenever she visited a new place, she observed land and water habitats with a much more sophisticated eye. Logan also learned that his northern Idaho home is filled with fascinating landscape features and habitats, attractive to a totally different set of plants and animals. He, too, started to discover new and interesting habitats everywhere he visited. Because of their investigatory work, Logan and Emily realized they were able to better communicate what they saw in the natural world around them both on the phone and via email. They further added to their knowledge base after attending a “Watershed Festival” held in a nearby park in late spring. At one of the stations, a water-quality expert described a variety of aquatic macroinvertebrates (water “bugs”). Their presence, Logan and Emily learned, can indicate a lot about a watershed’s health, particularly regarding pollutant levels. Some aquatic macroinvertebrates cannot tolerate pollution—they are “pollution sensitive,” found only in cold, clean water. Examples include mayflies, stone flies, and caddis flies; these are the “bugs” that people try to imitate when fly fishing. Other aquatic macroinvertebrates are highly tolerant of pollution. Leeches, aquatic worms, and mosquitos are examples; while they don’t “like” pollution, and are also found in cleaner water, they can survive in badly polluted water, or at the very least at levels intolerable to pollution-sensitive bugs. Thus any mosquito inundations around a waterway might indicate the presence of more pollutants. A middle group of macroinvertebrates exists too. They are found in moderately clean water like ponds, where the water is warmer, with less dissolved oxygen, or perhaps a limited amount of pollution. Dragonflies, damselfiles, aquatic beetles, and water striders qualify for this group. After the festival ended, Emily and Logan found identification sheets for aquatic macroinvertebrates online (an example is found via link on the IDAH2O Master Water Stewards Volunteers web page, here: https://www.uidaho.edu/extension/idah2o/volunteers) and started trying to figure out how to identify the bugs in their local stream. With practice, and by paying close attention to the macroinvertebrates’ individual features, they found that identifying the different bugs got easier with time. You, too, will get to learn more about aquatic macroinvertebrates. As part of your final journey into aquatic habitats, you will capture some of the creatures that live in your local stream or lake/pond. You’ll learn to identify what you are looking at, based on its physical characteristics (e.g., does it have a shell, or no shell? Does it have legs, and if so, how many pairs of legs? etc.). Read on to learn more about aquatic macroinvertebrates and the story they can tell about your local body of water.

Unpublished Draft_3/23/2020
81
About Aquatic Macroinvertebrates (adapted from Utah State University Water Quality Extension’s Bugs Don’t Bug Me program)
Aquatic macroinvertebrates are small animals that live in water, are big enough to see with the naked eye, and have no backbone. These animals include many types of insects as well as other animals such as worms, mollusks, and crustaceans. Many macroinvertebrates make their homes in the riffles and pools of gravel-bed streams and in the submerged grasses and aquatic vegetation in ponds. By turning over stones and examining the underside or pulling a net through emergent aquatic grasses and plants, you may find aquatic macroinvertebrates. Aquatic macroinvertebrates are often used as an indicator of water quality.
Most aquatic macroinvertebrates make their homes in rocks, leaves, and the sediment of streambeds. These organisms have many special adaptations allowing them to live in demanding environments. Macroinvertebrates that live in riffles and fast-moving water may have features that help them hold on to rocky or hard substrates such as hooked feet or suction cups; or flat, streamlined bodies that can handle rapid water velocities. Go to http://streamsidescience.usu.edu/ for some great stream information, including the “Bugs Don’t Bug Me” activity book.
Macroinvertebrates that house themselves deep in muddy substrates may have different sets of adaptations for low oxygen environments such as air tubes or oxygen trapping red hemoglobin in their tissue. . . . These bugs are important because they are an integral part of the food chain. They provide food for fish and other aquatic organisms. Many of them are also key indicator species. They can tell us about the quality of the water where they are found. Bugs that have a low tolerance to pollution tell us that the water they are found in is relatively healthy. If we do not find these bugs, then it could possibly be due to some sort of pollutant or other impairment to the water body.
For more, go to USU’s publication, “Bugs Don’t Bug Me”
(http://digitalcommons.usu.edu/cgi/viewcontent.cgi?article=2169&context=extension_curall), Utah State University Water Quality Extension (http://extension.usu.edu/waterquality/).
Learning Objectives ● To define and discuss the meaning of “aquatic macroinvertebrate”; with additional experience,
you will be able to discuss basic life stages of aquatic insects (e.g., egg, nymph/larvae, pupae, adult)
● To list one pollution-tolerant and one pollution-sensitive macroinvertebrate; as you gain additional experience, you will list three of each
● With prompting, to make direct links between clean water, macroinvertebrates, fish, and people; advanced members will be more sophisticated in their explanations
● To describe (written or oral) one distinguishing feature of an aquatic macroinvertebrate, as seen under a microscope
Learning/Inquiry Activity 10: Assessing Aquatic Macroinvertebrates Anticipated time: 4.5 hrs (2.5 hrs planning, indoors learning identification skills, and building net(s); 1.5 hrs catching and identifying macroinvertebrates; 30 min uploading data and cleaning up)

Unpublished Draft_3/23/2020
82
● To draw two distinguishing features of a macroinvertebrate; advanced members will attempt to draw or describe in writing multiple (at least three) distinguishing features for at least three macroinvertebrates
● To know that jobs and careers exist in water science Ongoing long-term project:
● To learn how to make and use a macroinvertebrate kick- or seine net ● To learn how to collect aquatic macroinvertebrates from a variety of water bodies ● To collect data on the presence of aquatic macroinvertebrates from their stream- or pond-study
site; to upload the data to the IDAH2O Master Water Stewards online data collection application
Materials ● Biological (Aquatic Macroinvertebrate) Assessment Form (in appendix 3; you might want to print
this on Rite in the Rain paper or some other type of durable paper) ● Macroinvertebrate identification charts (various types) with information about three taxa of
aquatic macroinvertebrates ○ Group 1 macroinvertebrate taxa (high-water–quality bugs); Bug ID chart ○ Group 2 macroinvertebrate taxa (medium-quality bugs); Bug ID chart ○ Group 3 macroinvertebrate taxa (lower-quality bugs); Bug ID chart
● Fine mesh nets suitable in construction for use in stream or pond environments ● Plastic spoons (white or clear) and maybe small petri dishes or other shallow trays for insect
inspection ● Drawing/composition paper and pencils
Optional:
● 3-power “bug viewers” (an internet search for “bug viewer” should produce a number of options in the $10–$15 range per viewer)
● 20-power dissecting microscopes (see, for example, AMSCOPE-KIDS 20X Cordless LED Portable Binocular Stereo Microscope; SKU: SE120)
Procedure: Introduction Activity (Activity 5-A) Before you go out to your stream- or pond-assessment site to complete your biological assessment, it can be helpful for you and an adult (and maybe some friends) to catch aquatic macroinvertebrates from a nearby creek or stream and bring them to an indoor setting to practice your identification skills. Along with giving you the chance to look at the bugs in a more focused setting, it should make it easier for you to lead a discussion about what you are seeing. By practicing in this way, using bug viewers, macroinvertebrate ID sheets, etc., you will gain more confidence with using your identification skills when you are out in the field. However, if you are already comfortable with catching and identifying aquatic macroinvertebrates, skip to Activity 5-B, Full Project Activity, below. Be aware of these safety precautions when choosing a stream site:
● Do not enter the water without being prepared, i.e. bring waders, good wading shoes, and possibly a change of clothing.

Unpublished Draft_3/23/2020
83
● Avoid steep, slippery banks. Holes, vertical banks, and other hazards can be especially difficult to see when the banks are thick with vegetation.
● Scout the area for dangerous trash such as broken glass, rusted wire, or metal scraps. ● Scout the area for poison ivy, poison oak, and stinging nettle. ● Don’t enter water that covers your knees or water that is moving very fast. Moving water is
deceptively dangerous! ● Never visit a stream during a lightning storm and beware of sudden storms that could produce
flash floods.
In preparation for your first forays into the macroinvertebrate world, you should be able to describe the things that live in the water and the terrestrial animals that depend on the water (and what lives in it) to survive. As part of a fun (and useful) exercise to get in the mood for this description exercise, imagine what it would be like to be a fish. Next, read the following: There are plants and insects and fish of different types that live in the water. Ospreys and eagles and bears all depend on the fish that live there. Swallows, flycatchers, other birds, spiders, and other small animals depend on the insects. Deer and songbirds all rely on the water that is available. Discuss these animals and their connections to clean water, as well as the bugs that live in water bodies, to prepare for the biological assessments. Here are some prompts to help you think through the connections among aquatic animals, macroinvertebrates, and their habitat. In your portfolio/notebook/journal, write out detailed answers to each of these prompts in your journal. Write your own definition of “aquatic macroinvertebrates.” Break these words into their component parts: aquatic (live mostly in the water); macro (large enough to see without magnification or a microscope); invertebrate (without a backbone). Macroinvertebrates include such creatures as worms and insects; vertebrates, however, have a backbone and internal skeleton and thus include creatures such as fish, birds, amphibians, etc. What happens to these living things when the water gets polluted? There are pollution-sensitive and pollution-tolerant species of insects and fish. Below is an example of an entry you might pen: Some of these animals cannot live in polluted water and so they either swim away to somewhere else or die. Other animals can tolerate pollution; they don’t like pollution or seek it out necessarily, but instead they have adapted to tolerate pollution and so can survive in degraded environments. Describe how aquatic macroinvertebrates fit into the larger food chain (food web). Pollution-sensitive (clean-water) macroinvertebrates eat leaves and algae in the water. Cold-water fish eat the bugs, and then are available to humans and animals to catch and eat. Find a good pond or stream food-web diagram and include it in your journal notes. Viewing, Sorting, and Documenting Aquatic Macroinvertebrates (10–20 min)

Unpublished Draft_3/23/2020
84
As you begin to observe and identify aquatic macroinvertebrates, you will initially spend considerable time clarifying how to accurately identify bugs. As the activity progresses, you will get better and more confident at identifying them.
● Refer to insect identification guides and work hard at carefully observing the characteristics of each macroinvertebrate. It helps to bring laminated ID sheets into the field, as your materials will get wet from time to time.
● In your notes, describe in words and drawings which unique characteristics (similarities and differences) you are using to help identify the macroinvertebrate. Keep careful notes of your observations; it’s useful to make a drawing of the macroinvertebrates in your notes for future reference, too.
● Note whether some of the insects exhibit behaviors in response to changes in their environment (for instance, stone flies may work their gills rapidly to try to get more oxygen into their systems due to low dissolved oxygen, others may be sluggish due to high temperatures or low dissolved oxygen).
● Remember that many aquatic macroinvertebrates are not the adult form within the life cycle, but the nymph or larvae stage. Nymphs in clean-water streams generally eat vegetable matter; nymphs and other macroinvertebrates associated with polluted water can scavenge or even prey on other macroinvertebrates or other animals. Some of the aquatic macroinvertebrates in the water, such as beetles and scuds, are the adult form.
● It helps to arrange or sort different species of macroinvertebrates into different cells of ice cube trays.
Remember to constantly take notes on and create drawings of what you think is the most important information that will answer your teacher’s questions to the best of your ability. Low-power dissecting microscopes, magnifying glasses, or bug viewers are great aids. If you have access to any of them, use them, because they can help you learn more about the bugs. Each microscope and bug viewer should come with some sort of macroinvertebrate ready for viewing. For a microscope, use the shallow tray to view your bugs. If you can’t figure out how to adjust the microscope, ask an adult to show you how to adjust its different parts. For bug viewers, hold the handles and not the top part with the magnifying lens (this comes off easily). The viewer should come prefocused on the insects.
● Adjust the microscope’s focus by turning the knobs for fine or coarse adjustment. The whole upper assembly moves up and down.
● Adjust the eyepiece width to match your eye width. ● Bugs don’t stay still. To continue to view them, you’ll need to move the shallow dishes or nudge
the insects into viewing range with forceps, a plastic pipette, or a spoon. Now that you have observed aquatic macroinvertebrates in a less-than-natural setting, it’s time to look for and at them in their habitats.

Unpublished Draft_3/23/2020
85
Full Project Activity (Activity 5-B) After getting some practice identifying aquatic macroinvertebrates, you will use your new knowledge of aquatic macroinvertebrates to capture, identify, upload presence data for, and possibly preserve and document macroinvertebrates that live in multiple bodies of water. Before you upload your data to the IDAH2O Master Water Stewards website, however, you must register your assessment site into the system, and you must have a username and password assigned to you by an IDAH2O Program Coordinator. Refer to appendix 1, Aquatic Macroinvertebrate Assessment Instructions for more details. You will use the Biological Assessment form (appendix 3) to collect your data. Note: once you have received your login information and then finished uploading your data to the IDAH2O website, you will need to add the Biological Assessment data form to your portfolio/notebook/journal. Be aware of these safety precautions when choosing a stream site:
● Do not enter the water without being prepared (bring waders, good wading shoes, and possibly an available change of clothing).
● Avoid steep, slippery banks. Holes, vertical banks, and other hazards can be especially difficult to see when the banks are thick with vegetation.
● Scout the area for dangerous trash such as broken glass, rusted wire, or metal scraps. ● Scout the area for poison ivy, poison oak, and stinging nettle. ● Don’t enter water that covers your knees or water that is moving very fast. Moving water is
deceptively dangerous! ● Never visit a stream during a lightning storm and beware of sudden storms that could produce
flash floods.
Once you are ready, you and a study partner can start to collect aquatic macroinvertebrates from your stream or pond with a bug net and perhaps a shovel. You can use manufactured bug nets or make one yourself by stapling a window screen to a wooden dowel. See appendix 1, Your Own Aquatic Macroinvertebrate Kick Net for instructions. A long-handled D-shaped net is likely all that you’ll need in a stream or pond. The bugs tend to live in and among the rocks/pebbles in a stream and in the aquatic grasses and weeds in a pond. After you’ve trapped them, hard-bodied macroinvertebrates like mayflies, stone flies, dragonflies, beetles, etc. can be preserved in small sample jars in 70% denatured alcohol. Soft-bodied macroinvertebrates, such as caddis flies, flatworms, or leeches, require extra steps to get them to relax so that you can view them in the preservative. For long-term collection of your bugs, use small, screw-lid collection jars. See appendix 2, Preserving Aquatic Macroinvertebrates for detailed information about starting an aquatic macroinvertebrate collection for display. However, you don’t need to preserve your bugs. You can simply observe and identify them, then return them to the same waterbody you caught them in (with the exception of invasive or non-native crayfish). You could also photograph them before you release them, but only if you can figure out how to take a good photograph of them.

Unpublished Draft_3/23/2020
86
Also, you have the option of conducting a separate crayfish study in addition to the macroinvertebrate study. If you’re up for that, see appendix 2, activity 3 for additional details about crayfish.
Reflection
Think back to the many activities you have completed and how they stress the interrelated nature of all facets of water resources. Like the webs of relations within terrestrial habitats, water resources and watersheds are intricately interconnected, where a change in one place creates consequences (sometimes good, sometimes bad) in others.
Note on your map which macroinvertebrates you found and their location. Can you see any sort of gradient in terms of species composition from one place to another? In other words, is there overlap in the types of macroinvertebrates you find from place to place? Describe the changes you see from one site to another. Once you collect macroinvertebrates in the same place two or three times, describe changes you see in that place over time. If you are interested in focusing even more on aquatic macroinvertebrates, go to appendix 2, Crayfish Population Data Collection to learn about how to monitor crayfish populations (if your area has crayfish in its streams or ponds).

Unpublished Draft_3/23/2020
87
Chapter 4: Presentations and Community Engagement A primary goal for this project is for you to develop a project to present at a public event, such as the county fair or similar venue. We encourage you to present your project at a local fair, at your school’s science fair, at a suitable event at a local library, or at some other similarly suitable venue. The information in this chapter will give you the guidance and assistance you need to develop your project materials into a presentation. In addition to the presentation, we expect you to develop one of the following research tools to record the information you will gather during your field investigations:
● Design Portfolio ● Engineering Notebook ● Field Journal
The exact “look” or content style of your portfolio, notebook, or journal is less important than the completeness to which you faithfully document your learning experiences as you progress through the program. These are commonly used types of project documentation. Do what feels right for you; the goal is to capture all that you did with this project in an easily accessible and organized format. A person with a more artistic bent might develop a design portfolio, heavy on labeled drawings, sketches with written descriptions, and other images with some context. There are many ways to create a design portfolio, including using a 3-ring binder, plain-paper (no lines) drawing journal, or hardcover composition notebook. Whatever you choose, it will need to have enough pages to complete this three-year curriculum. Make sure you create a label for your portfolio—include your name, 4-H club or other affiliation, title: Wildlife and Water Habitats Curriculum Design Portfolio, and any other identifying information. A person with a more mathematical mind might develop an engineering notebook with formulas, graphs, tables, and scale drawings, again with notations and context written with each. Like the portfolio, there are many ways to create an engineering notebook. You can use a hardcover or soft cover graph paper notebook, 3-ring binder, plain (drawing) or lined (writing) journal, or hardcover composition notebook. Whatever you choose, it will need to have enough pages to complete this three-year curriculum. Make sure you create a label for your notebook with your name, 4-H club or other affiliation, title: Wildlife and Water Habitats Curriculum Engineering Notebook, and any other identifying information. A person who likes to write narrative descriptions might develop a field journal with written reflections about her/his experiences, but also include sketches, drawings, and mathematical formulas. There are many ways to create a field journal, including a plain (no lines) drawing journal, a hardcover or softcover graph-paper notebook, 3-ring binder, or journal you create from scratch (described in chapter 1 at the beginning of the Procedure section) using cardstock (or other equally thick paper) for the cover and plain paper for the inside. Whatever you choose, it will need to have enough pages to complete this three-year curriculum. Make sure you create a label for your journal with your name, 4-H club or other affiliation, title: Wildlife and Water Habitats Curriculum Field Journal, and any other identifying information.

Unpublished Draft_3/23/2020
88
Remember, the research tool you create will house and show all your work, including drafts of your maps and any and all of your reflections as you work through each assignment. In addition to your portfolio/notebook/journal, you will also develop and keep a regular 4-H Record Book. By the end of their three-year habitat-study odyssey, Emily and Logan had created an impressive portfolio, stuffed with hand-drawn maps, habitat drawings, written work like essays, photographs, and data-collection forms. They were so satisfied with their efforts that they wished to display their work. They began to search for the most appropriate venue they could find. Two recommended formats to use in your presentation include a scientific (e.g., conference) poster or a comprehensive portfolio (a record book/journal combination). A scientific poster generally has three columns and looks like the following (you can Google “example format scientific poster” to find other acceptable formats). When you exhibit your project, follow the 4-H Learning through Exhibiting pdf, found here: https://www.uidaho.edu/extension/4h/documents-records. You can also find examples and/or sources of Record Books/Portfolios/Family Handbook/Policies and Procedures posted on the same hyperlink. Your portfolio/notebook/journal should be complete and accurately reflect all your work you did for this project, from rough drafts, notes, finished essays, and data studies to any and all the other materials that you developed within the chapters here. Below is a list of each chapter’s written, drawn, and photographic outcomes. Section 1:
Chapter 1: Portfolio/Notebook/Journal you purchased or created Drawing, poem, or short story from Habitat Hike Written and/or visual description of habitat from Habitat Hike 3-D model of habitat Recorded observations from Micro Hike Written account of discussion of animal needs Answers to questions from each Reflection activity Chapter 2: Research findings (including printed pictures, drawings, other visuals, and interview
notes) Storyboard Data sheets (if applicable) Analyzed data notes or spreadsheet Questionnaires (if applicable) Research report

Unpublished Draft_3/23/2020
89
Answers to questions from each Reflection activity Chapter 3: Observation notes from Erosion Hike Data sheets Answers to questions from each Reflection activity
Section 2: Chapter 1:
Water Cycle poster with suggestions from community contacts Watershed Map (first draft), plus watershed rainfall calculations Advanced Watershed Map
Chapter 2: Indoor and Outdoor Water-Use Calculations, tabulated neatly in the provided tables (also include all your math work, lab and field notes, drawings, and other preparatory materials), plus answers to the initial seven questions and answers to the reflection question. Include the extra-credit calculations if you chose to complete that.
Chapter 5: Physical/Chemical Water-Quality Assessment data forms (field notes/forms and forms whose data is neatly written), including the written monitoring plan and written answer to the reflection question.
Chapter 6: Water-quality issue research report, including a list of references/sources used and your responses to the fourteen reflective questions.
Chapter 7: Working model or detailed map of your stream- or pond-assessment site, an updated monitoring plan, and your written or drawn responses to reflection questions.
Chapter 8: (if applicable) Stream Habitat Assessment Form (field notes/forms and form with neatly written data) and any photographs of your monitoring site; written, drawn, and photographic updates to your watershed map; and your two-page reflective stream description.
Chapter 9: (if applicable) Pond/Lake Habitat Assessment Form (field notes/forms and form with neatly written data) and any photographs of your monitoring site; written, drawn, and photographic updates to your watershed map; and the two-page reflective stream description.
Note: The same requirements apply for any urban stream or pond monitoring you did; in addition, include your response to the reflective questions in the urban waterways subsection (section 2, chapter 3, Extra Considerations). Chapter 10:
Every single Aquatic Macroinvertebrates Assessment Form you completed (including field notes/forms and forms with neatly written data), written responses to the three preparatory prompts, and updates made to your watershed map.

Unpublished Draft_3/23/2020
90
Chapter 11: Crayfish Study Assessment Form (field notes/forms and forms with neatly written data)
and written responses to reflection questions. Just as with doing your math homework, it is essential to “show your work.” Each of your portfolio/notebook/journal chapters should start with the polished written work, data forms, printed maps, and such. Behind that, in each chapter, insert your rough drafts, sketches, mathematical calculations, notes, and other preliminary versions of your work. Because your maps may be poster-sized or larger, include a reference to the map or other creative work in the record book/portfolio; then make sure to bring the maps any time you present them. As part of your presentation, you could also organize a community volunteer effort to clean up trash along a waterway or one focused on planting native vegetation (trees, shrubs, and grasses, usually) along your stream or pond. Refer to appendix 2, Advanced Activity 4, Trash Cleanup and/or Streambank/Lakeshore Restoration Plan for additional instructions and guidance toward continuing with such a volunteer effort.

Unpublished Draft_3/23/2020
91
Appendices: Detailed Instructions, Advanced Activities, and Additional Information
Appendix 1: Detailed Instructions for Activities Some of the activities require detailed instructions that don’t fit well within the chapters. You can find instruction for these activities in this appendix section.

Unpublished Draft_3/23/2020
92
Indoor Water-Use Calculation Instructions Chapter 2; Activity 1a Use the worksheet in appendix 3 (Indoor Water-Use Calculation Table) to help you calculate how much water you use on average each day. One way to measure your water use is to read your water meter immediately before and after each use. But many rural houses have a well and therefore no meter; water use in an apartment involves a flat rate. By capturing and measuring the water you use with each activity, you can more accurately estimate the amount of water you use for each activity. As a comparison, and to help you to refine your estimates, we have included some use-type ranges with gallons as the unit of measure. But these ranges are estimates, and can vary widely, so use them as guidelines. They also rely on knowing how much water flows from a faucet or showerhead each minute. It might be easiest to use a 1-gal container and a stopwatch to determine the flow in most situations. You may need a smaller container for use with some sinks and a larger container for use in large sinks, showers, and tubs. If using a 5-gal bucket, make gallon increment marks on the side by adding one gallon at a time and marking the water level. Shower: First, determine the flow of your shower head. A “gallons per minute” number might already be written or engraved on the shower head itself. If not, or if you prefer to check the accuracy of the information provided on the shower head, fill a 5-gal bucket with water from the shower while timing how long it takes to fill. If you can’t find a 5-gal bucket, use any bucket or container with a known volume. Divide the number of gallons by the number of minutes to get a flow rate in gallons-per-minute. Then, using a stopwatch, determine how long it normally takes you to shower. Multiply the gallons-per-minute number from that shower head by the number of minutes your shower lasted. Bath: Using a 5-gal bucket or other container of known volume, determine the flow per minute of your bathtub spout. Use a bucket or container of known volume and a timer, then turn the faucet on and time how long it takes to fill the container to the known volume. Then time how long it takes to fill the tub for a normal bath. Toilet: Determine the gallons per flush for each toilet in your house. Many newer toilets have that figure printed on the toilet. If yours cites no such figure, carefully scoop the clean water out of the toilet tank (not the bowl!) into a container of known volume to measure how much water is used with each flush (you may need to turn off the water supply valve or support the float valve inside the toilet tank). Get your parent or someone else to help you with this and, again, don’t mess with the water in the bowl. Keep track of how many flushes occur during the day. To determine whether your toilet tank leaks, place a few drops of food coloring in the tank. Wait for a few minutes to a few hours, then check to see if any coloring has made its way to the bowl without flushing. Kitchen sink and washing dishes: Use a big dish pan to wash a normal day’s dishes, then pour that water into a 5-gal bucket. If you tend to turn the faucet on and off during washing and rinsing, use a second dish pan to capture the rinse water and pour it into a bucket. Measure how much water you used. You might need to dump the bucket once or twice in the middle of your dishwashing. Another way to calculate your water use is to determine the flow of your kitchen sink in gallons per minute. Use

Unpublished Draft_3/23/2020
93
a stopwatch to measure how long you run the water while washing and rinsing your dishes. This is a useful way to measure rinse water if you tend to keep the water running constantly while washing and rinsing. Waiting for the hot water: Do you ever find yourself standing around with the hot water turned on, waiting for hot water to come out of the faucet? Meanwhile, perfectly good water is going down the drain. Why does it take so long? Most houses have a hot water heater located in a basement, garage, or closet. The kitchen or bathroom sink might be many feet away from the hot water heater; that distance varies for each house, and within each house it varies for each sink, tub faucet, or shower. For each sink and tub/shower in the house, determine the volume of cold water that is wasted while waiting for the hot water to come to the tap. Note: You can’t do this all at once, since once you have measured how much water pours out to get hot water to one sink or faucet, it is already part way to the other sinks and faucets. You will need to wait until the hot water in the pipes has cooled again before measuring the volume used at each other sink or faucet. Use a container of known volume to capture the cold water until the hot water comes to each tap in your house. Some houses have mechanisms that eliminate that wasted water. One mechanism is an under-sink, on-demand hot water heater in the kitchen. The cold water heats right there, under the sink, and only heats when you need it. Other houses have a separate set of pipes that circulates the cold water back to the hot water heater until the hot water gets to the sink, thus saving the water. Nevertheless, you should be able to calculate the very small amount of water wasted before hot water reaches each sink. Dishwasher: Most newer dishwashers use a known volume of water. The owner’s manual or other paperwork for your dishwasher might have this information. If you haven’t kept that documentation, you might do an internet search for the type of dishwasher you have. Water use will depend on which setting you select to do the dishes; some dishwashers have a “water miser” or other lower water-use setting. Some dishwashers also have a “pots and pans” setting that will usually use more water. Once you have determined an estimated volume of water used for each load of dishes at the setting you most commonly use, note how many loads of dishes your family runs in the dishwasher each day and multiply that by the number of gallons per load. Washing machine: As with dishwashers, most newer washing machines use a known volume of water. Determine how much water your washing machine uses during a typical day in about the same way that you measured your dishwasher’s water use. Cooking: Note how much water you use for cooking each day of the week, then average those together to get an average cooking water use per day. For instance, cooking pasta might use more water than cooking rice. Bathroom sink: Use a container of known volume and a stopwatch to determine the flow in gallons per minute of your bathroom sink. If you have more than one bathroom sink in your house, see if their flows differ. Also, if you don’t tend to run the water at full blast, make a second measurement of the faucet flow at whatever level you run the sink at. Use a stopwatch to determine how long you let the sink faucet run during different typical activities. The number of seconds the sink flows might be negligible

Unpublished Draft_3/23/2020
94
for brushing teeth if you turn the water on and off quickly. You might use more for washing your face, washing your hands, or brushing teeth if you let the water run. Dripping faucet: Determine how much water you waste if your faucet drips. Place a container of known volume under the dripping faucet to catch the drips. Use a stopwatch or other timing device to measure how long it takes to fill to the known volume.

Unpublished Draft_3/23/2020
95
Outdoor Water-Use Calculation Instructions Section 2; Chapter 2; Activity 1b During the summer months, outdoor water use can eclipse (exceed) indoor use. Watering lawns, gardens, and landscaping sometimes doubles or even triples a household’s indoor use. You can easily calculate this by comparing a house’s water use during the late-fall, winter, and spring months with the summer use. Winter water use provides an especially good baseline of comparison because during those months we use water almost entirely indoors. That said, precisely determining a household’s water use outside of the house is less straightforward. By using several of the techniques listed below, however, we can make some reliable estimates. Lawn Watering: Use several clean, empty tuna cans or equivalent (cat food cans work well, too) to determine your lawn watering system’s output and efficiency. Measure the length and width of your yard to determine approximately its square footage. Create a hand-drawn map of your yard and record those dimensions on it. Before turning on the sprinklers, place a number of tuna cans at regular intervals around the yard, noting each can’s location on your map. Once you’ve turned on the sprinkler, use a stopwatch or timer to determine how long it takes to almost fill the cans—that is the equivalent of about an inch of water. In a perfect system, all the cans would fill at the same rate. However, some cans might fill at different rates. This indicates that watering does not disperse evenly across the whole yard. Determine how long it takes for the fastest-filling can to fill, then note the water depth in all of the other cans. Mark those depths of water for each can on your map. Then, calculate the average depth of water in the cans (arithmetic mean) in inches and multiply that depth by the area of your yard. Divide that by twelve. This will give you a volume of water in cubic feet, a standard water-volume measurement. A cubic foot holds 7.48 gallons, so you can convert cubic feet to gallons, if you would like, by multiplying the cubic feet by 7.48. The mathematical formula that represents all of these calculations looks something like this: average depth of water (in) X the size of the yard in sq ft = cu ft divided by 12 in In the example below, the size of one specific portion of Emily’s yard, controlled by the irrigation system “Zone 1,” is about 9’4” x 9’, equaling about 84 sq ft. She had placed eight cans around that section before her mom turned on the sprinkler. It took about ten minutes for two of the cans to fill, though some of the others never completely filled. After measuring the depth of the water in each can, she charted the figures in a spreadsheet to manage the data more clearly before determining the average depth of water her irrigation system delivered to the yard.
Outdoor Lawn–Watering Calculation Table
Can 1 0.9 in

Unpublished Draft_3/23/2020
96
Can 2 0.8 in
Can 3 0.7 in
Can 4 1.0 in
Can 5 0.6 in
Can 6 0.5 in
Can 7 0.5 in
Can 8 1.0 in
Total depth of water sprinkled onto the lawn
6.0 in Average = 0.75 in per can
For the final step, determine how much water the irrigation system can deliver each minute. Divide the total amount of water delivered by the sprinklers by the total number of minutes the sprinklers took to fill the cans. This will provide you with the output per minute in gallons for your sprinklers. If your sprinkler system is set up to irrigate multiple zones, repeat this process for each zone. Here’s Emily’s initial calculations: (0.75 in X 84 sq ft)/12 = 5.25 cu ft 5.25 cu ft X 7.48 gal per cu ft = 39.27 gal And the one for her final step: 39.27 gal/10 min = 3.9 gal per min delivered by Emily’s irrigation system

Unpublished Draft_3/23/2020
97
Physical/Chemical Assessment Instructions Chapter 2; Activity 2 “Metadata” (Date, Time, Monitoring team name(s), Site location and description) While actual water-quality data is important, it loses its meaning when it lacks context. When a scientist studies any sort of data, s/he must understand the data’s origins—who collected the data and under what circumstances. Indeed, water-quality results can vary a lot depending on the time of day or calendar date. For instance, you would expect the water temperature to be much colder in winter than in summer. You might also notice a change in water temperature from the same location early in the morning versus later in the afternoon. A stream way up in the mountains is thus different in many ways from the same stream that flows across lower and more level terrain away from the mountains. As a result, make sure to note the date and the time you begin your assessment. Also, write down your name and the names of everyone else who is with you, even if they are simply observing. Your site description should also include the geographic coordinates of your stream- or pond- monitoring location. Use a handheld GPS unit to gather your site’s latitude and longitude or go online and use Google Maps to precisely find its coordinates. To do that, first find your site location on Google Maps and right click on it. The coordinates should pop up in a separate window or within the mapping app somewhere. Note that this is the geographic location of your monitoring site, information that corresponds with a stream transect (or cross section) or a pond access. All of your monitoring activities should happen at this location or be centered on it. In addition, write a description that is good enough so that someone else can find your monitoring site using only it and a map marked with your site’s location as her/his guide. Some (fictitious) examples might include “Our pond behind the house, on the far side, directly across from the house . . .” or “Such-and-Such Stream, 25 meters downstream from the County Line Road bridge.” Weather Weather strongly influences the physical characteristics of water. For example, a strong four-hour spring rain may create most of the excess sediment (cloudiness/muddiness) and other pollution that the stream transports that year (that is, the stream’s annual sediment and pollution load). Long-term weather conditions can also greatly affect our streams and lakes. Floods, droughts, or other climatic extremes can change the water body’s physical and chemical characteristics quite dramatically (e.g., create new stream channels or fill in portions of a pond with sediment). Weather also impacts streams in other ways:
● Cloudy weather may lower dissolved oxygen levels because it inhibits plant photosynthesis (in photosynthesis, plants use sunlight and carbon dioxide to produce energy. The waste product is oxygen.)
● Recent rains may dilute point source pollution (pollution that comes from a single location, like a pipe from a wastewater treatment plant or old factory).
● Recent rains may increase nonpoint source pollution by increasing soil erosion from surface water runoff and moving other pollution around.
● Wind may raise dissolved oxygen levels by increasing turbulence.

Unpublished Draft_3/23/2020
98
● Temperature affects many parameters, such as the concentration of oxygen able to dissolve in stream water and thus be available to aquatic insects and fish.
Air Temperature Another component of the weather is air temperature. We will determine water temperature a little later, but air temperature must be measured using a dry thermometer. Hang it in the shade for up to 2 min so that its calculation can stabilize. Remember, too, to avoid touching the bulb at the bottom of the thermometer; your hand’s warmth will cause an inaccurate reading (upping the temperature it displays or, possibly, lowering it on a very hot day).
Precipitation Precipitation is the final component of the weather whose effect we will include in our calculations. Document how much precipitation as rainfall occurred at your monitoring site within the past 24 hrs. For a close estimation, use data from a nearby weather station or airport. The National Weather Service website is particularly handy. It contains past weather data for almost any airport and many other local weather stations. However, if you can secure permission to place a rain gauge at your monitoring site, that’s a better source, except that you’ll need to check it and empty it 24 hrs before you return to monitor. Any snowfall should be measured as inches of liquid water. You can also weigh a known volume of snow (100 cu cm is an easy volume to use) and compare that with what that same volume of liquid water weighs. This will give you a percentage that you can use to multiply the total depth of snow by to get the equivalent in rainfall. As a final option, make a rougher estimate by putting the previous 24 hrs’ depth of snow into a container (preferably with vertical sides) without compacting the snow and allow it to melt completely. With a ruler, measure the water’s depth in inches.
Reporting Technique Look around you and note the conditions at your location and document them at the time of your stream assessment: Find out the amount of precipitation that occurred there during the previous 24-hr period. Use your thermometer to measure the air temperature at your monitoring site before using it to measure the water temperature. After you have finished assessing and documenting the weather and its effect, place the thermometer in a safe location in the creek or pond; it will require 2 min to stabilize, during which you can begin the water-color and odor assessments that follow. Water Color The water’s color can provide you with some immediate clues about a stream or pond’s condition. Clear water does not necessarily indicate high-quality water, and other colors might indicate other conditions.
● Clear: Does not necessarily mean clean water. Many pollutants or are invisible. Bacteria, for instance, are too small to be seen without magnification (e.g., a microscope). Some chemicals are also invisible (but might be noticeable by odor). pH, or acidity and alkalinity of the water is also invisible but can drastically affect aquatic life if it’s too far from neutral (that is, 7.0 pH).

Unpublished Draft_3/23/2020
99
● Brown: Usually caused by heavy sediment loads and/or soil washing into the stream or lake. Sediment clogs fish gills (especially the little fry, or very young fish) and makes it harder for fish to see their food source. Sediment usually includes excess nutrients like phosphorus and nitrates that cause algae and nuisance aquatic plants to grow out of control.
● Green: Usually the result of excessive algae or cyanobacteria (single-cell bacteria that once were called “blue-green algae”) growth. These “algae blooms” are usually caused by excess nutrients and high temperatures and can be unhealthy or toxic to animals (including humans) that use the water.
● Oily sheen: Petroleum or chemical pollution can cause a rainbow-colored oily sheen; by-products of plant decomposition can also cause it. To tell the difference between whether the sheen has been caused by a petroleum spill or natural oil, poke it with a stick. If the sheen swirls back together immediately, it’s petroleum (there’s no pot of gold at the end of this rainbow!). If the sheen breaks apart and does not flow back together, it is from the decomposition of plants, animals, or bacteria.
● Reddish/Orange: Usually due to the presence of iron oxide or some high-iron soil that is eroding.
● Blackish: Usually caused by leaf decomposition. Pigments leached from decaying leaves can cause the water to appear murky.
● Milky: May be caused by salts in the water or from very fine sediments like silt. Some rivers and lakes flow from glaciers, which are loaded with glacial till; also, finely ground rock that is similar to silt and is milky in appearance can have the same effect.
● Gray: May be a result of natural or human-induced activity. Surface foam is a common culprit and can be naturally occurring. For instance, vegetation can produce surface-acting agents (or surfactants) which cause surface foam. Human-induced surface foam, however, may have an unnatural color (red, pink, blue, yellow, or orange) and fragrant smell. This type of foam is most likely generated by household soaps and detergents and may be a sign of a failing septic drain field or other sewage discharge.
Reporting Technique Report the water color based on the categories listed above and on the data-collection form. Water Odor Water odor, like water color, can provide immediate clues about potential problems in a stream.
● Sewage/Manure: Smells like these are common in Idaho's air but our water shouldn’t smell like it. It is important to differentiate between whether the odor comes from the water or the air. Only document odors when they originate from the water.
● Rotten Egg: Often caused by hydrogen sulfide gas, a by-product of anaerobic decomposition (that is, rotting without oxygen). This is a natural process that occurs in areas that have large quantities of organic matter and low levels of dissolved oxygen. It may indicate water that contains excessive nutrients or other organic pollution.
● Petroleum/Chemical: Can indicate serious pollution problems from a direct source, such as a factory or parking lot or storm-sewer runoff.

Unpublished Draft_3/23/2020
100
● Musky: May result from natural or human-induced activities. Muskiness is often the by-product of some organic matter breaking down or being composted.
Reporting Technique Determine whether the water produces any of the odors described above. Water Temperature Many of the chemical, physical, and biological characteristics of a stream are directly affected by water temperature. Some species, such as trout, are highly sensitive to temperature changes. Water temperatures can fluctuate seasonally, daily, and even hourly. Human activities can adversely raise stream temperatures in a variety of ways. Thermal pollution can be caused by:
● Warmed water entering a stream from industry discharges or runoff from paved surfaces ● Removal of riparian corridors, which increases solar heating ● Soil erosion, resulting in darker water, which can absorb more sunlight
Water temperature affects the following:
● The amount of oxygen dissolved in the water. Cool water holds more dissolved oxygen than warm water. Dissolved oxygen is essential to aquatic life.
● The rate of photosynthesis by algae and aquatic plants, which increases with higher temperatures.
● The metabolic rates of aquatic animals. Animals’ metabolism increases with higher temperatures.
● The sensitivity of organisms to diseases, parasites, and toxic wastes. Human impacts are most critical during summer, when low flows and higher temperatures can cause greater stress on aquatic life. It is important to note that the temperatures of some streams are naturally higher than others, depending on groundwater flow into the stream, the weather, and other factors. Reporting Technique At your stream- or pond-monitoring location, place the thermometer directly into the stream, holding it underwater in the main flow of the stream or a location that is connected to the main pond (not a shallow pool or isolated pocket of water) for about two minutes so the reading can stabilize. Transparency and Turbidity Transparency is a measure of water clarity and is affected by the amount of material suspended in the water. The more material that’s in suspension, the less light can pass through the water, making the water less transparent. Suspended materials may include soil, algae, plankton, and microbes. Transparency is measured in centimeters using a transparency tube in streams or a Secchi disk in lakes. Transparency is a measure of water clarity—specifically, how far (in cm) through the water column a person can see an alternating white and black pattern, called a Secchi pattern, until it disappears.

Unpublished Draft_3/23/2020
101
Researchers look through a transparency tube to make these assessments in streams. The tube is typically 60 or 120 cm in length with the Secchi pattern at the bottom. Fill the tube with water then look down through the water in the tube to see if the Secchi pattern is visible. If it is, the reading is <60 (or <120 with the longer version). If the water is too cloudy for you to see the pattern, release some of the water from the valve at the bottom until the pattern just barely comes into view. Note the depth of the water in the tube. To assess a lake’s or pond’s transparency, researchers use a larger, weighted Secchi disk by dangling it on a long line down into the water and then recording the line’s length when they no longer can see the disk. They can do this because lakes and ponds generally contain standing water, so their sediment tends to settle more rapidly than in streams. Turbidity is another important water-clarity measure. But it is somewhat different from transparency. Turbidity measures the degree to which suspended particles in water scatter light. More elaborate scientific equipment, including a handheld computer and submersible probe that includes a turbidity sensor, enables its measurement. A special light bulb, light-emitting diode, or LED from the probe shines a beam of light of known intensity and color through a known distance of water at (actually, inside of) the sensor. Any suspended particles in the water will block some of the light from reaching the sensor. The sensor measures the amount of light it can detect and sends that data to a handheld computer. The computer then begins its calculations, doing a little subtraction to determine how much light made it through the water versus the amount of unscattered light. It reports its finding not in centimeters, but in an “NTU” or nephelometric turbidity unit, a more precise measurement of the water’s cloudiness than the transparency measurement. It’s a helpful measure but the equipment it requires is costly and needs to be recalibrated after use. The effect of low transparency (or high numbers of suspended particles) is rarely toxic to aquatic animals, but it indirectly harms them when the solids settle out and clog gills, destroy habitat, and reduce the availability of food. Suspended materials in streams also promote solar heating, which can increase water temperatures, and reduce light penetration, which reduces photosynthesis. The combination of higher temperatures and reduced photosynthesis is problematic because it lowers the availability of dissolved oxygen for aquatic life. Sediment particles also usually carry attached nutrients and sometimes harmful or toxic chemicals, all of which can have harmful environmental effects. Reporting Technique Using a transparency tube in a stream: A transparency tube is a 60-cm (or rarely a 120-cm) clear plastic tube whose bottom contains a stopper, a small Secchi pattern, and a small hole or valve off the side. A centimeter scale (like a little tape measure) lines the side of the tube. A zero mark coincides with the location of the Secchi pattern inside the tube’s bottom. The idea is to fill the transparency tube with stream water and then look through it to determine how far through the water column you can see the Secchi pattern. Remember to remove your sunglasses for a more accurate measurement. The basic procedure is as follows:
1. Make sure the finger clamp on the hose of your transparency tube is closed.

Unpublished Draft_3/23/2020
102
2. Facing upstream in the area of the stream with the greatest flow, let the flow fill up the transparency tube.
3. Hold the tube upright in the shade. Use your body to shade the tube if nothing else is available. 4. With your back to the sun, look directly into the tube from the open top. If you can see all the
way to the Secchi pattern in the bottom, record the top number in centimeters; add a “greater than” (“>”) symbol before the number to indicate that you could see through more than the length of the tube. If you cannot see the Secchi pattern at the bottom, slowly release water through the small hose valve or hole, regulating the flow with the finger clamp, until you are able to distinguish the black-and-white pattern (Secchi pattern) on the bottom of the tube. Close the finger clamp. Read the number on the outside of the tube that is closest to the water line. Record your reading in centimeters.
5. Rinse the tube after each use so that the bottom Secchi pattern does not become dirty and clouded.
Using a Secchi disk in a pond or lake: The Secchi disk is an 8-in diameter plastic disk with a weight at the bottom and an eyebolt through it that ties to a long line that is marked in 1-m increments. The entire plastic disk is colored or painted in a Secchi pattern (alternating black and white quadrants). The idea is to carefully lower the Secchi disk into the lake or pond and then use the meter marks on the line to determine how far through the water column you can see the Secchi pattern. Remember to remove your sunglasses for a more accurate measurement. The basic procedure is as follows:
1. If monitoring from a boat, always wear a personal floatation device. At your monitoring site, carefully lower an anchor over the side until it reaches the bottom. Remember that when the anchor hits the lake bottom, there’s enough energy to disrupt some bottom sediment. Let out plenty of anchor line to allow the boat to drift away from the sediment kicked up by the anchor.
2. Ensure that the Secchi disk is securely tied or attached to the line (or sometimes a waterproof tape measure). Slowly lower the Secchi disk into the water until it is no longer visible.
3. When the disk is no longer in view, use a paperclip, clothespin, or something similar to mark the line or tape measure at the water’s surface.
4. Lower the disk a few more feet and then slowly raise it back toward the surface. When you can see the disk, mark the line or tape measure at the water’s surface with another marker. Carefully lift the line and disk back into the boat.
5. Form a loop in the line or tape measure between the two markers. Use a third marker to mark the center of the loop, which is the “average” between the two readings. This measurement, usually in meters, is considered to be the Secchi depth. Record the results on the assessment field form.
6. If the Secchi disk hits the bottom and it is still in view, the reading is greater than the depth of the lake at that location. This often happens when measuring transparency from a dock or in shallow lakes. Measure the depth to the bottom and add a “greater than” (>) symbol to your measurement to indicate that the transparency is greater than the depth to bottom.
7. If the Secchi disk is obscured by dense aquatic vegetation, move it a few feet away to improve your view through the plants. If that does not work, use a transparency tube to get a water-

Unpublished Draft_3/23/2020
103
clarity reading. Note in the Physical/Chemical Assessment Form’s comments section that dense aquatic plant growth inhibited your ability to collect a Secchi disk reading.
pH or Acid/Base The pH scale indicates how acidic or basic water is; it is measured in pH units on a scale of 0–14. A pH of 7 is neutral (distilled water), one that is greater than 7 is basic/alkaline, and one that is less than 7 is acidic. The pH of stream water is influenced by the concentration of acids in rain and the types of soils and bedrock in the watershed. The typical rainfall in the United States is slightly acidic, with a pH ranging from 5.0 to 5.6. As rainwater falls, carbon dioxide from the atmosphere dissolves into it, thus forming a weak carbonic acid that lowers the pH. Soils and bedrock can affect pH, too. Water flowing through karst topography, or other types of limestone bedrock, as well as some volcanic bedrock, can become slightly basic, with a pH higher than 7. Abnormally low or high pH levels (acidic or basic water) can have a harmful impact on the health of aquatic communities. Very acidic water or acid rain can allow toxic substances such as ammonia and heavy metals to leach from our soils and possibly be absorbed by aquatic plants and animals in a process called bioaccumulation. Most aquatic organisms require habitats with a pH of 6.5–9.0. Extremely high or low pH values are quite rare in Idaho, however. Most values that exceed 9.0 (basic) are caused by excessive algal growth, a sign of nutrient enrichment. Very low (acidic) pH readings are generally near point sources of pollution. Reporting Technique Although any type of pH test strip can be used, Hach pH test strips with a pH measuring range of 4–9 are the best to use because they are suitable for use in unbuffered solutions (https://www.hach.com/ph-test-strips-4-9-ph-units/product?id=7640211607, product #: 2745650). Most fish tanks, hot tubs, and swimming pools have some sort of buffering agent included in the chemicals that are added to keep them clean. But streams and ponds aren’t treated and are thus considered unbuffered. If you can’t find the Hach strips, you can use other pH test strips, though they might be less accurate. Whichever test strips you end up using, store them in the dark at room temperature. Here’s the basic procedure to test a water’s pH:
1. Check the expiration date on the bottom of your bottle of Hach or other brand pH test strips. If the expiration date has passed, do not use them.
2. Facing upstream in the area along your transect with the greatest flow, dip the test strip in the water then remove it immediately. Hold the strip level for 15 sec. Do not shake excess water from the test strip.
3. Estimate the pH by comparing the color of your test pad with those in the color chart provided in the test strip package. Remove your sunglasses before reading the strip. The pad will continue to change color, so make a determination immediately after 15 sec.
4. Record your result on the Physical/Chemical Assessment Form.
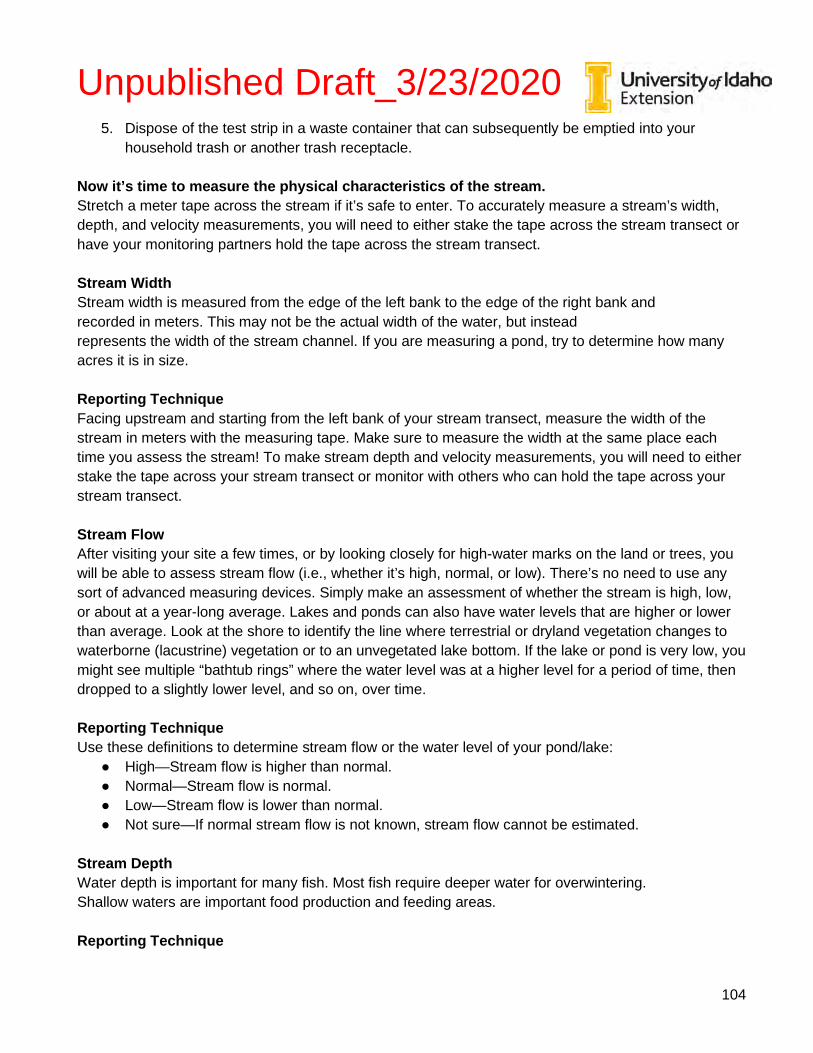
Unpublished Draft_3/23/2020
104
5. Dispose of the test strip in a waste container that can subsequently be emptied into your household trash or another trash receptacle.
Now it’s time to measure the physical characteristics of the stream. Stretch a meter tape across the stream if it’s safe to enter. To accurately measure a stream’s width, depth, and velocity measurements, you will need to either stake the tape across the stream transect or have your monitoring partners hold the tape across the stream transect. Stream Width Stream width is measured from the edge of the left bank to the edge of the right bank and recorded in meters. This may not be the actual width of the water, but instead represents the width of the stream channel. If you are measuring a pond, try to determine how many acres it is in size. Reporting Technique Facing upstream and starting from the left bank of your stream transect, measure the width of the stream in meters with the measuring tape. Make sure to measure the width at the same place each time you assess the stream! To make stream depth and velocity measurements, you will need to either stake the tape across your stream transect or monitor with others who can hold the tape across your stream transect. Stream Flow After visiting your site a few times, or by looking closely for high-water marks on the land or trees, you will be able to assess stream flow (i.e., whether it’s high, normal, or low). There’s no need to use any sort of advanced measuring devices. Simply make an assessment of whether the stream is high, low, or about at a year-long average. Lakes and ponds can also have water levels that are higher or lower than average. Look at the shore to identify the line where terrestrial or dryland vegetation changes to waterborne (lacustrine) vegetation or to an unvegetated lake bottom. If the lake or pond is very low, you might see multiple “bathtub rings” where the water level was at a higher level for a period of time, then dropped to a slightly lower level, and so on, over time. Reporting Technique Use these definitions to determine stream flow or the water level of your pond/lake:
● High—Stream flow is higher than normal. ● Normal—Stream flow is normal. ● Low—Stream flow is lower than normal. ● Not sure—If normal stream flow is not known, stream flow cannot be estimated.
Stream Depth Water depth is important for many fish. Most fish require deeper water for overwintering. Shallow waters are important food production and feeding areas. Reporting Technique

Unpublished Draft_3/23/2020
105
Using your stream width measurement, divide the total width of your stream into three to five equal distances. You will use these distance increments to locate where you will measure the stream depth. Facing upstream and starting from the left bank of your stream transect, measure and record the depth of the water, in meters, at each of your distance increments (see Figure 32). Remember to convert centimeters to meters. If your stream is fairly narrow, three measurements will be enough. If it is very small (e.g., only a meter in width), a single measurement in the middle is sufficient.
Figure 32. Accurate measurements along your stream transect will allow you to track changes in channel migration and the effects of sedimentation in your stream. Illustration by Noah Kroese. If you are measuring a pond, try to find the deepest spot and measure the total depth with a line tied to a weight. You may want to measure a bottom profile by measuring the depth at different points along a straight line across the pond. Scientists use depth finders to measure the depth along many transects or along a grid-patterned path all around the lake. Scientists can make a three-dimensional topographical map of the lake’s bottom with these more sophisticated measurements. Do the best you can with the materials you have on hand. Even knowing the maximum depth of the lake or pond can help you to understand some of the subsurface dynamics within the water body. Stream Velocity and Pond Volume A stream’s velocity is a measurement of how fast water is flowing. Along with a stream’s depth and width, you need to know a stream’s velocity in order to calculate a stream’s discharge rate, or the volume of water flowing down a stream past a particular point per second. While researchers use more sophisticated scientific equipment to determine stream velocity, you can simply use a floating object like an orange, tennis ball, or even a stick. The discharge rate is important data, for it helps us understand the effects of other parameters.

Unpublished Draft_3/23/2020
106
Ponds or lakes, however, are calmer bodies of water, so using a floating object to measure either’s velocity of water is pointless. But you can calculate how long water stays in the pond or lake by knowing its total volume and how much water flows into it. Information like this can be found by searching on the internet or by corresponding with the agency or organization that manages a lake. Additionally, sizable streams or rivers usually flow into large lakes; many of these streams have a gauging station that provides inflow data (though the smaller the stream, the lesser chance that this kind of information is available). Thus you should be able to measure ponds for volume and streams for discharge. Reporting Technique (please read entire instructions first before actually carrying them out)
1. Measure a known distance along a stream’s bank (e.g., 1 m, or 3 m) and get ready with your stopwatch. Be sure the location is not blocked by logs or other obstacles (a few rocks in the way may slow the floating object down a little but that is still acceptable).
2. Toss your floating object into the water just upstream from your measured distance. 3. Start the stopwatch the moment your floating object crosses the upper end of your measured
distance. 4. Stop the stopwatch as soon as it crosses the lower end of that distance. 5. Write down on the Physical/Chemical Assessment Form the time it took the object to float from
the start to the end of the measured distance. 6. Repeat this procedure at least three times at the same location and average the results. 7. Repeat the whole above procedure for each stream-width-distance increment. If your stream is
really small (less than a meter wide), it’s okay to measure just the velocity in one spot in the middle.
Other Stream Assessment Observations and Notes Use this section to record anything of interest or any anomalies you encounter. For instance, if you can’t see the Secchi disk because of aquatic vegetation, or if a friendly dog muddied up your stream just before you took the transparency tube measurement (it’s happened . . . .), note those things here.

Unpublished Draft_3/23/2020
107
Stream Habitat Assessment Instructions Chapter 3; Activity 1 “Metadata” (Date, Time, Monitoring team name(s), Site location and description) While actual water quality data is important, it loses its meaning when it lacks context. When a scientist studies any sort of data, s/he must understand where the data came from, who collected the data, and under what circumstances the data were collected. Some water-quality results vary a lot depending on the time of day or calendar date. For instance, you would expect the water temperature to be much colder in the winter than in the summer. You might also notice a difference in water temperature from the same location early in the morning versus later in the afternoon. Location affects data results as well. A stream way up in the mountains is different in many ways when it flows at lower elevations across more level terrain, away from the mountains. In this section, be sure to note the date and time you begin your assessment. Also, write down your name and the names of everyone else who is with you, even if they are simply observing. The site description should include the geographic coordinates of your stream- or pond-monitoring location. Use a handheld GPS unit to gather your site’s latitude and longitude. If you don’t have one of these units, go online and query Google Maps to find your site location, then right click on that site. The coordinates should pop up in a separate window or within the mapping app somewhere. Note that this is the geographic location of your monitoring site. This corresponds with a stream transect (or cross section) or a pond access. All of your monitoring activities should happen at or be centered on this location. In addition, write a description that is good enough so that someone else can find your monitoring site using only it and a map marked with your site’s location as her/his guide. Some (fictitious) examples might include “Our pond behind the house, on the far side, directly across from the house . . .” or “Such-and-Such Stream, 25 meters downstream from the County Line Road Bridge.” Pebble Count Survey (“Wolman Pebble Count”) The characteristics of a stream bottom are very important to habitat quality and the type of aquatic life you find there. In general, a shifting sand or silt streambed will not support as diverse a population as more stable streambeds consisting of gravel, cobble, boulders, or fallen trees. What a streambed is made up of is called the substrate. You will learn how to use a long-standing assessment technique called the “Wolman Pebble Count” to assess your stream’s substrate. The procedure is named after a famous geologist and hydrologist, M. Gordon Wolman, who worked with geomorphologist and hydrologist Luna Leopold to pioneer research about how rivers flow and change, how they move river bottom pebbles and sediments, and how they change entire landscapes. His count makes for very dynamic study. Although natural geology is responsible for the original substrate of Idaho streams, human activities in the watershed, such as those that increase soil erosion rates, also cause sand or silt to cover existing substrate.

Unpublished Draft_3/23/2020
108
You too can be a hydrologist like Wolman and Leopold. Using the measuring device below will allow you to make your own statistically significant estimate of a stream’s substrate without picking up every single rock in the stream bottom.
Figure 33. Wolman Pebble Count measuring tool. Illustration by Noah Kroese. Reporting Procedure At your stream transect, perform a Wolman Pebble Count:
1. Start at the edge of your transect’s left bank. Take one step into the water perpendicular to the flow and, while averting your eyes, bend over toward your big toe and pick up the first pebble that touches your index finger. In this context, “pebble” means any rocky material, from silt and clay particles to large boulders.
2. Measure and record the B-axis (that is, the “middle axis,” not the longest nor the shortest length
of an irregular-shaped rock; see Figure 33) with a Wolmanator Ruler. Make certain to record your counts in the “inwetted” or “outwetted” columns, depending on if the pebble was in the water or out of the water, respectively. For embedded pebbles or those that are too large to move, measure the shortest axis visible.
3. Discard the pebble downstream so that you don’t count it again.
4. Moving across the transect step-by-step, repeat steps 1–3 until you reach the edge of the right
bank.

Unpublished Draft_3/23/2020
109
5. Establish a new transect just
upstream from your last and begin the process over again. If your stream reach is relatively narrow (< 2 m), modify the method by walking upstream in a zigzag pattern instead of one perpendicular to the flow. In general, collect fifty measurements in order to accurately quantify pebble distributions; however, always finish any transect you start.
Figure 34. In a Wolman pebble count, you will measure the B-Axis of the pebbles, which is the mid-length axis. Illustration by Noah Kroese. Noting the shine of the substrate can help determine if the substrate moves during periods of bankfull discharge (the flow discharge when the stream is full to the top of its banks and is just about to spill onto its floodplain). A dull substrate may indicate more bed load (sediment rolled or dragged along the bottom) than the stream can move and process (aggradation) or show that bankfull flows were not reached. Stream Bank Description You can tell a lot about a stream’s long-term stability and the aquatic life it can support by looking at the shape and condition of its banks. Are the streambanks high, crumbling walls or gently sloping banks with grass, shrubs, and trees growing on them? All streams and rivers move within their floodplains, but a mature, stable stream does not move very rapidly. A stable bank is a sign of a stable stream. But bank-sloughing cut banks (banks that are actively eroding) and high-walled banks without trees or other soil-holding plants are signs of bank instability and poor physical condition and thus poor biological condition. Streambanks are an important source of sediment and nutrients, but when streambank erosion increases beyond the stream’s ability to assimilate the sediment, streambank erosion occurs, negatively impacting aquatic life. A sloping bank covered with vegetation is more stable and indicates a healthier watershed. Not only do gently sloping banks offer better habitats for wildlife near the water’s edge, they work to slow and filter watershed runoff.

Unpublished Draft_3/23/2020
110
So what determines a stream bank’s stability? Factors that impact the stability of streambanks include: Channelization—Streams that engineers have channelized or straightened have extremely high flow, particularly at certain times of the year, like flood season. These methods often create cut banks, thus affecting a stream’s stability. For instance, channelizing streams by pinning them against the edges of valleys was common practice fifty and more years ago. Intended to make farming and other development in the valley bottoms easier, it instead hindered farmers and harmed stream habitats. The streams’ faster flow cut down into the valley floors, reducing the amount of water that soaked into the soil. As a result, farmers had to invest in expensive irrigation equipment. Meanwhile, fish suffered as their severely altered habitat shrunk in size. Today, many landowners try to restore the original sinuosity (curviness) of nearby streams; they also are installing a few armored crossings (fords) in the hopes of opening farming to both sides of the valley. Soil types—The type of soil that a stream channel cuts through affects bank appearance. A stream that cuts through soft loamy soil tends to produce eroding cut banks and thus more instability. A more stable soil such as clay, however, usually encourages the development of more durable slopes. Vegetation—A community of native wetland plants at the water’s edge, such as willow thickets, prevents or slows bank erosion. But growing row crops or harvesting timber at the edge increases erosion, thus negatively altering a stream’s stability. Livestock—In-stream grazing and watering are particularly damaging to a stream’s stability. In fact, livestock grazing directly along and in streams is one of the most erosive forces along streambanks, especially along “cow paths” or watering places. As a corrective, many farmers have installed off-stream watering troughs while many ranchers have switched to fencing livestock out of streams. Road culverts or drainage tiles—Outlets can cause erosion if not properly positioned and installed. Properly designed road culverts reduce erosion and allow fish passage upstream and downstream. Reporting Procedure Use the Stream Habitat Assessment Form to record the characteristics of both the left and right streambanks as you face upstream at your site’s stream transect. Bank Condition Streambanks are the portions of the stream channel that are the most susceptible to erosion. They are important transition zones between terrestrial and aquatic life. Generally, human disturbances in and around the riparian corridor heavily influence a streambank’s condition. Banks in good condition are well vegetated, stabilized by deep root systems, and provide excellent aquatic habitat. Eroding streambanks are likely to have very little vegetation and easily fall to flow-related erosion. Yet appearances can be deceiving. Some banks covered by vegetation can be unstable sites where erosion sets in. Alternately, some exposed banks can be stable, especially those predominately made of rock. Whatever the cause of their deterioration, poor streambanks often allow more solar radiation to reach the water via an increased sediment load to the channel.

Unpublished Draft_3/23/2020
111
Reporting Procedure At your stream transect, record the condition of both the left and right streambanks. For each streambank, choose one of the following descriptions:
● covered, stable ● uncovered, stable ● covered, unstable ● uncovered, unstable
Canopy Cover Canopy cover influences the amount of light that can filter through overhead vegetation before reaching a stream. It is the vegetation (tree branches, leaves, grasses, etc.) that hangs over a stream. Like clouds in the atmosphere, canopy cover helps protect a stream from extreme fluctuations in water temperature. Vegetation is also important for streambank stabilization and the aquatic food web. Without a good canopy cover, a stream’s water temperature can fluctuate greatly and stress aquatic communities. Elevated water temperatures resulting from solar heating creates warm water, which contains less dissolved oxygen than cold water. Thus less oxygen is available for fish and other aquatic life in streams with no or little canopy cover. Reporting Procedure At your stream transect, estimate what percentage of the area above the stream is covered by tree branches, leaves, and/or grasses. Make your best estimate of canopy cover in 25% increments. You can use a phone camera or digital camera to take a photo, pointed directly up, above the middle of the stream. Use the photo to help estimate the percentage of canopy cover. You can also digitally superimpose a grid on top of the photograph, then count the grid squares that are most filled by tree branches, leaves, etc. to assist your estimation. Riparian Zone Width and Percentage Plant Cover A stream’s riparian zone is the area of land directly adjacent to a stream. A healthy riparian area consists of trees, shrubs, and/or grasses (Figure 35). This zone is extremely important for the health and protection of the stream. Trees help stabilize the bank during flood events and may provide habitat for both aquatic and terrestrial organisms. Shrubs, grasses, and other plants slow and filter runoff water before it enters the stream.

Unpublished Draft_3/23/2020
112
Figure 35. Transect of a riparian zone, where the depth to the water table is shallow. Illustration by Mercedes Rennison. Reporting Procedure Measure each of the following at the stream transect:
● Riparian Zone Width—Facing upstream, estimate the width of the riparian zones along the left and right banks in increments of 0–5 m, 5–25 m, and more than 25 m. Utilize the vegetation’s appearance as an aid in determining the zone’s extent.
● Riparian Zone Plant Cover—Facing upstream, estimate the percentage of plant cover (trees,
shrubs, grass/low plants, other) in the left- and right-bank riparian zones. The percentages of each bank should add up to 100%.
To prepare for the next procedure, begin assessing the stream reach beyond the stream transect Stream Sinuosity (along the entire stream reach) Sinuosity is a measure of a stream channel’s tendency to meander back and forth within a stream valley. Strictly speaking, sinuosity is the ratio of the channel length between two points in a channel and the straight-line distance between the same two points. Describing the sinuosity of the stream reach as low, moderate, high, or braided does not necessarily mean that the entire stream has that level of sinuosity but that the portion of the stream being monitored can be viewed in this way. Stream channels with low sinuosity are relatively straight with few bends or meanders. Stream channels with moderate sinuosity have few bends that are greater than 90º. A high sinuosity rating is for streams with a significant number of bends and meanders that make a greater than 90º curve. Braided channels are divided into several smaller channels, typically due to an accumulation of deposits within the bankfull channel (Figure 36).

Unpublished Draft_3/23/2020
113
Figure 36. Descriptions of various stream sinuosity measurements. Illustration by Noah Kroese. Reporting Procedure Record the sinuosity of your stream reach as low, moderate, high, or braided. Microhabitats Smaller habitat areas, called microhabitats, exist within larger stream habitat types (pool, riffle, run, and glide). These microhabitats consist of algae mats, leaf packs, logjams, rock piles, root wads, undercut banks, fallen trees, weed beds, and large rocks. Microhabitats ensure stream diversity by supporting a variety of aquatic life. Reporting Procedure Your Stream Habitat Assessment Form lists many different types of microhabitats. Check off all of the different types that you see in your stream reach and describe each as well as possible. Adjacent Land Use The land use adjacent to a stream and riparian zone is also very important to document. Feedlots, wastewater treatment facilities, and city storm sewers can be sources of nutrients and other pollutants to nearby waters. Other important influences include golf courses, roadways, parking lots, construction zones, dump sites, airports, and state or federally protected natural areas. To be sure, stormwater flows from any land use, carrying beneficial nutrients as well as associated pollutants directly to the stream.

Unpublished Draft_3/23/2020
114
It is important to document any land use in the watershed that might influence water quality, especially those that exist in close proximity to your stream reach. Additionally, documenting human use, or even evidence of it, can help to illustrate our physical connection to aquatic resources. Reporting Procedure The Stream Habitat Assessment Form contains three lists related to land use: land uses immediately adjacent to your stream, human uses that you witness, and human use that you don’t witness. From these lists, check all those that apply along the stream reach. Note: don’t document land uses that are out of sight or more than a few hundred yards from your stream.
● Adjacent land-use—Check all land uses in the area adjacent to the riparian zones. Record all other land-use practices that could affect the stream.
● Human-use activities—Check all activities you’ve either witnessed or participated in at this site.
● Evidence of human use—If there’s any evidence of others using the stream, check all uses that apply.
Record all other land use practices that potentially could affect the stream: Document the many land uses more distant from your stream reach that might impact the water quality there. Reporting Procedure (Photographs) As the adage goes, a picture is worth a thousand words. Photographic documentation of habitat conditions along your stream reach may prove to be extremely useful for tracking changes over time. Be sure to use landmarks to identify specific locations so you can compare images from year to year. The more pictures, the better!

Unpublished Draft_3/23/2020
115
Pond/Lake Habitat Assessment Instructions Chapter 3, Activity 3 IDAH2O suggests beginning lake monitoring at spring ice-out and continuing on a monthly schedule until fall freeze-over. A habitat assessment, however, should be an annual event, preferably in July. If this schedule is too rigorous, or if the goals and objectives of your program don’t require this frequency, set a schedule that works best for you. The most important concept is consistency. If you sample the first week of May, July, and September one year, be sure to repeat this as closely as possible the next year. In general, IDAH2O recommends sampling between 10 a.m. and 3 p.m. Understand, however, that there is flexibility in both the day and time you sample, especially when unfavorable weather conditions intrude. Use good judgment as to when to sample. IDAH2O recommends that you not sample alone and be sure to let someone know when and where you are going to sample. Under no circumstances should volunteers be on the water during rain or electrical storms, high winds (white caps), thin ice, or other unsafe conditions. When conducting your assessment, use the Pond/Lake Habitat Assessment Form located in appendix 3 and online at the IDAH2O website (https://www.uidaho.edu/extension/idah2o/volunteers). The remainder of this chapter describes the various kinds of data you’ll collect when you do the assessment. When (or before) you arrive at your monitoring site, you first need to be sure you have everything you need, that your equipment is organized and ready to use, and that you’ve set up your assessment form to be ready to document the conditions at the site. As with the Physical and Chemical assessments for stream monitoring, it is important to include the metadata that provides context for your assessment. You will use the monitoring data collection form in appendix 3 to record your data. Pay close attention to each of the individual protocols discussed and described in the following paragraphs. “Metadata” [Date, Time, Monitoring team name(s), Site location and description] While actual water-quality data is important, it loses its meaning when it lacks context. When a scientist studies any sort of data, s/he must understand the data’s origins—who collected the data and under what circumstances. Indeed, water-quality results can vary a lot depending on the time of day or calendar date. For instance, you would expect the water temperature to be much colder in winter than in summer. You might also notice a change in water temperature from the same location early in the morning versus later in the afternoon. A stream way up in the mountains is thus different in many ways from the same stream that flows across lower and more level terrain away from the mountains. As a result, make sure to note the date and the time you begin your assessment. Also, write down your name and the names of everyone else who is with you, even if they are simply observing. The site description should include the geographic coordinates of your stream- or pond-monitoring location. Use a handheld GPS unit to gather your site’s latitude and longitude or go online and use Google Maps to precisely find its coordinates. To do that, first find your site location on Google Maps and right click on it. The coordinates should pop up in a separate window or within the mapping app

Unpublished Draft_3/23/2020
116
somewhere. Note that this is the geographic location of your monitoring site, information that corresponds with the point at which you access your pond or lake. All of your monitoring activities should happen at this location or be centered on it. In addition, write a description that is good enough so that someone else can find your monitoring site using only it and a map marked with your site’s location as her/his guide. Some (fictitious) examples might include “Our pond behind the house, on the far side, directly across from the house . . .” or “Such-and-Such Stream, 25 meters downstream from the County Line Road bridge.”

Unpublished Draft_3/23/2020
117
Make Your Own Transparency Tube Instructions Chapter 3; Activity 2 (Option 3-A) Materials:
● A clear tube (approximately 4.5 cm x 60 or 120 cm; many hardware stores carry long tubes for protecting fluorescent light bulbs. These are inexpensive and make excellent transparency tubes. If these are not available, any long, clear plastic tube of the appropriate size can be used. Length of tube is more important than diameter.)
● Permanent, waterproof black marker ● PVC cap (to fit snugly over one end of tube) ● Meter stick (or meter tape)
Directions:
● Using the black permanent marker, draw a Secchi pattern (alternating black and white quadrants) on the inside of the PVC cap.
● Attach the PVC cap over one end of the tube. Use glue, adhesive, or some sort of waterproof tape if you need to. The cap should fit tightly to keep water in.
● Use the marker and meter stick to draw a centimeter scale on the tube’s side. The bottom of the PVC cap with the Secchi disk pattern is 0 cm. Mark every centimeter up from that point. Most commercially available transparency tubes are either 60 cm or 120 cm.
● Drill a small (1/8”–3/16”) hole in the bottom; you will use your finger to plug the hole when it’s time to fill the tube. Instead, you can install a shutoff valve near the bottom of the tube to allow water to escape in a controlled manner; this more closely resembles commercially available transparency tubes, but its assembly requires care.
● This procedure adapted from: https://www.globe.gov/documents/11865/320eaa47-1309-44dd-844a-7767168c040c.

Unpublished Draft_3/23/2020
118
Make Your Own Secchi Disk Instructions Chapter 3; Activity 3 (Option 3-B) (Adapted from Oklahoma State 4-H Sportfishing Program, “Homemade Sampling Gear: Making a Secchi Disk,” http://www.4hfishing.org/resources/aquatic_ecology_pdfs/7c_homemade_sampling_gear_secchi_disk.pdf) The Secchi disk depth is influenced by the amount of suspended plankton and other nonliving particles (dirt, small pieces of organic material) in the water. Young game fish depend on plankton as food sources. Many species of baitfish feed on plankton. Fish that depend upon vision to capture their food may be replaced by bullhead and other fish that feed by touch and odor if waters are constantly turbid from siltation. Turbidity caused by excess algae may indicate that oxygen levels are depleted. In this type of water, only fish that survive in low-oxygen environments, such as carp and members of the catfish family, may be present. Biologists also use the Secchi disk on ponds, lakes, and slow-moving rivers to determine the productivity of a given water. Unproductive waters have little turbidity, so the Secchi disk can be lowered very deep (30 or more ft). Productive waters can have Secchi disk depths of a few feet to a few inches. Recently, observations have been made about the impacts of zebra and quagga mussels on algae-related turbidity. In zebra mussel–infested waters, the clarity of the water has improved dramatically due to the capacity of these organisms to filter huge amounts of water. This reduction of plankton can lead to game fish population crashes.
Building and Using a Secchi Disk Lake scientists use a Secchi disk to measure transparency in lakes and ponds. By lowering the Secchi disk until the black-and-white pattern is no longer visible and noting its depth, you can measure a relative level of transparency. Use the Secchi disk to compare the transparency of a number of different lakes or ponds. It may also be interesting to measure the transparency of a lake or pond during different times of the year. Materials Needed:
● Wood (plywood works best) or 1/4" plastic disk, 6–8 in (15–20 cm) in diameter (alternately, the top of a large juice can or a metal pie plate are good approximate measures)
● Hand drill ● Black and white paint—exterior grade, flat ● 20’–50' piece of parachute cord or other nylon rope ● Large metal washers (several ounces for each disk) ● Eye bolt, three nuts, and a washer for each disk ● Stick or wooden dowel, about 1 ft (30 cm) long ● Two waterproof markers, different colors
Building the Secchi Disk:

Unpublished Draft_3/23/2020
119
1. Paint entire disk with white paint. If using wood, be sure to cover all exposed surfaces and edges.
2. Drill a hole large enough for the eyebolt to pass through in the center of the wood or plastic disk. Thread one nut on the eyebolt, followed by the washer. Put the eyebolt into the disk and place the washer and nut on the bottom. Tighten. (Sequence should be eyebolt, nut, washer, disk, then washer nut. The washer is used for weight and is threaded on the bottom of the eyebolt and held on with the remaining nut.)
3. Divide the disk into quarters and paint alternating sections of it black and white. 4. Tie the rope to the eyebolt. 5. Tie the free end of the rope to the stick or wooden dowel. 6. Use the marker to mark off distances on the rope every 6 in (or every 10 cm if metric). For
example, mark every 1-ft (or 1-mete) interval with a red mark and every 6-in (10-cm) interval with a blue mark.
Using the Secchi Disk:
1. Hold onto the stick and rope and lower the Secchi disk into the water until you can no longer see its painted surface.
2. Using the marks on the rope, determine how deep the Secchi disk is when you lose sight of the black-and-white pattern or the depth at which it reappears as you bring it back up.
3. This depth is your measure of transparency. Use the same method each time you measure your transparency.

Unpublished Draft_3/23/2020
120
Aquatic Macroinvertebrate Assessment Instructions Chapter 3; Activity 5 How to collect a macroinvertebrate sample from a stream:
1. Wade into a stream with your partner/teammate with a net and place it so its mouth is perpendicular to and facing the flow of the water.
2. Another person on your team positions her/himself upstream from the net and disturbs the stream bottom with her/his feet and hands or turns over rocks with a shovel.
3. Carefully pick up and rub stones directly in front of the net to remove any attached animals. (The current will have carried stream-bottom materials and organisms into the net.)
If you are sampling from a pond, use a long-handled net to knock macroinvertebrates off the emergent and submerged vegetation around the edges of the pond. Also, try to capture some bugs off the bottom, but be careful to allow as little muck into the net (though trapped muck is inevitable) to make finding the bugs easier.
4. Continue this process until it looks like you have captured enough macroinvertebrates, or if you see that you are not catching any more. This should not take too long; less than one minute. If you notice that a lot of debris traps in the net, stop and pick through that, collecting any macroinvertebrates, then go back for more. Too much debris in the net makes it more difficult to find the macroinvertebrates.
5. Pick individual macroinvertebrates directly out of the net (use a plastic spoon, forceps/tweezers, or just your fingers) and store them in a tub or ice cube tray or simply dump your stream or pond sample directly from your net into a larger plastic tub, using a container of stream water to help wash the organisms into that tub.
6. Sort and identify the macroinvertebrates using magnifying glasses, ice cube trays or shallow dishes, and dichotomous macroinvertebrate identification keys. (You can find the keys on the IDAH2O web pages and elsewhere online; use the internet search term, Aquatic Macroinvertebrate ID Key.)
Accurately identify each aquatic macroinvertebrate you find and mark its presence on the data sheet. You can use hash/tally marks to count the total numbers of different macroinvertebrates you’ve collected, but this is not necessary; a simple presence-absence survey is sufficient.

Unpublished Draft_3/23/2020
121
Make Your Own Aquatic Macroinvertebrate Kick-Net Instructions Chapter 3; Activity 5 You can also make a long-handled net for collecting macroinvertebrates from ponds, undercut banks, and other hard-to-reach locations. It can be done for two dollars or less! Find a wooden dowel about an inch in diameter (possibly as small as ¾”); a wire coat hanger; about a yard of light-colored nylon netting (or one of a similar synthetic material); a 4”-wide x ~3’-long strip of canvas or other durable, sewable material; needle/thread; duct tape; and a rubber band. You can find netting at a fabric shop; some people prefer the “tulle” netting that’s often added to wedding dresses or formal dresses. The netting should be 18” by 36”.
1. Fold the netting the shortwise to make a square-shaped double-thickness net about 18” square. Stitch up all three sides to complete a double-thick net for durability.
2. Fold the long strip of durable material in half to form a long, skinny folded material. Sew the
longest seam to form what could be thought of as a tube.
3. Straighten the coat hanger hook and reshape the rest of the hanger so that it’s round; you might double up on the coat hangers to increase stiffness. If you do so, use a few twist ties or zip ties to tighten the doubled coat hangers together.
4. Duct tape the straightened hook to the dowel and open out your folded netting to form a pouch;
carefully wrap the top edges of the netting’s opening along the coat hanger’s circumference. Stitch the netting’s edges in place along the hanger’s rim, so that the pouch can hang down freely. Make the net more durable by folding the canvas in half lengthwise around the coat hanger and sewn-on netting and sew it all together with double- or triple seams all the way around. It won’t look nearly as good as this (Figure 37) , but it will be just as functional.
Figure 37. Example of a macroinvertebrate Kick Net.

Unpublished Draft_3/23/2020
122
Appendix 2: Advanced Activities Four additional advanced activities are located in this section. Each builds upon existing activities within the regular curriculum. These activities are optional and are intended to provide older members with real-world scientific challenges above and beyond the others.

Unpublished Draft_3/23/2020
123
Advanced Activity 1: Watershed Precipitation Volume After you complete section 2, chapter 1, learning activity 2 (Basic Watershed Mapping), you might be ready to calculate the total volume of water that falls as rain and snow/precipitation within a watershed. To calculate a volume of water that falls as rain: Multiply the number of inches of rain by the watershed area in acres and divide the result by 12 (the number of inches in a foot). Use acre-feet (ac-ft) as the unit of measurement. Imagine a huge, long, skinny box that is 660 ft long, 66 ft wide, and 1 ft tall. Or, imagine a football field covered in 1 ft of water. The amount of water in an acre-foot is almost 326,000 (exactly 325,851) gal. Acres x (inches of precipitation/12) = total volume of water in ac-ft Multiply the total acre-feet of rainfall by 325,851 to get the total number of gallons of rainfall that, on average, falls on your watershed each year. It will be a huge number! Here’s an example: The Lake Pend Oreille watershed (not including the Clark Fork River; only the surface of the lake and the ridges around the lake) is 176,870 ac. About 32 in of precipitation (including the snow, melted into liquid water) falls on the lake each year.
176,870 x (32/12) = ac-ft 176,870 x 2.6666666667 = 471,653.3 ac-ft 471,653.3 ac-ft x 325,851 gal per ac-ft = 153,880,82,208 gal
Yikes! That’s a big number. That’s why water resources managers use the unit of measurement of acre-feet, as it’s easier to understand. Now, try this calculation for your own watershed!
Reflection Look on the internet and do a Google search to find the total population of your watershed; or make the closest estimate that you can. Divide your volume calculation by the population. By this calculation, how many gallons (or acre-feet) of precipitation are available per person? What’s missing from this calculation (e.g., did you count crops or livestock or other water users in it)? Try drawing a diagram with arrows to show where all that water goes, proportionally. What percentage of all that water makes it to your home?

Unpublished Draft_3/23/2020
124
Advanced Activity 2: Preserving Aquatic Macroinvertebrates Preserving aquatic macroinvertebrates is a little different from preserving and pinning their terrestrial counterparts. Aquatic macroinvertebrates should be kept in ethyl alcohol, which is a type of rubbing alcohol commonly found in local pharmacies (see, for instance Walgreen’s online ad: https://www.walgreens.com/store/c/walgreens-ethyl-rubbing-alcohol-70-first-aid-antiseptic/ID=prod6056575-product). Isopropyl alcohol is more commonly used as rubbing alcohol, but it does not preserve the bugs as well as ethyl alcohol does. More information can be found here: https://www.ars.usda.gov/arsuserfiles/60360510/publications/King_and_Porter-2004(M-3886).pdf.
Some macroinvertebrates, especially the soft-bodied ones (leeches, worms), but also many hard-bodied ones curl up when placed in the preservative. This renders the organism unfit for visual exploration. The IDAH2O program has had success in narcotizing specimens by placing them in a low concentration (~5%–10%) of ethyl alcohol and water, which relaxes them slowly enough that it helps them to maintain or extend a lifelike appearance. The procedure also makes a collector feel better about the preservation process because it knocks the creatures out before they die in the pure preservative. Once the specimen relaxes in the low concentration of alcohol, you can place them in full-concentration alcohol. I do this by pouring out the low-concentration solution and immediately adding the full-concentration version. Be patient waiting out this entire process. Some organisms can take up to an hour to relax, others longer. For instance, crane flies take a very long time to relax. But most knock out in about 10 or 15 min. For more information, see: https://www.mccrone.com/mm/narcotizing-slowing-down-and-preserving-microscopic-and-other-aquatic-animals/#sthash.h53On0G1.dpuf.

Unpublished Draft_3/23/2020
125
Advanced Activity 3: Crayfish Population Data Collection Logan and Emily heard about a new citizen science project on crayfish populations that really intrigued them. It focused on whether native or invasive, non-native species inhabited creeks and rivers across the entire Columbia River Basin, including streams near them. Each had caught a crayfish or two in their nets when completing their biological stream surveys. But they didn’t know that Idaho has at least three native and two non-native species of crayfish. Curious to know more details about these creatures than that they resemble miniature freshwater lobsters, the pair gathered the latest information that they could about the different species of Idaho crayfish. They discovered that the three native species had been spotted near places where Logan and Emily were currently living or had lived: signal crayfish (Pacifastacus leniusculus) mostly in north Idaho where Logan lives, the pilose crayfish (P. gambelii) in portions of southeastern and far southern Idaho where Emily lives, and the Snake River pilose crayfish (P. connectens) generally in far southwestern Idaho counties, including the Boise area where they both grew up. They also found out that at least two non-native, invasive species of crayfish inhabit portions of Idaho: virile crayfish (Faxonius virilis) can be found across many Idaho waterways and red swamp crayfish (Procambarus clarkii) have been found in portions of southern Idaho. Note: The following section is adapted from the Crayfish Project Field Study, written by Debra Berg, Lake Roosevelt National Recreation Area. Purpose: Members will have an opportunity to participate in a place-based educational field study in a National Recreation Area. Being part of a study that occurs within the boundaries of a park, as well as within their local community, will connect members to “place.” Monitoring an invasive species will hopefully empower and encourage them to be environmentally conscious in the future. Timeline: 1–2 days Overarching question: How do invasive crayfish species affect the population and habitat of native crayfish? Learning/Inquiry Activity 11: Monitoring for Crayfish Anticipated time: 4.5 hrs (2.5 hrs indoors, planning, learning identification skills, and building net(s); 1.5 hrs outdoors, catching and identifying macroinvertebrates; 30 min uploading data and cleaning up)
Learning Objectives ● To learn how to capture crayfish ● To learn how to objectively identify different crayfish species in Idaho ● To measure crayfish and identify specific body parts
Materials ● a copy of trap-sampling protocol ● traps, buoys ● tool to punch holes in catfood can ● all other materials on protocol list ● garbage bag

Unpublished Draft_3/23/2020
126
● a copy of “Crayfish May Help Restore Dirty Streams” article ● field supplies and equipment:
crayfish traps canned cat food GPS thermometer field maps field data forms (including the Crayfish Study Assessment Form, appendix 3) pencils measuring board/ruler digital scale and mesh bag digital camera waders cooler/ice bucket crayfish identification keys (see appendix 3, Aquatic Macroinvertebrate Identification Key) sampling permits
Procedure Basically, you’ll be going to a local pond or stream to set and then later collect your traps and gather the data. You’ll be leaving the traps all day and/or overnight, but no longer than 24 hrs. Follow the Crayfish-Sampling Protocol (listed as Trap-Sampling Protocol below) precisely; it lists the techniques you should use to set and collect your traps. This protocol is one used for member crayfish surveys conducted across the Columbia River Basin; however, not all parts may pertain to you and your situation. Use the parts that work best for you or are legal in your state. Check and follow the fishing regulations in your state for trapping crayfish. In Idaho, you must have a fishing license to catch crayfish in traps, but you don’t need one to catch them (or any other aquatic macroinvertebrate) in a seine or Kick Net. More things to consider:
● Before you leave school grounds, make sure at least two group members accompany you. Also make sure they are equally prepared to carry out their duties after arriving at the park. Depending on the number of members you are taking to the park, you’ll likely want to invite parents to help chaperone, if possible.
● Make sure that invited members have practiced measuring and recording data, though they may not have set or pulled the traps yet. Depending on when you choose to go into the field, you could practice setting and retrieving traps in the school yard if you prefer.
● Take along a garbage bag for the cat food cans and any other garbage you may find at the park.
Let’s Do It! Trap-Sampling Protocol Setting

Unpublished Draft_3/23/2020
127
1. Ensure that all needed equipment is loaded in your vehicle(s). 2. A minimum of two people must be present during sampling. 3. The teacher’s name and fishing license number must be on a tag attached to the trap. 4. Be sure to monitor the weather and dress appropriately while out in the field. 5. Navigate by vehicle and by foot to your survey sites. 6. Prior to setting the trap:
a. Determine the location where you will set your trap. b. Punch several small holes in the bottom of seafood-flavored canned cat food. c. Place the punctured can into the trap, secure it inside the trap with a zip tie or bailing
wire and lock the trap’s door. d. Attached buoy/buoy line to the trap. e. Record the site name on your data sheet. f. Record the names of the collectors on your data sheet. g. Record the date set on the data sheet. h. Record the water temperature (in Celsius degrees) on your data sheet. i. Record the air temperature (in Celsius degrees) on your data sheet. j. Circle Y or N to respond to the “precipitation?” prompt on your data sheet. k. Describe the bank’s condition on your data sheet. l. Describe the bank substrate on your data sheet.
7. Setting Traps a. Toss the baited trap into water. BE SURE you have a hold of the end of the buoy
line! b. Secure the buoy line to the shore. c. Record the buoy number on your data sheet. d. Record the time you set each trap on your data sheet. e. Record the waypoint (an intermediate point or place on a route, or a stopping point or
point at which you change course) and GPS coordinates of the trap location on your data sheet.
8. Set each trap within the sample location, depending on the available habitat and distance from other sample sites.
9. Choose a central location to set your traps and record the following on the Crayfish Study Assessment Form (appendix 3):
a. Current weather conditions b. Lakeshore bank type
10. Leave your traps overnight and collect them within 24 hrs of setting them. After setting all the traps be sure to collect all the equipment you didn’t use and return it to your vehicle(s). Pulling
1. Pre-activity. Make sure of the following: a. That all the equipment you need is loaded into your vehicle(s). b. That a minimum of two people is present when you pull your traps. c. That the teacher who is listed on the collection permit is on site during trap retrieval. d. To check the weather and dress appropriately while out in the field. e. To navigate by vehicle and by foot to your survey sites.

Unpublished Draft_3/23/2020
128
f. That you’ve designated a recorder and measurer.
2. For each trap you pull: a. Record the data one at a time and in the order each trap was set. b. Record the date pulled on the Crayfish Study Assessment Form (appendix 3). c. Pull it slowly to ensure you don’t lose crayfish, damage the trap, or cut the line by
accident. d. Place the trap onshore and record the time pulled on the study assessment form. NOTE: A trap may get stuck; if this happens, try your best to get it unstuck without getting into the water. If you are unsuccessful in bringing in the trap or if you lose any traps, tell your Adult Leader. S/he should provide you with a replacement trap.
3. Unhook the buoy line from the trap and neatly wind it back up and place it into a mesh bag. 4. Record various biological measurements using the Crayfish Study Assessment Form (appendix
3). a. One at a time, pull crayfish from the trap. b. Identify the species using the key provided and record it. c. Identify and record the gender of the crayfish: Male (M), Female (F). d. Measure and record its carapace length in millimeters (mm). e. Measure and record its total length in mm (ensure that the uropods—tail fan
appendages—are together). f. Measure and record its weight to the nearest gram by placing the crayfish in a mesh bag
and hanging it from a digital scale. Be sure to zero-scale it each time with the bag attached before weighing each crayfish.
5. Take a picture of each crayfish and record a picture number on the assessment form. 6. Once you’ve recorded all of your measurements: if the crayfish is a native species (e.g., a
signal crayfish) take a picture of it and immediately return it to the water. If it is a non-native species, take a picture of it and then place the crayfish into a bucket.
7. Continue steps 8–10 until all the crayfish in the traps are accounted for. 8. On your data sheet, record the total number of crayfish caught in each trap by referencing its
corresponding buoy number. 9. Repeat steps 6–12 until you’ve pulled all the traps and collected and recorded all of your data. 10. If you are unsure of your identification of a species, take several pictures of the crayfish in
question and use them to identify it with more confidence later. NOTE: The more pictures the better! Take pictures of the traps, the crayfish in the trap, the site; take pictures of anything and everything!
11. Place all the non-native crayfish now in the buckets into a plastic bag and set them on ice and/or place them into a freezer to euthanize them.
12. Once the non-native crayfish have been euthanized, it is your teacher’s responsibility to properly dispose of them.
IMPORTANT: At NO time can any of the crayfish collected be kept as pets or be consumed. It is against the law to transport live crayfish; and it violates our scientific collection ethics to use crayfish for anything other than crayfish population studies. If at any time these rules are broken, the member(s) involved will be immediately banned from the project.

Unpublished Draft_3/23/2020
129
Reflection Carefully consider each of the questions below. Think deeply about each crayfish as an individual creature and as a species connected to a larger watershed.
1. How would you explain a crayfish to someone who has never seen one before? What if that person had never seen a lobster? Provide a detailed written description.
2. Explain how a crayfish’s needs and anatomy are adapted to its environment. (Give at least two examples.)
3. Compare and contrast swimmerets and walking legs. 4. After reading the attached article, explain what you think would happen to the environment in
the cage if you introduced a non-native crayfish into the caged-off section of the creek containing native crayfish:
a. Short term b. Long term
5. Explain why you think the above changes would happen. 6. Your job is to redesign a crayfish. What would you change and why?
Data Analyses and Reporting After you’ve finished collecting data, make and save electronic copies of the data sheets and email them to the Lake Roosevelt Biologist (contact information provided below). Those copies will be placed into the Lake Roosevelt National Recreation Area Crayfish Inventory & Monitoring Study binder. You may want to report your findings to a local agency or post your information on iNaturalist, a nature-study website (see http://www.inaturalist.org/). The website is easy to navigate so you should be able to post your findings without a hitch! The above material was adapted from a document written by Meghan Lyons, NPS biologist and Janice Elvidge, NPS educational specialist; and from a crayfish curriculum created by Engaging Every Student, where you can find additional crayfish curricula and a poster.
Article: Crayfish May Help Restore Dirty Streams Crayfish may benefit insects, reduce sediment settling in impaired streams
Date: April 21, 2016 Source: Stroud Water Research Center While macroinvertebrates are a tasty food source for crayfish, a new study reveals a surprising finding: When crayfish were present in in-stream experimental enclosures, macroinvertebrate density was higher, not lower. Stroud Water Research Center's lead fluvial geomorphologist Melinda Daniels, Ph.D., and Lindsey Albertson, Ph.D., a postdoctoral researcher and ecology professor from Montana State University, conducted the study in Valley Creek. The creek is an urbanized and degraded tributary of the Schuylkill River in King of Prussia—a Philadelphia suburb. The scientists placed wire-mesh enclosures, some with crayfish inside and some without, in the creek. At the conclusion of the 2-week experiment, populations of macroinvertebrates such as caddisflies, which can indicate better water quality, were higher in the crayfish enclosures despite being a food

Unpublished Draft_3/23/2020
130
source for crayfish. The crayfish enclosures also featured reduced settling of fine sediment pollution on the surface of the streambed. As the crayfish disturbed the rock and gravel bottom with their claws, they agitated and increased suspension of fine sediments, presumably allowing more sediments to flow downstream. "We were surprised," Albertson admitted. "We thought the crayfish would eat the macroinvertebrates and reduce their populations, but we found the opposite. Macroinvertebrate density was higher in the crayfish enclosures. So even if the crayfish were eating some of the macroinvertebrates, we think that all of the fine sediment that had been suspended and washed away created a more macroinvertebrate-friendly habitat." Many macroinvertebrates don't like to live in streams with high sediment loads. It's a type of pollution that degrades freshwater streams and can be traced to land-use changes like agriculture and development. Daniels said, "Crayfish show the potential to alleviate some of the problems seen in impaired streams. Every organism has its part in an ecosystem, and we're still learning what the individual roles are." Stroud Water Research Center. "Crayfish may help restore dirty streams: Crayfish may benefit insects, reduce sediment settling in impaired streams." Science News. ScienceDaily, 21 April 2016. <www.sciencedaily.com/releases/2016/04/160421085228.htm>.

Unpublished Draft_3/23/2020
131
Advanced Activity 4: Trash Cleanup and/or Streambank/Lakeshore Restoration Plan Many community needs can be met through volunteerism. One way you can help to better your community is to participate in a stream cleanup or stabilization vegetation planting effort. Engaging in events like a trash hike not only will help to clean the watershed, it gives you the opportunity to create your own citizen science project and share vital data. While walking along your creek or pond and picking up trash, record your findings: describe and weigh the trash; enter its weight into an Excel spreadsheet or use the Litterati app (https://www.litterati.org/) to track the different types of trash. If you plan to organize a waterway cleanup or vegetation planting project, start early by identifying and coordinating with appropriate organizations or agencies. Next, determine whether a similar project targeting your water body has already occurred and find out who organized it. If no similar project has happened, contact your local Extension office to find an organization that is experienced in managing volunteer projects. University Extension has a lot of experience with organizing volunteers, but if this sort of project is beyond the Extension office’s ability, additional possibilities include a nearby field office of the Natural Resources Conservation Service, the Idaho Department of Environmental Quality, a watershed advisory group, or a local nonprofit. These organizations can provide essential leadership, problem-solving, registration/permission waivers, and other helpful services and resources. Partnering with an experienced organization or event leader is crucial, especially in the days and hours before and after your event occurs. As the day of your event nears, make sure everything is ready to go. See the “Let’s do it” section below for more details. Learning/Inquiry Activity 12: Organizing a Volunteer Day Anticipated time: 3of pre-activity setup, 3 hrs of activity, 1 hr of follow-up
Learning Objectives To learn about a local agency or organization that manages volunteer efforts To learn how to organize and develop a volunteer effort To meet new people and network with professionals
Materials Depends on the individual project. Work with a local organization to help you develop a list of necessary tasks and materials.
Procedure Some of the pre-planning includes finding volunteers for and resources to use on the event day, like trash bags, gloves, willow cuttings, etc. Volunteers like to get a little something for their effort; providing hot beverages and snacks on the morning of the event and/or lunch afterwards can help retain those you’ve already recruited, as well as attract more. A local grocery store or restaurant will often donate basic snacks or lunch items. If you choose to have door prizes, other businesses and individuals might donate items for the giveaway. Use tickets or devise some other way to do a random drawing, unless you’ve collected enough items (like T-shirts) that you can give one to each volunteer. You might also work with the event’s sponsoring organization to seek additional funding so that all volunteers can be provided with a token of appreciation like a T-shirt or lapel pin.

Unpublished Draft_3/23/2020
132
If nobody knows about your event, however, you won’t get any volunteers! Outreach, therefore, is crucial; doing a lot of it plays a big part when organizing any volunteer effort. Use a number of methods to help get the word out to people who are likely to volunteer their time. Contact local newspapers and other media outlets, especially if they post public event calendars. Some local radio stations can arrange for you to have a couple of minutes of airtime so that you can deliver a “PSA” (that is, a Public Service Announcement) or even give a brief, live interview with one of their DJs. You can also produce informational flyers and post them strategically, like at community centers or on public billboards. But always ask permission, or understand and honor an organization’s requirements/limitations, before doing so.
Let’s Do It! On the day of your event, make sure everything is ready to go. Arrange all the resources at your event location well in advance. Recruit one or two reliable volunteers to assist you. Get up very early and double check the arrangements. Be sure that each registrant submits an email address and other contact information so that you can send a follow-up “Thank You” note after the event. Keep records of how much trash is picked up (or how many trees are planted, depending on the theme), how many people attended, how many hours they participated, etc. Also, keep track of the resources and donations you receive before, during, and after the event. Organizations can use data like the number of participants and donations, etc. to help write future grants for additional volunteer-event funding.
Reflection After the event is finished, think about how much work was done. How long would it have taken you to do it all yourself? Are you more motivated to participate in other volunteer events in your community?

Unpublished Draft_3/23/2020
133
Appendix 3: Data Sheets and Things to Print This section contains printable forms like data tables, identification sheets, assessment forms, and other resources to add to your portfolio/notebook/journal.

Unpublished Draft_3/23/2020
134
Soil Erosion Data Recording Sheet
Soil Erosion Data Recording Sheet
Instructions: In each box, record the height and width of the “landscape” before and after “erosion.” Also, record any changes to the “landscape.” For the water erosion, record how much water is left in the pan after your experiment. For the wind erosion, record how far the soil traveled from the “land feature.”
Soil Type Height & Width Before
Height & Width After
Amount of Water (in oz) Before
Amount of Water (in oz) After
Distance “blown” After
Sand
Potting Soil
Sand/Potting Soil Mix
Other (list here)
Notes:

Unpublished Draft_3/23/2020
135
Soil-Filtering Data Recording Sheet
Soil-Filtering Data Recording Sheet
Instructions: In the box, record, in seconds, how long it takes each soil type to filter each liquid type, what color the liquid is after it filters, and how much liquid is filtered through each soil type.
Liquid Type Kool-Aid "Clear" Water
"Red" Water
"Blue" Water
Other (list here)
Other (list here)
Soil Type
Sand
Sand/Topsoil Mix
Other (list here)
Other (list here)
Note:

Unpublished Draft_3/23/2020
136
Water Cycle Poster

Unpublished Draft_3/23/2020
137
Indoor Water-Use Calculation Table
Indoor Water-Use Calculation Table
Activity Average Gallons (rough estimate)
Our Household Per Use (duration x gallons)
Uses per day
Showers
Regular (older) flow head (7 gal/min) 49
Low-flow head (3 gal/min) 21
Ultra-low flow (1.75 gal/min) 12.25
Baths
Full tub 38
Toilets (per flush)
Older standard size 7
Conserving models 3.5
Ultra-low flush 1.6
Brushing Teeth
With faucet running (3 min*) 9
To fill drinking cup 8 oz (0.0625 gal)
Shaving
With faucet running (7.5 min) 22
With a full sink 2
With quick faucet bursts or partial sink fill
1
Washing hands
While water runs (1 min) 3
Turn water off while sudsing 0.25
Automatic Dishwasher

Unpublished Draft_3/23/2020
138
Full cycle, older model 12
Short cycle, water-miser model 8
Washing dishes by hand
With water running (15 min) 45
With full sink, plus sprayer rinse 4.5
Cooking (measure all the water you cook with)
Varies widely by meal
Washing Machine
Full load 43
Small machine or water-miser model 34
Front load or high-efficiency model 20
Waiting for hot water to get to the tap Varies widely
Kitchen sink Varies widely
Tub or shower faucet 1 Varies widely
Tub or shower faucet 2 Varies widely
Bathroom sink 1 Varies widely
Bathroom sink 2 Varies widely
Other sink 1 (e.g., laundry room) Varies widely
Other sink 2 (e.g., laundry room) Varies widely
Leaky faucets (each at 60 drops/min) per day
8
Leaky toilets (each) per day 60
Stuck toilet flapper valve (each) per day 150
Total water use per day ** * Faucets vary; we assume 3 gal/min for an average faucet ** Multiply your household use by the uses per day to get a total volume of water used in the house each day
Outdoor Water-Use Calculation Table

Unpublished Draft_3/23/2020
139
Outdoor Water-Use Calculation Table
Can 1 ____________ in
Can 2 ____________ in
Can 3 ____________ in
Can 4 ____________ in
Can 5 ____________ in
Can 6 ____________ in
Can 7 ____________ in
Can 8 ____________ in
Total depth of water sprinkled onto the lawn
____________ total in Average = ____ in per can

Unpublished Draft_3/23/2020
140
Monitoring Plan Worksheet Why are you monitoring? Goals: Objectives: When will you monitor? Availability: Scheduled events: Frequency: _________________________ Who will monitor with you? Team members: Where will you monitor? Primary site: Latitude_____________________ Longitude____________________ Brief site description (so I can more easily find the site on Google Maps, and so future volunteers can find my site for continued monitoring after I have moved on): _____ _____________________________________________________________________ _____________________________________________________________________ Do you have good access with written permission (if private)? YES NO Is it safe for you to approach the stream with your abilities? YES NO How many sites will you monitor? If more than one, re-answer the location and access questions above. Site #2 (optional): Latitude_____________________ Longitude____________________ Brief site description (so I can more easily find the site on Google Maps, and so future volunteers can find my site for continued monitoring after I have moved on): _____ _____________________________________________________________________ _____________________________________________________________________ Do you have good access with written permission (if private)? YES NO Is it safe for you to approach the stream with your abilities? YES NO Site #3 (optional): Latitude_____________________ Longitude____________________ Brief site description (so I can more easily find the site on Google Maps, and so future volunteers can find my site for continued monitoring after I have moved on): _____ _____________________________________________________________________ _____________________________________________________________________ Do you have good access with written permission (if private)? YES NO Is it safe for you to approach the stream with your abilities? YES NO

Unpublished Draft_3/23/2020
141
Physical/Chemical Assessment Form
Date: __________ Time______________ Monitoring team name(s): ______________________________________________ Site location and description:___________________________________________ Weather (check all that apply) Sunny__ Mostly Sunny__ Mostly Cloudy__ Cloudy__ Rainy/Snowy__ Windy__ Calm __ Air Temperature ______ °F Precipitation ______ in over the last 24 hrs Water Color (check all that apply) Clear__ Brown__ Green__ Oily__ Reddish__ Blackish__ Milky__ Gray__ Water Odor (check all that apply) None_____ Sewage/Manure_____ Rotten Eggs_____ Petroleum_____ Musky_____ Water Temperature ______ °F Transparency (record whole numbers only) _______ cm pH check one – <4_____ 4_____ 5_____ 6_____ 7_____ 8_____ 9_____ >9 _____ Now, stretch a meter tape across the stream if it’s safe to enter. Stream Width Stream Flow (along your transect) ___.____ m ___ high ___ normal ___ low ___ not sure Stream Depth (in meters) Stream Velocity (in seconds)
1st Spot ___._____ ___.____
2nd Spot ___._____ ___.____
3rd Spot ___._____ ___.____
4th Spot ___._____ ___.____
5th Spot ___._____ ___.____

Unpublished Draft_3/23/2020
142
Maximum Stream Depth (along your transect) ___._______ m Other Stream Assessment Observations and Notes

Unpublished Draft_3/23/2020
143
Stream Habitat Assessment Form * Recommended frequency: Yearly *
* Photographic documentation is recommended and strongly encouraged *
Date: __________ Time______________ Monitoring team name(s): ______________________________________________ Site location and description: ___________________________________________ Was the stream dry when it was monitored? Yes _ No _ _
Stream Habitat Type (at transect – check one): Riffle _ Run Pool _ Glide
Pebble Count Survey (Wolman 1954) (at transect) Size class Dimension In
wetted Out
wetted
Silt/Clay 0–1 mm
Sand 1.1–2.5 mm
Very fine pebble 2.51–6 mm
Pebble 6.1–15 mm
Coarse pebble 15.1–31 mm
Very coarse pebble 31.1–64 mm
Small cobble 64.1–128 mm
Large cobble 128.1–256 mm
Small boulder 256.1–512 mm
Medium boulder 512.1–1024 mm
Large boulder 1024 mm and larger
TOTAL _ _
Stream Bank Description (check all that apply)
%
Left Bank (facing upstream) Right Bank (facing upstream)
_ Cut Bank – Eroding
_ Cut Bank – Vegetated
_ Sloping Bank
_ Sand/Gravel Bar
_ Rip/Rap
_ Constructed Bank (i.e., drainage ditch)
_ Other: _ _ _
_ Cut Bank – Eroding
_ Cut Bank – Vegetated
_ Sloping Bank
_ Sand/Gravel Bar
_ Rip/Rap
_ Constructed Bank (i.e., drainage ditch)
_ Other: _ _ _
Bank Condition (at transect, check one for each bank):
Left Bank (facing upstream) Right Bank (facing upstream)

Unpublished Draft_3/23/2020
144
_ Covered stable _ Covered stable
_ Covered unstable _ Covered unstable
_ Uncovered stable _ Uncovered stable
_ Uncovered unstable _ Uncovered unstable
Canopy Cover (over transect – check one): 0%–25% _ 25%–50% _ 50%–75% _ 75%–100%
Riparian Zone Width (at transect – check one for each bank)
Left Bank (facing upstream) Right Bank (facing upstream)
_ 0–5 m _ 0–5 m
_ 5–25 m _ 5–25 m
_ Over 25 m _ Over 25 m
Riparian Zone Plant Cover (at transect – estimate percentage of each)
Left Bank (facing upstream) Right Bank (facing upstream)
_ % Trees _ % Trees
_ % Shrubs/Low Trees _ % Shrubs/Low Trees
_ % Grass/Low Plants _ % Grass/Low Plants
_ % Exposed Soil _ % Exposed Soil
_ % Other (riprap, concrete, etc.) _ % Other (riprap, concrete, etc.)
100% TOTAL 100% TOTAL
(Note—begin assessing stream reach beyond stream transect)
Stream Sinuosity (along stream reach): Low Moderate High Braided _
Microhabitats (check all present in stream reach)
_ Algae Mats _ Sand _ Undercut Banks
_ Large Organic Debris _ Junk (tires, etc.) _ Riprap
_ Root Wads _ Leaf Packs _ Overhanging Vegetation
_ Fallen Trees _ Rocks _ Other (describe)
_ Silt/Muck _ Weed Beds
Adjacent Land Use (along stream reach – check all that apply)

Unpublished Draft_3/23/2020
145
_ Row Crop _ Park _ Stairs/Walkway
_ Pasture _ Playground _ Rural Residential
_ Urban _ Campground _ Conservation Lands
_ Industrial _ Boating Accesses _ Animal Feeding
_ Timber _ Nature Trails _ Operations/Lots
_ Wetland _ Fence _ Other _ _
_ Prairie _ Steep Slopes
Human-Use Activities (along stream reach – check all that apply)
Please check activities you’ve participated in or witnessed at this site.
_ Swimming _ Canoeing/Kayaking _ Hunting/Trapping
_ Tubing _ Boating _ Fishing
_ Water Skiing _ Wading _ Kids Playing
_ Wind Surfing _ Rafting _ Other _ _
Evidence of Human Use (along stream reach – check all that apply) Please check
evidence of human use you’ve witnessed at this site.
_ Streamside Roads _ ATV/ORV Tracks _ Fishing Tackle
_ Footprints or Paths _ Rope Swings _ Evidence of Play
_ Dock/Platform _ Camping Sites _ Other _ _
_ Livestock Watering _ Fire Pit/Ring
Record all other land-use practices that potentially could affect the stream. _____________________________
_____________________________________________________________________________________________
_____________________________________________________________________________________________
_____________________________________________________________________________________________
_____________________________________________________________________________________________

Unpublished Draft_3/23/2020
146
Pond/Lake Habitat Assessment Form Recommended frequency: Monthly, from ice-out to freeze-over. Date ____________ Time __________ IDAH2O monitor # ____________ Site number ______________ # of adults (including you)___________ # under 18____________________ Other volunteers involved_____________________________________________________________________ ____________________________________________________________________________ Site description ____________________________________________________________________________ ____________________________________________________________________________ Site location ____Open water _____Shore or dock Describe the lake banks above the water level (the type of slope; soil quality—marshy or sandy, muddy or dry; what sort of vegetation; other observations): ____________________________________________________________________________ ____________________________________________________________________________ Bank Condition (at edge of the lake at your monitoring site – check one from each column):
__Covered __Stable
__Uncovered __Unstable Canopy Cover (at edge of the lake at your monitoring site – check one): 0%–25%__25%–50%__ 50%–75%__ 75%–100%__
Riparian Zone Width (at edge of the lake at your monitoring site – check one):
___0–5 m ___5–25 m ___Over 25 m
Riparian Zone Plant Cover (at edge of the lake at your monitoring site – check one)
____% Trees ____% Shrubs/Low Trees ____% Grass/Low Plants ____% Exposed Soil ____% Other (riprap, concrete, etc.) 100% TOTAL
Plant Cover Below Water Line (check all present on or under the water within 25 linear ft of your site:
__ Free-floating plants __Floating, rooted plants __ Submerged plants (rooted to the bottom) __ Emerging plants (growing from the bottom and sticking up out of the water) __ Algae, free floating
__ Algae filaments free-floating in the water __ Algae mats on the bottom

Unpublished Draft_3/23/2020
147
__ Noticeable green color to the water (possibly indicating an algal or cyanobacterial bloom)
Microhabitats [check all those near your monitoring site (within 100 m/yds or so)]
_ Sand _ Undercut Banks _ Large Organic Debris _ Junk (tires, etc.) _ Riprap _ Root Wads _ Leaf Packs _ Overhanging Vegetation _ Fallen Trees _ Rocks _ Other (describe) _ Silt/Muck _ Weed Beds Adjacent Land Use [check all those occurring near your monitoring site (within 100 m/yds or so)]
_ Row Crop _ Park _ Stairs/Walkway
_ Pasture _ Playground _ Rural Residential
_ Urban _ Campground _ Conservation Lands
_ Industrial _ Boating Accesses _ Animal Feeding
_ Timber _ Nature Trails _ Operations/Lots
_ Wetland _ Fence _ Other _ _
_ Prairie _ Steep Slopes
Human-Use Activities [check all you witness near your site (within 100 m/yds or so)]
Please check activities you’ve participated in or witnessed at this site.
_ Swimming _ Canoeing/Kayaking _ Hunting/Trapping
_ Tubing _ Boating _ Fishing
_ Water Skiing _ Wading _ Kids Playing
_ Wind Surfing _ Rafting _ Other _ _
Evidence of Human Use: check all evidence of human use you’ve witnessed near your site (within 100 m/yds or so) _ Streamside Roads _ ATV/ORV Tracks _ Fishing Tackle
_ Footprints or Paths _ Rope Swings _ Evidence of Play
_ Dock/Platform _ Camping Sites _ Other _ _
_ Livestock Watering _ Fire Pit/Ring
Record all other land-use practices that potentially could affect the lake. _______________________________________________________________________________________________________________________________________________________________________________________________________________________________________________________________________________________
Other observations and notes: ____________________________________________________________________________ _____________________________________________________________________________________________ _____________________________________________________________________________________________

Unpublished Draft_3/23/2020
148
Biological (Aquatic Macroinvertebrate) Assessment Form * Recommended frequency – no more than three times/yr (Spring, Summer, and Fall) *
Date Time
Monitor team names
Was the stream dry when it was monitored? Yes No
Were benthic macroinvertebrates found? (If yes, please check those benthics found. If no, please provide any relevant comments in the “Other Assessment Observations and Notes” section at the end of this form. Why do you think these critters are not present?)
Benthic Macroinvertebrates (check all found)
High-Quality Group
(pollution-intolerant)
___ Caddis fly
___ Dobsonfly
___ Mayfly
___ Riffle Beetle
___ Snail (not pouch)
___ Stone fly
___ Water-penny Beetle
Middle-Quality Group
(somewhat pollution-tolerant)
___ Alderfly
___ Backswimmer
___ Crane Fly
___ Crawdad
___ Crawling Water Beetle
___ Damselfly
___ Dragonfly
___ Giant Water Bug
___ Limpet
___ Mussels/Clams
___ Orbsnail
___ Predaceous Diving Beetle
___ Scud
___ Sow bug
___ Water Boatman
___ Water Mite
___ Water Scorpion
___ Water Strider
___ Whirligig Beetle
Low-Quality Group
(pollution-tolerant)
___ Aquatic Worm
___ Blackfly
___ Bloodworm
___ Flatworm
___ Leech
___ Midge Fly
___ Mosquito
___ Pouch Snail
___ Rat-tailed Maggot
___ Water Scavenger Beetle
___ Other ______________
(no tolerance group assigned)
Benthic Macroinvertebrate Investigation Time (check one)
0–15 min ___________ 15–30 min ___________ 30–45 min ___________ More than 45 min ___________

Unpublished Draft_3/23/2020
149
Collection Nets (How many nets are you using to collect critters?)
0____1____2____3____4____5____6____More than 6_____
Stream Reach Length (How far along the stream did you search?)
______ 0–25 m ______ 25–50 m ______ 50–75 m ______ 75–100 m ______ 100+ m
Microhabitats (check all present in stream reach; check if sampled)
Algae Mats: Present __ Sampled __
Leaf Packs: Present __ Sampled __
Logjams: Present __ Sampled __
Rocks: Present __ Sampled __
Root Wads: Present __ Sampled __
Weed Beds: Present __ Sampled__
Fallen Trees: Present __ Sampled __
Undercut Banks: Present __ Sampled __
Silt/Muck: Present __ Sampled __
Riprap: Present __ Sampled __
Sand: Present __ Sampled __
Overhanging Vegetation: Present __ Sampled __
Junk (tires, garbage, etc.): Present __ Sampled __
Other (describe): Present __ Sampled __
___________________________________
____________________________________
Stream Habitat Type (check all types sampled in stream reach)
Riffle _____ Run _____ Glide _____ Pool _____
Aquatic Plant Cover of Streambed (at transect – check one)
0%–25% _____ 25%–50% _____ 50%–75% _____ 75%–100% _____

Unpublished Draft_3/23/2020
150
Bank Conditions * select 1
Algae Cover of Stream Streambed (at transect – check one)
0%–25% _____ 25%–50% _____ 50%–75% _____ 75%–100% _____
Other Assessment Observations and Notes:
Crayfish Study Assessment Form
Record all required information and any optional data as able. There are two options for uploading data: 1) enter each data sheet, one at a time, via a computer with internet service; or 2) enter data in the Excel Data Sheet for the Crayfish Study and submit it to The River Mile Network’s Crayfish Study (https://therivermile.org/network-projects/data-collection-submission/). If you choose the latter option, you’ll need to scroll down (under “Excel Data Sheets”) to find the Data Sheet (“Crayfish Observation”) and submission link.
*Required Information
Contact ID * Site ID *
Grade Level *(choose multiple)
Date * Time * mm/dd/yyyy hh:mm
Bank Substrate * select 1
_ __ Mud (silt/clay) Muddy __ Sand (particle diameter 0.06–2 mm) Sandy __ Granule (particle diameter 2–4 mm) Rocky __ Pebble (particle diameter 4–6.4 mm) Vegetated __ Cobble (particle diameter 6.4–25.6 cm)
__ Boulder (particle diameter >25.6 cm) __ Sheer Cliff
Water Temperature* ˚C Specific Conductivity (in μS)
pH Dissolved Oxygen (in mg/L)
Air Temperature (in ˚C) *
Wind Direction Wind Speed (in mph) North South North-Northeast South-Southwest Northeast Southwest
1st
2nd
3rd
6th
7th
8th
11th
12th
College 4th 9th Other 5th 10th

Unpublished Draft_3/23/2020
151
East-Northeast West-Southwest East West East-Southeast West-Northwest Southeast Northwest South-Southeast North-Northwest
Precipitation on Set Date (circle one) Yes No Describe:
Precipitation on Pull Date (circle one) Yes No Describe:
Collection Information
Collection Type * Crayfish Trap Net Caught By Hand Found (dead) Unknown
Collection Depth (m)
Collection Location * Latitude: Longitude:
Altitude (m):
Crayfish Information
Crayfish Species *
Northern Crayfish (Orconectes virilis) Rusty Crayfish (Orconectes rusticus) Signal Crayfish (Pacifastacus leniusculus) Red Swamp Crayfish (Procambarus clarkii) Unknown
Carapace Length (cm)
Total Length (cm)
Weight
Crayfish Photo? Circle one: Yes No Document Number/ID:
Sex

Unpublished Draft_3/23/2020
152
Notes:
Aquatic Macroinvertebrate Identification Key

Unpublished Draft_3/23/2020
153

Unpublished Draft_3/23/2020
154

Unpublished Draft_3/23/2020
155