
Draft v1 - Affinity Water - Stakeholder · Affinity Water Business Plan 2015 – 2020: Risk &...
111
Transcript of Draft v1 - Affinity Water - Stakeholder · Affinity Water Business Plan 2015 – 2020: Risk &...

Draft v1.7 07/03/14
To be updated – to be called ‘Submission’

Affinity Water Business Plan 2015 – 2020: Risk & Reward Submission 2

Affinity Water Business Plan 2015 – 2020: Risk & Reward Submission 3
Table of Contents
Board Assurance Statement .................................................................................................. 6
1 Executive Summary ...................................................................................................... 10
2 Wholesale WACC and Retail Margins ............................................................................ 15
3 Outcome Delivery Incentives (ODIs) .............................................................................. 18
4 Uncertainty Mechanisms .............................................................................................. 96
5 Outperformance (RoRE)................................................................................................ 99
6 Affordability and Financeability ...................................................................................103
Appendices ........................................................................................................................109
Please note, bill reduction figures given in this document are indicative and subject to confirmation as Ofwat makes its determination.

Affinity Water Business Plan 2015 – 2020: Risk & Reward Submission 4

Affinity Water Business Plan 2015 – 2020: Risk & Reward Submission 5
Our risk and reward submission at a glance
A. Affinity Water confirms that it accepts Ofwat’s guidance on the industry wholesale weighted average cost of capital (WACC) of 3.7%.
B. Affinity Water confirms that it accepts Ofwat’s guidance on retail margins for household and non-household customers of 1% and 2.5% respectively.
C. Affinity Water confirms that it accepts Ofwat’s guidance on Outcome Delivery Incentives (ODIs).
D. Affinity Water confirms that it accepts Ofwat’s guidance on uncertainty mechanisms and will continue to comply with any new statutory environmental and legal obligations.
E. Affinity Water confirms that it accepts Ofwat’s guidance on the outperformance/underperformance range for Return on Regulated Equity (RoRE).
F. Affinity Water is confident that its resulting bill profile will remain affordable for customers in AMP6 and beyond and has tested the acceptability of its bill profile with its customers recently.
G. Affinity Water confirms that its Business Plan remains financeable under both a notional and actual gearing structure.
H. Affinity Water confirms that it has complied with all the data table requirements for pre-qualified companies.
I. Affinity Water confirms that it will meet, resolve or comply with each of Ofwat’s six Action Points, set out in its letter of 10 March 2014, by 11 April 2014.
J. The Board of Affinity Water confirms that this submission has been subject to robust Board assurance and oversight.

Affinity Water Business Plan 2015 – 2020: Risk & Reward Submission 6
Board Assurance Statement
Chairman Dr. Philip Nolan
Independent non-executive director Dr. Jeffrey Herbert
Independent non-executive director Baroness Peta Buscombe
Independent non-executive director Patrick Bourke
Executive director Richard Bienfait – Chief Executive Officer
Executive director Duncan Bates – Chief Financial Officer
Non-executive director Antonio Botija
Non-executive director Kenton Bradbury
Non-executive director Olivier Bret
Non-executive director Yacine Saidji
Non-executive director Jim Wilmott
Affinity Water Business Plan 2015 – 2020: Risk & Reward Submission 7
Board Assurance Statement
The Board of Affinity Water is delighted that Ofwat has pre-qualified our Business Plan for enhanced status. With this submission we confirm that the Board accepts Ofwat’s risk and reward guidance published on 27 January 2014.
The whole Board has discussed, assured, and owns the revisions to our Business Plan set out in this submission that are necessary to meet Ofwat’s guidance.
We have been guided by the best interests of our customers and by ensuring our business can remain financeable to implement the investment needed over the longer-term to continue to supply our customers with safe, reliable, and affordable drinking water.
We have, once again, taken into account the principles Ofwat set in its methodology for ‘high quality’ Business Plans. We are assured that the revisions set out in this submission fully meet these principles.
We firmly consider that our Business Plan is an ambitious and challenging plan - one that will deliver real benefits for our customers and the environment and build on the significant improvements in our operational performance during AMP5. It is an integrated and balanced plan – one that is based on a demand management strategy supported by our customers, to respond effectively and responsibly to our longer-term supply/demand challenge and leave more water in the environment.
- We are committed to very challenging cost reduction targets over the next 5 years, which in aggregate total £106m or 10% of our base operating and capital maintenance expenditure, along with industry leading efficiencies on enhancement expenditure, for example in terms of our meter installation unit rates.
- We are committed to reducing our leakage by 14% over the next 5 years - the largest percentage reduction target of any water company in AMP6. It is critical to our “save water” strategy for us to be able to convince our customers that we are doing all we can to use water more efficiently. We are incentivised to meet this stretching target: if we don’t, we will reduce bills to compensate our customers. Conversely, we will be able to earn positive rewards if we can deliver more and/or sooner than our stretching performance commitments.
- We are committed to implementing a major and ambitious water efficiency programme, including universal metering, to reduce consumption by 14%. Our programme is built on thorough engagement and responsiveness to our customers’ needs and the communities we serve.
- We are committed to ensuring Affinity Water is accountable to the communities it serves and so we will be reporting our operational performance at a community level.
We are confident we can deliver our Business Plan and ensure that customer bills will remain affordable in both AMP6 and beyond. Our average customer bill will now reduce on average by 1.4% per year in real terms in the period 2015-2020, this percentage reflecting our 2014/15 price limit abatement. Our average annual real reduction in customer bills is now twice the 0.7% decrease in our original Business Plan, which our research found was highly acceptable to our customers. We have one of the lowest average water bills in the country and it should continue to fall as a share of our customers’ real disposable incomes over the next five years.

Affinity Water Business Plan 2015 – 2020: Risk & Reward Submission 8
We recognise, however, that some household budgets are under strain, which is why we voluntarily chose not to implement in 2014/15 our full tariff increase, and why we have launched from April 2014 our new social tariff – ‘LI£T’.
By reviewing our decisions on the Regulatory Capital Value (RCV) run off rate and Pay As You Go (PAYG) ratio, we have also assessed our likely bill profile beyond AMP6 to ensure that we are not storing up affordability pressures for future generations of our customers.
We have reconsidered the balance between our pain/gain mechanisms. For this AMP6 period only, we have volunteered to share with our customers 100% of the value of the company specific adjustment that reflects our higher equity risk profile. We appreciate that Ofwat has not taken a view on the validity of our company specific adjustment, and our decision does not in any way fetter its discretion at future price reviews, when all the evidence will need to considered at that time on its merits.
We have withdrawn our proposal in our Business Plan for a company specific change protocol in recognition of Ofwat’s approach on a single industry weighted average cost of capital (WACC). This gives customers more certainty on bills, but exposes our business to more risk compared to the current settlement in AMP5 if there are costs associated with changes in legislation. Nevertheless, we recognise that that we will continue to comply with any new statutory environmental obligations and other new legal obligations.
We have reviewed our Outcome Delivery Incentives (ODIs) and have made a number of changes including increasing the number of our performance commitments that carry financial penalties if we underperform. This demonstrates our strong desire to protect customers in the event that we fall short of our performance commitments. We have also reviewed the potential rewards to ensure they align to what our customers’ value and will only be earned for performance that is industry leading or transformational for our business. These incentives have been established to be fully consistent with Ofwat’s July 2013 methodology.
The Board has sought a very high degree of external assurance on this submission. We have asked Frontier Economics to assure us that there is a clear evidence based case in terms of net customer benefit to support an adjustment to the industry WACC. We have asked Frontier Economics to assure us that our revised ODI package fully meets Ofwat’s guidance. We asked our independent Customer Challenge Group (CCG) to review our changes to our Business Plan and report to Ofwat. We have tested the acceptability of our revisions with our online customer panel. Finally, we have asked our auditors, PricewaterhouseCoopers (PwC), to provide assurance on our data tables.
We commit to meeting, resolving or complying with each of the six Action Points Ofwat identified for Affinity Water in its letter to us of 10 March 2014. We appreciate that Ofwat’s Action Points are necessary to provide our customers and Ofwat with assurance that customers’ interests are fully protected both in the next AMP and over the longer-term. We share this objective: it is fully in line with our vision to be the leading community-focused water company.
We have given assurance that we are financeable both under our actual gearing and Ofwat’s notional gearing. We fully accept that risks arising from our financing structure rest with our shareholders not our customers. We fully support Ofwat’s guidelines on corporate governance and will publish our governance code by the end of March 2014.

Affinity Water Business Plan 2015 – 2020: Risk & Reward Submission 9
Finally, the Board is excited by its Business Plan and is keen to get on and implement it so we can start to realise its benefits for our customers, our communities and the environment.
Dr. Philip Nolan
Chairman - For and on behalf of each Director

Affinity Water Business Plan 2015 – 2020: Risk & Reward Submission 10
1 Executive Summary

Affinity Water Business Plan 2015 – 2020: Risk & Reward Submission 11
1.1 Affinity Water accepts Ofwat’s risk and reward guidance
A. Affinity Water confirms that it accepts Ofwat’s guidance on the industry wholesale weighted average cost of capital (WACC) of 3.7%.
B. Affinity Water confirms that it accepts Ofwat’s guidance on retail margins for household and non-household customers of 1% and 2.5% respectively.
C. Affinity Water confirms that it accepts Ofwat’s guidance on Outcome Delivery Incentives (ODIs).
D. Affinity Water confirms that it accepts Ofwat’s guidance on uncertainty mechanisms and will continue to comply with any new statutory environmental and legal obligations.
E. Affinity Water confirms that it accepts Ofwat’s guidance on the outperformance/ underperformance range for Return on Regulated Equity (RoRE).
F. Affinity Water is confident that its resulting bill profile will remain affordable for customers in AMP6 and beyond and has tested the acceptability of its bill profile with its customers recently.
G. Affinity Water confirms that its Business Plan remains financeable under both a notional and actual gearing structure.
H. Affinity Water confirms that it has complied with all the data table requirements for pre-qualified companies.
I. Affinity Water confirms that it will meet, resolve or comply with each of Ofwat’s six Action Points, set out in its letter of 10 March 2014, by 11 April 2014.
J. The Board of Affinity Water confirms that this submission has been subject to robust Board assurance and oversight.
1.2 Assumptions
We have made the following assumptions in this risk and reward submission.
- Ofwat will confirm on 4 April that Affinity Water’s Business Plan is awarded enhanced status.
- We expect that Ofwat’s ‘do no harm’ principle will apply to any upward revisions on its view of the industry WACC. It will also apply to any further industry uncertainty mechanisms added by Ofwat to the current standard suite of mechanisms.

Affinity Water Business Plan 2015 – 2020: Risk & Reward Submission 12
- We understand that subject to meeting Ofwat’s six action points in its letter of 10 March and Ofwat confirming enhanced status on 4 April, Affinity Water will:
o have passed Ofwat’s risk-based review tests for outcomes, costs, affordability, risk/reward, and Board assurance; and
o receive a draft determination including totex menus by 30 April 2014 where Affinity Water will be able to identify the 5% cost sharing benefit from its enhanced Business Plan, which Ofwat has initially calculated could be worth £3.3million over the 2015-2020 period if we perform in line with our Business Plan.
By having an enhanced Business Plan we look forward to the benefit of being able to get on and implement it and our Water Resource Management Plan (WRMP) to realise benefits for our customers, communities, and the environment as soon as possible.
1.3 Ofwat Action Points
We will meet each of the six Action Points set out in Ofwat’s pre-qualification letter of 10 March 2014 in line with the timetable shown below. We agreed with Ofwat on 14 March 2014 our timetable for meeting the six Action Points.
Deliverable Comments Location in Document
Action Point 1: Evidence that Performance Commitments represent value for money
Included within our data tables and data table commentary (W2, W2a).
Appendix 4
Action Point 2: Performance Commitments and ODI measurement and assurance
This document contains a summary of our response. A full response was submitted to Ofwat on 20 March.
Section 3
Action Point 3: Performance Commitments - serviceability
This document contains a summary of our response. A full response was submitted to Ofwat on 20 March.
Section 3
Action Point 4: Cost allocation
Affinity Water commits by 11 April to meet each of the actions set out in Ofwat’s supplementary letter of 12 March. Specifically:
- to comply with Ofwat’s cost allocation guidance; and
- to amend its allocation of costs between retail and wholesale, and between household and non-household such that our cost allocation complies with existing cost allocation rules set out in the Business Planning guidance. These allocations will be externally assured.
N/A
Action Point 5: Included within our data tables and data Appendix 4
Affinity Water Business Plan 2015 – 2020: Risk & Reward Submission 13
Legacy adjustments table commentary.
Action Point 6: Engagement on the Thames Tideway Tunnel
A full response was submitted to Ofwat on 20th March.
N/A
Table 1-A: Timetable for responding to Ofwat’s six action points
1.4 Pre-qualification data tables
We have included in Appendix 4 the data tables and associated commentaries required by the Ofwat guidance. We asked our auditors, PwC, to provide our Board with assurance on their accuracy. We will send PwC’s formal assurance report to Ofwat under separate cover, which allows time for our Board to review and assure it first. The number and complexity of modelling changes has meant that this has not been possible to achieve for inclusion in this document submission.
1.5 Transparency
In the interests of transparency, we support the publication of all information contained within Appendices 4, 5 and 6 of Ofwat’s letter to Affinity Water of 10 March 2014.
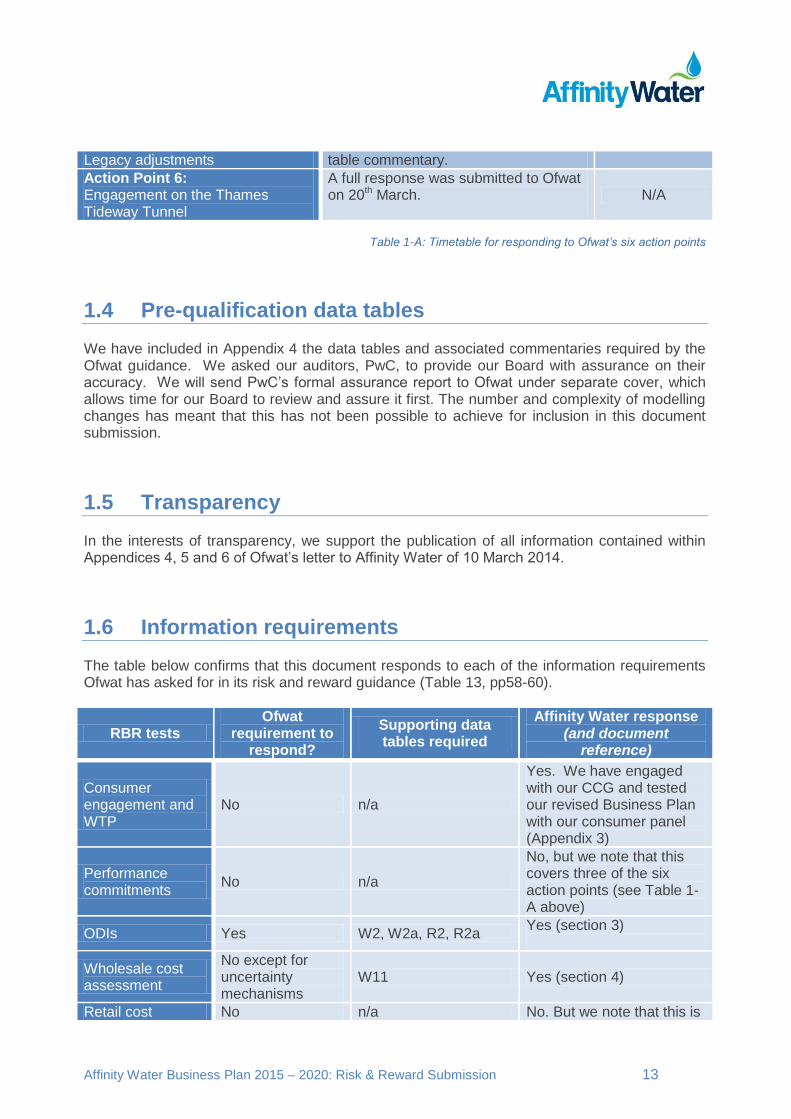
1.6 Information requirements
The table below confirms that this document responds to each of the information requirements Ofwat has asked for in its risk and reward guidance (Table 13, pp58-60).
RBR tests Ofwat
requirement to respond?
Supporting data tables required
Affinity Water response (and document
reference)
Consumer engagement and WTP
No n/a
Yes. We have engaged with our CCG and tested our revised Business Plan with our consumer panel (Appendix 3)
Performance commitments
No n/a
No, but we note that this covers three of the six action points (see Table 1-A above)
ODIs Yes W2, W2a, R2, R2a Yes (section 3)
Wholesale cost assessment
No except for uncertainty mechanisms
W11 Yes (section 4)
Retail cost No n/a No. But we note that this is

Affinity Water Business Plan 2015 – 2020: Risk & Reward Submission 14
allocation one of the six action points for a response by 11 April
ACTS adjustments No n/a No
Default tariffs No n/a No
Risk analysis Yes A8, A20 (scenario I only)
Yes (section 5)
Level and allocation of risk
Yes A8, A20 (scenario I only)
Yes (section 5)
Rewards and return
Yes W18 Yes (section 2)
Retail net margins Yes R5 Yes (section 2)
Financeability Yes
A1, A2, A3, A10, A11, A12, A13, A14, A15, A19,A22, A23, W9, W10, W18, W19
Yes (section 6)
Affordability Yes A1 Yes (section 6)
Table 1-B: Summary of Ofwat information requirements and Affinity Water response

Affinity Water Business Plan 2015 – 2020: Risk & Reward Submission 15
2 Wholesale WACC and Retail Margins

Affinity Water Business Plan 2015 – 2020: Risk & Reward Submission 16
2.1 Wholesale WACC
Affinity Water accepts Ofwat’s guidance on the industry wholesale WACC of 3.7%.
We confirm that a wholesale WACC of 3.7% has been used as the basis for our financial modelling. Affinity Water notes that it will benefit as an enhanced company from Ofwat’s ‘do no harm’ principle if there are upward changes to Ofwat’s view on the industry WACC and we appreciate this does not include any adjustments for a specific company premium or operating leverage.
We commissioned expert adviser Frontier Economics to assess the customer costs and benefits of remunerating our distinct equity risk profile and to quantify these costs and benefits where possible. A final report is attached in Appendix 1.
The final report makes several important evidence-based findings.
- There is strong, and recent, regulatory precedent for remunerating a high level of operating leverage.
- There is clear evidence that Affinity Water has a high level of operating leverage.
- There is recent Competition Commission precedent for how operating leverage should be remunerated through the WACC, which would imply a WACC adjustment for Affinity Water between 30bps and 40bps.
- There is clear and quantifiable evidence that remunerating such a premium would be cost beneficial to our customers.
Notwithstanding the compelling evidential justification and regulatory precedent for such an equity premium to the industry WACC, the Board of Affinity Water has decided not to propose to Ofwat a company specific adjustment for PR14. We have decided to share 100% of its value with our customers for the period 2015-2020. This takes into account the following factors:
- We are very keen to proceed with implementing our Business Plan to deliver benefits for our customers and the environment in pursuit of our vision to be the UK’s leading community-focused water company.
Key points from Ofwat’s guidance
- Industry wholesale WACC of 3.7% (p4). “Companies should confirm they adopt our
guidance on an appropriate industry-wide wholesale WACC. They should revise their
risk and reward proposals in line with this guidance. Any small companies that are
seeking adjustments to this guidance must provide evidence that this is cost beneficial
to customers” (p59).
- Retail net margins of 1% for domestic customers and 2.5% for non-household
customers (p4). “Companies should confirm they adopt our guidance on appropriate
household and non-household net margins” (p60).

Affinity Water Business Plan 2015 – 2020: Risk & Reward Submission 17
- Ofwat’s decision on retail margins gives Affinity Water a financial advantage compared to the retail margins we proposed in our original Business Plan and when compared to companies with lower operating leverage (revenue/RCV).
- The financial and non-financial benefits that will accrue to Affinity Water having an enhanced Business Plan.
It is essential that Affinity Water does not suffer a relative financial or commercial disadvantage to other companies in Ofwat’s standard process as a result of accepting enhanced status. This would undermine the incentives that Ofwat is seeking to introduce for companies developing high quality Business Plans and seeking enhanced status.
Our position on the company specific adjustment for PR14 in no way sets a precedent for our decisions for future price reviews. Equally, we acknowledge that Ofwat has not taken a view on our company specific adjustment for PR14. Our decision at this price review does not in any way fetter the discretion of Ofwat in future reviews, when we would expect the evidence to be considered on its merits.
2.2 Retail margins
Affinity Water confirms that it will adopt Ofwat’s guidance on retail margins for household and non-household customers of 1% and 2.5% respectively.
We welcome Ofwat’s acknowledgement that given Affinity Water’s relatively low RCV compared to other companies, achieving an identical retail margin will be worth more ‘WACC equivalent basis points’ for our company than for a larger WaSC with a higher RCV. We estimate that for Affinity Water the retail margins will be worth 35bps.
We fully recognise that part of this return relating to the retail margins in the non-household market is at risk from 2017 depending on our success in competing in the open market.
We will continue to work closely with Ofwat and the Open Water programme to ensure a successful launch of retail market reform in 2017.

Affinity Water Business Plan 2015 – 2020: Risk & Reward Submission 18
3 Outcome Delivery Incentives (ODIs)

Affinity Water Business Plan 2015 – 2020: Risk & Reward Submission 19
3.1 Introduction
Affinity Water confirms that it accepts Ofwat’s guidance on ODIs.
This section sets out our revised Outcome Delivery Incentive (ODI) package. It explains the approach we have taken to ensure that we are incentivised to deliver each of our AMP6 Performance Commitments (PCs) to further the interests of our present customers, future customers and the environment. We believe our ODI package provides robust and meaningful protection for our customers in that we will suffer significant financial penalties if we fail to achieve our performance commitments whilst we will not earn any financial reward unless we achieve performance results exceeding historic record best performance.
In section 3.2 we explain how our ODI package is coherent with our business strategy and our vision to be the leading community-focused water company. This includes how we will deliver our PCs and the role of our Board in ensuring this happens. Section 3.3 explains our approach to measurement, assurance and accountability. This is followed by sections explaining how our customers are protected should we underperform (section 3.4), our approach to reducing potential bill volatility in AMP6 (section 3.5) and why our ODI package is an appropriate balance of risk and reward for our customers (section 3.6).
Sections 3.7 to 3.10 explain in detail our approach to each PC for our four customer Outcomes, including:
- the level of PC and its measurement;
- the most appropriate ODI incentive type to protect customers;
- the calculation and calibration of financial incentive rates and ODI parameters; and
Key points from Ofwat’s guidance
- “Companies should resubmit ODIs with meaningful rewards and penalties” (p4).
- The RoRE impact from ODIs (ex SIM) should be between +/- 1% to 2% (p51).
- “The package of incentives should be consistent with evidence on affordability and
willingness to pay” (p49).
- “Companies should revise their ODIs as required. They should submit sufficient and
convincing evidence that their ODIs appropriately incentivise performance” (p58, nb
bold from original).
- “Companies should only revise or re-submit information on performance
commitments where this is necessary to support their revised ODIs” (p58, nb bold
from original).
- “It is for the Boards of water companies to determine at this stage what additional
engagement with customers and involvement of CCGs, if any, is needed to shape
their overall package of risk and reward to be consistent with these guidelines” (p38).

Affinity Water Business Plan 2015 – 2020: Risk & Reward Submission 20
- the effective rewards and penalties that could apply based on our actual performance over the period 2015-2020 and the impact in terms of our Return on Regulated Equity (RoRE).
Affinity Water Business Plan 2015 – 2020: Risk & Reward Submission 21
3.2 Overview of our customer Outcomes and Performance Commitments
3.2.1 Summary
We welcome Ofwat’s approach of linking rewards and penalties to performance. We note that the ODI package in our original Business Plan was one of the most stretching proposed by any company.
We have developed our ODIs to be consistent with Ofwat’s July 2013 methodology (including Appendix 1 on the calibration of incentives). We have reviewed our ODIs in light of Ofwat’s January 2014 Risk and Reward guidance, further discussion with our CCG, and further reflection by our Board on the appropriate balance of risk between our shareholders and customers.
We have not changed our underlying PCs for AMP6 from those presented in our Business Plan. These PCs were developed following detailed and rigorous customer consultation, including with our CCG. They represent a very stretching and ambitious set of PCs for AMP6 for example:
- Our commitment to reduce leakage by 14% in AMP6 is the largest percentage reduction proposed by any company.
- Our agreement with the Environment Agency (EA) to reduce our abstractions by 5% in AMP6 is the largest percentage reduction proposed by any company.
Our PCs must be viewed as part of a balanced and integrated Business Plan, optimised to deliver our demand management strategy in AMP6 to meet our longer-term supply/demand challenge, whilst leaving more water in the environment – and delivering challenging totex efficiencies to ensure value for money.
In revising our ODI package we have paid particular attention to achieving the following objectives.
- We have ensured that our customers are protected from us not delivering on our PCs. Where possible we have applied financial incentives to reinforce customer protection should we fail to deliver on our PCs; excluding the Service Incentive Mechanism (SIM) and the Abstraction Incentive Mechanism (AIM) PCs, where the incentives will be set by Ofwat. 10 of our 11 PCs have financial penalties and/or customer compensation arrangements.
- We have ensured an appropriate balance of risk between our shareholders and our customers. We have amended the balance of the ODI package in customers’ favour and we are now accepting more shareholder risk if we underperform.
- We have ensured that our customers have confidence in our measurement, audit and reporting of our performance. We will use existing industry metrics where possible that will enable easy comparison and independent assurance. We are committed to transparency and ensuring that our customers can hold us to account in a transparent way, including at the local level.

Affinity Water Business Plan 2015 – 2020: Risk & Reward Submission 22
- We have ensured that we take into proper account the assumptions we have made on other regulatory incentives, including totex efficiency sharing.1 We have also ensured that our ODI package supports the wider statutory framework within which we operate, for example by including financial incentives on our environmental and water quality obligations.
- We have ensured our ODI package has simplicity, clarity and transparency so that it is easily understood, well targeted, and can be fully justified based on Ofwat’s July 2013 methodology.
A summary of our revised ODI package is set out in the table below. This shows the value, in terms of % of annual revenue, of the effective financial incentives that apply in 80% of probable outcomes (i.e. between the ‘P10’ and ‘P90’ outcomes). We have excluded both the AIM and SIM from this submission as the relevant incentive parameters will be set by Ofwat.
Excluding SIM, we are proposing to put 3.2% of our annual revenue at stake for penalties for underperformance. This compares to 0.8% of our annual revenue for potential incentive rewards. The size of the penalties for underperformance will create high-powered incentives to ensure we do not fall short of our PCs, especially when the size of the penalties is viewed in the context of our much higher operating leverage than the industry average (measured by revenue/RCV).
1 In revising our ODIs we have maintained the assumption of a totex menu-sharing rate of 50% to ensure consistency with our Business Plan submission.

Affinity Water Business Plan 2015 – 2020: Risk & Reward Submission 23
Customer Outcome
Performance Commitment
Type of ODI Potential upside (% RoRE) p.a.
Potential downside (% RoRE) p.a.
1. Making sure our customers have enough water, whilst leaving more water in the environment
Leakage Reward and penalty
+ 0.48% -1.37%
Average water use Penalty only None - 0.13%
Water available for use Penalty only None - 0.13%
Abstraction incentive mechanism
Non financial incentive
- -
Sustainable abstraction reductions
Reward and penalty
+ 0.09% - 0.04%
2. Supplying high quality water you can trust
Compliance with water quality standards
Penalty only None - 0.19%
Customer contacts for discoloration
Penalty only None - 0.07%
3. Minimising disruption to you and your community
Unplanned interruptions to supply over 12 hours
Reward and penalty
+ 0.01% -0.39%
Number of burst mains Penalty only + 0.00% -0.00%
Affected customers not notified of planned interruptions
Compensation payments
None Enhanced GSS
Planned work taking longer to complete than notified
Compensation payments
None Enhanced GSS
4. Providing a value for money service
Service incentive mechanism
Reward and penalty
+ 0.50% -1.00%
Value for money survey No financial incentive
- -
Total ODI package (excluding SIM) + 0.58% -2.32%
Table 3-A: Summary of revised ODI package
We recognise that some customers may be concerned about whether we have an incentive to underdeliver in order to gain financially, especially if the costs associated with delivering our PCs are included within our totex projections (and in a regulatory framework for AMP6 where the previous ‘short-falling’ arrangements are withdrawn).
This is why we have proposed that all but one of our 11 company specific PCs have either a financial penalty or customer compensation:
- 8 PCs have financial penalty ODIs; and
- 2 PCs have Enhanced GSS payments for compensating customers directly affected by our service failure.

Affinity Water Business Plan 2015 – 2020: Risk & Reward Submission 24
Conversely we consider that we should establish reward ODIs on three PCs where this is supported by customer research on Willingness to Pay (WTP) and where it can encourage us to stretch beyond the challenging PCs we have set.
A summary of our PCs and their associated ODI parameters is set out in the table below.
Figure 3-1: Summary of ODI revisions
Note to table: All AMP6 PCs for ‘Making sure our customers have enough water, whilst leaving more water in the environment’ are expressed in the table simply as the target that we have set for 2019/20. All other PCs are expressed in per year terms.
3.2.2 Coherence of our PCs and ODIs with our Business Plan strategy
We have developed a balanced and integrated package of PCs and ODIs to:
- address the challenges we face for AMP6 and beyond;
- meet the expectations of our customers today and the needs of future generations of customers; and
- incentivise us to innovate so that we can continue to provide high standards of service whilst maintaining affordable bills for customers.

Affinity Water Business Plan 2015 – 2020: Risk & Reward Submission 25
We set out below how our package of PCs and ODIs align to the challenges we face to provide robust protection for customers today and future generations.
Customer Outcome 1: Making sure our customers have enough water, whilst leaving more water in the environment
We have agreed very challenging sustainability reductions with the EA
A primary challenge for our business is adapting to the reduction in abstraction from a number of our groundwater sources, which have been agreed with the EA in order to improve flows and habitats in local chalk streams. We have agreed sustainability reductions of 42Ml/d with the EA in our Central region in AMP6 and a further 28 Ml/d in AMP7. These changes are supported by a number of local and national environmental groups.
Taken together these sustainability reductions are equivalent to nearly 8% of our current resource base. The reduction in AMP6 is the largest for any company (in percentage terms).
This is why we have included a PC and ODI for sustainable abstraction reductions.
We will replace these reductions in our water supply with improvements in saving water through leakage reduction and metering
Our Business Plan is substantially different from our PR09 Business Plan as we no longer have a surplus of water resources. This means we have to replace lost resources by reducing leakage and encouraging our customers to be part of the solution by working with them to reduce their consumption through metering and water efficiency. This builds upon the successful universal metering programme we have undertaken since 2006 in our Dour community (which comprises our Southeast operating region). We also need to preserve the capacity and serviceability of our current assets to ensure the resilience of our supply is maintained during this challenge. Customers have placed reducing leakage as their highest priority so we have taken account of that in establishing our PCs and ODIs.
To incentivise us to meet the challenge of our demand management strategy we have included PCs and ODIs for leakage, average water use and water available for use (WAFU).
We will improve supply through sharing and trading
We have worked closely with other water companies in the southeast of England to explore the potential for sharing regional water resources in the interests of resilience, sustainability, cost and energy efficiency. This work has been valuable and we have used the outcomes of collective modelling work to inform our Business Plan. We have worked closely with neighbouring companies to ensure our respective Plans agree with regard to water trading. We have imported and exported bulk supplies of water for many years and this inter-dependency will continue.
We welcome the introduction of the Abstraction Incentive Mechanism (AIM) to incentivise the most appropriate use of water resources and will work with Ofwat to develop this innovative mechanism. We see a strong synergy between the objectives of AIM and our own PCs for AMP6 to improve local river environments through reductions in our abstraction.

Affinity Water Business Plan 2015 – 2020: Risk & Reward Submission 26
Customer Outcome 2: Supplying high quality water you can trust
Customers’ expectations are clear
Through our research, our customers expressed a strong desire that we maintain our performance in delivering consistently high quality wholesome drinking water.
Our strategy matches customer expectations
We will meet these expectations by investing in:
- water quality improvements for lead and pesticides;
- National Environment Programme (NEP) actions and investigations;
- biodiversity improvements; and
- resilience, including security measures under SEMD and new compartments for two reservoirs.
We will maintain our already high standards of water quality and meet future regulations by constructing treatment barriers for pesticides and we will start a targeted lead pipe replacement programme. We will maintain and improve the quality of our surface and groundwater sources by enhancing our catchment management programme. Through our NEP and biodiversity programmes we will continue to monitor the health of our rivers and natural water environment and investigate the impact of proposed sustainability reductions.
Our treatment works now operate at a high level of resilience and we supply very high quality water, demonstrated by our high level of compliance. We have introduced more targeted risk-based maintenance using new processes and in-house developed software that will allow us to maintain our assets more efficiently.
To demonstrate our commitment to the effective stewardship of our assets, we have included PCs and ODIs for compliance with water quality standards and customer contacts for discolouration.
Customer Outcome 3: Minimising disruption to you and your community
Customers’ expectations are clear
Few customers experience disruption. Those that do are concerned when prolonged disruptions occur and they are keen to be kept informed of progress of work. Customers want to see no deterioration in overall service but show less support for reducing the number of service interruptions.
Our strategy matches customer expectations
Our customers have told us that longer disruption periods affect them most. The longer disruptions tend to occur as a result of a trunk mains burst. We will prioritise investment on reducing the risk of failure of our large pipes. Maintaining serviceability of these assets requires planned maintenance and replacement. We will increase the renewal of trunk mains and continue to implement ‘hot spot’ mitigation by replacing critical sections of main where higher numbers of customers could be affected by a burst. We plan to renew 82km of trunk mains and 482km of distribution mains, with significant investment in our Stort, Wey and Dour communities.

Affinity Water Business Plan 2015 – 2020: Risk & Reward Submission 27
Bursts occur on our network because of ageing infrastructure, ground movement and on occasion due to our operations. We have continued to develop our burst model techniques so we can accurately forecast the number of bursts. During AMP5 we have seen the variability in these forecasts stabilise. The amount we are investing in our network during 2010-2015 has enabled us to reduce significantly the amount of mains replacement required in 2015-2020 without compromising our aim of keeping our network performance stable. Linked to this is an element of preventative maintenance on the network, better control through network telemetry and improved network management (our ‘calmer network’ project).
To ensure we remain incentivised to protect customers we have included PCs and ODIs for the number of burst mains and unplanned interruptions to supply over 12 hours.
Customers may also experience disruption when there is a planned event that interrupts the continuity of our service.
We will provide information to customers about planned works using their preferred means of communication in sufficient time to allow them to make alternative arrangements. Where there is a service interruption, we will keep our customers informed of our timescales for restoring service through direct communication and use of digital media and our website.
To ensure customers are protected we have included PCs and ODIs for affected customers not notified of planned interruptions and planned work taking longer to complete than notified. The ODI takes the form of our enhanced compensation payments under the Guaranteed Standards of Service Regulations. This ensures those customers directly affected by our underperformance in these two areas are compensated.
Customer Outcome 4: Providing a value for money service
We have a comprehensive approach to providing value for money and affordable bills.
- We are committing to very challenging efficiency savings of £106m on our base operating and capital maintenance costs, the equivalent of a 10% saving. These costs savings will allow us to invest more in enhancement schemes whilst allowing our average bill to reduce by 6.5% in real terms over AMP6.
- We are offering innovative tariffs, flexible payment arrangements and allowing our customers time to transfer to measured bills following installation of meters.
- We will offer continued support for vulnerable customers by maintaining our WaterSure tariff, which caps charges at the level of the average metered bill. We are introducing a new social tariff from 1 April 2014 to target support at those who need it most.
- We will enable our customers to be part of the solution in saving water and help them manage their bills by allowing them to monitor their water use and offering advice on how to use water more efficiently.
We do not expect bad debt costs to increase in real terms in AMP6 from the current 2013/14 level, despite the challenging economic environment faced by some of our customers. We expect to be able to control our bad debt costs better in the future by:
- implementing a new debt management system in 2014, which will allow us to tailor our debt collection activities to the specific risk profiles of our customers;

Affinity Water Business Plan 2015 – 2020: Risk & Reward Submission 28
- sharing with credit reference agencies information about the credit history of those customers who are able, but choose not, to pay their bills or reach a satisfactory payment arrangement with us;
- fully deploying our social tariff by 2017; and
- implementing the industry-wide landlord portal to improve billing and recovery of revenue from transient customers within the tenant population
Providing value for money is more than just keeping costs to a minimum. It is also about enhancing our value proposition in the eyes of our customers. We will continue to increase our responsiveness to our customers’ needs and expectations. Our approach includes:
- our new Customer Charter;
- our ‘Voice of the Customer’ programme;
- Web chat;
- social media; and
- traditional contact channels.
We will make it easier and quicker for our customers to manage their accounts by improving the transparency of our billing and expanding the ways in which they can manage their accounts through digital solutions.
We recognise that the SIM is a useful tool in assessing the views of customers with respect to certain aspects of the service we provide. We therefore welcome the retention of SIM as a financial incentive and penalty mechanism.
We want to understand the views of a wider and more representative sample of our customers (at company and community level) as to whether our service represents an affordable and value for money service. We will therefore undertake an annual value for money survey to establish this and have included this as a PC. We will establish a baseline for this commitment by the beginning of AMP6.
3.2.3 Board governance and ownership of our PCs
Our Board is committed to placing customers’ interests at the heart of our Business Plan and to obtaining the best possible assurance that we are implementing it. There are two strong reasons underpinning this commitment.
First, in order to achieve our vision of being the leading community-focused water company, we need to maintain legitimacy and trust with our customers and the communities in which they live and work. We can only achieve this if we meet the PCs we have made.
Second, the significant challenge that we face with respect to managing our water resources challenge so that we can continue to meet the needs of today’s customers and future generations, whilst leaving more water in the environment, requires a step change in how our customers use and value water. Our Board recognises that we can only expect customers to respond positively to our plans to help them reduce the amount of water they use, if we are seen to meet the PCs we have made with respect to leakage, water available for use and sustainability reductions.
Our Board has overseen and participated in the development of our PCs and ODIs. It recognises that customers’ and stakeholders’ views have shaped and influenced them and that

Affinity Water Business Plan 2015 – 2020: Risk & Reward Submission 29
the business has selected a package of ODIs that strikes a fair balance of risk and reward for our business and customers. Meeting our PCs will require stretching performance by management, at levels significantly higher than were set for AMP5. Rewards will only be earned for leading performance, while penalties will be incurred where performance falls below the committed level of performance. The overall level of risk and reward through the ODI package incentivises our Board to own the delivery of our PCs.
Our Board will keep under review the operational, financial and management needs of the organisation to ensure that the business is equipped and resourced to meet our PCs. Our Chief Executive Officer, supported by his senior executive team, is accountable to the Board for meeting our PCs. He will report monthly to our Board on progress against our PCs. Our Board will, where appropriate, challenge management’s plans to achieve them. This active oversight of performance, supported by third party assurance of our reporting, will provide confidence to customers, regulators and other stakeholders of our Board’s determination for the business to achieve high levels of performance against its commitments.
Customers, regulators and stakeholders rightly expect that the remuneration of executive directors and other senior executives is linked to standards of performance experienced by customers. The Board’s remuneration committee has therefore developed a long-term incentive plan for executive directors and other senior executives linking incentive awards directly to the Company’s ranking under the SIM. The remuneration committee will review management’s performance against our PCs when determining the annual bonus awards. These arrangements will be reported in our annual report and should provide assurance to customers and stakeholders that management is appropriately incentivised to focus on providing high standards of service to customers.

Affinity Water Business Plan 2015 – 2020: Risk & Reward Submission 30
3.3 Measurement, assurance and accountability 3.3.1 Measurement and audit
To be the leading community-focused water company it is essential our customers have confidence in the measurement and audit of our performance. This is important where there are financial rewards or penalties linked to our PCs, and especially so where the ODI has a high relative weight in the financial package as is the case with our leakage ODI. We therefore recognise the following point made by our CCG.
“We are, however, concerned that Affinity Water has tied such a large proportion of its penalties and rewards to the one outcome on leakage. We understand why the company has done this, but have concerns about the company placing ‘all its eggs in one basket.’ For this approach to be credible with customers, we believe it is essential that the company develop a performance monitoring system that is transparent, robust and reliable.”
R Dahlberg, CCG Chair: Letter to Ofwat, 14 March 2014
Our approach responds robustly to this objective.
The measures we currently use are based on industry standards and subject to robust procedures and monitoring by other regulators and bodies including DEFRA, the EA, the Drinking Water Inspectorate (DWI), Natural England, CC Water and our CCG. This ensures we report data that is accurate, reliable and audited. Continuing with these measures provides confidence to our customers and a source of consistency in time series comparisons.
Coupled with these existing measures, we believe that our industry-leading innovation offered by our Service Delivery Map will gain trust and establish our legitimacy to serve our customers and communities.
We will use our reporting tool (Navig-8) to reflect unique local issues and report on the condition of local assets. It will offer communities the ability to view historical service as well as forecasts of expected future performance against levels of investment. We will provide our communities with a clear picture of performance against commitments within their local area and the ability to compare performance across our communities.
We confirm that we will invite our Reporter to provide audit and assurance of our actual performance in relation to outcomes reporting at the company level. We will ensure that the scope of this work is added to the ongoing functions of the Reporter in completing our assurance of our Annual Performance Report and Risk and Compliance Statement submissions.
We will share the outcome of our Reporter’s assurance with other bodies that have a role in monitoring our performance, including DEFRA, the EA, the DWI, Natural England, CC Water, Local Authorities and our Stakeholder Assurance Panel.
3.3.2 Accountability to our customers and stakeholders for performance against our PCs
We recognise the importance of being accountable to our customers and stakeholders for our performance against our PCs. After all, it is they who have shaped our customer Outcomes and associated PCs and they rightly expect that we are clear and transparent about our

Affinity Water Business Plan 2015 – 2020: Risk & Reward Submission 31
performance. We are committed to reporting performance at a community level and this is fully aligned with our vision to be the leading community-focused water company.
We understand that customers and stakeholders need to be assured that our reporting is reliable, accurate and robust, if we are to maintain legitimacy with them. So, we will establish third party professional review of our reporting against our PCs and afford stakeholder access to our assurance providers.
We will provide our customers with information about our performance against our PCs through a range of traditional and digital media including direct communication with customers through information provided with their bills.
We want the information we provide to customers to be as relevant, simple and transparent as possible. We will work with CC Water and our Stakeholder Assurance Panel to test the materials, language and terminology we use in our communications with customers to remove any barriers to understanding.
We will report our performance against our PCs in our Annual Performance Report, alongside such other measures that we or our regulators require. We will publish our Annual Performance Report on our website and draw it to the attention of our customers in our communications with them.
We will also share our Annual Performance Report with our regulators and key stakeholders such as local authorities and local politicians. Our regular e-bulletins sent to community leaders and elected representatives will also provide an update on how we are performing against our PCs.
We also plan to hold an annual stakeholder forum event in each of our eight communities, led by our senior executives. This will provide an opportunity for management to be held to account for local performance.
We will commission our Reporter to review our reporting of our performance against our PCs to ensure our reporting is reliable, accurate and robust. We will also commission our financial auditors to make an independent assessment of penalty or reward that arises from the performance we have achieved. For our value for money survey, we will use external consultants accredited by a recognised market research body.
Our independently-chaired Stakeholder Assurance Panel, which will evolve from our CCG in 2014/15, and comprise key stakeholders with a collective understanding of customer issues, will scrutinise our performance against our PCs. Our Panel will have access to assurance reports from our Reporter and financial auditors regarding our performance against our PCs. The Panel will have an opportunity to meet with them to discuss their findings should the Panel wish. It will ensure we retain the confidence of our communities by reviewing and challenging our performance.

Affinity Water Business Plan 2015 – 2020: Risk & Reward Submission 32
3.4 Customers are protected from underperformance
We are setting stretching PCs and will face strong commercial and regulatory incentives to protect customers from underperformance.
Our customer Outcomes have been developed following extensive stakeholder and customer engagement on our WRMP and our Business Plan. They have also benefited from scrutiny and challenge from our CCG.
We believe that our package of PCs and ODIs furthers the interests of this generation and future generations of customers. The package reflects customers’ priorities and affords strong protection from underperformance through a balance of financial and reputational incentives for PCs founded on compliance with our key legal duties.
We recognise that customers should have a high degree of confidence that we are appropriately incentivised to deliver our PCs and they should be confident their interests are protected from any underperformance. Our approach is built around the following:
- setting stretching PCs to further our customers’ interests. For example, our rates of change expected on both leakage and sustainable abstraction reductions are the highest in the sector according to the December 2013 Business Plans;
- strong commercial incentives to deliver our PCs. Many of our PCs are central to our ability to meet our longer-term challenge around our supply/demand position. If we fail to deliver against our demand management strategy of using water efficiently, we face significant financial consequences in terms of importing more water to our supply area – this is a risk within the AMP that will be borne by our shareholders and not our customers;
- ensuring we are accountable for delivering our PCs in a transparent way with our customers, including performance reporting at the community level. This is central to our vision of being the leading community-focused water company and imposes strong and effective reputational incentives on our business; and
- giving our customers further confidence we are proposing a strong financial ODI package. This will enhance our commercial incentives and compensate our customers if we fall short.
Financial ODI incentives will sharpen our incentives to deliver for our customers
We recognise that customers will be concerned about whether we have an incentive to underdeliver in order to gain financially, especially if the costs associated with delivering our PCs are included within our totex projections (and in a regulatory framework where the previous ‘short-falling’ arrangements are withdrawn).
This is why we have proposed a range of financial penalties on our PCs to mitigate this risk. All but two (AIM and Value for Money) of our 13 PCs have a financial penalty or customer compensation:
- 8 now have financial penalty ODIs (leakage, average water use, WAFU, sustainable abstraction reductions, the two PCs for water quality, unplanned interruptions to supply over 12 hours, and the number of burst mains).

Affinity Water Business Plan 2015 – 2020: Risk & Reward Submission 33
- 2 have Enhanced GSS payments for compensating customers (customers not notified of planned interruptions and planned work taking longer to complete than notified).
- 1 has financial incentives set by Ofwat (SIM).
The penalty incentive rates have been calculated in accordance with Ofwat’s July 2013 methodology. This should give assurance to our customers that we will not financially gain from failing to deliver our PCs or by letting our service deteriorate.
In addition, we want to send a strong message to our customers that by placing financial penalties on nearly all of our PCs we have safeguarded them from the risk that we focus exclusively on one or two areas whilst allowing service to deteriorate in other areas.
We welcome Ofwat’s support for positive financial incentives to encourage us to stretch beyond the PCs in our revised Business Plan. Following the Ofwat July 2013 methodology, we think rewards should apply to fewer of our PCs than penalties. This is based on our customer research that found that customers did not wish to pay for a service improvement in some areas but they were keen to avoid any service deterioration.
Of our 13 PCs, we have established financial rewards for 3 where we believe this can be supported by our customer research evidence. These are leakage, sustainable abstraction reductions, and unplanned interruptions to supply over 12 hours. A further PC in relation to SIM will have financial incentives set by Ofwat.
We want to give our customers confidence that our financial reward ODIs are appropriate. We have done this by taking into account evidence on customers’ WTP. We have taken into account whether a reward would reflect our performance simply ‘catching up’ with the industry norms or pushing well beyond this level. Finally, we have considered the extent to which outperformance will arise from innovative approaches and technologies that could have positive learning effects for the sector more generally.
Our ODIs are consistent with Ofwat’s other PR14 assumptions and other regulatory incentives
We consider that our ODI package is consistent with Ofwat’s PR14 assumptions. We have not included any totex for performance levels in excess of our PCs and we have calculated incentive rates in accordance with the Ofwat methodology. Therefore, there is not a possibility of ‘double recovery’ of totex with financial rewards for outperformance.
Our ODI framework is also consistent with other regulatory frameworks we must comply with. For example:
- the sustainable abstraction reductions ODI helps support our delivery of our agreed sustainability reductions with the Environment Agency (EA). It therefore supports our environmental legal obligations.
- the water quality ODIs are consistent with our statutory obligations. We already face very effective reputational, commercial and legal incentives for failing to meet our water quality obligations. But in the unlikely event that we do fall short, we think it right that we reduce our bills to customers as a result.
- Frontier Economics has provided external assurance to our Board that our revised ODI package fully meets the Ofwat guidance.

Affinity Water Business Plan 2015 – 2020: Risk & Reward Submission 34
In addition, we have legal obligations in relation to achieving many of our PCs
In addition to commercial and regulatory incentives we also have legal obligations that relate directly to many of our PCs. We have a legal duty to develop and maintain an efficient and economical system of supply within our supply area. Seven of our PCs are directly linked to how effectively we meet this duty by investing in, maintaining and operating our water supply system – the serviceability of our assets.
- Leakage.
- WAFU.
- Sustainable abstraction reductions.
- Compliance with water quality standards.
- Customer contacts for discoloration.
- Unplanned interruptions to supply over 12 hours.
- Number of burst mains.
Our legal duty is enforceable by Ofwat, which can intervene through the use of an enforcement order or penalty to ensure that the duty is met.
We also have a legal duty to promote the efficient use of water by consumers. Our PC for average water use is directly linked to our legal duty to promote water efficiency. Again, this duty is enforceable by Ofwat, which can intervene through the use of an enforcement order or penalty to ensure that the duty is met.
Failure to meet our commitments with respect to sustainable abstraction reductions could lead to enforcement by the EA in the event of a breach of our abstraction licences.
Customers are further protected with respect to compliance with water quality standards and customer contacts for discolouration by our legal duties with respect to the wholesomeness of the water we supply. The Secretary of State, through the DWI, can intervene to take enforcement action in the event of underperformance which breaches this duty.
We are also obliged by Regulations to compensate customers where we fail to meet certain standards of service. Our PC for affected customers not notified of planned interruptions and planned work taking longer to complete than notified, are directly linked to our legal duty to compensate customers in these circumstances. By enhancing the compensation payments to household customers to a higher amount than prescribed by Regulations, we are further incentivised to ensure that our customers do not experience unnecessary disruption to their service in the event of planned works.
Avoiding bill volatility
We propose that all ODI rewards/penalties are ‘rolled up’ over AMP6 and applied to the opening RCV for AMP7 either as an addition or reduction to the RCV. This brings the approach into line with SIM in terms of the timing of the application of performance incentives. It also helps avoid bill volatility for customers over AMP6. This approach is supported by the CCG in its letter to Ofwat of 14 March.
We believe there are sound reasons for applying potential rewards/penalties as an addition or reduction to the RCV rather than as a revenue adjustment in AMP7.

Affinity Water Business Plan 2015 – 2020: Risk & Reward Submission 35
- Our Outcomes support our long-term objectives: Any incentive is dependent on how well we deliver against our PCs, and these in turn help to achieve our long-term strategy of ensuring future customers have access to safe, reliable and affordable water, whilst leaving more water in the environment. Applying potential rewards/penalties to RCV helps align the recovery/payment of incentive awards with this longer-term objective.
- Investment in assets: We will make a substantial investment in our assets in order to achieve our PCs. If we outperform or underdeliver then it seems appropriate that we adjust the value of this investment which will be included in the RCV.

Affinity Water Business Plan 2015 – 2020: Risk & Reward Submission 36
3.5 Our ODIs reflect an appropriate balance of risk between our shareholders and customers
The combined value of the penalties is about 2.3% of RoRE. This is towards the top end of Ofwat’s January 2014 guidance on risk and reward but we think it is appropriate to send a powerful message to our customers and the communities we serve that we will suffer significant financial penalty from any underperformance.
This level of penalty will provide clear incentives on our business to avoid underperformance. These incentives are especially sharp for our business relative to the industry average because we have a much higher revenue/RCV ratio (operating leverage).
This incentive is set against the context of our Business Plan that has very challenging totex efficiency assumptions and a much lower WACC than PR09 (see section 2). We have also removed the company specific uncertainty mechanism to deal with costs risks arising from HS2 and the EA proposing greater sustainability reductions under the Water Framework Directive and River Basin Management Plans (see section 4).
The value of potential rewards is about 0.6% of RoRE. This is much less than the amount of money that is at risk from penalties and a little below the low end of the Ofwat January 2014 guidance.
We did consider options for making the rewards and the penalties more symmetrical but this would have taken us away from the evidence we have on customers’ WTP for improvements and we believe this would be less consistent with Ofwat’s July 2013 methodology as set out in the Figure 3-2 below taken from figure 5 on page 68 of the publication.
Figure 3-2: Ofwat methodology framework for determining incentives

Affinity Water Business Plan 2015 – 2020: Risk & Reward Submission 37
We continue to place a significant emphasis on the leakage reduction ODI although we have adjusted the balance with our other ODI’s following feedback from our CCG. The leakage ODI now accounts for approximately 60% of the overall potential penalty and approximately 80% of the overall potential reward. We consider this is appropriate for several reasons.
- It remains consistent with our customer research preferences, which showed that customers placed a high value on leakage reduction.
- It is consistent with our Business Plan strategy, which responds to our supply/demand challenge through a demand management strategy involving both our business and our customers. We know that if we want our customers to use water more efficiently we must show leadership by demonstrating to them that we are doing everything possible to reduce leakage. This is one reason why we have committed to an industry leading percentage reduction in leakage for AMP6.
- By having financial penalties or customer compensation on 11 of our 13 PCs we can send a very clear message to our customers that we will not let other aspects of service deteriorate due to our focus on reducing leakage.
Taken with the context of the stretch implied by our revised Business Plan, and the overall risk and reward package, we believe that our ODIs represent an appropriate balance in risk between our shareholders and our customers.
A summary of our revised ODI package, in terms of RoRE, is given in the table below.
Avg. upside £m p.a.
Avg. upside % annual
revenue p.a.
Avg. RoRE
upside % RoRE p.a.
Avg. downside £m p.a.
Avg. downside % annual revenue
p.a.
Avg. RoRE
downside % RoRE
p.a.
Total ODIs £2.20 0.81% 0.58% -£8.78 -3.23% -2.32%
Leakage £1.83 0.67% 0.48% -£5.18 -1.90% -1.37%
Average water use £0.00 0.00% 0.00% -£0.50 -0.18% -0.13%
Water available for use £0.00 0.00% 0.00% -£0.50 -0.18% -0.13%
Sustainable abstraction £0.33 0.12% 0.09% -£0.14 -0.05% -0.04%
Compliance water quality standards £0.00 0.00% 0.00% -£0.72 -0.26% -0.19%

Affinity Water Business Plan 2015 – 2020: Risk & Reward Submission 38
Customer contacts for discoloration £0.00 0.00% 0.00% -£0.28 -0.10% -0.07%
Unplanned interruption >12 hrs £0.03 0.01% 0.01% -£1.46 -0.54% -0.39%
Number of burst mains £0.00 0.00% 0.00% £0.00 0.00% 0.00%
Total ODIs AMP6 £10.99 0.81% 0.58% -£43.88 -3.23% -2.32%
Table 3-B: Summary of revised ODIs
Affinity Water Business Plan 2015 – 2020: Risk & Reward Submission 39
3.6 Customer Outcome (1) - Making sure our customers have enough water, whilst leaving more water in the environment
It is a key challenge for our business to ensure that our customers have enough water, now and in the future, whilst leaving more water in the environment to protect our chalk streams and local habitats, and to preserve our water sources for future generations.
To overcome this challenge we need to use our water resources more efficiently and persuade our customers to recognise water as a precious and finite resource.
We will improve the efficiency with which we use our water resources and support our customers to reduce their consumption to leave more water in the local environment. This will enable us to provide a sustainable water service and ensure that our customers, communities and the environment have enough water both now and in the future.
The five PCs linked to this customer Outcome must be viewed as an integrated set of commitments to deliver our demand management strategy in AMP6. This in turn is part of a longer-term supply/demand strategy set out in our Water Resources Management Plan (WRMP).
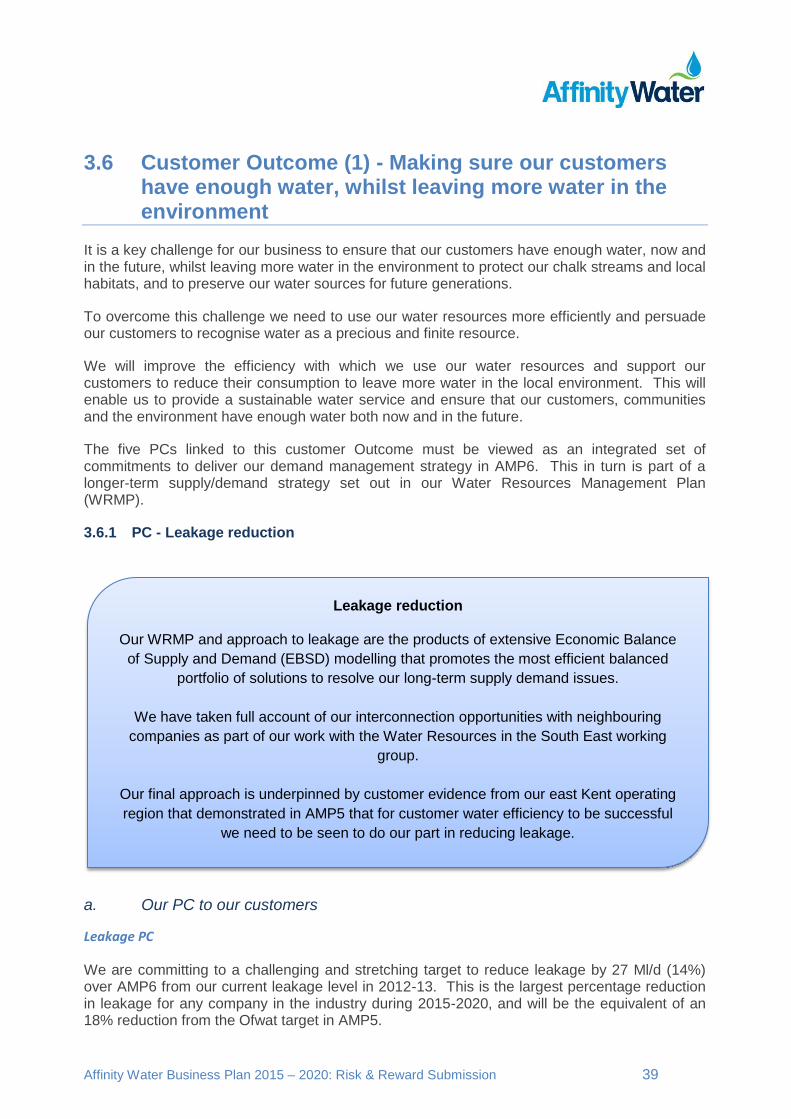
3.6.1 PC - Leakage reduction
a. Our PC to our customers
Leakage PC
We are committing to a challenging and stretching target to reduce leakage by 27 Ml/d (14%) over AMP6 from our current leakage level in 2012-13. This is the largest percentage reduction in leakage for any company in the industry during 2015-2020, and will be the equivalent of an 18% reduction from the Ofwat target in AMP5.
Leakage reduction
Our WRMP and approach to leakage are the products of extensive Economic Balance
of Supply and Demand (EBSD) modelling that promotes the most efficient balanced
portfolio of solutions to resolve our long-term supply demand issues.
We have taken full account of our interconnection opportunities with neighbouring
companies as part of our work with the Water Resources in the South East working
group.
Our final approach is underpinned by customer evidence from our east Kent operating
region that demonstrated in AMP5 that for customer water efficiency to be successful
we need to be seen to do our part in reducing leakage.

Affinity Water Business Plan 2015 – 2020: Risk & Reward Submission 40
The 14% leakage reduction in AMP6 was the result of our Economic Balance of Supply and Demand (EBSD) modelling, which was an integral part of our Water Resources Management Plan (WRMP). EBSD modelling determined the optimal economic level of the different measures that we need to take over the planning period (25 years) within a set of given constraints in order to meet our commitments under the Water Framework Directive, namely the reduction in our resource base of 42Ml/d during AMP6. The 27Ml/d leakage reduction (increasing by a further 10Ml/d in AMP7) is part of our overall demand reduction strategy, which also includes reduction in water used through universal street-by-street metering and water efficiency programmes.
We consulted upon our draft WRMP from 17 May 2013 to 12 August 2013. The consultation response is summarised in our revised WRMP (November 2013), section 10.3.1. We also used our online customer panel to test customer preferences for leakage with a specific questionnaire in July 2013. We designed this questionnaire to include a paragraph of explanation about our current operations to inform the customer before they answered. The results of our questionnaire are summarised in section 10.5.2 of our revised WRMP, and include a good level of support for reducing leakage beyond the economic level and that metering will encourage customers to take responsibility for leakage on their pipework.
Industry leading performance
We currently (AMP5) do not have a deficit in our supply and demand balance and our Ofwat leakage target is constant during AMP5. Therefore, we seek to control leakage in the most cost efficient manner such that we minimise expenditure on leakage operations and the marginal operating costs (the value of water being lost through leakage). The level of leakage that minimises these costs is the economic level of leakage (ELL) and this level should be maintained over the planning period. If external costs associated with environmental, social and carbon impacts are also considered then the ELL is referred to as the short-run Sustainable ELL. We use RPS Consultants, who are expert in leakage economics, to calculate our short run ELL and SELL values.
Our current ELL is calculated as 213Ml/d, which compares to our estimated out turn leakage level for 2013-14 of 187Ml/d (compared to our Ofwat leakage target of 197 Ml/d). Our current SELL is calculated as 221Ml/d.
Our last ELL/SELL calculation was carried out for PR09 and using like-for-like parameters such as the value used for the marginal cost of water, RPS calculate that our leakage efficiency in terms of cost per unit saving of leakage at current and reduced leakage levels has increased by just below 12%. They put this down to improved active leakage control policies and techniques and to some extent the change in the environment at the time of the analysis, although, they cannot differentiate between these two factors.
During AMP6 we plan to drive leakage down to 162Ml/d by 2019/20, which is well below today’s economic levels. The lowest previous leakage level we have achieved was in 2011/12 when we achieved a leakage level of 170Ml/d. This achievement was as a result of £5m additional leakage expenditure in 2010/11 to counteract the effects of severe winter, in order to meet the leakage target that year. The benefit in driving leakage so low in the months of January to March 2011 remained through the 2011/12 year.
In 2019/20 our leakage performance commitment of 162Ml/d will be 24% below today’s economic level. We intend to recalculate the ELL as a means of monitoring progress to ensure that additional investment and innovation is resulting in the efficiency improvements required to

Affinity Water Business Plan 2015 – 2020: Risk & Reward Submission 41
ensure that the ELL reduces in line with lower leakage targets, achieving the best possible value for customers.
To achieve these low levels of leakage and maintain them sustainably will only be achieved by efficient working and innovation, using the very latest technology. Developing and deploying this innovation is at the heart of our network management strategy which also includes installing AMR meters and AMR devices on existing meters in areas of universal metering and will be continuing with the roll out of our real time data systems and calming measures for the pipe network. Getting the benefit from these technological advances will be the key challenge we will face.
In order to achieve the PC by 2019/20 we cannot continue our ‘business as usual’ approach to leakage management. Our PC in AMP6 will require a transformational approach, which will require us to employ new technologies and innovations - for example, real-time network telemetry. We predict we will be the industry leader in leakage management for an urbanised network.
We will only earn a reward if we drive leakage faster than the PC and beyond our best ever level of leakage. If we fall short of our PC, significant penalties will apply with no deadband. The totex in our Business Plan only included to achieve the PC and so any cost for over-performing will be borne by the company and shareholders.
b. How we will be incentivised to deliver
The table below sets our rationale for the type of incentive we have chosen for leakage. We have confirmed that a financial incentive with penalties and rewards is most appropriate.
Methodology question Our answer
Q1 Is there sufficient evidence that a financial incentive is appropriate?
Yes, based on customer preference and priorities that we should be financially rewarded or penalised (WTP studies).
Q2 Is there sufficient evidence that there is potential benefit from increased performance?
Yes, benefits from increased performance impact supply/demand and this benefits customers by deferring future supply/demand schemes and leaving more water in the environment.
Q3 Is the outcome, on its own, highly valued by customers?
Yes, WTP studies prove this.
Q4 Is there a reliable value for the outcome?
Yes, leakage is measurable and has been reliably measured over many AMPs. We have a specific WTP value for changes in leakage levels; we have cost data for reducing leakage.
Table 3-C: Selecting the incentive type – leakage

Affinity Water Business Plan 2015 – 2020: Risk & Reward Submission 42
c. Calculation and calibration of financial incentives
We tested our leakage reduction strategy with our customers again through our WTP surveys. We set our WTP interval as part of a “choice experiment” to calculate marginal WTP values. This value was £306k/Ml/d saved. The work was carried out on our behalf by ICS and followed best practice.
To assess the incremental cost rates we have used our economic level of leakage cost curves analysis carried out by RPS as part of our short run Sustainable Level of Leakage (SR SELL) calculation. This information was also used in the EBSD modelling. See figure 3-3 below for our average incremental cost curve for leakage reduction.
Figure 3-3: Incremental leakage reduction costs
Even though we have calculated specific costs for different levels of leakage reduction, there is substantial uncertainty around the specific increments. In other words, the costs of reducing leakage will increase with further reductions in leakage but the specific increments may vary.
Penalty incentive rate
We have not changed our penalty incentive rate from our Business Plan submission.
To establish the penalty incentive rate we followed the Ofwat final methodology guidance that:
ODIpenalty = Incremental WTP – (incremental cost x p)
Following this guidance, we set the penalty incentive rate at £241,000/Ml/day (£306,000-£130,000 x 50%). This reflects the importance customers put on leakage.

Affinity Water Business Plan 2015 – 2020: Risk & Reward Submission 43
Due the fact that our underlying PC is for a significant reduction in leakage we have not used a Willingness to Accept (WTA) valuation for the penalty incentive rate. In most cases a failure to achieve the leakage PC is unlikely to lead to a level of leakage higher than our start point of 189Ml/d. Moreover by 2018/19 our penalty collar is below the level of our start point.
Reward incentive rate
The general formula for setting reward rates as stated in the Ofwat final methodology is:
- ODIreward = Incremental WTP*(1-p)
However, in considering the appropriate incentive rates, we have noted Ofwat guidance that:
“if committed performance levels are being set below economic levels then companies should consider capping any ODI reward at an estimate of incremental costs, rather than using potentially higher estimates of WTP.”
Ofwat, Setting price controls for 2015-20 – final methodology and expectations for companies’ business plans
Therefore, because our leakage PC of 162Ml/d will be 24% below today’s economic level, we have used the following specific formula to set our reward incentive rate:
- ODIreward = Estimated incremental cost *(1-p)
Estimating incremental costs for leakage reduction is challenging, particularly when going beyond our PC to a level where we would never have been before. Therefore, we have sought to design our reward incentive rates to best reflect the average incremental costs by splitting the potential reward into two reward incentive rates using our leakage cost curve:
- Reward incentive rate 1 - for performance up to 162.2 Ml/d, our end of AMP6 performance commitment.
- Reward incentive rate 2 - for performance between 162.1 Ml/d and our reward cap.
We have estimated incremental costs based upon the mid-point of the leakage cost curve (figure 3-4) for the performance ranges of each reward incentive rate. This has enabled us to calculate our reward incentive rates as:
- ODIreward Incentive Rate 1 = £150,000 *(1 - 0.5) = £75,000 / Ml/d
- ODIreward Incentive Rate 2 = £224,000 *(1 - 0.5) = £112,000 / Ml/d
We believe that this offers an appropriate level of reward for any outperformance, and encourages us to develop innovative solutions to leakage reduction.

Affinity Water Business Plan 2015 – 2020: Risk & Reward Submission 44
Figure 3-4: Incremental leakage reduction costs – ODI rates and performance ranges
ODI design parameters
Compared to our Business Plan, we have removed the penalty ‘deadband’ to put more value at risk between the AMP6 target and P10 scenario to increase the effective incentive we face. Although this increases our risk exposure it is justified on the basis that this outcome is one where there is a larger degree of management control/influence.
We have also introduced a reward ‘deadband’ to ensure that we are only eligible to earn rewards if and when we drive leakage below 170Ml/d. This level represents our best ever previous level of performance. Therefore, we would only earn a reward if we reduced leakage faster than our PC, but only when we have reduced leakage to historic best ever levels for the Company. We have also established two new reward incentive rates to reflect the incremental cost of sub-economic leakage reduction.
The other ODI parameters remain unchanged compared to our Business Plan.
The precise parameters for the leakage ODI are detailed in the table below.

Affinity Water Business Plan 2015 – 2020: Risk & Reward Submission 45
ODI Parameter Presented
in BP Updated Proposal
Change from BP
AMP6 performance commitment (by 2020)
Ml/d 162.2 162.2 No change
Incentive rate - penalty £m/Ml/d/year 0.241 0.241 No change
Incentive rate 1 - reward £m/Ml/d/year 0.153 0.075
We have reduced our reward incentive rate for performance up to 162.2 Ml/d
Incentive rate 2 - reward £m/Ml/d/year 0.153 0.112
We have reduced our reward incentive rate for performance better than 162.2 Mld.
Penalty collar (average for AMP6)
Ml/d (above PC)
28.3 28.0 Effectively no change
Penalty deadband Ml/d (above PC)
8.3 0.1 We have removed the penalty deadband
Reward deadband Ml/d (beyond PC)
8.3 170.2
We have included a reward deadband at the level of our best AMP5 performance
Reward cap (average for AMP6)
Ml/d (beyond PC
27.0 28.0
Effectively no change – minor amendment to ensure symmetry with penalty collar
Timing of incentives Annual AMP6
Assessed annually then rolled up and applied at PR19 as a single adjustment to RCV
Table 3-D: Leakage ODI parameters

Affinity Water Business Plan 2015 – 2020: Risk & Reward Submission 46
Figure 3-5: Revised leakage ODI design
d. RoRE analysis
The table below summarises the effective incentive range that could apply depending on how well we perform in AMP6. The effective incentive range is assumed to be the P10/P90 range as opposed to the theoretical maximum reward or penalty.
Avg. upside £m p.a.
Avg. upside % annual
revenue p.a.
Avg. RoRE
upside % RoRE p.a.
Avg. downside £m p.a.
Avg. downside % annual revenue
p.a.
Avg. RoRE
downside % RoRE
p.a.
Leakage £1.83 0.67% 0.48% -£5.18 -1.90% -1.37%
Table 3-E: RoRE analysis - leakage ODI
e. Measuring leakage
The processes we put in place have been developed from industry best practice and our own experience, and we have sought to innovate in how we measure leakage with initiatives such as fast logging. We are confident that the way we capture data and assess our performance is appropriate to give our communities the confidence that we are reducing leakage in line with our PC.
We collect leakage data from our network telemetry, reporting our Minimum Night Flow (MNF) in litres per property per hour and communicating our progress weekly with colleagues across the business. We report progress at company level, but make data available at the community level to our teams to compare performance and identify where the need for leakage detection is

Affinity Water Business Plan 2015 – 2020: Risk & Reward Submission 47
greatest. This allows us to be flexible with our leakage detection and repair resource pool and ensure that our customers see an appropriate response to leakage in their community.
Our weekly Minimum Night Flow is translated into our monthly leakage figure in million litres per day within days of month end.
We report monthly leakage figures to our Executive Management Team and the Board, together with updates on our strategic leakage projects such as Service Delivery Map ‘network calming’ and pressure optimisation, together with the relationship with our energy efficiency programme.
We report our leakage position quarterly as part of our water balance, always targeting closure within 5%. We calculate our water balance at the community level as well as regional and company levels. We internally assure all components of the quarterly water balance.
Finally, we report leakage as a key component of our Annual Return, which continues to be audited by our Reporter. We will also report on all PCs in our Annual Report and Annual Performance Report.
We are confident that our existing systems provide the necessary tools to measure and report our leakage position. We have maintained the governance provided by thorough internal assurance and external audit we used for the June Return in the compilation of our Annual Return.
3.6.2 PC - Average water use
a. Our PC to our customers
Our customers have one of the highest per capita consumption (PCC) rates in the country. Our customers have told us that they want to know how they can reduce their consumption, particularly as there is a benefit to the environment. This measure is a reflection of the success of our partnership with customers to reduce consumption and will be a significant challenge.
Water saved is dependent on the number of customers paying measured charges. To support customers which we will measure during AMP6 as part of our universal metering programme we
Average water use
Our customers have one of the highest per capita consumption (PCC)
rates in the country.
Our customers have told us that they want to know how they can reduce
their consumption, particularly as this would benefit the environment.
A significant majority of our customers think that it is important to use water
carefully although most are of the view they are already ‘water wise’ and
they place a higher priority on us reducing leakage first.

Affinity Water Business Plan 2015 – 2020: Risk & Reward Submission 48
have agreed to allow them to switch to measured charges at any time up to two years after their meter is installed. This means there could be a delay in reducing water saved compared to the rate identified in our WRMP. We will enhance our water efficiency campaign to compensate for this potential delay.
Water saved is also affected by seasonal weather conditions so it will be necessary to assess actual consumption each year and adjust to take account of prevailing weather conditions. We developed a consistent method to assess this variance during development of our WRMP although this approach is more reliable for a time series trend.
Our approach to monitoring and sharing our progress with our key stakeholders at a community level will ensure we maintain a robust standard of water balance reporting throughout AMP6 which will be subject to annual audit by our Reporter in order to protect customers.
Average water use PC
The 7% average water use reduction in AMP6, equivalent to 11 l/p/d, was the result of our economic balance of supply and demand (EBSD) modelling, which was an integral part of our WRMP. EBSD modelling determined the optimal economic level of the different measures that we need to take over the planning period (25 years) within a set of given constraints in order to meet our commitments under the Water Framework Directive, namely the reduction in our resource base of 42Ml/d during AMP6.
The reduction in average water use is part of our overall demand reduction strategy, which also includes reduction in water used through universal street-by-street metering coupled with water efficiency programmes.
b. How we will be incentivised to deliver
The table below sets our rationale for the type of incentive we have chosen for average water use. We have confirmed that a financial incentive with penalties only is most appropriate for this PC.
Methodology question Our answer
Q1 Is there sufficient evidence that a financial incentive is appropriate?
We do not have full influence over the consumption behaviours of our customers.
However, we know that our work can have a significant influence over their behaviour in terms of the success of water efficiency measures and metering.
Q2 Is there sufficient evidence that there is potential benefit from increased performance?
Yes, benefits from increased performance, i.e. reduced customer demand will improve our supply/demand situation and this will benefit customers by deferring future supply/demand schemes and leaving more water in the environment.

Affinity Water Business Plan 2015 – 2020: Risk & Reward Submission 49
Q3 Is the outcome, on its own, highly valued by customers?
No, we do not believe we have evidence that customers highly value reductions in consumption on their own. They consistently state that Affinity Water should reduce leakage first.
Table 3-F: Selecting the incentive type – average water use
c. Calculation and calibration of financial incentives
We do not have WTP data to assess the penalty incentive rate that should apply for failing to achieve our PC for average water use. Therefore to set the penalty incentive rate we have used alternative cost data.
Our demand management programme is fundamental to achieving our target of reducing the average consumption of our customers (weighted average per capita) from 158.4 l/p/d to 147.4 l/p/d. For this performance commitment we addressed the range of water savings over which management decisions could affect the amount of water saved from having installed meters and not the rate of metering itself as universal metering will be required in all scenarios. In essence if our management and implementation of our integrated water efficiency and metering programme is poor customers may save less water than we plan or conversely if we are more successful this will encourage higher levels of savings.
We considered a range of evidence to forecast achievable water savings and valued the range in terms of the savings or costs of water that would be saved or needed to replace the volume lost in average. The range is limited to the amount of surplus water that we would be able to draw on in an average year which is constrained bearing in mind we have no supply/demand surplus in a dry year so any deficit in that situation would incur a higher risk of supply failure which is incentivised by other performance commitments.
There is insufficient evidence to develop a statistical relationship for the incidence and elasticity of metering on consumption in particular in view of the variation in socio-economic, demographic, hydrological, implementation and tariff variables for any particular metering situation. We therefore considered appropriate benchmark data to define a reasonable range of outcome for our integrated water efficiency and metering. As the volume saved in each situation is dependant on scale and the commencing average consumption we assess all savings benchmarks as a percentage change from unmeasured consumption. The range of data used is described in our WRMP2.
- Results from water industry metering trials over the last 20 years have been variable suggesting potential water savings from 0 to 22% (UKWIR 2005)3.
- Evidence from our water balance in 2011/12 indicated that the difference between measured household and unmeasured household was 13.6%. This difference reflects not only new properties metered since 1991 but also optant meters both of which are likely to have lower than average consumption. Therefore, we adopted this as our stretch target in order to achieve a leading edge approach to our programme. 13.6% of savings corresponds to a volume demand saving of 20 Ml/d for AMP6 which corresponds to the forecast change in Weighted Average PCC (WAPCC) of 11 l/p/d.
2 Water Resources Management Plan 2013 : Technical Report 3.3 Metering Strategy & Cost Benefit Analysis – Appendix 11.
3 UKWIR 2005, Critical Review of Relevant Research Concerning the Effects of Charging and Collection Methods on Water
Demand, Different Customer Groups and Debt, Report Ref. No. 05/CU/02/1

Affinity Water Business Plan 2015 – 2020: Risk & Reward Submission 50
- In comparison 10% a commonly held industry benchmark for the effect of metering on consumption. This compares with two trial sites in our Central region (the focus of our metering programme for AMP6 and AMP7) from the National Metering Trials in 1991. We therefore evaluated a lower bound of volume saving of 10 Ml/d for AMP6 which is within the range of alternative available supplies in a normal year and this corresponds to a 6.8% rate of water saved which would be a significantly worse performance than average industry savings and that would result in a WAPCC at the end of AMP6 of 152.9 l/p/d, (+5.5 l/p/d above target).
- An equal range of higher efficiency has been used in our PC assessment corresponding to a volume saving of 30Ml/d or an equivalent saving rate of 20.4% which would correspond to a WAPCC of 141.9 l/p/d (-5.5 l/p/d) at the end of AMP6. This compares with independent analysis of our compulsory metering programme in our Southeast region that concluded confirmed savings of at least 16% have been achieved and the best ever evidence of water saved from the Isle of Wight metering trials (22%). We consider this an upper bound of savings taking account the strong support that was offered n our Southeast region programme by both local authorities, Kent County Council and local MP’s who were all concerned to ensure the region would continue to have resilience of supplies.
This assessment is consistent with our data in Table W2a.
In a normal year any change in WAPCC would result in the amount of water abstracted from the environment or imported from neighbouring companies changing. The marginal cost of normal year WAPCC should be assessed as the marginal cost of the weighted average cost of production and supply for non-groundwater sources (£89/Ml), as groundwater is always fully utilised. Thus, a 10 Ml/d variance in normal year water saved would cost £0.324million.
Therefore, a penalty/reward of £0.5million would incentivise a lower WAPCC in AMP6 and dis-incentivise a higher WAPCC in a normal year.
We estimate that for the first 10 Ml/d change in water saved would cost £324,000. A 10 Ml/d variance in supply/demand related to water saved is equivalent to 5 l/p/d. Therefore the cost per l/p/d is equivalent to £64,800. To ensure the penalty incentive rate protects customers we think that it is appropriate to set the penalty incentive at a higher level. If we increase the rate of the water saving cost to £92,340/l/p/d then the cumulative water saved over AMP6 results in a potential penalty of £2.5m over AMP6.
ODI design parameters
We have designed this penalty to apply ‘as a pass-fail’ incentive with a ‘way-point’ in the third year, 2017/18, and a final assessment in 2019/20 of AMP6. If we fail to achieve our performance commitment in each assessment year we will be subject to the maximum penalty for that year, regardless of how much we underperform the PC by.
The variance between our AMP6 starting position and end position is 11 l/p/d. We have set the third year target by taking into account that water saved is dependent on the rate of customers changing to measured charges, discussed above, but in particular a delay in achieving savings compared to our WRMP as we are supporting our customers in the transition to measured charges by allowing them to transfer up to 2 years after meter installation at their property. The precise parameters for the average water use ODI are detailed in the table below.

Affinity Water Business Plan 2015 – 2020: Risk & Reward Submission 51
ODI Parameter Presented
in BP Updated Proposal
Change from BP
AMP6 performance commitment year 5 (by 2020)
l/p/d 147.4 147.4 No change
AMP6 performance commitment year 3 (by 2018)
l/p/d n/a 153.3 Third year ‘way-point’
Incentive rate - penalty £m/yeah n/a 0.5
0.5 is an average per year over the AMP, but note we have allocated 0.75 in year 3 and 1.75 in year 5
Penalty collar (average for AMP6)
l/p/d n/a n/a No change
Penalty deadband l/p/d n/a n/a We have not included a penalty deadband in the ODI design
Timing of incentives Annual End of AMP6
This will be a pass/fail assessment in year 3 and year 5. Any penalties are then rolled up and applied at PR19 as a single adjustment to RCV
Table 3-G: Average water use ODI parameters
d. RoRE analysis
The table below summarises the effective incentive range that could apply depending on how well we perform over AMP6. The effective incentive range is assumed to be the P10/P90 range as opposed to the theoretical maximum reward or penalty.

Affinity Water Business Plan 2015 – 2020: Risk & Reward Submission 52
Avg. upside £m p.a.
Avg. upside % annual
revenue p.a.
Avg. RoRE
upside % RoRE p.a.
Avg. downside £m p.a.
Avg. downside % annual revenue
p.a.
Avg. RoRE
downside % RoRE
p.a.
Average water use £0.00 0.00% 0.00% -£0.50 -0.18% -0.13%
Table 3-H: RoRE analysis – Average water use ODI
e. Measuring average water use
To be able to show customers how much water they use and how they compare to others in their community, we must have clear processes for data capture, measurement and verification of both measured and unmeasured properties.
Our domestic (household) customers use around 80% of the water we put into supply, known as distribution input (DI). We calculate average water use (PCC) of our domestic customers as a weighted average of the PCC of measured and unmeasured households. These are critical components of our water balance, which is audited by our Reporter as part of our Annual Return. We also determined the weighted average annual demand for the Ofwat tables appended to our Business Plan that was based on an examination of historic demand and hydrological conditions. All measures are documented in our 2013 WRMP and in our procedures for our Annual Report.
A number of measures are derived from our Hi-Affinity billing system. Billed properties are validated by comparing and matching properties with data purchased from the ONS and held in our billing dataset. This reconciliation process takes place for our Annual Report. We are undertaking work to further improve our property records on our billing system and over time we will gain a better view on measured consumption in particular water resource zones through actual meter readings.
Derivation of measured PCC
We calculate the annual consumption of measured households from meter readings logged on our billing system, Hi-Affinity. We measure the volume used over a period of time (usually a year) to reveal each household’s use and to calculate average property consumption. As we read domestic customers’ meters twice each year and have a robust meter age replacement programme, we are confident in our consumption data for our measured households.
We convert the average household consumption to a quantity per person by using an average household occupancy value. The average occupancy value was derived from a survey we undertook in summer 2012 and benchmarked against the overall occupancy data we received from Experian following the 2011 Census. PCC is quoted as the litres per person (or per head or capita) per day.
Derivation of unmeasured PCC using our unmeasured consumption monitor
We also produce estimates of current average unmeasured household consumption for each of our communities using our unmeasured consumption monitor; this comprises a group of around 1,500 customers in our Central region who have had meters installed for our survey purposes

Affinity Water Business Plan 2015 – 2020: Risk & Reward Submission 53
but are not charged a metered tariff. As the meter penetration in our east Kent and east Essex regions is greater than 75% we do not have an unmeasured consumption monitor in those regions.
The key objective of our unmeasured consumption monitor is to produce auditable and consistent figures to estimate unmeasured per capita consumption, in particular for our Annual Return and regulatory submission to Ofwat and the Environment Agency.
Our unmeasured consumption monitor has been in operation since 1997. We selected a wide range of property types (flats/apartments, terraced houses, semi-detached and detached properties) across the region to better understand how water use differs for different properties. For example, we would expect that the garden watering micro-component would be lower for those living in flats than for those living in detached properties.
We read the meters of our unmeasured consumption monitor four times each year. These meter readings are input to a model and assured by a third party.
Periodically, we run a survey in which we ask the customers in our unmeasured consumption monitor to share information about the number of people living at their property, whether any are transient (e.g. students returning home outside of term-time), and whether they have recently upgraded to more water efficient devices. We incentivise the return of survey forms by running a competition with a number of small cash prizes, and have regularly received a response rate in excess of 20%. We ran our most recent survey in July 2012 to inform our draft WRMP, which we submitted in March 2013.
We convert the average unmeasured property consumption to a quantity per person by using an average household occupancy value (the average number of people occupying each property) derived from the ONS and validated for our operating area by a third party, comparing it with the data we received from our most recent survey. Demand is then quoted as litres per person (or per head) per day (PCC).
As a result of our investment in the unmeasured consumption monitor, we are confident in the accuracy of data reported. In addition, a third party consultant independently verifies the outputs. The quality of data is paramount and we take care to eliminate incorrect readings and outliers through our assessment process. We will continue our unmeasured consumption monitor throughout our universal metering programme as the number of measured households increases, and will consider how to maintain the relevance of the sample as the type of unmeasured properties changes (for example, we believe that the proportion of unmeasured properties on joint supplies or apartments will increase as our universal metering programme progresses).

Affinity Water Business Plan 2015 – 2020: Risk & Reward Submission 54
3.6.3 PC - Water available for use (WAFU)
a. Our PC to our customers
Our customers understand that there is a balance between the amount of water required to meet their consumption needs and the amount of water available to supply them. They appreciate that abstracting more water to meet demand can have a damaging effect on the environment. They support us making best use of the available resources, including purchasing and selling surplus water from neighbouring companies via bulk transfers.
Key stakeholders who will be monitoring our progress against this performance commitment include the EA and Natural England. We must therefore ensure that our measurement methods and data capture arrangements are fit for purpose and that our equipment is properly calibrated.
Water available for use PC
Our capacity or resilience in meeting demand is measured and reported as ‘water available for use’ (WAFU) and WAFU in turn is the combination of aggregate ‘deployable output’ of our system over a period of time minus the amount of time assets are not available for use – known as ‘outage’ which can be both planned and unplanned.
WAFU = Deployable output - Sustainability reductions - Climate change impacts - Outage
Outage is therefore an indicator of the serviceability of our assets which reflects our ability to respond and prevent loss of supply and WAFU in turn is a fundamental measure of serviceability of our assets and service to customers. We plan to invest to maintain ‘outage’ and serviceability at a stable level but customers could be put at risk if we were to invest less or unwisely on our asset maintenance. Accordingly, we are committing to ensure assets are kept in a stable condition to protect customers.
In AMP6, changes in WAFU will be dominated by changes in capacity arising from sustainability reductions and an assessment of these changes in our capacity are explored in detail in Section 4 of our WRMP and its measurement is detailed in an appendix to that document. This assessment was used to assess the optimum balance of investment for managing supply and demand. However as sustainability reductions are addressed on its own as another
Water available for use
Customers understand that there is a balance between the amount of water required to
meet their consumption needs and the amount of water available to supply them.
WAFU in turn is the combination of aggregate ‘deployable output’ of our system over a
period of time less outage, being the amount of water we can’t produce because our
assets are not available for use.
Outage is therefore an indicator of the reliability of our assets which reflects our ability to
respond and prevent loss of supply.

Affinity Water Business Plan 2015 – 2020: Risk & Reward Submission 55
performance measure in terms of assessment of a financial measure for this performance commitment we have focussed on the secondary change in WAFU arising from outage and therefore the change in cost and benefit that arises from a change in serviceability of our assets.
b. How we will be incentivised to deliver
The table below sets our rationale for the type of incentive we have chosen for average water use. We have confirmed that a financial incentive with penalties only is most appropriate for this PC.
Methodology question Our answer
Q1 Is there sufficient evidence that a financial incentive is appropriate?
Key components of WAFU are covered by leakage and average water use.
However, we do recognise that the level of outage of our assets is also critical for this measure, being an indicator of non-infrastructure serviceability.
Q2 Is there sufficient evidence that there is potential benefit from increased performance?
Yes, benefits from increased performance in terms of outage would result in greater headroom for the business and improved supply resilience for customers.
Q3 Is the outcome, on its own, highly valued by customers?
No, we do not believe we have evidence that customers value the level of outage in our business.
Table 3-I: Selecting the incentive type – Water available for use
At the Outcome level, our commitment is to maintain the existing level of outage so this will be a pass/fail penalty only incentive.
c. Calculation and calibration of financial incentives
We do not have WTP data to assess the penalty incentive rate that should apply for failing to achieve our PC for WAFU. Therefore, to set the penalty incentive rate we have used cost data.
In broad terms our analysis shows that if outage is higher than we propose we are exposed to higher risk and we would incur additional costs of £1.16m by allowing the serviceability of our assets to deteriorate, such that it reduces WAFU by 5.2 Ml/d year by the end of AMP6. The change in cost from the optimum position is the sum of operating cost savings of £2.05million plus potential GSS payments of £3.26million as we would be operating at a higher risk position. If we experienced more interruptions to supply the GSS payments would offset any savings. However, there is a possibility that we could avoid £2.05m costs without GSS payments if the higher operational risk does not result in more interruptions to supply. We are therefore

Affinity Water Business Plan 2015 – 2020: Risk & Reward Submission 56
proposing a financial penalty only incentive of £0.5million per year for lower WAFU such that penalties always exceed the potential savings and could total £2.5m over AMP6.
Our base expenditure for each of our commitment levels is the costs required to reduce WAFU to the 1067Ml/d level as required in our WRMP. This includes a value of 44.8Ml/d for outage (calculations for this are presented in Appendix 4D of our Business Plan submission, WRMP, Section 4.6). Using results from our portfolio investment optimiser we were able to model the variation of outage against the base case for different expenditure levels. Our unconstrained optimisation represents the lowest expenditure level and highest value for outage, where our strategy is significantly more reactive than our current practices and deterioration in service is observed. This unconstrained optimisation showed an increase in outage of 11.6%: this equates to an increase of 5.2 Ml/d (an increase of outage to 50.0Ml/d and a final WAFU figure of 1062Ml/d). This is consistent with performance level 1 in table W2a.
ODI design parameters
We have designed this penalty to apply ‘as a pass-fail’ incentive with a ‘way-point’ in the third year, 2017/18, and a final assessment in 2019/20 of AMP6. If we fail to achieve our performance commitment in each assessment year we will be subject to the maximum penalty for that year, regardless of how much we underperform the PC by.
This profile takes account of the variability in this measure due to external conditions. The variance between our AMP6 starting position and end position is 47.7Ml/d. We have set the third year target by taking into account that sustainability reductions are addressed on their own as another PC, and so we have focused on the secondary change in WAFU arising from outage and therefore the change in cost and benefit that arises from a change in serviceability of our assets.
The precise parameters for the leakage ODI are detailed in the table below.
ODI Parameter Presented
in BP Updated Proposal
Change from BP
AMP6 performance commitment year 5 (by 2020)
Ml/d 1067.0 1067.0 No change
AMP6 performance commitment year 3 (by 2018)
Ml/d n/a 1100.8 Third year ‘way-point’
Incentive rate - penalty £m n/a 0.5
0.5 is an average per year but note we have allocated 0.59 in year 3 and 1.91 in year 5
Penalty collar (average for AMP6)
Ml/d n/a n/a No change

Affinity Water Business Plan 2015 – 2020: Risk & Reward Submission 57
Penalty deadband Ml/d n/a n/a We have not included a penalty deadband in the ODI design
Timing of incentives Annual End of AMP6
This will be a pass/fail assessment in year 3 and year 5. Any penalties are then rolled up and applied at PR19 as a single adjustment to RCV
Table 3-J: Water available for use ODI parameters
d. RoRE analysis
The table below summarises the effective incentive range that could apply depending on how well we perform over AMP6. The effective incentive range is assumed to be the P10/P90 range as opposed to the theoretical maximum reward or penalty.
Avg. upside £m p.a.
Avg. upside % annual
revenue p.a.
Avg. RoRE
upside % RoRE p.a.
Avg. downside £m p.a.
Avg. downside % annual revenue
p.a.
Avg. RoRE
downside % RoRE
p.a.
Water available for use £0.00 0.00% 0.00% -£0.50 -0.18% -0.13%
Table 3-K: RoRE analysis – Water available for use ODI
e. Measuring WAFU
WAFU can be regarded as a measure of supply reliability and resilience by comparing actual headroom with planned headroom. This is similar to the reporting of our Security of Supply Index (SOSI), which we will continue to calculate on a quarterly basis, together with our water balance. WAFU is calculated from several components.
- The deployable output of our existing sources, plus
- The volume of bulk imports from neighbouring water companies, less
- The volume of bulk exports to neighbouring water companies, less
- The impact of climate change on deployable output, less
- Outage allowances, less
- The loss in deployable output due to sustainability reductions.

Affinity Water Business Plan 2015 – 2020: Risk & Reward Submission 58
Each of the component parts of WAFU is regularly monitored and calculated at a community level. We follow industry accepted best practices in our measurement methods (e.g. UKWIR reports), where available, and maintain records and explanations of our approach where there is no industry accepted guidance.
We report our WAFU in our Annual Return, which is audited by our Reporter.
3.6.4 PC – Sustainable abstraction reductions ODI
a. Our PC to our customers
Our customers have told us that they are concerned for the environment and that they wish us to reduce our abstractions where they are unsustainable. Key stakeholders who will closely monitor our progress against this performance commitment include the EA and Natural England, both of whom are represented on our CCG.
The EA is responsible for issuing licences for water abstractions from both groundwater and surface water. It also has the power to amend existing licences or to enter into operating agreements to limit abstraction where it is having a negative effect on the environment.
In the last 25 years, there has been greater awareness of the benefits of protecting the environment and ensuring that our rivers and other water habitats are maintained in good condition. As a result, we have been working closely with the EA to develop our sustainability reductions programme, based on comprehensive studies that we have undertaken as part of our National Environment Programme (NEP).
The table below is repeated from our revised WRMP and represents the volume of water that will be lost from our resource base (deployable output or DO).
Sustainable abstraction reduction
We will start AMP6 with a supply demand deficit – with no spare water in
a dry year.
We have a regulatory obligation to achieve sustainability reductions in
AMP6 of 42 Ml/d, this is a 4% loss of our resource base.
We have the highest rate of sustainability reductions in the industry
because we have the highest proportion of chalk streams in our supply
area.
The EA will also apply enforcement action in the event of non-compliance
with revised abstraction licences.

Affinity Water Business Plan 2015 – 2020: Risk & Reward Submission 59
Water Resource Zone
Reduction Average DO Ml/d Reduction Peak DO Ml/d
AMP6 AMP7 AMP6 AMP7
1 11.00 2.00 6.15 2
2 5.82 8.84 5.82 0
3 25.27 16.87 27.09 10.49
4 0 0 0 0
5 0 0 0 0
6 0 0 0 0
Sub-total (Central region)
42.09 27.71 39.06 12.49
7 (Southeast region)
0 0 0 .0
8 (East region)
0 0 0 0
Company Total 69.80 51.55
Table 3-L: Change in deployable output
We anticipate the reduction in our DO will be managed by formal licence variation by the EA. The EA will take enforcement action against us if we fail to comply with the amended licences. This could result in financial penalties from the EA as well as an adverse impact on our reputation.
We have worked to improve our relationships with local interest groups and NGOs who are pleased to see the scope and scale of our sustainability reductions programme for AMP6. We remain committed to delivering this programme and ensuring we maintain the supply/demand balance by delivering a mix of schemes including universal metering, leakage reduction, water efficiency and increasing our use of bulk supplies.
Sustainable abstraction reduction PC
We have been working in partnership with the EA since 1991 to investigate abstractions where these may be affecting the local chalk stream environment. During AMP5 we carried out detailed studies in a number of catchments and in conclusion of those studies agreed to make sustainability reductions during AMP6 and AMP7 in seven river catchments:
- River Beane – reduction of 16.18Ml/d
- River Mimram – reduction of 15.47Ml/d
- River Ver – reduction of 14.66Ml/d
- River Misbourne – reduction of 5Ml/d
- Upper River Lee – reduction of 10.49Ml/d
- River Gade – reduction of 6.4Ml/d
- Hughenden Stream – reduction of 1.6Ml/d
Details of proposals can be found in our WRMP Technical Report 1.4: Sustainability Reductions.

Affinity Water Business Plan 2015 – 2020: Risk & Reward Submission 60
This regulatory obligation corresponds to a loss of resource in AMP6 of 42 Ml/d. This represents a loss of 6% of our resource base which is the highest rate of sustainability reductions in the industry. We will implement the remaining 27 Ml/d savings in AMP7.
Implementing such measures will be a major challenge and will require substantial changes to our assets. These changes to reduce leakage and demand for water and replace water lost will cost totex £96 million (£79million capex and £17million opex). The challenge is exacerbated by the risk of further sustainability reductions arising from additional ‘unknown’ requirements to meet Water Framework Directive targets and potential loss of resource due to construction of HS2. We have agreed the risk from these new obligations will be carried by Affinity Water in AMP6 unless the quantum of cost exceeds the threshold for an Interim Determination.
b. How we will be incentivised to deliver
The table below sets our rationale for the type of incentive we have chosen for RSA. We have confirmed that a financial incentive with the possibility of a small reward if we can deliver our sustainability reductions agreed with the Environment Agency (EA) ahead of schedule. Equally we are including a symmetrical penalty if we fail to meet the timetable we have agreed.
We note that our sustainability reductions in AMP6 are the largest of any company in terms of proportion of water abstracted and is industry leading for AMP6. The outcome will also be subject to enforcement action by the EA if sustainability reductions are not achieved.
Methodology question Our answer
Q1 Is there sufficient evidence that a financial incentive is appropriate?
In our Business Plan we did not think there was sufficient evidence because customers are already protected as we must perform to this commitment because sustainability reductions are a statutory obligation.
However, we reconsidered this position reflecting on the pace of sustainability reductions, in response to the EA’s requests for us to accelerate the reductions.
Q2 Is there sufficient evidence that there is potential benefit from increased performance?
Yes, benefits from increased performance will result in more water being left in the environment.
Q3 Is the outcome, on its own, highly valued by customers?
Yes, we have WTP evidence proving this is highly valued by customers as well as local political and interest group interest.
Q4 Is there a reliable value for the outcome?
Yes, our abstraction, per site, per day is measured reliably and can be audited.
Table 3-M: Selecting the incentive type – sustainable abstraction reduction
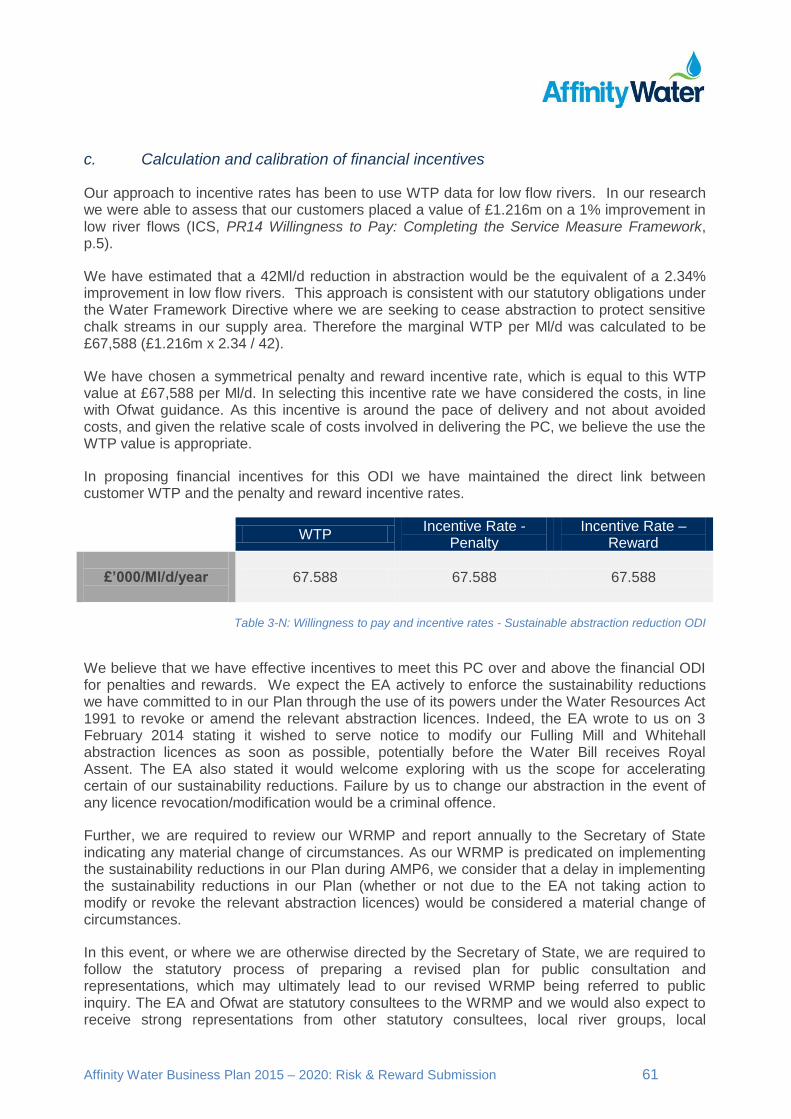
Affinity Water Business Plan 2015 – 2020: Risk & Reward Submission 61
c. Calculation and calibration of financial incentives
Our approach to incentive rates has been to use WTP data for low flow rivers. In our research we were able to assess that our customers placed a value of £1.216m on a 1% improvement in low river flows (ICS, PR14 Willingness to Pay: Completing the Service Measure Framework, p.5).
We have estimated that a 42Ml/d reduction in abstraction would be the equivalent of a 2.34% improvement in low flow rivers. This approach is consistent with our statutory obligations under the Water Framework Directive where we are seeking to cease abstraction to protect sensitive chalk streams in our supply area. Therefore the marginal WTP per Ml/d was calculated to be £67,588 (£1.216m x 2.34 / 42).
We have chosen a symmetrical penalty and reward incentive rate, which is equal to this WTP value at £67,588 per Ml/d. In selecting this incentive rate we have considered the costs, in line with Ofwat guidance. As this incentive is around the pace of delivery and not about avoided costs, and given the relative scale of costs involved in delivering the PC, we believe the use the WTP value is appropriate.
In proposing financial incentives for this ODI we have maintained the direct link between customer WTP and the penalty and reward incentive rates.
WTP Incentive Rate -
Penalty Incentive Rate –
Reward
£’000/Ml/d/year
67.588 67.588 67.588
Table 3-N: Willingness to pay and incentive rates - Sustainable abstraction reduction ODI
We believe that we have effective incentives to meet this PC over and above the financial ODI for penalties and rewards. We expect the EA actively to enforce the sustainability reductions we have committed to in our Plan through the use of its powers under the Water Resources Act 1991 to revoke or amend the relevant abstraction licences. Indeed, the EA wrote to us on 3 February 2014 stating it wished to serve notice to modify our Fulling Mill and Whitehall abstraction licences as soon as possible, potentially before the Water Bill receives Royal Assent. The EA also stated it would welcome exploring with us the scope for accelerating certain of our sustainability reductions. Failure by us to change our abstraction in the event of any licence revocation/modification would be a criminal offence.
Further, we are required to review our WRMP and report annually to the Secretary of State indicating any material change of circumstances. As our WRMP is predicated on implementing the sustainability reductions in our Plan during AMP6, we consider that a delay in implementing the sustainability reductions in our Plan (whether or not due to the EA not taking action to modify or revoke the relevant abstraction licences) would be considered a material change of circumstances.
In this event, or where we are otherwise directed by the Secretary of State, we are required to follow the statutory process of preparing a revised plan for public consultation and representations, which may ultimately lead to our revised WRMP being referred to public inquiry. The EA and Ofwat are statutory consultees to the WRMP and we would also expect to receive strong representations from other statutory consultees, local river groups, local

Affinity Water Business Plan 2015 – 2020: Risk & Reward Submission 62
politicians and the media should we not implement the sustainability reductions in our Plan. We therefore have strong reputational incentives to implement the sustainability reductions in our Plan, regardless of the timing of the EA’s revocation/modification of the abstraction licences.
ODI design parameters
We have not included a penalty ‘deadband’ or penalty ‘collar’ within the ODI design to ensure that we are fully incentivised to meet our PCs and customers are fully protected from any underperformance.
We have included a reward ‘cap’ at the P90 scenario to limit the financial exposure to our customers during the first three years of AMP6. During 2018/19 and 2019/20, our PC is set at the size of the programme and therefore only penalties for underperformance would apply.
The precise parameters for this ODI are detailed in the table below.
ODI Parameter Presented
in BP Updated Proposal
Change from BP
AMP6 performance commitment (by 2020)
Ml/d -42.1 -42.1 No change
Incentive rate - penalty £’000/Ml/d/year n/a 67.588 We have added a symmetrical financial reward and penalty
Incentive rate - reward £’000/Ml/d/year n/a 67.588
Penalty collar (average for AMP6)
Ml/d n/a 0.0 We have not included a penalty collar (in effect 0 Ml/d reduction)
Penalty deadband Ml/d n/a n/a We have not included a penalty deadband in the ODI design
Reward deadband Ml/d n/a n/a We have not included a reward deadband in the ODI design
Reward cap Ml/d n/a At P90 level
We have included a reward cap within the ODI design
Timing of incentives Annual AMP6
Assessed annually then rolled up and applied at PR19 as a single adjustment to

Affinity Water Business Plan 2015 – 2020: Risk & Reward Submission 63
RCV
Table 3-O: Sustainable abstraction reduction ODI parameters
The revised parameters for the sustainability reductions ODI are summarised in Figure 3-6 below.
Figure 3-6: Proposed sustainable abstraction reduction ODI design
d. RoRE analysis
The table below summarises the effective incentive range that could apply depending on how well we perform over AMP6. The effective incentive range is assumed to be the P10/P90 range as opposed to the theoretical maximum reward or penalty.
Avg. upside £m p.a.
Avg. upside % annual
revenue p.a.
Avg. RoRE
upside % RoRE p.a.
Avg. downside £m p.a.
Avg. downside % annual revenue
p.a.
Avg. RoRE
downside % RoRE
p.a.
Sustainable abstraction £0.33 0.12% 0.09% -£0.14 -0.05% -0.04%
Table 3-P: RoRE analysis - sustainable abstraction reduction ODI
-50
-40
-30
-20
-10
0
2015/16 2016/17 2017/18 2018/19 2019/20
Ave
rage
ab
stra
ctio
n r
esu
ctio
ns
per
an
nu
m -
Ml/
d
AMP6 cumulative target level Reward cap
Incentives apply to the acceleration or delay to the programme delivery
Retain performance commitment
Symmetrical reward and penalty rates £67.6k per Ml/d Reward cap

Affinity Water Business Plan 2015 – 2020: Risk & Reward Submission 64
e. Measuring sustainable abstraction reduction
We will be able to accurately measure the achievements showing compliance with new abstraction licence volumes that will be implemented by the Environment Agency before the beginning of AMP6.

Affinity Water Business Plan 2015 – 2020: Risk & Reward Submission 65
3.7 Customer Outcome (2) - Supplying high quality water you can trust
Drinking water quality standards are becoming more stringent over time and we must do more to maintain compliance with the UK standards. For example, some pipes in our network are made of lead, which can potentially be harmful and we will need to do more replacement work.
Changes in manufacturing and agricultural practices can introduce chemicals into the natural environment which can affect the quality of untreated water. We need to ensure that our treatment processes are able to effectively deal with emerging and past pollutants. We also need to take action where deposits of minerals build up in our pipes over time which can cause the water we supply to become discoloured.
Our customers trust the quality of the water, which they currently receive and expect us to ensure that we maintain the high quality of water at our customers’ taps. It is vitally important that customers are protected in all circumstances
3.7.1 PC - Compliance with water quality standards
a. Our PC to our customers
We will assure our customers that they will continue to receive safe and wholesome water by taking samples at our customers’ taps to detect any occurrence of detectable water quality parameters that could cause harm. We carry out random sampling at about 7500 individual properties each year involving hundreds of thousands of individual sample tests. The samples are analysed at our independently accredited laboratory in Staines.
Our water quality compliance is very high, between 99.95% and 99.97% of all samples. Our PC is to maintain 99.95% compliance in AMP6.
In AMP5 we are systematically cleaning about 1000km of pipes to remove iron and manganese deposits.
Water quality standards
We will assure our customers that they will continue to receive safe and
wholesome water by taking samples at our customers’ taps to detect any
occurrence of detectable water quality parameters that could cause harm.
We currently maintain a very high compliance of between 99.95% and
99.97% of all samples. Our PC is to maintain 99.95% compliance in
AMP6.
When we do experience current failures this often come from pesticides in
the water we abstract.

Affinity Water Business Plan 2015 – 2020: Risk & Reward Submission 66
In AMP6 we intend to replace about 30,000 lead communication pipes in those zones that currently have the highest number of failures against the new lead standard.
A large proportion of our current water quality compliance failures come from pesticides in ground water. At one of our treatment works in the Hatfield group of sources, we have a number of different water quality issues including high turbidity and pesticide concentrations. Among the pesticides found in the raw waters serving the works is metaldehyde, which is always present and regularly exceeds the Prescribed Concentrations at periods of heavy rainfall around the application period. Catchment management work has started with in the area, but the presence of metaldehyde in the aquifer itself means that this can only be considered to be a long term solution.
A more immediate solution is required to achieve our outcome for water quality. Innovative collaborative work by Affinity Water and Veolia Water has demonstrated that certain types of Powdered Activated Carbon (PAC) are capable of removing the Metaldehyde (and other associated pesticides). Laboratory scale pilot trials have identified that the concentration can be reduced to below the limit of detection from concentrations as high as 0.3 ug/l. The application of PAC can be carried out through a high rate clarification process, improving both the pesticide and the turbidity removal. We will implement a full scale PAC treatment process at this WTW.
Further work will take place on our River Thames works to identify the most appropriate solutions for pesticides, in particular metaldehyde, at these sites. The experience gained from operating a full scale unit at the WTW in the Hatfield group of sources will help to inform a decision for treatment at PR19.
Compliance with water quality standards PC
We will maintain our current high standards of performance with the measure achieving at least 99.95% compliance measured by mean zonal compliance. Meeting water quality compliance and ensuring we supply water that is wholesome is a regulatory requirement and therefore we have constrained the outcomes in all our investment optimisation scenarios.
Through our lead replacement programme and removal of metaldehyde from the final treated water we know the compliance will improve. We would, however, need significant expenditure on lead and pipe replacement into the future if we were to consistently perform at levels higher than 99.97% compliance.
b. How we will be incentivised to deliver
The table below sets our rationale for the type of incentive we have chosen for compliance with water quality standards. We have confirmed that a financial incentive with penalties only is most appropriate for this PC.
Methodology question Our answer
Q1 Is there sufficient evidence that a financial incentive is appropriate?
In our Business Plan we considered that customer interests were already protected by our statutory obligations on water quality and DWI regulation.
However, we could consider a financial incentive to strengthen the interests of customers.

Affinity Water Business Plan 2015 – 2020: Risk & Reward Submission 67
Q2 Is there sufficient evidence that there is potential benefit from increased performance?
No, customers are unlikely to recognise financial benefits from increased performance - customers believe that we should be providing high quality drinking water anyway.
Table 3-Q: Selecting the incentive type – compliance with water quality standards
c. Calculation and calibration of financial incentives
We do not have WTP data to assess the penalty incentive rate that should apply for failing to achieve our compliance with water quality standards. We have instead taken account of the direct and indirect costs in our investment modelling which reflect water quality service measures such as taste and odour, biological and chemical failure and discolouration.
Because we know that customers do not want any deterioration to their water quality we constrained all scenarios to meet current standards. We wanted to use Mean Zonal Compliance as a standard as this is recognised across the industry and we have an established method of measurement. We do not have WTP data to assess the penalty incentive rate that should apply for failing to achieve our compliance with water quality standards or cost based analysis from modelling using this measure.
Our penalty incentive is therefore based on a pragmatic approach of analysing what incentive we may have in reducing compliance by reducing our operating costs and therefore protecting customers by valuing a penalty at a level higher greater than any cost savings we could achieve.
We believe that we have effective incentives to meet this PC over and above the ODI financial penalties. This is because we have a legal duty under the Water Industry Act 1991 to supply water to our customers that is wholesome and to ensure, so far as reasonably practicable, that there is no deterioration in the quality of water supplied from time to time from each source or combination of sources. This duty is enforceable by the DWI, through the Secretary of State, and may ultimately lead to termination of our Instrument of Appointment if we fall short. In addition, the reputational risk associated with the public losing confidence in our ability to meet our water quality obligations is very significant indeed. This PC supports our Outcome of supplying high quality water you can trust. Our annual ‘value for money’ survey will test whether customers do indeed trust the high quality of the water we are supplying, so we are strongly incentivised to meet this PC.
Therefore, given these incentives we would still be heavily incentivised to limit any performance shortfall even if we have incurred the ‘hair trigger’ penalty.
Avoided cost
Reducing our safety margin in dosing concentrations of orthophosphoric acid, to keep lead levels below permissible levels, could save about £104k/year from an annual chemical cost of £580k/year. This is achieved by reducing current dosing from an average of 850micrograms/litre of water to the minimum target value of 700micrograms/litre of water. The effect of this would be to increase the risk of receiving non-compliant samples at customers’ taps and therefore reducing our overall % compliance
We also use granulated activated carbon to remove pesticides at 22 treatment sites. This media needs regular replacement or regeneration and we estimate that we need to spend £6.177m in

Affinity Water Business Plan 2015 – 2020: Risk & Reward Submission 68
AMP6 for this operation. Reducing the replacement rates could lead to a cost saving of 10% per year (£124k/year) but would increase the likelihood of pesticide failure in the final water.
The combination of the above two factors gives a potential saving of £228k/year but increases the risk of compliance failures for lead and pesticides. We have determined that an annual penalty of £0.720m for failing to achieve at least 99.95% mean zonal compliance demonstrates our clear commitment to achieving this performance commitment. This penalty rate is three times greater than any potential cost savings we could achieve in a single year.
ODI design parameters
We have designed this penalty to apply ‘as a pass-fail’ incentive to be assessed annually. If we fail to achieve our performance commitment in a year we will be subject to the maximum penalty for that year, regardless of how much we underperform the PC by.
The precise parameters for the compliance with water quality standards ODI are detailed in the table below.
ODI Parameter Presented
in BP Updated Proposal
Change from BP
AMP6 performance commitment
% 99.95 99.95 No change
Incentive rate - penalty £m/year n/a 0.72 Set at greater than 3 times the potential annual avoided cost
Penalty collar % n/a n/a No change
Penalty deadband % n/a n/a We have not included a penalty deadband in the ODI design
Timing of incentives Annual AMP6
This will be a pass/fail annual assessment with any penalties rolled up and applied at PR19 as a single adjustment to RCV
Table 3-R: Compliance with water quality standards ODI parameters
d. RoRE analysis
The table below summarises the effective incentive range that could apply depending on how well we perform over AMP6. The effective incentive range is assumed to be the P10/P90 range as opposed to the theoretical maximum reward or penalty.

Affinity Water Business Plan 2015 – 2020: Risk & Reward Submission 69
Avg. upside £m p.a.
Avg. upside % annual
revenue p.a.
Avg. RoRE
upside % RoRE p.a.
Avg. downside £m p.a.
Avg. downside % annual revenue
p.a.
Avg. RoRE
downside % RoRE
p.a.
Compliance water quality standards £0.00 0.00% 0.00% -£0.72 -0.26% -0.19%
Table 3-S: RoRE analysis – Compliance with water quality standards ODI
e. Measuring compliance with water quality standards
Our customers have told us that continuing to receive high quality water is important to them. We are committed to continuing our strong water quality performance and want our communities to be aware of the work we are undertaking to maintain that performance. We work closely with statutory bodies and local authorities to ensure that there is appropriate external scrutiny of our performance.
The measurement is mean zonal compliance. Mean zonal compliance (MZC) is an index DWI uses to measure water quality performance. MZC uses the results of up to 39 water quality parameters (we analyse for 35 of these) from regulatory samples taken at customers’ taps. The index is calculated by assessing each result against the Prescribed Concentration or Value (PCV) for each parameter in each water quality zone. Meeting water quality compliance and ensuring we supply water that is wholesome is a regulatory requirement and therefore we have constrained the outcomes in all our portfolio optimisation scenarios.
We use a range of treatment processes at our treatment works that are tailored to the individual raw waters to ensure that the water we put into supply is wholesome. We also maintain our reservoirs, towers and distribution systems so that the water does not deteriorate as it passes through them.
In order to identify changes in raw water quality, confirm the integrity of our treatment processes and distribution systems and meet our duties under the Water Supply (Water Quality) Regulations 2000, we carry out a wide range of sampling and analysis. All aspects of these activities are covered by controlled procedures and are accredited by the United Kingdom Accreditation Service (UKAS).
Our sampling programme is determined each year following a review of the previous year’s results and associated trends. The results of our compliance programme and raw water monitoring are reported to the Drinking Water Inspectorate (DWI) on a monthly basis. In July of each year, the Chief Inspector of the DWI publishes an annual report that summarises our compliance performance in the previous calendar year.
The unit is percentage compliance with standards per annum on a calendar year basis maintaining a performance of at least 99.95%
Any results that are non-compliant with the relevant standards lead to an investigation, remedial work if necessary and a report to the DWI. If any of these results indicate a potential risk to public health the issue is discussed with the local Public Health England and Environmental

Affinity Water Business Plan 2015 – 2020: Risk & Reward Submission 70
Health teams. If necessary, consumers are given the appropriate information to protect their health.
Our water quality samples will be linked with Navig-8 in the next phase of development so that we will be able to determine our performance by community and track emerging trends.
We report our water quality performance in our Annual Return, which is audited by our Reporter.
3.7.2 PC - Discoloration contacts per 1000 population
a. Our PC to our customers
We take the aesthetic appearance of the water we supply as importantly as its quality. Despite high quality treated water leaving our works we sometimes receive customer contact due to discolouration of water at their tap. This discolouration mainly arises from deposits in the pipes either from internal corrosion or historical build up of by-products from treatment over the years. One of these by-products is manganese and we have an undertaking at three of our works to reduce levels of manganese in the final water in AMP5.
The manganese build up already in the network is currently being managed through tighter control of the network especially during planned work. Our target company average discoloration rate is between 0.5 and our current reference level of 0.66 contacts/1000 population. We have 3 zones where historically we have experienced contacts of between 2.2 and 4.6 contacts/1000 population because of manganese and a significant proportion of all discolouration contacts come from these three zones. We are now systematically cleaning these zones using an innovative solution using ice pigging for the large diameter pipes (a process using technology from the food industry using ice to clean the pipes without the need to dig down and expose the pipe). Our use of this technique is the longest continuous planned ice pigging programme ever attempted. We are able to clean about 150km of the trunk main network in this manner at significantly lower costs of traditional methods and with minimum disruption to customers.
Discoloration contacts per 1000 population
We take the aesthetic appearance of the water we supply as importantly
as its quality.
Discolouration mainly arises from deposits in the pipes either from internal
corrosion or historical build up of by-products from treatment over the
years.
One of these by-products is manganese and we have an undertaking at
three of our works to reduce levels of manganese in the final water in
AMP5.

Affinity Water Business Plan 2015 – 2020: Risk & Reward Submission 71
In addition to the systematic cleaning of the 3 high manganese zones we are targeting more localised flushing of our pipes in two zones to remove aluminium build up. We are using new software “Optiflush” to optimise the flushing operations.
Discoloration contacts per 1000 population PC
We will maintain the low numbers of discolouration contact of 0.66/1000 population per year and following the large scale systematic cleaning programme for the removal of manganese we will continue to target high risk local areas where deposits could have built up in our pipes and remove these through targeted flushing.
b. How we will be incentivised to deliver
The table below sets our rationale for the type of incentive we have chosen for compliance with water quality standards. We have confirmed that a financial incentive with penalties only is most appropriate for this PC.
Methodology question Our answer
Q1 Is there sufficient evidence that a financial incentive is appropriate?
In our Business Plan submission we considered that customer interests were already protected by our statutory obligations on water quality and DWI regulation.
However, we could consider a financial incentive to strengthen the interests of customers.
Q2 Is there sufficient evidence that there is potential benefit from increased performance?
No, customers are unlikely to recognise financial benefits from increased performance - customers believe that we should be providing high quality drinking water anyway.
Table 3-T: Selecting the incentive type – customer contacts for discolouration
c. Calculation and calibration of financial incentives
We have calculated our financial penalty rate based upon our customers’ WTP valuation. In our research we were able to assess that our customers placed a value of £49 per property on avoiding a notable discolouration/aeration event (ICS, PR14 Willingness to Pay: Completing the Service Measure Framework, p.23). This valuation is based upon a temporary issue and assumes an impact that lasts for 3 days on average.
We forecast that in 2015/16 we will have 1,479,625 connected properties with a population served of 3,636,457 (Business Plan data table W4). This represents a ratio of 2.46 people to each household. Therefore the willingness to pay value per indexed (1000 / population) customer contact is £0.438m (£49 x 2.46 x 3,636,457/1000).

Affinity Water Business Plan 2015 – 2020: Risk & Reward Submission 72
In revising this ODI we have maintained the direct link between customer WTP and the penalty incentive rates.
WTP Incentive Rate -
Penalty
£m per indexed
contact
0.438 0.438
Table 3-U: Willingness to pay and incentive rate – customer contacts for discolouration
ODI design parameters
This is a penalty only financial incentive. We have included a penalty ‘collar’ at 1.30 indexed customer contact. This is approximately twice our AMP 6 performance commitment and equates to a maximum penalty of £0.280m per annum. We have not included a penalty ‘deadband’ within the incentive design.
The precise parameters for the customer contacts - discoloration ODI are detailed in the table below.
ODI Parameter Presented
in BP Updated Proposal
Change from BP
AMP6 performance commitment
Nr/1000/popn. 0.66 0.66 No change
Penalty incentive rate £m/indexed contact
n/a 0.438 We have included a penalty equal to customers’ WTP
Penalty collar Nr/1000/popn n/a 1.30 We have included a penalty collar at around twice our PC
Penalty deadband Nr/1000/popn n/a n/a We have not included a penalty deadband in the ODI design
Timing of incentives Annual AMP6
This will be a pass/fail annual assessment with any penalties rolled up and applied at PR19 as a single adjustment to RCV
Table 3-V: Customer contacts for discolouration ODI parameters

Affinity Water Business Plan 2015 – 2020: Risk & Reward Submission 73
The revised parameters for the ODI are summarised in Figure 3-7 below.
Figure 3-7: Proposed ‘customer contacts for discolouration‘ ODI design
d. RoRE analysis
The table below summarises the effective incentive range that could apply depending on how well we perform AMP6. The effective incentive range is assumed to be the P10/P90 range as opposed to the theoretical maximum reward or penalty.
Avg. upside £m p.a.
Avg. upside % annual
revenue p.a.
Avg. RoRE
upside % RoRE p.a.
Avg. downside £m p.a.
Avg. downside % annual revenue
p.a.
Avg. RoRE
downside % RoRE
p.a.
Customer contacts for discoloration £0.00 0.00% 0.00% -£0.28 -0.10% -0.07%
Table 3-W: RoRE analysis – Customer contacts for discolouration ODI
e. Measuring discoloration contacts per 1000 population
We report discolouration contacts per 1000 population to the DWI yearly and have to provide individual reports whenever single events exceed 50 contacts. We have an established and auditable procedure for measuring and reporting contacts.
Our preference is that our monitoring systems are such that we are notified of any water quality issues before our customers become aware so that we may take the appropriate remedial
0.00
0.20
0.40
0.60
0.80
1.00
1.20
1.40
2010/11 2011/12 2012/13 2013/14 2014/15 2015/16 2016/17 2017/18 2018/19 2019/20
Cu
sto
mer
co
nta
cts
for
dis
colo
ura
tio
n n
r/1
00
0/p
op
ula
tio
n
AMP5 Reference level AMP6 Performance Commitment
Current performance Penalty collar
Penalty collar
Retain performance commitment
Penalty incentive rate £4.38k per 0.01 indexed contacts
No penalty deadband

Affinity Water Business Plan 2015 – 2020: Risk & Reward Submission 74
action. However, this might not always be the case as the cause of the water quality issue may not be as a result of our action or inaction, so we take each customer contact about water quality seriously.
All written (letter, fax and email) and verbal (telephone) communications about the quality of water we supply are logged on our Hi-Affinity billing system under a ‘W’ code. The member of staff raising the code is empowered to generate an action, a call back and/or schedule an appointment by a Customer Service Technician (CST) and/or a Water Quality Sampler to investigate the concern raised in the community. During these customer visits, we investigate the customer’s concerns and often take water quality samples. When the analysis is completed our teams give feedback to the customer regarding the results, their meaning and what remedial action needs to be taken.
All customer contact queries are monitored in real time on the basis of geographic locations, which we can map on Navig-8 and review to determine any trends that could require further investigation. More than three customer concerns/reports in one water supply zone within 24 hours will generate a ‘cluster’ report to highlight a point of interest for further investigation. This system is designed to identify any emerging operational issues such discoloration arising from a burst water main. The cluster report is emailed to senior managers in all operational departments to trigger a rapid response.
During an on-site inspection, our CST will identify the nature of the concern together with its likely cause and what the required course of action should be. Our CSTs are empowered to initiate a job to address the problem, e.g. undertake mains flushing, or rezone an area. If the work requires a more substantial response, the matter is handled via our Water Quality Scientists.
Our team of Water Quality Scientists is explicitly responsible for collating all ‘W’ QOS queries monthly to assess issues and trends. Analysing customer contact data and identifying issues from it was a key component of our PR09 “Q” submissions for mains cleaning in the zones supplied from our Roydon and Blackford water treatment works. Our Water Quality team reports any exceptions through to our Executive management Team and Board and instigates any actions necessary to maintain compliance with drinking water regulations. All reports are collated in our annual report to the Drinking Water Inspectorate and are subject to external audit by our Reporter.
All water quality compliance sample results are published in our public register and are available for customers to view on our company website. From 2015, we will collate key water quality compliance results for each community via Navig-8 and we will publish them on our website. We will include publication of key water quality performance in our monthly community performance report and we will seek specific feedback from customers under our regular value for money survey.
We will continue to maintain regular dialogue and liaison with the DWI, EA, local authorities (EHOs), Public Health Authorities and neighbouring water companies.

Affinity Water Business Plan 2015 – 2020: Risk & Reward Submission 75
3.8 Customer Outcome (3) - Minimising disruption to you and your community
Our key challenge in minimising disruption is maintaining and replacing an ageing network of pipes over 16,500km long. Most of our pipes are located in the highway and we must achieve a balance between the work we carry out repairing and renewing these pipes and disruption to the local community.
Less predictable weather patterns, associated with climate change, and extremes of weather can put immense stress on our network. We also need to protect our assets from natural disaster such as flooding, but also from theft, vandalism and other security risks.
Our research suggests that only a small proportion of customers had experienced disruption to their water service. As such, disruption was not a particular concern for customers who often saw maintenance work as a necessity. However, potentially prolonged periods of interruptions to their water service were a concern for customers.
3.8.1 PC - Unplanned interruptions to supply over 12 hours
a. Our PC to our customers
All large scale unplanned interruptions to supply are caused by failure of the strategic large pipelines (trunk mains). In most cases we can mitigate the impact on customers from a burst by supplying customers from adjacent and interconnected networks while the repair is being carried out. However, in some instances we cannot supply from adjacent or interconnected networks and we calculate, from our hydraulic criticality modelling, that we have about 4500 individual sections of pipe that could affect 300 properties or more if they were to burst. Our analysis also tells us that 1 in 12 bursts could cause unplanned interruptions to supply to more than 2000 properties.
The physical location of a burst can cause further complications which can cause a repair to take longer than normal. These complications are typically: the location of gas or power cables obstructing access to our infrastructure; trees and street furniture which may need to be removed in order to expose a main; or the burst may occur on a busy highway requiring local highways authority permission to close partially or entirely. For example, in 2010-11 two incidents caused us to have unplanned interruptions to supply over 12 hours to 1189 properties in the Harrow/Wembley area. The primary cause was corrosion causing failure of the main but each repair was extremely difficult to carry out.
Unplanned interruptions to supply over 12 hours
Our customers have told us that they appreciate there could be an
unplanned interruption to their water supply, for example if there is a burst
in our pipe network.
Our performance against this metric has improved over AMP5 and we
remain committed to continuing this downward trend.

Affinity Water Business Plan 2015 – 2020: Risk & Reward Submission 76
Instead of replacing expensive pipelines that are in relatively good condition but may burst, we will be reducing risk through our trunk main “hotspot” programme. This focusses more on risk mitigation, but this is a lengthy process spread over the next 3 AMP periods, from 2015 to 2030.
We will concentrate on reducing the times that customers are affected on all our repairs, not only those ones that could be greater than 12 hours in duration. Due to the number of potential problems we may encounter, when we repair pipelines, it is possible that a number of customers go without water for between 10 and 12 hours. We call these near misses and we average about 800 of these per year.
Unplanned interruptions to supply over 12 hours PC
As explained above, we usually have very low numbers greater than 12 hour duration interruptions. However we do rarely experience some exceptional events such as in 2010-11. Through our maintenance programmes and “hotspot” programme of work we will gradually reduce the likelihood of these large events happening so that we will continue to operate at current levels of 320 interruptions per year or better and will negate entirely the likelihood of large scale interruptions or be in penalty.
b. How we will be incentivised to deliver
In revising our ODI package we have decided to include a positive financial incentive where the number of properties affected by a supply interruption for more than 12 hours is very low, well below our AMP6 target and consistent with some of the best in the industry. This is consistent with customer research that told us that customers value avoiding longer-term supply interruptions, more than 12 hours, to a much greater extent than interruptions of a shorter duration.
The table below sets our rationale for the type of incentive we have chosen. We have applied financial incentives to reinforce customer protection should we fail to deliver the PCs set out in plan.
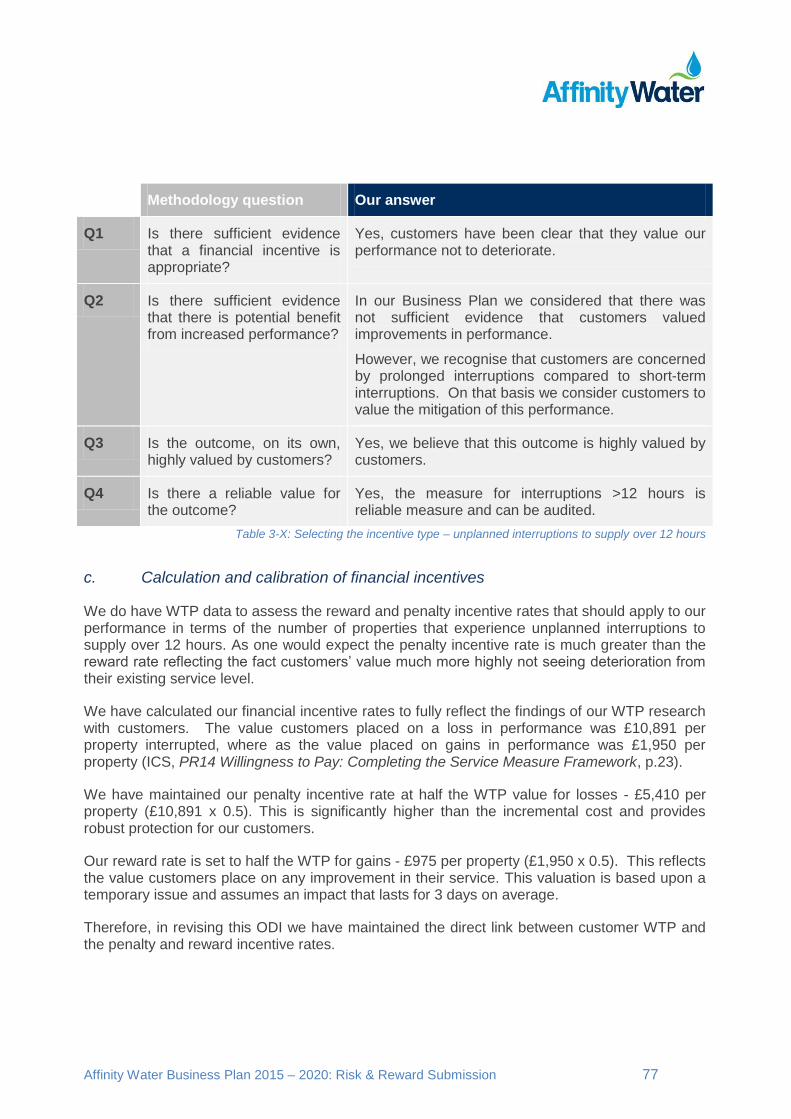
Affinity Water Business Plan 2015 – 2020: Risk & Reward Submission 77
Methodology question Our answer
Q1 Is there sufficient evidence that a financial incentive is appropriate?
Yes, customers have been clear that they value our performance not to deteriorate.
Q2 Is there sufficient evidence that there is potential benefit from increased performance?
In our Business Plan we considered that there was not sufficient evidence that customers valued improvements in performance.
However, we recognise that customers are concerned by prolonged interruptions compared to short-term interruptions. On that basis we consider customers to value the mitigation of this performance.
Q3 Is the outcome, on its own, highly valued by customers?
Yes, we believe that this outcome is highly valued by customers.
Q4 Is there a reliable value for the outcome?
Yes, the measure for interruptions >12 hours is reliable measure and can be audited.
Table 3-X: Selecting the incentive type – unplanned interruptions to supply over 12 hours
c. Calculation and calibration of financial incentives
We do have WTP data to assess the reward and penalty incentive rates that should apply to our performance in terms of the number of properties that experience unplanned interruptions to supply over 12 hours. As one would expect the penalty incentive rate is much greater than the reward rate reflecting the fact customers’ value much more highly not seeing deterioration from their existing service level.
We have calculated our financial incentive rates to fully reflect the findings of our WTP research with customers. The value customers placed on a loss in performance was £10,891 per property interrupted, where as the value placed on gains in performance was £1,950 per property (ICS, PR14 Willingness to Pay: Completing the Service Measure Framework, p.23).
We have maintained our penalty incentive rate at half the WTP value for losses - £5,410 per property (£10,891 x 0.5). This is significantly higher than the incremental cost and provides robust protection for our customers.
Our reward rate is set to half the WTP for gains - £975 per property (£1,950 x 0.5). This reflects the value customers place on any improvement in their service. This valuation is based upon a temporary issue and assumes an impact that lasts for 3 days on average.
Therefore, in revising this ODI we have maintained the direct link between customer WTP and the penalty and reward incentive rates.

Affinity Water Business Plan 2015 – 2020: Risk & Reward Submission 78
WTP Incentive Rate -
Penalty Incentive Rate –
Reward
£’000/prop/year
10.820 5.410 0.975
Table 3-Y: Willingness to pay and incentive rates – unplanned interruptions to supply over 12 hours ODI
ODI design parameters
We have modified the design of this ODI to strengthen customer protection and to include a small reward if we achieve a challenging stretch level of performance. We have maintained our AMP6 PC at the same level as for AMP5.
We have included a small reward within our ODI design and a reward deadband. To go beyond the deadband and earn this reward we would need to achieve a ‘best ever’ level of performance of 134 properties affected or beyond - our previous best ever performance was 136 properties affected in 2009/10.
In addition, we have reduced the level of the penalty deadband to be symmetric with the reward deadband. Previously, the penalty deadband was consistent with our upper limit for serviceability that exists today at 880 properties. We have lowered this significantly to 505 properties to enhance customer protection. We have lowered the penalty collar to maintain the same overall maximum scale of penalties and to maintain the balance of our package of ODIs.
In addition, we have considered alternatives such as capping the number of properties per individual event and looking at averages over the five years. However, in the interest of simplicity and transparency we have opted for a symmetrical deadband with the reward and a penalty collar. The properties affected will continue to receive enhanced GSS compensation whether they are below or above the penalty cap.
The precise parameters for the ODI are detailed in the table below.
ODI Parameter Presented
in BP Updated Proposal
Change from BP
AMP6 performance commitment
Nr properties 320 320 No change
Incentive rate - penalty £’000/prop/year 5.410 5.410 No change
Incentive rate - reward £’000/prop/year n/a 0.975 We have included a small reward
Penalty collar
(*average for AMP6) Nr properties 1072* 775
We have reduced the scale of the penalty collar

Affinity Water Business Plan 2015 – 2020: Risk & Reward Submission 79
Penalty deadband Nr properties 802 505 We have significantly reduced the penalty deadband
Reward deadband Nr properties n/a 135
We have included a deadband for rewards at best ever performance level
Reward cap Nr properties n/a 0 We have not capped rewards (in effect 0 properties)
Timing of incentives Annual AMP6
Assessed annually then rolled up and applied at PR19 as a single adjustment to RCV
Table 3-Z: Unplanned interruptions to supply over 12 hours ODI parameters
The parameters for this ODI and summarised in figure 3-8 below.
Figure 3-8: Revised unplanned interruptions to supply over 12 hours ODI design
0
200
400
600
800
1000
1200
1400
2010/11 2011/12 2012/13 2013/14 2014/15 2015/16 2016/17 2017/18 2018/19 2019/20
Un
pla
nn
ed in
terr
up
tio
ns
>12
ho
urs
-n
r p
rop
erti
es
AMP5 Reference level AMP6 performance commitment Current performance
Penalty collar Penalty deadband Reward deadband
New penalty collar
No reward cap
Retain performance commitment
Penalty incentive rate £5.41k per propertyReward incentive rate £0.98k per property
Smaller penalty deadband
‘Best ever’ deadband for rewards

Affinity Water Business Plan 2015 – 2020: Risk & Reward Submission 80
d. RoRE analysis
The table below summarises the effective incentive range that could apply depending on how well we perform over AMP6. The effective incentive range is assumed to be the P10/P90 range as opposed to the theoretical maximum reward or penalty.
Avg. upside £m p.a.
Avg. upside % annual
revenue p.a.
Avg. RoRE
upside % RoRE p.a.
Avg. downside £m p.a.
Avg. downside % annual revenue
p.a.
Avg. RoRE
downside % RoRE
p.a.
Unplanned interruption >12 hrs £0.03 0.01% 0.01% -£1.46 -0.54% -0.39%
Table 3-AA: RoRE analysis – unplanned interruptions to supply over 12 hours ODI
e. Measuring water unplanned interruptions to supply over 12 hours
Our measurement methods and data capture arrangements for this performance commitment are robust as we are only able to verify the duration of each unplanned interruption after a full review of the incident, which could include customer contact logs, valve operations and real time network telemetry.
Unplanned interruptions to supply over 12 hours, is a long-standing performance measure (Ofwat BoN ref BN1008). Although the measure has not been reported directly to Ofwat since the June Return of 2011, it is still an important component of the infrastructure serviceability assessment for use throughout the AMP5 period. Therefore, we have maintained all our systems for data capture, analysis, verification, reporting and audit. These systems will continue into the AMP6 period.
Any unplanned interruption to supply of three hours or more is added to our DG3 register. Once added to the register, each unplanned interruption incident is subject to a process of analysis to verify the start and end times and the numbers of properties affected. This analysis is undertaken by a manager from our Community Operations team and takes account of:
- the times and properties number recorded by the gang on the WMIS job sheet;
- valve operations and times recorded on GIS;
- customer calls of ‘no water’ and ‘low pressure’;
- notes recorded at the time on our ‘Bulletin Board’;
- pressures and flows recorded on data loggers at district meters and levels of service monitoring points; and
- additional information from staff involved in the incident e.g. spot pressure checks carried out.
The analysis and resultant conclusion is detailed in a ‘DG3 audit report’ sheet. Each sheet is independently reviewed by our Regulation team and filed on our networked SharePoint system.
The Regulation team also undertakes an analysis of each day’s calls from customers reporting ‘no water’. Any call from an area indicating that customers may have experienced an

Affinity Water Business Plan 2015 – 2020: Risk & Reward Submission 81
interruption to supply of three hours or more is noted and checked against the DG3 register. We also use our network telemetry to establish any unplanned interruptions to supply. Any potential incident not on already the register is added and subject to the verification process above. By this process we ensure the capture of supply interruption incidents that are not the result of mains shutdowns. This includes ‘one-off’ events, for example a boundary stopcock being left shut in error after a meter change.
Our performance against this metric is reported each week in the Weekly Management Report. This includes both the numbers of properties ‘verified’ and those still to be verified. Our Director of Community Operations owns this metric. Our performance is reported to the Board each month and to the Audit Committee each quarter in the Monitoring Plan.
The DG3 register is maintained by our Regulation team. The register, together with the underlying processes, are subject to audit by our Reporter. Although not identical in detail to the DG3 measure ref BN1008, unplanned supply interruptions are subject to the Guaranteed Standards of Service (GSS) regulations. The register process described above is used to ensure we are also compliant with legal obligations for GSS.
As supply interruptions are recorded by their geographic location, we are able to report separately for each of our eight communities. The register process allows also for the reasons for any failure to be recorded. We will plan to publish monthly a dashboard report on our website.
3.8.2 PC - Number of burst mains
a. Our PC to our customers
The condition of our pipeline network is assessed by recording the numbers of bursts that occur each year. Bursts also are a measure of how well the network performs in providing the required service to customers. Bursts cause interruptions to customers, leakage, flooding and disruption especially to road users. Bursts are therefore a key indicator and one which we can commit to a performance of ongoing stability.
Number of burst mains
We appreciate that burst mains present an inconvenience to our
customers, which could include their water supply being interrupted or
their travel plans being affected by our repair works.
Bursts also are a measure of how well the network performs in providing
the required service to customers.
By 2011-12 we had successfully reversed a rising trend in bursts,
achieved through sophisticated and robust modelling to target those mains
needing replacement.

Affinity Water Business Plan 2015 – 2020: Risk & Reward Submission 82
At PR04 we recognised the need to increase expenditure on distribution mains renewal in our Central region to reduce the then upward trend of bursts and their impact on service and serviceability. Renewals levels in the three AMP periods leading to AMP4 were mainly derived from historical levels of expenditure. For AMP4 we made a case to increase our renewal levels to 0.9% of the distribution mains from historical levels of around 0.4%. Our objectives for renewal were to arrest the current deterioration in burst numbers over the AMP4 period and reduce these numbers over the AMP5 period to achieve a more stable infrastructure and the reference level set by Ofwat.
By 2011-12 we had successfully reversed the trend in bursts and achieved the Ofwat reference level ensuring that our infrastructure was classified as ‘stable’. The target was achieved using the programme devised and at the costs originally estimated with efficiencies now being achieved on cost that are being applied to our totex in AMP6.
We achieved this using sophisticated and robust modelling to target those mains needing replacement and integrated into a practical design process. We will continue to innovate in this area in order to ensure that we remain efficient in the maintenance of our infrastructure and it remains stable for future generations.
Number of burst mains PC
Our underlying PC is that we will keep our pipeline assets stable over the next AMP period and beyond by renewing pipelines cost effectively. We will only renew pipes that are necessary (from our deterioration models and targeting process) but will improve the network to improve pressure management and reduce the risk of future customer interruptions where we can.
b. How we will be incentivised to deliver
We have concluded that we will retain the ODI set out in our Business Plan and will not make any changes.
The table below sets our rationale for the type of incentive we have chosen. We have applied financial incentives to reinforce customer protection should we fail to deliver the PCs set out in plan.
Methodology question Our answer
Q1 Is there sufficient evidence that a financial incentive is appropriate?
Yes, customers have been clear that they value our performance not to deteriorate.
Q2 Is there sufficient evidence that there is potential benefit from increased performance?
We do not believe there is sufficient evidence that customers recognise an improvement in service.
Table 3-AB: Selecting the incentive type – number of burst mains
c. Calculation and calibration of financial incentives
We do not have WTP data to assess the penalty incentive rate that should apply for failing to achieve a level of bursts below our performance commitment. Our approach to incentive rates

Affinity Water Business Plan 2015 – 2020: Risk & Reward Submission 83
has been to estimate the consequence cost of bursts that we also use in our investment modelling methodology.
The consequential costs of failures of our pipelines are built up from our service measures framework and the costs to repair any failure. These costs vary with the size, location and criticality of the pipe. Our service measure framework has several consequences of failure, from interruption to supply, water quality issues and media events. We assign where possible company specific costs to each of these consequences (response to customers, clean up operations, water quality mitigation, public relations etc).
We know that all asset failures do not necessarily cause a service failure, i.e. not all bursts cause an interruption to supply. Therefore we use a likelihood of consequence factor for each service measure which has been calibrated using our own historical performance data. Also, due to the configuration of the network we know that some bursts will affect significantly more people than others. Through our hydraulic modelling we were able to assess the number of customers that would be affected by a particular mains failure. This is then used to size the potential service measure failure, i.e. the number of customers isolated by a burst.
Repair costs are obtained from our financial systems. We also include the social and environmental cost of bursts from the impact of traffic disruption and operational carbon. These social and environmental costs are included in our modelling, but are not included in our direct costs. Typically the actual cost of a burst can vary from £2500 for a burst on a 100mm diameter pipe in a rural grassland environment and supplying 10 properties to £21,200 for a burst on a 200mm diameter pipe in a sub-urban footpath supplying 100 properties to £203,000 for a burst on a pipe in an urban road supplying 10,300 properties.
The incentive rate chosen followed the Ofwat methodology using incremental cost data in the absence of customer valuation data.
ODI design parameters
We have retained the design of the number of bursts mains ODI as it already provides customer protection if our performance is not as good as we plan to deliver. Our underlying PC remains constant from the AMP5 period – this is consistent with our customer research that found that customers did not wish to pay for improvements but they did wish to avoid any deterioration in service standards. We are also retaining a penalty deadband in line with our AMP5 serviceability upper limit of 3,500.
The precise parameters for the ODI are detailed in the table below.
ODI Parameter Presented
in BP Updated Proposal
Change from BP
AMP6 performance commitment
Nr bursts 3100 3100 No change
Incentive rate - penalty £’000/burst 2.665 2.665 No change
Penalty collar Nr bursts 4350 4350 No change

Affinity Water Business Plan 2015 – 2020: Risk & Reward Submission 84
Penalty deadband Nr bursts 3500 3500 No change
Timing of incentives Annual AMP6
Assessed annually then rolled up and applied at PR19 as a single adjustment to RCV
Table 3-AC: Number of burst mains ODI parameters
The parameters for this ODI and summarised in Figure 3-9 below.
Figure 3-9: Number of burst mains ODI design
d. RoRE analysis
The table below summarises the effective incentive range that could apply depending on how well we perform over AMP6. The effective incentive range is assumed to be the P10/P90 range as opposed to the theoretical maximum reward or penalty. It shows that we do not expect to pay penalties in 90% of outcomes.
1500
2000
2500
3000
3500
4000
4500
5000
2010/11 2011/12 2012/13 2013/14 2014/15 2015/16 2016/17 2017/18 2018/19 2019/20
Nu
mb
er o
f b
urs
t m
ain
s -
nr
Current performance AMP6 performance commitment
AMP5 Reference level Penalty collar
Penalty deadband
Retain penalty collar
Retain performance commitment
Retain penalty deadband

Affinity Water Business Plan 2015 – 2020: Risk & Reward Submission 85
Avg. upside £m p.a.
Avg. upside % annual
revenue p.a.
Avg. RoRE
upside % RoRE p.a.
Avg. downside £m p.a.
Avg. downside % annual revenue
p.a.
Avg. RoRE
downside % RoRE
p.a.
Number of burst mains £0.00 0.00% 0.00% £0.00 0.00% 0.00%
Table 3-AD: RoRE analysis – Number of burst mains ODI
e. Measuring numbers of burst mains
The number of burst mains gives us an indication of the ‘health’ of our assets and as this metric assists us in our investment decisions, we must understand the root cause of each burst and capture this information in our systems.
For this metric, we will be reporting against the Ofwat definition of a mains burst contained in BoN ref BN1225. This will be a simpler measure to report against than that used for the infrastructure serviceability in our Central region through AMPs 3, 4 and 5, which has included ferrule leaks in the count.
Mains bursts will be identified through unique coding in our job management system. During 2014/15, we will be replacing the current ‘WMIS’ job management system with a new system that will allow greater flexibility in design for future needs of management and regulatory information.
The correct coding of individual jobs in the job management system is crucial to reporting data that is reliable, accurate and complete. Our means for achieving this are:
- A job management system that allows for specific coding of ‘mains burst’ jobs;
- Clear guidance and training for operational staff on what is and what is not a ‘mains burst’ under BN1225 and the correct job codes to use;
- Ongoing monitoring of job records and codes to ensure guidance is understood and being followed correctly;
- Audit sheets for any change to job codes after completion by the repair gang.
Bursts performance is the responsibility of our Director of Community Operations. Burst numbers are reported by the Regulation team each week in the Weekly Management Report, to the Board each month and to the Audit Committee each quarter in the Monitoring Plan.
There is an audit trail for the compilation of burst numbers. Burst numbers and the processes behind their compilation will be subject to audit by our Reporter. All bursts are recorded on our GIS and we are able to report separately for each of our eight communities. We plan to publish monthly a dashboard report on our website.

Affinity Water Business Plan 2015 – 2020: Risk & Reward Submission 86
3.8.3 PC - Affected customers not notified of planned interruptions
a. Our PC to our customers
Our customers have told us that they understand their water supply could be interrupted as a result of essential maintenance works, but that failing to be notified is unacceptable. We understand that ensuring our communities receive information about our plans in advance is key to reducing unwanted contact. Consideration for customers affected by our planned works is a key component of our planning phase of any project, and we are proud that the number of affected customers not notified of planned interruptions has significantly reduced during AMP5.
Affected customers not notified of planned interruptions PC
Our underlying PC is that we will keep the number of events stable over the next AMP and beyond at or less than 110 events. We recognise that in an ideal world we would have no events at all. We have not made our PC zero as we know that it is unlikely we will achieve this each year. We believe the PC of 110, that is consistent with our most recent 2012/13 performance, will be a challenge to sustain. This is around 50% less than the number of events we averaged between 2008-09 and 2011-12 and a 90% reduction on 2007-08.
b. How we will be incentivised to deliver
We consider that enhanced GSS compensation payments protect customers and incentivise our performance sufficiently well to not warrant an additional financial penalty ODI. GSS compensates those customers directly affected by not being notified of planned interruptions.
The table below sets our rationale for the type of incentive we have chosen.
Affected customers not notified of planned interruptions Our customers have told us that they understand their water supply could
be interrupted as a result of essential maintenance works, but that failing to
be notified is unacceptable.
In the unlikely event one of our customers experiences an interruption for
which they received no notification, we thoroughly investigate the incident
and implement lessons learned to prevent future recurrence.

Affinity Water Business Plan 2015 – 2020: Risk & Reward Submission 87
Methodology question Our answer
Q1 Is there sufficient evidence that a financial incentive is appropriate?
No, we believe that the enhanced GSS compensation mechanism protects customer interests.
Q2 Is it possible and appropriate to measure performance for reputational incentives?
Yes, we believe it is appropriate.
Table 3-AE: Selecting the incentive type – affected customers not notified of planned interruptions
c. Calculation and calibration of financial incentives
While we regard this as reputational incentive we do currently operate a level of enhanced GSS compensation payment of £50 per property per event.
Our record shows that we take minimising the incidence of failure to notify our customers very seriously, particularly as this is an avoidable cost and completely within our control to get ‘right first time’. We are proud that the number of affected customers not notified of planned interruptions has significantly reduced. For example, in 2007-08 we had a total of 1,058 events that was reduced to 216 events by the end of 2010-11. In 2012-13, our most recent complete year for which we have records, we had 109 events. This level of event is the basis for our AMP6 PC of 110.
d. RoRE analysis
As this is a reputational incentive under Ofwat’s methodology we have not included potential levels of GSS payment in any financial analysis of RoRE.
e. Measuring affected customers not notified of planned interruptions
For this measure, we will be reporting the number of GSS ‘events’ as defined in BoN ref GSS00010. Therefore, ‘affected customers’ will be as defined in The Water Supply and Sewerage Services (Customer Service Standards) Regulations 2008.
The majority of planned interruptions to supply arise from our mains renewals programme, for which there is a well established process for DG3 reporting and identification of GSS events, described below. A small proportion of planned interruptions occur as a result of other miscellaneous activities, for example a fire hydrant replacement. We recognise that our WMIS job management system does not allow for the capture of all necessary information on planned interruptions and that also the manual ‘work around’ processes do not provide comprehensive assurance for this measure. This will be addressed with the replacement job management system that is due to be implemented in 2014/15.
Our performance against this measure and the underlying systems will be audited by our Reporter, and will be reported monthly to the Board.
Supply interruptions are recorded by geographic location/address and we are able to report separately for each of our eight communities. We plan to publish monthly a dashboard report on our website.

Affinity Water Business Plan 2015 – 2020: Risk & Reward Submission 88
In the unlikely event that we identify that a customer was not warned of a planned interruption to their supply, we will undertake a detailed investigation, which includes the use of interruption notification logs and our GIS to establish if the failure was caused by our delivery partner, the Affinity Water project team or if it was an unforeseen event.
In addition, our delivery partner provides our Regulation team with a quarterly report of all supply interruptions associated with their work. Reported GSS events are reconciled to the quarterly supply interruptions records provided by the mains renewal contractor. This reconciliation is carried out by the Regulation team.
The contracts we have with our contractors also include penalties associated with failure to notify customers of planned interruptions and our ability to demand a remediation plan should our audits identify non-conformances with data records. In the event one of our customers experiences an interruption for which they received no notification, we thoroughly investigate the incident and implement lessons learned to prevent future recurrence.
3.8.4 PC - Planned works taking longer to complete than notified
a. Our PC to our customers
Our design review process carefully considers how we can undertake essential renewal works without affecting our customers’ water supplies. We have increased our use of trenchless techniques, so that fewer customers are affected by planned interruptions, and those that are are only affected for a short duration as we transfer their supply pipe to the new water main. We know that our customers do not appreciate their water supply being interrupted for a period of time longer than that they are notified of, so real-time measurement methods and data capture arrangements to understand progress are essential to be able to make the right decisions for our customers and their community.
Planned works taking longer to complete than notified PC
Our underlying PC is that we will keep the number of events stable over the next AMP and beyond at or less than 550 events. We believe that a PC of 550, that is consistent with our
Planned works taking longer to complete than notified
We know that our customers do not appreciate their water supply being
interrupted for a period of time longer than that they are notified of.
We have increased our use of trenchless techniques, so that fewer
customers are affected by planned interruptions, and those that are are
only affected for a short duration.
Real-time measurement methods and data capture arrangements to
understand progress are essential to be able to make the right decisions
for our customers and their community.

Affinity Water Business Plan 2015 – 2020: Risk & Reward Submission 89
recent performance will be challenging to achieve as planned works taking longer to complete than notified is not fully within our control and subject to a range of factors including that works can sometimes be less straightforward than we have planned for.
b. How we will be incentivised to deliver
We consider that enhanced GSS compensation payments protect customers and incentivise our performance sufficiently well to not warrant an additional financial penalty ODI. GSS compensates those customers directly affected by planned works taking longer to complete than notified.
The table below sets our rationale for the type of incentive we have chosen.
Methodology question Our answer
Q1 Is there sufficient evidence that a financial incentive is appropriate?
No, we believe that the enhanced GSS compensation mechanism protects customer interests.
Q2 Is it possible and appropriate to measure performance for reputational incentives?
Yes, we believe it is appropriate.
Table 3-AF: Selecting the incentive type – planned works taking longer to complete than notified
c. Calculation and calibration of financial incentives
While we regard this as a reputational incentive we do currently operate a level of enhanced GSS compensation payment of £50 per property per event.
We have worked hard to ensure that the number of customers and GSS events occurring from planned works taking longer to complete than notified is kept as low as possible. Occasionally planned works do overrun. There are many reasons for this, which are not always directly within our control. Our recent performance shows this as the level of GSS events since 2007-08 has varied between 900 and 200 per year with no obvious trend. In 2012-13, our most recent complete year for which we have records, we had almost 542 events. This level of event is the basis for our AMP6 PC of 550.
We believe that continuing to use enhanced GSS compensation payments for failures against this PC is appropriate for a number of reasons:
- It acts as an effective financial incentive in itself. We have a strong financial incentive to minimise the number of payments by reducing the incidence of poor performance. We also experience indirect financial exposure under the SIM arrangements from the complaints, unwanted contacts and any adverse impact on the qualitative assessment that can arise from poor performance in this area. This offers additional protection for customers.
- It directly compensates those customers who experience the service failure rather than those that do not experience any poor service. We pay enhanced compensation at £50 per customer.

Affinity Water Business Plan 2015 – 2020: Risk & Reward Submission 90
- Our actual performance level for this PC show that the incidence of service failure is very low and we are planning for it to remain so. The risk of our performance levels deteriorating would be mitigated by strong shareholder and Board pressure to mitigate the financial risk and also the reputational risk given we have committed to reporting our reputational performance levels at the local level.
Therefore, we do not consider the imposition of an additional financial penalty or financial reward would be appropriate or proportionate in this case.
d. RoRE analysis
As this is a reputational incentive under Ofwat’s methodology we have not included potential levels of GSS payment in any financial analysis of RoRE.
e. Measuring Planned works taking longer to complete than notified
For this measure, we will be reporting the number of GSS ‘events’ as defined in BoN ref GSS00012. Therefore, ‘affected customers’ will be as defined in The Water Supply and Sewerage Services (Customer Service Standards) Regulations 2008.
The majority of planned interruptions to supply arise from our mains renewal programme, for which there is a well-established process for DG3 reporting and identification of GSS events, described below.
A small proportion of planned interruptions occur as a result of other miscellaneous activities, for example a fire hydrant replacement. We recognise that our WMIS job management system does not allow for the capture of all necessary information on planned interruptions and that also the manual ‘work around’ processes do not provide comprehensive assurance for this measure. This will be addressed with the replacement job management system to be implemented in 2014/15.
Our performance against this measure and the underlying systems will be audited by our Reporter, and is reported monthly to the Board. Supply interruptions are recorded by geographic location/address and we are able to report separately for each of our eight communities. We plan to publish monthly a dashboard report on our website.
In the event our contractors determine that the work has the potential to overrun, they will liaise with the Affinity Water project team to determine the best course of action. This may include making the work safe, restoring customers’ supplies and closing any excavations and returning at a later date (having pre-warned affected customers) to complete the works. We will also consider installing a temporary overland supply pipe, allowing work to continue and eliminating the need to return at a later date causing further disruption. This approach avoids customers being without water longer than the duration they were notified of.
The contracts we have with our contractors allow us to audit the contractor’s records at any time. On completion of the project, we take ownership of the project file, including all valve operations logs.
In addition, the mains renewal contractor provides a quarterly report to our Regulation team of all supply interruptions associated with their work. Reported GSS events are reconciled to the quarterly supply interruptions records provided by our delivery partner. This reconciliation is carried out by our Regulation team.
Affinity Water Business Plan 2015 – 2020: Risk & Reward Submission 91
The contracts also include penalties associated with the overrun of planned works. In the event one of our customers experiences an interruption that is longer than they were notified of, we thoroughly investigate the complaint and implement lessons learned to prevent future occurrence.

Affinity Water Business Plan 2015 – 2020: Risk & Reward Submission 92
3.9 Customer Outcome (4) - Providing a value for money service
Our key challenge is achieving the right balance between the level of service our customers receive and the price they pay. We must understand and meet our customers’ increasing expectations for their service that needs to be balanced with ensuring that bills remain affordable. This is especially during the current tough economic climate where household incomes are under pressure.
The majority of our customers feel that the current service they receive represents good value for money and they support investment to maintain the levels of service they currently receive but do not value service improvements that would push up their bills. We also know our customers expect us to work hard to deliver efficiencies to reduce the impact of new obligations on their bills.
3.9.1 PC - Value for money survey
a. Our PC to our customers
The ethos of community engagement that we have developed is based on asset delivery at a community level. We will set out our investment and service delivery plans at community level using the Service Delivery Map process. We will share those plans with our communities. We will monitor our asset investment, service performance and attainment of performance measures at community level using Navig-8 and we will share this with our communities regularly by publishing data on our website and sending information to key stakeholders.
Our CCG has played a valuable role in our business planning process. We will take that experience of the CCG process forward as we establish our own Stakeholder Assurance Panel. Our Stakeholder Assurance Panel will have an overview remit, assuring our stakeholders that our service and assurance processes are working effectively. We will invite our Stakeholder Assurance Panel to contribute to the design of our value for money survey. We expect our Stakeholder Assurance Panel will independently assure our interpretation of the value for money survey.
Value for money survey performance commitment
We will establish a PC in light of our work over the coming months on survey design and establishing the measurement methodology (see below). Trials will be undertaken.
b. How we will be incentivised to deliver
We believe it is appropriate that this is non-financial incentive as SIM, and in particular the proposed changes to a greater weighting on qualitative assessment, will continue to protect customers interests in the household sector. We do not think it is appropriate for a non-household sector SIM to operate at an industry level.
The table below sets our rationale for the type of incentive we have chosen. We have applied financial incentives to reinforce customer protection should we fail to deliver the PCs set out in plan.

Affinity Water Business Plan 2015 – 2020: Risk & Reward Submission 93
Methodology question Our answer
Q1 Is there sufficient evidence that a financial incentive is appropriate?
No, we believe that customers’ interests are protected with SIM and the effectiveness of economic regulation and the price determination.
Q5 Is it possible and appropriate to measure performance for reputational incentives?
Yes, once we have established the survey, which we plan to do during 2014/15.
Table 3-AG: Selecting the incentive type – value for money survey
c. Calculation and calibration of financial incentives
We are not proposing any financial incentives for this performance commitment.
d. RoRE analysis
As this is a reputational incentive we have not included potential levels of GSS payment in any financial analysis of RoRE.
e. Measuring value for money survey
We will engage our communities through a structured programme managed by our internal stakeholder engagement team and we will assess perception of the service we have provided through online Community Feedback Panels (CFPs). An evolution of the online panels used during our Business Plan consultation, the CFPs will be stratified to reflect each community in order to generate statistically robust outputs of community assurance. The CFPs feedback will provide the current status on our approval rating within communities as well as furnish us with feedback we can use in future planning for community service levels. Our CFPs will help us to maintain our level of local accountability over the longer term.
Alongside our CFPs, we have proposed a further mechanism to support the specific assessment of our value for money measure: a quantitative value for money customer survey. The survey is complementary to the work of the CFPs and the assessment of customer service delivered through SIM. We will engage our Stakeholder Assurance Panel to help us establish the criteria we should use for judging ‘value for money’ and we will ask them to check for completeness, clarity and comprehension of the proposed questionnaire.
The survey will be developed in detail over the next few months with the input of CC Water, community groups and other relevant customer representative bodies such as Citizens’ Advice Bureau. We will move to trial phase during summer 2014. The first survey will establish our baseline performance commitment against which we will measure our performance during AMP6.
In addition to our ongoing dialogue with key stakeholders, we will develop a qualitative engagement programme around value for money as part of the overall engagement piece to capture customer satisfaction and performance perceptions from difficult to access groups e.g. businesses and vulnerable customers.

Affinity Water Business Plan 2015 – 2020: Risk & Reward Submission 94
We will establish relationships with independent external agencies to deliver the engagement programme including the value for money survey. Our agencies will report findings to us in the form of excel data tables providing raw data results. We will receive data in a format capable of being interrogated at a number of levels of detail to allow us to access customer thinking across a range of issues and from different perspectives. Agencies will be directed to deliver summary reports of key findings including analysis of outcomes.
Our results will be subject to a high degree of scrutiny via our independent audit processes. We will invite our financial auditors to review our financial performance while our performance metrics will be audited by our Reporter whose scope will be extended to cover value for money surveys for our Annual Return.

Affinity Water Business Plan 2015 – 2020: Risk & Reward Submission 95
3.10 Summary of ODI package
A summary of our revised ODI package is set out in the table below. This shows the value, in terms of £m annual revenue, of the effective financial incentives that apply in 80% of probable outcomes (i.e. between the ‘P10’ and ‘P90’ outcomes) during each year of AMP6. We have excluded both the AIM and SIM from this submission as the relevant incentive parameters will be set by Ofwat.
Table 3-AH: ODI package summary

Affinity Water Business Plan 2015 – 2020: Risk & Reward Submission 96
4 Uncertainty Mechanisms

Affinity Water Business Plan 2015 – 2020: Risk & Reward Submission 97
4.1 Uncertainty mechanisms
Affinity Water confirms that it accepts Ofwat’s guidance on uncertainty mechanisms.
We accept there should be a consistent set of uncertainty mechanisms across the industry. We are not requesting any additional company-specific uncertainty mechanisms to the list set out in Ofwat’s risk/reward guidance.
We welcome that Ofwat has said that it will allow companies to include an appropriate uncertainty mechanism for the revaluation of business rates in 2017. We would like to apply for this mechanism on the basis that there is very little we can do to affect either the probability or the impact of changes in business rates. We want to be transparent on the cost-sharing ratio and have proposed 75:25. That is, although we have no influence on these costs, we will still bear one quarter of the cost risk. We consider this will provide some residual incentive to seek a reasonable treatment in the review of rating arrangements on behalf of our customers.
We note that our position on uncertainty mechanisms reflects a significant reduction in risks to customer bills compared to PR09. For example, due to the wide range of uncertainty of cost impact which, despite our best endeavours we have not been able to resolve with third parties, our Business Plan did not factor in estimates for some costs where there could be a material change in our statutory obligations in AMP6. Changes in statutory obligations for example could relate to:
- further sustainability reductions notified by the EA under the Water Framework Management Directive and River Basin Management Plans; and
Key points from Ofwat’s guidance
- “We expect all pre-qualified companies to adopt a consistent suite of [relatively few]
standard industry uncertainty mechanisms alongside those specific to their own
outcome delivery proposals in ODIs” (p54).
- “We will be seeking reassurance from our assessment of business plan information
that all pre-qualifying companies adopt a transparent approach to gain/pain sharing
with their customers and that customers are properly protected from the non-delivery
of projects supported by evidence of WTP” (p55).
- “We will allow companies to include an appropriate uncertainty mechanism for the
revaluation of business rates in 2017.” “Such a mechanism should allow for
enhanced cost sharing, but retain a residual incentive to argue for reasonable
treatment in the review of rating arrangements on behalf of their customers” (p55).
- “For the avoidance of doubt, companies should not assume that the existing
arrangements for logging up/down and shortfalling are retained” (p55).

Affinity Water Business Plan 2015 – 2020: Risk & Reward Submission 98
- obligations arising from major infrastructure developments (where these costs are not recoverable from the promoter/developer (such as the HS2 railway proposal).
Up to the point where one of Ofwat’s industry mechanisms (e.g. IDoK) would be applicable, these cost risks will now be borne by our shareholders. We do, however, want to make it absolutely clear that we will continue to comply with any new statutory environmental obligations as well as our other legal obligations.
We note that we will benefit from Ofwat applying its ‘do no harm’ principle if it later in its process decides to offer additional industry uncertainty mechanisms.

Affinity Water Business Plan 2015 – 2020: Risk & Reward Submission 99
5 Outperformance (RoRE)

Affinity Water Business Plan 2015 – 2020: Risk & Reward Submission 100
5.1 Return on Regulated Equity (RoRE)
Figure 5-1 below sets out a RoRE analysis for Affinity Water based on Ofwat’s notional gearing structure (62.5%). It shows a mid-point RoRE of 5.69%.
We have made the following changes to our scenarios from our original Business Plan:
- Scenario H has been changed to reflect the changes to our ODIs as detailed in data table W2 and described in section 3 of this document.
Key points from Ofwat’s guidance
- “Companies should provide sufficient and convincing evidence that their revised
business plans contain proposed risk impacts within the parameters set out in the
guidance” (p59, nb bold from original).
- “Companies should consider overall scope of outperformance from cost, ODIs,
service incentive mechanism (SIM) and financing… to provide meaningful
incentives to encourage the best service” (p4).
- “We expect a RoRE variance from base returns of +/- 3.5% to 4.5%..” (p49).
- Cost outperformance: “We do not expect companies to alter their cost
performance incentives as part of their response to pre-qualification guidance, but
we would expect that they consider the total scope for outperformance, including
cost performance, as part of … their revised business plan” (p49). “We would
expect that cost performance would provide for at least +/-2% on RoRE” (p50).
- SIM outperformance: “SIM could result in a RoRE impact of -0.5% to + 0.25%”
(p50).
- Financing outperformance: “…companies could outperform the allowed cost of
capital such as by managing the cost of debt more efficiently than allowed for in
the price control. We suggest financing outperformance could have a RoRE
impact of between +/-0.5% to +/-1.0%” (p50). “..we now request that companies
separately identify the impact on RoRE of financing performance… Specifically,
they should provide the effect of overperformance or underperformance against
the notional cost of debt, holding constant all other WACC inputs” (p62).
- “Companies should provide sufficient and convincing evidence that their revised
business plans contain an appropriate balance of risk and reward, including
demonstrating an efficient level, and allocation of risk” (p59, bold in original). “In
relation to scenario analysis, companies are required to re-submit information in
relation to Scenario I only (that is, the overall scenario)” (p59).

Affinity Water Business Plan 2015 – 2020: Risk & Reward Submission 101
- We have made a minor change to Scenario A that is explained in the commentary to A20.
- We have revised Scenario I to reflect the changes to Scenario A and H.
- A financing scenario is added to reflect Ofwat’s risk/reward guidance.
- A SIM scenario has been added to reflect Ofwat’s risk/reward guidance.
Our revised scenarios are as follows:
- Scenario A: Household growth.
- Scenario B: Industrial demand.
- Scenario C: Cost input inflation.
- Scenario D: Overall economic scenario.
- Scenario E: Rainfall.
- Scenario F: New quality obligations.
- Scenario G: Tideway Tunnel bad debts and contact rate.
- Scenario H: Incentive performance variation.
- Scenario I: A combination of the above.
- Financing Scenario: a variation of ±0.25% on the rate for new debt.
- SIM downside: A possible penalty of 1% of revenue.
- Uncertainty mechanism: attributing 75% of business rates variance to customers.
The range around the baseline RoRE broadly meets Ofwat’s expectations because it is between 0.28% to 9.19%. This range in part reflects the fact that Affinity Water has a high revenue/RCV ratio (operating leverage) compared to the industry average.
In addition, it can be seen that the contribution towards this range from the individual ‘outperformance’ sources is also broadly in line with Ofwat’s risk/reward guidance:
- Totex and COPI/RPI performance of +2.59% to -2.26%. This is in line with Ofwat’s guidance.
- SIM performance +0% to -0.73%. Given the asymmetric penalty/reward SIM regime, our current industry position, and the pressures on our SIM performance in AMP6 from our metering programme and Thames Tideway, we are not forecasting a RoRE upside from SIM outperformance. The downside is greater than Ofwat’s expectations because of Affinity Water’s relatively high revenue/RCV ratio (operating leverage).
- Financing performance +0.23% to -0.23%. This is less than Ofwat’s expectations because all our existing debt is fixed beyond the end of AMP6. We have therefore only modelled variations in the rates relating to new debt raised during the period.
- Net ODI performance of +0.67% to -2.06%. This reflects our ODI package set out in section 3 as adjusted for totex related to the ODIs, and the associated tax effect.
- Uncertainty mechanisms of +0.02% to -0.13%. This reflects the uncertainty mechanism detailed in section 4.

Affinity Water Business Plan 2015 – 2020: Risk & Reward Submission 102
Figure 5-1: RoRE from revised Business Plan under “Scenario I”
Affinity Water considers that the range for RoRE above represents a fair and efficient allocation of risk/reward with our customers. The ability to earn returns in excess of the baseline RoRE is dependent on our outperformance and, by symmetry, we stand to earn substantially reduced returns – below our cost of debt - if we do not perform well.
It must be stressed that the context for this is that our Business Plan already makes very ambitious and stretching commitments where we face serious financial consequences if we fail to deliver and/or we are faced with external risks. These include:
- Industry leading leakage reductions (in percentage terms).
- Industry leading sustainability reductions (in percentage terms).
- A challenging demand management programme.
- A challenging totex efficiency challenge.
- Costs arising from further sustainability reductions under the Water Framework Directive and River Basin Management Plans.
- Costs arising from major infrastructure developments such as HS2.
Base Case RoRE, 5.69%
0.00%
1.00%
2.00%
3.00%
4.00%
5.00%
6.00%
7.00%
8.00%
9.00%
10.00%
Notional
Appointed RoRE Graph
Financing outperformance
SIM outperformance
Uncertainty mechanismoutperformanceODI outperformance
RPI/COPI outperformance
Totex outperformance
Totex underperformance
RPI/COPI underperformance
ODI underperformance
Uncertainty mechanismunderperformanceSIM underperformance
Financing underperformance

Affinity Water Business Plan 2015 – 2020: Risk & Reward Submission 103
6 Affordability and Financeability

Affinity Water Business Plan 2015 – 2020: Risk & Reward Submission 104
6.1 Affordability
Affinity Water is confident that its resulting bill profile will remain affordable for customers.
Our average customer bills will now reduce by an average of 1.4% per year in real terms. We already have one of the lowest average water bills in the country and it should continue to fall as a share of our customers’ real disposable income over the next five years. The table below sets out our revised bill profile for AMP6. We want to ensure our customers benefit from the lower cost of capital charge as soon as possible and hence we have sculpted the bill profile to give a real price reduction of 3.6% in the first year followed by further reductions in each subsequent year, peaking in a reduction of 1.2% in 2019-20.
Key points from Ofwat’s guidance
- “Companies should provide sufficient and convincing information to demonstrate
that their revised business plan remain affordable to customers” (p60, nb bold in
original).
- “[Companies] should provide sufficient and convincing information to demonstrate
that their revised business plans – including revisions – are financeable.”
“Companies may vary their use of new regulatory mechanisms such as the PAYG
ratio and RCV run off rate, if required. (p60, nb bold from original).
- “As well as re-submitting relevant data tables that highlight any changes, we expect
companies to:
o explain and justify the drivers of any financeability constraint;
o explain and justify whether, and how, they have used such tools as the
PAYG ration and RCV run off rate to address any financeability/affordability
constraint. They should demonstrate clearly that their choice of
PAYG/RCV ratio and RCV run off rates minimises costs to customers and
are consistent with financeability/affordability beyond the forthcoming
control period;
o provide revised financial ratios and explain how those ratios are consistent
with target credit ratings under the proposed actual capital structure and
investment grade credit rating under notional capital structure. In doing so,
companies will need explain how much headroom they require on key
financial ratios relative to the boundary of investment grade rating and
indicate if they will continue to target the same credit rating” (p62).
Key points from Ofwat’s guidance
- “Companies should provide sufficient and convincing information to demonstrate
that their revised business plan remain affordable to customers” (p60, nb bold in
original).
- “[Companies] should provide sufficient and convincing information to demonstrate
that their revised business plans – including revisions – are financeable.”
“Companies may vary their use of new regulatory mechanisms such as the PAYG
ratio and RCV run off rate, if required. (p60, nb bold from original).
- “As well as re-submitting relevant data tables that highlight any changes, we expect
companies to:
o explain and justify the drivers of any financeability constraint;
o explain and justify whether, and how, they have used such tools as the
PAYG ratio and RCV run off rate to address any financeability/affordability
constraint. They should demonstrate clearly that their choice of
PAYG/RCV ratio and RCV run off rates minimises costs to customers and
are consistent with financeability/affordability beyond the forthcoming
control period;
o provide revised financial ratios and explain how those ratios are consistent
with target credit ratings under the proposed actual capital structure and
investment grade credit rating under notional capital structure. In doing so,
companies will need explain how much headroom they require on key
financial ratios relative to the boundary of investment grade rating and
indicate if they will continue to target the same credit rating” (p62).

Affinity Water Business Plan 2015 – 2020: Risk & Reward Submission 105
2014/15 2015/16 2016/17 2017/18 2018/19 2019/20
Average household bill (£)
164.9 159.0 158.1 156.8 155.2 153.3
Annual change -3.6% -0.6% -0.8% -1.0% -1.2%
Table 6-A: Average bill profile and proposed price limits for AMP6 (12/13 prices)
Please note that the starting point for these calculations is the abated average household bill following our decision to forgo implementing some of our tariff increase for 2014/15.
We recognise that some household budgets are under strain. We believe we are a leading company in responding to this:
- We voluntarily chose not to implement in 2014/15 our full tariff increase.
- Our new social tariff will be implemented on 1 April 2014.
Our average bill reduction now planned is now twice that we proposed in our original Business Plan (RPI-0.7% pa), as illustrated in figure 6-1 below.
Figure 6-1: Comparison of average water bills and real GDHI Source: Deloitte & Affinity Water
We tested the 0.7% per year reduction with customers and gained very high levels of acceptance. It is reasonable for us to assume that an even lower average bill profile would be acceptable to our customers given that we project the gross disposable household income of customers in the regions we serve to rise on average by around 1.4% per annum during the
Affinity Water Business Plan 2015 – 2020: Risk & Reward Submission 106
same period. Unlike for the water sector as a whole, our bills have not risen as a share of our customers’ disposable incomes since the downturn in 2009.
Nevertheless, we have undertaken further, more recent, customer testing of our revised Business Plan, which has confirmed the position on acceptability (see Appendix 3). In particular:
- An example showing the impact of a revised WACC and rewards/penalty package showed the average bill was always lower at the end of five years than our original Business Plan. This was acceptable to customers.
- In principle, customers agree that linking bills to performance is a good idea. But customers do not agree that companies should be rewarded for outperformance.
6.2 Financeability
Affinity Water confirms that its revised Business Plan is financeable.
6.2.1 Drivers for any financeability constraint
We have not made any adjustment in the revised Business Plan to meet a constraint on our financeability.
6.2.2 RCV run off rate and PAYG ratio
We can confirm that we have made no changes to the RCV run off rate compared with our original Business Plan. It remains 4% per year.
We have made some very minor changes to our PAYG ratio to help reduce customer bill volatility. Overall this delivers an average real reduction of 1.4% per year, which as described above is a bill profile we are assured is affordable. Table 6.B below sets out our assumptions and compares it with what we proposed in the original Business Plan. We have considered affordability beyond AMP6 in terms of whether we are storing up bill pressure for future generations. During AMP6 our RCV is forecast to grow from £1,016m (post midnight adjustments) to £1,197m (18%). This is reasonable in the context of some of our major atypical investments such as sustainability reductions, universal metering and lead pipe replacements. Our PAYG ratio represents an appropriate intergenerational balance because the incidence of costs does not fall disproportionality between present and future generations of customers.
We propose recovering the £4m reward for enhanced status by adding the amount to our opening RCV. This has been included within our financial modelling. We consider this is the fairest way of recovering this from customer bills over time.

Affinity Water Business Plan 2015 – 2020: Risk & Reward Submission 107
2015/16 2016/17 2017/18 2018/19 2019/20
Revised table W10 70.27% 69.24% 77.81% 86.11% 92.42%
Original table W10
(2nd December 2013 Business Plan)
69.49% 67.62% 75.97% 84.35% 91.06%
Table 6-B: PAYG ratios in AMP6 for revised Business Plan compared to Business Plan
Note: the original version of Table W10 did not allow entry of a different per year PAYG ratio so we showed an average over the AMP of 76.58%.
6.2.3 Financial ratios/target credit ratings
The table below sets out our main financial ratios. We will seek to maintain a family credit rating of BBB+/Baa1 based on gearing of 80%. This will allow us to maintain our current credit ratings on our Class A debt of A-/A3. These ratios are consistent with that objective. They are also consistent with Affinity Water having an investment grade rating under Ofwat’s notional gearing of 62.5%.
Under the worst case scenario, modelled in Table A20, our Business Plan remains financeable with no breaches of our two main financial covenants, Senior Adjusted Interest Cover Ratio (ICR) and Senior Regulatory Asset Ratio (Gearing ratio). Senior Adjusted ICR must be above 1.10 in any one year and 1.20 over a 3 year period and gearing must remain below 90%.
We also have covenant requirements to maintain minimum credit rating levels. Our credit ratings would come under pressure in the worst case scenario and we believe this would result in a downgrade in our ratings from both Moody’s and Standard & Poors (S&P). Affinity Water, and in particular our Class A debt, would likely remain investment grade and we therefore would continue to be able to access the debt markets and finance the business. Alongside our financial covenants Moody’s and S&P consider a number of financial ratios. We consider Funds From Operations (FFO) to Debt to be the main cash flow ratio considered by S&P with a minimum of 7% required to maintain our current rating. We consider Adjusted Interest Cover to be the main cash flow ratio considered by Moody’s with a minimum of 1.60 times required to maintain our current rating.
We acknowledge that the risks associated with our actual gearing structure is a matter for shareholders not customers.

Affinity Water Business Plan 2015 – 2020: Risk & Reward Submission 108
Actual Capital Structure 2015/16 2016/17 2017/18 2018/19 2019/20
Return on regulated equity (RoRE) (return due to shareholders / equity component of RCV)
8.71% 8.58% 8.68% 8.75% 8.73%
Cash Interest Cover (FFO) 4.241 4.097 3.956 4.053 4.035
Adjusted Cash / Debt (S&P) 7.87% 7.06% 7.18% 7.75% 8.09%
Adjusted Interest Cover (Moody's) 1.596 1.435 1.427 1.531 1.562
Senior Adjusted ICR 1.981 1.762 1.695 1.848 1.904
Notional Capital Structure 2015/16 2016/17 2017/18 2018/19 2019/20
Return on regulated equity (RoRE) (return due to shareholders / equity component of RCV)
5.89% 5.40% 5.61% 5.69% 5.85%
Cash Interest Cover (funds from operations / net interest)
3.536 3.332 3.383 3.576 3.711
Adjusted cash interest cover ratio ((funds from operations less capital charges) / net interest)
2.181 1.971 1.996 2.149 2.261
Funds from operations / net debt 0.119 0.109 0.111 0.119 0.125
Dividend cover (profit after tax / dividends paid) 1.371 1.222 1.310 1.480 1.592
Table 6-C: Financial ratios / target credit ratings

Affinity Water Business Plan 2015 – 2020: Risk & Reward Submission 109
Appendices

Affinity Water Business Plan 2015 – 2020: Risk & Reward Submission 110
Appendix 1: The Net Customer Benefits of the Affinity Water Wholesale Equity Premium –Report by Frontier Economics
Appendix 2: Revisions to ODIs and Ofwat Guidance – Report by Frontier Economics
Appendix 3: Results of Recent Customer Engagement on Changes to our Business Plan
Appendix 4: Data Tables and Commentary, including Table A20 ODI Revisions

Affinity Water Business Plan 2015 – 2020: Risk & Reward Submission 111