
Draft Tewksbury Master Plan Economic D evelopment Chapter...Draft . Tewksbury Master Plan Economic D...
64
Draft Tewksbury Master Plan Economic Development Chapter Introduction The Economic Development chapter of the Master Plan reviews the Existing Conditions in Tewksbury relative to the economy, the business community and existing infrastructure and then takes a look at issues and opportunities for further economic growth. Economic development refers to the local workforce, businesses and potential economic growth opportunities for additional private investment. Understanding the current economic condition of the community and the potential for economic growth provides the foundation for the other elements within the Master Plan. Planning for economic growth is essential in that it generates local tax revenues needed to support local services and creates job opportunities for residents. The Economic Development element of the previous Master Plan focused on the need for economic development capacity building, the redevelopment and reuse of underutilized or vacant property, and the Town Center. The Town of Tewksbury has been largely successful in addressing each of these issues through the formation of an Economic Development Committee, the redevelopment and reuse of several commercial properties along Route 38 and the adoption of an overlay district for the Town Center and increased focus upon the commercial center of Town. The Town has worked with the Northern Middlesex Council of Governments (NMCOG) on the completion of corridor studies for Route 38, Route 133, East Street and Woburn Street, the identification of Priority Development Sites (PDS) within the Greater Lowell Regional Strategic Plan (RSP), participation on the Greater Lowell Comprehensive Economic Development Strategy (CEDS) Committee in development the Greater Lowell CEDS Update for 2009-2013, and inclusion within the Siting Plan for Renewable Energy Facilities for the Greater Lowell and Montachusett regions. With the completion of the Economic Development Self- Assessment Tool (EDSAT) report by the Dukakis Center of Northeastern University, the Town has a new “blueprint” for attracting additional private investment to the community as a means to provide jobs for local residents, property taxes to support other public initiatives, and increased development opportunities. The Economic Development chapter of the Master Plan will attempt to address the following questions and, hopefully, will elicit public debate on the future economic development action steps for the community: • What should the town do to retain and attract additional businesses? What specific types of businesses should be targeted? Have these businesses already located in town? • How did the recent recession impacted businesses in town? Which businesses and industries closed or laid off workers? Which businesses left town and what were their reasons for moving away?
Transcript of Draft Tewksbury Master Plan Economic D evelopment Chapter...Draft . Tewksbury Master Plan Economic D...
Draft
Tewksbury Master Plan Economic Development Chapter
Introduction
The Economic Development chapter of the Master Plan reviews the Existing Conditions in Tewksbury relative to the economy, the business community and existing infrastructure and then takes a look at issues and opportunities for further economic growth. Economic development refers to the local workforce, businesses and potential economic growth opportunities for additional private investment. Understanding the current economic condition of the community and the potential for economic growth provides the foundation for the other elements within the Master Plan. Planning for economic growth is essential in that it generates local tax revenues needed to support local services and creates job opportunities for residents.
The Economic Development element of the previous Master Plan focused on the need for economic development capacity building, the redevelopment and reuse of underutilized or vacant property, and the Town Center. The Town of Tewksbury has been largely successful in addressing each of these issues through the formation of an Economic Development Committee, the redevelopment and reuse of several commercial properties along Route 38 and the adoption of an overlay district for the Town Center and increased focus upon the commercial center of Town. The Town has worked with the Northern Middlesex Council of Governments (NMCOG) on the completion of corridor studies for Route 38, Route 133, East Street and Woburn Street, the identification of Priority Development Sites (PDS) within the Greater Lowell Regional Strategic Plan (RSP), participation on the Greater Lowell Comprehensive Economic Development Strategy (CEDS) Committee in development the Greater Lowell CEDS Update for 2009-2013, and inclusion within the Siting Plan for Renewable Energy Facilities for the Greater Lowell and Montachusett regions. With the completion of the Economic Development Self-Assessment Tool (EDSAT) report by the Dukakis Center of Northeastern University, the Town has a new “blueprint” for attracting additional private investment to the community as a means to provide jobs for local residents, property taxes to support other public initiatives, and increased development opportunities.
The Economic Development chapter of the Master Plan will attempt to address the following questions and, hopefully, will elicit public debate on the future economic development action steps for the community:
• What should the town do to retain and attract additional businesses? What specific types of businesses should be targeted? Have these businesses already located in town?
• How did the recent recession impacted businesses in town? Which businesses and industries closed or laid off workers? Which businesses left town and what were their reasons for moving away?
2
• Does the retail and commercial mix in the town and region address the needs of Tewksbury residents? What types of additional businesses and industries need to be added? Where should these businesses be located – Route 38, North Tewksbury, Route 495 or Route 93, or the Woburn Street corridor?
• What role should the Economic Development Committee play in implementing the community’s economic development strategy? Should there be changes to how the town markets itself and available industrial and commercial properties and sites? How does the community build upon its designation as an Economic Target Area (ETA) to expand current businesses or to attract new businesses?
• Where are the vacant or underutilized retail, commercial, office, or industrial properties? How should the town work with the owners to fill these spaces?
• How seriously did the recent recession impact the workforce in town? Which workforce development programs would help the underemployed or unemployed secure a new job? Which programs should be targeted to youth or older workers?
• What specific infrastructure issues (telecommunications, water, roads, public transit, parking, etc.) need to be addressed in order to support continued economic growth?
• How do the “green initiatives” fit within the town’s economic development program and what needs to be done to support these initiatives? What other types of industry should be attracted to the community and are there adequate support facilities?
• How can economic growth be managed so that it maintains the quality of life in town? What protections need to be in place to ensure that the community character is not changed?
These questions are just part of an ongoing dialogue that needs to take place between the Town of Tewksbury and its residents and businesses. The completion of this Economic Development chapter will add to that discussion.
I. Existing Conditions
The Existing Conditions section of the Economic Development chapter provides an update on the current Economy, Business Community, and Infrastructure in Tewksbury. Within the Economy subsection, there is updated information on the Income levels within the community, the Unemployment and Layoff situation over a period of time, the current Labor Force and projected employment in the future. Under the Business Community subsection, the composition of the town’s industry is provided, along with a summary of the major employers. More detailed information on the number of establishments, average monthly employment figures and average weekly wages are provided. In addition those industries which have a greater share than the national average are identified and can serve as a focus for targeting cluster industries in the future. Under the Infrastructure subsection, there is a general description of the water, wastewater and other utilities available to businesses and residents within the community.
3
A. The Economy
Within the Existing Conditions section of the Economic Development chapter, the subsection labeled The Economy focuses upon the basic demographic and economic development data not available in other chapters of the Master Plan. The Economy subsection begins with a comparison of the income data from the 2000 U.S. Census and the 2006-2010 American Community Survey, which replaced the Census as the location for income data. The focus then shifts to the subject of Municipal Taxation and Spending, which summarizes the community’s available resources and expenditures. Another subject area addressed is the Educational Attainment section, which offers updated information on the educational levels of the Tewksbury workforce. The section continues with a discussion of the Labor Force, Places of Employment and Employed Residents. The section also documents the unemployment rates, which have been decreasing since the Great Recession, as well as the reported layoffs in the community as reported by the Massachusetts Rapid Response Team. Finally, the Employment Projections developed by MassDOT with input from the Northern Middlesex Council of Governments (NMCOG) are presented.
1. Income Over the past decade, the socio-economic situation in Tewksbury has changed as shown by increases in median household, median family, and per capita incomes. Table 1 shows the change in median household income between 1999 and 2010, while Tables 2 and 3 show changes in the median family and per capita incomes, respectively. These changes are compared to the rates of change on the Primary Metropolitan Statistical Area (PMSA/NECTA), state, and national levels.
In 2005 the Office of Management and Budget (OMB) revised or created new statistical labor market areas based upon the commuting patterns and economic dependence upon communities in Massachusetts. Within New England, a special category called New England Cities and Town Areas (NECTAs) was created to reflect existing labor markets as determined by the commuting patterns identified in the 2000 U.S. Census. Instead of dealing with the previous Metropolitan Statistical Areas (MSAs) or Primary Metropolitan Statistical Areas (PMSAs), the new labor market areas are defined as Metropolitan or Micropolitan NECTAs, as well as NECTA Divisions.
The American Community Survey (ACS) provides local and regional income data for 2010. The ACS is an ongoing survey that provides data every year - giving communities the current information they need to plan investments and services. Data is published in periods of 1-, 3-, and 5-year estimates representing the characteristics of the population and housing over a specific data collection period. Data are combined to produce 12 months, 36 months or 60 months of data. For this document, 5-year ACS data was used because it was more precise and reliable than the 1-year and the 3-year data.
4
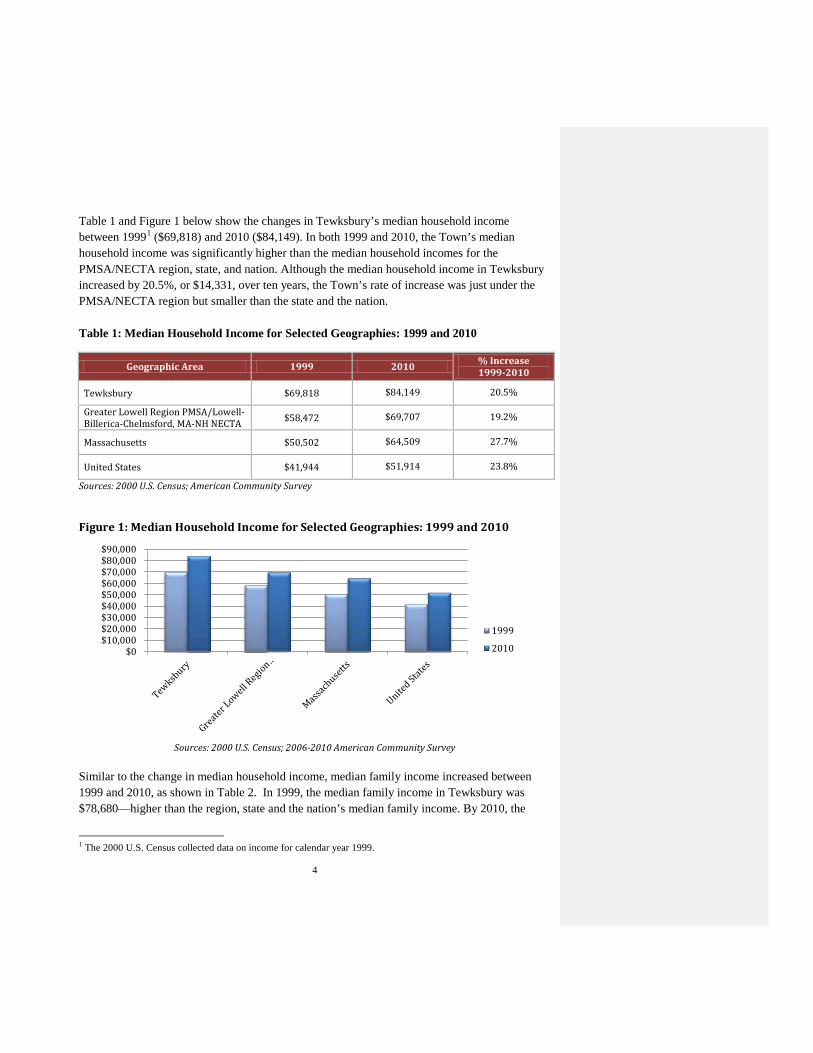
Table 1 and Figure 1 below show the changes in Tewksbury’s median household income between 19991 ($69,818) and 2010 ($84,149). In both 1999 and 2010, the Town’s median household income was significantly higher than the median household incomes for the PMSA/NECTA region, state, and nation. Although the median household income in Tewksbury increased by 20.5%, or $14,331, over ten years, the Town’s rate of increase was just under the PMSA/NECTA region but smaller than the state and the nation.
Table 1: Median Household Income for Selected Geographies: 1999 and 2010
Geographic Area 1999 2010 % Increase 1999-2010
Tewksbury $69,818 $84,149 20.5%
Greater Lowell Region PMSA/Lowell-Billerica-Chelmsford, MA-NH NECTA $58,472 $69,707 19.2%
Massachusetts $50,502 $64,509 27.7%
United States $41,944 $51,914 23.8%
Sources: 2000 U.S. Census; American Community Survey
Figure 1: Median Household Income for Selected Geographies: 1999 and 2010
Sources: 2000 U.S. Census; 2006-2010 American Community Survey
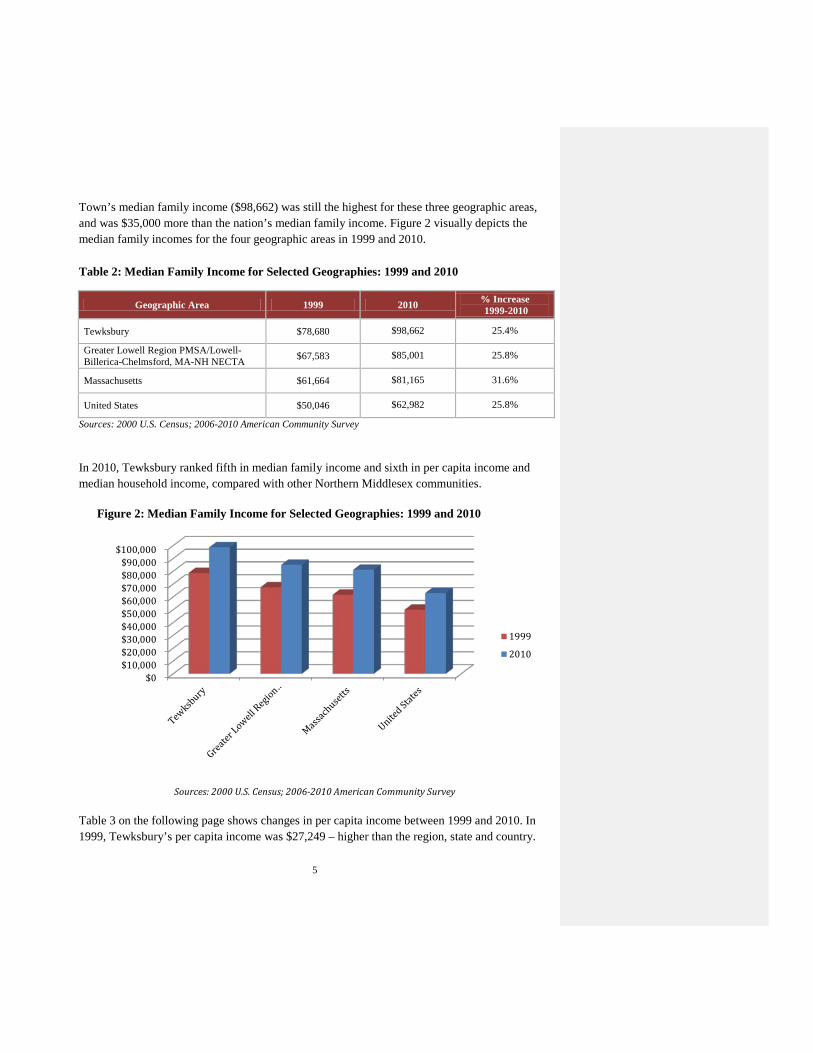
Similar to the change in median household income, median family income increased between 1999 and 2010, as shown in Table 2. In 1999, the median family income in Tewksbury was $78,680—higher than the region, state and the nation’s median family income. By 2010, the
1 The 2000 U.S. Census collected data on income for calendar year 1999.
$0 $10,000 $20,000 $30,000 $40,000 $50,000 $60,000 $70,000 $80,000 $90,000
1999
2010
5
Town’s median family income ($98,662) was still the highest for these three geographic areas, and was $35,000 more than the nation’s median family income. Figure 2 visually depicts the median family incomes for the four geographic areas in 1999 and 2010.
Table 2: Median Family Income for Selected Geographies: 1999 and 2010
Geographic Area 1999 2010 % Increase 1999-2010
Tewksbury $78,680 $98,662 25.4%
Greater Lowell Region PMSA/Lowell-Billerica-Chelmsford, MA-NH NECTA $67,583 $85,001 25.8%
Massachusetts $61,664 $81,165 31.6%
United States $50,046 $62,982 25.8%
Sources: 2000 U.S. Census; 2006-2010 American Community Survey
In 2010, Tewksbury ranked fifth in median family income and sixth in per capita income and median household income, compared with other Northern Middlesex communities.
Figure 2: Median Family Income for Selected Geographies: 1999 and 2010
Sources: 2000 U.S. Census; 2006-2010 American Community Survey
Table 3 on the following page shows changes in per capita income between 1999 and 2010. In 1999, Tewksbury’s per capita income was $27,249 – higher than the region, state and country.
$0 $10,000 $20,000 $30,000 $40,000 $50,000 $60,000 $70,000 $80,000 $90,000
$100,000
1999
2010
6
Eleven years later, the Town’s per capita income increased to $34,684, which continued to be highest of these geographies. The rate of increase was above the nation, but slower than that of the PMSA/NECTA and state, at only 27.3% compared to the NECTA at almost a 30.4% increase and the state at 30.9%. Table 3: Per Capita Income for Selected Geographies: 1999 and 2010
Geographic Area 1999 2010 % Increase 1999-2010
Tewksbury $27,249 $34,684 27.3%
Greater Lowell Region PMSA/Lowell-Billerica-Chelmsford, MA-NH NECTA $24,081 $31,394 30.4%
Massachusetts $25,952 $33,966 30.9%
United States $21,587 $27,334 26.6%
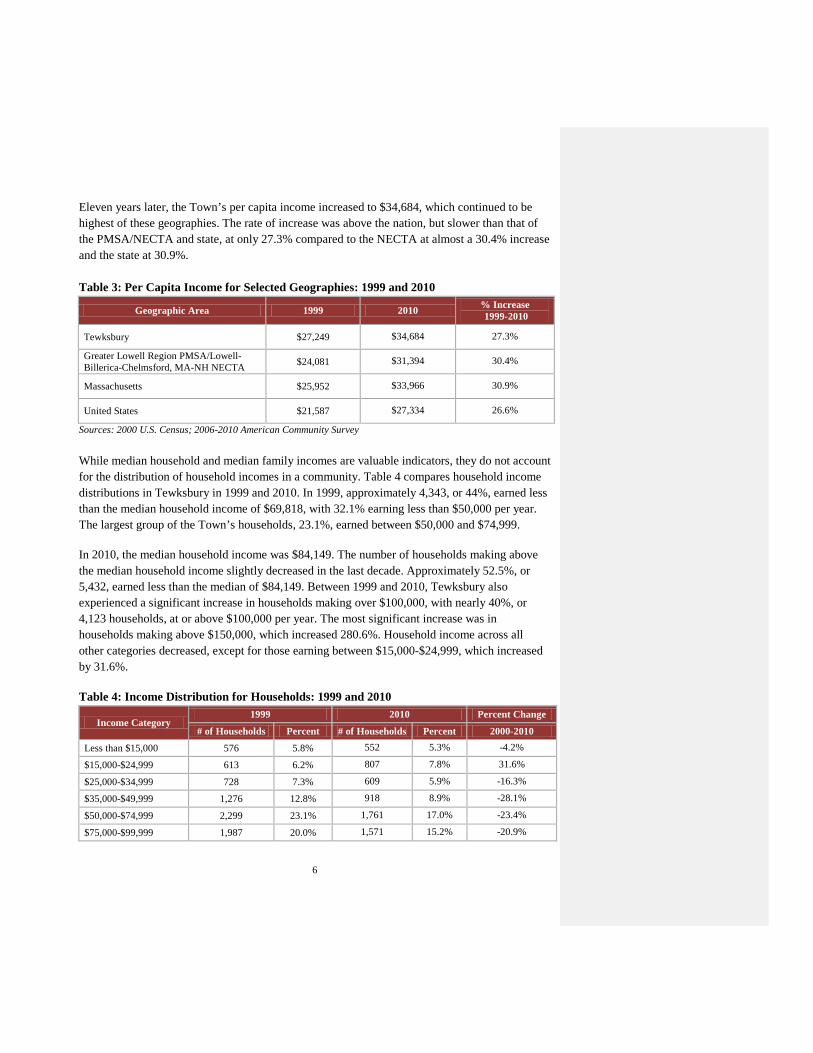
Sources: 2000 U.S. Census; 2006-2010 American Community Survey While median household and median family incomes are valuable indicators, they do not account for the distribution of household incomes in a community. Table 4 compares household income distributions in Tewksbury in 1999 and 2010. In 1999, approximately 4,343, or 44%, earned less than the median household income of $69,818, with 32.1% earning less than $50,000 per year. The largest group of the Town’s households, 23.1%, earned between $50,000 and $74,999. In 2010, the median household income was $84,149. The number of households making above the median household income slightly decreased in the last decade. Approximately 52.5%, or 5,432, earned less than the median of $84,149. Between 1999 and 2010, Tewksbury also experienced a significant increase in households making over $100,000, with nearly 40%, or 4,123 households, at or above $100,000 per year. The most significant increase was in households making above $150,000, which increased 280.6%. Household income across all other categories decreased, except for those earning between $15,000-$24,999, which increased by 31.6%. Table 4: Income Distribution for Households: 1999 and 2010
Income Category 1999 2010 Percent Change
# of Households Percent # of Households Percent 2000-2010
Less than $15,000 576 5.8% 552 5.3% -4.2%
$15,000-$24,999 613 6.2% 807 7.8% 31.6%
$25,000-$34,999 728 7.3% 609 5.9% -16.3%
$35,000-$49,999 1,276 12.8% 918 8.9% -28.1%
$50,000-$74,999 2,299 23.1% 1,761 17.0% -23.4%
$75,000-$99,999 1,987 20.0% 1,571 15.2% -20.9%
7
$100,000- $149,999 2,037 20.5% 2,452 23.7% 20.4%
$150,000 or more 439 4.4% 1,671 16.2% 280.6%
Total 9,955 100% 10,341 100% 3.9% Source: 2000 U.S. Census; 2006-2010 American Community Survey
2. Municipal Taxation and Spending
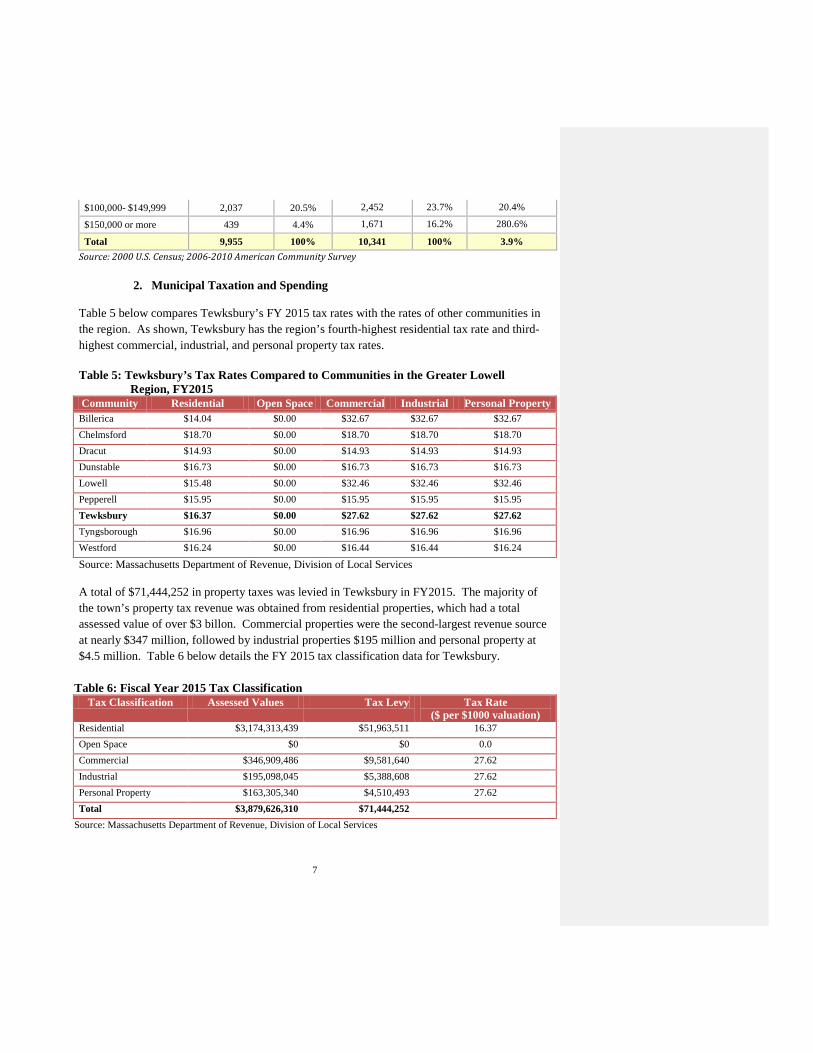
Table 5 below compares Tewksbury’s FY 2015 tax rates with the rates of other communities in the region. As shown, Tewksbury has the region’s fourth-highest residential tax rate and third-highest commercial, industrial, and personal property tax rates.
Table 5: Tewksbury’s Tax Rates Compared to Communities in the Greater Lowell Region, FY2015
Community Residential Open Space Commercial Industrial Personal Property Billerica $14.04 $0.00 $32.67 $32.67 $32.67 Chelmsford $18.70 $0.00 $18.70 $18.70 $18.70 Dracut $14.93 $0.00 $14.93 $14.93 $14.93 Dunstable $16.73 $0.00 $16.73 $16.73 $16.73 Lowell $15.48 $0.00 $32.46 $32.46 $32.46 Pepperell $15.95 $0.00 $15.95 $15.95 $15.95 Tewksbury $16.37 $0.00 $27.62 $27.62 $27.62 Tyngsborough $16.96 $0.00 $16.96 $16.96 $16.96 Westford $16.24 $0.00 $16.44 $16.44 $16.24
Source: Massachusetts Department of Revenue, Division of Local Services A total of $71,444,252 in property taxes was levied in Tewksbury in FY2015. The majority of the town’s property tax revenue was obtained from residential properties, which had a total assessed value of over $3 billon. Commercial properties were the second-largest revenue source at nearly $347 million, followed by industrial properties $195 million and personal property at $4.5 million. Table 6 below details the FY 2015 tax classification data for Tewksbury.
Table 6: Fiscal Year 2015 Tax Classification Tax Classification Assessed Values Tax Levy Tax Rate
($ per $1000 valuation) Residential $3,174,313,439 $51,963,511 16.37 Open Space $0 $0 0.0 Commercial $346,909,486 $9,581,640 27.62 Industrial $195,098,045 $5,388,608 27.62 Personal Property $163,305,340 $4,510,493 27.62 Total $3,879,626,310 $71,444,252
Source: Massachusetts Department of Revenue, Division of Local Services
8
In FY 2015, Tewksbury’s eight largest taxpayers included Raytheon, Demoulas Supermarkets, National Grid, 495 Network Center, Highwood Holdings, BCIA 1925 Andover Street, Ames Pond LLC, and ThermoFisher.
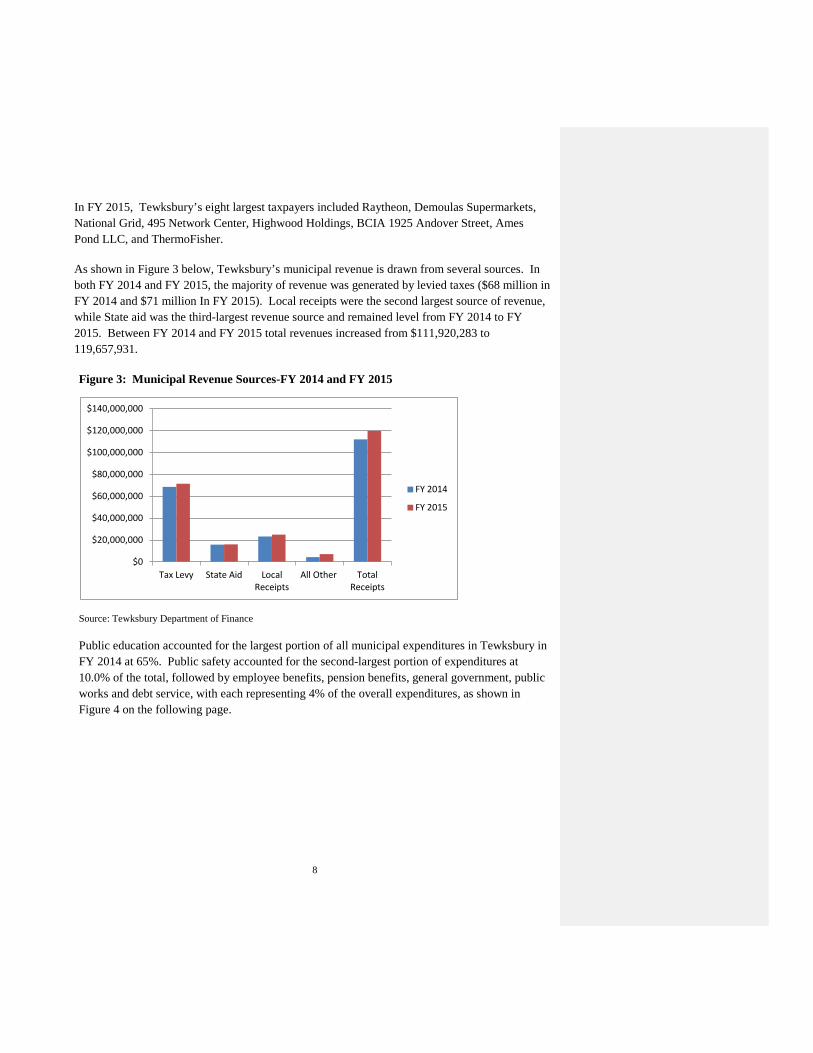
As shown in Figure 3 below, Tewksbury’s municipal revenue is drawn from several sources. In both FY 2014 and FY 2015, the majority of revenue was generated by levied taxes ($68 million in FY 2014 and $71 million In FY 2015). Local receipts were the second largest source of revenue, while State aid was the third-largest revenue source and remained level from FY 2014 to FY 2015. Between FY 2014 and FY 2015 total revenues increased from $111,920,283 to 119,657,931. Figure 3: Municipal Revenue Sources-FY 2014 and FY 2015
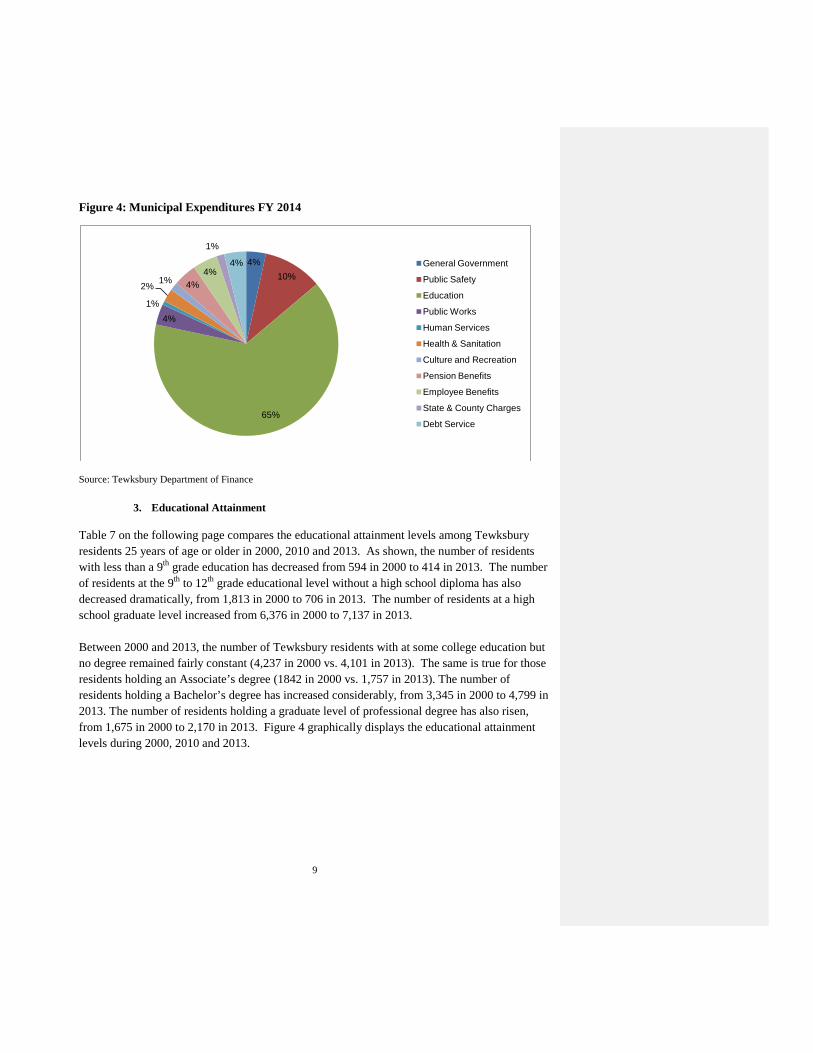
Source: Tewksbury Department of Finance Public education accounted for the largest portion of all municipal expenditures in Tewksbury in FY 2014 at 65%. Public safety accounted for the second-largest portion of expenditures at 10.0% of the total, followed by employee benefits, pension benefits, general government, public works and debt service, with each representing 4% of the overall expenditures, as shown in Figure 4 on the following page.
$0
$20,000,000
$40,000,000
$60,000,000
$80,000,000
$100,000,000
$120,000,000
$140,000,000
Tax Levy State Aid Local Receipts
All Other Total Receipts
FY 2014
FY 2015
9
Figure 4: Municipal Expenditures FY 2014
Source: Tewksbury Department of Finance
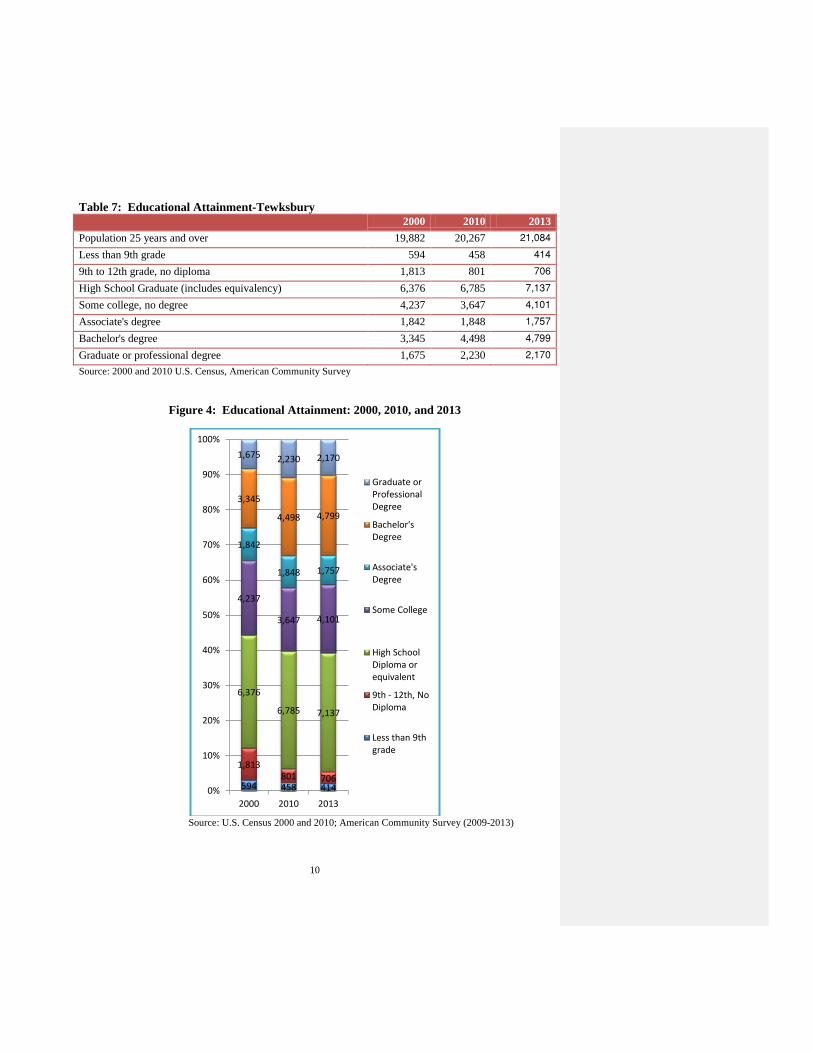
3. Educational Attainment Table 7 on the following page compares the educational attainment levels among Tewksbury residents 25 years of age or older in 2000, 2010 and 2013. As shown, the number of residents with less than a 9th grade education has decreased from 594 in 2000 to 414 in 2013. The number of residents at the 9th to 12th grade educational level without a high school diploma has also decreased dramatically, from 1,813 in 2000 to 706 in 2013. The number of residents at a high school graduate level increased from 6,376 in 2000 to 7,137 in 2013. Between 2000 and 2013, the number of Tewksbury residents with at some college education but no degree remained fairly constant (4,237 in 2000 vs. 4,101 in 2013). The same is true for those residents holding an Associate’s degree (1842 in 2000 vs. 1,757 in 2013). The number of residents holding a Bachelor’s degree has increased considerably, from 3,345 in 2000 to 4,799 in 2013. The number of residents holding a graduate level of professional degree has also risen, from 1,675 in 2000 to 2,170 in 2013. Figure 4 graphically displays the educational attainment levels during 2000, 2010 and 2013.
4% 10%
65%
4% 1%
2% 1% 4% 4%
1%
4% General Government
Public Safety
Education
Public Works
Human Services
Health & Sanitation
Culture and Recreation
Pension Benefits
Employee Benefits
State & County Charges
Debt Service
10
Table 7: Educational Attainment-Tewksbury 2000 2010 2013 Population 25 years and over 19,882 20,267
Less than 9th grade 594 458
9th to 12th grade, no diploma 1,813 801
High School Graduate (includes equivalency) 6,376 6,785
Some college, no degree 4,237 3,647
Associate's degree 1,842 1,848
Bachelor's degree 3,345 4,498
Graduate or professional degree 1,675 2,230
Source: 2000 and 2010 U.S. Census, American Community Survey
Figure 4: Educational Attainment: 2000, 2010, and 2013
Source: U.S. Census 2000 and 2010; American Community Survey (2009-2013)
594 458 414
1,813 801 706
6,376
6,785 7,137
4,237
3,647 4,101
1,842
1,848 1,757
3,345
4,498 4,799
1,675 2,230 2,170
0%
10%
20%
30%
40%
50%
60%
70%
80%
90%
100%
2000 2010 2013
Graduate or Professional Degree
Bachelor's Degree
Associate's Degree
Some College
High School Diploma or equivalent
9th - 12th, No Diploma
Less than 9th grade
11
4. Labor Force
The labor force figures for the Town of Tewksbury have not changed that much since 2002. According to the seasonally unadjusted labor force figures developed by the Executive Office of Labor and Workforce Development, the total labor force for Tewksbury in October 2002 was 16,970, only 60 workers greater than the October 2014 figure of 16,910. Within the overall labor force, the number of Tewksbury residents employed actually increased from 16,091 in October 2002 to 16,106 in October 2014. Based upon the larger workforce numbers, the unemployment rate in October 2002 was 5%, as compared to the 5.1% figure in October 2014.
The following sections provide more detailed information on where Tewksbury residents work, what the industry composition is, the Employment projections developed by MassDOT and the Educational Attainment figures for Tewksbury that have a major impact upon the quality of the workforce.
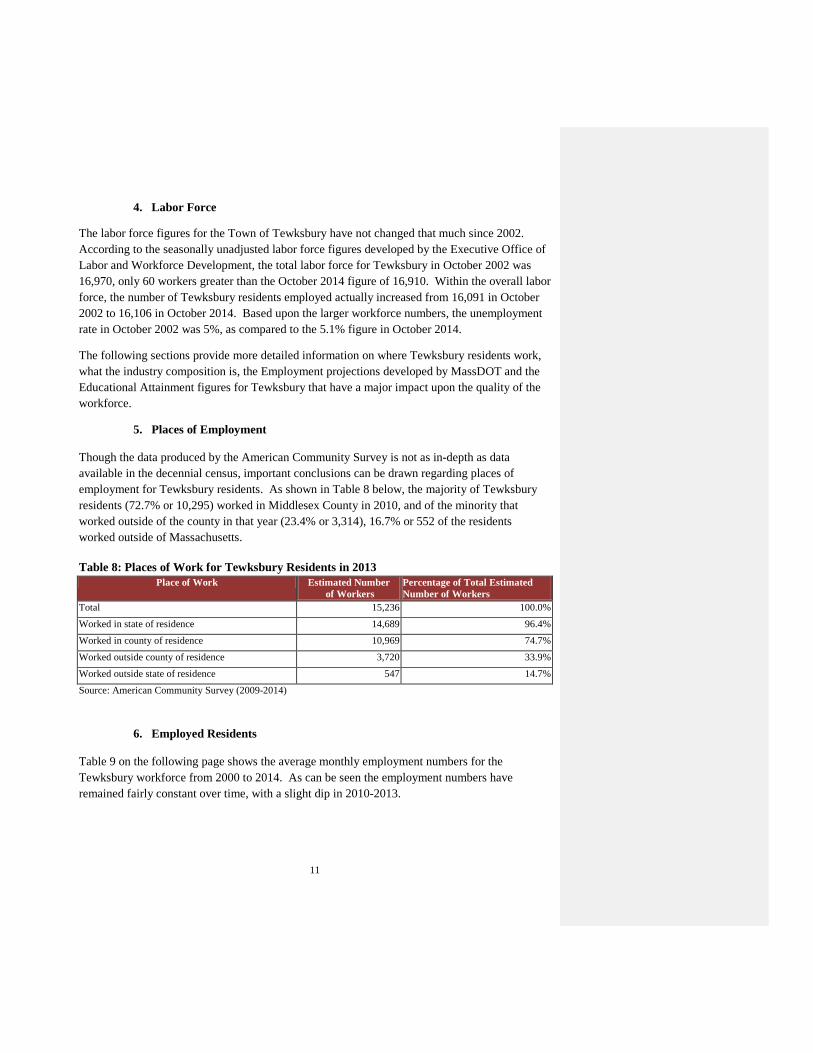
5. Places of Employment Though the data produced by the American Community Survey is not as in-depth as data available in the decennial census, important conclusions can be drawn regarding places of employment for Tewksbury residents. As shown in Table 8 below, the majority of Tewksbury residents (72.7% or 10,295) worked in Middlesex County in 2010, and of the minority that worked outside of the county in that year (23.4% or 3,314), 16.7% or 552 of the residents worked outside of Massachusetts. Table 8: Places of Work for Tewksbury Residents in 2013
Place of Work Estimated Number of Workers
Percentage of Total Estimated Number of Workers
Total 15,236 100.0%
Worked in state of residence 14,689 96.4%
Worked in county of residence 10,969 74.7%
Worked outside county of residence 3,720 33.9%
Worked outside state of residence 547 14.7%
Source: American Community Survey (2009-2014)
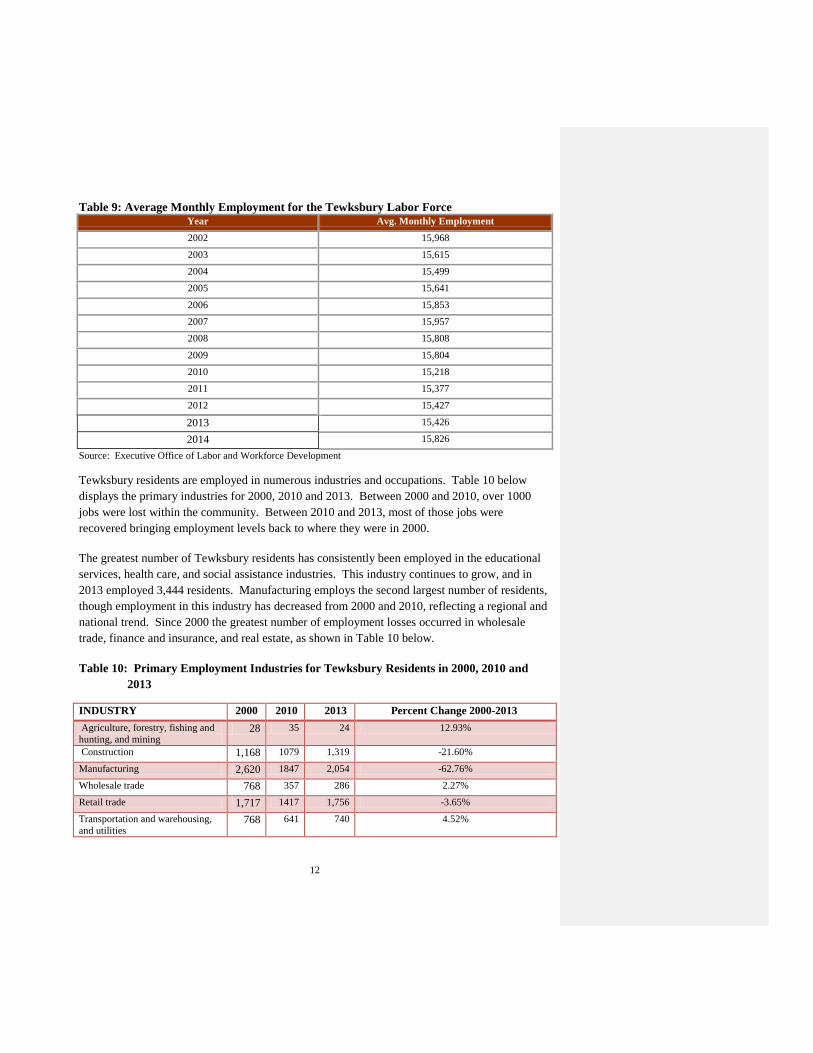
6. Employed Residents Table 9 on the following page shows the average monthly employment numbers for the Tewksbury workforce from 2000 to 2014. As can be seen the employment numbers have remained fairly constant over time, with a slight dip in 2010-2013.
12
Table 9: Average Monthly Employment for the Tewksbury Labor Force Year Avg. Monthly Employment
2002 15,968
2003 15,615
2004 15,499
2005 15,641
2006 15,853
2007 15,957
2008 15,808
2009 15,804
2010 15,218
2011 15,377
2012 15,427
2013 15,426
2014 15,826
Source: Executive Office of Labor and Workforce Development Tewksbury residents are employed in numerous industries and occupations. Table 10 below displays the primary industries for 2000, 2010 and 2013. Between 2000 and 2010, over 1000 jobs were lost within the community. Between 2010 and 2013, most of those jobs were recovered bringing employment levels back to where they were in 2000. The greatest number of Tewksbury residents has consistently been employed in the educational services, health care, and social assistance industries. This industry continues to grow, and in 2013 employed 3,444 residents. Manufacturing employs the second largest number of residents, though employment in this industry has decreased from 2000 and 2010, reflecting a regional and national trend. Since 2000 the greatest number of employment losses occurred in wholesale trade, finance and insurance, and real estate, as shown in Table 10 below. Table 10: Primary Employment Industries for Tewksbury Residents in 2000, 2010 and 2013
INDUSTRY 2000 2010 2013 Percent Change 2000-2013 Agriculture, forestry, fishing and hunting, and mining
28 35 24 12.93%
Construction 1,168 1079 1,319 -21.60%
Manufacturing 2,620 1847 2,054 -62.76%
Wholesale trade 768 357 286 2.27%
Retail trade 1,717 1417 1,756 -3.65%
Transportation and warehousing, and utilities
768 641 740 4.52%
13
Information 598 570 625 -14.36%
Finance and insurance, and real estate and rental and leasing
1,128 1167 966 11.34%
Professional, scientific, and management, and administrative and waste management services
1,772 2241 1,973 18.39%
Educational services, and health care and social assistance
2,909 3054 3,444 0.12%
Arts, entertainment, and recreation, and accommodation and food services
832 622 833 22.52%
Other services, except public administration
604 549 740 14.74%
Public administration 699 921 802 -14.29%
Total All Industries 15,611
14,500
15,562
-0.31%
Source: U.S Census 2000, American Community Survey (2006-2010 and 2009-2013)
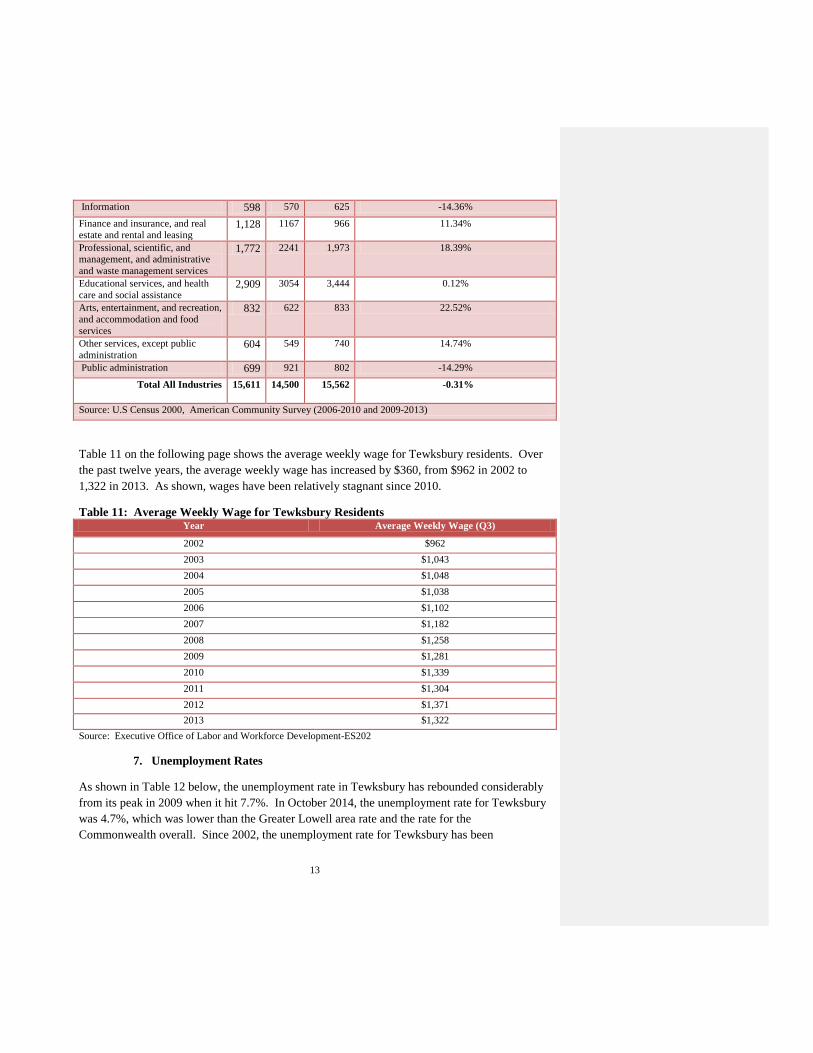
Table 11 on the following page shows the average weekly wage for Tewksbury residents. Over the past twelve years, the average weekly wage has increased by $360, from $962 in 2002 to 1,322 in 2013. As shown, wages have been relatively stagnant since 2010.
Table 11: Average Weekly Wage for Tewksbury Residents Year Average Weekly Wage (Q3)
2002 $962 2003 $1,043 2004 $1,048 2005 $1,038 2006 $1,102 2007 $1,182 2008 $1,258 2009 $1,281 2010 $1,339 2011 $1,304 2012 $1,371 2013 $1,322
Source: Executive Office of Labor and Workforce Development-ES202
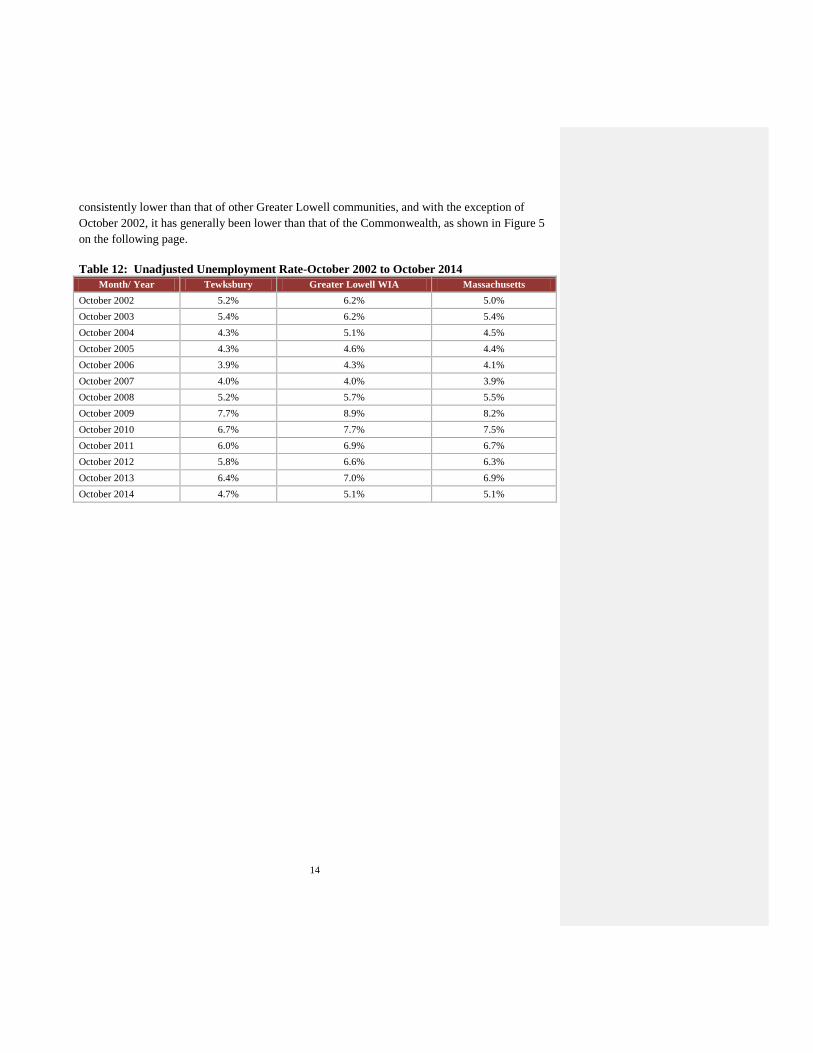
7. Unemployment Rates
As shown in Table 12 below, the unemployment rate in Tewksbury has rebounded considerably from its peak in 2009 when it hit 7.7%. In October 2014, the unemployment rate for Tewksbury was 4.7%, which was lower than the Greater Lowell area rate and the rate for the Commonwealth overall. Since 2002, the unemployment rate for Tewksbury has been
14
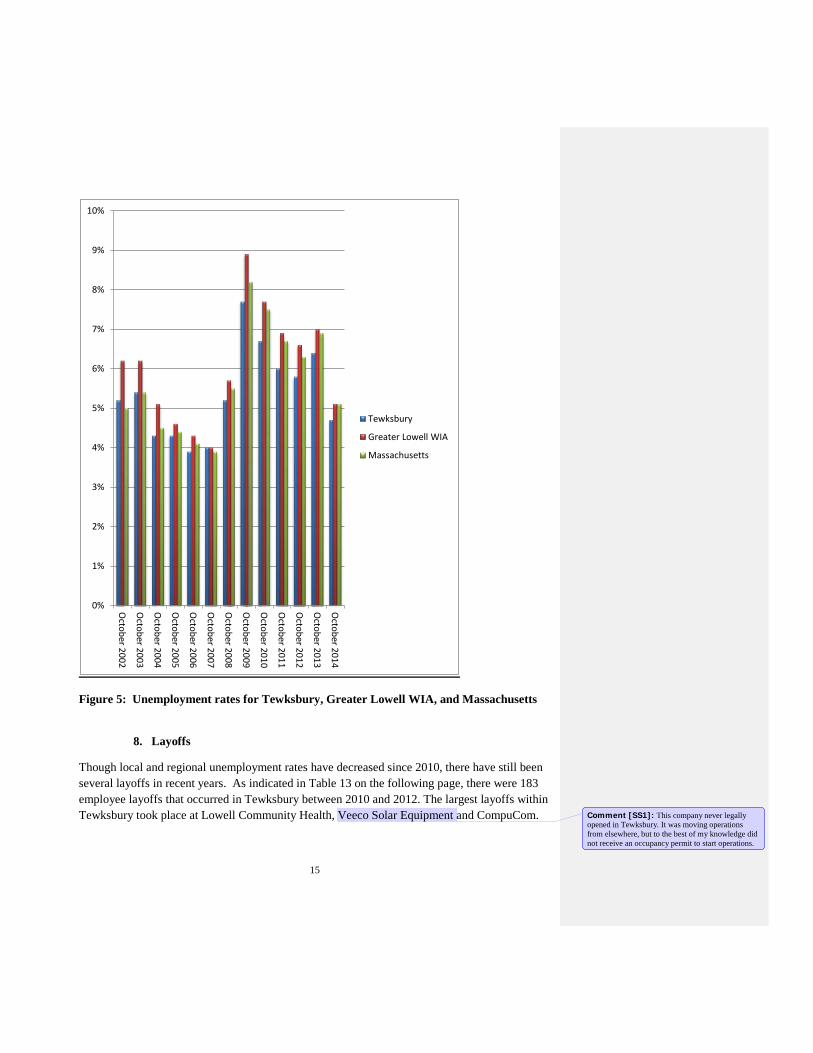
consistently lower than that of other Greater Lowell communities, and with the exception of October 2002, it has generally been lower than that of the Commonwealth, as shown in Figure 5 on the following page. Table 12: Unadjusted Unemployment Rate-October 2002 to October 2014
Month/ Year Tewksbury Greater Lowell WIA Massachusetts October 2002 5.2% 6.2% 5.0% October 2003 5.4% 6.2% 5.4% October 2004 4.3% 5.1% 4.5% October 2005 4.3% 4.6% 4.4% October 2006 3.9% 4.3% 4.1% October 2007 4.0% 4.0% 3.9% October 2008 5.2% 5.7% 5.5% October 2009 7.7% 8.9% 8.2% October 2010 6.7% 7.7% 7.5% October 2011 6.0% 6.9% 6.7% October 2012 5.8% 6.6% 6.3% October 2013 6.4% 7.0% 6.9% October 2014 4.7% 5.1% 5.1%
15
Figure 5: Unemployment rates for Tewksbury, Greater Lowell WIA, and Massachusetts
8. Layoffs
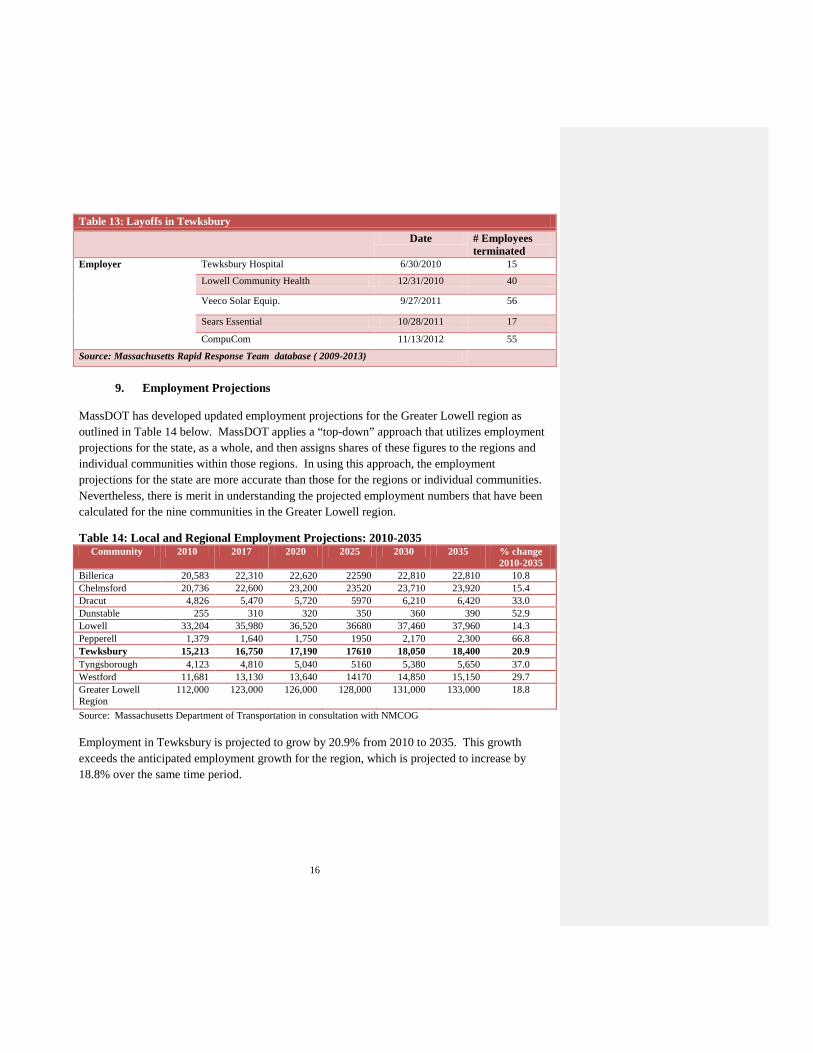
Though local and regional unemployment rates have decreased since 2010, there have still been several layoffs in recent years. As indicated in Table 13 on the following page, there were 183 employee layoffs that occurred in Tewksbury between 2010 and 2012. The largest layoffs within Tewksbury took place at Lowell Community Health, Veeco Solar Equipment and CompuCom.
0%
1%
2%
3%
4%
5%
6%
7%
8%
9%
10%
October 2002
October 2003
October 2004
October 2005
October 2006
October 2007
October 2008
October 2009
October 2010
October 2011
October 2012
October 2013
October 2014
Tewksbury
Greater Lowell WIA
Massachusetts
Comment [SS1]: This company never legally opened in Tewksbury. It was moving operations from elsewhere, but to the best of my knowledge did not receive an occupancy permit to start operations.
16
Table 13: Layoffs in Tewksbury Date # Employees
terminated Employer
Tewksbury Hospital 6/30/2010 15
Lowell Community Health 12/31/2010 40
Veeco Solar Equip. 9/27/2011 56
Sears Essential 10/28/2011 17
CompuCom 11/13/2012 55
Source: Massachusetts Rapid Response Team database ( 2009-2013)
9. Employment Projections
MassDOT has developed updated employment projections for the Greater Lowell region as outlined in Table 14 below. MassDOT applies a “top-down” approach that utilizes employment projections for the state, as a whole, and then assigns shares of these figures to the regions and individual communities within those regions. In using this approach, the employment projections for the state are more accurate than those for the regions or individual communities. Nevertheless, there is merit in understanding the projected employment numbers that have been calculated for the nine communities in the Greater Lowell region.
Table 14: Local and Regional Employment Projections: 2010-2035 Community 2010 2017 2020 2025 2030 2035 % change
2010-2035 Billerica 20,583 22,310 22,620 22590 22,810 22,810 10.8 Chelmsford 20,736 22,600 23,200 23520 23,710 23,920 15.4 Dracut 4,826 5,470 5,720 5970 6,210 6,420 33.0 Dunstable 255 310 320 350 360 390 52.9 Lowell 33,204 35,980 36,520 36680 37,460 37,960 14.3 Pepperell 1,379 1,640 1,750 1950 2,170 2,300 66.8 Tewksbury 15,213 16,750 17,190 17610 18,050 18,400 20.9 Tyngsborough 4,123 4,810 5,040 5160 5,380 5,650 37.0 Westford 11,681 13,130 13,640 14170 14,850 15,150 29.7 Greater Lowell Region
112,000 123,000 126,000 128,000 131,000 133,000 18.8
Source: Massachusetts Department of Transportation in consultation with NMCOG Employment in Tewksbury is projected to grow by 20.9% from 2010 to 2035. This growth exceeds the anticipated employment growth for the region, which is projected to increase by 18.8% over the same time period.
17
B. Business Community
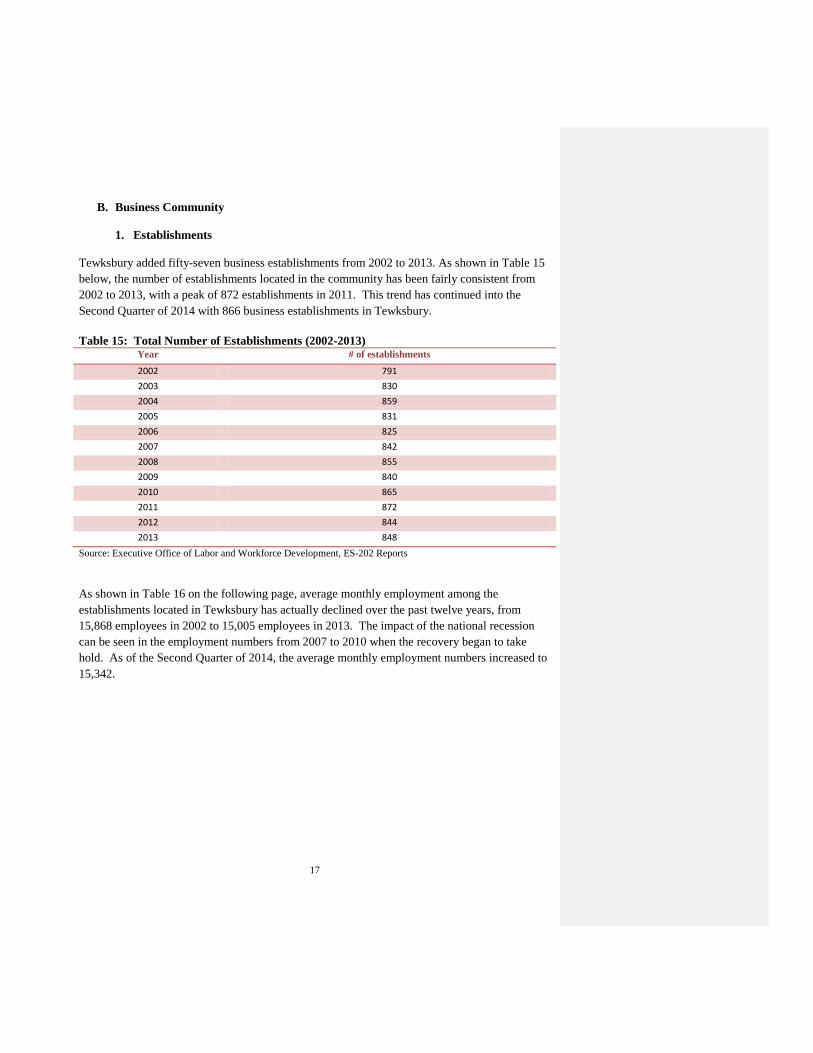
1. Establishments Tewksbury added fifty-seven business establishments from 2002 to 2013. As shown in Table 15 below, the number of establishments located in the community has been fairly consistent from 2002 to 2013, with a peak of 872 establishments in 2011. This trend has continued into the Second Quarter of 2014 with 866 business establishments in Tewksbury. Table 15: Total Number of Establishments (2002-2013)
Year # of establishments 2002 791 2003 830 2004 859 2005 831 2006 825 2007 842 2008 855 2009 840 2010 865 2011 872 2012 844 2013 848
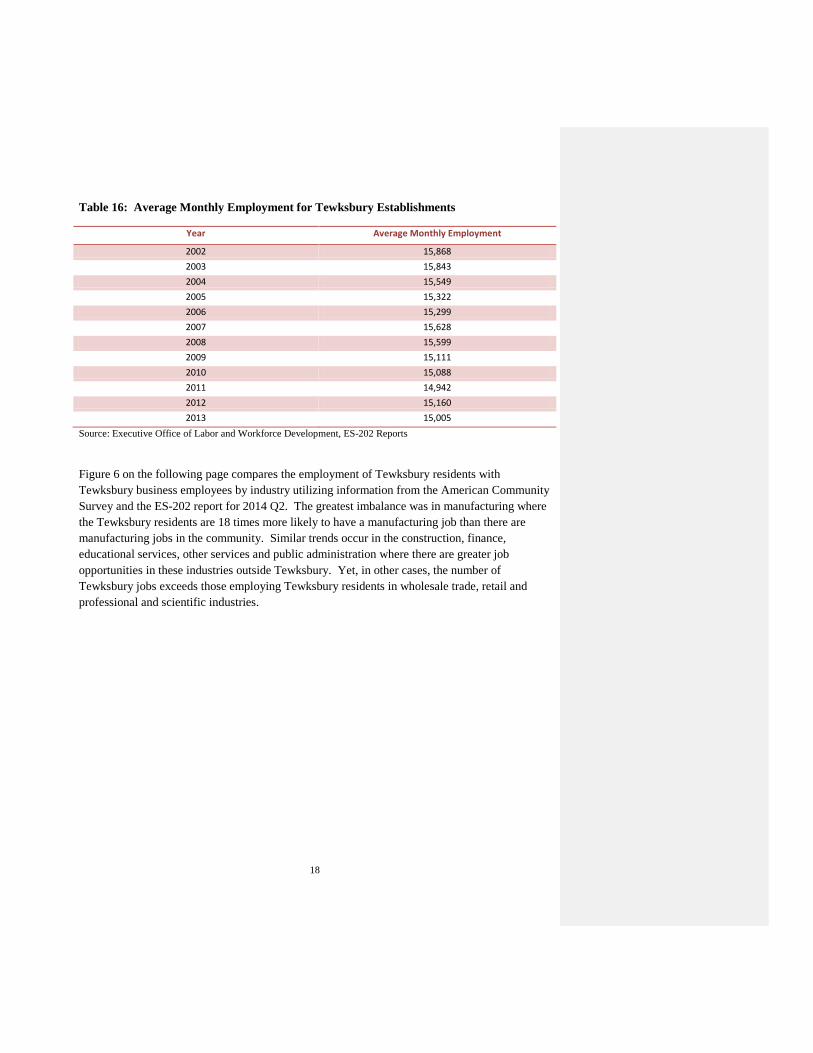
Source: Executive Office of Labor and Workforce Development, ES-202 Reports As shown in Table 16 on the following page, average monthly employment among the establishments located in Tewksbury has actually declined over the past twelve years, from 15,868 employees in 2002 to 15,005 employees in 2013. The impact of the national recession can be seen in the employment numbers from 2007 to 2010 when the recovery began to take hold. As of the Second Quarter of 2014, the average monthly employment numbers increased to 15,342.
18
Table 16: Average Monthly Employment for Tewksbury Establishments
Year Average Monthly Employment
2002 15,868 2003 15,843 2004 15,549 2005 15,322 2006 15,299 2007 15,628 2008 15,599 2009 15,111 2010 15,088 2011 14,942 2012 15,160 2013 15,005
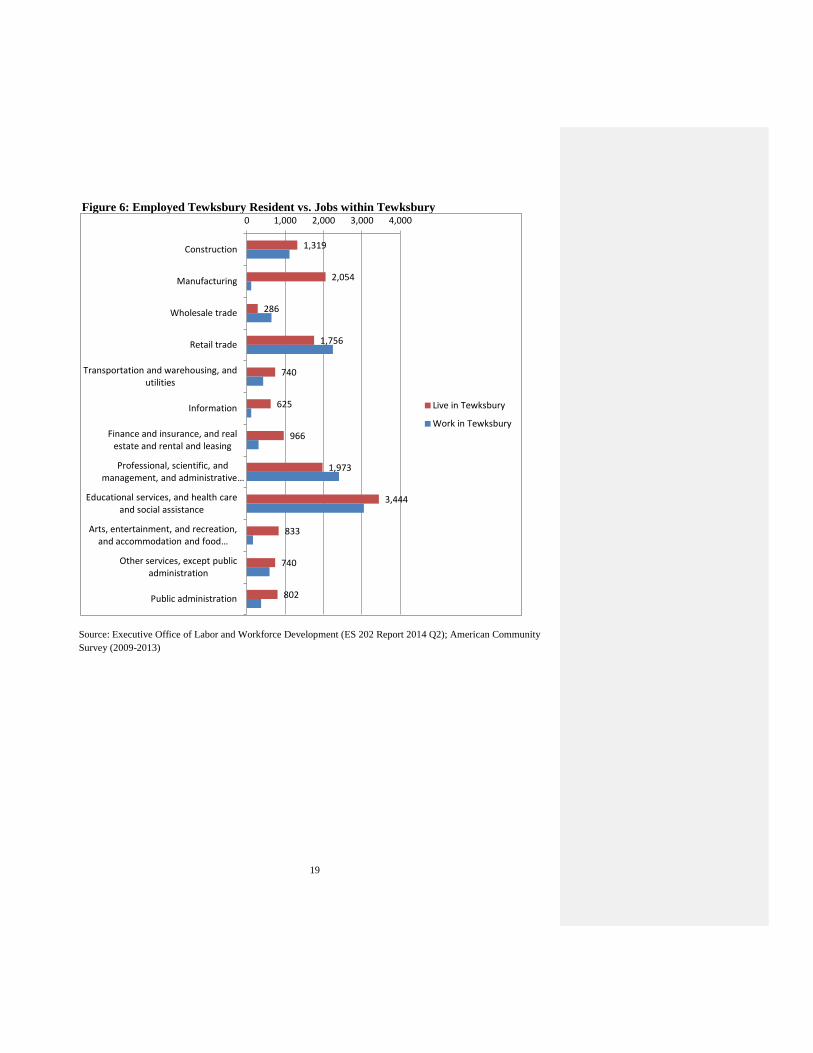
Source: Executive Office of Labor and Workforce Development, ES-202 Reports Figure 6 on the following page compares the employment of Tewksbury residents with Tewksbury business employees by industry utilizing information from the American Community Survey and the ES-202 report for 2014 Q2. The greatest imbalance was in manufacturing where the Tewksbury residents are 18 times more likely to have a manufacturing job than there are manufacturing jobs in the community. Similar trends occur in the construction, finance, educational services, other services and public administration where there are greater job opportunities in these industries outside Tewksbury. Yet, in other cases, the number of Tewksbury jobs exceeds those employing Tewksbury residents in wholesale trade, retail and professional and scientific industries.
19
Figure 6: Employed Tewksbury Resident vs. Jobs within Tewksbury
Source: Executive Office of Labor and Workforce Development (ES 202 Report 2014 Q2); American Community Survey (2009-2013)
1,319
2,054
286
1,756
740
625
966
1,973
3,444
833
740
802
0 1,000 2,000 3,000 4,000
Construction
Manufacturing
Wholesale trade
Retail trade
Transportation and warehousing, and utilities
Information
Finance and insurance, and real estate and rental and leasing
Professional, scientific, and management, and administrative …
Educational services, and health care and social assistance
Arts, entertainment, and recreation, and accommodation and food …
Other services, except public administration
Public administration
Live in Tewksbury
Work in Tewksbury
20
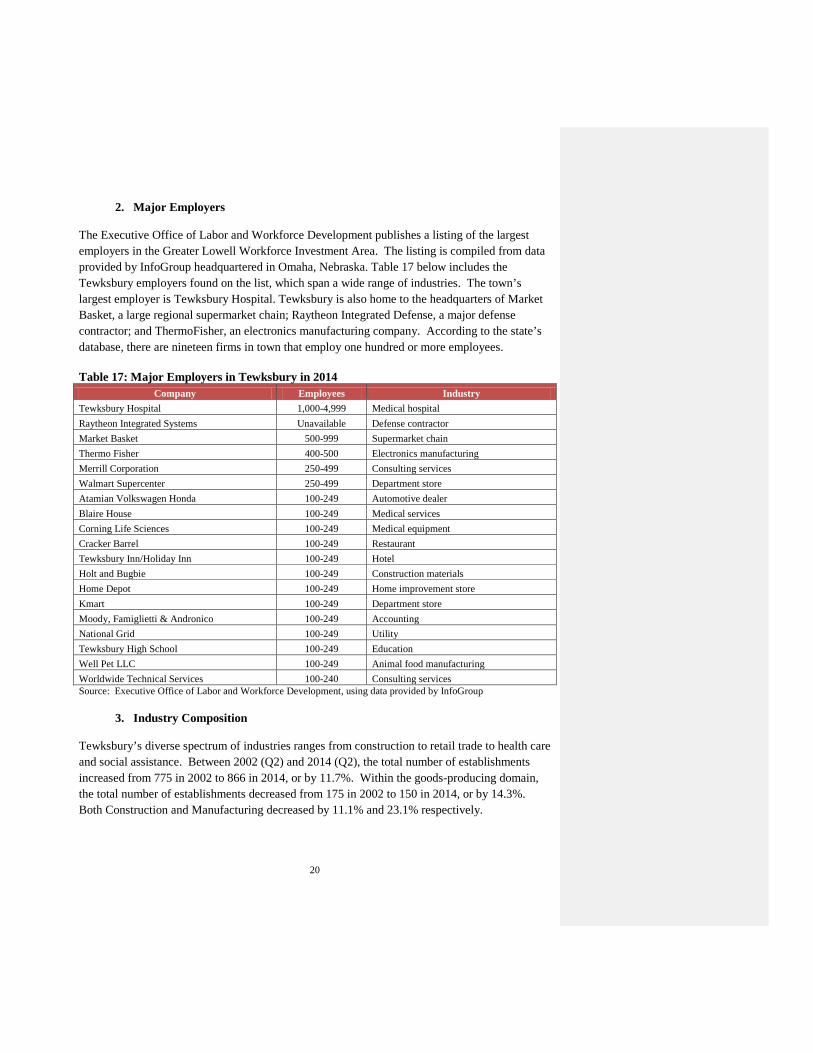
2. Major Employers The Executive Office of Labor and Workforce Development publishes a listing of the largest employers in the Greater Lowell Workforce Investment Area. The listing is compiled from data provided by InfoGroup headquartered in Omaha, Nebraska. Table 17 below includes the Tewksbury employers found on the list, which span a wide range of industries. The town’s largest employer is Tewksbury Hospital. Tewksbury is also home to the headquarters of Market Basket, a large regional supermarket chain; Raytheon Integrated Defense, a major defense contractor; and ThermoFisher, an electronics manufacturing company. According to the state’s database, there are nineteen firms in town that employ one hundred or more employees. Table 17: Major Employers in Tewksbury in 2014
Company Employees Industry Tewksbury Hospital 1,000-4,999 Medical hospital Raytheon Integrated Systems Unavailable Defense contractor Market Basket 500-999 Supermarket chain Thermo Fisher 400-500 Electronics manufacturing Merrill Corporation 250-499 Consulting services Walmart Supercenter 250-499 Department store Atamian Volkswagen Honda 100-249 Automotive dealer Blaire House 100-249 Medical services Corning Life Sciences 100-249 Medical equipment Cracker Barrel 100-249 Restaurant Tewksbury Inn/Holiday Inn 100-249 Hotel Holt and Bugbie 100-249 Construction materials Home Depot 100-249 Home improvement store Kmart 100-249 Department store Moody, Famiglietti & Andronico 100-249 Accounting National Grid 100-249 Utility Tewksbury High School 100-249 Education Well Pet LLC 100-249 Animal food manufacturing Worldwide Technical Services 100-240 Consulting services Source: Executive Office of Labor and Workforce Development, using data provided by InfoGroup
3. Industry Composition Tewksbury’s diverse spectrum of industries ranges from construction to retail trade to health care and social assistance. Between 2002 (Q2) and 2014 (Q2), the total number of establishments increased from 775 in 2002 to 866 in 2014, or by 11.7%. Within the goods-producing domain, the total number of establishments decreased from 175 in 2002 to 150 in 2014, or by 14.3%. Both Construction and Manufacturing decreased by 11.1% and 23.1% respectively.

21
In the service-providing domain, the total number of establishments increased from 600 in 2002 to 716 in 2014, or by 19.3%. Among those industries where the number of establishments increased were Education and Health Services (139.1%), Public Administration (40%), Information (33.3%), Leisure and Hospitality (20.8%), Professional and Business Services (5.8%), and Other Services (3.7%). Several industries in the service-providing domain experienced decreases in the number of establishments, including Financial Activities (-10.7%) and Trade, Transportation and Utilities (-0.6%). Within the Financial Activities industry, Real Estate and Rental and Leasing establishments decreased by 20% or 6 firms. The changes in industry composition largely reflect the changes in the region moving from a goods-producing domain to a service-providing domain. Outlined below in Table 18 is a summary of the changes in Tewksbury’s industry composition from 2002 Q2 to 2014 Q2. Table 18: Changes in Local Industry Composition: 2002 (Q2) - 2014 (Q2)
Industry Type Number of Establishments Percent Change
2002-2014 Number of Establishments 2002
(Q2) 2014 (Q2)
Goods-Producing Domain 175 150 -14.3
Construction 135 120 -11.1
Manufacturing 39 30* -23.1
NONDUR - Non Durable Goods Manufacturing 7 5 -28.6
Service-Providing Domain 600 716 19.3
Trade, Transportation and Utilities 165 164 -0.6
Wholesale Trade 48 46 -4.2
Retail Trade 87 88 1.1
Transportation and Warehousing 27 27 0
Information 9 12 33.3
Financial Activities 56 50 -10.7
Finance and Insurance 26 26 0
Real Estate and Rental and Leasing 30 24 -20.0
Professional and Business Services 137 145 5.8
Professional and Technical Services 87 98 12.6
Administrative and Waste Services 48 43 -10.4
Education and Health Services 64 153 139.1
Health Care and Social Assistance 54 136 151.9
Leisure and Hospitality 77 93 20.8
Arts, Entertainment, and Recreation 11 12 9.1
Accommodation and Food Services 66 81 22.7
Other Services 82 85 3.7
22
Public Administration 10 14 40.0
Total All Industries 775 866 11.7%
Source: Executive Office of Labor and Workforce Development, ES-202 Reports
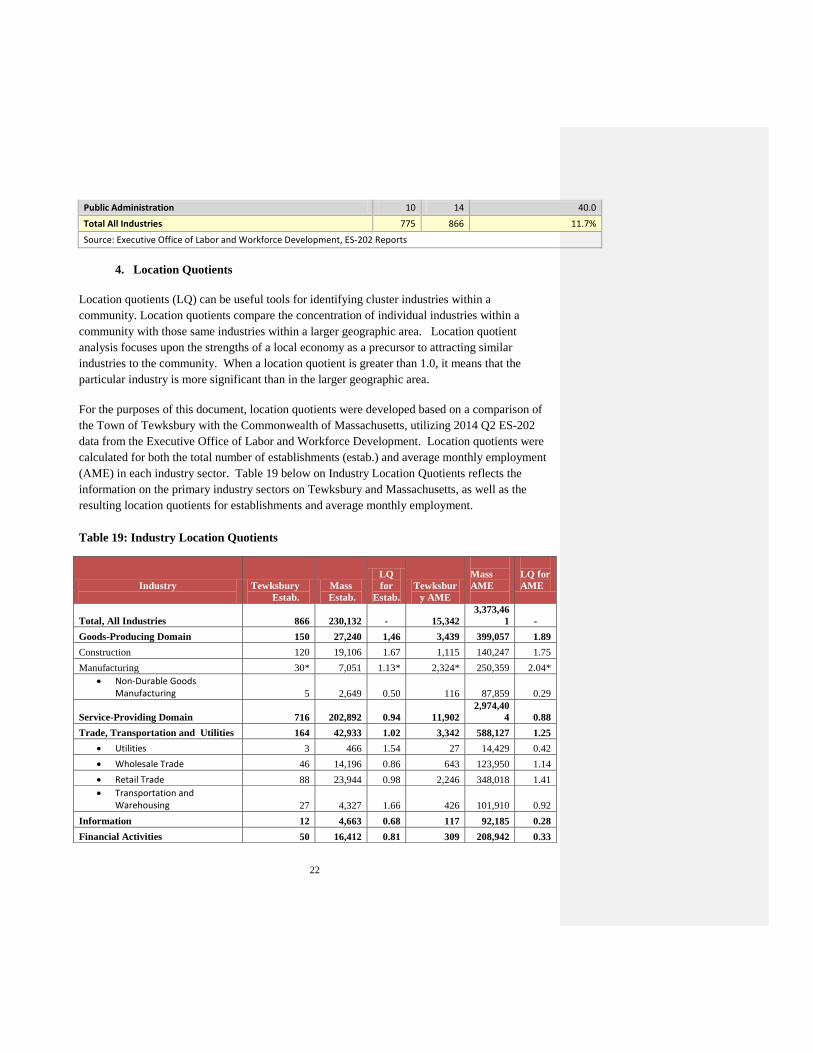
4. Location Quotients
Location quotients (LQ) can be useful tools for identifying cluster industries within a community. Location quotients compare the concentration of individual industries within a community with those same industries within a larger geographic area. Location quotient analysis focuses upon the strengths of a local economy as a precursor to attracting similar industries to the community. When a location quotient is greater than 1.0, it means that the particular industry is more significant than in the larger geographic area. For the purposes of this document, location quotients were developed based on a comparison of the Town of Tewksbury with the Commonwealth of Massachusetts, utilizing 2014 Q2 ES-202 data from the Executive Office of Labor and Workforce Development. Location quotients were calculated for both the total number of establishments (estab.) and average monthly employment (AME) in each industry sector. Table 19 below on Industry Location Quotients reflects the information on the primary industry sectors on Tewksbury and Massachusetts, as well as the resulting location quotients for establishments and average monthly employment. Table 19: Industry Location Quotients
Industry
Tewksbury Estab.
Mass Estab.
LQ for
Estab. Tewksbur
y AME
Mass AME
LQ for AME
Total, All Industries 866 230,132 - 15,342 3,373,46
1 - Goods-Producing Domain 150 27,240 1,46 3,439 399,057 1.89 Construction 120 19,106 1.67 1,115 140,247 1.75 Manufacturing 30* 7,051 1.13* 2,324* 250,359 2.04*
• Non-Durable Goods Manufacturing 5 2,649 0.50 116 87,859 0.29
Service-Providing Domain 716 202,892 0.94 11,902 2,974,40
4 0.88 Trade, Transportation and Utilities 164 42,933 1.02 3,342 588,127 1.25
• Utilities 3 466 1.54 27 14,429 0.42 • Wholesale Trade 46 14,196 0.86 643 123,950 1.14 • Retail Trade 88 23,944 0.98 2,246 348,018 1.41 • Transportation and
Warehousing 27 4,327 1.66 426 101,910 0.92 Information 12 4,663 0.68 117 92,185 0.28 Financial Activities 50 16,412 0.81 309 208,942 0.33
23
• Finance and Insurance 26 9,869 0.70 189 165,506 0.25 • Real Estate and Rental and
Leasing 24 6,543 0.97 121 43,436 0.61 Professional and Business Services 145 43,935 0.88 2,401 524,805 1.01
• Professional and Technical Services 98 30,506 0.85 1,379 285,511 1.06
• Administrative and Waste Services 43 12,074 0.95 343 175,596 0.43
Education and Health Services 153 48,948 0.83 3,052 952,106 0.70 • Health Care and Social
Assistance 136 4,235 8.53 2,322 595,968 0.86 Leisure and Hospitality 93 20,171 1.23 1,715 354,016 1.07
• Arts, Entertainment, and Recreation 12 3,664 0.87 160 60,964 0.58
• Accommodation and Food Services 81 16,507 1.30 1,555 293,052 1.17
Other Services , except Public Admin. 85 21,804 1.04 593 116,958 1.12 Public Administration 14 4,026 0.92 373 137,264 0.60
Source: Executive Office of Labor and Workforce Development, ES-202 reports Note: * Estimates for manufacturing in 2014 Q2 – approximately 30 establishments and 2,324 employees.
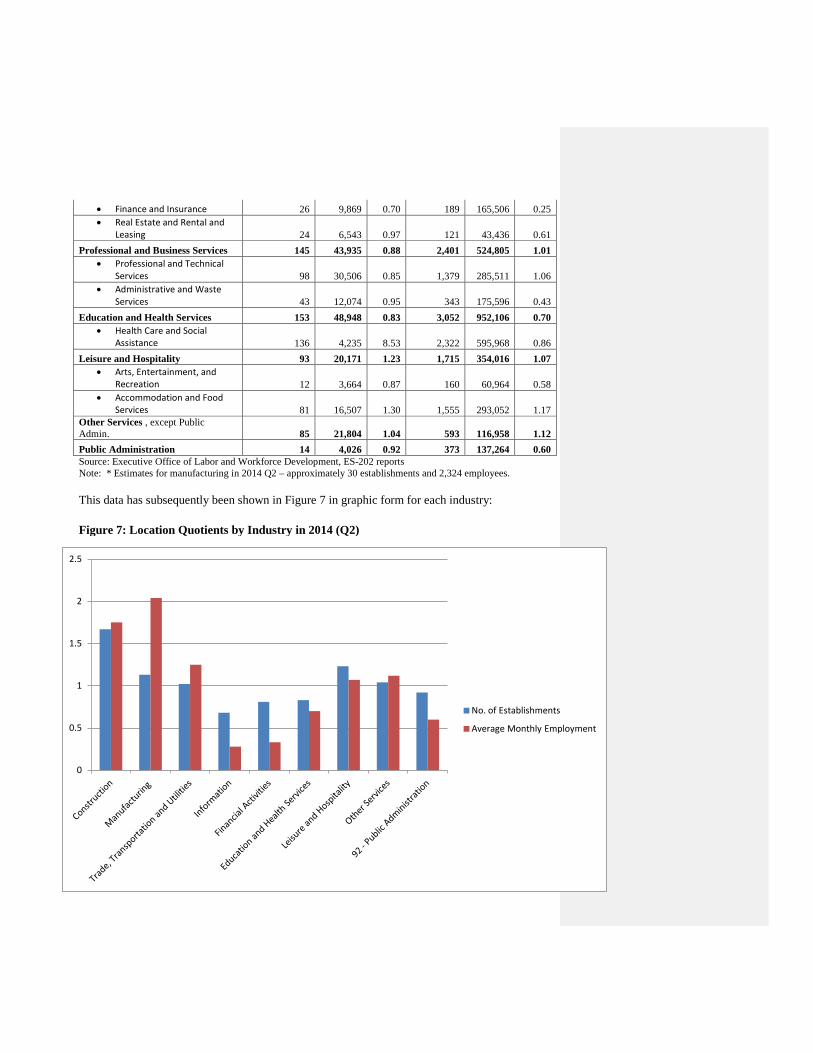
This data has subsequently been shown in Figure 7 in graphic form for each industry: Figure 7: Location Quotients by Industry in 2014 (Q2)
Source: Executive Office of Labor and Workforce Development, ES-202 reports.
As shown in Figure 8, five out of the nine primary industry sectors in Tewksbury had significant location quotients for number of establishments and for average monthly employment. In particular, both Construction and Manufacturing reflect the concentration of these establishments in the Town of Tewksbury and should be supported. Additional analysis should be done on the
0
0.5
1
1.5
2
2.5
No. of Establishments
Average Monthly Employment
24
As shown in Figure 7, five out of the nine primary industry sectors in Tewksbury had significant location quotients for number of establishments and for average monthly employment. In particular, both Construction and Manufacturing reflect the concentration of these establishments in the Town of Tewksbury and should be supported. Additional analysis should be done on the industry subsectors to determine the location quotients for each one and to outline a blueprint for the Economic Development Committee to market the advantages within the Town of Tewksbury and to attract additional industries in these subsectors.
5. Wages By Industry The wages provided by industry in Tewksbury contribute a great deal to the local economy. Between 2002 (Q2) and 2014 (Q2), the total number of establishments in all industries increased from 775 in 2002 to 866 in 2014, or by 11.7%.. However, the average monthly employment decreased from 16,068 in 2002 to 15,342 in 2014, or by 4.5%. During this same period, the total wages paid in all industries increased by 33.7% from $195,696,175 in 2002 to $261,659,072 in 2014. The average weekly wages increased from $937 in 2002 to $1,312 in 2014, or by 40%. Within the Goods-Producing Domain, the total number of establishments decreased by 14.3% from 175 establishments in 2002 to 150 establishments in 2014. This employment sector is comprised largely of the construction and manufacturing industries. The average monthly employment also decreased from 3,919 in 2002 to 3,439 in 2014, or by 12.2%. As shown in Table 20 on the following page, the total wages in this employment sector increased significantly, notwithstanding the decrease in the number of establishments, from $74,672,918 in 2002 to $112,157,036 in 2014, or by 50.2%. The average weekly wages also increased significantly from $ 1,466 in 2002 to $2,509 in 2014 or by 71.1%. Within the construction industry, total wages increased by 28.1% between 2002 and 2014, while average weekly wages increased by 18%. Similarly, in the manufacturing industry, it is estimated that the total wages increased by 54.4% between 2002 and 2014 and the average weekly wages increased by 13.6%. Estimates were developed due to the suppression of the manufacturing industry information in 2014.

25
Table 20: Total Wages and Average Weekly Wages By Industry: 2002 (Q2) and 2014 (Q2) Total Wages (Q3) Percent Average Weekly Percent
Industry
Change Wages (Q3) Change 2002 2014 2002-2014 2002 2014 2002-2014 Total, All Industries $195,696,175 $261,659,072 33.7 $937 $1,312 40.0 Goods-Producing Domain $74,672,918 $112,157,036 50.2 $1,466 $2,509 71.1 Construction $11,803,777 $15,116,387 28.1 $884 $1,043 18.0 Manufacturing $62,865,541 $97,040,649* 54.4* $1,673 $1,900* 13.6*
• Non-Durable Goods Manufacturing $3,815,526 $1,750,961 -54.1 $1,011 $1,161 14.8
Service-Providing Domain $121,023,257 $149,502,036 23.5 $766 $966 26.1 Trade, Transportation and Utilities $25,582,229 $30,191,677 18.0 $632 $695 10.0
• Utilities $897,447 $840,850 -6.3 $1,523 $2,396 57.3 • Wholesale Trade $10,769,960 $11,999,118 11.4 $1,086 $1,435 32.1 • Retail Trade $12,027,929 $13,626,111 13.3 $447 $467 4.5 • Transportation and
Warehousing $1,886,893 $3,725,598 97.4 $607 $673 10.9 Information $9,684,588 $2,851,865 -70.6 $1,754 $1,875 -6.9 Financial Activities $8,707,731 $4,196,712 -51.8 $800 $1,045 30.6
• Finance and Insurance $6,380,802 $2,672,746 -58.1 $790 $1,088 37.7 • Real Estate and Rental and
Leasing $2,326,929 $1,523,966 -34.5 $829 $969 16.9 Professional and Business Services $37,944,998 $59,075,225 55.7 $1,123 $1,893 68.6
• Professional and Technical Services $28,319,229 $46,466,751 64.1 $1,450 $2,592 78.8
• Administrative and Waste Services $5,189,197 $3,779,624 27.2 $741 $848 14.4
Education and Health Services $24,188,723 $34,179,886 41.3 $681 $861 26.4 • Health Care and Social
Assistance $16,267,028 $26,247,752 61.4 $607 $870 43.3 Leisure and Hospitality $5,243,896 $7,780,201 48.4 $267 $349 30.7
• Arts, Entertainment, and Recreation $595,573 $896,232 50.5 $250 $431 72.4
• Accommodation and Food Services $4,648,323 $6,883,969 48.1 $269 $341 26.8
Other Services , except Public Admin. $5,877,515 $5,196,029 -11.6 $732 $674 -7.9 Public Administration $3,793,576 $6,030,441 59.0 $940 $1,244 32.3
Source: Executive Office of Labor and Workforce Development, ES-202 reports Note: * Estimates for manufacturing in 2014 Q2 – approximately 30 establishments and 2,324 employees.
Within the Service-Providing Domain, the total number of establishments increased from 600 in 2002 to 716 in 2014, or by 19.3%. The average monthly employment decreased by 2% from 12,149 in 2002 to 11,902 in 2014. The total wages increased by 23.5% from $ 121,023,257 in 2002 to $ 149,502,036 in 2014, which was slightly less than half of the wage increase in the
26
Goods-Producing Domain. The average weekly wages increased by 26.1% from $766 in 2002 to $966 in 2014. The wage levels in the Service-Providing Domain, compared to the Goods-Producing Domain, ranged from 52.3% in 2002 to 38.5% in 2014. In analyzing the industry sectors within the Service-Providing Domain, it became clear that each industry sector had different experiences from 2002 to 2014 as outlined below:
• The Trade, Transportation and Utilities industry sector had a similar number of establishments in 2002 and 2014 and a 7.3% decrease in employment, yet experienced a 18% increase in total wages and a 10% increase in average weekly wages.
• Within the Information industry sector, the number of establishments increased from 9 to 12 firms and average monthly employment increased by 263.2%. Yet, total wages and the average weekly wage decreased by 70.6% and 6.9% respectively.
• The Financial Activities industry sector experienced a 10.7% decrease in the number of establishments and a 63.1% decrease in average monthly employment. As a result, total wages decreased by 51.8%, but average weekly wages increased by 30.6%. Within this industry sector, Finance and Insurance (-58.1%) and Real Estate and Rental and Leasing (-34.5%) also had decreases in total wages and increases in average weekly wages.
• Within the Professional and Business Services industry sector, eight additional firms were added between 2002 and 2014, yet the average monthly employment decreased by 7.6%. Both total wages (55.7%) and the average weekly wage (68.6%) increased, attaining some of the highest wage levels in the Service-Providing Domain.
• The number of establishments within the Education and Health Services industry sector more than doubled from 64 establishments in 2002 to 153 establishments in 2014. Average monthly employment only increased by 11.6%, but total wages increased by 41.3% and average weekly wages increased by 26.4%.
• Within the Leisure and Hospitality industry sector, the number of establishments increased by 20.8% and the average monthly employment increased by 13.5%. Total wages and average weekly wages increased by 48.4% and 30.7% respectively.
• The number of establishments in Other Services increased by three firms, but lost 4% in average monthly employment. Both wages and average weekly wages decreased by 11.6% and 7.9% respectively.
• Four additional establishments were added to the Public Administration industry sector resulting in a 20.3% increase in average monthly employment. Total wages increased by 59% and average weekly wages increased by 32.3%.
C. Infrastructure
The following section examines the existing sewer, water supply infrastructure and utilities within the community. The provision of adequate infrastructure greatly enhances the economic development potential of the town. Many studies have found evidence of large private sector
27
productivity gains from public infrastructure investments, in many cases with higher returns than private capital investment. Research has shown that well designed infrastructure investments can raise economic growth, productivity, and land values. Private developers assess the quality of a community’s infrastructure to determine whether to invest in that community. The Town of Tewksbury enjoys a level of infrastructure generally unmatched in other suburban communities. With a completed sewer infrastructure and access to water and other utilities, the community offers a complete package to private developers interested in expanding or locating their operations. This section provides a summary of what’s available in Tewksbury related to its overall infrastructure. A version of this summary should be made available on the town’s web site so that private site locators will be alerted to the availability of a range of infrastructure in Tewksbury.
1. Public Water Supply
The Town of Tewksbury’s water treatment plant has the capacity to treat up to seven million gallons of water per day. The Town’s drinking water supply is drawn entirely from the Merrimack River. The Massachusetts Surface Water Quality Standards classify the River as a Class B waterway, which means that water withdrawn from the River must be treated. Municipal water is available to 98% of the town.
The Town operates it’s own water treatment plant and manages the distribution system. In 2002, the Town increased the capacity of its water treatment plant from 3.5 to 7.0 million gallons per day. In 2013, the water treatment plant pumped 894.9 million gallons of water, for an average of 2.45 gallons per day, with a peak usage of 4.562 million gallons on July 1, 2013. The consumption rates for residential, industrial and municipal usage in 2013 was as follows:
• Residential use was 565.8 million gallons (63%) or 53.0 gallons per person per day; • Industrial use was 125.9 million gallons (14%); and • Municipal use was 50.0 million gallons, including 16 million gallons used for the annual
water system flushing program.
The town is undertaking an engineering evaluation to determine whether the 25-year old water treatment plant is in need of upgrading.
There are two pressure boosting stations, and three storage tanks with a total storage capacity of seven million gallons. The site of the town’s first storage tank located at Catamount Street Road (aka Ames Hill), which is still in use, is home to the two (2) underground storage tanks which were built circa 1951 and 1958. Each tank can hold up to 500,000 gallons of water. In 1971 an elevated storage tank was constructed at Astle Street, which was refurbished and can store up to 1,000,000 gallons of water. In August 2007, the Town completed the construction of a wire
28
wound pre-stressed concrete tank that can hold 5 million gallons of water, which is located on Colonial Drive. This tank is the largest pumped tank in New England and provides a low profile.
The distribution system also contains thousands of line gates, hydrants, and over 180 miles of water mains and water service lines used to convey potable water to over 10,000 residential and commercial facilities.
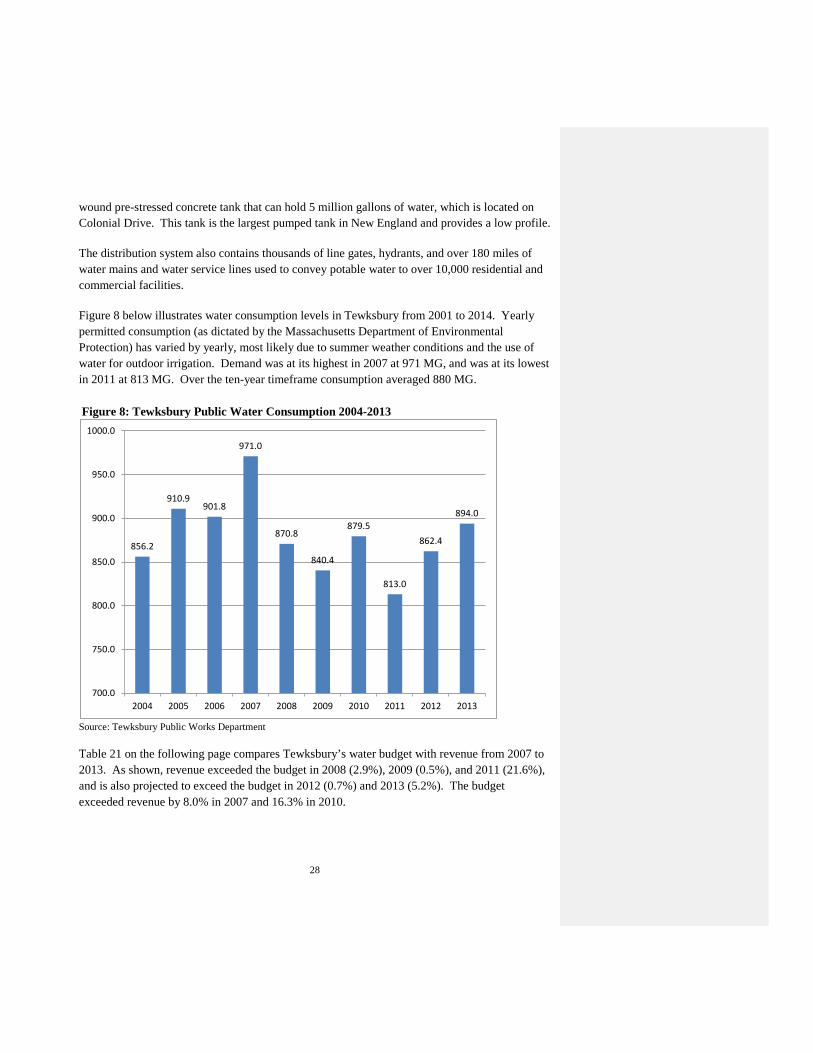
Figure 8 below illustrates water consumption levels in Tewksbury from 2001 to 2014. Yearly permitted consumption (as dictated by the Massachusetts Department of Environmental Protection) has varied by yearly, most likely due to summer weather conditions and the use of water for outdoor irrigation. Demand was at its highest in 2007 at 971 MG, and was at its lowest in 2011 at 813 MG. Over the ten-year timeframe consumption averaged 880 MG. Figure 8: Tewksbury Public Water Consumption 2004-2013
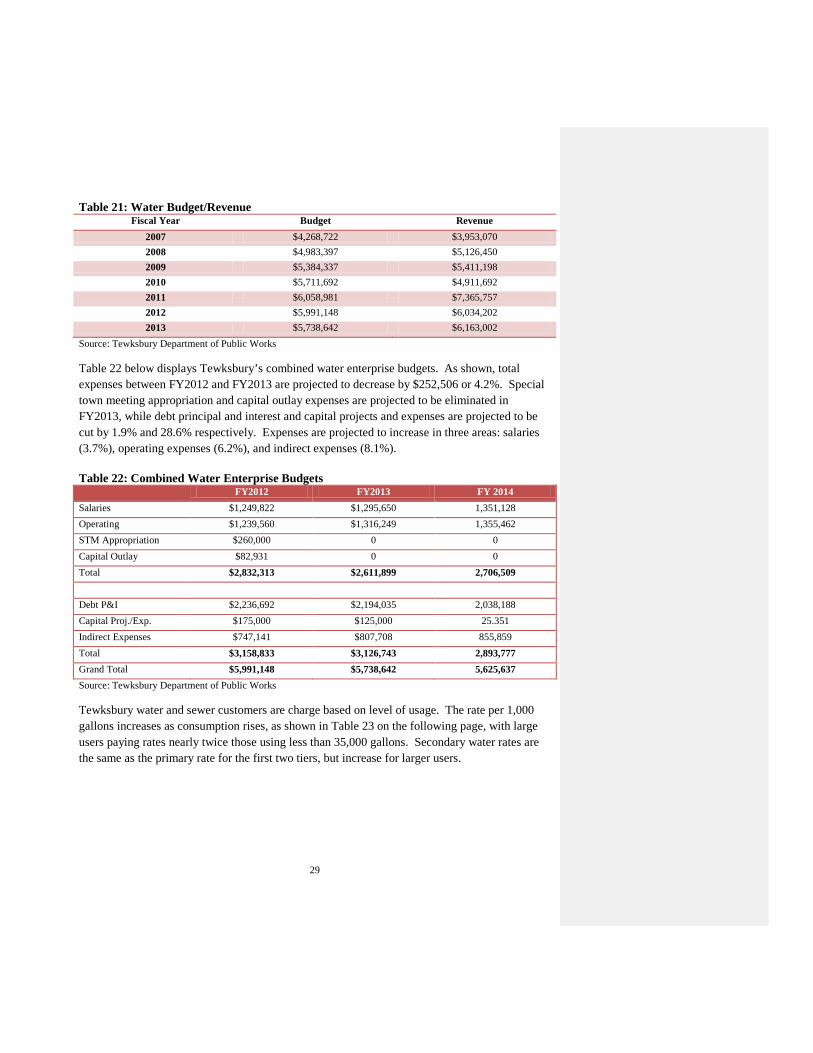
Source: Tewksbury Public Works Department Table 21 on the following page compares Tewksbury’s water budget with revenue from 2007 to 2013. As shown, revenue exceeded the budget in 2008 (2.9%), 2009 (0.5%), and 2011 (21.6%), and is also projected to exceed the budget in 2012 (0.7%) and 2013 (5.2%). The budget exceeded revenue by 8.0% in 2007 and 16.3% in 2010.
856.2
910.9 901.8
971.0
870.8
840.4
879.5
813.0
862.4
894.0
700.0
750.0
800.0
850.0
900.0
950.0
1000.0
2004 2005 2006 2007 2008 2009 2010 2011 2012 2013
29
Table 21: Water Budget/Revenue Fiscal Year Budget Revenue
2007 $4,268,722 $3,953,070 2008 $4,983,397 $5,126,450 2009 $5,384,337 $5,411,198 2010 $5,711,692 $4,911,692 2011 $6,058,981 $7,365,757 2012 $5,991,148 $6,034,202 2013 $5,738,642 $6,163,002
Source: Tewksbury Department of Public Works Table 22 below displays Tewksbury’s combined water enterprise budgets. As shown, total expenses between FY2012 and FY2013 are projected to decrease by $252,506 or 4.2%. Special town meeting appropriation and capital outlay expenses are projected to be eliminated in FY2013, while debt principal and interest and capital projects and expenses are projected to be cut by 1.9% and 28.6% respectively. Expenses are projected to increase in three areas: salaries (3.7%), operating expenses (6.2%), and indirect expenses (8.1%). Table 22: Combined Water Enterprise Budgets
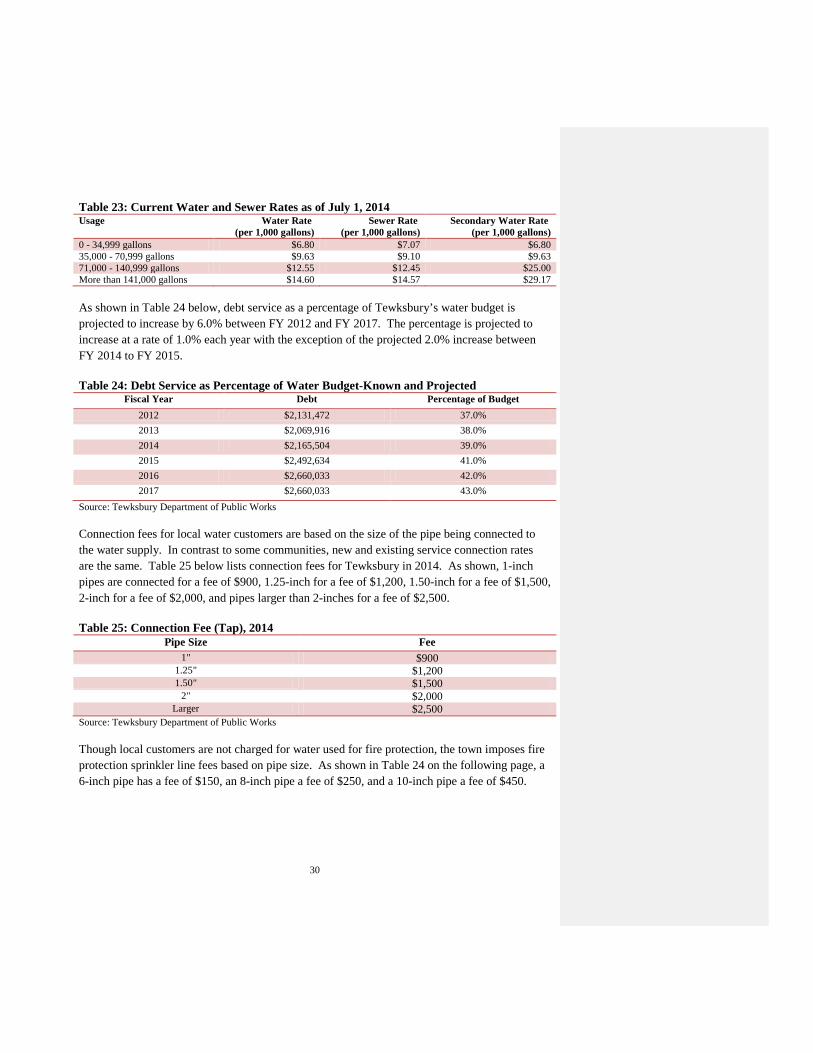
FY2012 FY2013 FY 2014 Salaries $1,249,822 $1,295,650 1,351,128 Operating $1,239,560 $1,316,249 1,355,462 STM Appropriation $260,000 0 0 Capital Outlay $82,931 0 0 Total $2,832,313 $2,611,899 2,706,509 Debt P&I $2,236,692 $2,194,035 2,038,188 Capital Proj./Exp. $175,000 $125,000 25.351 Indirect Expenses $747,141 $807,708 855,859 Total $3,158,833 $3,126,743 2,893,777 Grand Total $5,991,148 $5,738,642 5,625,637 Source: Tewksbury Department of Public Works Tewksbury water and sewer customers are charge based on level of usage. The rate per 1,000 gallons increases as consumption rises, as shown in Table 23 on the following page, with large users paying rates nearly twice those using less than 35,000 gallons. Secondary water rates are the same as the primary rate for the first two tiers, but increase for larger users.
30
Table 23: Current Water and Sewer Rates as of July 1, 2014 Usage Water Rate
(per 1,000 gallons) Sewer Rate
(per 1,000 gallons) Secondary Water Rate
(per 1,000 gallons) 0 - 34,999 gallons $6.80 $7.07 $6.80 35,000 - 70,999 gallons $9.63 $9.10 $9.63 71,000 - 140,999 gallons $12.55 $12.45 $25.00 More than 141,000 gallons $14.60 $14.57 $29.17 As shown in Table 24 below, debt service as a percentage of Tewksbury’s water budget is projected to increase by 6.0% between FY 2012 and FY 2017. The percentage is projected to increase at a rate of 1.0% each year with the exception of the projected 2.0% increase between FY 2014 to FY 2015. Table 24: Debt Service as Percentage of Water Budget-Known and Projected
Fiscal Year Debt Percentage of Budget 2012 $2,131,472 37.0% 2013 $2,069,916 38.0% 2014 $2,165,504 39.0% 2015 $2,492,634 41.0% 2016 $2,660,033 42.0% 2017 $2,660,033 43.0%
Source: Tewksbury Department of Public Works Connection fees for local water customers are based on the size of the pipe being connected to the water supply. In contrast to some communities, new and existing service connection rates are the same. Table 25 below lists connection fees for Tewksbury in 2014. As shown, 1-inch pipes are connected for a fee of $900, 1.25-inch for a fee of $1,200, 1.50-inch for a fee of $1,500, 2-inch for a fee of $2,000, and pipes larger than 2-inches for a fee of $2,500. Table 25: Connection Fee (Tap), 2014
Pipe Size Fee 1" $900
1.25" $1,200 1.50" $1,500
2" $2,000 Larger $2,500
Source: Tewksbury Department of Public Works Though local customers are not charged for water used for fire protection, the town imposes fire protection sprinkler line fees based on pipe size. As shown in Table 24 on the following page, a 6-inch pipe has a fee of $150, an 8-inch pipe a fee of $250, and a 10-inch pipe a fee of $450.
31
Table 26: Tewksbury Sprinkler Lines Fees, 2014
Pipe Size Fee 6" $150 8" $250
10" $450 Source: Tewksbury Department of Public Works
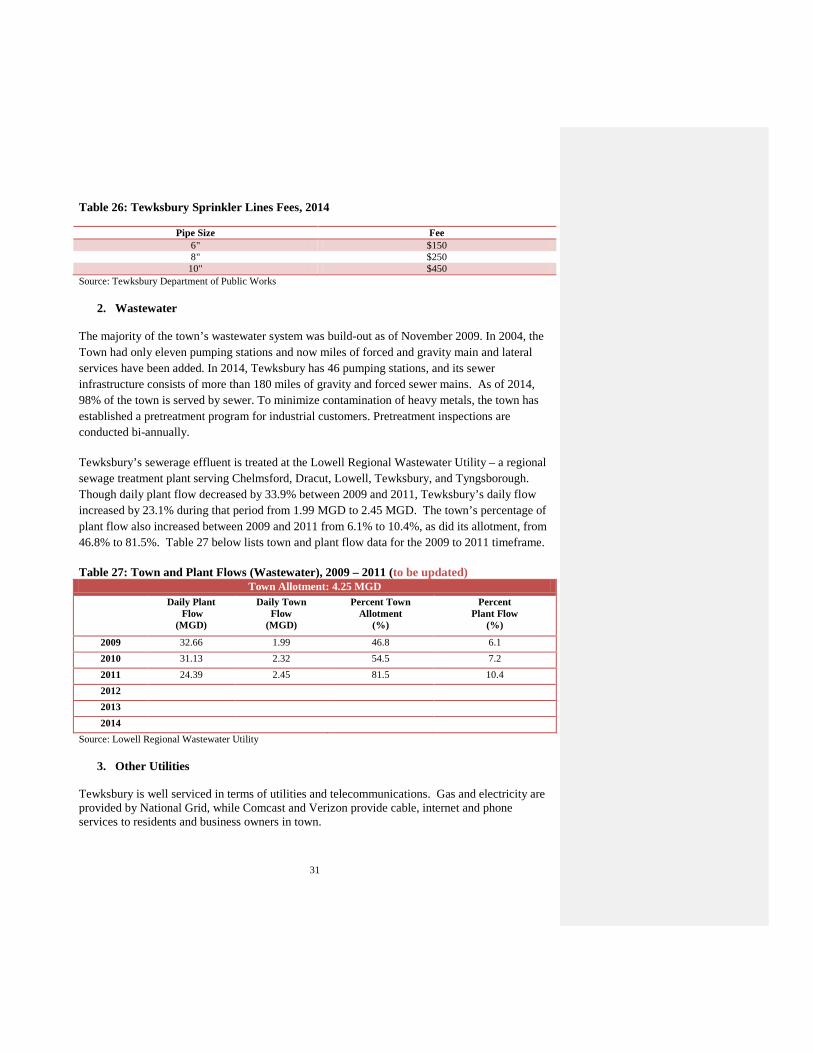
2. Wastewater
The majority of the town’s wastewater system was build-out as of November 2009. In 2004, the Town had only eleven pumping stations and now miles of forced and gravity main and lateral services have been added. In 2014, Tewksbury has 46 pumping stations, and its sewer infrastructure consists of more than 180 miles of gravity and forced sewer mains. As of 2014, 98% of the town is served by sewer. To minimize contamination of heavy metals, the town has established a pretreatment program for industrial customers. Pretreatment inspections are conducted bi-annually.
Tewksbury’s sewerage effluent is treated at the Lowell Regional Wastewater Utility – a regional sewage treatment plant serving Chelmsford, Dracut, Lowell, Tewksbury, and Tyngsborough. Though daily plant flow decreased by 33.9% between 2009 and 2011, Tewksbury’s daily flow increased by 23.1% during that period from 1.99 MGD to 2.45 MGD. The town’s percentage of plant flow also increased between 2009 and 2011 from 6.1% to 10.4%, as did its allotment, from 46.8% to 81.5%. Table 27 below lists town and plant flow data for the 2009 to 2011 timeframe. Table 27: Town and Plant Flows (Wastewater), 2009 – 2011 (to be updated)
Town Allotment: 4.25 MGD
Daily Plant
Flow (MGD)
Daily Town Flow
(MGD)
Percent Town Allotment
(%)
Percent Plant Flow
(%)
2009 32.66 1.99 46.8 6.1 2010 31.13 2.32 54.5 7.2 2011 24.39 2.45 81.5 10.4 2012 2013 2014
Source: Lowell Regional Wastewater Utility
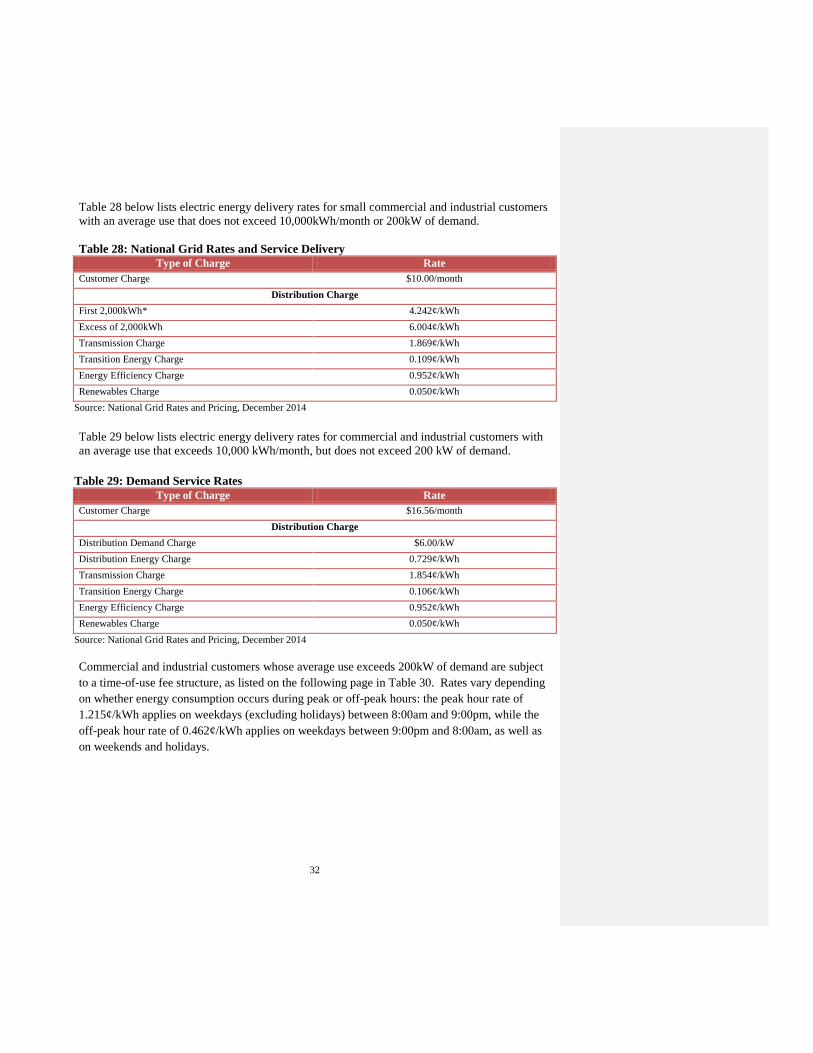
3. Other Utilities Tewksbury is well serviced in terms of utilities and telecommunications. Gas and electricity are provided by National Grid, while Comcast and Verizon provide cable, internet and phone services to residents and business owners in town.
32
Table 28 below lists electric energy delivery rates for small commercial and industrial customers with an average use that does not exceed 10,000kWh/month or 200kW of demand. Table 28: National Grid Rates and Service Delivery
Type of Charge Rate Customer Charge $10.00/month
Distribution Charge First 2,000kWh* 4.242¢/kWh Excess of 2,000kWh 6.004¢/kWh Transmission Charge 1.869¢/kWh Transition Energy Charge 0.109¢/kWh Energy Efficiency Charge 0.952¢/kWh Renewables Charge 0.050¢/kWh
Source: National Grid Rates and Pricing, December 2014
Table 29 below lists electric energy delivery rates for commercial and industrial customers with an average use that exceeds 10,000 kWh/month, but does not exceed 200 kW of demand.
Table 29: Demand Service Rates
Type of Charge Rate Customer Charge $16.56/month
Distribution Charge Distribution Demand Charge $6.00/kW Distribution Energy Charge 0.729¢/kWh Transmission Charge 1.854¢/kWh Transition Energy Charge 0.106¢/kWh Energy Efficiency Charge 0.952¢/kWh Renewables Charge 0.050¢/kWh
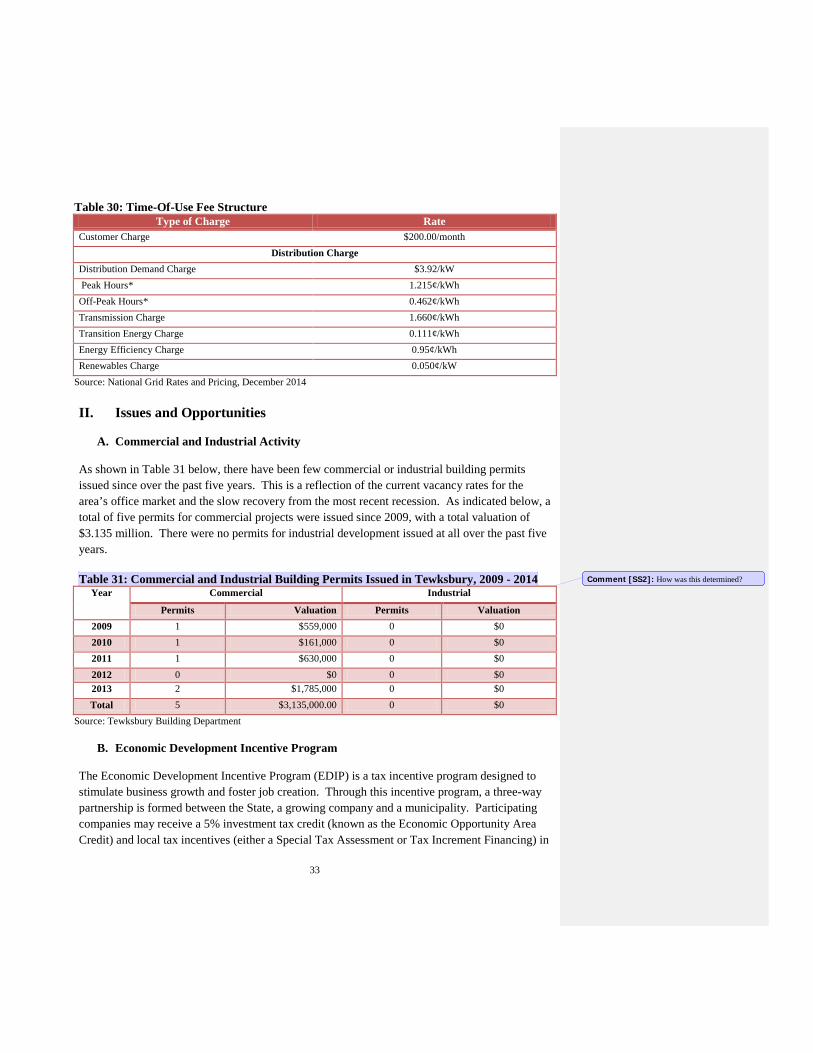
Source: National Grid Rates and Pricing, December 2014 Commercial and industrial customers whose average use exceeds 200kW of demand are subject to a time-of-use fee structure, as listed on the following page in Table 30. Rates vary depending on whether energy consumption occurs during peak or off-peak hours: the peak hour rate of 1.215¢/kWh applies on weekdays (excluding holidays) between 8:00am and 9:00pm, while the off-peak hour rate of 0.462¢/kWh applies on weekdays between 9:00pm and 8:00am, as well as on weekends and holidays.
33
Table 30: Time-Of-Use Fee Structure Type of Charge Rate
Customer Charge $200.00/month Distribution Charge
Distribution Demand Charge $3.92/kW Peak Hours* 1.215¢/kWh Off-Peak Hours* 0.462¢/kWh Transmission Charge 1.660¢/kWh Transition Energy Charge 0.111¢/kWh Energy Efficiency Charge 0.95¢/kWh Renewables Charge 0.050¢/kW
Source: National Grid Rates and Pricing, December 2014
II. Issues and Opportunities
A. Commercial and Industrial Activity As shown in Table 31 below, there have been few commercial or industrial building permits issued since over the past five years. This is a reflection of the current vacancy rates for the area’s office market and the slow recovery from the most recent recession. As indicated below, a total of five permits for commercial projects were issued since 2009, with a total valuation of $3.135 million. There were no permits for industrial development issued at all over the past five years. Table 31: Commercial and Industrial Building Permits Issued in Tewksbury, 2009 - 2014
Year Commercial Industrial
Permits Valuation Permits Valuation 2009 1 $559,000 0 $0 2010 1 $161,000 0 $0 2011 1 $630,000 0 $0 2012 0 $0 0 $0 2013 2 $1,785,000 0 $0 Total 5 $3,135,000.00 0 $0
Source: Tewksbury Building Department
B. Economic Development Incentive Program The Economic Development Incentive Program (EDIP) is a tax incentive program designed to stimulate business growth and foster job creation. Through this incentive program, a three-way partnership is formed between the State, a growing company and a municipality. Participating companies may receive a 5% investment tax credit (known as the Economic Opportunity Area Credit) and local tax incentives (either a Special Tax Assessment or Tax Increment Financing) in
Comment [SS2]: How was this determined?
34
exchange for job creation and private investment commitments. TIF is authorized by M.G.L. c 40 and allows municipalities to grant property tax exemptions to property owners under the EDIP program. TIF Agreements must be approved by the municipality’s legislative and executive bodies, as well as the Economic Assistance Coordinating Council (EACC) at the state level. A TIF Zone must be in an area approved by the EACC as an Economic Opportunity Area (EOA) or found to be an area “presenting exceptional opportunities for economic development” by the Director of Development.
In 2010, the Town was designated as an Economic Target Area (ETA) and negotiated a tax increment financing (TIF) deal with Thermo-Fisher Scientific to locate at 2 Radcliff Road in a 140,000 square foot facility that was previously vacated by Avid Technologies. This reuse brought 400 employees to Tewksbury with a projected 100 more employees to be added over the next five years.
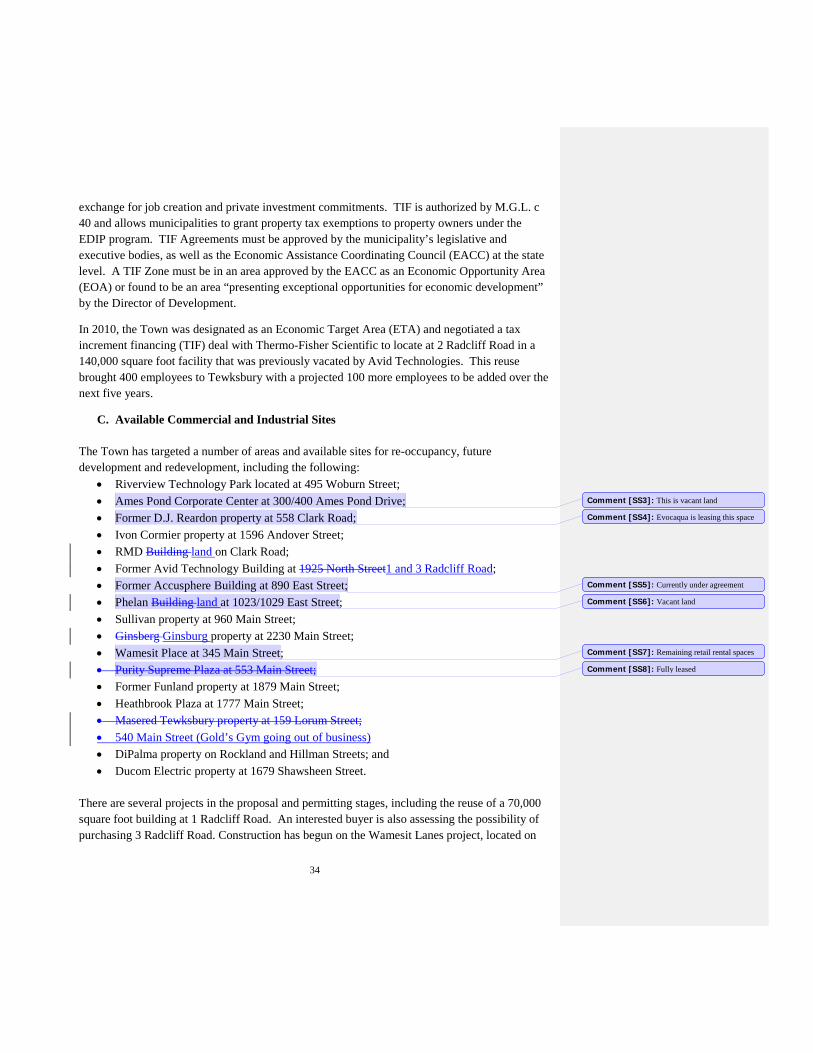
C. Available Commercial and Industrial Sites The Town has targeted a number of areas and available sites for re-occupancy, future development and redevelopment, including the following:
• Riverview Technology Park located at 495 Woburn Street; • Ames Pond Corporate Center at 300/400 Ames Pond Drive; • Former D.J. Reardon property at 558 Clark Road; • Ivon Cormier property at 1596 Andover Street; • RMD Building land on Clark Road; • Former Avid Technology Building at 1925 North Street1 and 3 Radcliff Road; • Former Accusphere Building at 890 East Street; • Phelan Building land at 1023/1029 East Street; • Sullivan property at 960 Main Street; • Ginsberg Ginsburg property at 2230 Main Street; • Wamesit Place at 345 Main Street; • Purity Supreme Plaza at 553 Main Street; • Former Funland property at 1879 Main Street; • Heathbrook Plaza at 1777 Main Street; • Masered Tewksbury property at 159 Lorum Street; • 540 Main Street (Gold’s Gym going out of business) • DiPalma property on Rockland and Hillman Streets; and • Ducom Electric property at 1679 Shawsheen Street.
There are several projects in the proposal and permitting stages, including the reuse of a 70,000 square foot building at 1 Radcliff Road. An interested buyer is also assessing the possibility of purchasing 3 Radcliff Road. Construction has begun on the Wamesit Lanes project, located on
Comment [SS3]: This is vacant land
Comment [SS4]: Evocaqua is leasing this space
Comment [SS5]: Currently under agreement
Comment [SS6]: Vacant land
Comment [SS7]: Remaining retail rental spaces
Comment [SS8]: Fully leased
35
the former Caswell Motel site. The project entails construction of a new 40,000 square foot building that will contain a bowling alley, restaurant and family entertainment center. The owner of 937 Main Street is proposing to construct a new 21,520 sf mixed-use commercial building on the 3-acre parcel. The project would be developed under the Mixed Use Overlay Bylaw. A mixed use development is also proposed at 1438 Main Street. That project will involve construction of an 8,500 square foot office building and twelve residential units. There is an active proposal to redevelop a 32.2-acre parcel located on Victor Drive which was formerly used as for a single-family residence and greenhouse complex. The proposed project consists of 30,000 square feet of retail and 192 garden style rental units.
D. Marketing and Branding Various public agencies, quasi-public organizations, and public/private partnerships provide statewide and national marketing for designated priority development sites and other key properties. These organizations include the Massachusetts Office of Business Development (MOBD), the MassEcon, MassDevelopment, Merrimack Valley Economic Development Council (MVEDC). In addition, the Town has established its own Economic Development Committee.
Within the Route 3 portion of Greater Lowell, the communities of Burlington, Bedford, Billerica, Chelmsford and Lowell worked with EOHED to develop a marketing/branding program for the Route 3 corridor known as Middlesex 3. In conjunction with the business community, the municipalities sought to design a program that would immediately conjure up the image of this area through a creative branding strategy. The work on the branding strategy came about as a result of the Chapter 43D grant administered by the Town of Billerica, whereby a consultant was hired to identify the barriers to further development along the Route 3 and Middlesex Turnpike corridors. Recently, the Town of Tewksbury joined Middlesex 3, along with the Towns of Tyngsborough and Lexington.
Tewksbury was also named a Gold-rated Bioready Community in January 2009 by the Massachusetts Biotechnology Council. Communities with a gold rating have established policies that are aimed at streamlining the processes that lead to construction and renovation of facilities for biotechnology and life sciences.
On a broader scale, MVEDC has worked on a branding strategy for the area from Pepperell to Newburyport that would reflect the diverse characteristics of the Merrimack Valley communities. Working with the local and regional Chambers of Commerce, as well as the state tourism agencies, MVEDC felt that there were numerous attractions in the region to support its Creative Economy initiative and to encourage more private investment in the cultural and
36
creative economy throughout the region. Tewksbury is a member of the MVEDC, and town representatives sit on its Board of Directors.
The Town established an Economic Development Committee in 2007 to promote Tewksbury’s identity in the Merrimack Valley and Greater Boston area. The Economic Development Committee strives to foster and maintain a favorable business environment and acts as a liaison between businesses and government, to facilitate streamlined review and approval processes and assistance programs. Over the past several years the activities of the Economic Development Committee have included the following:
• Hosted business breakfasts with the Greater Lowell Chamber of Commerce in 2008 and 2009;
• Received certified Gold Bioready Status from the Massachusetts Biotech Council in 2009;
• Received approval of Joint Economic Target Area in 2010; • Developed a marketing piece for Tewksbury in 2012; • In response to the concerns of economic Development stakeholders, Board of Selectmen
created the Economic Development Review Process Committee to evaluate the town’s permitting process across all departments.;
• In 2014, Tewksbury contracted with Northeastern University’s Dukakis Center for EDSAT in 2014, using DLTA funds and NMCOG assistance, joined the Middlesex 3 Coalition, and contracted with Co-Star, a site finding service; and
• The Town is now working with Lowell Sun staff in a Route 38 Insert which will be published in advance of the 2015 Business Breakfast.
E. Completed Projects and Economic Development Successes
The Town has had several recent successes in attracting economic development. In 2012, ThermoFisher relocated to 2 Radcliff Road in Tewksbury, reusing a 140,000 sf building for electronics manufacturing, as previously discussed. Recently, the 750,000 square foot 495 Network Center was sold and the Town is now working with the new owner on tenant fit up. Much of economic activity has taken place along the Main Street corridor. Ocean State Job Lots and Workout World recently relocated to the previously vacant Purity Supreme space on Main Street. The former Grand Prix site located at 2087 Main Street has been redeveloped as the Merrimack Valley Pavillion. The project entailed the renovation of a 4,800 sf existing building and construction of a new 4,000 sf addition, for laser tag, mini-golf, an arcade, and family entertainment. In 2013, Walmart, located at 333 Main Street, added 21,000 sf to their existing 120,000 sf retail store to become s full-service “Super Walmart”. Heath Brook Plaza, which had been largely vacant for several years, has made a comeback and will be nearly full soon with the addition of a restaurant and hardware store
37
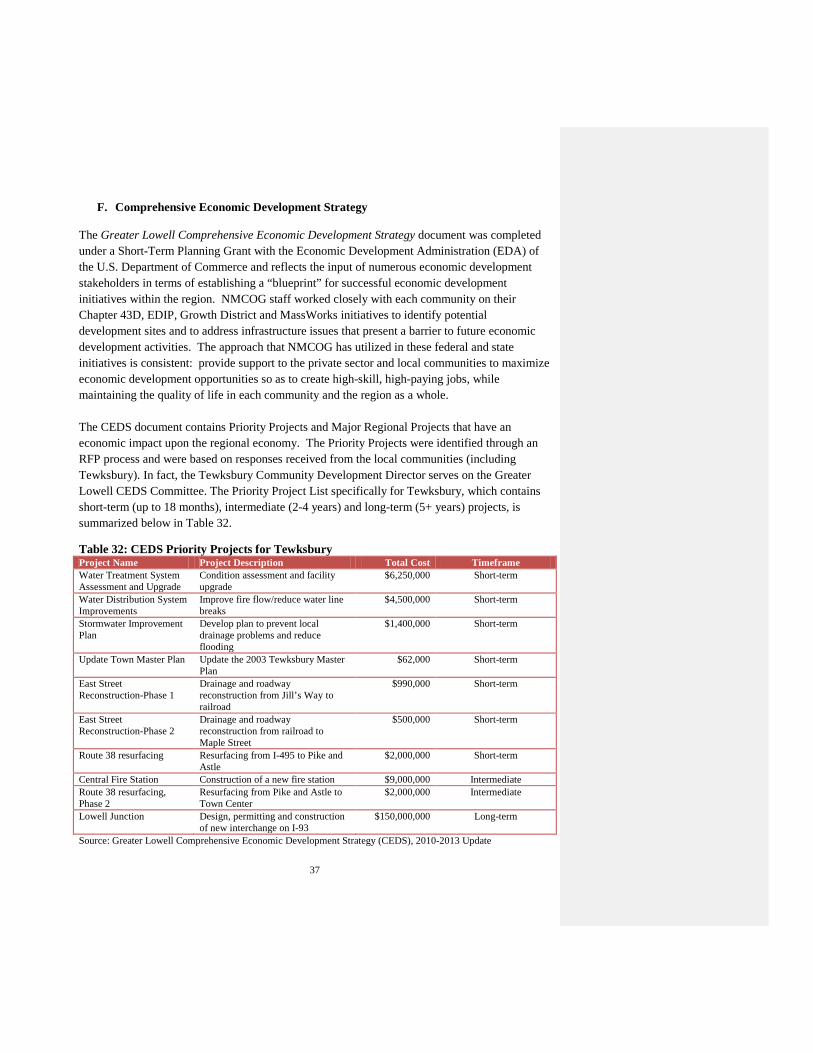
F. Comprehensive Economic Development Strategy The Greater Lowell Comprehensive Economic Development Strategy document was completed under a Short-Term Planning Grant with the Economic Development Administration (EDA) of the U.S. Department of Commerce and reflects the input of numerous economic development stakeholders in terms of establishing a “blueprint” for successful economic development initiatives within the region. NMCOG staff worked closely with each community on their Chapter 43D, EDIP, Growth District and MassWorks initiatives to identify potential development sites and to address infrastructure issues that present a barrier to future economic development activities. The approach that NMCOG has utilized in these federal and state initiatives is consistent: provide support to the private sector and local communities to maximize economic development opportunities so as to create high-skill, high-paying jobs, while maintaining the quality of life in each community and the region as a whole. The CEDS document contains Priority Projects and Major Regional Projects that have an economic impact upon the regional economy. The Priority Projects were identified through an RFP process and were based on responses received from the local communities (including Tewksbury). In fact, the Tewksbury Community Development Director serves on the Greater Lowell CEDS Committee. The Priority Project List specifically for Tewksbury, which contains short-term (up to 18 months), intermediate (2-4 years) and long-term (5+ years) projects, is summarized below in Table 32.
Table 32: CEDS Priority Projects for Tewksbury Project Name Project Description Total Cost Timeframe Water Treatment System Assessment and Upgrade
Condition assessment and facility upgrade
$6,250,000 Short-term
Water Distribution System Improvements
Improve fire flow/reduce water line breaks
$4,500,000 Short-term
Stormwater Improvement Plan
Develop plan to prevent local drainage problems and reduce flooding
$1,400,000 Short-term
Update Town Master Plan Update the 2003 Tewksbury Master Plan
$62,000 Short-term
East Street Reconstruction-Phase 1
Drainage and roadway reconstruction from Jill’s Way to railroad
$990,000 Short-term
East Street Reconstruction-Phase 2
Drainage and roadway reconstruction from railroad to Maple Street
$500,000 Short-term
Route 38 resurfacing Resurfacing from I-495 to Pike and Astle
$2,000,000 Short-term
Central Fire Station Construction of a new fire station $9,000,000 Intermediate Route 38 resurfacing, Phase 2
Resurfacing from Pike and Astle to Town Center
$2,000,000 Intermediate
Lowell Junction Design, permitting and construction of new interchange on I-93
$150,000,000 Long-term
Source: Greater Lowell Comprehensive Economic Development Strategy (CEDS), 2010-2013 Update
38
In addition to the Priority Projects, the CEDS document also contains a number of planning objectives, including the following objective relative to Tewksbury:
• Work with the Town of Tewksbury and the Tewksbury Economic Development Committee to complete the Economic Development Statistical Analysis Tool (EDSAT) with Northeastern University and the Economic Development section of the updated Master Plan; and
• Work in partnership with MassDOT and the Town of Tewksbury to implement traffic improvements along the Route 38 corridor.
G. Regional Strategic Plan In 2011, the Regional Strategic Plan for Greater Lowell was funded by the Executive Office of Housing and Economic Development (EOHED) as part of a state initiative to increase local and regional planning capacity in the areas of economic development, housing and resource protection. The Plan identified locations in each community where growth is appropriate based on zoning, infrastructure, access and environmental impacts. The document contains strategies for advancing housing initiatives, and economic development and job creation through cooperative efforts involving local, state and regional levels of government. The economic development goals of the Regional Strategic Plan are as follows:
• Create a regional economic development framework that supports the efforts of private industry, local communities and agencies, educational institutions, federal and state agencies and private foundations to create jobs and improve the quality of life in the region;
• Create higher-skilled, higher wage jobs within industry clusters – biotech, nanotech, high technology, “green” industries, and emerging technology – to diversify the regional economy and focus on the global economy;
• Utilize a combination of economic development and redevelopment strategies that reflects the character of each community, and address infrastructure barriers (roads, wastewater capacity, telecommunications, etc.) to future economic growth; and
• Increase the supply of skilled workers for industry in the region through the integration of economic development and workforce development strategies.
NMCOG staff worked with the planners and community development personnel at the municipal level to develop a list of Priority Economic Development Areas for the Town of Tewksbury. Input was also solicited through the public outreach process which included two public visioning sessions. The following sites were identified during this process:
39
• Lowell Junction area (Priority Development Site under Chapter 43D) • East Street Corridor • Five (5) overlay districts on Route 38, including the Town Center,
Village Residential, South Village, Village Mixed-use and Community Village zoning areas.
• Route 133 • Woburn Street corridor
Each of these areas is discussed in greater detail in the narrative below.
1. Woburn Street Corridor NMCOG assisted the communities of Billerica, Lowell and Tewksbury in examining land use, transportation and economic development issues along the Woburn Street/Billerica Avenue corridor, with an eye toward addressing land use conflicts and identifying opportunities where the communities can work together to promote the corridor for economic development and plan for the future. The Woburn Street/Billerica Avenue Corridor Study Area spans a distance of approximately 1.75 miles, and begins north of the I-495 interchange, at the intersection of Easton Street/Gaudreau Street in Lowell, and extends southeasterly along Woburn Street and Billerica Avenue, through the towns of Tewksbury and Billerica, terminating at the intersection of Mount Pleasant Street in Billerica. Future development and redevelopment within the study area will depend on the uses allowed under each community’s zoning bylaw or ordinance, the availability of adequate infrastructure, and overall market conditions. The corridor is nearly built-out and there is little vacant land available. However, the redevelopment of existing and underutilized parcels will provide future economic development opportunities, particularly within the communities of Billerica and Tewksbury. Within Tewksbury, there are only four (4) parcels of undeveloped land totaling 7.88 acres. The largest parcel is 3.06 acres in size and abuts the Billerica town line. The other three (3) parcels have frontage on Woburn Street and are contiguous lots totaling 4.82 acres and are north of the access road to the former Raytheon building. There are eight (8) parcels comprising 84.10 acres that are considered to be underutilized. The Billerica Business Center, which is located on the Tewksbury town, line has five (5) parcels consisting of 30.72 acres. The Business Center is currently facing an extremely high vacancy rate and holds significant opportunities for economic development. There are five (5) commercial buildings, which are zoned for industrial uses. Further to the west, the former Raytheon building parcel (30.84 acres), including the front parking lot (13 acres), represents a
40
significant redevelopment and development opportunity that will require a cooperative and collaborative working relationship between the three communities.
Since the completion of the Woburn Street Corridor Study, a portion of the former Raytheon property has been redeveloped. A number of additional recommendations were developed for addressing economic development issues within the study area, as outlined below:
• Modify zoning to allow for allow for additional commercial support services that meet the needs of office and industrial uses;
• Address potential conflicts between industrial and residential uses through down zoning,
transitional zoning and/or the use of an overlay district;
• Improve the quality of development through the use of design guidelines;
• Focus on the development opportunities related to the former Raytheon site and the Billerica Business Center properties;
• Work with the Greater Lowell Workforce Investment Board (GLWIB) and the Career Center in Lowell to match prospective employees with available positions. Utilize the workforce development incentives available through the GLWIB;
• Utilize the Economic Target Area (ETA) status to develop Tax Increment Financing
(TIF) agreements with prospective businesses. Establish an Economic Opportunity Area (EOA) on the Tewksbury side of the former Raytheon plant to complement the EOA on the Billerica side of this site;
• Address Brownfield and petroleum contamination issues at the former Raytheon site, the
former Corenco Corporation site and railroad tracks abutting the parcels in the study area. Access Brownfield funds from MassDevelopment as a result of the ETA designation;
• Work with the Town of Billerica to address the permit streamlining issues across
municipal jurisdictions;
• Encourage commercial development opportunities that would address the consumer needs of employees and residents in the target area;
2. Route 38 Corridor
The Route 38 Corridor, known as Main Street in Tewksbury, runs in a northwest-southeast direction across the entire length of the town, roughly parallel to the old Boston and Main rail line that terminates near I-495, at the Lowell/Tewksbury line. Land within the 6.3-mile corridor is predominantly zoned for commercial development (270 parcels), however the corridor
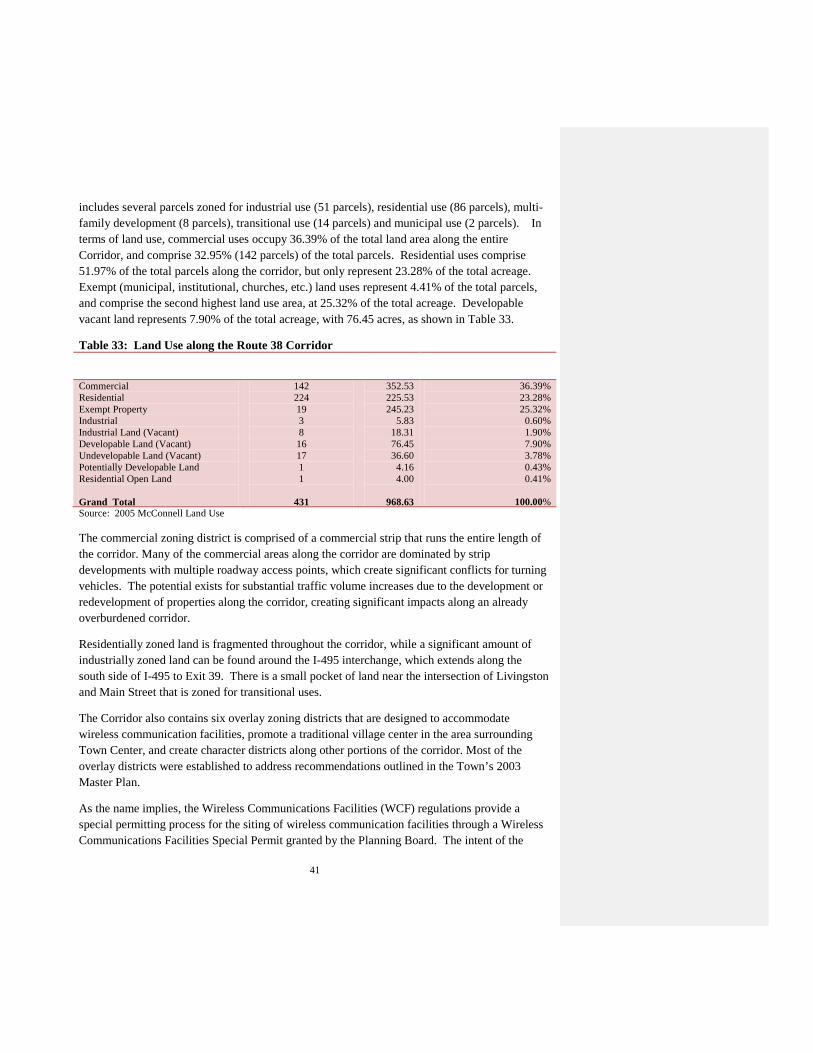
41
includes several parcels zoned for industrial use (51 parcels), residential use (86 parcels), multi-family development (8 parcels), transitional use (14 parcels) and municipal use (2 parcels). In terms of land use, commercial uses occupy 36.39% of the total land area along the entire Corridor, and comprise 32.95% (142 parcels) of the total parcels. Residential uses comprise 51.97% of the total parcels along the corridor, but only represent 23.28% of the total acreage. Exempt (municipal, institutional, churches, etc.) land uses represent 4.41% of the total parcels, and comprise the second highest land use area, at 25.32% of the total acreage. Developable vacant land represents 7.90% of the total acreage, with 76.45 acres, as shown in Table 33.
Table 33: Land Use along the Route 38 Corridor Land Use No. of Parcels Acreage Percent of Land Area
Commercial Residential Exempt Property Industrial Industrial Land (Vacant) Developable Land (Vacant) Undevelopable Land (Vacant) Potentially Developable Land Residential Open Land Grand Total
142 224 19 3 8 16 17 1 1
431
352.53 225.53 245.23
5.83 18.31 76.45 36.60
4.16 4.00
968.63
36.39% 23.28% 25.32%
0.60% 1.90% 7.90% 3.78% 0.43% 0.41%
100.00%
Source: 2005 McConnell Land Use
The commercial zoning district is comprised of a commercial strip that runs the entire length of the corridor. Many of the commercial areas along the corridor are dominated by strip developments with multiple roadway access points, which create significant conflicts for turning vehicles. The potential exists for substantial traffic volume increases due to the development or redevelopment of properties along the corridor, creating significant impacts along an already overburdened corridor.
Residentially zoned land is fragmented throughout the corridor, while a significant amount of industrially zoned land can be found around the I-495 interchange, which extends along the south side of I-495 to Exit 39. There is a small pocket of land near the intersection of Livingston and Main Street that is zoned for transitional uses.
The Corridor also contains six overlay zoning districts that are designed to accommodate wireless communication facilities, promote a traditional village center in the area surrounding Town Center, and create character districts along other portions of the corridor. Most of the overlay districts were established to address recommendations outlined in the Town’s 2003 Master Plan.
As the name implies, the Wireless Communications Facilities (WCF) regulations provide a special permitting process for the siting of wireless communication facilities through a Wireless Communications Facilities Special Permit granted by the Planning Board. The intent of the
42
overlay bylaw is to minimize adverse impacts on adjacent properties and to protect the visual and aesthetic value of the community.
The Town Center Overlay District (TCOD) is designed to encourage a mix of business, residential, cultural, educational and civic uses, and to promote compact development that is pedestrian-oriented and preserves the historic value and character of the area. All uses and structures in the TCOD are subject to a Special Permit and Site Plan Special Permit from the Planning Board. Furthermore, all projects in the TCOD must follow design criteria described in the Town Center Design Guidelines.
Similar to the Town Center Overlay District, the Village Residential Overlay District is designed to encourage a mix of business, residential, cultural, educational and civic uses, and to promote compact development that is pedestrian-oriented and preserves the historic value and character of the area. The VROD is located along Route 38 west of the TCOD. All uses and structures in the VROD are subject to a Special Permit and Site Plan Special Permit from the Planning Board. Furthermore, all projects in the VROD must follow design criteria described in the Village Residential Design Guidelines.
The Village Mixed-Use Overlay District (VMOD) is designed to encourage a mix of business, residential, cultural, educational and civic uses, and to promote compact development that is pedestrian-oriented and preserves the historic value and character of the area. The VMOD is located along Route 38 east of the TCOD. All uses and structures in the VMOD are subject to a Special Permit and Site Plan Special Permit from the Planning Board. Furthermore, all projects in the VMOD must follow design criteria described in the Village Mixed-Use Design Guidelines.
The South Village Overlay District (SVOD) is designed to encourage a mix of business, residential, cultural, educational and civic uses, and to promote compact development that is pedestrian-oriented and preserves the character of the area. The SVOD is located along Route 38 between Shawsheen Street and South Street. All uses and structures in the SVOD are subject to a Special Permit and Site Plan Special Permit from the Planning Board. Furthermore, all projects in the SVOD must follow design criteria described in the Village Residential Design Guidelines.
The Community Village Overlay District (CVOD) is designed to encourage a mix of business, residential, cultural, educational and civic uses, and to promote compact development that is pedestrian-oriented and preserves the character of the area. The CVOD is located along Route 38 just west of the SVOD. All uses and structures in the CVOD are subject to a Special Permit and Site Plan Special Permit from the Planning Board. Furthermore, all projects in the CVOD must follow design criteria described in the Village Residential Design Guidelines.
Currently, there is one development project in the permitting pipeline which consists of an 8,000 square foot medical office building near the intersection of Route 38 and Chandler Street. Given the limited availability of vacant developable land within Tewksbury, much of the town’s development activity in the future will consist of redevelopment or reuse projects. Town
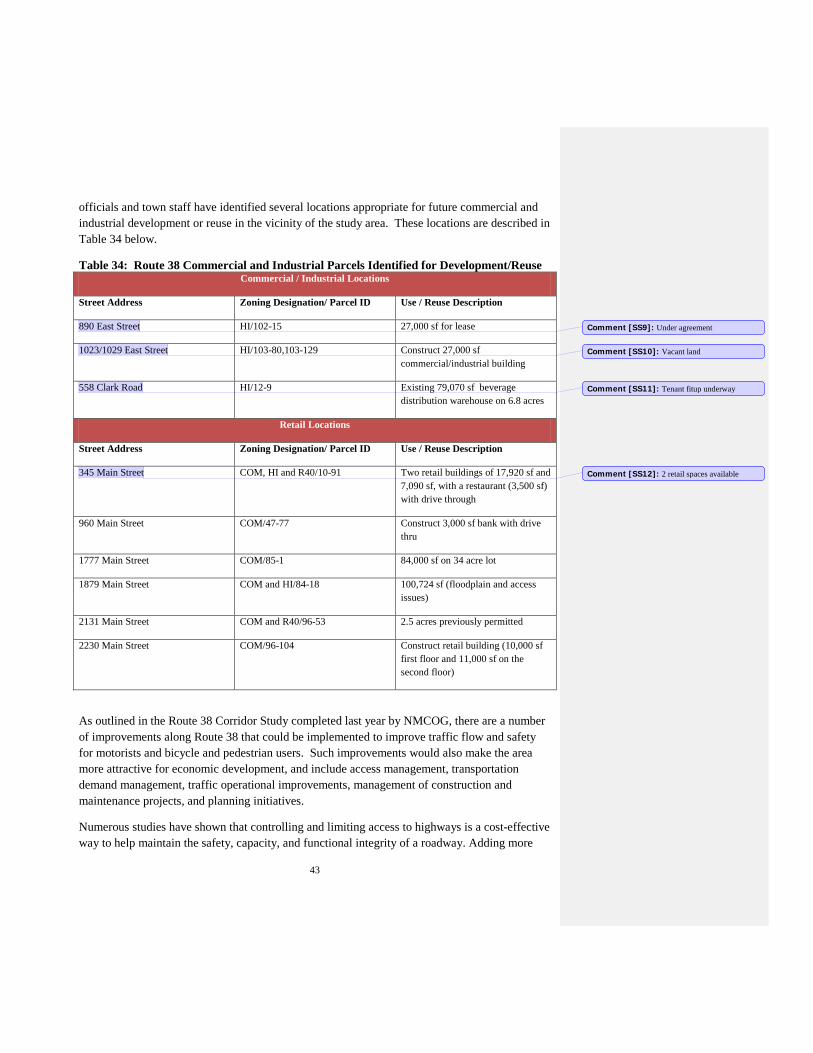
43
officials and town staff have identified several locations appropriate for future commercial and industrial development or reuse in the vicinity of the study area. These locations are described in Table 34 below.
Table 34: Route 38 Commercial and Industrial Parcels Identified for Development/Reuse Commercial / Industrial Locations
Street Address Zoning Designation/ Parcel ID Use / Reuse Description
890 East Street HI/102-15 27,000 sf for lease
1023/1029 East Street HI/103-80,103-129 Construct 27,000 sf commercial/industrial building
558 Clark Road HI/12-9 Existing 79,070 sf beverage distribution warehouse on 6.8 acres
Retail Locations
Street Address Zoning Designation/ Parcel ID Use / Reuse Description
345 Main Street COM, HI and R40/10-91 Two retail buildings of 17,920 sf and 7,090 sf, with a restaurant (3,500 sf) with drive through
960 Main Street COM/47-77 Construct 3,000 sf bank with drive thru
1777 Main Street COM/85-1 84,000 sf on 34 acre lot
1879 Main Street COM and HI/84-18 100,724 sf (floodplain and access issues)
2131 Main Street COM and R40/96-53 2.5 acres previously permitted
2230 Main Street COM/96-104 Construct retail building (10,000 sf first floor and 11,000 sf on the second floor)
As outlined in the Route 38 Corridor Study completed last year by NMCOG, there are a number of improvements along Route 38 that could be implemented to improve traffic flow and safety for motorists and bicycle and pedestrian users. Such improvements would also make the area more attractive for economic development, and include access management, transportation demand management, traffic operational improvements, management of construction and maintenance projects, and planning initiatives.
Numerous studies have shown that controlling and limiting access to highways is a cost-effective way to help maintain the safety, capacity, and functional integrity of a roadway. Adding more
Comment [SS9]: Under agreement
Comment [SS10]: Vacant land
Comment [SS11]: Tenant fitup underway
Comment [SS12]: 2 retail spaces available

44
lanes to an existing roadway is expensive and difficult. Controlling access, particularly by advocating the internal shared circulation of adjacent developments, is a proactive and cost-effective way to accomplish this objective. Given that Route 38 is under state jurisdiction, while the Town has permitting authority for development and redevelopment projects and for changes in use, MassDOT and the Town will need to establish a partnership in order to address future access issues along the corridor. The development of an access management program which coordinates land use planning decisions by local government and investments in the state highway system, will serve to control the proliferation curb cuts and other access approaches. Having a robust access management policy would help to increase the traffic- carrying capacity of the roadway and reduce the incidences of traffic accidents, and promote sound economic growth and the growth management goals.
The Town of Tewksbury should consider adopting a TDM policy as part of its site plan review process that focuses on workplace travel. Such a policy could encourage the use of transit (where available), ridesharing, bicycling and walking, or travel outside of peak periods, as well participation in a Transportation Management Association (TMA), such as the River Road TMA. TDM needs to be a cooperative endeavor involving transportation system users, employers, developers, residents and government.
Other TDM measures that could be implemented include providing ADA compliant sidewalks throughout the corridor and encourage walking. The ADA compliant sidewalks would easily tie into the Rt. 38 crosswalk accessibility project that MassDOT recently completed. Approximately 35% of corridor does not have existing sidewalks. Alternative travel modes could be made more attractive through the use of landscaping, street trees and streetscaping, and by providing bicycle racks at key locations, as well as benches, and directional signage. The town should continue to promote mixed use development along the corridor as a way of reducing travel by single occupancy vehicles.
A number of traffic efficiencies could be gained along the corridor by improving signal operations through corridor-wide signal retiming/optimization. Certain sections of the corridor will need additional capacity that could be provided through a center turn lane, as outlined in the report.
3. Town Center
The Town Center surrounds the Town Hall, the Library, and other older school and building sites. As presented in the Land Use Concept Plan created as part of the Town’s previous Master Plan, the Town Center begins at the Gateway Area and extends southeasterly on Route 38, incorporating a portion of North and Pleasant Streets and terminating just beyond the Route 38/Chandler Street intersection. This area’s main objective is to promote a sense of place by creating an identifiable village center with pedestrian activities, traditional building form, mixed

45
uses, and greater coherence of architectural treatment and design. The 2003 Master Plan suggested that future design guidelines for this area foster and encourage:
46
• Traditional building form; • Subordination of parking in relation to buildings; • New standards of signage and overall aesthetics; • High quality landscaping and pedestrian amenities; • On-site lighting in traditional and pedestrian scale; • An improved “sense of entry” to the Town Center; and • Protection of older buildings that contribute to the Town Center’s image.
The 2003 Master Plan also provided the following broader goals relative to the Main Street corridor and the Town Center:
• Promote a traditional village center in the area surrounding Town Hall; • Promote a coordinated approach to land use on Route 38, aiming for small-scaled
development of high-quality design, consolidated curb cuts, attractive landscaping, lighting and parking;
• Recognize and protect Tewksbury’s character-defining roads, natural and built assets and unique local landmarks;
• Give preference to reuse and redevelopment of existing structures and infill development over new growth, assuring that reuse activities respect the architectural integrity of historic buildings; and
• Encourage pedestrian and bicycle access throughout Tewksbury by providing a safe network of roads, sidewalks and trails.
In 2009, NMCOG assisted the Town in creating a Town Center Overlay District to encourage mixed-use development in the Center area. In addition to the goals outlined above, the Planning Board incorporated the following additional goals into the design guidelines for the district:
• Restore the Town Center as an area of civic, business and entertainment activity, while preserving and protecting its historic character and resources;
• Foster a pleasant pedestrian environment with amenities such as sidewalks, street trees, landscaping and businesses with attractive window displays;
• Create a unified appearance, a sense of place, and community identity; • Reuse vacant and underutilized properties; • Encourage a diverse mix of uses including residential, business, commercial, office,
institutional, educational, and cultural and entertainment activities for workers, visitors, and residents;
• Encourage live/work units such as apartments over first floor commercial uses; • Provide diverse housing opportunities; • Provide centrally located parking that encourages people to leave their cars and walk
through the Town Center; • To provide a consistent architectural scale and promotes the historic nature and value of
the Town Center; • Provide adequate lighting to ensure safety and security; enhance and encourage evening
activities; and provide distinctive character in the Center area;
47
• Encourage signage that is clear and of an appropriate scale for the Town Center; and provide a comprehensive sign program that is consistent for the Center area; and
• Attract new investment and foster economic development. A revitalized and vibrant Town Center has the potential to produce many benefits, including the efficient use of infrastructure, an increased tax base, historic preservation, the fostering of civic spirit and engagement, and the creation of a thriving small business community. The Town Center Overlay District was established to promote the development of a pedestrian-oriented Town Center consisting of a diverse mix of residential, business, commercial, office, institutional, educational and cultural uses. Adaptive reuse of historic buildings, rather than razing and rebuilding, is also encouraged in this area as a way of preserving the Town’s character. The Town is currently renovating the Town Hall building, thereby preserving and enhancing a key historic resource in the heart of the Town Center. The use of traditional Town Center design concepts will help minimize impacts on public services, maximize the use of public infrastructure, and allow a mix of residential and compatible commercial and civic uses that will provide employment opportunities, spark new investment and foster economic growth. Since the adoption of the Town Center Overlay District in 2009, there have been three projects permitted by the Town for reuse of existing buildings, and the Planning Board is now reviewing the first new construction proposal put forth under the overlay bylaw. In 2013, the Board of Selectmen established the Town Center Master Plan Committee. The Committee is charged with developing a Master Plan to improve the Town Center and possibly create a Village concept for the area. Improvements to be incorporated into the Master Plan include traffic flow, pedestrian access, green space, and business development. The master planning process for the area must be transparent and open to all through a collaborative, cooperative and coordinated fashion. The Committee will:
• Determine the boundaries of the Town Center; • Determine the landowners within the Town Center boundaries; • Work with town staff to develop a map of the Town Center boundaries and property
owners; • Determine if a consultant is needed; • Study and identify ways to improve vehicular and pedestrian traffic; • Identify areas for increased residential use within the Town Center; • Identify the types of commercial businesses best suited for the Town Center; • Provide an atmosphere for commercial expansion while maintain the Center character; • Coordinate work with other relevant boards and committees on issues to enhance
effectiveness and avoid redundancy;
48
• Perform other related projects as may be requested by the Board of Selectmen or Town Manager;
• Develop a draft document with recommendations for review by the Board of Selectmen; • Hold at least one public hearing in the recommendations for resident input; and • Submit a final report to the Board of Selectmen.
In early 2015, the Committee will be issuing an RFP for consultant services to provide technical expertise and guidance to the Committee, using funding appropriated by Town Meeting in October 2014.
4. Other Proposed Village Concepts In addition to its work on the Town Center plan, the Town Center Master Plan Committee is exploring the establishment of Village Style Development Concepts for the following locations:
a. Main Street and Victor Drive area: In 2005, Omni Properties built out Village Green adding 10,000 sf of new retail on Route 38, a new 10,000 sf daycare center, a new bank, and renovated professional offices. In 2007, Omni Properties then constructed a 56-unit 40B project at Village Green. All of Omni’s work is in front to Villa Roma, a 200 unit condo development. In 2013, Hawthorne Properties was permitted for a 128 unit congregate care facility southeast of Village Green along Route 38. In addition, the northeast corner of Victor Drive and Route 38 is poised for redevelopment, as the owner is looking to develop 10,000-30,000 sf of retail at the intersection, with 192 units of rental housing behind the retail project.
b. South Street, Salem Road and Main Street: The South Fire Station, Methodist Church and Trahan Schools would serve as anchors for this area. Land is available at the formerly proposed Sughre Commons for additional village style development.
5. Route 133 Corridor
Route 133 (Andover Street) traverses the northern section of Tewksbury, from the Lowell line to the Andover line. The corridor provides access to I-495 and I-93. The section of Route 133 in the vicinity of the I-495 interchange is an important economic center for the Town. Significant high technology and defense contracting companies are located in this area, along with commercial support services, and highway-oriented businesses, including restaurants, service stations, and hotels.
49
The community has recently been evaluating land use and zoning in the area surrounding the interchange, with the objective of accommodating additional business opportunities and supporting the needs of the companies already located in this area. The Town is assessing whether to allow additional commercial services that would meet the needs of workers and residents within the study area’s zoning districts, and evaluating whether there is a need to modify zoning designations for certain parcels.
In 2013, Penn National Gaming, based in Wyomissing, Pennsylvania, proposed to site a $200 million slots parlor on 30 acres off Ames Pond Drive, near the Interstate 495/Route 133 interchange. Town Meeting voters did not approve the rezoning required for the project. The Town has since initiated discussions about the most appropriate uses for the parcel in the future. NMCOG assisted the Town in exploring the feasibility of creating a lakefront zoning bylaw in the Ames Pond area. The purpose of the bylaw would be to encourage water-oriented recreational, commercial and mixed-use development opportunities.
6. East Street Corridor
Since completion of the last Master Plan, the Town of Tewksbury investigated land use and economic development issues along the East Street corridor, with NMCOG’s assistance. The purpose of the study was to examine land use conflicts along the corridor, identify opportunities for future economic development, and outline steps for addressing existing and future conflicts between business and residential uses.
The section of East Street extending approximately .8 miles from the Tewksbury/Andover line includes three areas where significant land use conflicts are evident. There is also another area of conflict located along Carter Street, close to the intersection with East Street. These conflicts are principally due to the fact that the north side of East Street is zoned for residential uses while the south side is zoned business/industrial.
There is land available for future development on the southern side of East Street, approximately .3 miles from the Tewksbury/Andover line. This area is zoned for heavy industry, and could potentially accommodate industrial uses, provided that substantial buffering is provided along East Street to protect the single-family homes directly across the street. An extensive industrial/business cluster is also found near the East Street/Industrial Avenue intersection. NMCOG staff evaluated possible options for new development and redevelopment opportunities in this area and recommended that small office uses, neighborhood-based commercial, and commercial/residential mixed-use be considered, in order to minimize the impacts to single-family homes located nearby on East and Carter Streets. Office and light-industrial uses are still appropriate for areas directly bordering East and Carter Streets in those locations where residential uses would not be impacted.
50
In addition, the study found that a continued emphasis on industrial uses is appropriate for the areas north of the Industrial Avenue/East Street and Carter Street/East Street intersections. A transition zone, buffering the industrial uses from the residential uses directly lining East and Carter Streets, has been recommended. The transition zone may consist of a mix of office, neighborhood commercial, and professional service type businesses.
7. Lowell Junction/I-93 Area
Given the amount of available undeveloped and underutilized land, the Lowell Junction/ I-93 Development Area has the potential to become one of the largest concentrations of employment in northeastern Massachusetts. The area’s strategic location north of the research and development centers of Boston, Cambridge and Route 128, and immediately south of the longstanding technology manufacturing centers of the Merrimack Valley, place it at the nexus of the Commonwealth’s initiatives to retain and develop employment opportunities in the communications, technology, instrumentation and life sciences sectors. With its strategic location between Exit 41 (Route 125) and Exit 42 (Dascomb Road), a new interchange would open up 700 acres of currently landlocked land for development. In 2006, the communities of Andover, Wilmington and Tewksbury formed the Tri Town Development Task Force in order to create a Unified Development Vision for the area. The task force retained the services of The Cecil Group to assist with formulating four alternative visions for the Junction Area. As a result of the public planning process, a mixed-use vision emerged which would allow for science and technology based development, around sustainable mixed-use "villages" offering a compact setting for office and retail uses. Residential uses would be included in specific locations within the site. The Tri-Town Unified Development Vision sought to provide area businesses, residents, municipalities, and the region with significant new job and tax benefits, while alleviating existing traffic congestion, limiting the impact of vehicular trips generated by new development, and improving environmental conditions. The three towns were committed to reaching unanimous agreement on a final development area master plan that respects each community’s “Priorities” as outlined in the vision. In the spring 2008, Town Meeting voters in the three communities voted to designate three separate portions of the development area as Priority Development Sites under the Commonwealth of Massachusetts’ Chapter 43D expedited permitting regulation. This process required the communities to commit to permitting development projects on the priority development sites within 180 days. In exchange, the Executive Office of Housing and Economic Development provided planning funds and economic development assistance to the communities.
51
The communities then worked toward advancing the planning that would allow the mixed-use vision for the development area to be implemented. The Towns collectively decided to pursue a form-based zoning code as the mechanism for implementing the development vision. The form-based code was to be consistent across municipal boundaries. The planning initiatives for this area have been dormant for the past three years given that MassDOT was unable to advance the design and permitting for the interchange construction project. Without construction of a new interchange access to this property is extremely challenging. The town will need to continue to evaluate the most appropriate strategy for developing this area.
H. Green Community Designation and Green Jobs Initiatives Massachusetts has a core of companies and jobs in clean energy, and the industry has continued to grow even during the national recession. The Green Jobs Act of 2008 created the MassCEC to accelerate job growth and economic development in the state’s clean energy industry. MassCEC serves as a clearinghouse and support center for the clean energy sector, making direct investments in new and existing technologies, clean energy companies, and workforce development to meet the skill needs of the industry. In November 2009, An Act Relative to Clean Energy transferred the state’s Renewable Energy Trust Fund to MassCEC. The Trust Fund was created in 1998 by the Legislature to provide financial support for the development of renewable energy projects. With funds and programs to support clean energy development, entrepreneurship, workforce development and installation, MassCEC is a one-stop shop for the clean energy economy. From 2010 to 2020, the Department of Energy Resources has estimated that the Massachusetts RPS classes will stimulate $360 million in annual investment or $3.9 billion in cumulative investment in clean power generation. This is expected to create 900 full-time construction jobs over that ten-year period. It is recognized that implementation of the renewable energy and energy efficiency projects promotes job growth across the clean energy, biotechnology, nanotechnology, and green business sectors. In particular, a recent analysis of the Green Community Act (GCA) found that its implementation lead to $1.2 billion2 in net economic benefits to Massachusetts, and more than 16,000 jobs.3 Tewksbury has made a concerted effort to play a major role in the siting of renewable energy facilities by becoming a state-designated Green Community. The Green Communities Division 2 In 2013 net present value dollars. 3 http://www.analysisgroup.com/uploadedfiles/publishing/articles/analysis_group_gca_study.pdf
52
of the Department of Energy Resources (DOER) works closely with municipalities to help lower energy costs and adopt energy efficient technologies, add renewables to their energy mix, and make their fleets more energy efficient. As provided for in the Green Communities Act of 2008, the DOER’s Green Communities Grant Program uses funding from auctions of carbon emissions permits under the Regional Greenhouse Gas Initiative to reward communities that win Green Communities designation by meeting five clean energy benchmarks:
• Adopting local zoning bylaw or ordinance that allows "as-of-right-siting" of renewable energy projects;
• Adopting an expedited permitting process related to the as-of-right facilities; • Establishing a municipal energy use baseline and a program designed to reduce use by 20
percent within five years; • Purchasing only fuel-efficient vehicles for municipal use, whenever such vehicles are
commercially available and practicable; and • Requiring all new residential construction over 3,000 square feet and all new commercial
and industrial real estate construction to reduce lifecycle energy costs (i.e., adoption of an energy-saving building "stretch code").
Being designated as a Green Community provides grant funding to a municipality to support all or a portion of the cost of the following:
• studying, designing, constructing and implementing energy efficiency activities, including but not limited to energy efficiency measures and projects;
• procuring energy management services; • installing energy management systems; • adopting demand-side reduction initiatives or energy efficiency policies; and • siting activities and construction of a renewable energy generating facility on
municipally-owned land. Once designated a Green Community, the Town of Tewksbury was awarded a base grant of $207,725, five solar solid waste compactors, and four signs to be displayed in the community. The base grant was used to fund staff training on energy management systems, a consultant to oversee grant implementation projects, and energy conservation measures, including retro-commissioning the Police Station and Wynn and Ryan schools; and lighting retrofits at the Dewing, Ryan and Wynn Middle schools. In addition to the base grant, Tewksbury was awarded a $161,574 competitive grant, which was used to fund exterior lighting upgrades in four schools
53
and four municipal facilities, weatherization upgrades in the DPW building and an outdoor air reset in Loella Dewing School.4 The Town of Tewksbury also has a Green Committee, which was established to explore energy conservation and renewable/ alternative energy generation strategies for the Town, its residents and commercial base. The Committee is tasked with assessing the Town’s baseline energy consumption, developing achievable targets for energy conservation, exploring zoning changes to allow for renewable/alternative energy generation across all types of land use, considering environmentally sustainable building and site standards for all classes of buildings, and serving as a local advisor for federal and state energy related grant programs and developing a community outreach program.5
In the Northern Middlesex Region, Tewksbury is a leader in solar production for the commercial and retail sectors, producing 898 kW of solar through five installations in the commercial sector and 323 kW of solar through one installation in the retail sector. For these two sectors, this is more than any other municipality in the region. Tewksbury also produces 198 KW of residential solar through 33 installations.6
Through the continued implementation of green energy programs, Tewksbury is encouraging job creation and economic benefits at the local level, while also decreasing reliance of fossil fuels, and ensuring a cleaner, healthier environment.
I. Workforce Development
The Northern Middlesex region enjoys a unique strength in terms of its education and training facilities. Notwithstanding the fact that Tewksbury residents live within an hour of the greatest collection of colleges and universities in the world in Boston, the availability of education and training facilities in the Greater Lowell region is quite remarkable for an area this size. The area is well represented by the University of Massachusetts Lowell and Middlesex Community College in terms of higher educational facilities, as well as nearby Merrimack College in North Andover and Northern Essex Community College in Lawrence and Haverhill. Additional higher educational facilities, such as Northeastern University’s campus in Burlington, Rivier College and Southern New Hampshire University in Nashua, New Hampshire, and numerous Worcester colleges, such as Worcester State University, Clark University, College of the Holy
4 http://www.mass.gov/eea/docs/doer/green-communities/grant-program/map-summary-green-communities.pdf 5 http://www.tewksbury-ma.gov/green-committee 6 Source: DOER SREC Database July 9, 2014, Massachusetts ARRA Database, DOER http://www.mass.gov/eea/energy-utilities-clean-tech/renewable-energy/rps-aps/qualified-generation-units.html
54
Cross and Worcester Polytechnic Institute, offer additional educational choices to local residents and employees.
The principal higher education facilities serving this area are UMass Lowell and Middlesex Community College. Both institutions provide employment, education opportunities and research and development initiatives that help the region grow economically. While UMass Lowell was created out of a merger between Lowell Technological Institute and Lowell State, Middlesex Community College expanded into downtown Lowell from its Bedford campus. These institutions provide cost-effective quality education for students of all ages and play a vital role in the lifelong learning goals of the region.
The Greater Lowell Workforce Investment Board (GLWIB), which is the region’s principal workforce development entity, contracts with both institutions, as well as Northern Essex Community College, to provide quality skill training for area employers. The GLWIB, which is a private non-profit organization, plays a critical role in matching the needs of employers with the available workforce in the region. The GLWIB provides policy guidance for workforce development issues in the Northern Middlesex Service Delivery area, which includes Tewksbury. The GLWIB was established to meet the requirements of the Workforce Investment Act of 1998 (Public Law 105-220) and provides the following services:
Evaluation of the local One-Stop system, youth activities and other employment and training activities as described under WIA in partnership with the Chief Elected Official including determination of resource allocations, priorities for service and eligibility for Individual Training Account vendors;
Development and/or modification with the WIA partners, the Five-Year WIA plan for the region;
Provision of information regarding workforce development initiatives and resources to employers within the region;
Convene and manage grant-writing activities as appropriate; Negotiation of Memoranda of Understanding with One-Stop partners; Liaison with local, state and federal agencies regarding workforce development
policy; Select eligible service providers for youth and adults in the region; Negotiation of performance standards with the State and other local performance
indicators as appropriate; Generate Labor Market Information and reports as needed and or requested by the
City of Lowell; and Other Workforce Development activities deemed appropriate.
The GLWIB contracts with the One-Stop Center and its partners to provide comprehensive workforce development training. The One-Stop Center utilizes Individual Training Account
55
(ITA) contractors, Private Career Schools, Community Colleges and Universities and social service providers to address the training needs of their clientele.
J. Strengths, Weaknesses, Opportunities and Threats (SWOT)
In assessing the economic development potential of a community, it is important to determine the assets and liabilities of the community. As part of the overall Master Planning process, NMCOG staff conducted a Visioning Session in 2012 that was principally attended by local officials and town staff. The session was structured to provide an overview of the Master Planning process and to receive input from attendees on Strengths, Weaknesses, Opportunities and Threats relative to Tewksbury. The strengths and weaknesses outlined below summarize the assets and liabilities of the community. A narrative description of the top ten responses in each category is provided in this section.
1. Strengths The strengths identified are arranged in order of the priority below, based on rankings assigned by the participants:
1) Proximity to major highways; 2) Investment in school, police, library, and other public infrastructure/public investment; 3) Preservation of open space, including at state hospital; 4) Diverse housing stock; 5) Flexible zoning, including overlay districts; 6) Community Preservation Act adoption; 7) Economic target area; 8) Water resources; 9) Proximity to higher education; 10) Diverse recreational opportunities; 11) Public transportation; 12) Strong and educated workforce; 13) Strong sense of community; 14) Town center as hub; 15) Good business – town relationship; 16) Streamlined permitting process; 17) Diversity of retail services; and 18) Small-town feel
Good transportation access to I-495 and I-93 are considered to be strong assets in terms of the community’s ability to attract economic development. The town’s investment in public infrastructure, particularly the schools, public safety, the library, and most recently town hall, contribute to the quality of life in the community. Open space, water resources, and the adoption of the Community Preservation were also seen as strong assets for the community. Proximity to

56
outstanding institutions of higher learning was identified as key to meeting the educational and workforce development needs of the community. When asked to identify weaknesses participants unanimously cited deficiencies in the town’s transportation network and services. A lack of pedestrian and bicycle facilities was most frequently mentioned, along with poor traffic conditions along Route 38 and at South and Salem Street, and public transit service that is too infrequent. Other weaknesses often mentioned included the cost of sewer infrastructure, a lack of recreational open space, and the need to capitalize on Ames Pond and other natural resources. Some participants felt that the town needs to do more to market itself as a place open for business.
2. Weaknesses
The following weaknesses were identified by participants and are arranged based on the priorities assigned through a ranking process:
1) Lack of sidewalks; 2) Lack of bike lanes; 3) Empty retail stores along Route 38; 4) Route 38 traffic management; 5) Need more traffic lights – South and Salem; 6) Failure to capitalize on Ames Pond and other natural resources; 7) Public transportation does not have enough stops and the frequency is too low; 8) Not a lot of open/passive recreational space; 9) Poor marketing of Tewksbury to public and businesses; 10) Cost of sewer system; 11) Not a real sense of “there” in the town center; 12) Lack of communication between local government and residents; 13) The town underutilizes social media – needs to do a better job of reaching out; 14) Route 38 needs a center turning lane; 15) Not a good “farm system” for civic leaders – lack of involved younger people; and 16) Escalating of real estate, water, sewer tax burden
3. Opportunities
When asked what opportunities Tewksbury should take advantage of in the future participants identified the following:
1) Available commercial and industrial sites and lands; 2) Design guidelines for Main Street; 3) New town manager will enable us to do new things; 4) More diverse restaurants, and other types of businesses; 5) Eager and caring town staff that can become more visible;
57
6) Focus on underutilized resources such as Ames Pond which could be turned into active recreational use;
7) Educate people on town’s natural resources; 8) Natural resources; 9) Rethink how town’s money is spent; and 10) Promote historical components
Participants noted the amount of available commercial and industrial property in town and felt that the town needs to do more to market these sites in order to grow its tax base and create jobs for residents. Participants noted that the new design guidelines for Main Street will enhance the attractiveness of the corridor and create the type of development that the town is trying to encourage. Many noted the need for more diverse business types in the community, including ethnic restaurants and specialty retail. Some participants noted that the new town manager will bring new opportunities, and observed that town staff had recently become more visible to the public and engaged in the community. Participants felt that the residents need to be better educated relative to the town’s natural resources, and noted that Ames Pond is underutilized as a recreational asset. The need to promote the town’s historical resources was also highlighted.
4. Threats
When asked what threats participants see for the community in the future, the following responses were received from participants:
1) Tax base, budget; 2) Land use conflicts; 3) Demographic shifts – older population with impact on land use, etc.; 4) Decline in housing value; 5) Concentration of power among fewer people – disassociation with civic life; 6) Inactivity of state and federal governments; 7) Adverse effects of state and federal governments; 8) Tightening of commercial lending – lack of financing; 9) Natural disasters; 10) Lack of connections/relationships with other communities; 11) Land uses that promote poor public health – drive thru uses, etc.; 12) Crime; and 13) Decline of civil discourse.
Among the threats identified were fiscal challenges related to property tax revenues and the anticipated budgetary demands going forward. The need to address land use conflicts in certain areas of town (North Tewksbury, along East Street, and along certain sections of Route 38) were identified as a future threat given the anticipated increase in development over time. The impact of an aging population on the need for services was identified as a threat. Some felt the there will be a growing need for age restricted housing and medical services, which will demand new construction and impact land use. Some participants were concerned about declining property values due to over development, and felt that government agencies were not doing enough to
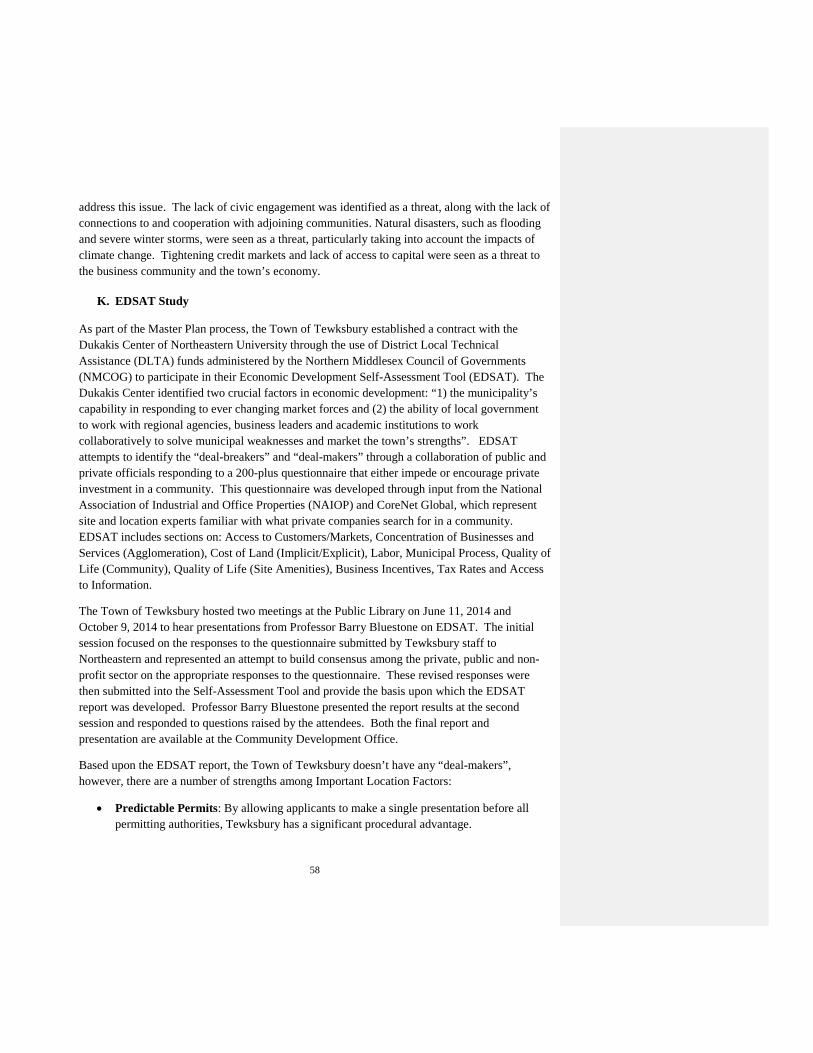
58
address this issue. The lack of civic engagement was identified as a threat, along with the lack of connections to and cooperation with adjoining communities. Natural disasters, such as flooding and severe winter storms, were seen as a threat, particularly taking into account the impacts of climate change. Tightening credit markets and lack of access to capital were seen as a threat to the business community and the town’s economy.
K. EDSAT Study As part of the Master Plan process, the Town of Tewksbury established a contract with the Dukakis Center of Northeastern University through the use of District Local Technical Assistance (DLTA) funds administered by the Northern Middlesex Council of Governments (NMCOG) to participate in their Economic Development Self-Assessment Tool (EDSAT). The Dukakis Center identified two crucial factors in economic development: “1) the municipality’s capability in responding to ever changing market forces and (2) the ability of local government to work with regional agencies, business leaders and academic institutions to work collaboratively to solve municipal weaknesses and market the town’s strengths”. EDSAT attempts to identify the “deal-breakers” and “deal-makers” through a collaboration of public and private officials responding to a 200-plus questionnaire that either impede or encourage private investment in a community. This questionnaire was developed through input from the National Association of Industrial and Office Properties (NAIOP) and CoreNet Global, which represent site and location experts familiar with what private companies search for in a community. EDSAT includes sections on: Access to Customers/Markets, Concentration of Businesses and Services (Agglomeration), Cost of Land (Implicit/Explicit), Labor, Municipal Process, Quality of Life (Community), Quality of Life (Site Amenities), Business Incentives, Tax Rates and Access to Information.
The Town of Tewksbury hosted two meetings at the Public Library on June 11, 2014 and October 9, 2014 to hear presentations from Professor Barry Bluestone on EDSAT. The initial session focused on the responses to the questionnaire submitted by Tewksbury staff to Northeastern and represented an attempt to build consensus among the private, public and non-profit sector on the appropriate responses to the questionnaire. These revised responses were then submitted into the Self-Assessment Tool and provide the basis upon which the EDSAT report was developed. Professor Barry Bluestone presented the report results at the second session and responded to questions raised by the attendees. Both the final report and presentation are available at the Community Development Office.
Based upon the EDSAT report, the Town of Tewksbury doesn’t have any “deal-makers”, however, there are a number of strengths among Important Location Factors:
• Predictable Permits: By allowing applicants to make a single presentation before all permitting authorities, Tewksbury has a significant procedural advantage.
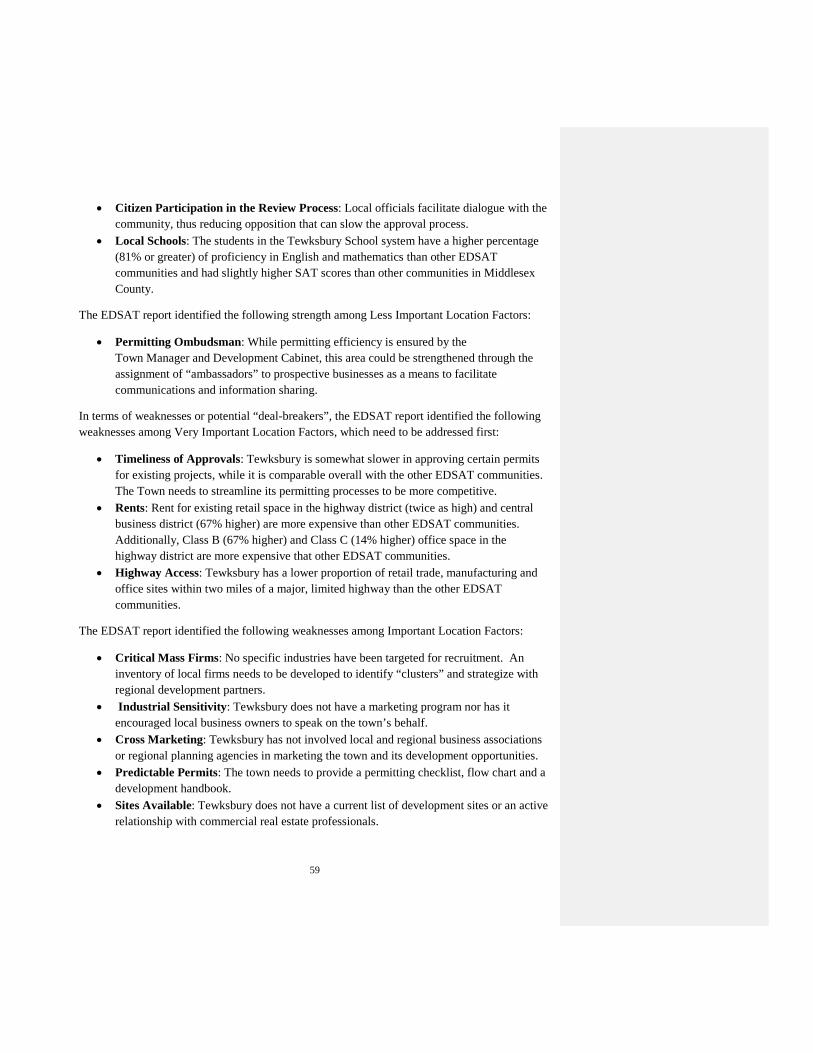
59
• Citizen Participation in the Review Process: Local officials facilitate dialogue with the community, thus reducing opposition that can slow the approval process.
• Local Schools: The students in the Tewksbury School system have a higher percentage (81% or greater) of proficiency in English and mathematics than other EDSAT communities and had slightly higher SAT scores than other communities in Middlesex County.
The EDSAT report identified the following strength among Less Important Location Factors:
• Permitting Ombudsman: While permitting efficiency is ensured by the Town Manager and Development Cabinet, this area could be strengthened through the assignment of “ambassadors” to prospective businesses as a means to facilitate communications and information sharing.
In terms of weaknesses or potential “deal-breakers”, the EDSAT report identified the following weaknesses among Very Important Location Factors, which need to be addressed first:
• Timeliness of Approvals: Tewksbury is somewhat slower in approving certain permits for existing projects, while it is comparable overall with the other EDSAT communities. The Town needs to streamline its permitting processes to be more competitive.
• Rents: Rent for existing retail space in the highway district (twice as high) and central business district (67% higher) are more expensive than other EDSAT communities. Additionally, Class B (67% higher) and Class C (14% higher) office space in the highway district are more expensive that other EDSAT communities.
• Highway Access: Tewksbury has a lower proportion of retail trade, manufacturing and office sites within two miles of a major, limited highway than the other EDSAT communities.
The EDSAT report identified the following weaknesses among Important Location Factors:
• Critical Mass Firms: No specific industries have been targeted for recruitment. An inventory of local firms needs to be developed to identify “clusters” and strategize with regional development partners.
• Industrial Sensitivity: Tewksbury does not have a marketing program nor has it encouraged local business owners to speak on the town’s behalf.
• Cross Marketing: Tewksbury has not involved local and regional business associations or regional planning agencies in marketing the town and its development opportunities.
• Predictable Permits: The town needs to provide a permitting checklist, flow chart and a development handbook.
• Sites Available: Tewksbury does not have a current list of development sites or an active relationship with commercial real estate professionals.
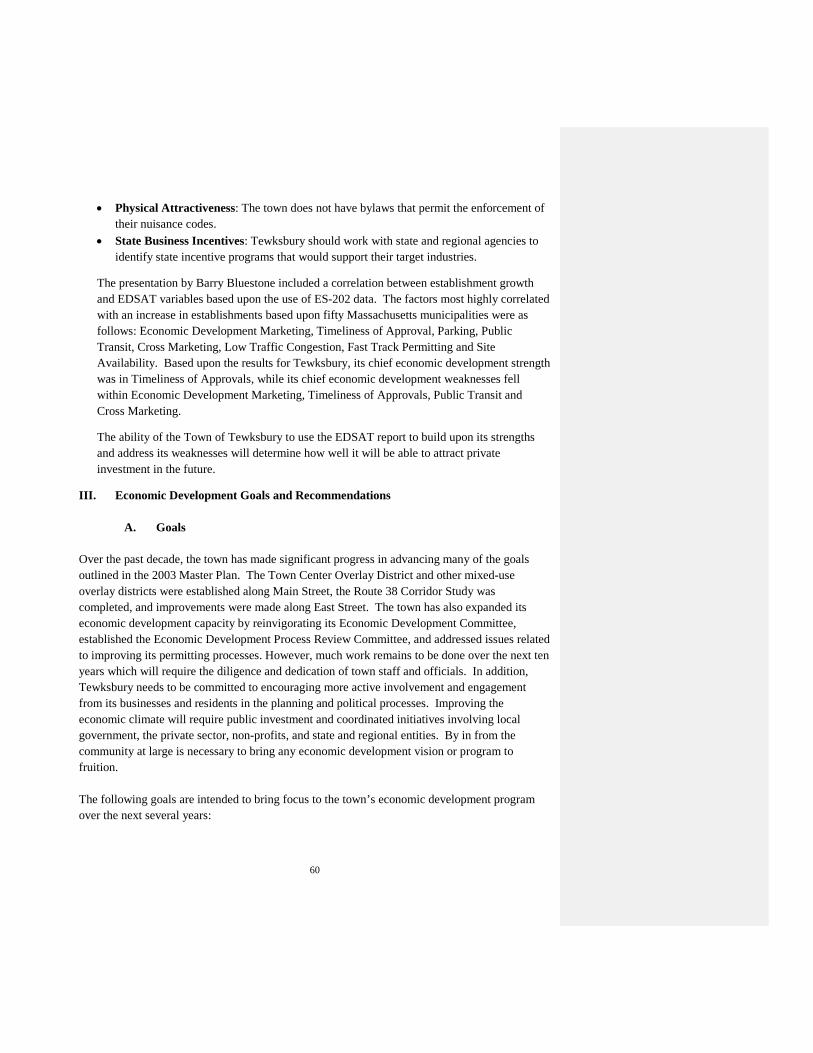
60
• Physical Attractiveness: The town does not have bylaws that permit the enforcement of their nuisance codes.
• State Business Incentives: Tewksbury should work with state and regional agencies to identify state incentive programs that would support their target industries.
The presentation by Barry Bluestone included a correlation between establishment growth and EDSAT variables based upon the use of ES-202 data. The factors most highly correlated with an increase in establishments based upon fifty Massachusetts municipalities were as follows: Economic Development Marketing, Timeliness of Approval, Parking, Public Transit, Cross Marketing, Low Traffic Congestion, Fast Track Permitting and Site Availability. Based upon the results for Tewksbury, its chief economic development strength was in Timeliness of Approvals, while its chief economic development weaknesses fell within Economic Development Marketing, Timeliness of Approvals, Public Transit and Cross Marketing.
The ability of the Town of Tewksbury to use the EDSAT report to build upon its strengths and address its weaknesses will determine how well it will be able to attract private investment in the future.
III. Economic Development Goals and Recommendations
A. Goals
Over the past decade, the town has made significant progress in advancing many of the goals outlined in the 2003 Master Plan. The Town Center Overlay District and other mixed-use overlay districts were established along Main Street, the Route 38 Corridor Study was completed, and improvements were made along East Street. The town has also expanded its economic development capacity by reinvigorating its Economic Development Committee, established the Economic Development Process Review Committee, and addressed issues related to improving its permitting processes. However, much work remains to be done over the next ten years which will require the diligence and dedication of town staff and officials. In addition, Tewksbury needs to be committed to encouraging more active involvement and engagement from its businesses and residents in the planning and political processes. Improving the economic climate will require public investment and coordinated initiatives involving local government, the private sector, non-profits, and state and regional entities. By in from the community at large is necessary to bring any economic development vision or program to fruition. The following goals are intended to bring focus to the town’s economic development program over the next several years:
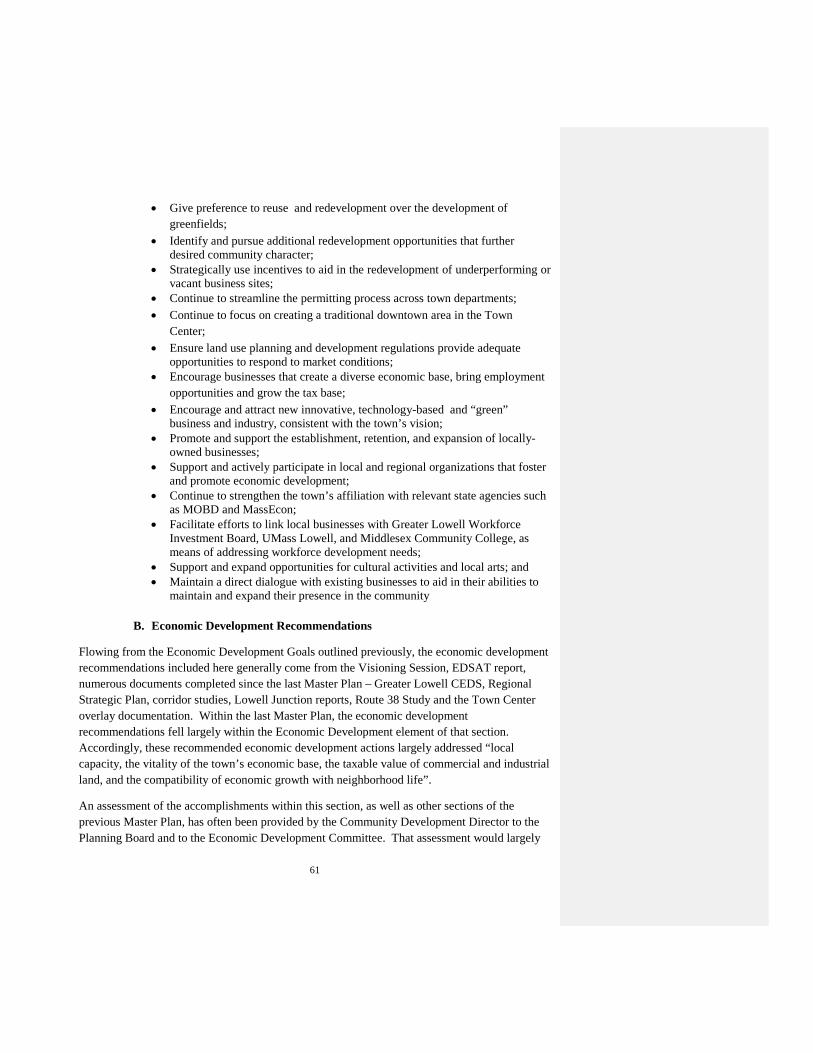
61
• Give preference to reuse and redevelopment over the development of greenfields;
• Identify and pursue additional redevelopment opportunities that further desired community character;
• Strategically use incentives to aid in the redevelopment of underperforming or vacant business sites;
• Continue to streamline the permitting process across town departments; • Continue to focus on creating a traditional downtown area in the Town
Center; • Ensure land use planning and development regulations provide adequate
opportunities to respond to market conditions; • Encourage businesses that create a diverse economic base, bring employment
opportunities and grow the tax base; • Encourage and attract new innovative, technology-based and “green”
business and industry, consistent with the town’s vision; • Promote and support the establishment, retention, and expansion of locally-
owned businesses; • Support and actively participate in local and regional organizations that foster
and promote economic development; • Continue to strengthen the town’s affiliation with relevant state agencies such
as MOBD and MassEcon; • Facilitate efforts to link local businesses with Greater Lowell Workforce
Investment Board, UMass Lowell, and Middlesex Community College, as means of addressing workforce development needs;
• Support and expand opportunities for cultural activities and local arts; and • Maintain a direct dialogue with existing businesses to aid in their abilities to
maintain and expand their presence in the community
B. Economic Development Recommendations
Flowing from the Economic Development Goals outlined previously, the economic development recommendations included here generally come from the Visioning Session, EDSAT report, numerous documents completed since the last Master Plan – Greater Lowell CEDS, Regional Strategic Plan, corridor studies, Lowell Junction reports, Route 38 Study and the Town Center overlay documentation. Within the last Master Plan, the economic development recommendations fell largely within the Economic Development element of that section. Accordingly, these recommended economic development actions largely addressed “local capacity, the vitality of the town’s economic base, the taxable value of commercial and industrial land, and the compatibility of economic growth with neighborhood life”.
An assessment of the accomplishments within this section, as well as other sections of the previous Master Plan, has often been provided by the Community Development Director to the Planning Board and to the Economic Development Committee. That assessment would largely
62
determine that the local capacity issues had been primarily addressed through the establishment of the Economic Development Committee, the designation of Tewksbury as an Economic Target Area (ETA) and the approval of the first TIF agreement with ThermoFisher. The Economic Development Committee has begun to reach out to the business community and to involve them into the town’s marketing activities. The Town has also reached out to NMCOG about the use of its non-profit arm, the Northern Middlesex Economic Development District (NMEDD), to provide a framework to work with the local banking institutions to provide loans to new and expanding businesses along the Route 38 Corridor. The Town has also joined Middlesex 3 to partner with other communities to market this region more effectively.
In terms of the redevelopment and reuse of underutilized or vacant property, the Town has begun to address this issue more effectively, particularly with underutilized or vacant property along Route 38. The use of the TIF agreement enabled the Town to work with ThermoFisher to occupy a 140,000 square foot facility at 2 Radcliffe Road vacated by Avid Technologies. The Town also worked with the property on Woburn Street which formerly housed Jabil Circuits, Inc., to create Riverview Technology Park. Although the Town’s effort to locate a gaming facility at the Ames Pond Corporate Center was not approved, this initiative has opened up the area to further private investment in the future. Other examples have been cited in other parts of this Economic Development chapter, but these few examples reflect the effort that has been made by the Town and its Economic Development Committee to redevelop and reuse underutilized or vacant property. However, additional work still needs to be done.
All the items listed under “A Town Center for Tewksbury” have been addressed through the establishment of an overlay district and the development of design guidelines. In implementing the overlay district and attracting private investment to the Town Center, the Town still needs to identify the types of commitments necessary to finance these improvements, including public (MassWorks, MassDOT, DHCD, etc.), private and non-profit funding. The renovation of Town Hall and the establishment of a singular focus on the Town Center through the establishment of a voluntary Committee structure will catalyze the effort in this area. In addition, the issuance of a Request for Proposal (RFP) for a Town Center Master Plan, apart from the Town’s Master Plan, will help provide a vision for the area, as well as an Action Plan to increase the level of private investment in the area and transform the center into an active commercial downtown.
Notwithstanding the improvements that have been made to date, there are a number of economic development recommendations that can be made. These recommendations should be tied into the recommendations outlined in the other chapters of this document, particularly those on Land Use, Transportation, Housing and Public Facilities. For the purposes of this draft chapter, the recommendations will be provided in bullet form and can be expanded as requested by the Community Development Director. Additionally, these draft recommendations should be presented to the Economic Development Committee before they are finalized for the Planning Board. Without input from the Economic Development Committee, which has been at the forefront of the economic development initiatives since the previous Master Plan was developed,
63
these recommendations would not have the institutional weight needed to implement them once the Master Plan is completed. Another issue that needs to be addressed is to identify which party or parties will be responsible for the implementation of these recommendations and to establish a Master Plan Implementation Committee, chaired by a Planning Board representative and consisting of representatives from various boards and committees, to follow through on these recommendations.
The economic development recommendations are as follows:
• Increase the involvement of the Town in the EDIP program and identify other state funding programs that can attract more private investment to the community;
• Focus more attention on vacant and underutilized properties for reuse and redevelopment by listing these sites on the Town’s upgraded web page and including them on NMCOG’s web page;
• Designate the Community Development Director as the town’s Permitting Ombudsman and build upon the current Development Cabinet to move projects through the permitting process more efficiently and effectively;
• Work with the Economic Development Committee to target specific industries for recruitment. Utilize the Location Quotient (LQ) tools to determine the strengths of the various subsectors of Tewksbury’s industry and build upon it by attracting similar firms to the community so as to establish economic “clusters”;
• Work with NMCOG, the Greater Lowell Chamber of Commerce and Middlesex 3 on branding and cross marketing activities that will increase private investment in the community that could benefit Tewksbury’s workforce and residents;
• Develop an effective marketing program through the Economic Development Committee by partnering with local business leaders to serve as Ambassadors for the community;
• Build upon the town’s historical resources to establish the community as a destination location;
• Develop a permitting checklist, flow chart and development handbook that can be accessed online by developers to ensure timely approvals;
• Work with the Lowell Regional Transit Authority (LRTA) to re-examine public transit routes so that they better address the needs of businesses, consumers and workers in accessing Tewksbury’s commercial and industrial locations;
• Attract more diverse restaurants and businesses to provide Tewksbury residents with greater opportunities to purchase locally;
• Develop a pedestrian and bike trail that will interconnect with the town’s commercial centers and open space areas;
• Utilize the services of the Greater Lowell Workforce Investment Board (GLWIB) to address the needs of employers and underemployed and unemployed workers;
64
• Build upon the town’s designation as a Green Community by targeting the growing Renewable Energy industries as prospective employers and tax payers;
• Reexamine the potential development opportunities available at Lowell Junction/I-93 and within the various traffic corridors (Woburn Street, Route 133, East Street, Route 38) studied over the past five years;
• Continue to address land use conflicts/zoning revisions along East Street, and pursue zoning changes to provide additional retail services along Woburn Street, to support the office and industrial uses located along the corridor;
• Work with MassDOT and NMCOG to implement the traffic improvements, pedestrian improvements and access management measures outlined in the Route 38 Corridor Study;
• Complete the Town Center Master Plan, review the existing Town Center Overlay Bylaw for consistency with the Master Plan, and develop a strategy for implementing the recommendations outlined in the Town Center Master Plan; and
• Address infrastructure issues that provide barriers to the development of commercial and industrial properties.