Draft template for an Indicator Fiche - ec.europa.eu · 3 Focus Area Target indicator Complementary...
31
Working document Target indicator fiches for Pillar II (Priorities 1 to 6) APRIL 2015
Transcript of Draft template for an Indicator Fiche - ec.europa.eu · 3 Focus Area Target indicator Complementary...

Working document
Target indicator fiches for Pillar II
(Priorities 1 to 6)
APRIL 2015

2
List of target / result indicators
Focus Area Target indicator Complementary result indicators
FA 1A
Fostering innovation, co-
operation, and the development
of the knowledge base in rural
areas
Percentage of expenditure under Articles 14, 15
and 35 of Regulation (EU) No 1305/2013 in
relation to the total expenditure for the RDP
FA 1B
Strengthening the links between
agriculture, food production
and forestry and research and
innovation, including for the
purpose of improved
environmental management and
performance
Total number of co-operation operations
supported under the co-operation measure
(Article 35 of Regulation (EU) No 1305/2013)
(groups, networks/clusters, pilot projects…)
[across all focus areas]
FA 1C
Fostering lifelong learning and
vocational training in the
agricultural and forestry sectors
Total number of participants trained under
Article 14 of Regulation (EU) No 1305/2013
[across all focus areas]
FA 2A
Improving the economic
performance of all farms and
facilitating farm restructuring
and modernisation, notably with
a view to increasing market
participation and orientation as
well as agricultural
diversification
Percentage of agriculture holdings with RDP
support for investments in restructuring or
modernisation
Change in agricultural output on supported
farms/AWU (Annual Work Unit)
FA 2B
Facilitating the entry of
adequately skilled farmers into
the agricultural sector and, in
particular, generational renewal
Percentage of agriculture holdings with RDP
supported business development
plan/investments for young farmers
FA 3A
Improving competitiveness of
primary producers by better
integrating them into the agri-
food chain through quality
schemes, adding value to
agricultural products,
promotion in local markets and
short supply circuits, producer
groups and organisations and
inter-branch organisations
Percentage of agricultural holdings receiving
support for participating in quality schemes,
local markets and short supply circuits, and
producer groups/organisations
FA 3B
Supporting farm risk prevention
and management
Percentage of farms participating in risk
management schemes
FA 4A
Restoring, preserving and
enhancing biodiversity,
including in NATURA 2000
areas, and in areas facing
natural or other specific
constraints, and high nature
value farming, as well as the
state of European landscapes
Percentage of forest or other wooded areas under
management contracts supporting biodiversity
+
Percentage of agricultural land under
management contracts supporting biodiversity
and/or landscapes

3
Focus Area Target indicator Complementary result indicators
FA 4B
Improving water management,
including fertiliser and pesticide
management
Percentage of agricultural land under
management contracts to improve water
management
+
Percentage of forestry land under management
contracts to improve water management
FA 4C
Preventing soil erosion and
improving soil management
Percentage of agricultural land under
management contracts to improve soil
management and/or prevent soil erosion
+
Percentage of forestry land under management
contracts to improve soil management and/or
prevent soil erosion
FA 5A
Increasing efficiency in water
use by agriculture
Percentage of irrigated land switching to more
efficient irrigation system
Increase in efficiency of water use in
agriculture in RDP supported projects
FA 5B
Increasing efficiency in energy
use in agriculture and food
processing
Total investment in energy efficiency
Increase in efficiency of energy use in
agriculture and food-processing in RDP
supported projects
FA 5C
Facilitating the supply and use
of renewable sources of energy,
of by-products, wastes and
residues and of other non- food
raw material, for purposes of
the bio-economy
Total investment in renewable energy production Renewable energy produced from supported
projects
FA 5D
Reducing greenhouse gas and
ammonia emissions from
agriculture
Percentage of LU concerned by investments in
live-stock management in view of reducing
GHG and/or ammonia emissions
+
Percentage of agricultural land under
management contracts targeting reduction of
GHG and/or ammonia emissions
Reduced emissions of methane and nitrous
oxide
Reduced ammonia emissions
FA 5E
Fostering carbon conservation
and sequestration in agriculture
and forestry
Percentage of agricultural and forest land under
management contracts contributing to carbon
sequestration or conservation
FA 6A
Facilitating diversification,
creation and development of
small enterprises, as well as job
creation
Jobs created in supported projects
(also under 6B (for LEADER))
FA 6B
Fostering local development in
rural areas
Percentage of rural population covered by local
development strategies
+

4
Focus Area Target indicator Complementary result indicators
Percentage of rural population benefiting from
improved services / infrastructures
+
Jobs created in supported projects (Leader)
FA 6C
Enhancing the accessibility,
use and quality of information
and communication
technologies (ICT) in rural
areas
Percentage of rural population benefiting from
new or improved services / infrastructures (ICT)

5
DEFINITIONS IN THE FICHES
When reference is made to measures, sub-measures and their codes, please see
exact denominations in Annex I, Part 5, to Commission Implementing Regulation
(EC) No 808/2014.
Indicator Name
Title of the indicator which will be used in implementing regulation/guidance documents.
Indicator code
Alphanumeric identifier.
Target indicator
Identification of whether the indicator is a target indicator.
The related priority
Identification of the priority to which the indicator is linked as defined in the Pillar II intervention
logic.
The related focus area
Identification of the focus area to which the indicator is linked as defined in the Pillar II
intervention logic.
Definition
Concise definition of the concept, including if the indicator already exists, e.g. AEI, EUROSTAT
indicator.
Unit of measurement
Unit used to record the value (e.g. ha, tonnes, €, %).
Methodology/formula
Identification of what is needed to transform data from the operations database into value for the
indicator.
Data required for the individual operation
Data required from the operations database in order to calculate the relevant indicator (e.g. area
of solar panels, ha of trees planted per species…). The units of measurement of these outputs
should be specified.
Data source/location of the data
Identification of where the data for the indicator comes from, links or other references to data
sources (e.g. in EUROSTAT specifying exact tables, FAO, World Bank) AEI definitions,
regulations establishing indicators, etc.
Point of data collection
Point(s) in time at which data is collected (e.g. operation/project approval, completion or during
evaluation activities).
Frequency
In principle this would be annual. If annual is not adequate, please specify.
Delay
Delay between data collection and data aggregation (where external statistical data is used).
Means of transmission to Commission
Identification of the way in which the data is made available to the Commission (e.g. submitted
with enhanced AIR in 2019 or quarterly/annual electronic submission).
Comments/caveats
Comments concerning interpretation of the indicator for monitoring and evaluation purposes and
its caveats, if appropriate.
Mention of context indicators specifically linked to this indicator (or required for its calculation).
6
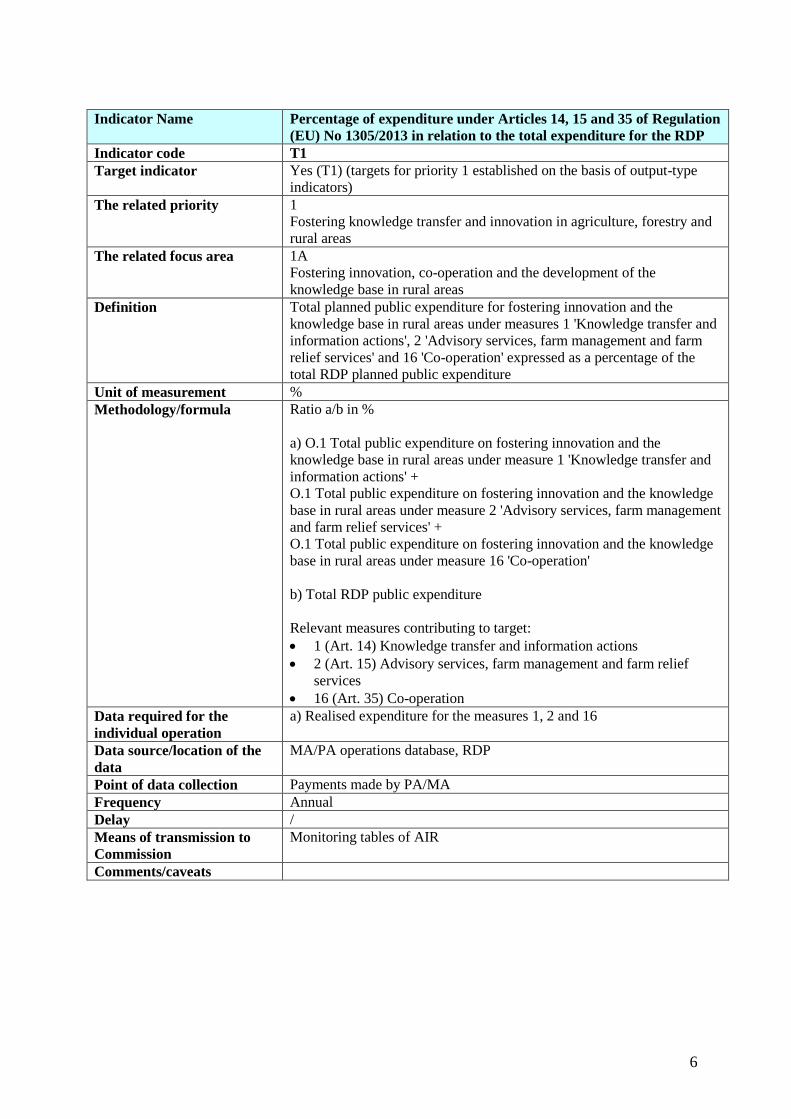
Indicator Name Percentage of expenditure under Articles 14, 15 and 35 of Regulation
(EU) No 1305/2013 in relation to the total expenditure for the RDP
Indicator code T1
Target indicator Yes (T1) (targets for priority 1 established on the basis of output-type
indicators)
The related priority 1
Fostering knowledge transfer and innovation in agriculture, forestry and
rural areas
The related focus area 1A
Fostering innovation, co-operation and the development of the
knowledge base in rural areas
Definition Total planned public expenditure for fostering innovation and the
knowledge base in rural areas under measures 1 'Knowledge transfer and
information actions', 2 'Advisory services, farm management and farm
relief services' and 16 'Co-operation' expressed as a percentage of the
total RDP planned public expenditure
Unit of measurement %
Methodology/formula Ratio a/b in %
a) O.1 Total public expenditure on fostering innovation and the
knowledge base in rural areas under measure 1 'Knowledge transfer and
information actions' +
O.1 Total public expenditure on fostering innovation and the knowledge
base in rural areas under measure 2 'Advisory services, farm management
and farm relief services' +
O.1 Total public expenditure on fostering innovation and the knowledge
base in rural areas under measure 16 'Co-operation'
b) Total RDP public expenditure
Relevant measures contributing to target:
1 (Art. 14) Knowledge transfer and information actions
2 (Art. 15) Advisory services, farm management and farm relief
services
16 (Art. 35) Co-operation
Data required for the
individual operation
a) Realised expenditure for the measures 1, 2 and 16
Data source/location of the
data
MA/PA operations database, RDP
Point of data collection Payments made by PA/MA
Frequency Annual
Delay /
Means of transmission to
Commission
Monitoring tables of AIR
Comments/caveats

7
Indicator Name Total number of co-operation operations supported under the co-
operation measure (Article 35 of Regulation (EU) No 1305/2013) (groups,
networks/clusters, pilot projects…)
Indicator code T2
Target indicator Yes (T2) (targets for priority 1 established on the basis of output-type
indicators)
The related priority 1
Fostering knowledge transfer and innovation in agriculture, forestry and rural
areas
The related focus area 1B
Strengthening the links between agriculture, food production and forestry and
research and innovation, including for the purpose of improved environmental
management and performance
Definition Number of co-operation operations (groups, networks/clusters, pilot
projects…) supported under measure 16 'Co-operation'
Unit of measurement Number
Methodology/formula /
O.16 + O.17
Relevant measures contributing to target:
16 (Art. 35) Co-operation
Data required for the
individual operation
O.16 Number of EIP operational groups to be supported (establishment and
operation) and O.17 Number of other co-operation operations (groups,
networks/clusters, pilot projects…) to be supported under measure 16 'Co-
operation'
Data source/location of
the data
MA/PA operations database (output indicator) from application forms
Point of data collection Data collected at application level but reported when the operation is
completed
Frequency Annual
Delay /
Means of transmission
to Commission
Monitoring tables of AIR
Comments/caveats

8
Indicator Name Total number of participants trained under Article 14 of Regulation (EU)
No 1305/2013
Indicator code T3
Target indicator Yes (T3) (targets for priority 1 established on the basis of output-type
indicators)
The related priority 1
Fostering knowledge transfer and innovation in agriculture, forestry and rural
areas
The related focus area 1C
Fostering lifelong learning and vocational training in the agricultural and
forestry sectors
Definition Total number of participants trained under measure 1 'Knowledge transfer and
information actions'
Unit of measurement Number
Methodology/formula /
O.12
Relevant measures contributing to target:
1 (Art. 14) Knowledge transfer and information actions,1.1, vocational
training
Data required for the
individual operation
Number of participants trained under measure 1 'Knowledge transfer and
information actions' (only 1.1, vocational training )
Data source/ location of
the data
MA/PA operations database (output indicator)
Point of data collection Application form, plus confirmation/amendment on completion of the
operation
Frequency Annual
Delay /
Means of transmission
to Commission
Monitoring tables of AIR
Comments/caveats

9
Indicator Name Percentage of agriculture holdings with RDP support for investment in
restructuring or modernisation
Indicator code R1/T4
Target indicator Yes (T4)
The related priority 2
Enhancing farm viability and competitiveness of all types of agriculture
in all regions and promoting innovative farm technologies and the
sustainable management of forests
The related focus area 2A
Improving the economic performance of all farms and facilitating farm
restructuring and modernisation, notably with a view to increase market
participation and orientation as well as agricultural diversification
Definition Total number of farm holding receiving support for investment in restructuring
or modernisation under measure 4 over the programming period expressed as a
percentage of the total number of agricultural holdings in base year for the
RDP area
Unit of measurement Number
%
Methodology/formula Ratio a/b in %
a) O.4 Total number of farm holdings receiving support for investment in
restructuring and/or modernisation under measure 4 over the programming
period
b) Total number of agricultural holdings in base year for the RDP area
Relevant measures contributing to target (when programmed under this focus
area):
4.1 (Art.17) Investments in physical assets
Data required for the
individual operation
a) Total number of farm holdings receiving support for investment in
restructuring and/or modernisation under measure 4 over the programming
period (cumulative)
b) Total number of agricultural holdings in base year for the RDP area
Data source/ location of
the data
a) Total number of farm holdings receiving support for investment in
restructuring and/or modernisation: from applications, MA/PA operations
database (output indicator)
b) Total number of agricultural holdings: Eurostat: Farm Structure Survey
Point of data collection a) Total number of farm holdings receiving support for investment in
restructuring and/or modernisation: data collected at application level but
reported when the operation is completed
b) Total number of agricultural holdings: /
Frequency a) Total number of farm holdings receiving support for investment in
restructuring and/or modernisation: annual
b) Total number of agricultural holdings: /
Delay a) Total number of farm holdings receiving support for investment in
restructuring and/or modernisation: /
b) Total number of agricultural holdings: /
Means of transmission to
Commission
a) Monitoring tables of AIR
Comments/caveats The available base year for the total number of agricultural holdings might not
be 2013 when RDP are drafted (depending on statistics availability). Update
will be needed.
Same beneficiary supported for several and different operations (several and
different applications) is counted several times.
10
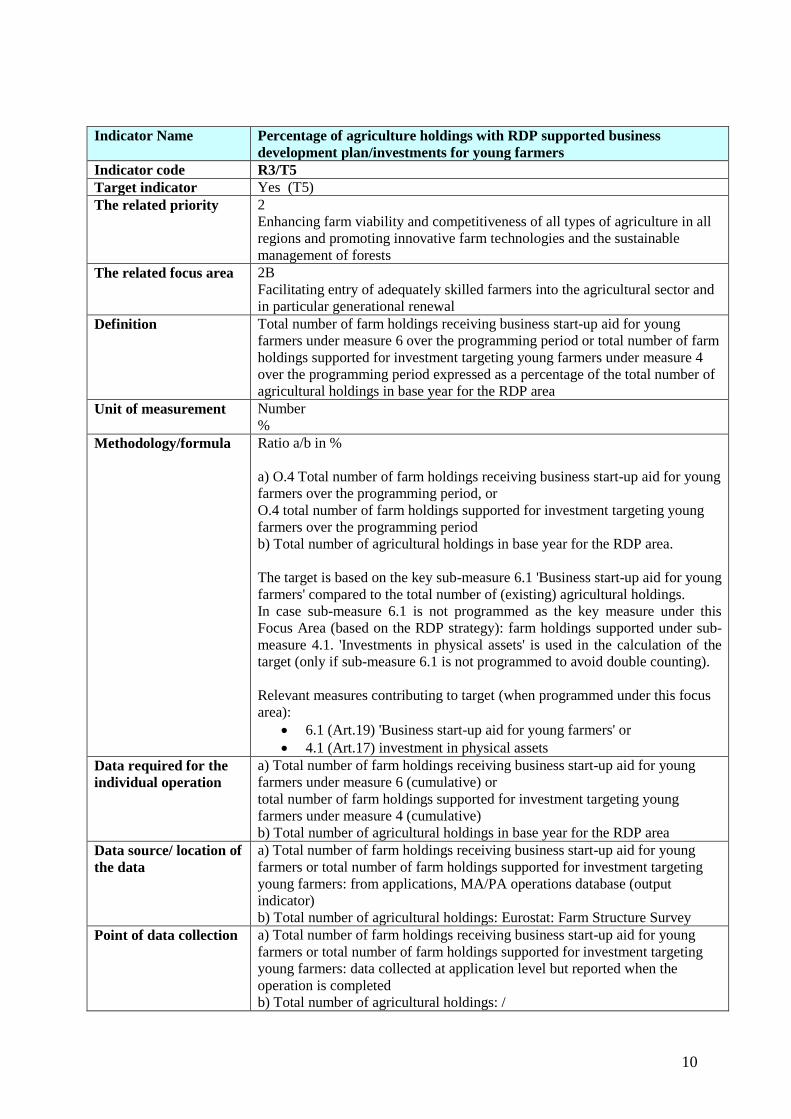
Indicator Name Percentage of agriculture holdings with RDP supported business
development plan/investments for young farmers
Indicator code R3/T5
Target indicator Yes (T5)
The related priority 2
Enhancing farm viability and competitiveness of all types of agriculture in all
regions and promoting innovative farm technologies and the sustainable
management of forests
The related focus area 2B
Facilitating entry of adequately skilled farmers into the agricultural sector and
in particular generational renewal
Definition Total number of farm holdings receiving business start-up aid for young
farmers under measure 6 over the programming period or total number of farm
holdings supported for investment targeting young farmers under measure 4
over the programming period expressed as a percentage of the total number of
agricultural holdings in base year for the RDP area
Unit of measurement Number
%
Methodology/formula Ratio a/b in %
a) O.4 Total number of farm holdings receiving business start-up aid for young
farmers over the programming period, or
O.4 total number of farm holdings supported for investment targeting young
farmers over the programming period
b) Total number of agricultural holdings in base year for the RDP area.
The target is based on the key sub-measure 6.1 'Business start-up aid for young
farmers' compared to the total number of (existing) agricultural holdings.
In case sub-measure 6.1 is not programmed as the key measure under this
Focus Area (based on the RDP strategy): farm holdings supported under sub-
measure 4.1. 'Investments in physical assets' is used in the calculation of the
target (only if sub-measure 6.1 is not programmed to avoid double counting).
Relevant measures contributing to target (when programmed under this focus
area):
6.1 (Art.19) 'Business start-up aid for young farmers' or
4.1 (Art.17) investment in physical assets
Data required for the
individual operation
a) Total number of farm holdings receiving business start-up aid for young
farmers under measure 6 (cumulative) or
total number of farm holdings supported for investment targeting young
farmers under measure 4 (cumulative)
b) Total number of agricultural holdings in base year for the RDP area
Data source/ location of
the data
a) Total number of farm holdings receiving business start-up aid for young
farmers or total number of farm holdings supported for investment targeting
young farmers: from applications, MA/PA operations database (output
indicator)
b) Total number of agricultural holdings: Eurostat: Farm Structure Survey
Point of data collection a) Total number of farm holdings receiving business start-up aid for young
farmers or total number of farm holdings supported for investment targeting
young farmers: data collected at application level but reported when the
operation is completed
b) Total number of agricultural holdings: /

11
Frequency a) Total number of farm holdings receiving business start-up aid for young
farmers or total number of farm holdings supported for investment targeting
young farmers : annual
b) Total number of agricultural holdings: /
Delay a) Total number of farm holdings receiving business start-up aid for young
farmers or total number of farm holdings supported for investment targeting
young farmers: /
b) Total number of agricultural holdings: /
Means of transmission
to Commission
a) Monitoring tables of AIR
Comments/caveats The available base year for the total number of agricultural holdings might not
be 2013 when RDP are drafted (depending on statistics availability). Update
will be needed.
12
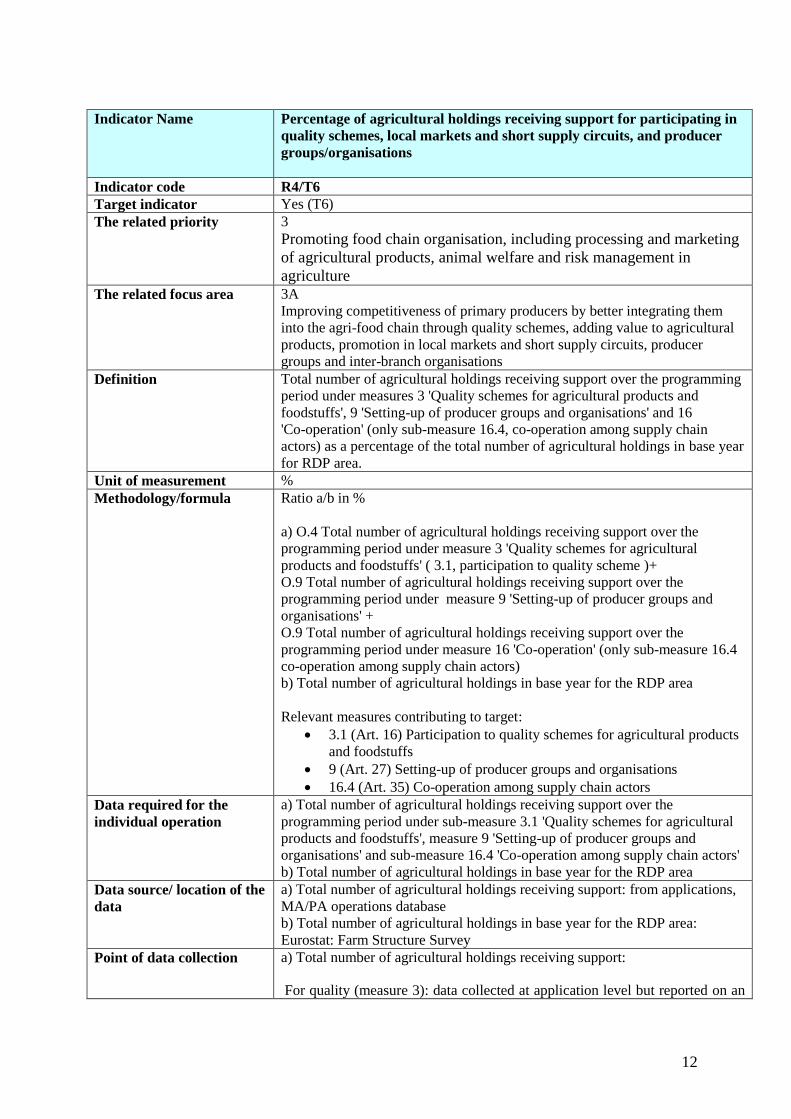
Indicator Name Percentage of agricultural holdings receiving support for participating in
quality schemes, local markets and short supply circuits, and producer
groups/organisations
Indicator code R4/T6
Target indicator Yes (T6)
The related priority 3
Promoting food chain organisation, including processing and marketing
of agricultural products, animal welfare and risk management in
agriculture
The related focus area 3A
Improving competitiveness of primary producers by better integrating them
into the agri-food chain through quality schemes, adding value to agricultural
products, promotion in local markets and short supply circuits, producer
groups and inter-branch organisations
Definition Total number of agricultural holdings receiving support over the programming
period under measures 3 'Quality schemes for agricultural products and
foodstuffs', 9 'Setting-up of producer groups and organisations' and 16
'Co-operation' (only sub-measure 16.4, co-operation among supply chain
actors) as a percentage of the total number of agricultural holdings in base year
for RDP area.
Unit of measurement %
Methodology/formula Ratio a/b in %
a) O.4 Total number of agricultural holdings receiving support over the
programming period under measure 3 'Quality schemes for agricultural
products and foodstuffs' ( 3.1, participation to quality scheme )+
O.9 Total number of agricultural holdings receiving support over the
programming period under measure 9 'Setting-up of producer groups and
organisations' +
O.9 Total number of agricultural holdings receiving support over the
programming period under measure 16 'Co-operation' (only sub-measure 16.4
co-operation among supply chain actors)
b) Total number of agricultural holdings in base year for the RDP area
Relevant measures contributing to target:
3.1 (Art. 16) Participation to quality schemes for agricultural products
and foodstuffs
9 (Art. 27) Setting-up of producer groups and organisations
16.4 (Art. 35) Co-operation among supply chain actors
Data required for the
individual operation
a) Total number of agricultural holdings receiving support over the
programming period under sub-measure 3.1 'Quality schemes for agricultural
products and foodstuffs', measure 9 'Setting-up of producer groups and
organisations' and sub-measure 16.4 'Co-operation among supply chain actors'
b) Total number of agricultural holdings in base year for the RDP area
Data source/ location of the
data
a) Total number of agricultural holdings receiving support: from applications,
MA/PA operations database
b) Total number of agricultural holdings in base year for the RDP area:
Eurostat: Farm Structure Survey
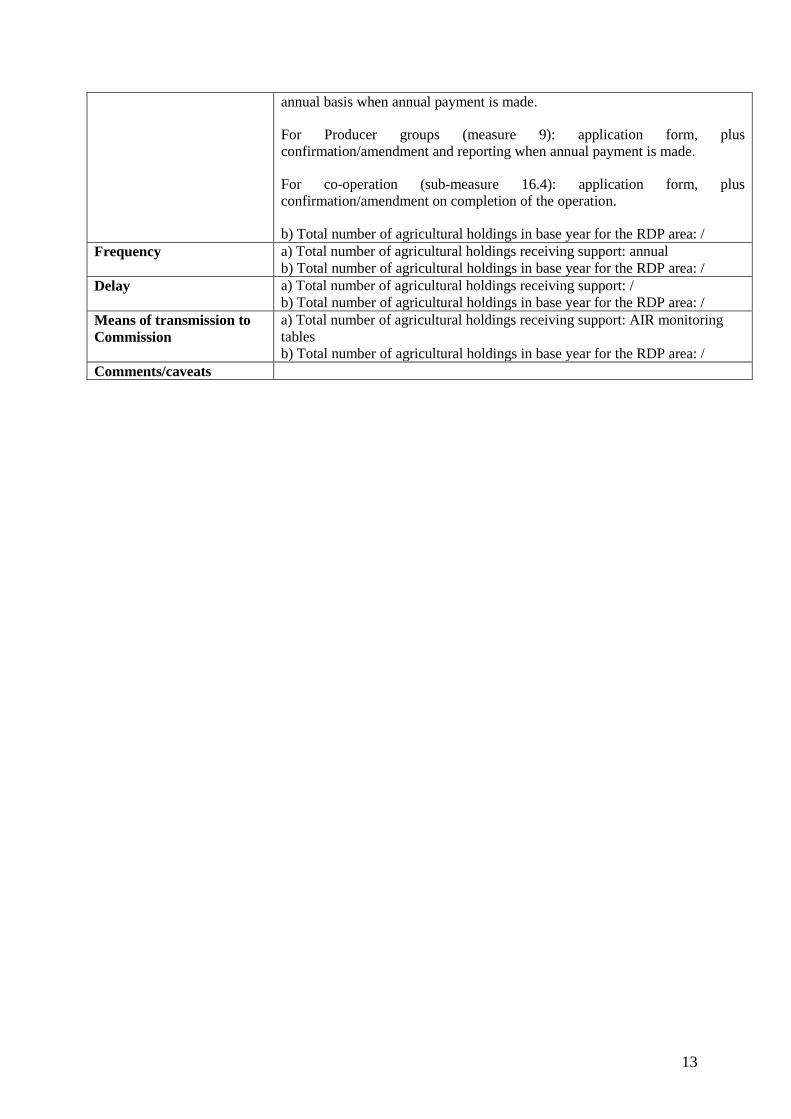
Point of data collection a) Total number of agricultural holdings receiving support:
For quality (measure 3): data collected at application level but reported on an
13
annual basis when annual payment is made.
For Producer groups (measure 9): application form, plus
confirmation/amendment and reporting when annual payment is made.
For co-operation (sub-measure 16.4): application form, plus
confirmation/amendment on completion of the operation.
b) Total number of agricultural holdings in base year for the RDP area: /
Frequency a) Total number of agricultural holdings receiving support: annual
b) Total number of agricultural holdings in base year for the RDP area: /
Delay a) Total number of agricultural holdings receiving support: /
b) Total number of agricultural holdings in base year for the RDP area: /
Means of transmission to
Commission
a) Total number of agricultural holdings receiving support: AIR monitoring
tables
b) Total number of agricultural holdings in base year for the RDP area: /
Comments/caveats

14
Indicator Name Percentage of farms participating in risk management schemes
Indicator code R5/T7
Target indicator Yes (T7)
The related priority 3
Promoting food chain organisation, including processing and marketing
of agricultural products, animal welfare and risk management in
agriculture
The related focus area 3B
Supporting farm risk prevention and management
Definition Total number of agricultural holdings supported for insurance premiums under
sub-measure 17.1, participating in mutual funds under sub-measure 17.2,
participating in income stabilisation tool under sub-measure 17.3, and
investing in preventive actions under measure 5.1 expressed as a percentage of
the total number of agricultural holdings in base year for the RDP area
Unit of measurement Number
%
Methodology/formula Ratio a/b in %
a) O.4 Number of agricultural holdings supported for insurance premiums
(17.1) + O.9 Number of agricultural holdings participating in mutual funds
(17.2) + O.9 Number of agricultural holdings participating in income
stabilisation tool (17.3) + O.4 Number of agricultural holdings investing in
preventive actions (5.1)
b) Total number of agricultural holdings in base year for the RDP area
Relevant measures contributing to target:
17.1 (Art. 37) Crop, animal and plant insurance
17.2 (Art. 38) Mutual funds for adverse climatic events, animal and
plant diseases, pest infestations and environmental incidents
17.3 (Art. 39) Income stabilisation tool
5.1 (Art. 18) Restoring agricultural production potential damaged by
natural disasters and catastrophic events and introduction of
appropriate prevention actions
Data required for the
individual operation
a) Number of agricultural holdings supported for insurance premiums (17.1),
number of agricultural holdings participating in mutual funds (17.2), number
of agricultural holdings participating in income stabilisation tool (17.3),
number of agricultural holdings investing in preventive actions (5.1).
b) Total number of agricultural holdings: Eurostat: Farm Structure Survey
Data source/ location of
the data
a) Number of agricultural holdings supported for insurance premiums (17.1
number of agricultural holdings participating in mutual funds (17.2), number
of agricultural holdings participating in income stabilisation tool (17.3),
number of agricultural holdings investing in preventive actions (5.1): from
applications, MA/PA operations database (output indicator)
b) Total number of agricultural holdings: Eurostat: Farm Structure Survey
Point of data collection a) Number of agricultural holdings supported for insurance premiums (17.1)
and number of agricultural holdings investing in preventive actions (5.1): data
collected at application level but reported when the operation is completed.
Number of agricultural holdings participating in mutual funds (17.2) and
number of agricultural holdings participating in income stabilisation tool
(17.3): application form, plus confirmation on completion of the operation
b) Total number of agricultural holdings: /

15
Frequency a) Number of agricultural holdings supported for insurance premiums (17.1),
number of agricultural holdings participating in mutual funds (17.2), number
of agricultural holdings participating in income stabilisation tool (17.3),
number of agricultural holdings investing in preventive actions (5.1): annual.
b) Total number of agricultural holdings: /
Delay /
Means of transmission
to Commission
/
Comments/caveats

16
Indicator Name FA 4A: Percentage of agricultural land under management contracts
supporting biodiversity and/or landscapes
FA 4B: Percentage of agricultural land under management contracts to
improve water management
FA 4C: Percentage of Agricultural land under management contracts to
improve soil management and/or prevent soil erosion
Indicator code R7/T9
R8/T10
R10/T12
Target indicator Yes (T9, T10, T12)
The related priority 4
Restoring, preserving and enhancing ecosystems related to agriculture
and forestry
The related focus area 4A Restoring, preserving and enhancing biodiversity, including in
NATURA 2000 areas, and in areas facing natural or other specific
constraints, and high nature value farming, as well as the state of European
landscapes
4B Improving water management, including fertiliser and pesticide
management
4C Preventing soil erosion and improving soil management
Definition 4A % of agricultural land under management contracts restoring or
preserving biodiversity and/or landscapes
Relevant measures contributing to target:
- 10 (Art. 28) Agri-environment-climate
- 11 (Art. 29) Organic farming
- 12.1 (Art. 30) Natura 2000 in agricultural area
- 8.1 and 8.2 (Art. 21 establishment only) Afforestation and creation of
woodland and establishment of agroforestry systems
4B % of agricultural land under management contracts improving water
management
Relevant measures contributing to target:
- 10 (Art. 28) Agri-environment-climate
- 11 (Art. 29) Organic farming
- 12.3 (Art. 30) Water Framework Directive payments
- 8.1 and 8.2 (Art. 21 establishment only) Afforestation and creation of
woodland and establishment of agroforestry systems
4C % of agricultural land under management contracts improving soil
management and/or preventing soil erosion
Relevant measures contributing to target:
- 10 (Art. 28) Agri-environment-climate
- 11 (Art. 29) Organic farming
- 8.1 and 8.2 (Art. 21 establishment only) Afforestation and creation of
woodland and establishment of agroforestry systems

17
Unit of measurement Ha
%
Methodology/formula 4A % of agricultural land under management contracts restoring or
preserving biodiversity and/or landscapes
Ratio a/b in %
a) Physical agricultural land area (ha) under land management restoring and
preserving biodiversity
b) Total agricultural land area (ha) in 2013 for the RDP area
4B % of agricultural land under management contracts improving water
management
Ratio a/b in %
a) Physical agricultural land area (ha) under land management improving
water management
b) Total agricultural land area (ha) in 2013 for the RDP area
4C % of agricultural land under management contracts improving soil
management and/or preventing soil erosion
Ratio a/b in %
a) Physical agricultural land area (ha) under land management improving soil
management
b) Total agricultural land area (ha) in 2013 for the RDP area
If justified, area under land management which addresses more than one of
these focus areas should count for the target of each of these relevant focus
areas (see table below).
Physical area: if different measures or schemes are implemented on the same
area for the same focus area, no double counting is allowed
Data required for the
individual operation
a) Total agricultural land area under land management
b) Total agricultural land area in base year for the RDP area
Data source/ location of
the data
a) Total physical area: from MA/PA operations database and IACS
b) Total agricultural land area in base year for the RDP area: EUROSTAT
Point of data collection a) Total physical area for measures 10, 11 and 12: area paid after
administrative and on-the-spot checks of the annual claims; for sub-measures
8.1 and 8.2 establishment only: data collected in applications and reported
when completed
b) Total agricultural land area:/
Frequency a) Total physical area: annual
b) Total agricultural land area in 2013 for the RDP area:/
Delay a) Total physical area: /
b) Total agricultural land area in 2013 for the RDP area:/
Means of transmission
to Commission
Monitoring tables of AIR
Comments/caveats

18
Indicator Name FA 4A Percentage of forest or other wooded areas under management
contracts supporting biodiversity
FA 4B Percentage of forestry land under management contracts to
improve water management
FA 4C Percentage of forestry land under management contracts to
improve soil management and/or prevent soil erosion
Indicator code R6/T8
R9/T11
R11/T13
Target indicator Yes (T8, T11, T13)
The related priority 4
Restoring, preserving and enhancing ecosystems related to agriculture
and forestry
The related focus area 4A Restoring, preserving and enhancing biodiversity, including in
NATURA 2000 areas, and in areas facing natural or other specific
constraints, and high nature value farming, as well as the state of European
landscapes
4B Improving water management, including fertiliser and pesticide
management
4C Preventing soil erosion and improving soil management
Definition 4A % of forest or other wooded areas under management contracts
restoring or preserving biodiversity
Relevant measures contributing to target:
- 15 (Art. 34) Forest-environmental and climate services and forest
conservation
- 12.2 (Art. 30) Natura 2000 in forestry area
- 8.5 (Art. 21) Investments improving the resilience and environmental value
of forest ecosystems
4B % of forestry land under management contracts improving water
management
Relevant measures contributing to target:
- 15 (Art. 34) Forest-environmental and climate services and forest
conservation
- 8.5 (Art. 21) Investments improving the resilience and environmental value
of forest ecosystems
4C % of forestry land under management contracts improving soil
management and/or preventing soil erosion
Relevant measures contributing to target:
- 15 (Art. 34) Forest-environmental and climate services and forest
conservation
- 8.5 (Art. 21) Investments improving the resilience and environmental value
of forest ecosystems
Unit of measurement Ha

19
%
Methodology/formula 4A % of forest or other wooded areas under management contracts
restoring or preserving biodiversity
Ratio a/b in %
a) Physical forestry or wooded land area (ha) under land management restoring
or preserving biodiversity
b) Total forestry or wooded land area (ha) in 2013 for the RDP area
4B % of forestry land under management contracts improving water
management
Ratio a/b in %
a) Physical forestry or wooded land area (ha) under land management
improving water management
b) Total forestry or wooded land area (ha) in 2013 for the RDP area
4C % of forestry land under management contracts improving soil
management and/or preventing soil erosion
Ratio a/b in %
a) Physical forestry or wooded land area (ha) under land management
improving soil management
b) Total forestry or wooded land area (ha) in 2013 for the RDP area
For sub-measure 8.5 Investments improving the resilience and environmental
value of forest ecosystems: output indicator area concerned by investment
improving the resilience and environmental value of forest ecosystems should
be used.
If justified, areas under land management which address more than one of
these focus areas should count for the target of each of these relevant focus
areas (see table below).
Physical area: if different measures or schemes are implemented on the same
area for the same focus area, no double counting is allowed.
Data required for the
individual operation
a) Total area under land management
b) Total forestry area in base year for the RDP area
Data source/ location of
the data
a) Total physical area: from MA/PA operations database and IACS
b) Total forestry and wooded land area in 2013 for the RDP area: Land cover
statistics (to be confirmed)
Point of data collection a) Total physical area: Natura 2000 (12) and Forest-environment (15): area
having received annual payment. Investment improving resilience (8.5): data
collected at application level and reported when completed
b) Total forestry and wooded land area in 2013 for the RDP area: /
Frequency a) Total physical area: annual
b) Total forestry area in 2013 for the RDP area: /
Delay a) Total physical area: /
b) Total forestry area in 2013 for the RDP area: /
Means of transmission
to Commission
Monitoring tables of AIR
Comments/caveats

20
Indicator Name Percentage of irrigated land switching to more efficient irrigation systems
Indicator code R12/T14
Target indicator Yes (T14)
The related priority 5
Promoting resource efficiency and supporting the shift towards a low carbon
and climate resilient economy in agriculture, food and forestry sectors
The related focus area 5A
Increasing efficiency in water use by agriculture
Definition % of irrigated land switching to more efficient irrigation systems funded under
measures 4 (concerning investments to convert irrigation systems) and 10
(concerning land management contracts to reduce irrigated land)
Unit of measurement Number
%
Methodology/formula Ratio a/b in %
a) Number of hectares switching to more efficient irrigation systems through
RDP, including:
- O.5 Number of hectares concerned by investments in more efficient
irrigation systems (measure 4)
+ O.5 Number of hectares switching to more efficient irrigation systems
through agri-environment-climate actions (measure 10) such as the reduction
of irrigated land programmed under FA 5A
b) Total irrigated land in a base year
Relevant measures contributing to target (when programmed under this focus
area):
4 (Art. 17) Investments in physical assets
10 (Art. 28) Agri-environment-climate
Data required for the
individual operation
a) Number of hectares switching to more efficient irrigation systems through
RDP support described above
b) Total irrigated land in a base year
Data source/ location of
the data
a) Number of hectares switching to more efficient irrigation systems: MA/PA
operations database, IACS
b) Total irrigated land in a base year: Eurostat
Point of data collection a) Number of hectares switching to more efficient irrigation systems:
Agri-environment-climate (measure 10): area paid after administrative and on-
the-spot checks of the annual claims. Investments in physical assets (measure
4): collected from applications and reported when the operation is completed
b) Total irrigated land in a base year: Eurostat
Frequency a) Number of hectares switching to more efficient irrigation systems: annual
b) Total irrigated land in a base year: Eurostat
Delay /
Means of transmission
to Commission
Monitoring tables of AIR
Comments/caveats
21
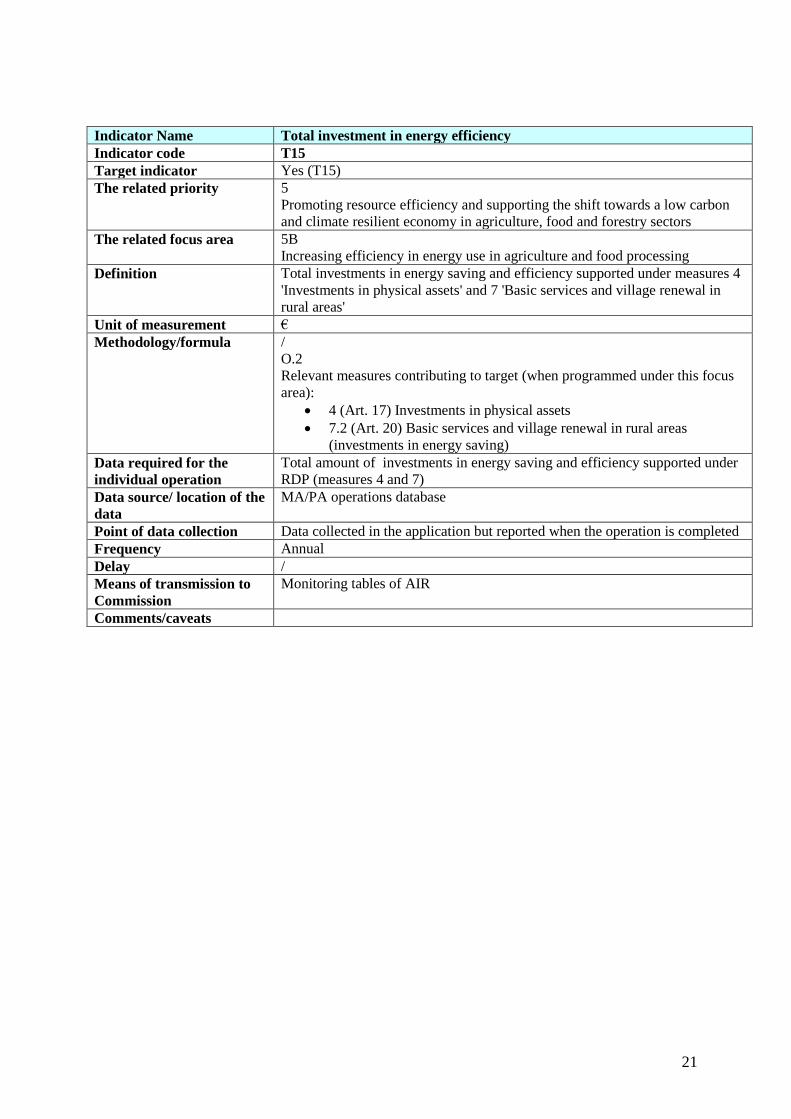
Indicator Name Total investment in energy efficiency
Indicator code T15
Target indicator Yes (T15)
The related priority 5
Promoting resource efficiency and supporting the shift towards a low carbon
and climate resilient economy in agriculture, food and forestry sectors
The related focus area 5B
Increasing efficiency in energy use in agriculture and food processing
Definition Total investments in energy saving and efficiency supported under measures 4
'Investments in physical assets' and 7 'Basic services and village renewal in
rural areas'
Unit of measurement €
Methodology/formula /
O.2
Relevant measures contributing to target (when programmed under this focus
area):
4 (Art. 17) Investments in physical assets
7.2 (Art. 20) Basic services and village renewal in rural areas
(investments in energy saving)
Data required for the
individual operation
Total amount of investments in energy saving and efficiency supported under
RDP (measures 4 and 7)
Data source/ location of the
data
MA/PA operations database
Point of data collection Data collected in the application but reported when the operation is completed
Frequency Annual
Delay /
Means of transmission to
Commission
Monitoring tables of AIR
Comments/caveats
22
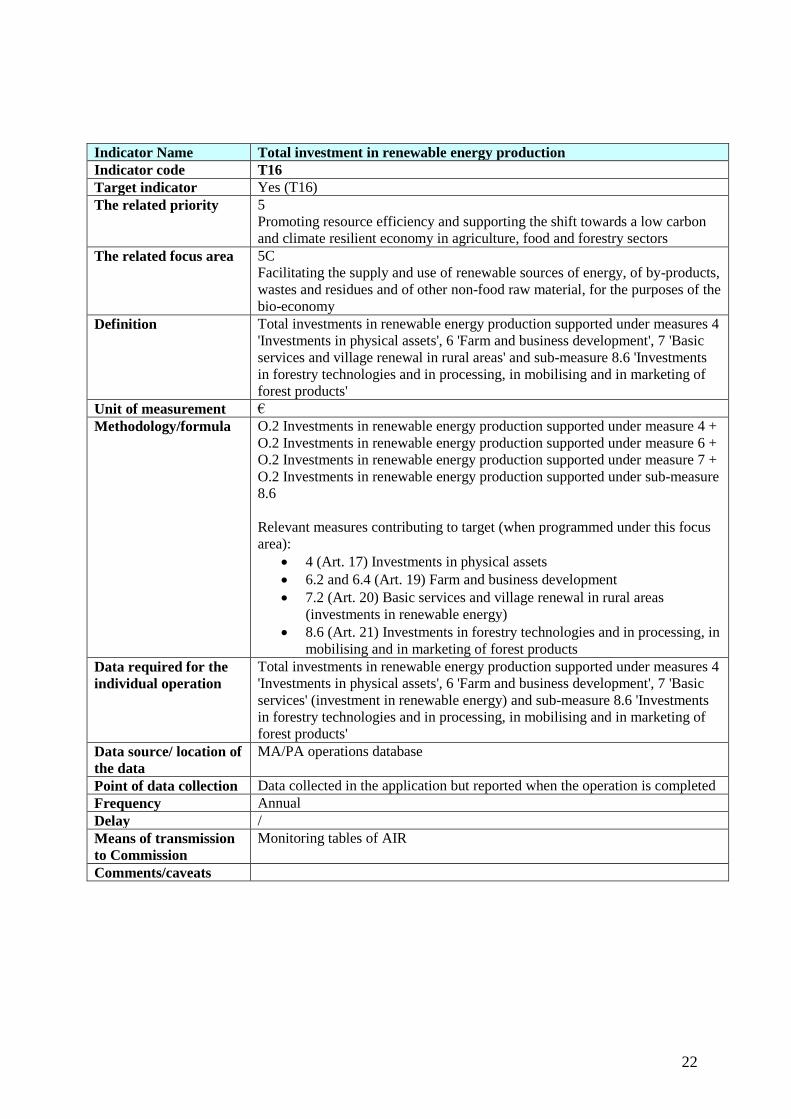
Indicator Name Total investment in renewable energy production
Indicator code T16
Target indicator Yes (T16)
The related priority 5
Promoting resource efficiency and supporting the shift towards a low carbon
and climate resilient economy in agriculture, food and forestry sectors
The related focus area 5C
Facilitating the supply and use of renewable sources of energy, of by-products,
wastes and residues and of other non-food raw material, for the purposes of the
bio-economy
Definition Total investments in renewable energy production supported under measures 4
'Investments in physical assets', 6 'Farm and business development', 7 'Basic
services and village renewal in rural areas' and sub-measure 8.6 'Investments
in forestry technologies and in processing, in mobilising and in marketing of
forest products'
Unit of measurement €
Methodology/formula O.2 Investments in renewable energy production supported under measure 4 +
O.2 Investments in renewable energy production supported under measure 6 +
O.2 Investments in renewable energy production supported under measure 7 +
O.2 Investments in renewable energy production supported under sub-measure
8.6
Relevant measures contributing to target (when programmed under this focus
area):
4 (Art. 17) Investments in physical assets
6.2 and 6.4 (Art. 19) Farm and business development
7.2 (Art. 20) Basic services and village renewal in rural areas
(investments in renewable energy)
8.6 (Art. 21) Investments in forestry technologies and in processing, in
mobilising and in marketing of forest products
Data required for the
individual operation
Total investments in renewable energy production supported under measures 4
'Investments in physical assets', 6 'Farm and business development', 7 'Basic
services' (investment in renewable energy) and sub-measure 8.6 'Investments
in forestry technologies and in processing, in mobilising and in marketing of
forest products'
Data source/ location of
the data
MA/PA operations database
Point of data collection Data collected in the application but reported when the operation is completed
Frequency Annual
Delay /
Means of transmission
to Commission
Monitoring tables of AIR
Comments/caveats

23
Indicator Name Percentage of Livestock Units (LU) concerned by investments in livestock
management in view of reducing GHG and/or ammonia emissions
Indicator code R 16/T17
Target indicator Yes (T17)
The related priority 5
Promoting resource efficiency and supporting the shift towards a low carbon
and climate resilient economy in agriculture, food and forestry sectors
The related focus area 5D
Reducing greenhouse gas and ammonia emissions from agriculture
Definition LU concerned by investments in livestock management in view of reducing
GHG and/or ammonia emissions supported under measure 4 'Investments in
physical assets' as a percentage of total LU in a base year
Unit of measurement Number
%
Methodology/formula Ratio a/b
a) O.8 Total number of LU concerned by investments on farm aiming at
reducing GHG and/or ammonia emissions supported under measure 4 (e.g. for
an investment in manure treatment, the number of LU concerned by that
investment on the farm).
b) Total LU in a base year
Relevant measures contributing to target (when programmed under this focus
area):
4 (Art. 17) Investments in physical assets
Data required for the
individual operation
a) LU concerned by investments in livestock management in view of reducing
GHG and/or ammonia emissions supported under measure 4
Data source/ location of
the data
a) LU concerned by investments in livestock management: from applications,
MA/PA operations database
b) Total LU: regional/national statistics
Point of data collection a) LU concerned by investments in livestock management: data collected in
the application but used when the action is completed
b) Total LU: regional/national statistics
Frequency a) LU concerned by investments in livestock management: annual
b) Total LU: regional/national statistics
Delay a) LU concerned by investments in livestock management: /
b) Total LU: regional/national statistics
Means of transmission to
Commission
Monitoring tables of AIR
Comments/caveats

24
Indicator Name Percentage of agricultural land under management contracts targeting
reduction of GHG and/or ammonia emissions
Indicator code R17/T18
Target indicator Yes (T18)
The related priority 5
Promoting resource efficiency and supporting the shift towards a low carbon
and climate resilient economy in agriculture, food and forestry sectors
The related focus area 5D
Reducing greenhouse gas and ammonia emissions from agriculture
Definition Agricultural land under management contracts targeting reduction of GHG
and/or ammonia emissions supported under measure 10 as a percentage of total
agricultural land in a base year
Unit of measurement Number
%
Methodology/formula Ratio a/b
a) O.5 Agricultural land under management contracts targeting reduction of
GHG and/or ammonia emissions supported under the RDP, including:
- land dedicated to reducing GHG and/or ammonia emissions under measure
10 (e.g. green cover, catch crops, reduced fertilisation, extensification)
programmed under FA 5D or P4
The total number of hectares should be reduced to the physical area: where
hectares are covered by two of these schemes/measures for the reduction of
GHG and/or ammonia emissions, only one hectare should be counted (not
two). It is the real surface where at least one action to reduce N2O emissions
and methane is taking place which should be counted.
b) total agricultural land in a base year
Relevant measures contributing to target (when programmed under this focus
area):
10 (Art. 28) Agri-environment-climate
Data required for the
individual operation
see above
Data source/ location of
the data
a) Agricultural land under management contracts targeting reduction of GHG
and/or ammonia emissions: MA/PA operations database (+ IACS)
b) Total agricultural land: Eurostat
Point of data collection a) Agricultural land under management contracts targeting reduction of GHG
and/or ammonia emissions: measure 10 'Agri-environment-climate': area paid
after administrative and on-the-spot checks of the annual claims
b) Total agricultural land: Eurostat
Frequency a) Agricultural land under management contracts targeting reduction of GHG
and/or ammonia emissions: annual
b) Total agricultural land: Eurostat
Delay a) Agricultural land under management contracts targeting reduction of GHG
and/or ammonia emissions: /
b) Total agricultural land: Eurostat
Means of transmission
to Commission
Monitoring tables of AIR
Comments/caveats
25
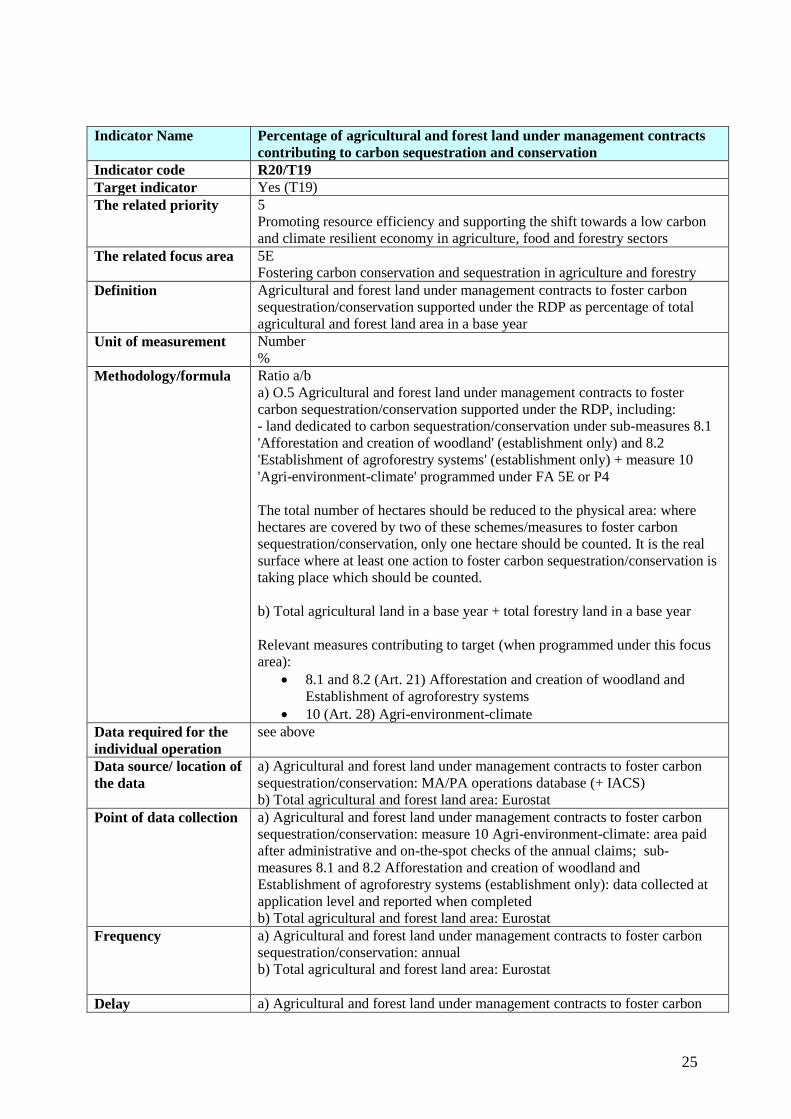
Indicator Name Percentage of agricultural and forest land under management contracts
contributing to carbon sequestration and conservation
Indicator code R20/T19
Target indicator Yes (T19)
The related priority 5
Promoting resource efficiency and supporting the shift towards a low carbon
and climate resilient economy in agriculture, food and forestry sectors
The related focus area 5E
Fostering carbon conservation and sequestration in agriculture and forestry
Definition Agricultural and forest land under management contracts to foster carbon
sequestration/conservation supported under the RDP as percentage of total
agricultural and forest land area in a base year
Unit of measurement Number
%
Methodology/formula Ratio a/b
a) O.5 Agricultural and forest land under management contracts to foster
carbon sequestration/conservation supported under the RDP, including:
- land dedicated to carbon sequestration/conservation under sub-measures 8.1
'Afforestation and creation of woodland' (establishment only) and 8.2
'Establishment of agroforestry systems' (establishment only) + measure 10
'Agri-environment-climate' programmed under FA 5E or P4
The total number of hectares should be reduced to the physical area: where
hectares are covered by two of these schemes/measures to foster carbon
sequestration/conservation, only one hectare should be counted. It is the real
surface where at least one action to foster carbon sequestration/conservation is
taking place which should be counted.
b) Total agricultural land in a base year + total forestry land in a base year
Relevant measures contributing to target (when programmed under this focus
area):
8.1 and 8.2 (Art. 21) Afforestation and creation of woodland and
Establishment of agroforestry systems
10 (Art. 28) Agri-environment-climate
Data required for the
individual operation
see above
Data source/ location of
the data
a) Agricultural and forest land under management contracts to foster carbon
sequestration/conservation: MA/PA operations database (+ IACS)
b) Total agricultural and forest land area: Eurostat
Point of data collection a) Agricultural and forest land under management contracts to foster carbon
sequestration/conservation: measure 10 Agri-environment-climate: area paid
after administrative and on-the-spot checks of the annual claims; sub-
measures 8.1 and 8.2 Afforestation and creation of woodland and
Establishment of agroforestry systems (establishment only): data collected at
application level and reported when completed
b) Total agricultural and forest land area: Eurostat
Frequency a) Agricultural and forest land under management contracts to foster carbon
sequestration/conservation: annual
b) Total agricultural and forest land area: Eurostat
Delay a) Agricultural and forest land under management contracts to foster carbon

26
sequestration/conservation: /
b) Total agricultural and forest land area: Eurostat
Means of transmission
to Commission
Monitoring tables of AIR
Comments/caveats

27
Indicator Name Jobs created in supported projects
Indicator code R21/T20
Target indicator Yes (T20)
The related priority 6
Promoting social inclusion, poverty reduction and economic development in
rural areas
The related focus area 6A
Facilitating diversification, creation and development of small enterprises, as
well as job creation
Definition Total number of jobs created in full time equivalent (FTE) (not maintained)
through supported projects expressed in (FTE).
Unit of measurement Number
Methodology/formula /
Relevant measures contributing to target (when programmed under this focus
area):
4 (Art.17) Investments in physical assets
6 (Art. 19) Farm and business development
8.6 (Art. 21) Investments in forestry technologies and in processing, in
mobilising and in the marketing of forest products
Data required for the
individual operation
Total number of permanent jobs created (not maintained) through supported
projects under measures 4 and 6 and sub-measure 8.6 expressed in FTE, by
gender.
Data source/ location of
the data
Application forms/business plans (expected outcome); validated through
sample of completed projects
Point of data collection Recorded at selection of projects (business plans), reported at the completion
of the project and validated through sample of completed projects, which will
also assess the gender of job holders.
Frequency Annual
Delay /
Means of transmission
to Commission
Monitoring tables of AIR
Comments/caveats Data source should be the business plan not a separate projection in order to
avoid the risk of over estimation.
Only new jobs actually created should be counted, which excludes jobs
maintained (as too problematic to assess). It relates to employment when the
project is up and running, i.e. if the project is creation of a farm shop, it does
not include employment created during the design/construction building phase
– consultant/architect/builders, but the employment which is created when the
shop is running (manager, sales assistants, etc.).
Voluntary work should not be counted but self-employment is included.
Indicator is calculated in FTE; therefore, if an existing halftime job is
transformed into a full time job, the value of the indicator is 0.5 (a half job is
considered created).
To count one job created, the duration of the contract should be one year or
more (e.g. a six month contract at 100% is 0.5).

28
Indicator Name Percentage of rural population covered by local development
strategies
Indicator code R22/T21
Target indicator Yes (T21)
The related priority 6
Promoting social inclusion, poverty reduction and economic development
in rural areas
The related focus area 6B
Fostering local development in rural areas
Definition % of rural population covered by LAGs funded through the RDP under
LEADER
Unit of measurement Number
%
Methodology/formula Ratio a/b in %
a) O.18 Total number of rural population covered by LAGs funded
through the RDP under LEADER over the programming period
b) Total rural population covered in the RDP area
Relevant measures contributing to target:
19 LEADER
Data required for the
individual operation
a) Total rural population covered by LAGs funded under LEADER
b) Total rural population covered by the RDP area
Data source/ location of
the data
a) Total rural population covered: MA/LAG
b) Total rural population covered by the RDP area: national or regional
statistics
Point of data collection a) Total rural population covered: recorded at selection of local
development strategies (LDS) by MA/LAG, after each selection round
b) Total rural population covered by the RDP area: national or regional
statistics
Frequency a) Total rural population covered: annual
b) Total rural population covered by the RDP area: national or regional
statistics
Delay /
Means of transmission
to Commission
Monitoring tables of AIR
Comments/caveats

29
Indicator Name Jobs created in supported projects
Indicator code R24/T23
Target indicator Yes (T23)
The related priority 6
Promoting social inclusion, poverty reduction and economic
development in rural areas
The related focus area 6B
Fostering local development in rural areas
Definition Number of jobs created in FTE through support for implementation of
operations under the LDS funded through the RDP under LEADER
Unit of measurement Number
Methodology/formula /
Relevant measures contributing to target:
19 LEADER
Data required for the
individual operation
Jobs created through support for implementation of operations under
the LDS under LEADER, by gender.
Data source/ location of
the data
Application forms of LEADER projects transferred from LAGs to MA
Point of data collection Recorded at selection of projects (business plans), provided by LAGs to
MAs at the completion of the projects and validated through sample of
completed projects, which will also assess the gender of job holders
Frequency Annual
Delay /
Means of transmission to
Commission
Monitoring tables of AIR
Comments/caveats The target set in the RDP is not broken down by gender but data
collected during the implementation should be broken down by gender.
Only new jobs actually created should be counted, which excludes jobs
maintained. It relates to employment when the project is up and
running, i.e. if the project is creation of a farm shop, it does not include
employment created during the design/construction building phase –
consultant/architect/builders, but the employment which is created
when the shop is running (manager, sales assistants, etc.).
Voluntary work should not be counted but self-employment is included.
Indicator is calculated in FTE; therefore, if an existing halftime job is
transformed into a full time job, the value of the indicator is 0.5 (a half
job is considered created).
To count one job created, the duration of the contract should be one
year or more (e.g. a six month contract at 100% is 0.5).

30
Indicator Name Percentage of rural population benefiting from improved services /
infrastructures
Indicator code R23/T22
Target indicator Yes (T22)
The related priority 6
Promoting social inclusion, poverty reduction and economic
development in rural areas
The related focus area 6B
Fostering local development in rural areas
Definition Population benefiting from improved services/infrastructures
supported under RDP through measure 7 'Basic services and village
renewal in rural areas' (only 7.1, 7.2, 7.4 to 7.8)
Unit of measurement Number
%
Methodology/formula Ratio a/b in %
a) The definition of the benefiting population is the potential users:
size of the population in the area (e.g. municipality, group of
municipalities…) benefiting from the service/infrastructure.
b) Total rural population covered in the RDP area
Double counting of the same population should be avoided. If different
operations are supported in the same area, the population should be
counted only once (difference compared to output O.15 where double
counting is possible).
Relevant measures contributing to target (when programmed under this
focus area):
7 (Art. 20) Basic services and village renewal in rural areas
(only 7.1, 7.2, 7.4 to 7.8 excluding ICT/Broadband)
Data required for the
individual operation
a) Population benefiting from improved services/infrastructures
supported under measure 7.
b) Total rural population covered by the RDP area
Data source/ location of the
data
a) Applications, MA/PA operations database
b) Total rural population covered by the RDP area: national or regional
statistics
Point of data collection a) Application form plus confirmation/amendment on completion of
operation if needed (Local Administrative Units concerned +
population) (reported when the action is completed)
b) Total rural population covered by the RDP area: national or regional
statistics systems
Frequency a) Annual
b) Total rural population covered by the RDP area: national or regional
statistics systems
Delay /
Means of transmission to
Commission
Monitoring tables of AIR
Comments/caveats

31
Indicator Name Percentage of rural population benefiting from new or improved
services / infrastructures (ICT)
Indicator code R25/T24
Target indicator Yes (T24)
The related priority 6
Promoting social inclusion, poverty reduction and economic development in
rural areas
The related focus
area
6C
Enhancing the accessibility, use and quality of information and
communication technologies (ICT) in rural areas
Definition % of rural population benefiting from support for services/infrastructure
(broadband internet infrastructure and other ICT) under sub-measure 7.3
Basic services and village renewal in rural areas (ICT/Broadband)
Relevant measures contributing to target (when programmed under this
focus area):
7.3 (Art. 20) Basic services and village renewal in rural areas
(ICT/Broadband)
Unit of measurement Number
Methodology/formula Ratio a/b in %
a) The definition of the benefiting population is the potential users: size of
the population in the area (e.g. municipality, group of municipalities…)
benefiting from the services/infrastructure.
b) Total rural population covered in the RDP area
Double counting of the same population should be avoided. If different
operations are supported in the same area, the population should be counted
only once (difference compared to output O.15 where double counting is
possible).
Relevant measures contributing to target (when programmed under this
focus area):
7.3 (Art. 20) Basic services and village renewal in rural areas
Data required for the
individual operation
a) Population benefiting from support for services/infrastructure (broadband
internet infrastructure and other ICT) under sub-measure 7.3
b) Total rural population covered by the RDP area
Data source/ location
of the data
a) Applications, MA/PA operations database
b) Total rural population covered by the RDP area: national or regional
statistics
Point of data
collection
a) Application form plus confirmation/amendment on completion of
operation if needed (Local Administrative Units concerned + population)
(reported when the action is completed)
b) Total rural population covered by the RDP area: national or regional
statistics systems
Frequency a) Annual
b) Total rural population covered by the RDP area: national or regional
statistics systems
Delay /
Means of
transmission to
Commission
Monitoring tables of AIR
Comments/caveats