Draft Systematic Review - Effective Health Care Program · () to see draft research questions and...
180
ii Draft Systematic Review Number xx Breastfeeding Programs and Policies, Breastfeeding Uptake, and Maternal Health Outcomes in Developed Countries Prepared for: Agency for Healthcare Research and Quality U.S. Department of Health and Human Services 5600 Fishers Lane Rockville, MD 20857 www.ahrq.gov Contract No. Prepared by: Investigators: AHRQ Publication No. xx-EHCxxx <Month Year> This information is distributed solely for the purposes of predissemination peer review. It has not been formally disseminated by the Agency for Healthcare Research and Quality. The findings are subject to change based on the literature identified in the interim and peer-review/public comments and should not be referenced as definitive. It does not represent and should not be construed to represent an Agency for Healthcare Research and Quality or Department of Health and Human Services (AHRQ) determination or policy.
Transcript of Draft Systematic Review - Effective Health Care Program · () to see draft research questions and...

ii
Draft Systematic Review Number xx
Breastfeeding Programs and Policies, Breastfeeding Uptake, and Maternal Health Outcomes in Developed Countries
Prepared for:
Agency for Healthcare Research and Quality
U.S. Department of Health and Human Services
5600 Fishers Lane
Rockville, MD 20857
www.ahrq.gov
Contract No.
Prepared by:
Investigators:
AHRQ Publication No. xx-EHCxxx
<Month Year>
This information is distributed solely for the purposes of predissemination peer review. It has not
been formally disseminated by the Agency for Healthcare Research and Quality. The findings are
subject to change based on the literature identified in the interim and peer-review/public comments
and should not be referenced as definitive. It does not represent and should not be construed to
represent an Agency for Healthcare Research and Quality or Department of Health and Human
Services (AHRQ) determination or policy.

iii
Key Messages Purpose of Review
To summarize the effectiveness of community, workplace and health care system-based programs and policies
aimed at supporting and promoting breastfeeding, and determine the association between breastfeeding and
maternal health.
Key Messages
Baby-Friendly Hospital Initiative (BFHI) improves rates of breastfeeding initiation and duration.
Healthcare staff education or training related to breastfeeding alone does not improve rates of breastfeeding
initiation.
For women enrolled in Special Supplemental Nutrition Program for Women, Infants and Children (WIC), peer-
support interventions offered by WIC agencies may improve breastfeeding outcomes.
Breastfeeding is associated with reduced maternal risk of breast and ovarian cancer, hypertension, and type 2
diabetes.
Future research should assess the benefits of workplace, school-based, and other community-based
interventions for improving rates of breastfeeding and consider whether certain interventions are more effective
among groups of women who differ by socioeconomic factors.

iv
This report is based on research conducted by the <EPC> Evidence-based Practice Center (EPC)
under contract to the Agency for Healthcare Research and Quality (AHRQ), Rockville, MD
(Contract No. <#>). The findings and conclusions in this document are those of the authors, who
are responsible for its contents; the findings and conclusions do not necessarily represent the
views of AHRQ. Therefore, no statement in this report should be construed as an official
position of AHRQ or of the U.S. Department of Health and Human Services.
The information in this report is intended to help health care decisionmakers—patients and
clinicians, health system leaders, and policymakers, among others—make well informed
decisions and thereby improve the quality of health care services. This report is not intended to
be a substitute for the application of clinical judgment. Anyone who makes decisions concerning
the provision of clinical care should consider this report in the same way as any medical
reference and in conjunction with all other pertinent information, i.e., in the context of available
resources and circumstances presented by individual patients.
AHRQ or U.S. Department of Health and Human Services endorsement of any derivative
products that may be developed from this report, such as clinical practice guidelines, other
quality enhancement tools, or reimbursement or coverage policies may not be stated or implied.
This report may periodically be assessed for the currency of conclusions. If an assessment is
done, the resulting surveillance report describing the methodology and findings will be found on
the Effective Health Care Program Web site at www.effectivehealthcare.ahrq.gov. Search on the
title of the report.
This document is in the public domain and may be used and reprinted without permission except
those copyrighted materials that are clearly noted in the document. Further reproduction of those
copyrighted materials is prohibited without the specific permission of copyright holders.
Persons using assistive technology may not be able to fully access information in this report. For
assistance contact [insert program email address].
None of the investigators have any affiliations or financial involvement that conflicts with the
material presented in this report.
Suggested citation: <Authors>. Systematic Review of Breastfeeding Programs and Policies,
Breastfeeding Uptake, and Maternal Health Outcomes in Developed Countries. <Report Series
Name in Title Caps No.> <#>. (Prepared by the <EPC Name> Evidence-based Practice Center
under Contract No. <##>.) AHRQ Publication No. XX-EHCXXX-EF. Rockville, MD: Agency
for Healthcare Research and Quality. <Month Year>.
www.effectivehealthcare.ahrq.gov/reports/final.cfm.

v
Preface The Agency for Healthcare Research and Quality (AHRQ), through its Evidence-based
Practice Centers (EPCs), sponsors the development of systematic reviews to assist public- and
private-sector organizations in their efforts to improve the quality of health care in the United
States. These reviews provide comprehensive, science-based information on common, costly
medical conditions, and new health care technologies and strategies.
Systematic reviews are the building blocks underlying evidence-based practice; they focus
attention on the strength and limits of evidence from research studies about the effectiveness and
safety of a clinical intervention. In the context of developing recommendations for practice,
systematic reviews can help clarify whether assertions about the value of the intervention are
based on strong evidence from clinical studies. For more information about AHRQ EPC
systematic reviews, see www.effectivehealthcare.ahrq.gov/reference/purpose.cfm
AHRQ expects that these systematic reviews will be helpful to health plans, providers,
purchasers, government programs, and the health care system as a whole. Transparency and
stakeholder input are essential to the Effective Health Care Program. Please visit the Web site
(www.effectivehealthcare.ahrq.gov) to see draft research questions and reports or to join an e-
mail list to learn about new program products and opportunities for input.
We welcome comments on this systematic review. They may be sent by mail to the Task
Order Officer named below at: Agency for Healthcare Research and Quality, 540 Gaither Road,
Rockville, MD 20850, or by email to [email protected].
Gopal Khanna, M.B.A. Arlene Bierman, M.D., M.S.
Director Director
Agency for Healthcare Research and Quality Center for Evidence and Practice Improvement
Agency for Healthcare Research and Quality
Stephanie Chang, M.D., M.P.H. Suchitra Iyer, Ph.D.
Director, EPC Program Task Order Officer
Center for Evidence and Practice Improvement Center for Evidence and Practice Improvement
Agency for Healthcare Research and Quality Agency for Healthcare Research and Quality

vi
Acknowledgments The authors gratefully acknowledge the following individuals for their contributions to this
project and deeply appreciate their considerable support, commitment, and contributions:

vii
Breastfeeding Programs and Policies, Breastfeeding Uptake, and Maternal Health Outcomes in Developed Countries
Structured Abstract Objectives. To summarize the effectiveness of community, workplace and health care system-
based programs and policies aimed at supporting and promoting breastfeeding, and determine the
association between breastfeeding and maternal health.
Data sources. We searched PubMed/MEDLINE, the Cochrane Library, CINAHL from January
1, 1980, to February 8, 2017 for studies relevant to the effectiveness of health care system-based,
workplace, and community breastfeeding programs and policies. For evidence on breastfeeding
and maternal health, we updated the 2007 AHRQ report on this topic and searched the same
databases from November 1, 2005 to February 2, 2017. For studies of breastfeeding programs
and policies, eligible studies included randomized controlled trials (RCTs), nonrandomized
trials, systematic reviews and observational studies with a control group; we excluded primary-
care based programs delivered as part of routine care. For studies related to breastfeeding and
maternal health outcomes, we included systematic reviews, case-control and cohort studies.
Review methods. Pairs of reviewers independently selected, extracted data from, and rated the
risk of bias of relevant studies; they graded the strength of evidence (SOE) using established
criteria. We synthesized all evidence qualitatively.
Results. We included 128 studies (119 individual studies and 9 systematic reviews). Of these, 34
individual studies were relevant to the effectiveness of breastfeeding programs or policies and
the remainder were relevant to one or more maternal health outcomes. Based on evidence from
one large RCT (PROBIT) enrolling mothers (N=17,046) who intended to breastfeed and 5
observational studies (62,834) we graded the SOE for Baby Friendly Hospital Initiative (BFHI)
as moderate for improving rates of breastfeeding duration over 12 months postpartum. Evidence
from 7 observational studies (1,156,033 women) also demonstrates improved rates of
breastfeeding initiation (low SOE); however, results are imprecise and the magnitude of benefit
varies across studies. Low SOE supports the benefit of BFHI combined with home visits
compared with BFHI alone. For non-BFHI healthcare system-based interventions, low SOE (4
studies) supports the conclusion that healthcare education or training related to breastfeeding
(without additional breastfeeding support services) does not improve rates of breastfeeding
initiation. Women, Infants, and Children (WIC, a federal supplemental nutrition program)
interventions that focus on in-person or telephone based peer support are effective in improving
rates of breastfeeding initiation and duration (low SOE). We found limited evidence for other
(community-based) interventions and no studies that focused on workplace or school-based
interventions or harms associated with interventions.
For maternal health outcomes, low SOE supports the conclusion that ever breastfeeding or
breastfeeding for longer durations may be associated with a reduced risk of developing (any)
breast cancer, luminal breast cancer, triple-negative breast cancer, epithelial ovarian cancer,
hypertension and type 2 diabetes. We rated the evidence for association between breastfeeding
and fracture low for no benefit. Due to heterogeneity and inconsistent results, we found

viii
insufficient evidence on whether breastfeeding is associated with postpartum depression,
cardiovascular disease, or postpartum weight change.
Conclusions. The body of evidence for breastfeeding programs and policies was diverse in terms
of interventions and settings. Current evidence supports the effectiveness of BFHI for improving
rates of breastfeeding initiation and duration; however, evidence from one large RCT (PROBIT)
has limited applicability, and observational studies do not clearly establish the magnitude of
benefit. For women enrolled in WIC, low SOE supports peer-support interventions for improving
breastfeeding outcomes. Although low SOE supports the association between breastfeeding and
improved health outcomes (breast cancer, ovarian cancer, hypertension, and type 2 diabetes),
methodological limitations specific to observational study designs does not establish that there is
a causal association between breastfeeding and maternal health.

ix
Contents Executive Summary ............................................................................................................... ES-1
Chapter 1. Introduction ............................................................................................................... 1 Background ................................................................................................................................. 1
Existing Guidelines ..................................................................................................................... 2 Rationale for Evidence Review .................................................................................................. 2 Key Questions ............................................................................................................................. 3
Key Question 1 ....................................................................................................................... 3 Key Question 2 ....................................................................................................................... 3
Analytic Framework ................................................................................................................... 3 Organization of This Report ....................................................................................................... 4
Chapter 2. Methods ...................................................................................................................... 5 Protocol Review .......................................................................................................................... 5 Literature Search Strategy........................................................................................................... 5
Search Strategy ....................................................................................................................... 5 Inclusion and Exclusion Criteria ............................................................................................. 5
Study Selection ....................................................................................................................... 7 Data Extraction ....................................................................................................................... 7
Risk of Bias Assessment of Individual Studies .......................................................................... 7 Risk of Bias Assessment of Systematic Reviews ....................................................................... 8 Data Synthesis ............................................................................................................................. 8
Strength of the Body of Evidence ............................................................................................... 9 Applicability ............................................................................................................................. 10
Peer Review and Public Commentary ...................................................................................... 11
Chapter 3. Results ....................................................................................................................... 12 Results of Literature Search and Screening .............................................................................. 12 Key Question 1a. What are the effectiveness and harms of programs and policies on
initiation, duration, and exclusivity of breastfeeding? .............................................................. 12 Key Points: Baby-Friendly Hospital Initiative ..................................................................... 12 Key Points: Non-BFHI health care system-based interventions ........................................... 13
Key Points: Women, Infant and Children (WIC)-based interventions ................................. 13 Key Points: Community-based interventions ....................................................................... 14 Baby-Friendly Hospital Initiative Interventions ................................................................... 14
Other (Non-BFHI) Health Care System-Based Interventions .............................................. 24 Women, Infants and Children-Based interventions .............................................................. 38 Community-Based Interventions .......................................................................................... 44
Key Question 1b. To what extent do the effectiveness and harms of programs and
policies on initiation, duration, and exclusivity of breastfeeding differ for
subpopulations of women defined by sociodemographic factors (e.g., age, race,
ethnicity, socioeconomic status)? ............................................................................................. 49
Key Question 1c. To what extent do intervention-related characteristics (e.g., type of
breast pump provided—manual or electric; delivery personnel) influence the initiation,
duration, and exclusivity of breastfeeding? .............................................................................. 51 Key Question 2a. What are the comparative benefits and harms for maternal health
outcomes among women who breastfeed for different intensities and durations? ................... 51

x
Key Points ............................................................................................................................. 51
Relationship Between Maternal Breast Cancer and Ovarian Cancer and
Breastfeeding ........................................................................................................................ 52
Cardiovascular Disease and Hypertension............................................................................ 72 Type 2 Diabetes .................................................................................................................... 79 Breastfeeding and Fracture Risk ........................................................................................... 84 Postpartum Depression ......................................................................................................... 89 Relationship Between Return to Prepregnancy Weight or Postpartum Weight
Change and Breastfeeding .................................................................................................. 101
Discussion................................................................................................................................... 113 Key Findings and Strength of Evidence ................................................................................. 113
Baby-Friendly Hospital Initiative Interventions ................................................................. 113 Other (non-BFHI) Health Care System-Based Interventions ............................................. 114
Women, Infants and Children-Based interventions ............................................................ 115
Community-Based Interventions ........................................................................................ 117
Key Question 1c. To what extent do intervention-related characteristics (e.g., type of
breast pump provided—manual or electric; delivery personnel) influence the initiation,
duration, and exclusivity of breastfeeding? ............................................................................ 119 Key Question 2a. What are the comparative benefits and harms for maternal health
outcomes among women who breastfeed for different intensities and durations? ................. 119 Deficiencies in Methods ......................................................................................................... 120 Findings in Relation to What is Already Known .................................................................... 122
Applicability ........................................................................................................................... 123 Limitations of the Review Process ......................................................................................... 123
Limitations of the Evidence Base ........................................................................................... 124 Future Research Needs ........................................................................................................... 125 Conclusions ............................................................................................................................. 125
References .................................................................................................................................. 126
Tables
Table A. BFHI 10 steps to successful breastfeeding1 ............................................................... ES-2 Table B. Summary of key findings and strength of evidence: Studies assessing BFHI ........... ES-6
Table C. Summary of key findings and strength of evidence: Non-BFHI health care
system-based interventions ....................................................................................................... ES-8
Table D. Summary of key findings and strength of evidence: WIC-based interventions ........ ES-9 Table F. Summary of key findings and strength of evidence: KQ1 studies reporting on
subgroups ................................................................................................................................ ES-12 Table G. Summary of key findings and strength of evidence maternal health outcomes ...... ES-13
Table 1. Baby-Friendly Hospital Initiative 10 steps to successful breastfeeding ............................2
Table 2. Eligibility criteria ...............................................................................................................6
Table 3. Definitions of the grades of overall strength of evidence ................................................10 Table 4. Characteristics of included studies assessing BFHI interventions...................................16 Table 5. BFHI studies reporting on breastfeeding initiation..........................................................20 Table 6. BFHI studies reporting on breastfeeding duration and exclusivity .................................22 Table 7. Characteristics of studies evaluating non-BFHI health care system-based
interventions ...................................................................................................................................26

xi
Table 8. Non-BFHI health system interventions reporting on breastfeeding initiation .................33
Table 9. Non-BFHI health system interventions reporting on breastfeeding duration ..................35 Table 10. Characteristics of studies assessing WIC-based interventions ......................................39
Table 11. WIC interventions reporting on breastfeeding initiation and duration ..........................42 Table 12. Characteristics of studies assessing community-based interventions ............................45 Table 13. Results of studies assessing community-based interventions ........................................47 Table 14. BFHI Studies reporting on eligible subgroups ..............................................................50 Table 15. Breastfeeding and breast cancer: Summary of published systematic reviews
and meta-analyses ..........................................................................................................................53 Table 16. Ever breastfeeding and breast cancer .............................................................................57 Table 17. Duration of breastfeeding and breast cancer ..................................................................58 Table 18. Breastfeeding and breast cancer in situ ..........................................................................62 Table 19. Breastfeeding and tumor subtypes of breast cancer defined by hormone receptor
status ..............................................................................................................................................64
Table 20. Breastfeeding and ovarian cancer: Summary of published systematic reviews ............67
Table 21. Breastfeeding and ovarian cancer: Summary of individual studies ...............................68 Table 22. Breastfeeding and CVD or hypertension: Summary of individual studies ....................74
Table 23. Breastfeeding and Type 2 diabetes: Summary of published systematic review ............80 Table 24. Breastfeeding and type 2 diabetes: Summary of individual studies ..............................81
Table 25. Breastfeeding and fractures: Summary of individual studies ........................................85 Table 26. Breastfeeding and postpartum depression: Summary of published systematic
review .............................................................................................................................................90
Table 27. Breastfeeding and postpartum depression: Summary of individual studies ..................92 Table 28. Breastfeeding and postpartum weight change: Summary of individual studies ..........103
Table 29. Summary of key findings and strength of evidence: Studies assessing BFHI .............114 Table 30. Summary of key findings and strength of evidence: Non-BFHI health care
system-based interventions ..........................................................................................................115
Table 31. Summary of key findings and strength of evidence: WIC-based interventions ..........117
Table 32. Summary of key findings and strength of evidence: Community-based
interventions .................................................................................................................................118 Table 33. Summary of key findings and strength of evidence: Maternal health
outcomes ......................................................................................................................................120
Figures
Figure A. Analytic framework for breastfeeding programs and policies, breastfeeding uptake,
and maternal health outcomes in developed countries ..............................................................ES-3
Figure 1. Analytic framework for breastfeeding programs and policies, breastfeeding uptake, and
maternal health outcomes in developed countries ...........................................................................4
Appendixes
Appendix A. Literature Search Strategies and Yields
Appendix B. PRISMA
Appendix C. Risk of Bias Assessment Forms and Ratings
Appendix D. Strength of Evidence Tables
Appendix E. Excluded Studies
Appendix F. Results Appendix

ES-1
Evidence Summary
Background In reproductive physiology, lactation follows pregnancy; evidence supports the association
between breastfeeding and better health outcomes for both infants and mothers.1-3 A 2007
Agency for Healthcare Research and Quality (AHRQ) review by Ip and colleagues concluded
that compared with no breastfeeding or a shorter duration of breastfeeding, breastfeeding was
associated with reduced maternal type 2 diabetes, breast cancer and ovarian cancer.2
Breastfeeding was not associated with risk of fracture. For other outcomes (e.g., postpartum
depression), the authors concluded that the relationship between breastfeeding and maternal
health was unclear. Since 2007, several new studies have reported on maternal outcomes not
addressed in the 2007 AHRQ review, including hypertension, rates of myocardial infarction, and
other cardiovascular outcomes.4-7
Breastfeeding initiation rates are increasing, and 82.5 percent of infants born in 2014 in the
United States were breastfed at birth; however, only 55.3 percent were breastfed at 6 months, and
33.7 at 12 months.8 With the exception of breastfeeding initiation, these rates fall short of
Healthy People 2020 targets for initiating breastfeeding, breastfeeding to 6 months, and
breastfeeding to 12 months are 81.9, 66.6, and 34.1 percent, respectively.9 Women would prefer
to breastfeed longer: in a national survey, 45 percent of U.S. women who initiated breastfeeding
reported early, undesired weaning.10 Moreover, racial and ethnic differences in breastfeeding
initiation and duration rates persist, despite rising rates for all groups of women. From 2000 to
2014, the percentage of women who initiated breastfeeding went up from 47.4 to 68.0 percent for
blacks, 71.8 to 85.7 percent for whites, and 77.6 to 84.8 percent for Hispanics.11, 12
In addition to setting targets for breastfeeding initiation rates and duration of breastfeeding,
other Healthy People 2020 objectives related to breastfeeding include 1) increasing the
proportion of live births that occur in facilities that provide recommended care for lactating
mothers and their babies, and 2) increasing the proportion of employers that have worksite
lactation support programs.9 These community, workplace, and health care system-based
programs and policies may be promising strategies to support initiation and increase duration of
breastfeeding.
Health care system-based interventions may include maternity staff education or the Baby-
Friendly Hospital Initiative (BFHI). The BFHI is a global program sponsored by the World
Health Organization (WHO) and United Nations Children's Fund to encourage and recognize
hospitals and birth centers that create an environment supporting breastfeeding; the “10 Steps to
Successful Breastfeeding for Hospitals” are listed in Table A. Insurance coverage for lactation
support is another strategy that may enable women to achieve their breastfeeding goals. Costs
associated with breastfeeding support (e.g., comprehensive lactation support and counseling,
breastfeeding equipment) are currently covered by health insurance marketplace plans and
private non-grandfathered health plans under the 2010 Patient Protection and Affordable Care
Act.13 It is not clear whether certain lactation benefit packages (e.g., type of breastfeeding
supplies offered, number of visits provided, or qualifications of intervention delivery personnel)
are more or less effective than others in increasing breastfeeding initiation and duration.
Although there is broad appeal and interest in workplace interventions to increase duration
and exclusivity of breastfeeding, the effectiveness and harms is uncertain; A 2012 systematic
review found no controlled trials evaluating the effectiveness of workplace programs.14

ES-2
Table A. BFHI 10 steps to successful breastfeeding1
1. Have a written breastfeeding policy that is routinely communicated to all health care staff.
2. Train all health care staff in skills necessary to implement this policy.
3. Inform all pregnant women about the benefits and management of breastfeeding.
4. Help mothers initiate breastfeeding within 1 hour of birth.
5. Show mothers how to breastfeed, and how to maintain lactation even if they should be separated from their infants.
6. Give infants no food or drink other than breast milk, unless medically indicated.
7. Practice rooming in—allow mothers and infants to remain together 24 hours a day.
8. Encourage breastfeeding on demand.
9. Give no pacifiers or artificial nipples to breastfeeding infants
10. Foster the establishment of breastfeeding support groups and refer mothers to them on discharge from the hospital or birth center.
1 Baby Friendly USA Ten Steps to Successful Breastfeeding15
Existing Guidelines Multiple clinical guidelines and health-related organizations recommend exclusive
breastfeeding up to (or around) 6 months, including the American Academy of Pediatrics,16 the
American Congress of Obstetrics and Gynecology,17 the WHO,18, 19 and others.20, 21 These
organizations recommend continued breastfeeding through the first year of life and beyond; the
WHO recommends continued breastfeeding through the second year of life and beyond.22
Rationale for Evidence Review The purpose of this review is to conduct an evidence report that summarizes the effectiveness
of community, workplace and health care system-based programs and policies aimed at
supporting and promoting breastfeeding. This review will not address the effectiveness of
individual-level primary care interventions to support breastfeeding; this evidence was recently
summarized in a systematic review23 to support the U.S. Preventive Services Task Force in
updating its recommendation on counseling to support breastfeeding.24
In addition, this review will also address the association between breastfeeding and maternal
health. Substantial time has elapsed since the last AHRQ review on this topic in 2007, and the
body of literature focused on the maternal health benefits of breastfeeding has grown.1, 25-27 This
review will conduct a partial update of the 2007 AHRQ review focused on the relationship of
breastfeeding and various maternal health outcomes.
Scope and Key Questions (KQs)
Key Question 1
1a: What is the effectiveness and harms of programs and policies on initiation, duration, and
exclusivity of breastfeeding?
1b: To what extent do the effectiveness and harms of programs and policies on initiation,
duration, and exclusivity of breastfeeding differ for subpopulations of women defined by
sociodemographic factors (e.g., age, race, ethnicity, socioeconomic status)?
1c: To what extent do intervention-related characteristics (e.g., type of breast pump
provided—manual or electric; delivery personnel) influence the initiation, duration, and
exclusivity of breast feeding?

ES-3
Key Question 2
2a: What are the comparative benefits and harms for maternal health outcomes among
women who breastfeed for different intensities and durations?
2b: To what extent do benefits and harms for maternal health outcomes differ for
subpopulations of women defined by age, race, ethnicity, and comorbidity?
Analytic Framework We developed an analytic framework to guide the systematic review process (Figure A). The
analytic framework illustrates the population, interventions, outcomes, and adverse effects that
guided our literature search and synthesis.
Figure A. Analytic framework for breastfeeding programs and policies, breastfeeding uptake, and maternal health outcomes in developed countries
KQ = Key Question.
Methods
Protocol Review The initial KQs were provided by AHRQ and developed in collaboration with partners from
the CDC and National Institutes of Health Office of Women’s Health. The EPC further refined
the KQs. We sought input from a Technical Expert Panel (TEP) into the final research protocol,
which was posted on the AHRQ Web site on March 20, 2017, at
https://effectivehealthcare.ahrq.gov/topics/breastfeeding/research-protocol/; our PROSPERO
registration number is CRD42017079125.
Adverse Effects
of Intervention
Guilt about not
breastfeeding;
workplace
discrimination
Maternal Health
Outcomes
Postpartum
depression;
postpartum weight
change; breast
cancer; ovarian
cancer; osteoporosis;
type 2 diabetes;
hypertension;
cardiovascular
outcomes (e.g.,
stroke, myocardial
infarction)
Breastfeeding
initiation,
duration and
exclusivity
KQ
1a-c
Community, workplace,
and health care system-
based interventions to
promote and support
breastfeedingChildbearing
Women
KQ
2a-b
KQ
1a-c

ES-4
Literature Search Strategy
Search Strategy For KQ 1, we searched PubMed/MEDLINE, the Cochrane Library, CINAHL from January
1, 1980, to February 8, 2017, to ensure that evidence is applicable to current breastfeeding
policies and practices. For KQ 2, we searched PubMed/MEDLINE, the Cochrane Library,
CINAHL from November 1, 2005 (6 months prior to the search date of the 2007 AHRQ review
searches) to February 2, 2017. A full description of the search strategy is provided in the
methods section of the full report.
Inclusion and Exclusion Criteria Interventions of interest for KQ 1 included any community, workplace, or health care
system-based interventions aimed at promoting and supporting breastfeeding. Included studies
for KQ 1 had to have a concurrent control group or (for single-group pre-post studies) include
multiple pre- and post- measures of breastfeeding rates.
Eligibility criteria for KQ 2 is based on criteria used in the 2007 AHRQ review by Ip and
colleagues for maternal health outcomes (postpartum depression, postpartum weight change,
breast cancer, ovarian cancer, osteoporotic fracture, and type 2 diabetes). For this update, we also
included hypertension and cardiovascular disease. Eligible studies compared groups of women
exposed to breastfeeding with those who did not breastfeed (or breastfed for shorter duration
and/or less intensity).
Risk of Bias Assessment of Individual Studies We adapted existing tools (ROBINS-I28 for observational studies, and the Cochrane tool29 for
trials) and used predefined criteria based on the AHRQ Methods Guide for Comparative
Effectiveness Reviews. Criterion details are included in the full report, including Appendix C.30
Risk of Bias Assessment of Systematic Reviews We assessed the relevance of systematic reviews published within the past 5 years using
predefined criteria. For reviews determined to be relevant, we rated the risk of bias as low,
unclear, or high risk of bias using the ROBIS tool.31 Appendix C of the full report lists the
specific questions used for evaluating the risk of bias of all relevant reviews.
Data Synthesis For those KQ 2 outcomes for which we included a recent published systematic review rated
low or unclear risk of bias, we first described the results of the review and then summarized data
from primary studies published after the latest search date of those reviews. We included
systematic reviews for some outcomes (breast cancer, ovarian cancer and type 2 diabetes) that
conducted meta-analyses. If individual studies identified in our database searches were generally
consistent with the pooled results reported by existing systematic reviews, we did not conduct
new meta-analyses.

ES-5
Strength of the Body of Evidence We graded the SOE based on guidance established for the Evidence-based Practice Center
Program.32 This approach incorporates five key domains: study limitations (aggregate risk of
bias), consistency, directness, precision, and reporting bias.
Applicability We assessed applicability following guidance from the Methods Guide for Effectiveness and
Comparative Effectiveness Reviews.33 For individual studies, we examined conditions that may
limit applicability of evidence such as: race or ethnicity of enrolled populations, setting of
enrolled populations, geographic setting, time period of enrollment, and availability of health
insurance and other health-related employment benefits.
Peer Review and Public Commentary This report will be posted for public comment and peer reviewed. We will address all
comments in the final report, making revisions as needed; a disposition of comments report will
be publicly posted 3 months after release of the final report.
Results of Literature Searches Searches of all sources identified a total of 10,211 potentially relevant citations. We included
119 unique individual studies described in 124 publications, and 9 systematic reviews. Of these
128 studies, 22 were studies from a prior 2007 AHRQ review addressing the maternal health
benefits of breastfeeding.2 The remaining 30 studies from the 2007 review were included in one
of our 9 new systematic reviews or superseded by a new included study. Of the 128 included
studies, 34 (from 37 publications) were relevant to KQ 1, and 85 individual studies (from 87
publications) and 9 systematic reviews were relevant to one or more maternal health outcomes.
Appendix B in the full report provides a complete list of articles excluded at the full-text
screening stage, with reasons for exclusion.
KQ 1a. What are the effectiveness and harms of programs and policies on initiation, duration, and exclusivity of breastfeeding?
The 34 studies that met our inclusion criteria evaluated a range of strategies to improve rates
of breastfeeding initiation and duration. No included studies assessed potential harms of
interventions. To aid in synthesizing results of similar studies, we categorized interventions
primarily based on intervention type: BFHI, non-BFHI healthcare system-based interventions,
Special Supplemental Nutrition Program for Women, Infants and Children (WIC)-based
interventions, and community-based interventions (not primarily delivered as part of the
healthcare system). In addition to categorizing interventions by intervention type, we also
summarized results for breastfeeding initiation and duration separately when we had similar
studies reporting on multiple breastfeeding outcome types. Below, we provide a summary of our
main conclusions related to the effectiveness of programs and policies for improving rates of
breastfeeding initiation and duration organized by intervention type.

ES-6
BFHI Interventions Eleven included studies (described in 12 publications) assessed the effectiveness of BFHI
interventions.34-45 Studies were conducted in diverse country settings including the United States
(2 studies)36, 37 and one each in the Republic of Belarus,34 Hong Kong,38 Czech Republic,39
Russia,46 Brazil,41 Croatia,42 Taiwan,43 United Kingdom (multiple regions),44 and Scotland.47
Table B below presents key findings and strength of evidence related to the benefit of BFHI
interventions. Overall, the evidence supports the effectiveness of BFHI for improving rates of
breastfeeding initiation and duration.
For breastfeeding initiation, evidence from seven cohort studies (1,156,033 participants)
comparing women giving birth in BFHI certified (or accredited) hospitals with non-certified
hospitals supports the effectiveness of BFHI (low strength of evidence). Although the included
studies consistently found higher rates of initiation at accredited hospitals, results were imprecise
and the magnitude of benefit varied by breastfeeding measure and country setting (Table B).
Table B. Summary of key findings and strength of evidence: Studies assessing BFHI
Breastfeeding Outcome Intervention vs. Comparator
N Studies; N Subjects Study Limitations
Outcome and Results Strength of Evidence
Initiation BFHI certified/ accredited vs. no BFHI status
7 cohorts; 1,156,033 Medium
Any BF initiation (k=4): higher initiation rates (by 0.5% to 7.4%) among BFHI accredited hospitals than control hospitals, differences were not statistically significant Exclusive BF initiation (k=3): significantly higher rates of initiation among BFHI accredited hospitals than control hospitals (by approximately 7.2% to 56%)
Low for benefit (consistent, imprecise)
Duration BFHI vs. no BFHI intervention (evidence from RCTs) BFHI certified/ accredited vs. no BFHI status (evidence from observational studies)
1 RCT; 17,046 5 cohorts; 62,834 Medium
One RCT found significantly higher rates of exclusive BF among women at BFHI hospitals at 3 mos (43% vs. 6%; p<0.001) and 6 mos postpartum (7.9% vs. 0.6%; p=0.01), and lower odds of weaning (from any BF) at 3, 6, 9, and 12 mo postpartum than women in control hospitals. Any BF duration (k=5 obs studies): higher rates of BF 1 to 12 mos postpartum among women at BFHI hospitals (by 6% to 15% in 4 studies) than women at control hospitals; one study found slightly higher BF rates at 1 mo among women in control hospitals (by 0.4% to 5%) than BFHI hospitals Exclusive BF duration (k=3 obs studies): higher rates of exclusive BF over 1 to 2 mos among infants born in BFHI hospitals than control hospitals (by 4% to 25%)
Moderate for benefit (consistent, imprecise)
Duration Six or more BFHI steps vs. less than six steps
1 cohort; 1,417 Medium
Significantly higher odds of weaning at or before 8 wks postpartum among women giving birth in hospitals practicing ≤ 4 BFHI steps than women giving birth in hospitals practicing six BFHI steps (ORs ranged from 2.08 and 3.13); no difference between women exposed to 5 vs. 6 steps
Low for benefit (consistent,a precise)

ES-7
Table B. Summary of key findings and strength of evidence: Studies assessing BFHI (continued)
Breastfeeding Outcome Intervention vs. Comparator
N Studies; N Subjects Study Limitations
Outcome and Results Strength of Evidence
Duration BFHI staff training +10 HVs vs. BFHI alone
1 RCT; 350 Low
Significantly higher rates of any BF at 6 mos. among women giving birth in BFHI hospitals combined with planned HVs than women giving birth in control hospitals (78% vs. 62%; p=0.001) and higher rates of exclusive BF at 5 mos. (45% vs. 13%; p<0.001)
Low for benefit (unknown consistency, precise)
a Although only one study compared groups of women based on number of BFHI practiced by hospitals, we considered evidence
on duration from studies comparing BFHI implementation (or accreditation) with non-accredited hospitals. As shown in the table,
we concluded that moderate SOE supports the effectiveness of BFHI for improving breastfeeding duration.
BF = breastfeeding; BFHI = Baby Friendly Hospital Initiative; CI = confidence interval; HV = home visits; k = number of
studies; mo(s) = months; N = number; OR = odds ratio; RCT = randomized controlled trial; SOE = strength of evidence; UK =
United Kingdom; US = United States.
Based on evidence from one large RCT (PROBIT, N=17,046) and five cohort studies
(62,834 women), we concluded that BFHI increases rates of breastfeeding duration through 12
months postpartum (moderate strength of evidence). In the PROBIT trial, women in the
intervention group had significantly higher rates of exclusive breastfeeding and lower rates of
weaning across various time points (1 to 12 months postpartum). Although the five observational
studies were mostly consistent in finding benefit for BFHI, results were imprecise and the
magnitude of benefit varied by breastfeeding measure and country setting. One cohort study
(N=1,417) compared rates of breastfeeding at 6 months among women discharged from hospitals
that differed in the number of BFHI implemented; low strength of evidence supports the
conclusion that implementation of 4 or more BFHI steps is associated with lower rates of
weaning than implementation of less than 4 steps.
In addition, combining BFHI staff training with planned home visits increases exclusive
breastfeeding at 6 months postpartum more than BFHI staff training alone (low strength of
evidence).
Other (Non-BFHI) Health Care System-Based Interventions Twelve included studies (described in 13 publications) assessed the effectiveness of other
health care system-based interventions (non-BFHI interventions).48-60 Studies were conducted in
diverse country settings including the United States (2 studies),52, 59 Canada (1 study),57 Sri
Lanka (1 study),54 Brazil (1 study),58 China (1 study),51 and various European countries (6
studies).49, 50, 53, 55, 56, 60 Studies assessed a variety of intervention types; the majority focused on
healthcare provider education or training related to breastfeeding, with or without additional
services offered (e.g., breastfeeding groups, home visits). Table C below presents key findings
and strength of evidence conclusions. Overall, the evidence supports the effectiveness of two
intervention types for improving the duration of exclusive breastfeeding: modified-BFHI policy
implementation in outpatient setting and continuous nursing care during the perinatal period (low
SOE for both). In addition, the evidence suggest that healthcare provider education and training
alone are not effective in improving rates of breastfeeding initiation (low SOE).
Five studies assessed the benefit of healthcare provider breastfeeding education or training
alone. Low strength of evidence supports the conclusion that healthcare staff training alone does
not improve rates of breastfeeding initiation; across 4 studies, there was no significant difference
between intervention and control groups. We rated the strength of evidence as insufficient for

ES-8
whether healthcare provider education or training improves rates of breastfeeding duration (due
to study limitations, inconsistent and imprecise findings).
Three studies assessing the benefit of an intervention combining healthcare staff education
with specific policies or programs to support or promote breastfeeding (e.g., expanding access to
healthcare-based group visits, home visits or Web-based parent support) found mixed results for
both breastfeeding initiation and duration outcomes. Due to methodological limitations,
imprecise and inconsistent findings, we rated the strength of evidence as insufficient.
One study assessed the benefit of implementing an adapted BFHI intervention into outpatient
maternal and child health centers (e.g., developing a breastfeeding policy, staff training, outcome
assessment and quality improvement initiatives). Low strength of evidence supports the
effectiveness of BFHI policies in the outpatient setting for improving rates of exclusive
breastfeeding duration over 6 months postpartum.
One RCT (set in China) randomized women to a continuous nursing care intervention (the
same nurse provides routine perinatal care to the mother and infant) or usual nursing care. We
rated the strength of evidence as low for the effectiveness of continuous nursing care in
improving rates of exclusive breastfeeding over 6 weeks postpartum.
Table C. Summary of key findings and strength of evidence: Non-BFHI health care system-based interventions
Breastfeeding Outcome Intervention vs. Comparator
N Studies; N Subjects Study Limitations
Outcome and Results Strength of Evidence
Initiation Education/ staff training related to BF vs. usual practice
4 (2 RCTS, 2 NRCTS); 1,532a Medium
No significant difference between intervention and control groups in rates of any or exclusive BF initiation (3 studies assessed a maternity staff or nursing education/training intervention, and one assessed a residency BF curriculum)
Low for no benefit (consistent, imprecise)
Initiation Education and staff training plus additional individual services vs. usual care
3 (2 RCTS, 1 NRCT); 20,979 Medium
Inconsistent findings across four studies: two RCTs assessed interventions combining staff training with additional BF support (expanding access to BF groups, and provision of additional HVs) found no benefit. One NRCT assessing staff training combined with access to long-term BF counseling and parent support (via Web pages) found higher rates of exclusive BF initiation among the intervention group than controls (75 vs. 66%; p=0.0099)
Insufficient (inconsistent, imprecise)
Duration Education and staff training related to BF only vs. usual practice
3 (2 RCTS, 1 NRCT); 1,526a Medium
Inconsistent findings across three studies for rates of any and exclusive BF duration; studies found similar durations across groups, or slightly higher BF rates among the intervention group than controls
Insufficient (inconsistent, imprecise)
Duration Education and staff training plus additional individual services vs. usual care
3 RCTS, 20, 903 Medium
Inconsistent findings across 3 RCTs: two found no difference between groups in rates of any or exclusive BF over 6 wks to 9 mons, and one found a lower cessation rate of any BF in the intervention group than controls (HR, 0.86; 95% CI, 0.75 to 0.99)
Insufficient (inconsistent, imprecise)

ES-9
Table C. Summary of key findings and strength of evidence: Non-BFHI health care system-based interventions (continued)
Breastfeeding Outcome Intervention vs. Comparator
N Studies; N Subjects Study Limitations
Outcome and Results Strength of Evidence
Duration Adaptation of the BFHI for integration into routine primary care (maternal and child health centers) vs. usual care
1 NRCT; 3,948 Medium
Significantly higher rates of exclusive BF in the intervention group than controls at 5 mos (OR, 1.39; 95% CI, 1.09 to 1.77) and at 6 mos (OR, 1.33; 95% CI, 1.03 to 1.72); no difference between groups in rates of any BF at 5 or 12 mos.
Low for benefit (unknown consistency, precise)
Initiation/ Duration Continuous primary nursing care (same nurse through perinatal period for mother/infant) vs. usual care (task oriented nursing)
1 RCT; 470 Medium
Significantly higher rates of exclusive BF during hospitalization (99% vs. 88%; p=0.001) and higher rates of exclusive BF 6 wks (72% vs. 94%; p=0.001) among women in the intervention group than controls
Low for benefit (unknown consistency, precise)
a Number here includes participants enrolled from three studies; one study focused on 13 residency programs did not report the
number of women included in analyses of breastfeeding outcomes.52
BF = breastfeeding; CI = confidence interval; HV = home visits; mo(s) = months; N = number; NRCT = non-randomized
controlled trial; RCT = randomized controlled trial; SOE = strength of evidence; UK = United Kingdom; US = United States.
Women, Infants and Children-Based interventions Six included studies assessed changes in breastfeeding rates associated with a WIC program
or policy.61-66 Although all studies were set in the United States, they included women from
diverse states. Included studies assessed heterogeneous interventions and policies; key findings
and SOE assessments are shown in Table D. Overall, low strength of evidence supports the
effectiveness of WIC-based peer support programs for improving rates of any breastfeeding
initiation and duration from 6 weeks to 6 months postpartum. We found insufficient evidence
(primarily due to unknown consistency and imprecision) to make a conclusion on the benefit of
other WIC programs or policies for improving breastfeeding outcomes, including policy changes
related to WIC food packages, provision of different types of breast pumps (electric versus
manual), and peer support programs targeted at fathers.
Table D. Summary of key findings and strength of evidence: WIC-based interventions
Breastfeeding Outcome Intervention vs. Comparator
N Studies; N Subjects Study Limitations
Outcome and Results Strength of Evidence
Initiation/ Duration Mother peer support vs. control
3 (1 RCT, 1 NRCT, 1 cohort); 2,480 Medium
All three studies found benefit in favor of peer support; two studies of in-person peer support found significantly higher BF initiation rates and BF duration over 3 to 6 mos among the intervention group than controls, and one study of telephone-based peer support found no difference between groups in BF initiation rates but significantly higher rates of any BF at 3 and 6 mos among the intervention group than controls
Low for benefit (consistent, precise)

ES-10
Table D. Summary of key findings and strength of evidence: WIC-based interventions (continued)
Breastfeeding Outcome Intervention vs. Comparator
N Studies; N Subjects Study Limitations
Outcome and Results Strength of Evidence
Initiation/ Duration BF rates post 2007 policy revising the WIC food package vs. pre-policy implementation
1 (3 pop. cohorts); PRAMS (127,477) NIS (73,991) PedNSS (744 infants): 744 High
No association between the policy change and rates of BF;a rates of BF increased overall with no difference between women receiving WIC benefits and similar groups of women not receiving WIC benefits
Insufficient (unknown consistency, imprecise)
Duration Provision of electric breast pump vs. manual pump
1 RCT; 280 Medium
For Hawaiian mothers on WIC who planned to return to work/school, no difference in BF duration among women assigned to an electric vs. manual breast pump: median duration of BF 12 vs. 11 mos, respectively; HR,1.13; 95% CI, 0.79 to 1.50
Insufficient (unknown consistency, imprecise)
Initiation/ Duration Peer support program for fathers (in addition to mother peer support) vs. peer support for mothers alone
1 NRCT; 200 Medium
Mothers in the intervention group had slightly higher rate of any BF at 6 mos than controls (63% vs. 55%) that was not statistically significant (p=0.20)
Insufficient (unknown consistency, imprecise)
a All three databases measured rates of “ever-breastfeeding”; in addition, PRAMS measured rates of breastfeeding for at least 4
weeks, NIS measured rates of breastfeeding for at least 3 months and PedNSS measured rates of breastfeeding for at least 1
month. Conclusions were consistent across the different measures.
BF = breastfeeding; CI = confidence interval; HV = home visits; mo(s) = months; N = number; NRCT = non-randomized
controlled trial; PRAMS = Pregnancy Risk Assessment Monitoring System; SOE = strength of evidence; UK = United Kingdom; US =
United States; WIC = Special Supplemental Nutrition Program for Women, Infants, and Children.
Community-Based Interventions Four included studies (described in five publications) assessed the effectiveness of a
community-based intervention; key findings and SOE assessments are shown in Table E. Studies
were conducted in diverse country settings including one each in Italy,67 Australia,68 Mexico,69
and Canada.70 Two were cluster RCTs,68, 69 one was an NRCT,67 and one was a prospective
cohort study.70 No studies assessed the same intervention type, which limited our ability to make
conclusions on the strength of evidence for most intervention types. Low strength of evidence
supports the benefit of community-based interventions that provide mothers with peer-support
(via home visits). In addition, access to a community-based breastfeeding drop-in center among
women receiving early home-based breastfeeding support does not increase breastfeeding
duration (low strength of evidence).

ES-11
Table E. Summary of key findings and strength of evidence: Community-based interventions
Breastfeeding Outcome Intervention vs. Comparator
N Studies; N Subjects Study Limitations
Outcome and Results Strength of Evidence
Initiation/Duration Community-based policy aimed at promoting BF in nonhospital-based health and community centers vs. no intervention
1 NRCT; 5,094 Medium
No significant difference in rates of exclusive BF at discharge, 3 and 6 mos, or rates of any BF at 5 and 12 mos between groups
Insufficient (unknown consistency, imprecise)
Duration Early home-based BF support vs. early home-based BF support plus access to community-based BF drop-in centers vs. usual care
1 RCT; 9,675 Low
No difference between groups in rates of any BF at 3, 4 or 5 mos.
Low for no benefit (unknown consistency, precise)
Duration Community based peer support vs. usual care
1 RCT; 130 Low
Significantly higher rates of exclusive BF at 3 mos. among intervention groups (50% to 67%) than control group (12%), p<0.001; rates of any BF were significantly longer in intervention groups (combined) than in the control group at 3 mos (but not 6 mos)
Low for benefit (unknown consistency, precise)
Duration Peer-led BF support class vs. Nurse-led BF support class
1 cohort; 109 High
No significant difference between groups in rates of any BF at 1 and 6 mos postpartum
Insufficient (unknown consistency, imprecise)
BF = breastfeeding; CI = confidence interval; mo(s) = months; N = number; NRCT = nonrandomized controlled trial; ROB = risk
of bias; RCT = randomized controlled trial; SOE = strength of evidence; SR = systematic review.
Key Question 1b. To what extent do the effectiveness and harms of programs and policies on initiation, duration, and exclusivity of breastfeeding differ for subpopulations of women defined by sociodemographic factors (e.g., age, race, ethnicity, socioeconomic status)?
Few studies reported on subgroups of women; we found no studies reporting on subgroups
defined by age (at breastfeeding exposure), comorbidity and other factors. Of the three included
studies reporting on subgroups of women, two focused on BFHI and reported on differences by
education status,36, 37 and one focused on a WIC peer support intervention and reported on
subgroups by language spoken (Spanish only versus English).64 Table F shows our key findings
and strength of evidence related to subgroups of women. Low strength of evidence supports the
conclusion that BFHI effectiveness may vary among women who differ by education status; two
U.S. cohort studies found higher rates of breastfeeding initiation among women with less
education (12 years or less) who gave birth in BFHI certified facilities compared with non-
certified facilities; no significant difference was observed for women with more education (13
years or more). We found insufficient evidence to make a conclusion on whether benefit of
telephone peer support varies by subgroups of women based on language spoken (Spanish only
versus English), primarily due to inconsistency (across outcome timings and measures) and
imprecision. One RCT64 of telephone peer counseling found increased rates of breastfeeding at 3
months among both English-speaking and Spanish-only speaking women in the intervention

ES-12
group than controls; at 6 months, rates of any breastfeeding were significantly higher among
Spanish-speaking women only. There was no significant difference in rates of exclusive
breastfeeding in the overall sample or by language at 3 or 6 months postpartum.
Table F. Summary of key findings and strength of evidence: KQ1 studies reporting on subgroups
Breastfeeding Outcome Intervention vs. Comparator
N Studies; N Subjects Study Limitations
Outcome and Results Strength of Evidence
Initiation (subgroups: education status) BFHI certified/ accredited vs. no BFHI status
2 cohorts; 27,341 Medium
Both studies found higher rates of BF initiation among women with lower education (≤12 yrs) at BFHI hospitals compared with control hospitals, but no difference in rates among women with higher education (≥13 yrs)
Low (consistent, imprecise)
Duration (subgroups: education status) BFHI certified/ accredited vs. no BFHI status
2 cohort; 27,341 Medium
Two studies found mixed results: one found significantly higher rates of exclusive BF for ≥4 wks among women with lower education (≤12 yrs) at BFHI hospitals than control hospitals (p=0.02), but no difference for women with higher education (no difference was seen for rates of any BF for ≥4 wks by education), and the other study found no difference in rates of exclusive or any BF for ≥4 wks among women who differed by education status
Insufficient (inconsistent, imprecise)
Initiation/ Duration (subgroups: language spoken) Mother peer support vs. control
1 RCT; 1948 Medium
One RCT of telephone peer support found mixed results for subgroups of women defined by language (English-speaking vs. Spanish-speaking only), results for any BF at 3 mos were significant for both groups; at 6 mo, benefit for any BF was significant only for the Spanish-speaking subgroup. There was no significant difference in rates of exclusive BF in either subgroup at 3 or 6 mo.
Insufficient (unknown consistency, imprecise)
BF = breastfeeding; BFHI = Baby Friendly Hospital Initiative; CI = confidence interval; mo(s) = months; N = number; SOE =
strength of evidence; US = United States; yrs = years.
KQ 1c. To what extent do intervention-related characteristics (e.g., type of breast pump provided—manual or electric; delivery personnel) influence the initiation, duration, and exclusivity of breastfeeding?
We found no evidence to address this KQ.
KQ 2a. What are the comparative benefits and harms for maternal health outcomes among women who breastfeed for different intensities and durations?
Table G below summarizes our key findings related to KQ 2 by outcome. Low strength of
evidence supports the conclusion that ever breastfeeding, as well as longer durations of
breastfeeding, may be associated with a reduced risk of developing (any) breast cancer, luminal
breast cancer, or triple-negative breast cancer. Despite a large body of observational evidence,
study and participant characteristics and methodological limitations did not explain the
significant heterogeneity of results. We rated the evidence as insufficient (primarily due to
unknown consistency) for the association between breastfeeding and subtypes of breast cancer
defined by tumor behavior (i.e., in situ breast cancer) or hormone receptor status, breast cancer
among BRCA1/2 mutation carriers, and mortality due to breast cancer.

ES-13
Low strength of evidence supports the association between ever breastfeeding, as well as
longer versus shorter durations of breastfeeding, and a reduced risk of developing epithelial
ovarian cancer. The body of evidence is relatively large and includes one systematic review of 41
studies and eight additional studies (39,618 women); however, we rated strength of evidence as
low because the results included significant heterogeneity not explained by study and participant
characteristics and methodological limitations.
For both hypertension and type 2 diabetes, studies varied in terms of outcomes and case
definition; however, evidence was consistent in finding an association between longer duration
of breastfeeding and lower rates of hypertension and type 2 diabetes (low SOE for both
outcomes).
Ten studies (6 case-control and 4 cohort studies) reported on the association between
breastfeeding using different measures (e.g., ever versus never, and duration per child) and hip,
vertebral and forearm fracture risk. Apart from one study of self-reported vertebral fractures
(rated high risk of bias), no study reported a statistically significant association between
breastfeeding and fracture. We rated the strength of evidence as low for no association.
Due to significant heterogeneity in study design, breastfeeding exposure definitions,
outcomes, and inconsistency in results, we found insufficient evidence on whether breastfeeding
is associated with postpartum depression or postpartum weight change. For postpartum
depression, current evidence does not establish the direction of relationship between
breastfeeding and higher or lower rates of postpartum depression.
Table G. Summary of key findings and strength of evidence maternal health outcomes
Intervention type N Studies; N Subjects Study Limitations
Outcome and Resultsa Strength of Evidence
Breast cancer 1 SR of 98 studies; NRb 17 individual cohort/case-control studies; 125,363 women Medium
Although studies consistently find a protective association between ever BF or longer duration of BF and breast cancer, magnitude varies across studies by BF definition and outcome measure
Low (inconsistent, precise)
Breast Cancer: BRCA1/2 Carriers
1 case-control; 5,708 women Medium
Unclear association between BF and breast cancer among BRCA carriers; one study found an association between longer BF duration and lower rates of breast cancer among BRCA1 mutation carriers (p for trend<0.0001), but not BRCA2
mutation carriers (p for trend=0.68)
Insufficient (unknown consistency, imprecise)
Breast cancer: In situ
3 (1 cohort, 2 case-control); 67,234 women Medium
Unclear association between BF and breast cancer in situ. Three studies found inconsistent results: one case-control study found no association between BF and DCIS and one found no association between BF duration and composite DCIS or invasive ductal carcinoma diagnosis; one cohort study found no association between BF duration and incident DCIS
Insufficient (inconsistent, imprecise)

ES-14
Table G. Summary of key findings and strength of evidence maternal health outcomes (continued)
Intervention type N Studies; N Subjects Study Limitations
Outcome and Results Strength of Evidence
Breast cancer: Hormone receptor subtypes
1 SR of 11 studies; 169,879 women for luminal, 14,266 women for HER2, and 176,430 women for triple-negative analyses 4 individual studies; 454,149 women Medium
Consistent association between ever BF or longer duration of BF and lower rates of luminal and triple negative breast cancer (although magnitude of association varies); for HER2, pooled estimates show unclear association between BF and lower rates of breast cancer (results are imprecise and pooled estimate is not statistically significant)
Low (Luminal, triple-negative; inconsistent, precise); Insufficient (HER2, inconsistent, imprecise)
Breast Cancer: Mortality
1 cohort study; 250,470 parous women Medium
One study found no significant association between BF and breast cancer mortality (HR,1.01;95% CI, 0.79 to 1.29)
Insufficient (unknown consistency, imprecise)
Ovarian cancer 1 SR of 41 studies; NRf 8 individual studies; 39,618 women Medium
Consistent association between ever BF and longer durations of BF and lower risk of ovarian cancer; magnitude of association varies across studies by BF exposure definition
Low (inconsistent, precise)
Hypertension 4 cohorts; 437,265 women High to Medium
Longer duration of BF (>6-12 mos) is associated with significantly lower rates HTN; magnitude of association varies by BF exposure and HTN outcome definition
Low (mostly consistent, imprecise)
CVD 3 cohorts; 301,989 women Medium
Although 3 studies conclude an association between longer BF duration and lower CVD risk, magnitude of association varies and each study reports on a different composite CVD outcome
Insufficient (unknown consistency, imprecise)
Death from CVD 1 cohort; 15,000 women Medium
One study found mixed results: parous women ≤65 yrs at enrollment who had never lactated had higher CVD mortality over 14 yrs of followup than women who lactated ≥24 mos (HR 2.77; 95% CI, 1.28 to 5.99). No clear associations were observed among women ≤65 yrs at enrollment
Insufficient (unknown consistency, imprecise)
Type 2 diabetes 1 SR of 8 studies; 273, 961 women 3 individual (cohort) studies; 140, 929 women Medium to high
Consistent association between ever BF and longer durations of BF and lower risk of type 2 diabetes (among women with and without gestational diabetes); magnitude of association varies by BF duration and study design
Low (consistent, imprecise)
Postpartum Depression
1 SR; 48 studies of 71,245 women 12 individual study; 11,056 women Medium
Magnitude of association and direction of effect unclear; studies are heterogeneous in design and results inconsistent
Insufficient (unknown consistency, imprecise)
Postpartum Weight change
17 cohort; 45,563 women Medium
Magnitude of postpartum weight change varies by BF exposure and outcome measure
Insufficient (inconsistent, imprecise)

ES-15
Table G. Summary of key findings and strength of evidence maternal health outcomes (continued)
Intervention type N Studies; N Subjects Study Limitations
Outcome and Results Strength of Evidence
Fractures 10 (6 case-control and 4 cohorts); 8,746 women Medium to high
Magnitude varies by exposure and outcome measure, but only 1 high risk of bias study reported statistically significant differences
Low for no association (consistent, imprecise)
a We marked outcomes as indirect for long-term maternal health outcomes primarily due to uncertainty of the relative
contribution of breastfeeding to risk (given that many other potential factors also contribute to outcomes such as hypertension,
fracture and breast cancer); for short-term maternal health outcomes (e.g., postpartum depression) there is uncertainty in the
direction of effect between breastfeeding and health outcomes. b Per authors, there were 52 studies with >1,500 women, 31 studies with 500-1,499 women, and 15 studies with <500 women.
Exact number of participants is unclear.
BF = breastfeeding; CI = confidence interval; CVD = cardiovascular disease; mo(s) = months: HR = hazard ratio; OR = odds
ratio; ROB = risk of bias; SOE = strength of evidence; SR = systematic review; yrs = years.
Discussion and Findings in Context For KQ 1, we did not find a previous systematic review of health-care system and
community-based interventions for improving breastfeeding initiation and duration. One recent
narrative review71 focused on BFHI came to similar conclusions as ours, despite differences in
scope and methods (i.e., inclusion of a broader range of observational study designs). The
authors conclude that adherence to the BFHI Ten Steps has a positive influence on breastfeeding
outcomes. One Cochrane review from 2012 found no RCTs or controlled trials investigating the
effect of workplace interventions for promoting breastfeeding in employed women.71
Similarly, for KQ 2, the results of our current review are, in general, consistent with those in
previous reviews with respect to conclusions about the limitations of the evidence base. For
certain outcomes (e.g., breast cancer, ovarian cancer and type 2 diabetes), we included published
systematic reviews in our evidence synthesis. However, we did not rely on the authors
conclusions and rated the strength of evidence separately using pre-defined criteria. Similar to
the previous (2007) AHRQ review by Ip and colleagues on this topic, we concluded that
breastfeeding is associated with reduced risk of breast cancer, ovarian cancer, and type 2 diabetes
(low SOE), and that there is no association between breastfeeding and risk of fracture (low
SOE). As was the case in 2007, we are not able to make a conclusion about the association
between breastfeeding and postpartum weight change or postpartum depression (due to study
limitations, imprecise and inconsistent results). For this review, we added two additional
maternal health outcomes: hypertension and cardiovascular disease. We concluded that low
strength of evidence supports the association between breastfeeding and hypertension; however,
due primarily to heterogeneity in outcome measures and study limitations, we concluded that
evidence was insufficient to reach a conclusion about cardiovascular disease.
For KQ 1, several factors may limit the applicability of findings. Although most studies
enrolled women of a similar age (20s to 30s), many had other specific inclusion criteria related to
parity or health status (of the mother, infant, or both) and a few enrolled only women who
intended to breastfeed or were undecided.34, 64 In general, the findings are applicable to healthy
women who have access to routine maternity care. Factors most likely to limit the applicability
of the evidence include country setting, community breastfeeding rates, variation in usual
maternity care practices (including other policies and practices to support breastfeeding), and
potentially socioeconomic factors.
For KQ 2, similar concerns about applicability apply. However, for KQ 2, we did limit our
review to studies conducted in very high-income countries. One limitation of the evidence

ES-16
related to time frame of enrollment. Many observational studies (including data from WHI
participants4) enrolled women who breastfed decades ago; evidence on the association between
breastfeeding from cohorts of older women may or may not reflect the strength of association for
women currently breastfeeding. Women who chose to breastfeed when breastfeeding rates in the
United States were lower could be different in ways that affect risk of adverse maternal health
outcome.
Limitations of the Review Process For KQ 1, we looked for and included a broad net in terms of our inclusion criteria that relate
to interventions to promote and support breastfeeding. At the same time, we specifically
excluded primary-care relevant interventions delivered to individual women (so as not to
duplicate a recent review conducted for the USPSTF).23 The studies that met our inclusion
criteria assessed a variety of different intervention types. Due to our inclusion criteria, we may
have excluded some interventions that could be considered system-level or community based.
The breadth of our eligibility criteria was also a limitation in terms of evidence synthesis;
included studies may have been categorized in different ways. We chose to focus on intervention
type and setting as these may be important factors for decision-makers who plan to implement
breastfeeding programs and policies. For KQ 2, we chose to include recent, relevant systematic
reviews in our evidence synthesis. Although this may improve efficiency, this approach has
limitations. Some included systematic reviews do not fully report details related to methods
(particularly risk of bias assessment).
Limitations of the Evidence Base For KQ 1, we found no evidence on certain types of interventions (e.g., workplace and
school-based interventions), limited evidence for subgroups of women, and no included studies
reported on potential harms of interventions. In addition, due to heterogeneity across studies, we
were not able to assess whether certain characteristics of interventions have a greater influence
on breastfeeding initiation, duration, and exclusivity. We were also not able to determine
whether heterogeneity within some categories of interventions such as BFHI is due to study
design, differences in outcome measures, or country setting (since variation exists across all
these factors).
For KQ 2, although we found a large volume of evidence supporting the association between
breastfeeding and improved maternal health, methodological limitations specific to observational
study designs limit the ability to determine the magnitude of effect that lactation has on maternal
health outcomes. Although a growing literature documents protective associations between
lifetime lactation and improved maternal health, these findings do not establish that
breastfeeding prevents poor maternal health. Several other factors may be at work. First, women
in very high income countries who choose to and successfully breastfeed are typically better
educated, wealthier, and more likely to engage in other beneficial health behaviors.72, 73
Moreover, it is plausible that, rather than breastfeeding preventing poor maternal health, poor
maternal health may prevent breastfeeding.
Future Research Needs For KQ 1, future research should assess the benefit of workplace, school-based and other
community-based interventions for improving rates of breastfeeding. Authors of future studies

ES-17
should more clearly describe characteristics of usual care and what other breastfeeding support
services are available. For studies conducted in the United States, future research should address
whether certain interventions are more effective for groups of women who differ by
socioeconomic factors in order to assess the consistency of current evidence suggesting a
difference by education status.
For KQ 2, observational studies will likely remain the major source of evidence on the
association between breastfeeding and maternal health. Use of standardized breastfeeding
definitions and clear reporting of how participants were selected could help minimize bias. In
terms of analyses, authors should adequately address known confounders and clearly report a
rationale for why certain factors were chosen.
Conclusions The body of evidence for breastfeeding programs and policies was diverse in terms of
interventions and settings. Current evidence supports the effectiveness of BFHI for improving
rates of breastfeeding initiation and duration; however, evidence from one large RCT (PROBIT)
has limited applicability, and observational studies do not clearly establish the magnitude of
benefit. For U.S. women enrolled in WIC, low strength of evidence supports peer-support
interventions for improving breastfeeding outcomes. Although low strength of evidence supports
the association between breastfeeding and improved health outcomes (breast cancer, ovarian
cancer, hypertension, and type 2 diabetes), methodological limitations specific to observational
study designs does not establish that there is a causal association between breastfeeding and
maternal health.

ES-18
References
1. Chowdhury R; Sinha B; Sankar MJ;
Taneja S; Bhandari N; Rollins N;
Bahl R; Martines J. Breastfeeding
and maternal health outcomes: a
systematic review and meta-analysis.
Acta Paediatr. 2015
Dec;104(467):96-113. doi:
10.1111/apa.13102. PMID:
26172878.
2. Ip S; Chung M; Raman G; Chew P;
Magula N; DeVine D; Trikalinos T;
Lau J. Breastfeeding and maternal
and infant health outcomes in
developed countries. Evid Rep
Technol Assess (Full Rep). 2007
Apr(153):1-186. PMID: 17764214.
3. Victora CG; Bahl R; Barros AJ;
Franca GV; Horton S; Krasevec J;
Murch S; Sankar MJ; Walker N;
Rollins NC. Breastfeeding in the 21st
century: epidemiology, mechanisms,
and lifelong effect. Lancet. 2016 Jan
30;387(10017):475-90. doi:
10.1016/s0140-6736(15)01024-7.
PMID: 26869575.
4. Schwarz EB; Ray RM; Stuebe AM;
Allison MA; Ness RB; Freiberg MS;
Cauley JA. Duration of lactation and
risk factors for maternal
cardiovascular disease. Obstet
Gynecol. 2009 May;113(5):974-82.
doi:
10.1097/01.AOG.0000346884.67796
.ca. PMID: 19384111.
5. Stuebe AM; Schwarz EB; Grewen
K; Rich-Edwards JW; Michels KB;
Foster EM; Curhan G; Forman J.
Duration of lactation and incidence
of maternal hypertension: a
longitudinal cohort study. Am J
Epidemiol. 2011 Nov
15;174(10):1147-58. doi:
10.1093/aje/kwr227. PMID:
21997568.
6. Stuebe AM; Michels KB; Willett
WC; Manson JE; Rexrode K; Rich-
Edwards JW. Duration of lactation
and incidence of myocardial
infarction in middle to late
adulthood. Am J Obstet Gynecol.
2009 Feb;200(2):138.e1-8. doi:
10.1016/j.ajog.2008.10.001. PMID:
19110223.
7. Schwarz EB; McClure CK; Tepper
PG; Thurston R; Janssen I; Matthews
KA; Sutton-Tyrrell K. Lactation and
maternal measures of subclinical
cardiovascular disease. Obstet
Gynecol. 2010 Jan;115(1):41-8. doi:
10.1097/AOG.0b013e3181c5512a.
PMID: 20027032.
8. Centers for Disease Control and
Prevention. Breastfeeding report
cards.
9. Office of Disease Prevention and
Health Promotion. Maternal, Infant,
and Child Health. Washington, DC:
Office of Disease Prevention and
Health Promotion; 2016.
https://www.healthypeople.gov/2020
/topics-objectives/topic/maternal-
infant-and-child-health/objectives.
Accessed on September 8, 2016.
10. Stuebe AM; Horton BJ; Chetwynd
E; Watkins S; Grewen K; Meltzer-
Brody S. Prevalence and risk factors
for early, undesired weaning
attributed to lactation dysfunction. J
Womens Health (Larchmt). 2014
May;23(5):404-12. doi:
10.1089/jwh.2013.4506. PMID:
24655291.
11. Centers for Disease Control and
Prevention. Progress in increasing
breastfeeding and reducing
racial/ethnic differences—United
States, 2000-2008 Births. Atlanta,
GA: Centers for Disease Control and

ES-19
Prevention; 2013.
www.cdc.gov/breastfeeding/resource
s/breastfeeding-trends.htm. Accessed
on January 3, 2017.
12. Centers for Disease Control and
Prevention. Breastfeeding among
U.S. Children Born 2002–2012,
CDC National Immunization
Surveys. Atlanta, GA: Centers for
Disease Control and Prevention;
2016.
www.cdc.gov/breastfeeding/data/nis
_data/index.htm.
13. Health Resources and Services
Administration. Women’s Preventive
Services Guidelines. Rockville, MD:
Health Resources and Services
Administration; 2016.
www.hrsa.gov/womensguidelines/.
Accessed on January 3, 2017.
14. Abdulwadud OA; Snow ME.
Interventions in the workplace to
support breastfeeding for women in
employment. Cochrane Database
Syst Rev. 2012 Oct
17;10:Cd006177. doi:
10.1002/14651858.CD006177.pub3.
PMID: 23076920.
15. Baby-Friendly USA. Baby-Friendly
Hospital Initiative. The Ten Steps to
Successful Breastfeeding. Albany,
NY: Baby-Friendly USA; 2010.
www.babyfriendlyusa.org/about-
us/baby-friendly-hospital-
initiative/the-ten-steps. Accessed on
January 3, 2017.
16. American Academy of Pediatrics.
Breastfeeding and the use of human
milk. Pediatrics. 2012
Mar;129(3):e827-41. doi:
10.1542/peds.2011-3552. PMID:
22371471.
17. American College of Obstetricians
and Gynecologists. Optimizing
support for breastfeeding as part of
obstetric practice. Committee
Opinion No. 658. Obstet Gynecol
Annu. 2016;127:e86-92.
18. World Health Organization.
International Code of Marketing
Breast-milk Substitutes. Geneva:
World Health Organization; 1981.
19. World Health Organization. Health
topics. Breastfeeding. Switzerland:
World Health Organization; 2017.
Accessed on January 3, 2017.
20. World Health Organization,
UNICEF. Protecting, promoting and
supporting breast-feeding: the
special role of maternity services.
Geneva: World Health Organization;
1989.
21. American Academy of Family
Physicians. Breastfeeding (policy
statement): American Academy of
Family Physicians [serial on the
Internet]; 2012.
22. World Health Organization.
Nutrition. Exclusive breastfeeding.
Geneva, Switzerland: World Health
Organization; n.d.
http://www.who.int/nutrition/topics/e
xclusive_breastfeeding/en/. Accessed
on November 28, 2017.
23. Patnode CD; Henninger ML; Senger
CA; Perdue LA; Whitlock EP.
Primary Care Interventions to
Support Breastfeeding: Updated
Evidence Report and Systematic
Review for the US Preventive
Services Task Force. JAMA. 2016
Oct 25;316(16):1694-705. doi:
10.1001/jama.2016.8882. PMID:
27784101.
24. Bibbins-Domingo K; Grossman DC;
Curry SJ; Davidson KW; Epling JW,
Jr.; Garcia FA; Kemper AR; Krist
AH; Kurth AE; Landefeld CS;
Mangione CM; Phillips WR; Phipps
MG; Pignone MP. Primary Care
Interventions to Support
Breastfeeding: US Preventive

ES-20
Services Task Force
Recommendation Statement. JAMA.
2016 Oct 25;316(16):1688-93. doi:
10.1001/jama.2016.14697. PMID:
27784102.
25. Wang L; Li J; Shi Z. Association
between Breastfeeding and
Endometrial Cancer Risk: Evidence
from a Systematic Review and Meta-
Analysis. Nutrients. 2015 Jul
14;7(7):5697-711. doi:
10.3390/nu7075248. PMID:
26184301.
26. Chen H; Wang J; Zhou W; Yin H;
Wang M. Breastfeeding and Risk of
Rheumatoid Arthritis: A Systematic
Review and Metaanalysis. J
Rheumatol. 2015 Sep;42(9):1563-9.
doi: 10.3899/jrheum.150195. PMID:
26178286.
27. Zhou Y; Chen J; Li Q; Huang W;
Lan H; Jiang H. Association between
breastfeeding and breast cancer risk:
evidence from a meta-analysis.
Breastfeed Med. 2015
Apr;10(3):175-82. doi:
10.1089/bfm.2014.0141. PMID:
25785349.
28. Sterne JA; Hernan MA; Reeves BC;
Savovic J; Berkman ND;
Viswanathan M; Henry D; Altman
DG; Ansari MT; Boutron I;
Carpenter JR; Chan AW; Churchill
R; Deeks JJ; Hrobjartsson A;
Kirkham J; Juni P; Loke YK; Pigott
TD; Ramsay CR; Regidor D;
Rothstein HR; Sandhu L; Santaguida
PL; Schunemann HJ; Shea B; Shrier
I; Tugwell P; Turner L; Valentine
JC; Waddington H; Waters E; Wells
GA; Whiting PF; Higgins JP.
ROBINS-I: a tool for assessing risk
of bias in non-randomised studies of
interventions. BMJ. 2016 Oct
12;355:i4919. doi:
10.1136/bmj.i4919. PMID:
27733354.
29. Higgins JPT; Green S. Cochrane
Handbook for Systematic Reviews of
Interventions. The Cochrane
Collaboration.; 2011.
www.handbook.cochrane.org.
Accessed on January 10, 2017.
30. Agency for Healthcare Research and
Quality. Methods Guide for
Effectiveness and Comparative
Effectiveness Reviews. AHRQ
Publication No. 10(14)-EHC063-EF.
Rockville, MD: Agency for
Healthcare Research and Quality;
January 2014.
www.effectivehealthcare.ahrq.gov/m
ethodsguide.cfm.
31. Whiting P; Savovic J; Higgins JP;
Caldwell DM; Reeves BC; Shea B;
Davies P; Kleijnen J; Churchill R.
ROBIS: A new tool to assess risk of
bias in systematic reviews was
developed. J Clin Epidemiol. 2016
Jan;69:225-34. doi:
10.1016/j.jclinepi.2015.06.005.
PMID: 26092286.
32. Berkman ND; Lohr KN; Ansari MT;
Balk EM; Kane R; McDonagh M;
Morton SC; Viswanathan M; Bass
EB; Butler M; Gartlehner G;
Hartling L; McPheeters M; Morgan
LC; Reston J; Sista P; Whitlock E;
Chang S. Grading the strength of a
body of evidence when assessing
health care interventions: an EPC
update. J Clin Epidemiol. 2015
Nov;68(11):1312-24. doi:
10.1016/j.jclinepi.2014.11.023.
PMID: 25721570.
33. Atkins D; Chang SM; Gartlehner G;
Buckley DI; Whitlock EP; Berliner
E; Matchar D. Assessing
applicability when comparing
medical interventions: AHRQ and
the Effective Health Care Program. J

ES-21
Clin Epidemiol. 2011
Nov;64(11):1198-207. doi:
10.1016/j.jclinepi.2010.11.021.
PMID: 21463926.
34. Kramer MS; Chalmers B; Hodnett
ED; Sevkovskaya Z; Dzikovich I;
Shapiro S; Collet JP; Vanilovich I;
Mezen I; Ducruet T; Shishko G;
Zubovich V; Mknuik D; Gluchanina
E; Dombrovskiy V; Ustinovitch A;
Kot T; Bogdanovich N; Ovchinikova
L; Helsing E. Promotion of
Breastfeeding Intervention Trial
(PROBIT): a randomized trial in the
Republic of Belarus. JAMA. 2001
Jan 24-31;285(4):413-20. PMID:
11242425.
35. Yang S; Platt RW; Dahhou M;
Kramer MS. Do population-based
interventions widen or narrow
socioeconomic inequalities? The
case of breastfeeding promotion. Int
J Epidemiol. 2014 Aug;43(4):1284-
92. doi: 10.1093/ije/dyu051. PMID:
24639438.
36. Hawkins SS; Stern AD; Baum CF;
Gillman MW. Evaluating the impact
of the Baby-Friendly Hospital
Initiative on breast-feeding rates: a
multi-state analysis. Public Health
Nutr. 2015 Feb;18(2):189-97. doi:
10.1017/s1368980014000238.
PMID: 24625787.
37. Hawkins SS; Stern AD; Baum CF;
Gillman MW. Compliance with the
Baby-Friendly Hospital Initiative
and impact on breastfeeding rates.
Arch Dis Child Fetal Neonatal Ed.
2014 Mar;99(2):F138-43. doi:
10.1136/archdischild-2013-304842.
PMID: 24277661.
38. Tarrant M; Wu KM; Fong DY; Lee
IL; Wong EM; Sham A; Lam C;
Dodgson JE. Impact of baby-friendly
hospital practices on breastfeeding in
Hong Kong. Birth. 2011
Sep;38(3):238-45. doi:
10.1111/j.1523-536X.2011.00483.x.
PMID: 21884232.
39. Mydlilova A; Sipek A; Vignerova J.
Breastfeeding rates in baby-friendly
and non-baby-friendly hospitals in
the Czech Republic from 2000 to
2006. J Hum Lact. 2009
Feb;25(1):73-8. doi:
10.1177/0890334408325820. PMID:
19020285.
40. Abolyan LV. The breastfeeding
support and promotion in Baby-
Friendly Maternity Hospitals and
Not-as-Yet Baby-Friendly Hospitals
in Russia. Breastfeed Med. 2006
Summer;1(2):71-8. doi:
10.1089/bfm.2006.1.71. PMID:
17661566.
41. Coutinho SB; de Lira PI; de
Carvalho Lima M; Ashworth A.
Comparison of the effect of two
systems for the promotion of
exclusive breastfeeding. Lancet.
2005 Sep 24-30;366(9491):1094-
100. doi: 10.1016/s0140-
6736(05)67421-1. PMID: 16182897.
42. Bosnjak AP; Batinica M; Hegedus-
Jungvirth M; Grguric J; Bozikov J.
The effect of baby friendly hospital
initiative and postnatal support on
breastfeeding rates--Croatian
experience. Coll Antropol. 2004
Jun;28(1):235-43. PMID: 15636080.
43. Gau ML. Evaluation of a lactation
intervention program to encourage
breastfeeding: a longitudinal study.
Int J Nurs Stud. 2004
May;41(4):425-35. doi:
10.1016/j.ijnurstu.2003.11.002.
PMID: 15050853.
44. Bartington S; Griffiths LJ; Tate AR;
Dezateux C. Are breastfeeding rates
higher among mothers delivering in
Baby Friendly accredited maternity
units in the UK? Int J Epidemiol.

ES-22
2006 Oct;35(5):1178-86. doi:
10.1093/ije/dyl155. PMID:
16926214.
45. Broadfoot M; Britten J; Tappin DM;
MacKenzie JM. The Baby Friendly
Hospital Initiative and breast feeding
rates in Scotland. Arch Dis Child
Fetal Neonatal Ed. 2005
Mar;90(2):F114-6. doi:
10.1136/adc.2003.041558. PMID:
15724033.
46. Yotebieng M; Labbok M; Soeters
HM; Chalachala JL; Lapika B; Vitta
BS; Behets F. Ten Steps to
Successful Breastfeeding programme
to promote early initiation and
exclusive breastfeeding in DR
Congo: a cluster-randomised
controlled trial. Lancet Glob Health.
2015 Sep;3(9):e546-55. doi:
10.1016/s2214-109x(15)00012-1.
PMID: 26246225.
47. Osband YB; Altman RL; Patrick PA;
Edwards KS. Breastfeeding
education and support services
offered to pediatric residents in the
US. Acad Pediatr. 2011 Jan-
Feb;11(1):75-9. doi:
10.1016/j.acap.2010.11.002. PMID:
21272827.
48. Ekstrom A; Abrahamsson H;
Eriksson RM; Martensson BL.
Women's use of nipple shields-their
influence on breastfeeding duration
after a process-oriented education for
health professionals. Breastfeed
Med. 2014 Nov;9(9):458-66. doi:
10.1089/bfm.2014.0026. PMID:
25188544.
49. Ekstrom A; Kylberg E; Nissen E. A
process-oriented breastfeeding
training program for healthcare
professionals to promote
breastfeeding: an intervention study.
Breastfeed Med. 2012 Apr;7(2):85-
92. doi: 10.1089/bfm.2010.0084.
PMID: 22168946.
50. Hannula LS; Kaunonen ME; Puukka
PJ. A study to promote breast
feeding in the Helsinki Metropolitan
area in Finland. Midwifery. 2014
Jun;30(6):696-704. doi:
10.1016/j.midw.2013.10.005. PMID:
24210842.
51. Wan H; Hu S; Thobaben M; Hou Y;
Yin T. Continuous primary nursing
care increases satisfaction with
nursing care and reduces postpartum
problems for hospitalized pregnant
women. Contemp Nurse. 2011
Feb;37(2):149-59. doi:
10.5172/conu.2011.37.2.149. PMID:
21692586.
52. Feldman-Winter L; Barone L;
Milcarek B; Hunter K; Meek J;
Morton J; Williams T; Naylor A;
Lawrence RA. Residency curriculum
improves breastfeeding care.
Pediatrics. 2010 Aug;126(2):289-97.
doi: 10.1542/peds.2009-3250.
PMID: 20603262.
53. Hoddinott P; Britten J; Prescott GJ;
Tappin D; Ludbrook A; Godden DJ.
Effectiveness of policy to provide
breastfeeding groups (BIG) for
pregnant and breastfeeding mothers
in primary care: cluster randomised
controlled trial. BMJ. 2009 Jan
30;338:a3026. doi:
10.1136/bmj.a3026. PMID:
19181729.
54. Senarath U; Fernando DN; Rodrigo
I. Effect of training for care
providers on practice of essential
newborn care in hospitals in Sri
Lanka. J Obstet Gynecol Neonatal
Nurs. 2007 Nov-Dec;36(6):531-41.
doi: 10.1111/j.1552-
6909.2007.00183.x. PMID:
17973696.

ES-23
55. Kronborg H; Vaeth M; Olsen J;
Iversen L; Harder I. Effect of early
postnatal breastfeeding support: a
cluster-randomized community
based trial. Acta Paediatr. 2007
Jul;96(7):1064-70. doi:
10.1111/j.1651-2227.2007.00341.x.
PMID: 17524018.
56. Kools EJ; Thijs C; Kester AD; van
den Brandt PA; de Vries H. A breast-
feeding promotion and support
program a randomized trial in The
Netherlands. Prev Med. 2005
Jan;40(1):60-70. doi:
10.1016/j.ypmed.2004.05.013.
PMID: 15530582.
57. Martens PJ. Does breastfeeding
education affect nursing staff beliefs,
exclusive breastfeeding rates, and
Baby-Friendly Hospital Initiative
compliance? The experience of a
small, rural Canadian hospital. J
Hum Lact. 2000 Nov;16(4):309-18.
PMID: 11155609.
58. Taddei JA; Westphal MF; Venancio
S; Bogus C; Souza S. Breastfeeding
training for health professionals and
resultant changes in breastfeeding
duration. Sao Paulo Med J. 2000
Nov 09;118(6):185-91. PMID:
11120550.
59. Madden JM; Soumerai SB; Lieu TA;
Mandl KD; Zhang F; Ross-Degnan
D. Effects on breastfeeding of
changes in maternity length-of-stay
policy in a large health maintenance
organization. Pediatrics. 2003
Mar;111(3):519-24. PMID:
12612230.
60. Bærug A; Langsrud Ø; Løland BF;
Tufte E; Tylleskär T; Fretheim A.
Effectiveness of Baby-friendly
community health services on
exclusive breastfeeding and maternal
satisfaction: a pragmatic trial.
Matern Child Nutr. 2016;12(3):428-
39. doi: 10.1111/mcn.12273. PMID:
116415662. Language: English.
Entry Date: 20160713. Revision
Date: 20160713. Publication Type:
Article. Journal Subset: Allied
Health.
61. Hayes DK; Prince CB; Espinueva V;
Fuddy LJ; Li R; Grummer-Strawn
LM. Comparison of manual and
electric breast pumps among WIC
women returning to work or school
in Hawaii. Breastfeed Med. 2008
Mar;3(1):3-10. doi:
10.1089/bfm.2007.0022. PMID:
18333763.
62. Joyce T; Reeder J. Changes in
breastfeeding among WIC
participants following
implementation of the new food
package. Matern Child Health J.
2015 Apr;19(4):868-76. doi:
10.1007/s10995-014-1588-7. PMID:
25095768.
63. Lovera D; Sanderson M; Bogle ML;
Vela Acosta MS. Evaluation of a
breastfeeding peer support program
for fathers of Hispanic participants in
a Texas special supplemental
nutrition program for women,
infants, and children. J Am Diet
Assoc. 2010 Nov;110(11):1696-702.
doi: 10.1016/j.jada.2010.08.001.
PMID: 21034883.
64. Reeder JA; Joyce T; Sibley K;
Arnold D; Altindag O. Telephone
peer counseling of breastfeeding
among WIC participants: a
randomized controlled trial.
Pediatrics. 2014 Sep;134(3):e700-9.
doi: 10.1542/peds.2013-4146.
PMID: 25092936.
65. Schafer E; Vogel MK; Viegas S;
Hausafus C. Volunteer peer
counselors increase breastfeeding
duration among rural low-income

ES-24
women. Birth. 1998 Jun;25(2):101-6.
PMID: 9668744.
66. Shaw E; Kaczorowski J. The effect
of a peer counseling program on
breastfeeding initiation and longevity
in a low-income rural population. J
Hum Lact. 1999 Mar;15(1):19-25.
PMID: 10578771.
67. Cattaneo A; Bettinelli M; Chapin E;
Macaluso A; Cordova DESL;
Murante A; Montico M.
Effectiveness of the baby friendly
community initiative in Italy: a non-
randomised controlled study. BMJ
Open; 2016.
68. McLachlan HL; Forster DA; Amir
LH; Cullinane M; Shafiei T; Watson
LF; Ridgway L; Cramer RL; Small
R. Supporting breastfeeding In Local
Communities (SILC) in Victoria,
Australia: a cluster randomised
controlled trial. BMJ Open. 2016
Feb 01;6(2):e008292. doi:
10.1136/bmjopen-2015-008292.
PMID: 26832427.
69. Morrow AL; Guerrero ML; Shults J;
Calva JJ; Lutter C; Bravo J; Ruiz-
Palacios G; Morrow RC; Butterfoss
FD. Efficacy of home-based peer
counselling to promote exclusive
breastfeeding: a randomised
controlled trial. Lancet. 1999 Apr
10;353(9160):1226-31. doi:
10.1016/s0140-6736(98)08037-4.
PMID: 10217083.
70. Rempel LA; Moore KC. Peer-led
prenatal breast-feeding education: a
viable alternative to nurse-led
education. Midwifery. 2012
Feb;28(1):73-9. doi:
10.1016/j.midw.2010.11.005. PMID:
21236530.
71. Perez-Escamilla R; Martinez JL;
Segura-Perez S. Impact of the Baby-
friendly Hospital Initiative on
breastfeeding and child health
outcomes: a systematic review.
Matern Child Nutr. 2016
Jul;12(3):402-17. doi:
10.1111/mcn.12294. PMID:
26924775.
72. Beck LF; Morrow B; Lipscomb LE;
Johnson CH; Gaffield ME; Rogers
M; Gilbert BC. Prevalence of
selected maternal behaviors and
experiences, Pregnancy Risk
Assessment Monitoring System
(PRAMS), 1999. MMWR Surveill
Summ. 2002;51(2):1-27.
73. Pesa JA; Shelton MM. Health-
enhancing behaviors correlated with
breastfeeding among a national
sample of mothers. Public Health
Nurs. 1999;16(2):120-4.

1
Chapter 1. Introduction
Background In reproductive physiology, lactation follows pregnancy; evidence supports the association
between breastfeeding and better health outcomes for both infants and mothers.1-3 A 2007
Agency for Healthcare Research and Quality (AHRQ) review by Ip and colleagues concluded
that compared with no breastfeeding or a shorter duration of breastfeeding, breastfeeding was
associated with reduced maternal type 2 diabetes, breast cancer and ovarian cancer.2
Breastfeeding was not associated with risk of fracture. For other outcomes (e.g., postpartum
depression), the authors concluded that the relationship between breastfeeding and maternal
health was unclear. Since 2007, several new studies have reported on maternal outcomes not
addressed in the 2007 AHRQ review, including hypertension, rates of myocardial infarction, and
other cardiovascular outcomes.4-7
Breastfeeding initiation rates are increasing, and 82.5 percent of infants born in 2014 in the
United States were breastfed at birth; however, only 55.3 percent were breastfed at 6 months, and
33.7 at 12 months.8 With the exception of breastfeeding initiation, these rates fall short of
Healthy People 2020 targets for initiating breastfeeding, breastfeeding to 6 months, and
breastfeeding to 12 months are 81.9, 66.6, and 34.1 percent, respectively.9 Women would prefer
to breastfeed longer: in a national survey, 45 percent of U.S. women who initiated breastfeeding
reported early, undesired weaning.10 Moreover, racial and ethnic differences in breastfeeding
initiation (starting) and duration (continuing) rates persist, despite rising rates for all groups of
women. From 2000 to 2014, the percentage of women who initiated breastfeeding went up from
47.4 percent to 68.0 percent for blacks, 71.8 percent to 85.7 percent for whites, and 77.6 percent
to 84.8 percent for Hispanics.11, 12 Sociodemographic factors associated with an increased
likelihood of breastfeeding initiation and continuation include older maternal age, being married,
Asian or white race, Hispanic ethnicity, higher maternal education, and access to private
insurance.12-15
In addition to setting targets for breastfeeding initiation rates and duration of breastfeeding,
other Healthy People 2020 objectives related to breastfeeding include 1) increasing the
proportion of live births that occur in facilities that provide recommended care for lactating
mothers and their babies, and 2) increasing the proportion of employers that have worksite
lactation support programs.9 These community, workplace, and health care system-based
programs and policies may be promising strategies to support initiation and increase duration
breastfeeding.
Health care system-based interventions may include maternity staff education or the Baby-
Friendly Hospital Initiative (BFHI). The BFHI is a global program sponsored by the World
Health Organization and UNICEF to encourage and recognize hospitals and birth centers that
create an environment that supports breastfeeding; the “10 Steps to Successful Breastfeeding for
Hospitals” are listed in Table 1. For U.S. hospitals, Baby-Friendly accreditation is awarded to
facilities that successfully implement the 10 steps and the International Code of Marketing of
Breast-Milk Substitutes16 and pass an intensive site visit.17 Site visits and certification are
adjudicated by Baby Friendly USA, a 501c3 non-profit organization.18 In addition to certification
by Baby Friendly USA, state departments of public health have encouraged implementation of
the 10 Steps through local programs such as the Texas Ten Step Program,19 the North Carolina
Maternity Center Breastfeeding-Friendly Designation Program,20 and others. On a national level,
the Centers for Disease Control and Prevention has audited maternity care practices during the

2
past 10 years with a biannual maternity practice survey, results of which are distributed to each
maternity center.21
Table 1. Baby-Friendly Hospital Initiative 10 steps to successful breastfeeding1
1. Have a written breastfeeding policy that is routinely communicated to all health care staff.
2. Train all health care staff in skills necessary to implement this policy.
3. Inform all pregnant women about the benefits and management of breastfeeding.
4. Help mothers initiate breastfeeding within 1 hour of birth.
5. Show mothers how to breastfeed, and how to maintain lactation even if they should be separated from their infants.
6. Give infants no food or drink other than breast milk, unless medically indicated.
7. Practice rooming in—allow mothers and infants to remain together 24 hours a day.
8. Encourage breastfeeding on demand.
9. Give no pacifiers or artificial nipples to breastfeeding infants
10. Foster the establishment of breastfeeding support groups and refer mothers to them on discharge from the hospital or birth center.
1 Baby Friendly USA Ten Steps to Successful Breastfeeding22
Insurance coverage for lactation support is another strategy that may enable women to
achieve their breastfeeding goals. Costs associated with breastfeeding support (e.g.,
comprehensive lactation support and counseling and breastfeeding equipment) are currently
covered by health insurance marketplace plans and private non-grandfathered health plans under
the 2010 Patient Protection and Affordable Care Act (ACA).23 It is not clear whether certain
lactation benefit packages (e.g., type of breastfeeding supplies offered, number of visits
provided, or qualifications of intervention delivery personnel) are more or less effective than
others in increasing breastfeeding initiation and duration.
Although there is broad appeal and interest in workplace interventions to increase duration
and exclusivity of breastfeeding, the effectiveness and harms is uncertain. If they are not
supported by their employers, working mothers may have difficulty expressing and storing milk,
and thus may not be able to maintain breastfeeding. A 2012 systematic review found no
controlled trials evaluating the effectiveness of workplace programs.24 The ACA included a
provision aimed at workplace breastfeeding policies by amending Section 7 of the Fair Labor
Standards Act to require employers to provide reasonable break time and a private space (other
than a bathroom) for breastfeeding women to express breast milk for at least 1 year after
childbirth.25
Existing Guidelines Multiple clinical guidelines and health-related organizations recommend exclusive
breastfeeding up to (or around) 6 months, including the American Academy of Pediatrics,26 the
American Congress of Obstetrics and Gynecology,27 the World Health Organization (WHO),16, 28
and others.29, 30 These organizations recommend continued breastfeeding through the first year of
life and beyond; the WHO recommends continued breastfeeding through the second year of life
and beyond.
Rationale for Evidence Review Programs and policies to support breastfeeding are quite diverse and often complex.31-33 The
purpose of this review is to conduct an evidence report that summarizes the effectiveness of
community, workplace, and health care system-based programs and policies aimed at supporting
and promoting breastfeeding. This review will describe the effectiveness of programs or policies

3
in supporting breastfeeding, and whether effectiveness varies for subgroups of women defined
by important sociodemographic factors (e.g., maternal age, education, and income; family and
social support). This review will not address the effectiveness of individual-level primary care
interventions to support breastfeeding; this evidence was recently summarized in a systematic
review34 to support the U.S. Preventive Services Task Force in updating its recommendation on
counseling to support breastfeeding.35
In addition, this review will address the association between breastfeeding and maternal
health. Substantial time has elapsed since the last AHRQ review on this topic in 2007, and the
body of literature focused on the maternal health benefits of breastfeeding has grown.1, 36-38 This
review will conduct a partial update of the 2007 AHRQ review focused on the relationship of
breastfeeding and various maternal health outcomes.
Key Questions
Key Question 1 1a: What is the effectiveness and harms of programs and policies on initiation, duration, and
exclusivity of breastfeeding?
1b: To what extent do the effectiveness and harms of programs and policies on initiation,
duration, and exclusivity of breastfeeding differ for subpopulations of women defined by
sociodemographic factors (e.g., age, race, ethnicity, socioeconomic status)?
1c: To what extent do intervention-related characteristics (e.g., type of breast pump provided—
manual or electric; delivery personnel) influence the initiation, duration, and exclusivity
of breast feeding?
Key Question 2 2a: What are the comparative benefits and harms for maternal health outcomes among women
who breastfeed for different intensities and durations?
2b: To what extent do benefits and harms for maternal health outcomes differ for subpopulations
of women defined by age, race, ethnicity, and comorbidity?
Analytic Framework We developed an analytic framework to guide the systematic review process (Figure 1). The
analytic framework illustrates the population, interventions, outcomes, and adverse effects that
guided our literature search and synthesis.

4
Figure 1. Analytic framework for breastfeeding programs and policies, breastfeeding uptake, and maternal health outcomes in developed countries
KQ=Key Question
Organization of This Report The remainder of the review describes our methods in detail and presents the results of our
synthesis of the literature by Key Question (KQ), with summary tables and the strength of
evidence grades for intervention types (KQ 1) or eligible maternal health outcomes (KQ 2). The
discussion section offers our conclusions, summarizes our findings, and provides other
information relevant to interpreting this work for practice and future research.
Appendix A contains the exact search strings we used in our literature searches. Appendix B
lists studies excluded at the stage of reviewing full-text articles with reasons for exclusion.
Appendix C provides the specific questions used for evaluating the risk of bias of all included
studies and documents risk of bias ratings for each study, and explains the rationale for high or
medium ratings. Appendix C also provides questions used for evaluating risk of bias and
relevance of included systematic reviews, and documents relevance and risk of bias ratings for
each review. Appendix D presents information about our grading of the strength of the various
bodies of evidence (tables for individual domain assessments and overall strength of evidence
grades for each intervention type or outcome).
Adverse Effects
of Intervention
Guilt about not
breastfeeding;
workplace
discrimination
Maternal Health
Outcomes
Postpartum
depression;
postpartum weight
change; breast
cancer; ovarian
cancer; fracture; type
2 diabetes;
hypertension;
cardiovascular
outcomes (e.g.,
stroke, myocardial
infarction)
Breastfeeding
initiation,
duration and
exclusivity
KQ
1a-c
Community, workplace,
and health care system-
based interventions to
promote and support
breastfeedingChildbearing
Women
KQ
2a-b
KQ
1a-c

5
Chapter 2. Methods
Protocol Review The initial Key Questions (KQs) were provided by AHRQ and developed in collaboration
with partners from the Centers for Disease Control and Prevention and National Institutes of
Health Office of Women’s Health. The RTI International-University of North Carolina at Chapel
Hill (RTI-UNC) Evidence-based Practice Center further refined the KQs. We sought guidance
from a Technical Expert Panel into the final research protocol, which was posted on the AHRQ
Web site on March 20, 2017, at
https://effectivehealthcare.ahrq.gov/topics/breastfeeding/research-protocol/; our PROSPERO
registration number is CRD42017079125.
Literature Search Strategy
Search Strategy We conducted two separate search strategies, one for KQ1 and a second for KQ2. Appendix
A presents the full search strategies for each KQ. For KQ1, we searched PubMed/MEDLINE,
the Cochrane Library, CINAHL from January 1, 1980, to February 8, 2017. Its start date
(January 1, 1980) was chosen to ensure that evidence is applicable to current breastfeeding
policies and practices. For KQ 2, we searched PubMed/MEDLINE, the Cochrane Library,
CINAHL from November 1, 2005 (6 months prior to the search date of the 2007 AHRQ review
searches) to February 2, 2017.
For both searches, we used either Medical Subject Headings or major headings as search
terms when available or key words when appropriate, focusing on terms to describe the relevant
population and interventions of interest. We reviewed our search strategy with the Technical
Expert Panel and incorporated their input into our search strategy. An experienced information
scientist (a librarian at the Evidence-based Practice Center) conducted the searches. The
literature search will be updated concurrent with the peer review process.
We searched for unpublished studies relevant to this review using ClinicalTrials.gov. On our
behalf, the AHRQ Scientific Resource Center solicited scientific information packages via
Federal register notices or informational requests.
We also manually searched reference lists of pertinent reviews and included trials and
background articles on this topic to look for any relevant citations that our searches might have
missed. We imported all citations into an EndNote® X7.5 electronic database.
Inclusion and Exclusion Criteria We developed eligibility (inclusion and exclusion) criteria with respect to PICOTS
(populations, interventions, comparators, outcomes, time frames, settings), study designs, and
study durations for each KQ (Table 2). Both KQs focused on populations of childbearing women
(adults and adolescents).

6
Table 2. Eligibility criteria
PICOTS Inclusion Exclusion
Population KQs 1 and 2: Childbearing women and adolescentsa; we will also search for evidence on subgroups of women defined by age, race, ethnicity, comorbidity, and socioeconomic status (including insurance status and payer type).
KQs 1 and 2: Men; nulliparous women; children
Intervention/ Exposure
KQ 1: Community, workplace, and health care system-based interventions aimed at promoting and supporting breastfeeding, including the following: health plan benefits; state and federal policies or programs (e.g., WIC programs); workplace and school-based programs; BFHI implementation, including full or partial implementation (defined as three or more steps) KQ 2: Exposure to breastfeedingb
KQ 1: Interventions delivered in primary care settings as part of pre- or postnatal care; interventions specific to NICU care KQ 2: All other exposures
Comparator KQ 1: No intervention (or usual practice); comparisons of two interventions that differ in content or intensity KQ 2: No breastfeeding; shorter duration (e.g., breastfeeding for 1 month vs. 12 months) and/or less intensive breastfeeding (e.g., exclusive breastfeeding vs. mixed feeding or formula feeding)
KQs 1 and 2: All other comparisons; no comparisons
Outcomes KQ 1: Rates of breastfeeding initiation, duration, and exclusivity of breastfeeding; harms of interventions (e.g., guilt about not breastfeeding, workplace discrimination, and other reported harms) KQ 2: Postpartum depression (any measure), postpartum weight change,c breast cancer, ovarian cancer, osteoporotic fracture,d type 2 diabetes, hypertension, cardiovascular outcomes (e.g., stroke, myocardial infarction, cardiovascular disease specific mortality, and composite outcomes)
KQ 1: Any other outcome not specified, including compliance with policies or practices and attitudes toward breastfeeding and complications of lactation KQ 2: Any other outcome not specified, including complications of lactation (e.g., mastitis)
Country setting
KQs 1 and2: Studies conducted in a developed country [“very high” (KQs 1 and 2)e and “high” (KQ 1) human development index per the United Nations Development Programme]39
KQs 1 and 2: Studies conducted in other countries
Study designs KQ 1: RCTs; CCTs; prospective cohort studies with concurrent control groups; systematic reviews; for studies assessing policy or system-level interventions, pre-post studies with repeated outcome measures before and after the intervention are also eligible KQ 2: RCTs; CCTs; cohort studiesf; case-control studies; systematic reviews
KQs 1 and 2: All other designs
Publication Language
KQs 1 and 2: English KQs 1 and 2: Languages other than English
a Childbearing women and adolescents are our population of interest; however, for KQ1, interventions may include or be targeted
towards the woman’s partner or family. b This includes women who breastfeed their infant at the breast and/or express milk. c The prior 2007 review on this topic for AHRQ (Ip et al.) restricted results to prospective cohort studies reporting on women for
whom the exclusivity or amount of breastfeeding was known. Studies reporting on weight change needed to control for
gestational weight gain or prepregnancy weight and have at least 3 months of followup. All included studies for the update met
these criteria.
d We excluded studies with surrogate measures of fracture (e.g., fracture risk score or index) or bone turnover markers or with
measures of osteoporosis only. e The United Nations does not recognize Taiwan (i.e., Republic of China) as a sovereign state and does not include it in the 2015
Human Development Index report. However, Taiwan’s government calculated its HDI to be 0.882, based on 2014 data and using
the same methodology as the United Nations. This HDI value would place Taiwan among countries in the “very high” human
development category and will be included in this report.40 f For all KQ 2 outcomes, we included cohort studies that report on the incidence of eligible health outcomes prospectively
regardless of whether or not women were classified into categories based on breastfeeding exposure prospectively (i.e., at study
enrollment) or retrospectively. Additionally, for long-term outcomes for which no prospective studies of outcomes exist, we may
include cohort studies that collect information on exposure and outcomes at a single time point (retrospectively). Such studies
provide evidence on associations rather than on causal relationships.
BFHI=Baby-Friendly Hospital Initiative; CCT=controlled clinical trial; KQ=Key Question; NICU= neonatal intensive care unit;
PICOTS=population, intervention/exposure, comparator, outcomes, time frames, country settings, study design;
RCT=randomized controlled trial; WIC=Special Supplemental Nutrition Program for Women, Infants, and Children.

7
The focus of KQ1 is on providing an overall synthesis of community, workplace, or health
care system-based interventions aimed at promoting and supporting breastfeeding. We
specifically excluded studies assessing individual-level primary care interventions to support and
promote breastfeeding, so as not to duplicate a recent review conducted for the U.S. Preventive
Services Task Force.34 For KQ1, we included studies conducted in countries categorized as “very
high” and “high” human development index per the United Nations Development Programme,
given the relatively small body of literature on the Baby-Friendly Hospital Initiative and other
community-based breastfeeding interventions.41 Eligible outcomes include rates of breastfeeding
initiation, duration and exclusivity of breastfeeding, as well as potential harms of interventions
(e.g., guilt about not breastfeeding, workplace discrimination).
Our eligibility criteria for KQ2 is based on criteria used in the 2007 AHRQ review by Ip and
colleagues for maternal health outcomes. Eligible studies are those that compare groups of
women exposed to breastfeeding with those who did not breastfeed (or breastfed for shorter
duration and/or less intensity). For this update, we also expanded to include additional outcomes
including hypertension and cardiovascular disease (e.g., stroke and myocardial infarction). For
outcomes relevant to osteoporotic fracture, we limited to studies reporting on fractures and
excluded intermediate outcomes such as bone mineral density.
Study Selection Two members of the research team independently reviewed all titles and abstracts (identified
through searches) for eligibility against our inclusion and exclusion criteria (Table 2). We
retrieved any publications marked for inclusion by either reviewer for evaluation of the full text.
For titles and abstracts that lacked adequate information to determine inclusion or exclusion, we
retrieved the full text for review. Then, two investigators independently reviewed the full texts to
determine final inclusion or exclusion. The reviewers resolved any disagreements by discussion
and consensus or by consulting a third member of the review team.
All results in both review stages were tracked in an EndNote database. We recorded the
principal reason that each excluded full-text publication did not satisfy the eligibility criteria (see
Appendix B).
Data Extraction For studies that met our inclusion criteria, we designed and used structured data extraction
forms to gather pertinent information from each article, including characteristics of study
populations, settings, interventions, comparators, study designs, methods, and results. One
investigator extracted the relevant data from each included article; all data abstractions were
reviewed for completeness and accuracy by a second member of the team. We recorded
intention-to-treat results if available. For KQ2, we abstracted results relevant to the association
between breastfeeding and health outcomes that were adjusted for potential confounders rather
than unadjusted results (when both were provided). All data abstraction was performed using
Microsoft Excel® software.
Risk of Bias Assessment of Individual Studies To assess the risk of bias (i.e., internal validity) of individual studies, we adapted existing
tools (ROBINS-I42 for observational studies, and the Cochrane tool43 for trials) and used
predefined criteria based on the AHRQ Methods Guide for Comparative Effectiveness Reviews.

8
These criteria included questions to assess selection bias, confounding, performance bias,
detection bias, and attrition bias; concepts covered include those about adequacy of
randomization, similarity of groups at baseline, masking, attrition, whether intention-to-treat
analysis was used, method of handling missing data, validity and reliability of outcome
measures, and treatment fidelity.44 Appendix C lists the specific questions used for evaluating the
risk of bias of all included studies. It also includes a table showing the responses to these
questions and risk of bias ratings for each study, and explains the rationale for all ratings that
were either high or medium.
In general terms, results from a low risk of bias study are considered to be valid. A study
with medium risk of bias is susceptible to some risk of bias, but probably not enough to
invalidate its results. A study assessed as high risk of bias has significant risk of bias (e.g.,
stemming from serious errors in design, conduct, or analysis) that may invalidate its results. To
assess publication bias, we looked for evidence of unpublished literature through searches of
gray literature (clinicaltrials.gov).
We evaluated the risk of bias from selection, confounding, measurement of exposure,
missing data, measurement of outcomes, and reporting. Based on multiple signaling questions,
we rated the risk of bias for each domain as high, some concerns, or low, and provided
justification for the rating. Studies with a high risk of bias in any domain received an overall high
risk of bias rating. Studies with one or more domains with some concerns received an overall
rating of medium risk of bias. Studies with low risk of bias in all domains received an overall
low risk of bias rating. We describe the results of all included studies regardless of the risk of
bias rating. Risk of bias for individual studies influence the aggregate risk of bias rating for the
overall strength of evidence for each outcome.
Two independent reviewers assessed risk of bias for each study. Disagreements between the
two reviewers were resolved by discussion and consensus or by consulting a third member of the
team.
Risk of Bias Assessment of Systematic Reviews For both KQs, we capitalized on the availability of existing systematic reviews and meta-
analyses; these were captured in our database searches and identified during the literature review.
No relevant systematic reviews were identified for KQ1. For KQ2, we assessed the relevance of
recent systematic reviews (published within the past 5 years) using predefined criteria. Appendix
Table C-17 shows our assessment of each potentially relevant review identified during our
database searches. For reviews determined to be relevant, we rated the risk of bias as low,
unclear, or high using the ROBIS tool.45 Appendix C lists the specific questions used for
evaluating the risk of bias of all relevant reviews.
Data Synthesis We summarized all included studies in narrative form and in summary tables that tabulate the
important features of the study populations, design, intervention, outcomes, and results for KQ 1
and KQ 2.
KQ 2 is a partial update of the 2007 AHRQ review by Ip and colleagues; we synthesized
evidence from that review with newly identified evidence and did not report results from that
review separately from the body of literature published since. As noted above, we included other
recent (published within the past 5 years) relevant systematic reviews rated low or unclear risk of
bias using the ROBIS tool45 for KQ2. Conclusions from systematic reviews rated high risk of

9
bias may not be valid due to bias stemming from uncertain study eligibility criteria, lack of dual-
review during identification and selection of studies, and other factors. For those KQ 2 outcomes
for which we included a recent published systematic review, we first describe the results of the
review and then summarize data from primary studies not included in the review (i.e., those
published after the latest search date of those reviews, or identified by searching reference lists of
relevant articles).
When recent, relevant existing systematic reviews were identified for a particular outcome,
we assessed whether newly identified primary studies were likely to change judgments about
conclusions made in existing reviews using an SOE framework (i.e., assessment of study
limitations, consistency, precision, directness, and reporting bias). If we deemed their results
likely to change the conclusions, we considered conducting a new quantitative synthesis if
appropriate (i.e., if conclusions made in existing reviews are based on a pooled analysis of
studies). If the new studies were consistent with prior syntheses and would not change the
conclusion of the review, we presented the results of the existing review along with an updated
qualitative synthesis including the newly identified studies and an explanation of how they are
consistent with the prior findings. We conducted a new SOE for each outcome and did not use
SOE grading from existing reviews.
We considered performing meta-analyses when we had at least three unique studies of low or
medium risk of bias that we deemed sufficiently similar (in population, interventions,
comparators, and outcomes), because of the potential biases of meta-analyses that include a
small number of studies.46 We planned to consider heterogeneity carefully before calculating a
pooled summary estimate in a meta-analysis, we carefully considered the heterogeneity across
studies. As described above, in cases where we identified a recent eligible meta-analysis for an
eligible outcome, we assessed whether to update the analysis by considering how the results of
recently published primary studies would change the conclusions of the meta-analyses using a
SOE framework. For KQ1, we did not conduct meta-analyses of studies assessing the benefit of
interventions to improve rates of breastfeeding initiation and duration because we identified few
studies that were similar in population, setting, intervention type and design. For KQ2, the size
of the literature and heterogeneity varied across outcomes. For postpartum depression and
cardiovascular disease, we did not conduct meta-analyses primarily due to significant
heterogeneity in terms of study designs and outcome measures. For type 2 diabetes, breast and
ovarian cancer, we included recent existing systematic reviews with meta-analyses; individual
studies identified in our database searches were generally consistent with the pooled results
reported by existing systematic reviews and so we did conduct new meta-analyses.
We synthesized and described results of all studies regardless of the risk of bias rating. When
possible, we describe whether results of studies rated high risk of bias differ from those rated low
or medium risk of bias (narratively, or by noting whether existing systematic reviews or meta-
analyses found inconsistent results for studies that varied by risk of bias).
Strength of the Body of Evidence We graded the SOE of the accumulated evidence on a given issue to answer the specific KQs
on the benefits and harms of the interventions in this review; we used the guidance established
for the Evidence-based Practice Center Program.47 Developed to grade the overall strength of a
body of evidence, this approach now incorporates five key domains: risk of bias (including study
design and aggregate risk of bias); consistency, directness, and precision of the evidence; and
reporting bias. It also considers other optional domains that may be relevant for some scenarios,

10
such as plausible confounding that would decrease the observed effect and strength of
association (i.e., magnitude of effect) or factors that would increase the strength of association
(i.e., dose-response effect).
Table 3 describes the grades of evidence that can be assigned. Grades reflect the strength of
the body of evidence to answer the KQs on the comparative effectiveness, efficacy, and harms of
the interventions in this review, and on associations between breastfeeding and health outcomes.
Two reviewers assessed each domain for each key outcome, and differences will be resolved by
consensus. For each assessment, one of the two reviewers was always an experienced
Evidenced-based Practice Center investigator. We graded the strength of evidence for all
included outcomes.
Table 3. Definitions of the grades of overall strength of evidence
Grade Definition
High We are very confident that the estimate of effect lies close to the true effect for this outcome. The body of evidence has few or no deficiencies. We believe that the findings are stable
(i.e., another study would not change the conclusions).
Moderate We are moderately confident that the estimate of effect lies close to the true effect for this outcome. The body of evidence has some deficiencies. We believe that the findings are likely to
be stable, but some doubt remains.
Low We have limited confidence that the estimate of effect lies close to the true effect for this outcome. The body of evidence has major or numerous deficiencies (or both). We believe that
additional evidence is needed before concluding either that the findings are stable or that the estimate of effect is close to the true effect.
Insufficient We have no evidence, we are unable to estimate an effect, or we have no confidence in the estimate of effect for this outcome. No evidence is available or the body of evidence has
unacceptable deficiencies, precluding reaching a conclusion.
Source: Berkman et al.47
An unfavorable assessment for any one of the five key domains (e.g., inconsistency,
indirectness, imprecision, high or medium aggregate risk of bias, or evidence of reporting bias)
typically resulted in downgrading from high to moderate SOE. Two unfavorable assessments
typically resulted in downgrading to low SOE. When only one study reported an outcome of
interest (with unknown consistency and imprecision arising from nonsignificant results or wide
confidence intervals spanning the null), we usually graded the SOE as insufficient. Insufficient
ratings also applied to evidence bases with multiple studies with inconsistent results. When
aggregate risk of bias was high or uncertain, we usually graded the SOE as low or insufficient
(depending on responses to other key domains). Appendix D presents tables showing our
assessments for each domain and the resulting SOE grades for outcomes organized by KQ and
then intervention type (for KQ 1) and outcome category (for KQ 2).
Applicability We assessed applicability following guidance from the Methods Guide for Effectiveness and
Comparative Effectiveness Reviews.48 For individual studies, we examined conditions that may
limit applicability based on the PICOTS structure. Some factors identified a priori that may limit
the applicability of evidence include the following: race or ethnicity of enrolled populations,
setting of enrolled populations, geographic setting, and availability of health insurance and other
health-related employment benefits. We also paid close to attention to secular trends when
interpreting the evidence. Such trends are of concern, in that breastfeeding rates in the United
States have changed dramatically in the past 40 years, from a nadir of less than 25 percent in
197149 to more than 80 percent in 2014.8 This is important because the time period between

11
exposure to breastfeeding and some outcomes of interest (e.g., cancer, cardiovascular disease)
may be decades, and secular trends in social determinants of infant feeding may confound
observed associations. Findings linking breastfeeding to maternal health among women feeding
their infants decades ago may not be generalizable to contemporary women.
Peer Review and Public Commentary This report will be posted for public comment and will be peer reviewed. We will address all
comments in the final report, making revisions as needed; a disposition of comments report will
be publicly posted 3 months after release of the final report.

12
Chapter 3. Results
Results of Literature Search and Screening We identified 10,211 unique titles or abstracts with potential relevance, with 1,125
proceeding to full text review (Appendix B). We excluded 992 studies at full-text review. We
included 119 unique individual studies (124 publications) and 9 systematic reviews in the
review. Of the 119 included individual studies, 22 were studies from a prior 2007 Agency for
Healthcare Research and Quality (AHRQ) review addressing the maternal health benefits of
breastfeeding. The remaining 30 studies from the 2007 review were included in one of our 9 new
systematic reviews or superseded by a new included study.
Key Question 1a. What are the effectiveness and harms of programs and policies on initiation, duration, and exclusivity of breastfeeding?
Key Points: Baby-Friendly Hospital Initiative
Eleven included studies assessed the effectiveness of interventions related to Baby
Friendly Hospital Initiative (BFHI). Studies were heterogeneous in terms of country
setting, design and type of breastfeeding outcome reported; none reported on potential
harms associated with BFHI.
Low strength of evidence supports the association between BFHI certification or
accreditation and higher rates of breastfeeding initiation; results from 4 observational
studies set in the US and the UK (for rates of any breastfeeding) were higher but not
statistically significant. Results from 3 studies (set in Czech Republic, Taiwan, and
Russia) reporting on rates of exclusive breastfeeding initiation were statistically
significant.
Based on evidence from one large RCT (PROBIT, N=17,046) and five cohort studies
(62,834 women), we concluded that BFHI increases rates of breastfeeding duration
through 12 months postpartum (moderate strength of evidence). In the PROBIT trial,
women in the intervention group had significantly higher rates of exclusive breastfeeding
and lower rates of weaning across various time points (1 to 12 months postpartum).
Although the five observational studies were mostly consistent in finding benefit for
BFHI, results were imprecise and the magnitude of benefit varied by breastfeeding
measure and country setting.
Low strength of evidence supports the conclusion that BFHI effectiveness may vary
among women who differ by education status. Two U.S. cohort studies found higher rates
of breastfeeding initiation among women with less education (12 years or less) who gave
birth in BFHI certified facilities compared with non-certified facilities; no significant
difference was observed for women with more education (13 years or more). We rated
the association between BFHI certification and breastfeeding duration among women
who differ by education status as insufficient (primarily due to inconsistent and imprecise
findings).

13
Low strength of evidence supports the effectiveness of BFHI combined with a series of
planned home visits (for breastfeeding support) compared with BFHI alone for increasing
rates of any and exclusive breastfeeding over 6 months postpartum.
Low strength of evidence supports the conclusion that
implementation of 4 or more BFHI steps is associated with lower
rates of weaning than implementation of less than 4 steps. Key
Points: Non-BFHI health care system-based interventions
Eleven included studies (described in 12 publications) assessed the effectiveness of other
(non-BFHI) health care system-based interventions. Included studies assessed
heterogeneous interventions and enrolled women from diverse country settings; no study
reported on potential harms associated with the interventions.
Low strength of evidence supports the conclusion that healthcare staff training alone does
not increase breastfeeding initiation rates; across 4 studies, there was no significant
difference between intervention and control groups
Based on inconsistent and imprecise evidence from three studies, we concluded that
evidence was insufficient to determine whether healthcare staff training alone increases
breastfeeding duration.
Three studies assessing the benefit of an intervention combining healthcare staff
education with specific policies or programs to support or promote breastfeeding (e.g.,
expanding access to healthcare-based group visits, home visits or Web-based parent
support) found mixed results for both breastfeeding initiation and duration outcomes. Due
to methodological limitations, imprecise and inconsistent findings, we rated the strength
of evidence as insufficient.
One RCT (set in China) randomized women to a continuous nursing care intervention
(the same nurse provides routine perinatal care to the mother and infant) or usual nursing
care. We rated the strength of evidence as low for the effectiveness of continuous nursing
care in improving rates of exclusive breastfeeding over 6 weeks postpartum.
Low strength of evidence supports the effectiveness of implementation of BFHI in
outpatient maternal and child health (outpatient) centers for improving rates of exclusive
breastfeeding over 6 months postpartum.
Key Points: Women, Infant and Children (WIC)-based
interventions
Six included studies assessed a Special Supplemental Nutrition Program for Women,
Infants and Children (WIC) program or policy; studies evaluated heterogeneous
interventions. 50-55 Although all studies were set in the United States, they included
women from diverse states. None reported on potential harms.
Low strength of evidence supports the effectiveness of WIC-based peer support programs
for improving rates of breastfeeding initiation and duration of any breastfeeding over 6
weeks to 6 months postpartum. Two RCTs (assessing in-person peer support) found
improved rates of breastfeeding initiation among women in the intervention group
compared with controls, and three trials (two assessing in-person peer support and one

14
assessing telephone-based peer support) found improved rates of any breastfeeding at
outcome timings ranging from 6 weeks to 6 months postpartum.
We found insufficient evidence (primarily due to unknown consistency and imprecision)
to make a conclusion on the benefit of other WIC programs or policies for improving
breastfeeding outcomes, including policy changes related to WIC food packages,
provision of different types of breast pumps (electric versus manual), and peer support
programs targeted at fathers.
One RCT of telephone peer support reported on outcomes by subgroups of women based
on language spoken (English, or Spanish-only); in both groups, the intervention was
effective in improving rates of any breastfeeding at 3 months. At 6 months, there was a
significantly higher rate of any breastfeeding among Spanish-speaking only women in the
intervention group compared with women in the control group (but no significant
difference between groups in the English-speaking subgroup). We concluded that
evidence was insufficient to determine whether the effectiveness of telephone-based peer
support interventions vary among subgroups of women enrolled in WIC who differ by
language spoken.
Key Points: Community-based interventions
Studies evaluating the effectiveness of community-based interventions (not associated
with the healthcare system, or delivered as part of routine maternity care) were conducted
in diverse country settings and assessed heterogeneous interventions. None reported on
harms or results for eligible subgroups of women.
Low strength of evidence supports the benefit of community-based interventions that
provide mothers with peer-support (via home visits). In one RCT, more women in the
intervention groups were exclusively breastfeeding than controls at 3 months postpartum,
and rates of any breastfeeding were significantly longer in the intervention groups than
control group at 3 months.
Based on evidence from one large RCT, access to a community-based breastfeeding
drop-in center among women receiving early home-based breastfeeding support does not
increase breastfeeding duration (low strength of evidence).
We found insufficient evidence to make a conclusion on the effectiveness of other
community-based interventions, primarily due to unknown consistency, imprecision and
study limitations. One study each assessed the benefit of a community policy to promote
and support breastfeeding in community settings and a peer-led breastfeeding support
class (compared with a nurse-led class).
Baby-Friendly Hospital Initiative Interventions
Characteristics Eleven included studies (described in 12 publications) assessed the effectiveness of Baby
Friendly Hospital Initiative (BFHI) interventions (Table 4).56-67 All focused on postpartum
women enrolled from hospital wards or birth facilities soon after delivery. Studies were
conducted in diverse country settings including the United States (2 studies)58, 59 and one each in
the Republic of Belarus,56 Hong Kong,60 Czech Republic,61 Russia,68 Brazil,63 Croatia,64
Taiwan,65 United Kingdom (multiple regions),66 and Scotland.69 The majority of the studies

15
focused on multiple hospitals (>4) or clusters of hospitals; the smallest study was set in Brazil
and focused on two hospitals.63 The majority of studies focused on women giving birth between
2000 and 2009 (Table 4); two enrolled women in the late 1990s.56, 67
Two included studies were randomized controlled trials (RCTs),56, 63 eight were prospective
cohort studies,58-62, 65-67 and one was a single-group pre-post study.64 Of the two RCTs, one
(Promotion of Breastfeeding Intervention Trial [PROBIT])56 was a cluster-randomized trial of
BFHI (34 hospitals were randomized to BFHI or routine practice); the second RCT compared
BFHI implementation plus 10 planned home visits for all mothers with BFHI alone.63 The
majority of other studies compared cohorts of women giving birth in hospitals that had
implemented BFHI with women giving birth in hospitals that had not implemented BFHI (or
were not accredited). Most assessed the implementation of all 10 steps; one study set in Hong
Kong compared breastfeeding initiation rates at hospitals that had implemented at least 6 steps
with those that had implemented less than 6 steps.60
In terms of population characteristics, seven studies reported on maternal age and generally
enrolled women in their 20s and 30s.56, 58, 60, 62, 63, 65, 66 Three studies (set in the US and UK)
reported on race; the percent of nonwhite participants enrolled ranged from 3 to 47 percent.58, 59,
66 In the six studies reporting on the percent of enrolled women who were primiparous, the range
was 38 to 67 percent.58, 60, 62, 63, 65, 66 One study (PROBIT) reported on the percent of women who
previously breastfed a child for 3 months or longer (25%),56 and one reported on the percent of
included women who had previously breastfed for any duration (34%).60 Six studies reported on
the rate of cesarean delivery among enrolled participants; rates ranged from 10 to 30 percent.56,
60, 62, 63, 65, 66
Included studies varied in terms of whether they had other specific inclusion criteria for
mothers or hospitals or clusters (Table 4). For example, three studies only recruited women who
gave birth in hospitals that had more than 50 births per year66 or 100 births per year.58, 59
Notably, the PROBIT RCT only included mothers who initiated breastfeeding,56 and another
study only recruited women who were willing to, or experienced in, breastfeeding.65 Four
included studies limited to women giving birth to healthy singletons.56, 60, 63, 66
The majority (8 studies) were rated medium risk of bias (ROB); 1 was rated low ROB63 and
2 were rated high ROB.64, 65 Common methodological limitations included selection bias, high or
unclear rates of attrition, and baseline differences between groups that were not accounted for in
analyses.

16
Table 4. Characteristics of included studies assessing BFHI interventions
Author, Year ROB
Study Design N sites N participants
Country Year(s) of Enrollment
Inclusion Criteria Intervention Description
Comparator(s) Age, Mean (SD)
% Non-white
% Primi-parous % Previously BF
% Cesarean Birth
Kramer, 200156; Yang, 201457
(PROBIT) Medium
Cluster RCT 31 maternity hospitals/ polyclinics 17,046 mother/infant pairs
Republic of Belarus 1996-1997
Mothers with healthy singleton infants (≥37 wks, birth weight ≥2,500 g) who initiated BF during their postpartum stay
Maternity care in a BFHI facility, included lactation training to staff (18-hours) and implementa-tion of all 10 steps
Standard maternity care (non-BFHI accredited facilities)
% by age category: <20:14 20-34: 81-83 ≥35: 4
NR % with no other children living in household: 56-60 % BF previous child ≥3 mos: 24-25
11-13
Hawkins, 201458
Medium
Prospective cohort 32 birth facilities in 5 US states 25,327 women
United States 1999-2009
Facilities: dataa from 5 states participating in PRAMS monitoring (1999-2009) Mothers giving birth at facilities with at least 100 births during study period who had information on BF initiation
Mothers giving birth in a BFHI accredited birth facility/hospital
Mothers giving birth in a nonaccredited birth facility/hospital
% by age category: ≤19: 9 20-24: 24 25-29: 29 30-34: 24 ≥35: 15
49 42 NR
NR
Hawkins, 201459
Medium
Prospective cohort 10 birth facilities in 1 US state (Maine) 2,014 women
United States 2004-2008
Mothers giving birth in Maine at a hospital where at least 100 births occur
Mothers giving birth in an accredited or becoming accredited BFHI facility
Mothers giving birth in a facility that is not BFHI accredited
NR ≤7% across all facili-ties
NR NR
NR

17
Table 4. Characteristics of included studies assessing BFHI interventions (continued)
Author, Year Study Name ROB
Study Design N sites N participants
Country Year(s) of Enrollment
Inclusion Criteria Intervention Description
Comparator(s) Age, Mean (SD)
% Non-white
% Primi-parous % Previously BF
% Cesarean Birth
Tarrant, 201160
Medium
Prospective cohort 4 hospitals 1,417 mother/infant pairs
Hong Kong 2006-2007
Healthy mothers intending to BF with healthy singleton births (≥37 wks, ≥2,500g)
Completion of steps 6 out of 6 steps (4,6,7,8,9,10)
Completion of <6 of 6 of the identified BFHI steps
% by age category: 18-24: 7 25-29: 23 30-34: 46 ≥35: 24
NA 59 34
12
Mydilova, 200961
Medium
Prospective cohort 112 hospitals 660,355 births
Czech Republic 2000-2006
Mothers giving birth in a maternity hospital with a living infant at discharge
Mothers giving birth in a BFHI accredited hospital
Mothers giving birth in a non- BFHI accredited hospital
NR NR NR NR
NR
Abolyan, 200662
Medium
Prospective cohort 8 hospitals 741 women
Russia 2004
Mothers with no mental illness who had healthy infants (Apgar >7, weight >2,500g)
Mothers giving birth in hospitals with BFHI certification
Mothers giving birth in “not-as yet Baby Friendly”b hospitals
26 NR 63-67 NR
15-16
Coutinho, 200563
Low
RCT 2 hospitals 350 women
Brazil 2001
Healthy mothers with singleton births
BFHI staff training; all mothers assigned 10 postnatal HV specific to BF support
BFHI staff training alone (with no added HV)
% by age group: <20: 33 ≥20: 67
NR 38 NR
29
Bosnjak, 200464
High
Single-group, pre-post study 14 primary care sites 7,414 infants
Croatia 1990-2000
NR Implementa-tion of BFHI (1994-1998) and, later, establishment of community-based BF support groups (1999-2000)
Period before intervention implementation (1990-1993)
NR NR NR NR
NR

18
Table 4. Characteristics of included studies assessing BFHI interventions (continued)
Author, Year Study Name ROB
Study Design N sites N participants
Country Year(s) of Enrollment
Inclusion Criteria Intervention Description
Comparator(s) Age, Mean (SD)
% Non-white
% Primi-parous % Previously BF
% Cesarean Birth
Gau, 200465
High
Prospective cohort 12 hospitals 4,614 mothers
Taiwan 2000-2002
Postpartum women willing to, or experienced in, BF
Hospital lactation intervention focused on BFHI initiation and accreditation
Control hospitals not participating in intervention (and pre-post comparisons)
30-31 NR 49-53 NR
24-30
Bartington, 200666
Medium
Prospective cohort 496 maternity units 17,359 mother-infant parts
United Kingdom 2000-2002
Women with singleton live births
Birth in a BFHI accredited hospital or certified unit
Birth in a hospital that was not BFHI accredited or certified
Median age: 28-29
6-13 43-44 NR
22-23
Broadfoot, 200567
Medium
Prospective cohort 33 maternity units 445,623 births
Scotland 1995-2002
Maternity units: those with >50 births/year
Hospitals that held a UNICEF UK BFHI standard award
Hospitals without BFHI accreditation
NR NR NR NR
NR
a Per authors, data from Alaska, Maine, Nebraska, Ohio, and Washington were used because these states had at least one birth facility receive BFHI accreditation during 1999
through 2009 when PRAMS data were collected, and the state released hospital identifiers. The years of PRAMS data varied across states as did the timing of hospitals’ BFHI
accreditation. b Per authors, the maternity hospitals of the control group are similar to the maternity hospitals of the experimental group, and have the same indices of quality of the obstetrical
services, the same number of deliveries, and comparable levels of participation. c Per authors, routine preventive health care for infants includes a home visit between 0–2 wks, and consultations at 6 wks, and at 3, 4 5, 6, 7–8, 10 and 11–12 mos for vaccination,
anthropometric measurements, screening, and lactation counselling.
BF = breastfeeding; BFHI = Baby Friendly Hospital Initiative; HV = home visits; mos = months; N = number; NR = not reported; NRCT = nonrandomized controlled trial;
PRAMS = Pregnancy Risk Assessment Monitoring System; PROBIT = Promotion of Breastfeeding Intervention Trial; ROB = risk of bias; SD = standard deviation; UNICEF =
United Nations Children’s Fund; wks = weeks.

19
Results Of the 11 studies assessing BFHI interventions, 7 reported on rates of breastfeeding
initiation58, 59, 61, 62, 65-67 and the majority (9 studies) reported on rates of breastfeeding duration;
two studies reported only on breastfeeding initiation.61, 67 Studies varied as to whether measures
were specific to initiation of exclusive breastfeeding (versus any) and duration of any
breastfeeding (versus duration of exclusive breastfeeding); we describe measures of any and
exclusive breastfeeding initiation or duration below when they were reported by studies. Results
are summarized below by outcome (breastfeeding initiation then duration); and, for duration,
further grouped by comparison. We identified no eligible studies reporting on harms of BFHI.
Breastfeeding Initiation All seven studies reporting on rates of breastfeeding initiation compared women giving birth
in hospitals that were BFHI accredited or certified with hospitals that were not BFHI accredited
or certified (Table 5).58, 59, 61, 62, 65-67 Four studies reported on rates of any breastfeeding initiation
(exclusive or non-exclusive) only. Two of these (by the same author) focused on hospitals in the
United States enrolling women from similar time periods (1999-2009); one evaluated data from
five US states58 and the other focused on hospitals in one state (Maine).59 Estimated rates of
initiation were approximately 2.4 to 7.0 percent higher in BFHI accredited facilities than
nonaccredited facilities, however the differences were not statistically significant in either study
(Table 5).58, 59 Similarly, two studies set in the United Kingdom (one of which was limited to
Scotland67) found slightly higher rates of breastfeeding initiation in BFHI accredited hospitals
than certified or control hospitals (ranging from 0.5 to 7.4%) across groups however the
differences were not statistically significant (Table 5).66, 67
Three other studies set in various other country settings (Czech Republic,61 Russia,62 and
Taiwan65) found significantly increased rates of exclusive breastfeeding initiation among
mothers giving birth in BFHI certified or accredited hospitals compared with control hospitals.
The study in the Czech Republic found a higher risk of not being exclusively breastfed among
infants born at control hospitals compared with BFHI hospitals throughout the study period
(2000-2006), and the overall average rate of exclusively breastfed infants at hospital discharge
over 6 years born at BFHI hospitals was higher than that of the controls (97.53% vs. 90.32%;
p<0.001).61 The study set in Russia found significantly higher rates of exclusive breastfeeding at
discharge among mothers giving birth in BFHI hospitals compared with hospitals not yet
certified (88.9% vs. 32.6%; p<0.001).61 Finally, the study set in Taiwan reported on rates of both
exclusive and any breastfeeding at hospitalization by year (1999-2002); for both measures, rates
were significantly higher each year among BFHI certified hospitals than in the controls
(p<0.001).65

20
Table 5. BFHI studies reporting on breastfeeding initiation
Author, Year ROB
Intervention Comparison
Study Design N Sites N Participants
BF Initiation
Hawkins, 201458
Medium
G1: Mothers giving birth in a BFHI accredited facility G2: Mothers giving birth in a nonaccredited facility
Prospective cohort 32 birth facilities in 5 US states 25,327 women
No overall differences in rates of BF initiation between facilities that received BFHI accreditation and those without accreditation: (adjusted coefficienta=0.024; 95% CI, -0.00 to 0.51)
Hawkins, 201459
Medium
G1: Mothers giving birth in a BFHI-accredited facility G2: Mothers giving birth in a nonaccredited facility
Prospective cohort 10 birth facilities in 1 US state (Maine) 2,014 women
No effect of BFHI on BF initiation between facilities that were accredited and those that were nonaccredited: (adjusted coefficienta=0 0.070; 95% CI, -0.04 to 0.18; p=0.2)
Mydiliova, 200961
Medium
G1: Mothers giving birth in a BFHI hospital G2: Mothers giving birth in a non-BFHI hospital
Prospective cohort 112 hospitals 660,355 women
Risk of not being exclusively BF was higher in non-BFHI than in BFHI hospitals (by year): Year: RR (95% CI) 2000: 1.09 (1.08 to 1.10) 2004: 1.54 (1.48 to 1.61) 2006: 1.32 (1.27 to 1.37) Avg. rate of exclusively BF infants for 2000-2006, (%): G1: 90.32 G2: 87.53 p<0.001
Abolyan, 200662
Medium
G1: Mothers giving birth in BFHI-certified hospitals G2: Mothers giving birth in “not-yet Baby Friendly” hospitals
Prospective cohort 741 women 8 sites
Exclusive breastfeeding at discharge, % (N) G1: 88.9 (383) G2: 32.6 (358) p<0.0001
Gau, 200465
High
G1: Mothers giving birth in BFHI-certified hospitals G2: Mothers giving birth in control hospitals
Prospective cohort 12 sites 4,614 mothers
Rates of exclusive BF during hospitalization by year, G1 vs. G2, % (SD) 1999: 0.30 (0.24) vs. 0.24 (0.006) 2000: 0.34 (0.24) vs. 0.22 (0.007) 2001: 0.46 (0.21) vs. 0.23 (0.05) 2002: 0.50 (0.16) vs. 0.23 (0.25) p<0.001 for all years Total BF rate (any breastfeeding): 1999: 0.92 (0.03) vs. 0.82 (0.08) 2000: 0.94 (0.03) vs. 0.82 (0.04) 2001: 0.95 (0.03) vs. 0.94 (0.07) 2002: 0.95 (0.04) vs. 0.95 (0.02) p<0.001 for all years
Bartington, 200666
Medium
G1: Birth in a BFHI accredited maternity unit G2: Birth in BFHI certified unit G3: Birth in unit with neither award
Prospective cohort 17,359 women
Breastfeeding initiation (full sample), % G1: 71.3 G2: 70.8 G3: 69.5 RRb (G1 vs G3): 1.10 (1.05 to 1.15) RRb (G2 vs G3): 1.02 (0.99 to 1.05)

21
Table 5. BFHI studies reporting on breastfeeding initiation (continued)
Author, Year ROB
Intervention Comparison
Study Design N Sites N Participants
BF Initiation
Broadfoot, 200567
Medium
G1: Birth in hospitals with UK BFHI standard award G2: Birth in hospitals with UK BFHI certificate of commitment G3: Hospitals with no BFHI accreditation
Prospective cohort 33 sites 445,623
Initiation of any breastfeeding at 7 days (%) G1: 49.4 G2: 43.4 G3: 42.0 ORc (G1 vs G3); 1.28 (1.24 to 1.31) ORc (G2 vs G3): 1.04 (1.02 to 1.06)
a All models include a birth fixed effect and an interaction between year and whether a birth facility received accreditation.
b RRs adjusted for ward type, socioeconomic status, ethnicity, academic qualifications, maternal age, parity, and lone parent
status.
c OR adjusted for Carstairs deprivation category, mother’s age, number of births in hospital, and year of birth.
Avg.= average; BF = breastfeeding; BFHI = Baby Friendly Hospital Initiative; G = group; N = number; NR = not reported;
NRCT = nonrandomized controlled trial; OR = odds ratio; ROB = risk of bias; RR = risk ratio; SD = standard deviation; UK =
United Kingdom; US = United States.
Breastfeeding Duration Nine studies reported on breastfeeding duration (Table 6); of these, seven compared women
giving birth in BFHI certified or accredited hospitals and control hospitals,56, 58, 62, 64-66, 71 and two
studies made additional comparisons related to BFHI implementation (aside from comparing
facilities with and without BFHI status).60, 63
Of the seven studies comparing hospitals with and without a BFHI status, one was an RCT
(PROBIT),72 and six were observational studies (one single group pre-post study,64 and the rest
were prospective cohort studies). In the PROBIT RCT, women giving birth at intervention
hospitals had higher rates of exclusive breastfeeding at 3 months postpartum (43% vs. 6%;
p<0.001) and 6 months (7.9% vs. 0.6%; p=0.01).56 The authors also report odds of having been
weaned (from any breastfeeding, exclusive or nonexclusive) at 3, 6, 9, and 12 months (Table 6);
women in the intervention group had lower odds of weaning at each time point compared with
controls.56
Across six observational studies, results for breastfeeding duration were mostly consistent in
finding benefit, however results were imprecise.58, 62, 64-66, 71 Two studies set in the United States
found no difference between intervention and control hospitals in rates of any breastfeeding or
exclusive breastfeeding for at least 4 weeks after delivery (Table 6);58, 59 estimated rates of
breastfeeding duration at or beyond 4 weeks was higher in BFHI hospitals by 0.5 to 6.8 percent,
however, differences were not statistically significant. One study evaluating Scottish hospitals
found no significant difference between women giving birth in BFHI accredited, BFHI certified
hospitals and control hospitals in rates of any breastfeeding at 1 month; rates were slightly lower
at BFHI accredited hospitals (44.6%) than hospitals that were certified or had neither status
(49.9% vs. 49.5%, respectively).66 One cohort study enrolling women from hospitals in Taiwan
compared rate of any and exclusive breastfeeding at 1 and 2 months postdischarge by year (1999
through 2002); for each year, rates of any and exclusive breastfeeding were higher in BFHI
hospitals than controls (p<0.001).65 One study set in Russia found rates of any breastfeeding at 6
to 12 months among women giving birth in BFHI hospitals than non-BFHI certified hospitals
over a 4 year period, however authors do not clearly report the sample size and whether
differences are statistically significant (% change from baseline: 10.5 v. 3.7; p-value NR).62
Finally, a single-group pre-post study set in Croatia found higher rates of any

22
Table 6. BFHI studies reporting on breastfeeding duration and exclusivity
Author, Year ROB
Intervention Comparison
Study Design N Sites N Participants
Breastfeeding Duration (Any, Nonexclusive Plus Exclusive)
Exclusive Breastfeeding Duration
Kramer 2001,56
PROBIT Medium
G1: Intervention modeled on BFHI G2: Usual maternity care
Cluster RCT 31 maternity hospitals 17,046 mother/infant pairs
Any BF (% of women), ORa (95% CI) for having been weaned: 3 mos: G1: 72.7 vs. G2: 60.0 OR (95% CI): 0.52 0.40 to 0.69 6 mos: G1: 49.8 vs. G2: 36.1 OR (95% CI): 0.52 (0.39 to 0.71) 9 mos: G1: 36.1 vs. G2: 24.4 OR (95% CI): 0.51 (0.36-0.73) 12 mos: G1: 19.7 vs. G2: 11.4 OR (95% CI): 0.47 (0.32 to 0.69)
Prevalence of exclusive BF (% of women), as defined by WHO: 3 mos: G1: 43.3 G2: 6.4 p<0.001 6 mos: G1: 7.9 G2: 0.6 p=0.01
Hawkins, 201458
Medium
G1: Mothers giving birth in a BFHI accredited facility G2: Mothers giving birth in a non-accredited facility
Prospective cohort 32 birth facilities in 5 US states 25,327 women
Any BF for ≥4 wks after delivery: coefficientb=0.006 (-0.01 to 0.033); p=0.6
Exclusive BF for ≥4 wks after delivery: coefficientb=0.012 (-0.01 to 0.03); p=0.3
Hawkins, 201459
Medium
G1: Mothers giving birth in a BFHI accredited facility G2: Mothers giving birth in a non-accredited facility
Prospective cohort 10 birth facilities in 1 US state (Maine) 2,014 women
Any BF for ≥4 wks after delivery: coefficientb=0.068b (-0.02 to 0.08); p=0.2
Exclusive BF for ≥4 wks after delivery: coefficientb=0.025b (-0.07 to 0.12); p=0.6
Tarrant, 200160
Medium
G1: Mothers giving birth in hospitals with 6 or more BFHI steps/practices G2: Mothers giving birth in hospitals with <6 BFHI steps/practices
Prospective cohort 4 hospitals 1,417 mother/ infant pairs
Association between exposure to number of BFHI practices and infant being weaned in ≤8 wks, No. BFHI practices: ORc (95% CI): 0-1: 3.13 (1.41 to 6.95) 2: 2.03 (1.05 to 3.94) 3: 2.31 (1.21 to 4.42) 4: 2.08 (1.08 to 4.00) 5: 1.45 (0.70 to 2.99) 6: 1.00 (referent)
NR
Abolyan, 200662
Medium
G1: Birth in BFHI certified hospitals G2: Birth at “not-yet Baby Friendly” hospitals
Prospective cohort 741 women (survey); N for BF rates at 6-12 months NR 8 sites
Increase in BF rates (%) at 6-12 mos among infants born during implementation of BFHI Baseline (1999-2003): G1: 20.7 to 31.2 (+10.5%) G2: 15.6 to 19.3 (+3.7%)
NR

23
Table 6. BFHI studies reporting on breastfeeding duration and exclusivity (continued)
Author, Year ROB
Intervention Comparison
Study Design N Sites N Participants
Breastfeeding Duration (Any, Nonexclusive Plus Exclusive)
Exclusive Breastfeeding Duration
Coutinho, 200563
Low
G1: BFHI staff training + 10 HVs providing BF support and promotion G2: BFHI staff training alone
RCT 2 sites 350 women
Mean rate of any BF 10-180 days after discharge, % (N) G1: 78 (174) G2: 62 (175) p<0.001
Mean rate of exclusive BF 10-180 days after discharge, % (N) G1: 45 (174) G2: 13 (175) p<0.0001
Bosnjak, 2004 64
High
G1: Implementa-tion of BFHI (1994-1998) and, later, establishment of community-based BF support groups (1999-2000) G2: Period before intervention implementa-tion (1990-1993)
Single-group, pre-post study 14 primary care sites 7,414 infants
Increase in BF prevalence compared with 1990-1993 (preintervention): BFHI implementation (1994-1998), G2 vs. G1: 1 mo: 68% vs. 87% 3 mos: 30% vs. 54% 6 mos: 11.5% vs. 28% 11-12 mos: 2% vs. 3.5% p<0.05 Implementation of BF support groups (1999–2000), G2 vs. G1: 1 mo: 68% vs. 87% 3 mos: 30% vs. 66% 6 mos: 11.5% vs. 49% 11-12 mos: 2% vs. 23 p<0.05
NR
Gau, 200465
High
G1: Mothers giving birth in BFHI-certified hospitals G2: Mothers giving birth in control hospitals
Prospective cohort 12 sites 4614 mothers
Total BF rate (any BF), by year, G1 vs. G2, % (SD) 1 mo 1999: 0.36 (0.05) vs. 0.30 (0.05) 2000: 0.35 (0.01) vs. 0.30 (0.01) 2001: 0.38 (0.02) vs. 0.30 (0.05) 2002: 0.44 (0.05) vs. 0.34 (0.02) p<0.001 for all comparisons 2 mos 1999: 0.19 (0.03) vs. 0.14 (0.02) 2000: 0.11 (0.03) vs. 0.07 (0.02) 2001: 0.16 (0.05) vs. 0.08 (0.02) 2002: 0.21 (0.05) vs. 0.13 (0.02) p<0.001 for all comparisons
Exclusive BF rate, by year, G1 vs. G2, % (SD): 1 mo 1999: 0.16 (0.04) vs. 0.06 (0.02) 2000: 0.15 (0.03) vs. 0.08 (0.02) 2001: 0.18 (0.03) vs. 0.06 (0.01) 2002: 0.23 (0.05) vs. 0.03 (0.02) p<0.001 for all comparisons 2 mos 1999: 0.09(0.03) vs. 0.03 (0.02) 2000: 0.06(0.02) vs. 0.05 (0.02) 2001: 0.08 (0.03) vs.0.03 (0.004) 2002: 0.12 (0.04) vs. 0.0 (0.00) p<0.001 for all comparisons

24
Table 6. BFHI studies reporting on breastfeeding duration and exclusivity (continued)
Author, Year ROB
Intervention Comparison
Study Design N Sites N Participants
Breastfeeding Duration (Any, Nonexclusive Plus Exclusive)
Exclusive Breastfeeding Duration
Bartington 200666
Medium
G1: Birth in a BFHI accredited maternity unit G2: Birth in BFHI certified unit G3: Birth in unit with neither award
Prospective cohort 17,359 women
Any BF at 1 mo, % G1: 44.6 G2: 49.9 G3: 49.5 RR (G1 vs G3): 0.96 (0.84 to 1.09) RR (G2 vs G3): 0.96 (0.91 to 1.01)
NR
a All ORs adjusted for birth weight, maternal age, and previous breastfeeding history.
b All models include a birth fixed effect and an interaction between year and whether a birth facility received accreditation.
c Adjusted for Baby-Friendly hospital practices, maternal age, maternal education, household income, emergency cesarean
section, return to work, whether mother was breastfed as a child, mother’s previous breastfeeding experience, husband’s feeding
preference.
d Adjusted for cluster effects, breastfeeding at hospital discharge, maternal education, age, parity, and smoking habits.
Avg.= average; BF = breastfeeding; BFHI = Baby Friendly Hospital Initiative; CI = confidence interval; G = group; mo(s) =
month(s); N = number; NR = not reported; NRCT = nonrandomized controlled trial; OR = odds ratio; PROBIT = Promotion of
Breastfeeding Intervention Trial; ROB = risk of bias; RR = risk ratio; SD = standard deviation; UK = United Kingdom; US =
United States; wks = weeks; WHO = World Health Organization.
breastfeeding among women giving birth in hospitals after the implementation of BFHI (plus
additional community-based BF support groups) than before implementation at 1, 3, and 6, and
11-12 months postpartum (p<0.05).64
Two studies made additional comparisons related to BFHI implementation (aside from
comparing facilities with and without BFHI status).60, 63 One study set in Hong Kong assessed
breastfeeding rates by degree of BFHI implementation.60 Women giving birth in hospitals
practicing four or fewer BFHI steps had higher odds of weaning at or before 8 weeks postpartum
compared with women giving birth in facilities practicing six BFHI steps (Table 6).60 Finally,
one RCT set in Brazil compared BFHI staff training plus 10 postpartum home visits providing
breastfeeding support with BFHI staff training alone; women receiving home visits had higher
rates of any breastfeeding over 6 months post discharge (78% vs. 62%; p=0.001) and higher rates
of exclusive breastfeeding (45% vs. 13%; p<0.001).63
Other (Non-BFHI) Health Care System-Based Interventions
Characteristics Twelve included studies (described in 13 publications) assessing the effectiveness of other
health care system-based interventions (non-BFHI interventions) were included (Table 7).70, 71, 73-
83 All 11 studies enrolled women from routine maternity care settings (prenatal clinics, maternity
hospitals, or postpartum care settings). Studies were conducted in diverse country settings
including the United States (2 studies),76, 83 Canada (1 study),81 Sri Lanka (1 study),78 Brazil (1
study),82 China (1 study),75 and various European countries (5 studies).71, 74, 77, 79, 80 Seven
included studies were randomized controlled trials (RCTs), 6 were cluster RCTs, 4 were
nonrandomized controlled trials,70, 71, 76, 81 and one was a single-group pre-post study.83 Most
studies enrolled women prior to 2009; the majority (8 studies) enrolled women during the 2000s,
and 3 studies enrolled women during the 1990s.81-83

25
In terms of populations, two studies were limited to primiparous women only,74, 75 and others
included primiparous or multiparous women. Of the ten studies enrolling both primiparous and
multiparous women, two reported on the percent of women who had previously breastfed (39%
to 52%, across groups).70, 71 Some studies had other inclusion criteria such as limiting to women
who gave birth to singleton infants only (5studies).70, 71, 74, 78, 79 Three studies did not report on
the age of enrolled mothers;76, 79, 81 across the remaining nine studies, the mean age of study
samples ranged from 27 to 34 years. Three studies reported on cesarean births, with rates ranging
from 0 percent (study conducted in 17 rural Canadian hospitals), to a minority of women in
studies conducted in Finland (12% to 17%),71 and Sweden (14% to 18%)74; one study
(evaluating maternity length of stay policies in the United States) excluded mothers who had a
cesarean delivery.83
Studies assessed the effectiveness of diverse interventions. Five studies assessed the
effectiveness of education and training for healthcare professionals only (with no mention of
additional individual-level services offered to women).74, 76, 78, 81, 82 Of these, one targeted
training to midwives and postnatal nurses, in Swedish municipalities,74 one focused on U.S.
residency programs (pediatrics, OBGYN, and family medicine),76 and three focused on hospital
staff (one focused on nursing staff only,81 and two included nurses, midwives and physicians78,
82). Length of training and content varied across studies and are described in Table 7.
Four studies assessed a health-system intervention that combined education (or skills
training) to providers with expanded breastfeeding support services.71, 77, 79, 80 One study
provided access to long-term intensified counseling to breastfeeding and parental support (via the
internet and in person) during the pre- and postnatal period.71 A study set in Scotland randomized
14 general practices to an expanded breastfeeding group policy (to increase the number of
breastfeeding groups and access to groups) versus usual care.77 A study set in The Netherlands
randomized health centers to health care provider training to deliver a breastfeeding promotion
and support program (counseling, identification of breastfeeding problems, and free access to
lactation consultants).80 The last study evaluated breastfeeding education to health visitors with
expanded home visits (1 to 3 within 5 weeks of birth) to support breastfeeding.79
Three studies assessed changes in health service delivery or policies that relate to
breastfeeding. One study set in a Chinese hospital randomized primiparous women to two
different types of perinatal nursing care: continuous primary nursing care (the same nurse
provided care during prenatal appointments, during admission, and 2 weeks postdischarge to
both mothers and infants), or usual task centered nursing (women and infants received the same
care, but different nurses carried out different tasks).75 The second study was a single group pre-
post study assessing the effect of changes in maternity length of stay policies in one U.S. state
(Massachusetts) among women enrolled in a large health maintenance organization.83 The third
study assessed the benefit of implementing an adapted BFHI intervention into outpatient
maternal and child health centers (e.g., developing a breastfeeding policy, staff training, outcome
assessment and quality improvement initiatives).70
Ten studies were rated as medium risk of bias (ROB) and 2 studies as high ROB.71, 81
Common sources of bias included selection bias, high attrition, and baseline differences between
groups that were not controlled for in the analyses.

26
Table 7. Characteristics of studies evaluating non-BFHI health care system-based interventions
Author, Year ROB
Study Design N Sites N Participants
Country Year(s) of Enrollment
Inclusion Criteria
Intervention Description
Comparator(s) Age, Mean (SD)
% Non-white
% Primiparous % Previously BF
% Cesarean Birth
Baerug, 201670
Medium
NRCT 54 municipalities 3948 mothers
Norway 2009-2012
Women with a singleton birth >2,000g
Implementing the BFHI into routine antenatal and child care services at the community level (staff training and demonstration of practical skills)
Routine antenatal and preventive health carec
% by age category: 16-24: 15 25-29: 34 30-34: 32 35-44: 19
NR 44 NR
NR
Ekstrom, 201473;
Ekstrom, 201274
Medium
Cluster RCT 10 municipalities 540 women
Sweden 2000-2002
Primiparous healthy mothers of singleton full-term infants receiving care from health professionals in the intervention or control municipalities
Process-oriented training in supportive BF counseling for midwives and postnatal nurses (7 days of lectures)
Usual care, women were sampled from clusters not receiving the intervention at two time points, before the intervention and at the same time as the intervention sample
27 (NR) NR 100 NA
14-18
Feldman-Winter, 201076
Medium
NRCT 13 residency programs (417 residents) N women NR
United States 2006-2008
Residency programs (pediatrics, OBGYN and family medicine) with low or unknown BF rates at hospitals lacking Baby Friendly certification Medical records of women giving birth at included sites were randomly sampled at study initiation and 6m later
Targeted BF curriculum for residents in pediatrics, family medicine, and OBGYN, including lectures, skills workshops, discussions, participation in newborn nursery rotation assisting mothers with BF, and community outreach and care coordination (field trip or presentation to local BF support group)
No curriculum (usual care)
NRa NR NR NR
NR

27
Table 7. Characteristics of studies evaluating non-BFHI health care system-based interventions (continued)
Author, Year Study Name ROB
Study Design N Sites N Participants
Country Year(s) of Enrollment
Inclusion Criteria
Intervention Description
Comparator(s) Age, Mean (SD)
% non-white
% Primiparous % Previously BF
% Cesarean Birth
Hannula, 201471
High
NRCT 3 maternity hospitals 705 mothers
Finland 2007-2008
Mothers giving birth to singleton infants at included maternity hospitals
Access to long-term intensified counseling on BF and parenthood support (via Web pages), in maternity hospital, and after childbirth (20th week gestation to 1 year)
Normal counseling and support at maternity health careb
31 (NR NR 47-62 39-52
12-17
Hoddinott, 200977
Medium
Cluster RCT 14 general practices (‘localities’) 18,603
Scotland 2002
Clusters: general practices that routinely collected BF data through a national surveillance program Women: no specific criteria other than women attending participating practices
Adoption of a BF group policy: localities were asked to double the amount of BF group activity, set up a minimum of 2 new groups and ensure all centers had access to a group; individual BF groups were to be offered weekly to women only and at least 50% of the group meeting was to be social and interactive
Practices without a new BF group policyc
28-29 NR NR NR
NR

28
Table 7. Characteristics of studies evaluating non-BFHI health care system-based interventions (continued)
Author, Year Study Name ROB
Study Design N Sites N Participants
Country Year(s) of Enrollment
Inclusion Criteria
Intervention Description
Comparator(s) Age, Mean (SD)
% non-white
% Primiparous % Previously BF
% Cesarean Birth
Kools, 200580
Medium
Cluster RCT 10 maternity and child health centers 781 mothers
Netherlands 200-2002
Women who gave birth to infants >2,000g
Health care provider training to deliver a BF promotion and support program (health counseling, early signaling of BF problems, continuity of care, and free access to lactation consultancy)
Usual care NR; % by age group <25 yrs: 8-10 25 to 30 yrs: 44-45
≧31 yrs:
46-47
NR 55-56 NR (66-71% intended to BF)
NR
Kronborg, 200779
Medium
Cluster RCT 22 municipalities 1,595 mothers
Denmark 2004
Mothers living in eligible municipalities who gave birth to a single full-term child
Health visitors received an 18-h course (related to providing BF support and counseling); 1 to 3 home visits were provided within 5 wks of birth, and addressed BF techniques, education, maternal and infant care, and need for support
Usual care (health visitor service, including one or more nonstandardized home visits within 5 wks of birth
NR NR NR NR
NR

29
Table 7. Characteristics of studies evaluating non-BFHI health care system-based interventions (continued)
Author, Year Study Name ROB
Study Design N Sites N Participants
Country Year(s) of Enrollment
Inclusion Criteria
Intervention Description
Comparator(s) Age, Mean (SD)
% non-white
% Primiparous % Previously BF
% Cesarean Birth
Madden, 200383
Medium
Single-group, pre-post 14 health centers 20,366 mother-infant pairs
United States 1990-1998
Mother-infant pairs identified from HMOd medical records who had given birth during 7.5 yrs before and after two LOS policy changes; excluded pairs whose deliveries involved cesarean sections, >4 nights’ LOS, or unequal mother and infant LOS.
Introduction of a new HMO protocol of 1 postpartum overnight hospitalization followed by a nurse home visit for normal vaginal deliveries (1994 to 1996), then MAe state 48h minimum coverage mandate (effective 1996)
Mothers giving birth during a 4- year period before the first policy change
NR; % by age group: <22: 4.5 22-29: 31.2 30-34: 39.2 35+: 25.1
31 45 NR
NA (excluded
Martens, 200081
High
NRCT 2 rural hospitals 75 births
Canada 1997
Mothers giving birth at participating hospitals
Mandated 1.5h hospital staff BF education session for all nursing staff; optional tutorial related to BF education, support and hospital policy completed individually.
Usual care
NR NR; 27 to 76% were First Nations clients
9.8-23.5 NR
0

30
Table 7. Characteristics of studies evaluating non-BFHI health care system-based interventions (continued)
Author, Year Study Name ROB
Study Design N Sites N Participants
Country Year(s) of Enrollment
Inclusion Criteria
Intervention Description
Comparator(s) Age, Mean (SD)
% non-white
% Primiparous % Previously BF
% Cesarean Birth
Senarath, 200778
Medium
Cluster RCT 5 hospitals 892 women
Sri Lanka 2003-2004
Healthy mother-newborn pairs (singleton births only) who received care from the 5 study hospitals
Training program (4-days) for hospital obstetric service staff (midwives, nurses and doctors) to increase knowledge and essential newborn care skills; approximately 5h spent on BF topics
Usual care (no additional training)
NR; % by age group:
≦19: 8-11
20-34: 80-87
≧ 35: 5-9
100 (Sri Lankan ethnici-ties)
36-46 NR
NR
Taddei, 200082
Medium
Cluster RCT 8 hospitals 970 infants
Brazil 1992
Hospitals located near Sao Paulo, Brazil with at least 2 births per day in the maternity ward; no previous exposure to a similar intervention
3-week intensive BF promotion program designed to train multidisciplinary teams in lactation management (pediatricians, obstetricians, and nurses)
No exposure to staff trainingf
26-29 NR 34-37 NR (90-96% intended to BF)
NR

31
Table 7. Characteristics of studies evaluating non-BFHI health care system-based interventions (continued)
Author, Year Study Name ROB
Study Design N Sites N Participants
Country Year(s) of Enrollment
Inclusion Criteria
Intervention Description
Comparator(s) Age, Mean (SD)
% non-white
% Primiparous % Previously BF
% Cesarean Birth
Wan, 201175
Medium
RCT 1 hospital (2 obstetric units) 470 pregnant women
China 2008-2009
Pregnant women ≥20 yrs having their first delivery
Continuous Primary Nursing Care: individualized continuous holistic primary nursing care starting 8 wks prior to delivery (outpatient setting), during admission and 2 wks post discharge (to mother and infants) by the same nurse
Task Centered Nursing Care: women received the same care for the same duration, but task centered (not individualized), and by different nurses who carried out different services
27-28 NR 100 NA
NR
a All characteristics provided in study are for the residents who were exposed to the educational curriculum, not for the women/infants whose BF rates were being measured. b Described as personal advice from midwives and nurses according to mother’s wishes and a possibility to watch a BF video on the ward); no additional staff training and the
families did not have access to more individualized BF support. c At baseline, 10 BF groups were offered in the intervention and control localities. d The HMO included 14 health centers of the Harvard Vanguard Medical Associates in eastern Massachusetts. e The Massachusetts law established a “minimum stay” of 48 hours, with shorter stays permitted if a mother gave consent and was offered a home visit. A federal law effective
January 1998 extended the 48-hour coverage mandate to other states and health plans but did not change the policy environment for the study population. f At the time of the study, few Brazilian hospitals had rooming-in and around 30% of all deliveries were via cesarean section.
BF = breastfeeding; BFHI = Baby-Friendly Hospital Initiative; HMO = health maintenance organization; LOS = length of stay; MA = Massachusetts; NA = not applicable; NR =
not reported; NRCT = nonrandomized controlled trial; OBGYN = obstetrician/gynecologist; RCT = randomized controlled trial; ROB = risk of bias; SD = standard deviation; wks
= weeks.

32
Results Of the 11 studies assessing non-BFHI health care system interventions, 9 reported on rates of
breastfeeding initiation and two reported only on rates of breastfeeding duration79, 82 (one of
these followed only women who had initiated breastfeeding).79 Results are summarized below by
outcome (initiation versus duration) and are also grouped based on intervention type. No
included studies reported on potential harms of interventions.
Breastfeeding Initiation Table 8 shows results of the nine studies reporting on breastfeeding initiation. Studies
generally measured breastfeeding initiation during a maternity stay or at discharge. Three studies
assessed the initiation of any breastfeeding (both exclusive and nonexclusive) only,74, 77, 83 two
assessed the initiation of exclusive breastfeeding only,71, 75 and the others reported both on both
measures.
Four studies assessing the effectiveness of education and training for health care
professionals only (with no mention of additional individual-level services offered to women)
reported on breastfeeding initiation; overall, studies found no difference between intervention
and control groups.74, 76, 78, 81 Two RCTs found no differences between intervention and control
groups on rates of breastfeeding initiation following health care staff training;74, 78 however, in
both studies, rates of breastfeeding initiation at intervention and control were high both before
and after implementation of the intervention (>97%). One NRCT assessed the effectiveness of a
residency breastfeeding curriculum; at intervention sites, initiation of exclusive breastfeeding
increased (pre-post % change, 7.5; p=0.002), however, control sites also increased breastfeeding
rates (pre-post % change, 3.0; p=0.239) and authors do not note whether differences between
intervention and control programs are statistically significant.76 The NRCT assessing nursing
staff breastfeeding education at two Canadian hospitals (rated high ROB), found no difference
between intervention and control hospitals for rates of any breastfeeding initiation.81
Three studies assessed a health-system intervention that combined education (or skills
training) to providers with expanded breastfeeding support services, and reported on
breastfeeding initiation rates.71, 77, 80 Of these studies, two did not find benefit. One cluster RCT
assessing adoption of a policy to provide breastfeeding groups for pregnancy and postpartum
women found no difference in breastfeeding initiation rates at intervention and control practices
(mean difference between groups, -0.009; 95% confidence interval [CI], -0.045 to 0.027).77 One
cluster RCT assessing an expanded breastfeeding promotion and support program found no
difference between intervention and control sites in rates of exclusive breastfeeding at birth (OR,
0.80; 95% CI, 0.57 to 1.11) or initiation of any breastfeeding at birth (odds ratio [OR], 0.84; 95%
CI, 0.61 to 1.16).80 The third study (rated high ROB) found increased rates of exclusive
breastfeeding initiation at hospitals implementing the intensified perinatal family breastfeeding
support intervention compared with controls (75 vs. 66%; p=0.0099).71
Two studies assessing changes in health service delivery or policies that relate to
breastfeeding reported on initiation rates, with inconsistent results.75, 83 One study was a single-
group pre-post study assessing the relationship between changes in maternity length of stay
policies among women belonging to one Massachusetts health maintenance organization
(HMO); the study period spanned two separate interventions: (1) the introduction of a new
protocol of one postpartum overnight hospitalization for women who had normal vaginal
deliveries (followed by a nurse home visit), and (2) Massachusetts state law mandating minimum

33
48-hour coverage legislation.83 Breastfeeding initiation rates increased an estimated 0.4 percent
per quarter over time with no statistically significant changes at either of the two policy
Table 8. Non-BFHI health system interventions reporting on breastfeeding initiation
Author, Year ROB
Intervention Comparison
Study Design N Sites N Participants
Breastfeeding Initiation Outcome Results
Ekstrom, 201473;
Ekstrom, 201274
Medium
G1: BF training program for health care professionals G2: Usual care (control group A)a G3: Usual care (control group B)
Cluster RCT 10 municipalities 565 women
Assessed via questionnaire (3 days postpartum), % initiated BF (N total): G1: 100 (172) G2: 97 (148) G3: 97 (160) G1 vs. G2: p=0.863 G1 vs. G3: p=0.838
Feldman-Winter, 201076
Medium
G1: Residency BF curriculum G2: Usual care
NRCT 13 sites (residency programs) N women NR
Initiation of exclusive BF, % (n/N total): G1 pre: 15.5 (78/504) G1 post: 23.1 (114/493) pre-post % change: 7.5; p=0.002 G2 pre: 27.5 (193/701) G2 post: 30.5 (214/701) pre-post % change: 3.0; p=0.239 Initiation of any BF (% (n/N total): G1 pre: 76.0 (383/504) G1 post: 80.7 (398/493) pre-post % change: 4.7; p=0.071 G2 pre: 64.8 (454/701) G2 post: 66.6 (467/701) pre-post % change: 1.8; p=0.500
Hannula, 201471
High
G1: Intensified perinatal family BF support G2: Usual care
NRCT 3 maternity hospitals 705 mothers
Exclusive BF at hospital discharge, % (N): G1: 76 (431) G2: 66 (274) p=0.0099
Hoddinott, 200977
Medium
G1: Adoption of a policy to provide BF groups for pregnant and BF women G2: Usual care (no new policy)
Cluster RCT 14 general practices (“localities“) 18,603b
Initiation of any BF at birth, mean difference (95% CI) between intervention and control groups at postintervention (adj. for preintervention rate): -0.009 (-0.045 to 0.027); p=0.58
Kools, 200580
Medium
G1: BF promotion and support program G2: Usual care
Cluster RCT 10 maternity and child health centers 781 mothers
Exclusive BF at birth, % (N): G1: 61 (371) G2: 67 (330) OR (95% CI): 0.80 (0.57 to 1.11) Total BF at birth (exclusive or nonexclusive), % (N): G1: 68 (371) G2: 72 (330) OR (95% CI): 0.84 (0.61 to 1.16)

34
Table 8. Non-BFHI health system interventions reporting on breastfeeding initiation (continued)
Author, Year ROB
Intervention Comparison
Study Design N Sites N Participants
Breastfeeding Initiation Outcome Results
Madden, 200383
Medium
Changes in maternity length of stay policy (pre-post)c
Single-group, pre-post 14 health centers 20,366 births
BF initiation rates increased an estimated 0.4% per quarter over time: 70.1% in the 4th quarter of 1990 to 81.9% in the 1st quarter of 1998 (p<0.0001); no statistically significant changes in BF rates were found at either of the 17 policy intervention points. Subgroups: no reductions in BF rates were associated with the changes in LOS policies for the following subgroups: maternal age, primiparous status, Medicaid enrollment, living in a low-income neighborhood, black race, Asian race, and Hispanic nonblack race.
Martens, 200081
High
G1: Nursing staff BF education G2: Usual care
NRCT 2 rural hospitals 75 births
Any BF initiation, % (N)d: G1 pre: 62 (21) G1 post: 65 (20) G2 pre: 74 (74) G2 post: 64 (14) p>0.05 for pre-post change in both groups
Senarath, 200778
Medium
G1: Obstetric staff training on essential newborn care G2: Usual care
Cluster RCT 5 hospitals 892 women
Exclusive BF at discharge (mothers self-report), % (N): G1 pre: 97.8 (233) G1 post 97.3 (233) G2 pre: 99.6 (233) G2 post: 98.7 (223) Difference in pre-post change between intervention and control groups NS
Wan, 201175
Medium
G1: Continuous primary nursing care G2: Task-centered nursing care
RCT 1 hospital (2 obstetric units) 470 pregnant women
Exclusive BF during hospitalization, % (N): G1: 98.69 (230) G2: 87.92 (240) p=0.001
a Women were sampled from clusters not receiving the intervention at two time points, before the intervention (control group A)
and at the same time as the intervention sample (control group B). b The population refers to eligible birth records in all randomized clusters with valid feeding data considered in ITT analysis. c This study period spanned the 17 interventions of interest: (1) the introduction of a new HMO protocol of one postpartum
overnight hospitalization followed by a nurse home visit for normal vaginal deliveries, then (2) Massachusetts state minimum
coverage legislation. d Rates of any BF initiation obtained from chart audits before and after intervention (at both intervention and control hospital).
All breastfed babies born at the control site from June 1997 to the end of September were supplemented with additional fluids.
BF = breastfeeding; BFHI = Baby-Friendly Health Initiative; CI = confidence interval; G = group; HMO = health maintenance
organization; ITT = intent-to-treat LOS = length of stay; N = sample size; NR = not reported: NRCT = nonrandomized controlled
trial; NS = not sufficient; RCT = randomized controlled trial.
intervention time points.83 The RCT comparing continuous primary nursing care with usual care
(task oriented nursing) among Chinese women found higher rates of exclusive breastfeeding
during hospitalization among the intervention group than in the controls (99% vs. 88%;
p=0.001).75
Breastfeeding Duration Table 9 shows results of the eight non-BFHI health care system intervention studies reporting
on breastfeeding duration. Two measured duration of exclusive breastfeeding only,75, 79 two

35
measured the duration of any breastfeeding only,77, 83 and four measured both exclusive and
nonexclusive breastfeeding duration.
Table 9. Non-BFHI health system interventions reporting on breastfeeding duration
Author, Year ROB
Intervention Comparison
Study Design N Sites N Participants
Breastfeeding Duration (Any, nonexclusive plus exclusive)
Exclusive Breastfeeding Duration
Baerug, 201670
Medium
G1: Implementing the BFHI into routine antenatal and child care services at the community level G2: Usual care
NRCT 54 municipalities 3,948 mothers
Any BF, % (N) 6 mos G1: 72 (969) G2: 68 (898) ORd: 1.24 (0.99-1.54); p=0.06 12 mos G1: 28 (224/807) G2: 27 (204/732) OR NR; p=0.43
Exclusive BF, % (N) 5 mos G1: 41 (971) G2: 36 (900) OR: 1.39 (1.09 to 1.77); p=0.018 6 mos G1: 18 (174/971) G2: 14 (127/900) OR: 1.33 (1.03 to 1.72); p=0.03
Ekstrom, 201473;
Ekstrom, 201274
Medium
G1: BF training program for health care professionals G2: Usual care (control group A)a G3: Usual care (control group B)
Cluster RCT Antenatal and child health centers in 10 municipalities 565 women
Total BF durationb (exclusive plus partial BF) assessed at 9 mos, mean mos (SD) G1: 7.5 (4.7) G2: 7.1 (4.6) G3: 7.0 (4.5) p=NS per authors
Duration of exclusiveb BF (mos), mean (SD) G1: 3.9 (2.2) G2: 3.2 (1.7) G3: 3.5 (2.0) G1 vs. G2= p=0.02 G1 vs. G3= NS per authors
Feldman-Winter, 201076
Medium
G1: Residency BF curriculum G2: Usual care
NRCT 13 sitesc (residency programs)
Any BF at 6 mos, % (N): G1 pre: 25.3 (300) G1 post: 28.7 (300) pre-post change: 3.4; p=0.291 G2 pre: 26.9 (499) G2 post: 25.3 (550) pre-post % change: -1.6; p=0.574
Exclusive BF at 6 mos, % (N): G1 pre: 2.3 (300) G1 post: 9.0 (300) pre-post % change: 6.7; p=0.001 G2 pre: 11.6 (499) G2 post: 6.2 (550) pre-post % change: -5.4; p=0.002
Hoddinott, 200977
Medium
G1: Adoption of a policy to provide BF groups for pregnant and BF women G2: Usual care (no new policy)
Cluster RCT 14 general practices (‘localities’) 18,603
Any BF at 6-8 wks postpartum, mean difference (95% CI) between intervention and control groups at postintervention (adj. for preintervention rate): -0.017 (-0.036 to 0.002); p=0.08 Any BF at 8-9 mos postpartum, mean difference (95% CI) between intervention and control groups at postintervention (adj. for preintervention rate): 0.007 (-0.056 to 0.070); p=0.82
NR
Kools, 200580
Medium
G1: BF promotion and support program G2: Usual care
Cluster RCT 10 maternity and child health centers 781 mothers
Any BF 3 mos postpartum, % (N): G1: 32 (371) G2: 38 (330) OR (95% CI): 0.79 (0.58 to 1.08)
Exclusive BF 3 mos postpartum, % (N): G1: 27 (371) G2: 32 (330) OR (95% CI): 0.79 (0.57 to 1.10)

36
Table 9. Non-BFHI health system interventions reporting on breastfeeding duration (continued)
Author, Year ROB
Intervention Comparison
Study Design N Sites N Participants
Breastfeeding Duration (Any, nonexclusive plus exclusive)
Exclusive Breastfeeding Duration
Kronborg, 200779
Medium
G1: Health visitor education, and delivery of BF support intervention (1-3 home visits) G2: Usual care
Cluster RCT 22 municipalities 1,595 mothers
NR Exclusive BF 6 mos postpartum, % (N): G1: 7.7 (780) G2: 4.9 (815) Cessation rate of exclusive BF at 6 mos postpartum (intervention vs. control): HR (95% CI) 0.86 (0.75 to 0.99) p=0.04
Madden, 200383
Medium
Changes in maternity length of stay policy (pre-post)
Single-group, pre-post 14 health centers 20,366 births
Rates of BF continuation within 90 days of birth among BF initiators remained constant at an estimated 72.6% throughout the study period.
NR
Taddei, 200082
Medium
G1: Intensive staff BF training (3-week course) G2: Usual care (no staff training)
Cluster RCT 8 hospitals 970 infants
Full BF duration (days),d measured at 6 mos, adj. HR (95% CI) of before-after cohort: G1: 0.80 (0.67 to 0.97) G2: 1.16 (0.93 to 1.45) p=0.0019 Total BF duration (age at which BF was terminated, days), measured at 6 mos, adjustede HR (95% CI) of before-after cohort: G1: 1.01 (0.83 to 1.22) G2: 1.55 (1.23 to 1.96) p=0.0019
Exclusive BF duration (days), measured at 6 mos, adjustede HR (95% CI) of before-after cohort: G1: 0.71 (0.59 to 0.85) G2: 0.98 (0.79 to 1.22) p=0.0020
Wan, 201175
Medium
G1: Continuous primary nursing care G2: Task-centered nursing care
RCT 1 hospital (2 obstetric units) 470 pregnant women
NR Exclusive BF at 6 wks postpartum, % (N): G1: 93.91 (230) G2: 72.08 (240) p=0.001
a Women were sampled from control clusters at two time points, before the intervention (control group A) and at the same time as
the intervention sample (control group B). b Exclusive breastfeeding was defined as breastfeeding with occasional use of water, breastmilk substitutes (not more than a few
times), and/or solids (not more than 1 tablespoon per day). Partial breastfeeding was defined as infants who received breastmilk
and breastmilk substitutes (every day) and/or solids (more than 1 tablespoon per day). c Residency programs in pediatrics, obstetrics, and family medicine were enrolled; eligible programs had to have low or unknown
breastfeeding rates, serve a diverse patient population and varied geographical regions, and lack a Baby-Friendly certification. d Full breastfeeding refers to age at introduction of any other milk. e Adjusted for hospital of birth, mother’s age, parity, delivery (normal vs. other), birth weight, and sex; p-value refers to the
interaction term of control-exposed and before-after variables from the model that included both cohorts from all hospitals
(N=970).
BF = breastfeeding; BFHI = Baby-Friendly Hospital Initiative; CI = confidence interval; G = group; HR = hazard ratio; mos =
months; N = number; NR = not reported; NRCT = nonrandomized controlled trial; NS = not sufficient; OR = odds ratio; RCT =
randomized controlled trial; ROB = risk of bias; SD = standard deviation; wks = weeks.
Three studies assessed the effectiveness of an intervention providing education and training to
health care professionals (with no additional individual-level services offered to women); the

37
results did not consistently demonstrate benefit.74, 76, 82 In the cluster RCT comparing
breastfeeding training to midwives and postnatal nurses in Swedish municipalities,74 women in
the intervention and control groups had similar durations of any breastfeeding (7.5, 7.1, and 7.0
months, respectively) and exclusive breastfeeding durations (3.9, 3.2, and 3.5 months,
respectively;74 only one comparison was significant: mean exclusive BF duration among women
in intervention municipalities vs. women from control group municipalities measured prior to the
start of the intervention (3.9 vs. 3.2 months; p=0.02). The NRCT enrolling U.S. residency
programs (pediatrics, OBGYN, and family medicine) reported on breastfeeding rates at 6 months
following implementation of a breastfeeding residency curriculum; there was no difference in the
pre-post change among intervention sites (3.4%; p=0.291) or control sites (1.6%; p=0.574) for
rates of any breastfeeding at 6 months.76 For rates of exclusive breastfeeding at 6 months,
intervention sites had improved rates (6.7%; p=0.001) while control sites had decreased rates (-
5.4; p=0.002) during the study period.76 Authors only provide p-values for pre-post comparisons
and not sufficient data to calculate differences between intervention and control groups. The
cluster RCT assessing staff education (nurses, midwives, and physicians) found lower rates of
weaning for exclusive breastfeeding, full breastfeeding (age at introduction of another milk), and
total (any) breastfeeding among women in the intervention group compared with controls (Table
9).82
Three studies assessed a health system intervention that combined education (or skills
training) to providers with expanded individually delivered breastfeeding support services; two
did not demonstrate benefit.77, 79, 80 At 3 months, the RCT set in The Netherlands found no
difference in rates of any and exclusive breastfeeding between groups randomized to the health
care provider training and support program (counseling, identification of breastfeeding problems,
and free access to lactation consultants) and control sites (Table 9).80 One cluster RCT assessing
a policy to provide breastfeeding groups found no difference in rates of any breastfeeding among
intervention and control practices 6 to 8 weeks postpartum and 8 to 9 months postpartum.77 The
last study evaluated breastfeeding education to health visitors plus expanded home visits (1 to 3
within 5 weeks of birth) to support breastfeeding; mothers in the intervention group had a lower
cessation rate of any breastfeeding than controls (hazard ratio [HR], 0.86; 95% CI, 0.75 to
0.99).79
Three studies assessed changes in health service delivery or policies that relate to
breastfeeding, and reported on breastfeeding duration; the studies did not consistently
demonstrate benefit. The RCT comparing continuous primary nursing care with usual care (task
oriented nursing) among Chinese women found higher rates of exclusive at 6 weeks postpartum
among the intervention group than in the controls (94% vs. 72%; p=0.001).75 One
nonrandomized trial set in Norway adapted BFHI for implementation into routine antenatal and
child services; there was no difference between the intervention and control group in rates of any
breastfeeding at 6 months (OR, 1.24; 95% CI, 0.99 to 1.54) or at 12 months. For rates of
exclusive breastfeeding, the intervention group had a significantly higher rate than controls at 5
months postpartum and at 6 months (OR, 1.33; 95% CI, 1.03 to 1.72).70 The single-group pre-
post study assessing the relationship between changes in maternity length of stay policies among
women belonging to one Massachusetts HMO found that rates of breastfeeding 90 days after
birth among initiators remained constant at an estimated 73 percent throughout the study
period.83

38
Women, Infants and Children-Based interventions
Characteristics Six included studies assessed changes in breastfeeding rates associated a Special
Supplemental Nutrition Program for Women, Infants and Children (WIC) program or policy.50-55
Although all studies were set in the United States, they included women from diverse states
(Table 10). Studies generally enrolled a population of women with mean ages in the 20s to 30s
(Table 10). Two studies focused on populations of women enrolled during the 1990s54, 55 and the
other four enrolled women from 2002 to 2010.
Included studies assessed heterogeneous interventions and policies. One study used three
separate U.S. population cohorts to assess breastfeeding rates before and after a 2007 policy
revising the WIC food package (implemented by states in 2009):51 (1) the Pregnancy Risk
Assessment Monitoring System (PRAMS), women from 19 states between 2004 to 2010, (2) the
Pediatric Nutrition Surveillance System (PedNSS), women/infants from 16 states from 2007 to
2010, and (3) the National Immunization Survey (NIS), infants from all 50 states and the District
of Columbia from 2004 to 2010. One goal of the food package revision was to provide a greater
economic incentive for women to breastfeed (e.g., by providing mothers of infants exclusively
breastfed with additional milk, cheese, eggs, canned fish and whole wheat bread).51
The other five studies assessed local WIC interventions (implemented in individual states or
WIC agencies). One RCT (N=280 mothers) assessed whether an electric breast pump (vs. a
manual pump) would increase breastfeeding duration in those returning to work or school full-
time among women recruited from 13 Hawaiian WIC sites.50 Four assessed a type of peer-
support intervention. One nonrandomized trial compared a Peer Dad program (plus Peer Support
for Mothers) with Peer Support for Mothers alone among Hispanic participants at a single WIC
agency in Texas.52 One RCT compared telephone peer counseling with standard care (no peer
counseling) at 4 WIC agencies in Oregon.53 Two compared a peer counseling program with
usual care (no peer counseling) at different agencies in Iowa (8 counties)54 and Tennessee (9
health departments).55
Two studies were rated high ROB51, 54 and the rest were rated medium ROB. Common
methodological concerns included selection bias, high or unclear rates of attrition, and
differences between groups that were not addressed in analyses.
Results Results of the six included studies are presented in Table 11. Most studies reported on both
breastfeeding duration and initiation and we present results together below grouped by
intervention type. Overall, three studies found some benefit for the intervention and three did
not.
In terms of broad policy interventions, the one study (rated with risk of bias) assessing
breastfeeding rates in relationship to the 2007 federal rule revising WIC food packages found no
association between the policy change and rates of breastfeeding.51 Data from all three sources
(PRAMS, PedNSS, and NIS) showed steady upward trends in rates of ever breastfed infants on
WIC during the study period; in neither PRAMS nor NIS data were trends in breastfeeding after
implementation of the new food package statistically different from trends in breastfeeding
among low-income women not on WIC (Table 11).51 Similarly, there was no change in monthly
breastfeeding rates by birth cohort associated with the new food package in the PedNSS data
(pre- vs. postimplementation of the new policy).51

39
Table 10. Characteristics of studies assessing WIC-based interventions
Author, Year ROB
Study Design N Sites N Participants
Country Year(s) of Enrollment
Inclusion Criteria
Intervention Description
Comparator(s) Age, Mean (SD)
% non-white
% Primiparous % Previously BF
% Cesarean Birth
Hayes, 200850
Medium
RCT 13 WIC sites (Hawaii) 280 women
US 2002-2003
Women who planned to return to work or school full-time after delivery and had no medical conditions that prevented or limited BF
Provision of an electric breast pump (loaned)
Provision of a manual breast pump (loaned)
NR: % by age group: <20: 11-18 20-29: 64-59 30-44: 18-30
NR 50-55 NR
NR
Joyce, 201551
High
Prospective Cohort NA (3 population cohorts: PRAMS, NIS, and PedNSS) PRAMS (WIC): 85,458 PRAMS (Non-WIC): 42,019 NIS (WIC): 62,289 NIS (Non-WIC): 11,702 PedNSS (infants): 744
US 2004-2010
PRAMS:
Pregnant women, WIC participants and women w/ low SESb who did not participate in WIC NIS: Children who
ever received WIC benefits and children who did not but had family income ≤250% of the federal poverty level. PedNSSc: All
participants 2007-2011 (pre- and post-policy change)
Changes to WIC food package (2007 rule implemented by states in 2009): available to fully BF women with monetary value comparable to that of vouchers received by mothers not exclusively BF; restrictions placed on issuance of formula to BF infants in first month; infants exclusively BF were eligible to receive additional commercially prepared infant fruits and vegetables
Mothers/infants not receiving WIC benefits (PRAMS and NIS); or pre-implementation of WIC policy change (PedNSS)
PRAMS: <20: 6-17 20-29: 61-62 ≥30: 21-31 NIS: <20:1-5 20-29: 35-54 ≥30: 41-63 PedNSS: NR
PRAMS: 56 (WIC); 34 (non-WIC) NIS:67 (WIC and non-WIC) PedNSS: NR
NR NR

40
Table 10. Characteristics of studies assessing WIC-based interventions (continued)
Author, Year ROB
Study Design N Sites N Participants
Country Year(s) of Enrollment
Inclusion Criteria
Intervention Description
Comparator(s) Age, Mean (SD)
% non-white
% Primiparous %Previously BF
% Cesarean Birth
Lovera, 201052
Medium
NRCT 1 WIC agency in Texas 200 women
United States 2005-2006
Program participation (mother alone, or with father participation); mother had initiated BF of the index child; current participation in the WIC program; Hispanic; ≥18 yrs; infant with no contraindication to breastfeeding
Peer Dad Program (plus Peer Counseling Program for Mothers): Peer dad volunteers acted as role models and provided counseling and classes pre- and postnatally for WIC father. Counseling sessions were held individually or with the spouse, in-person or by telephone.
Peer Counseling program only: Experienced breastfeeding women serve as role models
NR; % by age group, Mother: 20-35: 84-86 36-50: 14-16 Father: 20-35: 73-78 36-55: 22-27
NR (100% Hispanic)
29-30 72-78
46-54
Reeder, 201453
Medium
RCT 4 WIC agencies in Oregon 1,948 women
United States 2005-2007
Women attending a WIC new pregnancy appointment who indicated an intention to breastfeed or were undecided about BF
Telephone Peer Counseling program: delivered through WIC agenciesd
Standard WIC BF promotion and support (no contact with a peer counselor)
27 44-47
NR NR
26-30

41
Table 10. Characteristics of studies assessing WIC-based interventions (continued)
Author, Year ROB
Study Design N Sites N Participants
Country Year(s) of Enrollment
Inclusion Criteria
Intervention Description
Comparator(s) Age, Mean (SD)
% non-white
% Primiparous %Previously BF
% Cesarean Birth
Schafer, 199854
High
NRCT 8 counties (Iowa) 241 women
United States 1994-1996
Rural, low-income pregnant and postpartum women who qualified for WIC
Peer counseling program (2 counties): trained volunteer peer counselors from the community met one-on-one with women and presented lessons on nutrition and BF and provided support.
Usual care (6 counties without peer counseling program)
23-25 0-19 NR NR
NR
Shaw, 199955
Medium
Prospective cohort 9 health departments (Tennessee) 291 women
United States 1996-1997
Pregnant women who had registered antepartum for WIC at 1 of 9 health departments in West Tennessee
Peer counseling program: Trained peer counselors held individualized sessions with participants based on need
Usual care (no peer counselor intervention)
22-23 16-29 37-47 21-35
21-24
a Because they were already encouraged to use an electric pump. b Included women with a family income of less than $50,000 per year or whose prenatal care was covered by Medicaid. c Approximately 85% of cohort participated in WIC; data from all participants from 2007 to 2011 were used to describe changes in the percent of women ever breastfeeding or
breastfeeding for at least 1 month. d Low-frequency (4 calls) protocol or high-frequency protocol (8 calls) but analyzed together (see comments).
BF = breastfeeding; N = number; NIS = National Immunization Survey; NR = not reported; NRCT = nonrandomized controlled trial; PedNSS = Pediatric Nutrition Surveillance
System; PRAMS = Pregnancy Risk Assessment Monitoring System; RCT = randomized controlled trial; ROB = risk of bias; SES = socioeconomic status; WIC = Special
Supplemental Nutrition Program for Women, Infants, and Children; yrs = years.

42
Table 11. WIC interventions reporting on breastfeeding initiation and duration
Author, Year Study Name ROB
Intervention Comparison
Study Design N Sites N Participants
Breastfeeding Initiation Outcome Results
Breastfeeding Duration (Any, nonexclusive plus exclusive)
Exclusive Breastfeeding Duration
Hayes, 200850
Medium
G1: Provision of an electric breast pump (loaned) G1: Provision of a manual breast pump (loaned)
RCT 13 WIC sites (Hawaii) 280 women
NR % of women (N) who BF for at least 6 mos: G1: 72.3 (94/130) G2: 76.8 (76/88) Adjusted OR (95%CI),a electric vs. manual: 0.85 (0.45 to 1.60) Median duration (95% CI) of BF (mos): G1: 12 (8 t162) G2: 11 (9 to 14) Adjusted HR (95% CI)b 1.13 (0.79 to 1.50)
NR
Joyce, 201551
High
G1: Pre-WIC policy change G2: Post-WIC policy change
Prospective cohort NA (3 population cohorts: PRAMS, NIS, and PedNSS) PRAMS (WIC): 85,458 PRAMS (Non-WIC): 42,019 NIS (WIC): 62,289 NIS (Non-WIC): 11,702 PedNSS (infants): 744
Trends in rates of ever-breastfeeding (2008 to 2010), Adjusted differencec between WIC and non-WIC groups: PRAMS: 1.2 %; p=NS NIS: -1.3%; p=NS PedNSS: pre-post difference in proportion of children ever breastfed after the new food package (adjusted for trends in BF) = -0.1%
Trends BF for at least 4 wks (2008 to 2010), Adjusted difference between WIC and non-WIC groups, PRAMS: 0.3%; p=NS Trends BF for at least 3 mos (2008 to 2010), Adjusted difference between WIC and non-WIC groups, NIS: 0.4%; p=NS PedNSS: Pre-post difference in proportion of children breastfed for ≥1 month after the new food package (adjusted for trends in BF) = 0.5%
NR
Lovera, 201052
Medium
G1: BF Peer support program for fathers (in addition to mother peer support program) G2: Mother participation in peer support program only
NRCT 1 WIC site (Texas) 200 women
NA (only mothers who initiated BF were eligible)
% (N) of women who breastfed for 6 mos or longer: G1: 63.4 (64/101) G2: 54.5 (54/99) p=0.20 OR (95% CI) 1.44 (0.82 to 2.54)
NR
Reeder, 201453
Medium
G1: Telephone peer counseling program G2: Usual care
RCT 4 WIC Agencies in Oregon 1948 women
No association between telephone peer counseling and BF initiation rates (per authors, results not shown)
Adjustedd RR (95% CI) of nonexclusive BF (vs. nontreatment group): 1 m: 1.19 (1.10 to 1.27) 3 m: 1.22 (1.10 to 1.34) 6 m: 1.18 (1.03 to 1.34)
Adjustedd RR (95% CI) of exclusive BF (vs. nontreatment group): 1m: 1.07 (0.97 to 1.18) 3m: 1.09 (0.95 to 1.24) 6m: 1.01 (0.85 to 1.20)

43
Table 11. WIC interventions reporting on breastfeeding initiation and duration (continued)
Author, Year Study Name ROB
Intervention Comparison
Study Design N Sites N Participants
Breastfeeding Initiation Outcome Results
Breastfeeding Duration (Any, Nonexclusive Plus Exclusive)
Exclusive Breastfeeding Duration
Schafer, 199854
High
G1: WIC peer counseling program G2: Usual care
NRCT 2 counties 241 women
BF initiation, % (N/ N total): G1: 82 (59/72) G2: 31 (20/64)
Average BF duration (wks): G1: 5.7 G2: 2.5 % of women BF at 12 wks: G1: 43 (31/72) G2: 0 (0/64) p<0.001
NR
Shaw, 199955
Medium
G1: WIC peer counseling program G2: Usual care
Prospective cohort 9 health departments (Tennessee) 291 women
BF initiation (any attempt to BF), % (N/N total): G1: 53 (82/156) G2: 33 (45/135) p<0.01 Adjusted OR (95%): 2.43 (1.23 to 4.67) BF at hospital discharge, % (N/N total): G1: 44 (69/156) G2: 26 (35/136) p<0.01
Any BF at ≥6 wks, % (N/N total): G1: 26 (41/156) G2: 13 (18/135) p<0.01 Adjusted OR (95%CI): 2.78 (1.31 to 5.91)
NR
a Adjusted for mother’s age, race/ethnicity, education, marital status, and parity. b Adjusted for education, age, race/ethnicity, marital status, and parity. c All models include state and year fixed effects. Additional covariates include indicators for age, race/ethnicity, parity, marital
status, family income, mother’s schooling, and whether prenatal care was paid for by Medicaid. d Adjusted for age, education, race, language, marital status, month in pregnancy enrolled, family income, cesarean delivery,
LWA.
BF = breastfeeding; CI = confidence interval; G = group; LWA =local WIC agency; mos = months; N = number; NA = not
applicable; NIS = National Immunization Survey; NR = not reported; NRCT = nonrandomized controlled trial; NS = not
significant; OR = odds ratio; PedNSS = Pediatric Nutrition Surveillance System; PRAMS = Pregnancy Risk Assessment
Monitoring System; RCT = randomized controlled trial; ROB = risk of bias; RR = risk ratio; SD = standard deviation; WIC =
Special Supplemental Nutrition Program for Women, Infants, and Children; wks = weeks.
In the RCT (N=280) enrolling Hawaiian mothers on WIC who planned to return to work or
school, there was no difference in breastfeeding duration among mothers assigned to an electric
or manual breast pump (median duration of breastfeeding: 12 vs. 11 months, respectively; HR,
1.13; 95% CI, 0.79 to 1.50).50
Four studies that assessed a type of WIC peer support program, three assessing peer support
for mothers found benefit, and one (assessing added peer support for fathers) did not. Of the
three studies assessing peer support for mothers, two compared in-person peer support to
mothers with usual care.54, 55 One was a NRCT assessing a volunteer peer counselor program at
eight Iowa county WIC agencies; women in the intervention group had a higher rate of
breastfeeding initiation than in the controls (82% vs. 31%, respectively) and a higher rate of
breastfeeding at 12 weeks (43% vs. 0%; p<0.001).54 Similarly, the cohort study assessing a WIC
peer support program at nine Tennessee health departments found higher rates of breastfeeding
at hospital discharge in the intervention group than in the controls (44% vs. 26% of women,
p<0.01) and higher rates of any breastfeeding at 6 week postpartum (26% vs. 13%, p<0.01).55

44
One RCT compared telephone delivered breastfeeding support among women enrolled at four
Oregon WIC agencies with usual care, there was no difference between groups in terms of
breastfeeding initiation (per authors, data not provided).53 However, in the overall sample, rates
of nonexclusive breastfeeding were greater in the intervention than controls at 3 months and 6
months (RR, 1.18; 95% CI, 1.03 to 1.34).53 There was no significant difference in rates of
exclusive breastfeeding in the overall sample at 3 or 6 months postpartum.53
The NRCT comparing a peer support program for fathers (in addition to peer support for
mothers) with peer support for mothers alone found a slightly higher rate of any breastfeeding at
6 months, but the difference was not statistically significant (63 vs. 55%, respectively; p=0.20).52
Community-Based Interventions
Characteristics Four included studies (described in five publications) assessed the effectiveness of a
community-based intervention (Table 12). Studies were conducted in diverse country settings
including one each in Italy,84Australia,85 Mexico,86 and Canada.87 Two were cluster RCTs,85, 86
one was an NRCT.84 and one was a prospective cohort study.87 One study enrolled women
between 1995 and 1996,86 and all others enrolled women after 2005.
In terms of populations, two studies enrolled a majority of primiparous women84, 87 and two
enrolled a minority of primiparous women. Rates of cesarean births ranged from 27 to 40 percent
in three studies, and one did not report on the rate of cesarean birth.87 Most studies enrolled
women living in a community in which the intervention was implemented; one Australian study
targeted women who were considered at risk of early breastfeeding cessation (e.g., infant
received formula in the early postpartum period, or mother asked for help with breastfeeding).85
No studies assessed the same intervention type; details of intervention and comparators are
shown in Table 12. Briefly, one Italian study assessed a community-based policy (Baby Friendly
Community Initiative) aimed at promoting breastfeeding in nonhospital-based health and
community centers (including workplaces and day care centers).84 The Australian cluster RCT
evaluated an early home-based breastfeeding intervention in local health authorities with and
without access to a community-based breastfeeding drop-in center.85 The cluster-RCT set in
Mexico compared community-based breastfeeding peer support to usual care (peer counsellors
were trained and supervised by staff of La Leche League of Mexico).86 Finally, one prospective
cohort study set in Canada compared peer-led breastfeeding education classes with standard
nurse-led classes.87
We rated two studies low ROB,85, 86 one medium,84 and one high ROB.87 Common
methodological limitations included selection bias, high or unclear attrition, and differences
between groups that were not controlled for in analyses.

45
Table 12. Characteristics of studies assessing community-based interventions
Author, Year Study Name ROB
Study Design N Sites N Participants
Country Year(s) of Enrollment
Inclusion Criteria
Intervention Description
Comparator(s) Age, Mean (SD)
% non-white
% Primiparous % Previously BF
% Cesarean Birth
Cattaneo, 2016;84
Macaluso, 201388
Medium
NRCT 18 local health authorities (9 regions of Italy) 5,094 mother/ infant pairs
Italy 2009-2012
Mothers giving birth to a healthy infant in hospitals within eligible local health authorities
Early implementation of BFCI, a policy directed at promoting BF initiation and duration in nonhospital health facilities, day care centers, public locations, and businesses
Later implementation of BFCI
32 NR; (96-67% Italian)
54-57 41-44
27-29
MacLachlan, 201685
Low
Cluster RCT 10 LGAs, with 99 maternal child centers 9,675 women
Australia 2012-2013
Clusters: LGAs in Victoria, Australia with >450 births per year and lower rates of any BF at discharge from hospital than the Victoria state average. Mothers: those who left the hospital BF; mothers considered at risk of early BF cessation were targeted for HVsa
Early home-based BF support by a maternal and child health nurse for women identified as at risk of breastfeeding cessation, with or without access to a community-based breastfeeding drop-in center (offering women the opportunity to discuss BF concerns with nurse and/or trained peer supporter, meet and learn from other mothers, and access other BF support)
Usual care: hospital midwife visit 1-2 days after discharge; home visit 10-14 days after birth
31 NR 39-41 NR
32-36

46
Table 12. Characteristics of Studies assessing community-based interventions (continued)
Author, Year Study Name ROB
Study Design N Sites N Participants
Country Year(s) of Enrollment
Inclusion Criteria
Intervention Description
Comparator(s) Age, Mean (SD)
% non-white
% Primiparous % Previously BF
% Cesarean Birth
Morrow, 199986
Low
Cluster RCT 36 clusters, (composed of 2 to 4 city blocks) 130 women
Mexico 1995-1996
Pregnant women residing in the study area who agree to participate
Community-basedb BF peer counselor support via home visits (3 or 6)
Standard care (mothers with lactation problems were referred to their own physicians)
NR NR 21-30 NR
23-40
Rempel, 201287
High
Prospective cohort 1 hospital 109 women
Canada 2005-2006
NR; participants sampled from those who had participated in classes
Peer-led BF class (2 hours) providing education and support facilitated by 2 volunteer Breast-feeding Buddies (who BF for 6 mos and completed 18 hours of BF training)
Standard nurse-led prenatal BF class
28-31 NR 97 2
NR
a Women were considered at risk of early breastfeeding cessation if their infant received any formula (in addition to breast milk) in the early postpartum period and if a woman was
distressed about breastfeeding or asked for help with breastfeeding when telephoned. b Peer counsellors were trained and supervised by staff of La Leche League of Mexico and the physician study coordinator (trained in lactation management). The peer-counsellor
training consisted of 1 week of classes, 2 months in lactation clinics and with mother-to-mother support groups, and 1 day of observation and demonstration by visiting experts.
The peer counsellors practiced in a neighborhood nearby the study site for 6 months before the intervention trial, during which the content of messages and problem-solving skills
were refined.
BF = breastfeeding; BFCI = Baby Friendly Community Initiative; G = group; LGA = local governmental agency; mos = months; N = number; NR = not reported; NRCT =
nonrandomized controlled trial; RCT = randomized controlled trial; ROB = risk of bias; SD = standard deviation.

47
Results Results of studies are shown in Table 13. All studies reported on at least one measure of
breastfeeding duration, and one also reported on rates of breastfeeding initiation.86
The studies generally did not demonstrate benefit, with the exception of one study that
reported a benefit at 3 months but not at 6 months. The Italian study assessed a community-based
policy aimed at promoting breastfeeding in nonhospital-based health and community centers.84
The study found no difference between intervention and control regions at any time point; the
rate of exclusive breastfeeding at discharge, 3 and 6 months, and of any breastfeeding at 5 and 12
months increased during the study period in both groups.84 The Australian cluster RCT evaluated
an early home-based breastfeeding intervention in local health authorities with and without
access to a community-based breastfeeding drop-in center, compared with control regions;85 this
RCT found no difference between groups in the rate of any breastfeeding at 4 months (Table 13).
The cluster RCT (N=130) set in Mexico compared community-based breastfeeding peer
support to usual care86; at 3 months postpartum, more women in the intervention groups were
practicing exclusive breastfeeding than in the controls (67% of the 6-visit group, 50% of the 3-
visit group, vs. 12% of controls; p<0.001) and rates of any breastfeeding were significantly
longer in intervention groups (combined) than in control groups at 3 months, but not 6 months
(Table 13).86 Finally, in the prospective cohort study set in Canada comparing peer-led
breastfeeding education classes with standard nurse-led classes,87 there was no difference
between groups in rates of any breastfeeding at 1 and 6 months postpartum (Table 13).
Table 13. Results of studies assessing community-based interventions
Author, Year ROB
Intervention Comparison
Study Design N Sites N Participants
Breastfeeding Initiation Outcome Results
Breastfeeding Duration (Any, Nonexclusive Plus Exclusive)
Exclusive Breastfeeding Duration
Cattaneo, 201684;
Macaluso, 201388
Medium
G1: Early implementation of BFCI G2: Later implementation of BFCI
NRCT 18 local health authorities (9 regions of Italy) 5,094 mother/ infant pairs
NR Any BF 6 mos, % (data collected on 3 separate cohorts of women): G1: Round 1: 67.6 Round 2: 66.7 Round 3: 69.0 G2: Round 1: 62.4 Round 2: 63.4 Round 3: 65.4 Any BF, 12 mos, %: G1: Round 1: 32.4 Round 2: 34.9 Round 3: 36.2 G2: 12 mos Round 1: 26.6 Round 2: 30.8 Round 3: 34.9
Exclusive BF 3 mos (24-hour recall), % (data collected on 3 separate cohorts of women): G1: Round 1: 58.1 Round 2: 57.5 Round 3: 62.3 G2: Round 1: 52.8 Round 2: 53.6 Round 3: 57.9 6 mos (24-hour recall): G1: Round 1: 9.0 Round 2: 7.7 Round 3: 7.6 G2: Round 1: 7.1 Round 2: 8.4 Round 3: 9.6

48
Table 13. Results of studies assessing community-based interventions (continued)
Author, Year ROB
Intervention Comparison
Study Design N Sites N Participants
Breastfeeding Initiation Outcome Results
Breastfeeding Duration (Any, Nonexclusive Plus Exclusive)
Exclusive Breastfeeding Duration
MacLachlan, 201685
Low
G1: Early home-based maternal and child health nurse BF support G2: Early home-based maternal and child health nurse BF support (plus community-based BF drop-in center) G3: Usual care
Cluster RCT 10 LGAs, with 99 maternal child centers 9,675 women
NR Any breast milk feeding at 4 mos, % (N): G1: 62.7 (2,281) G2: 54.4 (2,344) G3: 53.9 (2,414) Adjusteda OR (95%CI) G1 vs. G3: 1.04 (0.84 to 1.29) G2 vs. G3: 0.92 (0.78 to 1.08) Authors also report no difference at 3 or 6 mos between groups and no difference before or after the intervention in any LGA.
NR
Morrow, 199986
Low
G1: Community-based BF peer counselor support G1: Usual care
Cluster RCT 36 clusters, (comprised of 2 to 4 city blocks) 130 women
BF initiation, % (N/ N total): G1 (6-visit): 100 (44/44) G1 (3-visit): 98 (51/52) G2: 94 (32/34) p=NS
Duration of any BF, % (N) ≥3 mos: G1: 95 (92) G2: 85 (33) p=0.039 ≥6 mos: G1: 87 (75) G2: 76 (29) p=0.09
Duration of exclusive BF % (N), 3 mos: G1 (6-visit): 67 (42) G1 (3-visit): 50 (50) G2: 12 (33) G1 (6-visit) vs. G1 (3-visit): p=0.015 G1 (6-visit) vs. G3: p<0.001 G1 (3-visit) vs. G3: p<0.001
Rempel, 201287
High
G1: Peer-led BF support class G2: Nurse-led BF support class
Prospective cohort 1 hospital 109 women
NR Women BF at 1 mos, % (N): G1: 84 (38) G2: 70 (37) p=NS Women BF at 6 mos, % (N): G1: 61 (31) G2: 49 (35) p=NS
NR
a Adjusted for baseline breastfeeding rates in the local government areas, gestational age, maternal age, cesarean births, age in
weeks at 4 m Key Ages and Stages visit, and the potential effect of clustering in the maternal and child health centers.
BF = breastfeeding; BFCI = Baby Friendly Community Initiative; G = group; LGA= local governmental agency; mos =
month(s); N = number; NA=not applicable; NR = not reported; NRCT = nonrandomized controlled trial; NS = not significant;
OR = odds ratio; RCT = randomized controlled trial; ROB = risk of bias;

49
Key Question 1b. To what extent do the effectiveness and harms of programs and policies on initiation, duration, and exclusivity of breastfeeding differ for subpopulations of women defined by sociodemographic factors (e.g., age, race, ethnicity, socioeconomic status)?
Few eligible studies reported on subgroups of women; we found no studies reporting on
subgroups defined by age (at breastfeeding exposure), comorbidity and other factors. Of the
three included studies reporting on subgroups of women, two focused on BFHI and reported on
differences by education status,58, 59 and one focused on a WIC peer support intervention and
reported on subgroups by language spoken (Spanish only versus English).53
The two studies assessing BFHI (by the same author) focused on hospitals in the United
States enrolling women from similar time periods (1999-2009); one of these evaluated data from
five US states58 and the other focused on hospitals in one state (Maine).59 Characteristics are
described above in KQ1a and shown in Table 4. Neither study found a significant difference in
breastfeeding initiation rates between facilities that received BFHI accreditation and
nonaccredited facilities in the overall sample, but both offer some evidence of differences in
effectiveness by education level, with benefits accruing to those with lower levels of
education.58, 59 Both studies found higher rates of breastfeeding initiation among women with
lower education (≤12 years) at BFHI facilities compared with nonaccredited facilities, but no
difference in rates among women with higher education (≥13 years).58, 59 For breastfeeding
duration, the study enrolling women from five US states found increased rates of exclusive
breastfeeding for 4 or more weeks among women with lower education in the intervention arm
when compared with the control arm (p=0.02), but no difference for women with higher
education (Table 14); no difference was seen for rates of any breastfeeding by education status.58
The study evaluating women giving birth in Maine hospitals found no difference in rates of
exclusive or any breastfeeding at 4 or more weeks postpartum among women who differed by
education status.59
One RCT compared telephone peer counseling with standard care at 4 WIC agencies in
Oregon; women in the overall sample randomized to the intervention had significantly higher
rates of any breastfeeding at 3 and 6 months. In subgroups of women based on language
(English-speaking and Spanish-only), results were significant at 3 months for both groups, but
for Spanish-speaking only at 6 months Table 14). There was no significant difference in rates of
exclusive breastfeeding in the overall sample or by language at 3 or 6 months postpartum.53

50
Table 14. BFHI Studies reporting on eligible subgroups
Author, Year Study Name ROB
Intervention Comparison
Study Design N Sites N Participants
Breastfeeding Initiation Breastfeeding Duration
Hawkins, 201458
Medium
G1: Mothers giving birth in a BFHI accredited facility G2: Mothers giving birth in a non- accredited facility
Prospective cohort 32 birth facilities in 5 US states 25,327 women
BF initiation increased by 3.8% among mothers with less education (≤12 years) who delivered in BFHI facilities (p=0.05), but not among mothers with more education (≥13 years) (p=0.9)
BF initiation increased exclusive BF for ≥4 wks by 4.5% (p=0.02) among mothers with lower education who delivered in BFHI facilities (p=0.1) There was no significant difference seen in subgroups based on education for rates of any BF for ≥4 wks.
Hawkins, 201459
Medium
G1: Mothers giving birth in a BFHI-accredited facility G2: Mothers giving birth in a non-accredited facility
Prospective cohort 10 birth facilities in 1 US state (Maine) 2,014 women
Among mothers with less education (≤12 years), the BFHI increased BF initiation by 8.6% (adjusted coefficient, 0.086; 95% CI, 0.01 to 0.16). No significant change in BF initiation rates for mothers with more education (≥13 years); p=0.9
No significant change in exclusive BF for ≥4 wks among mothers with less education (≤12 years; p=0.5) or more education (≥13 years; p=0.3) No significant change in any BF for ≥4 wks among mothers with less education (≤12 years; p=0.5) or more education (≥13 years; p=0.3)
Reeder, 201453
Medium
G1: Telephone peer counseling program G2: Usual care
RCT 4 WIC Agencies in Oregon 1948 women
NR Adjusteda RR (95% CI) of nonexclusive BF (vs. nontreatment group): Spanish only subgroup: 1 m: 1.16 (1.06 to 1.28) 3 m: 1.29 (1.13 to 1.48) 6 m: 1.29 (1.10 to 1.51) English only subgroup: 1 m: 1.22 (1.09 to 1.36) 3 m: 1.19 (1.02 to 1.38) 6 m: 1.10 (0.88 to 1.37) Adjusteda RR (95% CI) of exclusive BF (vs. nontreatment group): Spanish only subgroup: 1m: 1.13 (1.00 to 1.29) 3m: 1.20 (1.02 to 142) 6m: 1.17 (0.94 to 1.44) English only subgroup: 1m: 1.04 (0.90 to 1.19) 3m: 1.02 (0.84 to 1.24) 6m: 0.91 (0.70 to 1.19)
a Adjusted for age, education, race, language, marital status, month in pregnancy enrolled, family income, cesarean delivery,
LWA.
BF = breastfeeding; BFHI = Baby Friendly Hospital Initiative; G = group; LWA=local WIC agency; N = number; ROB = risk of
bias; US = United States; WIC = Special Supplemental Nutrition Program for Women, Infants, and Children.

51
Key Question 1c. To what extent do intervention-related characteristics (e.g., type of breast pump provided—manual or electric; delivery personnel) influence the initiation, duration, and exclusivity of breastfeeding?
We had insufficient evidence to address this KQ. As noted above (KQ 1a), few studies
assessed similar interventions among similar groups of women (or settings).
Key Question 2a. What are the comparative benefits and harms for maternal health outcomes among women who breastfeed for different intensities and durations?
Key Points
Low strength of evidence supports the conclusion that ever breastfeeding, as well as
longer durations of breastfeeding, may be associated with a reduced risk of developing
(any) breast cancer, luminal breast cancer, or triple-negative breast cancer. Despite a
large body of observational evidence, study and participant characteristics and
methodological limitations did not explain the significant heterogeneity of results. We
rated the evidence as insufficient (primarily due to unknown consistency) for the
association between breastfeeding and subtypes of breast cancer defined by tumor
behavior (i.e., in situ breast cancer) or hormone receptor status, breast cancer among
BRCA1/2 mutation carriers, and mortality due to breast cancer.
Low strength of evidence supports the association between ever breastfeeding, as well as
and longer durations of breastfeeding and a reduced risk of developing epithelial ovarian
cancer. The body of evidence is relatively large and includes one systematic review of 41
studies and eight additional studies (39,618 women), however, the results included
significant heterogeneity not explained by study, participant characteristics or
methodological limitations.
Based on consistent evidence from four studies (437,265 participants), we conclude that a
longer duration of breastfeeding is associated with reduced risk of hypertension (low
SOE); the magnitude of association varies by breastfeeding exposure and hypertension
outcome definition. We found insufficient evidence for an association between
breastfeeding and cardiovascular disease due to few studies assessing the same outcome
among similar cohorts of women.
Based on one meta-analysis (6 studies, 273,961) and three additional studies with
consistent findings, we conclude that a longer duration of lifetime breastfeeding is
associated with a reduced risk of developing type 2 diabetes (low SOE); the magnitude of
association varies by breastfeeding outcome definition and study design
Ten studies (6 case-control and 4 cohort studies) reported on the association between
breastfeeding using different measures (e.g., ever versus never, and duration per child)
and hip, vertebral and forearm fracture risk. Apart from one study of self-reported
vertebral fractures (rated high risk of bias), no study reported statistically significant
association between breastfeeding and fracture. We rated the evidence as low for no
association.

52
For postpartum depression, we found insufficient evidence on whether breastfeeding is
associated with postpartum depression. Studies were heterogeneous in design and varied
in how breastfeeding exposure and outcomes were assessed and categorized, and do not
establish the direction of relationship between breastfeeding and depression.
We rated the strength of evidence on the association between breastfeeding and
postpartum weight change as insufficient. The body of evidence is large (19 publications;
however, results are inconsistent and studies use heterogeneous measures of both
exposure and outcomes limiting the ability to compare findings. As noted in the prior
report, studies indicate that other variables have effects on weight change, such as
baseline BMI, ethnicity, gestational weight gain, and energy intake.
Relationship Between Maternal Breast Cancer and Ovarian Cancer
and Breastfeeding
Background Breast cancer is the most frequently diagnosed cancer among women, with an estimated
252,710 new diagnoses in 2017; an estimated 40,610 women will die due to breast cancer in
2017, making it the second most deadly cancer diagnosis among women behind lung cancer.
Ovarian cancer is substantially rarer than breast cancer, with an estimated 22,440 new diagnoses
in 2017, but is the fifth most deadly cancer among women (estimated 14,080 deaths).89 Family
history of breast or ovarian cancer, increased age, obesity, smoking, and postmenopausal
hormone use are known or suspected risk factors of both breast and ovarian cancer. Reproductive
factors that shorten a women’s menstrual history, such as oral contraceptive use and parity, are
associated with a decreased risk of both breast and ovarian cancer. Since breastfeeding is
associated with increased parity, we examined the association between it and breast and ovarian
cancer.90
Methods We included systematic reviews published within the past 5 years that were rated low or
unclear ROB. We also included eligible studies that were (a) included in or (b) published since
the 2007 AHRQ review by Ip2 but not captured in the recent systematic reviews. Finally, we
included eligible cohort and case-control studies published since the most recent systematic
review for each outcome. In terms of outcomes, we included studies reporting on breast or
ovarian cancer, and subtypes cancer, defined by molecular or histopathologic features.
Additionally, we included studies enrolling populations with BRCA1 and BRCA2 mutation
carriers who are at increased risk of both breast and ovarian cancer.
Breast Cancer: Systematic Reviews and Meta-Analyses
Breast Cancer One recent systematic review rated unclear ROB1 examined the association between ever
breastfeeding, as well as duration of breastfeeding, and subsequent breast carcinoma in the
mother among 98 studies (12 cohort and 86 case-control); 73 percent of the studies were
conducted in high-income countries (Table 15, Appendix Tables C-19 to C22). The authors did
not perform a formal quality or ROB assessment of included articles, but did assess 67 percent of
the studies as adequate (i.e., had none or one of selection, measurement, or confounding bias or

53
attrition of 20% as assessed by the review authors). They used random effects meta-analysis to
estimate pooled ORs when heterogeneity was high (I2>60% or p for heterogeneity<0.010);
reasons for heterogeneity were explored with subgroup analyses and meta-regression for the
main comparison of ever versus never breastfed. The authors found evidence of publication bias,
as evidenced by (a) an asymmetrical funnel plot, (b) significant Egger’s test (p<0.001), and (c)
significant Begg’s test (p<0.001); authors did not describe the potential impact of the publication
bias.
Using data from all 98 included studies, the authors reported a pooled OR forever versus
never breastfeeding of 0.78 (95% CI, 0.74 to 0.82). The high heterogeneity (I2=72) of these
results could not be completely explained in subgroup analyses. The reviewers found statistically
significantly different results when studies were categorized according to study size (i.e., number
of participants) (meta-regression p-value=0.009) and method of adjustment for parity (meta-
regression p-value, 0.037); they continued, however, to find substantial residual heterogeneity
within those subgroups (I2 ranged from 23 to 77). Among 52 studies that included at least 1,500
participants, the pooled OR was 0.83 (95% CI, 0.80 to 0.88; I2=72); the association was stronger
among 31 studies of 500 to 1,499 participants and 15 studies of fewer than 500 participants, but
the CIs were wider (pooled OR, 0.74; 95% CI, 0.66 to 0.83; I2=67 and pooled OR, 0.50; 95% CI,
0.37 to 0.66; I2=59, respectively). Among 60 studies that did not adjust for parity, the pooled OR
was 0.73 (95% CI, 0.68 to 0.79; I2=77); the pooled ORs were attenuated among 19 studies that
crudely adjusted for parity (0.86; 95% CI, 0.81 to 0.90; I2=23) and 19 studies that finely adjusted
for parity (0.92; 95% CI, 0.88 to 0.96; I2=55).
Table 15. Breastfeeding and breast cancer: Summary of published systematic reviews and meta-analyses
Author, Year
ROB
Number of Studies (Number of Participants; Number of Cases)
Included Study Designs
Overlap With Other Published SRs
Search Dates
Databases
Results
Bernier, 200091
Medium
23 studies (70,871; 25,871) Case-control
Included in the 2007 AHRQ Report2
19 studies included in Chowdhury, 20152
1980-1998 Medline, Embase
Ever versus never breastfed OR, 0.84 (95% CI, 0.78 to 0.91) Total breastfeeding duration (mos) versus never breastfed <6: OR, 1.00 (95% CI, 0.86 to 1.16) 6-<12: OR, 0.97 (95% CI, 0.86 to 1.09) ≥12: OR, 0.72 (95% CI, 0.65 to 0.80)
Chowdhury, 20151
Unclear
98 studies (NR) Cohort, case-control
2 of 3 studies were previously included in the 2007 AHRQ Report2
35 articles (34 studies) were previously included in at least one of the SRs included in the 2007 AHRQ report2
Inception through February 2015 PubMed, Cochrane, CABI
Ever versus never breastfed OR, 0.78 (95% CI, 0.74 to 0.82), I2=72, 98 studies Total breastfeeding duration (mos) versus never breastfed <6: OR, 0.93 (95% CI, 0.88 to 0.99), I2=59, 39 studies 6-12: OR, 0.91 (95% CI, 0.87 to 0.96), I2=23, 36 studies >12: OR, 0.74 (95% CI, 0.69 to 0.79), I2=62, 50 studies
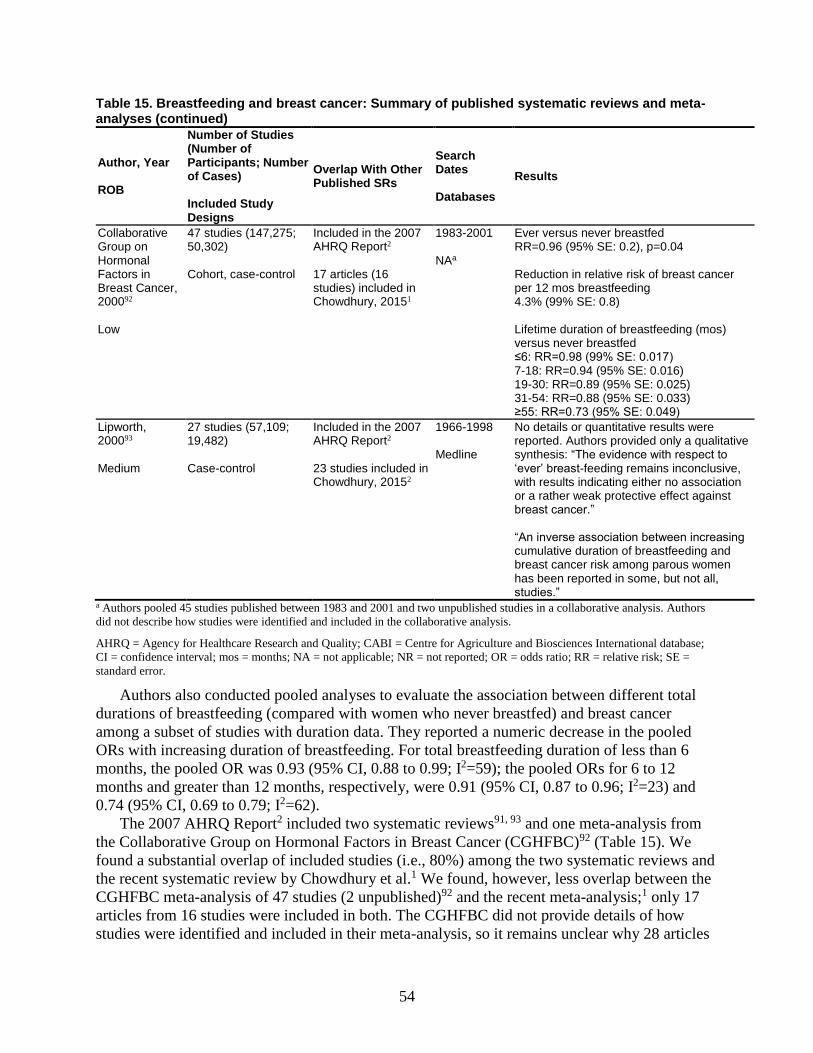
54
Table 15. Breastfeeding and breast cancer: Summary of published systematic reviews and meta-analyses (continued)
Author, Year
ROB
Number of Studies (Number of Participants; Number of Cases)
Included Study Designs
Overlap With Other Published SRs
Search Dates
Databases
Results
Collaborative Group on Hormonal Factors in Breast Cancer, 200092
Low
47 studies (147,275; 50,302) Cohort, case-control
Included in the 2007 AHRQ Report2
17 articles (16 studies) included in Chowdhury, 20151
1983-2001 NAa
Ever versus never breastfed RR=0.96 (95% SE: 0.2), p=0.04 Reduction in relative risk of breast cancer per 12 mos breastfeeding 4.3% (99% SE: 0.8) Lifetime duration of breastfeeding (mos) versus never breastfed ≤6: RR=0.98 (99% SE: 0.017) 7-18: RR=0.94 (95% SE: 0.016) 19-30: RR=0.89 (95% SE: 0.025) 31-54: RR=0.88 (95% SE: 0.033) ≥55: RR=0.73 (95% SE: 0.049)
Lipworth, 200093
Medium
27 studies (57,109; 19,482) Case-control
Included in the 2007 AHRQ Report2
23 studies included in Chowdhury, 20152
1966-1998 Medline
No details or quantitative results were reported. Authors provided only a qualitative synthesis: “The evidence with respect to ‘ever’ breast-feeding remains inconclusive, with results indicating either no association or a rather weak protective effect against breast cancer.” “An inverse association between increasing cumulative duration of breastfeeding and breast cancer risk among parous women has been reported in some, but not all, studies.”
a Authors pooled 45 studies published between 1983 and 2001 and two unpublished studies in a collaborative analysis. Authors
did not describe how studies were identified and included in the collaborative analysis.
AHRQ = Agency for Healthcare Research and Quality; CABI = Centre for Agriculture and Biosciences International database;
CI = confidence interval; mos = months; NA = not applicable; NR = not reported; OR = odds ratio; RR = relative risk; SE =
standard error.
Authors also conducted pooled analyses to evaluate the association between different total
durations of breastfeeding (compared with women who never breastfed) and breast cancer
among a subset of studies with duration data. They reported a numeric decrease in the pooled
ORs with increasing duration of breastfeeding. For total breastfeeding duration of less than 6
months, the pooled OR was 0.93 (95% CI, 0.88 to 0.99; I2=59); the pooled ORs for 6 to 12
months and greater than 12 months, respectively, were 0.91 (95% CI, 0.87 to 0.96; I2=23) and
0.74 (95% CI, 0.69 to 0.79; I2=62).
The 2007 AHRQ Report2 included two systematic reviews91, 93 and one meta-analysis from
the Collaborative Group on Hormonal Factors in Breast Cancer (CGHFBC)92 (Table 15). We
found a substantial overlap of included studies (i.e., 80%) among the two systematic reviews and
the recent systematic review by Chowdhury et al.1 We found, however, less overlap between the
CGHFBC meta-analysis of 47 studies (2 unpublished)92 and the recent meta-analysis;1 only 17
articles from 16 studies were included in both. The CGHFBC did not provide details of how
studies were identified and included in their meta-analysis, so it remains unclear why 28 articles

55
from 26 studies from the CGHFBC analysis were not identified or included by Chowdhury et al.1
Regardless of overlap (or lack thereof), all systematic reviews and meta-analyses included in the
2007 AHRQ Report2 reported a non-significant reduced risk of breast cancer among women who
had ever breastfed. The authors also reported varying degrees of an inverse association between
increasing duration of breastfeeding and breast cancer risk. The results are consistent in direction
and magnitude with pooled results reported by Chowdhury et al.1
Tumor Subtypes of Breast Cancer Defined by Hormone Receptor Status One recent systematic review rated unclear ROB examined the association between ever
breastfeeding and subsequent tumor subtypes of breast cancer, defined by hormone receptor
status, in the mother (Appendix Tables C-19 to C-22).94 The authors searched PubMed and
Embase from inception through October 2014 and included cohort and case-control studies that
reported information on hormone receptor (HR) (estrogen and progesterone receptors) and HER2
expression. They defined the breast cancer subtypes as (a) luminal (HR+ and HER2+/-), (b)
HER2 (HR- and HER2+), or (c) triple negative (HR- and HER2-). They used random effects
meta-analysis to estimate pooled ORs and identified heterogeneity using Cochrane’s Q statistic
and I2. Authors reported no evidence of publication bias according to the Macaskill method (i.e.,
funnel plot regression of the log OR on the sample size using inverse variance weighting).
All 11 included studies, except for two case-control studies from China and Japan, were
conducted in the United States; the studies were published between 2008 and 2014. The pooled
OR for the association between ever breastfeeding and luminal breast cancer from 9 studies
(169,870 women) was 0.77 (95% CI, 0.66 to 0.88; I2=79). The pooled OR for the HER2 and
triple negative subtypes were 0.78 (95% CI, 0.59 to 1.03; I2=46; 8 studies of 14,266 women) and
0.79 (95% CI, 0.6 to 0.94; I2=65; 11 studies of 176,340 women), respectively. The authors
reported that ORs were lower among case-control than among cohort or population-based case-
control studies, but also acknowledged the potential for confounding by study location because
the case-control studies were conducted in Asia.
Breast Cancer: Individual Studies
Breast Cancer
Characteristics Two cohort studies95, 96 and 15 case-control studies,97-111 published since the 2007 AHRQ
Report2 and not included in the systematic reviews by Chowdhury et al.1 or Lambertini et al.,94
evaluated the association between ever breastfeeding or duration of breastfeeding and overall
breast cancer (Table 16, Table 17, Appendix F). One medium-rated ROB cohort study was
conducted in Japan and compared mixed feeding (breastfeeding and formula feeding) and
formula-only feeding with exclusive breastfeeding.96 Over 26,000 of these women in the Ohsaki
National Health Insurance Cohort Study were followed for 11 years; 148 incident breast cancer
cases were identified.96 The other medium-rated ROB cohort study combined the hormone trial
and the observational study of the Women’s Health Initiative (WHI) into one cohort for analysis;
24,095 women in the hormone trial and 45,263 women in the observational study were followed
for a median duration of 7.9 years. The WHI evaluated the association between both ever
breastfed and duration of breastfeeding and breast cancer, and presented results for each group of

56
women, defined by which WHI study they participated in and which hormone therapy group
they were members of.95
We rated seven of the case-control studies as medium ROB; the studies were conducted in
the United States,99, 105, 108, 111 Spain,100 and Poland.109 The remaining case-control studies were
rated high ROB and were conducted in Saudi Arabia,97, 98 Germany,102, 103 Greece,101 Italy,106
Poland,104 the United Kingdom,110 and the United States.110 For the most part, ever breastfeeding
was not defined further with the exception of one study that described it as ≥1 month of
breastfeeding.99 In analyses that examined duration, never breastfed was the referent group, with
a few exceptions. Some studies used durations up to 3 months110 and 12 months98 as the referent
group; one study in Spain actually grouped women into two categories where women reported
whether or not they met a 2007 recommendation (from the World Cancer Research Fund and the
American Institute of Cancer Research) of cumulatively breastfeeding for at least 6 months.100
One medium ROB case-control study in the United States evaluated the risk of histologic
subtypes of breast cancer that included ductal, lobular, and mixed ductal/lobular breast cancers;
histologic subtype was determined by centralized pathology review for a vast majority of the
cases.99 Finally, another medium ROB case-control study in the United States evaluated the risk
of breast cancer among BRCA mutation carriers and noncarriers; the BRCA genes of only the
cases were sequenced.105
Results The WHI cohort study reported no statistically significant association between ever
breastfeeding and breast cancer,111 but in the Ohsaki National Health Insurance Cohort Study in
Japan, investigators report that women who only formula-fed their children had an 80 percent
increased risk of breast cancer compared with women who exclusively breastfed their children
(HR, 1.80; 95% CI, 1.14 to 2.86). The hazard was numerically increased, but not statistically
significant, for women who both breast- and formula-fed their children.96 Beaber et al.99 reported
a statistically significant decrease in risk of ductal breast cancer (OR, 0.7; 95% CI, 0.5 to 0.9),
but not lobular or mixed ductal/lobular breast cancers, and two other studies found varying
magnitudes in the statistically significant decrease of odds of breast cancer with ever
breastfeeding.108, 112 An Italian case-control study reported an 82 percent increased risk of breast
cancer when comparing women who never breastfed with women who had106; two other studies
reported a higher prevalence of breastfeeding among controls than cases but results were not
significant. There was one study in Germany in which more cases than controls reported ever
breastfeeding.103 Finally, Lee and colleagues reported that the prevalence of breastfeeding among
controls and cases who were BRCA carriers was 88 percent; the prevalence of breastfeeding
among cases who were not BRCA carriers was 79 percent (Table 16, Appendix F).105

57
Table 16. Ever breastfeeding and breast cancer
Author, Year
Country
Study Design
ROB
Results for Ever versus Never Breastfeedinga
Al-Amri, 201597
Saudi Arabia
Case-control High
OR, 0.30 (95% CI, 0.13 to 0.69)
Beaber, 200899
US
Case-control Medium
Ductal BC: OR, 0.7 (95% CI, 0.5 to 0.9)b Lobular BC: OR, 0.9 (95% CI, 0.7 to 1.3)b Ductal/Lobular BC: OR, 0.9 (95% CI, 0.6 to 1.4)b
Ge, 2015102
Germany
Case-control High
Cases: 63% Controls: 67%
Hadji, 2007103
Germany
Case-control High
Cases: 69% Controls: 52%
Lee, 2008105
US
Case-control Medium
BRCA Cases: 88%c Non-BRCA Cases: 79%c Controls: 88%c
Lumachi, 2010113
Italy
Case-control High
OR, 1.82 (95% CI, 1.20 to 2.77)d
Phillips, 2009108
United States
Case-control Medium
OR, 0.77 (95% CI, 0.67 to 0.89)
Ruszczyk, 2016111
United States
Case-control Medium
Cases: 59% Controls: 66%
Stendell-Hollis, 201395
United States
Cohort Medium
WHI Hormone Trial CEE HR, 0.72 (0.50, 1.06) CEE Placebo HR, 1.12 (0.80, 1.57) CEE/MPA HR, 1.06 (0.83, 1.36) CEE/MPA Placebo HR, 0.92 (0.70, 1.21) WHI Observational Study CEE HR, 1.11 (0.89, 1.39) CEE/MPA HR, 1.16 (0.91, 1.47) No prior HT HR, 1.00 (0.86, 1.18) Prior HT HR, 0.97 (0.78, 1.22)
Sugaware, 201396
Japan
Cohort Medium
Mixed feeding: HR, 1.12 (95% CI, 0.92 to 1.37)e Formula feeding: HR, 1.80 (95% CI, 1.14 to 2.86)e p for trend=0.014
a Never breastfed is the referent group for all comparisons, except when otherwise footnoted. b Ever breastfed was defined as ≥1 month. c Analysis is among women who had a full-term pregnancy. d Referent group is ever breastfed. e Referent group is exclusively breastfed.
BC = breast cancer; CEE = conjugated equine estrogen; CI = confidence interval; HR = hazard ratio; HT = hormone therapy;
MPA = medroxyprogesterone acetate; OR = odds ratio; ROB = risk of bias; WHI = Women’s Health Initiative Study.
Ten of thirteen studies did not report a significant inverse association between increasing
duration of breastfeeding and breast cancer risk (Table 17, Appendix F); confidence intervals
were wide and overlapping. Women in a small case-control study in Saudi Arabia were 44
percent less likely to develop breast cancer if they breastfed for ≥12 months (compared with
breastfeeding for <12 months), but results were unadjusted for any potential confounders
(OR=0.56; 95% CI: 0.35 to 0.88).98 Two other medium ROB case-control studies did report a
significant trend between decreased risk of breast cancer and increased duration107 and with ≥12
months of breastfeeding (but not 4 to 11 months).110 In the German study where more cases

58
reported breastfeeding, multiple linear regression indicated that women with breast cancer had a
significantly longer duration of breastfeeding, but specific details were not provided.103 Among
cases who were not BRCA carriers, there was a significant trend (p=0.002) of decreased breast
cancer risk associated with increased duration of breastfeeding; there was no trend of decreased
breast cancer risk with increased breastfeeding duration among cases who were BRCA carriers
(p=0.83).105
Table 17. Duration of breastfeeding and breast cancer
Author, Year
Country
Study Design
ROB
Results for Duration of Breastfeedinga
Al-Amri, 201597
Saudi Arabia
Case-control High
>2 yrs: OR, 1.68 (95% CI, 0.98 to 4.53)b Referent group is unclear
Al-Qutub, 201398
Saudi Arabia
Case-control High
≥12 mos: OR, 0.56 (95% CI, 0.35 to 0.88)b Referent group=<12 mos
Beaber, 200899
United States
Case-control Medium
Ductal BC <1 mos: OR, 1.1 (95% CI, 0.6 to 1.9) 1.0-5.9 mos: OR, 0.7 (95% CI, 0.5 to 0.9) 6.0-11.9 mos: OR, 0.8 (95% CI, 0.5 to 1.2) 12.0-23.9 mos: OR, 0.8 (95% CI, 0.5 to 1.3) ≥24.0 mos: OR, 0.6 (95% CI, 0.3 to 1.0) p for trend=0.43 Lobular BC <1 mos: OR, 1.0 (95% CI, 0.5 to 1.9) 1.0-5.9 mos: OR, 0.9 (95% CI, 0.6 to 1.3) 6.0-11.9 mos: OR, 1.0 (95% CI, 0.6 to 1.6) 12.0-23.9 mos: OR, 1.1 (95% CI, 0.7 to 1.8) ≥24.0 mos: OR, 0.8 (95% CI, 0.4 to 1.6) p for trend=0.85 Ductal/Lobular BC <1 month: OR, 1.4 (95% CI, 0.7 to 3.0) 1.0-5.9 mos: OR, 0.7 (95% CI, 0.4 to 1.2) 6.0-11.9 mos: OR, 0.8 (95% CI, 0.4 to 1.5) 12.0-23.9 mos: OR, 1.1 (95% CI, 0.6 to 2.0) ≥24.0 mos: OR, 1.9 (95% CI, 1.0 to 3.6) p for trend=0.11
Castello, 2015100
Spain
Case-control Medium
OR, 0.95 (95% CI, 0.70 to 1.28)c
Dalamaga, 2011101
Greece
Case-control High
>6 mos breastfeeding Cases: 44% Controls: 50%
Hadji, 2007103
Germany
Case-control High
Multiple linear regression showed that women with breast cancer had a significantly longer duration of breastfeeding; no other details were provided.
Kruk, 2014104
Poland
Case-control High
Compared to case subjects, controls reported a longer duration of breastfeeding; no other details were provided.

59
Table 17. Duration of breastfeeding and breast cancer (continued)
Author, Year
Country
Study Design
ROB
Results for Duration of Breastfeedinga
Lee, 2008105
US
Case-control Medium
BRCA Cases
<1-6 mos: OR, 1.31 (95% CI, 0.45 to 3.82) 7-23 mos: OR, 0.73 (95% CI, 0.23 to 2.30) ≥24 mos: OR, 1.29 (95% CI, 0.36 to 4.61) p for trend=0.83 Non-BRCA Cases <1-6 mos: OR, 0.66 (95% CI, 0.43 to 1.02) 7-23 mos: OR, 0.52 (95% CI, 0.33 to 0.81) ≥24 mos: OR, 0.49 (95% CI, 0.29 to 0.81) p for trend=0.002
Ma, 2006107
US
Case-control Medium
<1 month: OR, 0.99 (95% CI, 0.56 to 1.77) 1-6 mos: OR, 0.58 (95% CI, 0.37 to 0.91) 7-23 mos: OR, 0.52 (95% CI, 0.33 to 0.82) ≥24 mos: OR, 0.51 (95% CI, 0.30 to 0.86) p for trend=0.001
Pieta, 2008109
Poland
Case-control Medium
Mean duration of BFd Cases: 8.3 mos Controls: 6.8 mos
Press, 2010110
United Kingdom/United States
Case-control Medium
United Kingdom 4-11 mos: OR, 1.05 (95% CI, 0.84 to 1.31)b ≥12 mos: OR, 0.49 (95% CI, 0.38 to 0.64)b United States 4-11 mos: OR, 0.91 (95% CI, 0.78 to 1.07)b ≥12 mos: OR, 0.81 (95% CI, 0.68 to 0.96)b Referent group=0 to 3 mos
Ruszczyk, 2016111
United States
Case-control Medium
0-12 mos: OR, 0.76 (95% CI, 0.49 to 1.19)e >12 mos: OR, 0.61 (95% CI, 0.37 to 1.02)e p trend = 0.07
Stendell-Hollis, 201395
United States
Cohort Medium
WHI Hormone Trial CEE 1-3 mos: HR, 0.70 (95% CI, 0.41 to 1.20) 4-12 mos: HR, 0.78 (95% CI, 0.48 to 1.26) 13-23 mos: HR, 0.72 (95% CI, 0.35 to 1.46) ≥24 mos: HR, 0.64 (95% CI, 0.27 to 1.49) CEE Placebo 1-3 mos: HR, 0.86 (95% CI, 0.52 to 1.42) 4-12 mos: HR, 1.41 (95% CI, 0.95 to 2.08) 13-23 mos: HR, 1.15 (95% CI, 0.64 to 2.06) ≥24 mos: HR, 0.71 (95% CI, 0.30 to 1.64) CEE/MPA 1-3 mos: HR, 1.13 (95% CI, 0.81 to 1.59) 4-12 mos: HR, 1.02 (95% CI, 0.75 to 1.39) 13-23 mos: HR, 1.17 (95% CI, 0.79 to 1.72) ≥24 mos: HR, 0.89 (95% CI, 0.54 to 1.45) CEE/MPA Placebo 1-3 mos: HR, 0.87 (95% CI, 0.59 to 1.30) 4-12 mos: HR, 1.00 (95% CI, 0.71 to 1.40) 13-23 mos: HR, 1.00 (95% CI, 0.65 to 1.54) ≥24 mos: HR, 0.70 (95% CI, 0.40 to 1.24)

60
Table 17. Duration of breastfeeding and breast cancer (continued)
Author, Year
Country
Study Design
ROB
Results for Duration of Breastfeedinga
Stendell-Hollis, 201395
WHI Observational Study
CEE 1-3 mos: HR, 1.08 (95% CI, 0.80 to 1.46) 4-12 mos: HR, 1.15, (95% CI, 0.87 to 1.51) 13-23 mos: HR, 1.19 (95% CI, 0.81 to 1.76) ≥24 mos: HR, 0.96 (95% CI, 0.55 to 1.68) CEE/MPA 1-3 mos: HR, 1.11 (95% CI, 0.79 to 1.55) 4-12 mos: HR, 1.06 (95% CI, 0.79 to 1.43) 13-23 mos: HR, 1.38 (95% CI, 0.97 to 1.97) ≥24 mos: HR, 1.32 (95% CI, 0.84 to 2.06) No Prior HT 1-3 mos: HR, 0.99 (95% CI, 0.79 to 1.24) 4-12 mos: HR, 0.96 (95% CI, 0.78 to 1.18) 13-23 mos: HR, 1.01 (95% CI, 0.77 to 1.32) ≥24 mos: HR, 1.22 (95% CI, 0.90 to 1.66) Prior HT 1-3 mos: HR, 0.94 (95% CI, 0.68 to 1.29) 4-12 mos: HR, 0.92 (95% CI, 0.69 to 1.23) 13-23 mos: HR, 1.15 (95% CI, 0.79 to 1.67) ≥24 mos: HR, 1.05 (95% CI, 0.64 to 1.72)
a Never breastfed is the referent group for all comparisons, except when otherwise noted. b Results are unadjusted. c OR is for women who met a recommendation of cumulative breastfeeding ≥6 months compared to women who did not meet a
recommendation. The recommendation was issued by the World Cancer Research Fund and the American Institute of Cancer
Research in 2007. d A nonsignificant OR greater than the null is reported, but it is unclear if the analysis compared malignant breast cancer cases to
controls or if the benign neoplasm group of ‘cases’ was included somehow. e Cases were diagnosed with invasive ductal carcinoma.
BC = breast cancer; CEE = conjugated equine estrogen; CI = confidence interval; HR = hazard ratio; HT = hormone therapy;
MPA = medroxyprogesterone acetate; mos = month(s); OR = odds ratio; WHI = Women’s Health Initiative Study; yrs = years.
Breast Cancer Among BRCA1 and BRCA2 Mutation Carriers Characteristics We included one case-control study of 2,854 women with invasive breast cancer and 2,854
women without invasive breast cancer who were matched to the cases on BRCA mutation type,
year of birth, and country of residence; the study was rated medium ROB (Appendix Table C-
56). The study was nested within a cohort study that recruited women who sought testing for
BRCA1 and BRCA2 mutations because of a family history of breast or ovarian cancer; the
women were recruited from 70 centers in 12 countries.114 The results presented here supersede
(a) results presented in the 2007 AHRQ Report2 from a 2004 article by Jernstrom et al.115 that
included only 965 matched pairs of cases and controls from 53 centers in six countries and (b)
results published in 2012 by Kotsopoulos et al.116 that included 1,665 matched pairs from 62
centers in seven countries. Authors estimated ORs and 95 percent CIs for the association
between multiple durations of breastfeeding and invasive breast cancer using conditional logistic
regression, adjusting for age at menarche, parity, and oral contraceptive use.
A majority of the women (72%) were BRCA1 carriers and the mean age at interview was 47
years; the mean age at diagnosis among cases was 40 years, indicating that at least some of the
cases were prevalent. Cases breastfed for a mean of 9.6 months (range: 0 to 147 months); 79
percent of cases were parous. Controls breastfed for a mean of 7.5 months (range: 0 to 102
months); 80 percent of controls were parous.

61
Results The study found a significant inverse relationship between duration of breastfeeding and
breast cancer risk among BRCA1 mutation carriers (p for trend<0.0001), but not BRCA2
mutation carriers (p for trend=0.68).114 Among 1,847 BRCA1 carrier pairs, the ORs for ≤1 year, 1
to ≤2 years, 2 to ≤3 years, and >3 years compared with never breastfeeding were 0.81 (95% CI,
0.66 to 1.00), 0.65 (95% CI, 0.50 to 0.85), 0.51 (95% CI, 0.35 to 0.75), and 0.45 (95% CI, 0.30
to 0.68), respectively. Among 714 BRCA2 carrier pairs, the ORs were 1.03, 1.04, 1.33, and 1.02
for the same duration categories, respectively; all 95 percent CIs included the null.
Breast Cancer In Situ
Characteristics We included one cohort and two population-based case-controls studies, all rated medium
ROB, that evaluated the association between breastfeeding and incident ductal carcinoma in situ
(DCIS)108, 117 or incident breast cancer defined by a mix of invasive ductal carcinoma and
DCIS,111 confirmed by pathology (Table 18, Appendix F). The cohort study included 64,060
women originally enrolled in the WHI clinical trials that were followed for a median of 12
years.117 All studies were conducted in the United States and the percentage of nonwhite
participants ranged from 17%117 to 63%.111 The Women’s Circle of Health Study was a
multicenter case-control study of breast cancer in 2,270 African-American and European
American women in metropolitan New York City and seven counties in New Jersey; the high
percentage of African-American women in the study (56% of cases and 63% of controls) was
reported to be representative of the general community regarding education, income, marital
status, and obesity status.111
Results All three studies reported information on ever breastfeeding. Fifty-four percent of the cases
and 52 percent of the noncases from the WHI cohort,117 as well as 67 percent of the cases and 66
percent of the controls in the WCHS study111 reported ever breastfeeding. The smallest study
found no association between ever breastfeeding and DCIS (a case-control study of 904 women
[OR, 1.02; 95% CI, 0.78 to 1.34]). The results remained nonsignificant, with wide CIs, when the
DCIS cases were further categorized by tumor grade (high, medium/low).108 Similarly, the WHI
cohort found no association between duration of breastfeeding and DCIS (p for trend=0.94).117
Finally, in the case-control study where cases were diagnosed with a mix of invasive ductal
carcinoma and DCIS, duration of breastfeeding, dichotomized at 12 months, was not associated
with a diagnosis (p for trend=0.49).

62
Table 18. Breastfeeding and breast cancer in situ
Author, Year Study Design ROB
Description of Study (N) Description of Breast Cancer Cases (N)
Population Characteristics
Resultsa Confounders Adjusted For
Kabat117
Cohort Medium
Cohort of women, 50 to 79 years of age, originally randomized in the WHI clinical trial, and followed for a median of 12 yrs (64,060) Incident diagnosis of DCIS, verified by centralized review of medical records and pathology reports (664)
Mean age (yrs) Cases: 62 Noncases: 63 Nonwhite Cases: 17% Noncases: 18% Parous Cases: 89% Noncases: 89%
Ever Breastfed Cases: 54% Noncases: 52% Duration of Breastfeeding 1-6 mos: HR, 1.05 (95% CI, 0.86 to 1.28) 7-12 mos: HR, 1.04 (95% CI, 0.80 to 1.36) >12 mos: HR, 1.01 (95% CI, 0.80 to 1.29)
Age, education, hormone therapy, family history of breast cancer, history of breast biopsy, mammograms in past two yrs, age at menarche, age at menopause, and parity
Phillips, 2009108
Case-control Medium
Population-based case-control study; cases were rapidly ascertained and controls were frequency-matched to cases on race and age (904) First diagnosis of DCIS, pathology confirmed (446)
Mean age (yrs) Cases: 55 Controls: 55 Nonwhite Cases: 22% Controls: 15% Parous Cases: 85% Controls: 88%
Ever Breastfed DCIS OR, 1.02 (95% CI, 0.78 to 1.34) High-grade DCIS OR, 0.82 (95% CI, 0.57 to 1.20) Medium/low-grade DCIS OR, 1.02 (95% CI, 0.72 to 1.42)
Age, race, and frequency-matching offset terms
Ruszczyk, 2016111
Case-control Medium
Population-based case-control study of African-American and white women, 20 to 75 yrs; cases were rapidly ascertained through hospitals and cancer registries and controls were frequency matched to cases by telephone prefixes (2,270)c Histologically confirmed incident mixed breast cancer, defined by a mix of IDC and DCIS (650)
Mean age (yrs) Cases: 51 Controls: 50 Nonwhite Cases: 56% Controls: 63% Parous Cases: 77% Controls: 78%
Ever Breastfed IDC/DCIS Cases: 67% Controls: 66% Duration of Breastfeeding >0-12 mos: OR, 1.15 (95% CI, 0.88 to 1.50)b >12 mos: OR, 0.94 (95% CI, 0.70 to 1.27)b
Age, race, birthplace, family history, composite screening score, education, OC use, age at menarche, parity, age at first birth, and menopausal status
a Compared to never breastfed, unless otherwise specified. b Among parous women only. c Study enrolled 1,620 controls, 181 pure IDC cases, and 650 cases with mixed IDC and DCIS; only the 1,620 controls and 650
mixed cases are reported here.
CI = confidence interval; DCIS = ductal carcinoma in situ; IDC = invasive ductal carcinoma; mos = months; NA = not
applicable; NR = not reported; OC = oral contraceptive; OR, odds ratio; RR = relative risk; WHI = Women’s Health Initiative
Study; yrs = years.
Tumor Subtypes of Breast Cancer Defined by Hormone Receptor Status
Characteristics We included two medium ROB cohort studies118, 119 and two case-control studies, one rated
medium ROB and one rated high ROB,107, 120 that evaluated the association between
breastfeeding and breast cancer subtypes defined by hormone receptor status [i.e., estrogen

63
receptor (ER), progesterone receptor (PR), and human epidermal growth factor receptor 2
(HER2neu)] (Table 19, Appendix F). One study pooled data from two cohort studies [Black
Women’s Health Study (BWHS) and Nurses’ Health Study II (NHSII)] and evaluated the
association between duration of breastfeeding (<6 months and ≥6 months) and ER+ breast
cancer; there were 140,194 women, with 1,506 confirmed-by-pathology ER+ breast cancer cases
after over 1.5 million person-years of follow up.119 The European Prospective Investigation into
Cancer and Nutrition (EPIC) study followed women from 10 western European countries for a
median of 11 years and evaluated the association between ever breastfeeding and duration of
breastfeeding with ER+/PR+ and ER-/PR- breast cancer. A population-based case-control study
of 2,238 women in Los Angeles County, California, also included women with ER+/PR+ and
ER-/PR- breast cancer, but evaluated only duration of breastfeeding. Finally, a small hospital-
based case-control study at the MD Anderson Cancer Center in Texas evaluated the association
between ever breastfeeding and inflammatory breast cancer further defined by hormone receptor
status: (a) triple negative breast cancer (ER-/PR-/HER2neu-), (b) HER2neu breast cancer (any
ER/PR status/HER2neu+), and (c) luminal breast cancer (ER+/any PR/HER2neu-).120 The mean
age of women enrolled in these four studies ranged from 39119 to 51 years.120
Results The EPIC study reported no association between breastfeeding and breast cancer; the hazard
ratios for ever breastfeeding and ER+/PR+ and ER-/PR- breast cancers were 0.99 and 0.98,
respectively, and CIs included the null. The study reported a lack of association regardless of
breastfeeding duration (1 to 3 months through ≥18 months).118 Ma and colleagues107 reported an
inverse association between both ER+/PR+ and ER-/PR- breast cancer and increasing duration of
breastfeeding (p for trend=0.002 and 0.03, respectively). The ORs for ≥24 months of
breastfeeding were 0.49 (95% CI, 0.27 to 0.87) and 0.62 (95% CI, 0.32 to 1.21) for ER+/PR+
and ER-/PR- breast cancers, respectively.107 The study reported s a nonsignificant decrease in the
risk of ER+ breast cancer with both <6 months and ≥6 months of breastfeeding in the large study
that pooled data from the BWHS and NHSII.119 When the authors stratified by race, they found a
nonsignificant increase in ER+ breast cancer risk among black women, regardless of duration.
For white women, the authors found an inverse association between <6 months breastfeeding and
ER+ breast cancer (HR, 0.76; 95% CI, 0.60 to 0.98) but not ≥6 months. Notably, although 81
percent of the white women in the studies reported ever breastfeeding, only 44 percent of the
black women reported the same.119 Finally, Atkinson et al.120 reported a decrease in the risk of
triple-negative (OR, 0.30; 95% CI, 0.15 to 0.62) and luminal (OR, 0.35; 95% CI, 0.18 to 0.68)
but not HER2neu+ (OR, 1.01; 95% CI, 0.55 to 1.87) breast cancers with ever breastfeeding.120

64
Table 19. Breastfeeding and tumor subtypes of breast cancer defined by hormone receptor status
Author, Year
Study Design
ROB
Description of Study (N)
Description of Breast Cancer Cases (N)
Population Characteristics
Resultsa Confounders Adjusted For
Atkinson, 2016120
Case-control High
Hospital-based case-control study in Texas cancer center; controls were undergoing routine mammography screening (620) Incident inflammatory breast cancerc (224)
Mean age (yrs): Cases: 51 Controls: 51 Nonwhite: Cases: 23% Controls: 0%
Ever breastfedb Triple-negative IBCd OR, 0.30 (95% CI, 0.15 to 0.62) HER2neu+ IBCd OR, 1.01 (95% CI, 0.55 to 1.87) Luminal IBCd OR, 0.35 (95% CI, 0.18 to 0.68)
Age at menarche, menopausal status, number of children, age at first pregnancy, breastfeeding history, BMI, smoking history, breast cancer family history
Ma, 2006107
Case-control Medium
Population-based case-control study of cases identified by the CSP and neighborhood controls matched on age and race (2,238) First primary invasive breast cancer, histologically confirmed (1,794)e
Mean age (yrs): Cases: 43 Controls:43 Nonwhite: Cases: 12% Controls: 8%
Duration of BFb ER+/PR+ cases <1 mos: OR, 1.01 (95% CI, 0.53 to 1.90) 1-6 mos: OR, 0.57 (95% CI, 0.34 to 0.94) 7-23 mos: OR, 0.52 (95% CI, 0.31 to 0.87) 24+ mos: OR, 0.49 (95% CI, 0.27 to 0.87) p for trend=0.002 ER-/PR- cases <1 mos: OR, 1.19 (95% CI, 0.59 to 2.39) 1-6 mos: OR, 0.72 (95% CI, 0.41 to 1.27) 7-23 mos: OR, 0.55 (95% CI, 0.31 to 0.98) 24+ mos: OR, 0.62 (95% CI, 0.32 to 1.21) p for trend=0.03
Race, age, education, breast cancer family history, age at menarche, full-term pregnancies (number and age at), BMI, OC use alcohol use, menopausal status, and HRT use
Ritte, 2013118
Cohort Medium
Cohort study of women enrolled in the EPIC study, recruited from 23 centers in 10 western European countries, and followed for a median 11 yrs (311,097) First primary invasive breast cancer (9,456)g
Median age at recruitment (yrs): 51 Ever breastfed: 84% Median duration of breastfeeding: 6 mos
Ever breastfedb ER+/PR+ cases HR, 0.99 (95% CI, 0.89 to 1.09) ER-/PR- cases HR, 0.98 (95% CI, 0.81 to 1.17) Duration of BFf ER+/PR+ cases 1-3 mos: HR, 1.04 (95% CI, 0.89 to 1.20) 4-6 mos: HR, 0.97 (95% CI, 0.83 to 1.14) 7-12 mos: HR, 0.97 (95% CI, 0.83 to 1.13) 13-17 mos: HR, 0.92 (95% CI, 0.75 to 1.12) ≥18 mos: HR, 1.11 (95% CI, 0.92 to 1.33) ER-/PR- cases 1-3 mos: HR, 0.91 (95% CI, 0.69 to 1.21) 4-6 mos: HR, 0.99 (95% CI, 0.74 to 1.32) 7-12 mos: HR, 0.91 (95% CI, 0.68 to 1.23) 13-17 mos: HR, 1.12 (95% CI, 0.79 to 1.60) ≥18 mos: HR, 1.07 (95% CI, 0.75 to 1.51)
Age, EPIC center, BMI, height, menopausal status, HRT use, physical activity, smoking status, alcohol use, and education

65
Table 19. Breastfeeding and tumor subtypes of breast cancer defined by hormone receptor status (continued)
Author, Year
Study Design
ROB
Description of Study (N)
Description of Breast Cancer Cases (N)
Population Characteristics
Resultsa Confounders Adjusted For
Warner, 2013119
Cohort Medium
Two cohorts of 103,508 white and 37,406 African-American women enrolled in the BWHS and NHSII studies, with 1,582,083 person-yrs of follow-up (140,194) ER+ breast cancer, confirmed by pathology reports (1,506)
Mean age (yrs): Black: 39 White: 40 Parous: Black: 73% White: 79% Ever breastfed: Black: 44% White: 81% PR+ status: Black: 79% White: 86%
Duration of BFb All women <6 mos: HR, 0.85 (95% CI, 0.70 to 1.03) ≥6 mos: HR, 0.95 (95% CI, 0.81 to 1.10) Black women <6 mos: HR, 1.31 (95% CI, 0.96 to 1.80) ≥6 mos: HR, 1.27 (95% CI, 0.90 to 1.80) White women <6 mos: HR, 0.76 (95% CI, 0.60 to 0.98) ≥6 mos: HR, 0.90 (95% CI, 0.76 to 1.07)
Age, time, age at first birth, parity, age at menarche, menopausal status, age at menopause, family history, BMI, weight change since age 18, history of benign breast disease, alcohol use, OC use, and post-menopausal hormone use
a Compared to never breastfed, unless otherwise specified. b Among parous women. c Confirmed according to World IBC Consortium or AJCC criteria. The main characteristics of IBC include breast erythema and
edema, with or without an underlying palpable mass. d Triple negative breast cancer was defined by ER-/PR-/HER2neu- receptor status. HER2neu+ breast cancer was defined as any
ER/PR receptor status and HER2neu+ receptor status. Luminal breast cancer was defined as ER+ and/or PR+ and HER2neu-
receptor status. e Of the 1,794 breast cancer cases, 881 were ER+/PR+; 92 were ER+/PR-; 41 were ER-/PR+; 405 were ER-/PR-; 91 were
borderline or undecided ER/PR status; and 284 had no information on hormone receptor status. Only the cases identified as
ER+/PR+ or ER-/PR- were included in the hormone receptor-specific analyses and in this table. f Analysis is among parous women who breastfed; the referent group is women who breastfed for <1 month. g A total of 5,843 breast cancer cases had information on both ER and PR status (3,567 were ER+/PR+; 1,078 were ER+/PR-;
200 were ER-/PR+; and 998 were ER-/PR-).
AJCC = American Joint Committee on Cancer; BMI = body mass index; BWHS = Black Women’s Health Study; CI =
confidence interval; CSP = LA Cancer Surveillance Program; EPIC = European Prospective Investigation into Cancer and
Nutrition study; ER = estrogen receptor; HER2/HER2nue = human epidermal growth factor receptor 2; HR = hazard ratio; HRT
= hormone replacement therapy; IBC = inflammatory breast cancer; mos = months; NHSII = Nurses’ Health Study II; OC = oral
contraceptive; OR = odds ratio; PR = progesterone receptor; yrs = years.
All-Cause and Breast Cancer-Specific Mortality
Characteristics We included one medium ROB study of women in the EPIC prospective cohort study that
evaluated the association between breastfeeding and mortality (all-cause and breast cancer-
specific) after a mean follow up of 12.9 years (standard deviation=2.3 years) (Appendix F).121
The study included 322,972 (250,470 parous) women who were 25 to 70 years of age when they
were recruited from 23 centers in 10 European countries between 1992 and 2000. Exposure and
confounder data were collected at enrollment via questionnaires; mortality data were primarily
ascertained from cancer registries, boards of health, and death indices.

66
Results Among parous women, ever breastfeeding was associated with a decreased risk of all-cause
mortality (fully adjusted HR, 0.92; 95% CI, 0.87 to 0.97), but duration of breastfeeding was not
associated with all-cause mortality (p for trend=0.85). A total of 749 deaths were attributed to
breast cancer; the confidence intervals for the association with ever breastfeeding was spanned
the null (fully adjusted HR, 1.01; 95% CI, 0.79 to 1.29), and the study reported no statistically
significant trend between duration of breastfeeding and death due to breast cancer (p for
trend=0.35).
Ovarian Cancer: Systematic Reviews Three recent systematic reviews rated low122 or unclear ROB1, 106 examined the association
between breastfeeding and subsequent ovarian cancer in the mother (Table 20, Appendix Tables
C-19 to C22). Most of the studies included in the systematic reviews were conducted in the
United States, Europe, and Australia; seven studies were conducted in countries not categorized
by the United Nations Development Programme39 as very high or high human development
(Mexico, China, Thailand, Vietnam, and the Philippines) that contributed to one or more of the
systematic reviews. All three systematic reviews evaluated the association between ovarian
cancer and ever breastfeeding, and the duration of breastfeeding. One review, rated unclear
ROB, performed a quality assessment of included articles according to the Newcastle-Ottawa
Scale (NOS); approximately two-thirds of the studies were considered high quality but only 12
studies had a NOS score of “7.” The remaining studies had NOS scores ranging from “4” to
“6.”106 The other two systematic reviews1, 122 did not do a formal quality or ROB assessment, but
did perform a number of stratified analyses by factors related to potential biases (e.g., known
confounders, aspects of study design). Because of significant overlap among the 3 recent
systematic reviews, results from pooled analyses were very similar (Table 20, Appendix Tables
C-19 to C22). As such, we will describe in detail the most recent systematic review, published in
2015 and rated unclear ROB.1
Chowdhury et al.1 included five cohort and 36 case-control studies in their systematic review;
nine of the included studies were also included in the 2007 AHRQ review.2 The authors rated 27
(66%) of the studies as being of adequate quality, defined as having only one or none of the
following: selection bias, measurement bias, confounding bias, or attrition of 20 percent. They
used random effects meta-analysis to estimate pooled ORs when heterogeneity was high (I2>60%
or p for heterogeneity<0.010); reasons for heterogeneity were explored with subgroup analyses
and meta-regression for the main comparison of ever versus never breastfed. Authors reported no
evidence of publication bias using Begg’s test, Egger’s test, or funnel plot inspection.
Using data from all 41 included studies, the study found a pooled OR forever versus never
breastfeeding of 0.70 (95% CI, 0.64 to 0.77); the substantial heterogeneity (I2=70) of results
could not be explained in subgroup analyses. The authors noted that among 35 studies in high-
income countries, the association was significantly attenuated (pooled OR=0.74; 95% CI, 0.68 to
0.80) when compared with six studies in lower mid-income countries (pooled OR=0.48; 95% CI,
0.29 to 0.77), but the pooled estimates for two subgroups had substantial heterogeneity. The
inverse association between ever breastfeeding and ovarian cancer was also attenuated, but
remained significant, among cohort studies (pooled OR, 5 studies=0.87; 95% CI, 0.78 to 0.98),
studies that
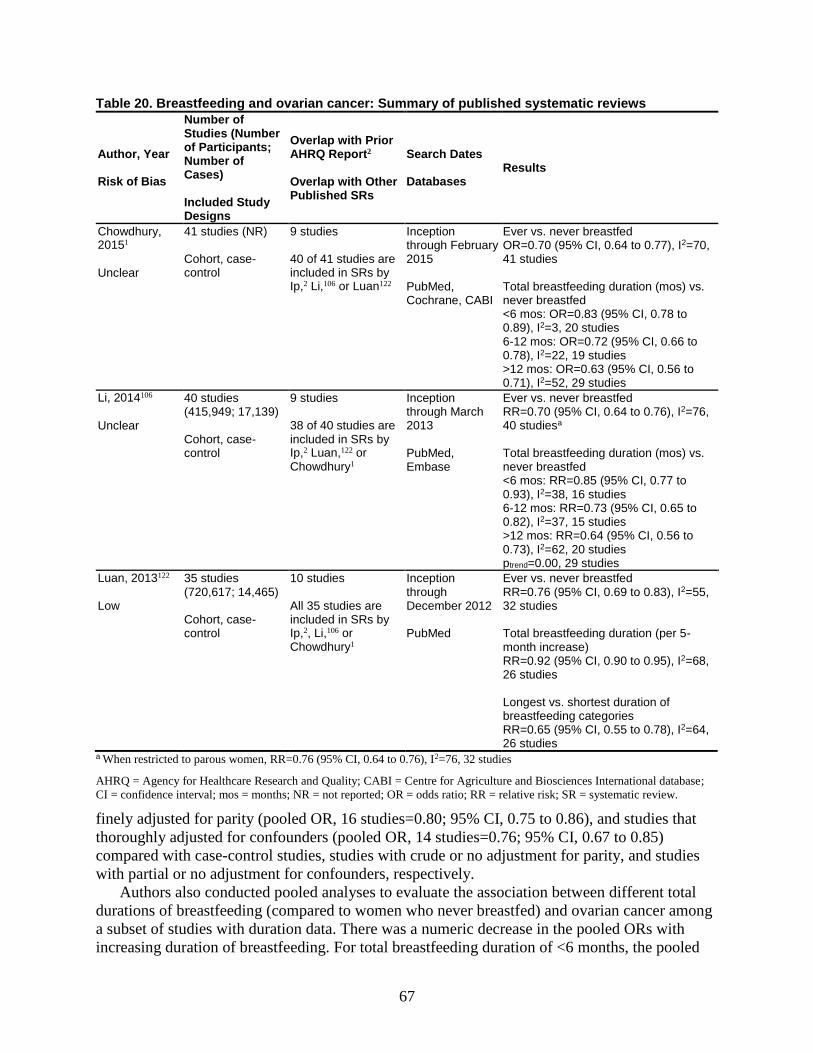
67
Table 20. Breastfeeding and ovarian cancer: Summary of published systematic reviews
Author, Year Risk of Bias
Number of Studies (Number of Participants; Number of Cases) Included Study Designs
Overlap with Prior AHRQ Report2 Overlap with Other Published SRs
Search Dates Databases
Results
Chowdhury, 20151
Unclear
41 studies (NR) Cohort, case-control
9 studies 40 of 41 studies are included in SRs by Ip,2 Li,106 or Luan122
Inception through February 2015 PubMed, Cochrane, CABI
Ever vs. never breastfed OR=0.70 (95% CI, 0.64 to 0.77), I2=70, 41 studies Total breastfeeding duration (mos) vs. never breastfed <6 mos: OR=0.83 (95% CI, 0.78 to 0.89), I2=3, 20 studies 6-12 mos: OR=0.72 (95% CI, 0.66 to 0.78), I2=22, 19 studies >12 mos: OR=0.63 (95% CI, 0.56 to 0.71), I2=52, 29 studies
Li, 2014106
Unclear
40 studies (415,949; 17,139) Cohort, case-control
9 studies 38 of 40 studies are included in SRs by Ip,2 Luan,122 or Chowdhury1
Inception through March 2013 PubMed, Embase
Ever vs. never breastfed RR=0.70 (95% CI, 0.64 to 0.76), I2=76, 40 studiesa Total breastfeeding duration (mos) vs. never breastfed <6 mos: RR=0.85 (95% CI, 0.77 to 0.93), I2=38, 16 studies 6-12 mos: RR=0.73 (95% CI, 0.65 to 0.82), I2=37, 15 studies >12 mos: RR=0.64 (95% CI, 0.56 to 0.73), I2=62, 20 studies ptrend=0.00, 29 studies
Luan, 2013122
Low
35 studies (720,617; 14,465) Cohort, case-control
10 studies All 35 studies are included in SRs by Ip,2, Li,106 or Chowdhury1
Inception through December 2012 PubMed
Ever vs. never breastfed RR=0.76 (95% CI, 0.69 to 0.83), I2=55, 32 studies Total breastfeeding duration (per 5-month increase) RR=0.92 (95% CI, 0.90 to 0.95), I2=68, 26 studies Longest vs. shortest duration of breastfeeding categories RR=0.65 (95% CI, 0.55 to 0.78), I2=64, 26 studies
a When restricted to parous women, RR=0.76 (95% CI, 0.64 to 0.76), I2=76, 32 studies
AHRQ = Agency for Healthcare Research and Quality; CABI = Centre for Agriculture and Biosciences International database;
CI = confidence interval; mos = months; NR = not reported; OR = odds ratio; RR = relative risk; SR = systematic review.
finely adjusted for parity (pooled OR, 16 studies=0.80; 95% CI, 0.75 to 0.86), and studies that
thoroughly adjusted for confounders (pooled OR, 14 studies=0.76; 95% CI, 0.67 to 0.85)
compared with case-control studies, studies with crude or no adjustment for parity, and studies
with partial or no adjustment for confounders, respectively.
Authors also conducted pooled analyses to evaluate the association between different total
durations of breastfeeding (compared to women who never breastfed) and ovarian cancer among
a subset of studies with duration data. There was a numeric decrease in the pooled ORs with
increasing duration of breastfeeding. For total breastfeeding duration of <6 months, the pooled

68
OR was 0.83 (95% CI, 0.78 to 0.89); the pooled ORs for 6 to 12 months and >12 months,
respectively, were 0.72 (95% CI, 0.66 to 0.78) and 0.63 (95% CI, 0.56 to 0.71).
Ovarian Cancer: Individual Studies
Characteristics We included four case-control studies123-126 of 2,131 women who were included in the 2007
AHRQ report by Ip2 but not included in subsequent systematic reviews (Table 21); these older
studies were conducted as early as 1959 in the United States and Canada. One study was a
pooled analysis of seven independent case-control studies123 among 465 black women. Three
studies included cases with nonmalignant (i.e., low malignant potential or borderline) tumors,123,
124, 126 and one study enrolled women with benign ovarian tumors as controls.125 The two oldest
studies, published in the 1960s, were rated high ROB by the authors of the 2007 AHRQ report.2
Two studies123, 126 evaluated the association between ever breastfeeding and ovarian cancer, and
three studies123-125 analyzed the association between different durations of breastfeeding and
ovarian cancer.
Table 21. Breastfeeding and ovarian cancer: Summary of individual studies
Author, Year Study Design Risk of Bias
Description of Study (N) Description of Ovarian Cancer Cases (N)
Population Characteristics
Results: Ever Breastfeda
Results: Duration of Breastfeedinga
Confounders Adjusted For
Gay, 2015127
Cohort Medium
Women, aged 50-64, enrolled in the Singapore Breast Cancer Project (28,107) Women diagnosed with incident ovarian cancer and reported to the Singapore Cancer Registry through 2012 (107)
Mean age (yrs): 57 Post-menopausal: 90% Current or prior use of HRT: 13%
HR=0.97 (95% CI, 0.63 to 1.51)b
≤1 year HR=1.09 (95% CI, 0.66 to 1.81)b >1 year HR=1.20 (95% CI, 0.72 to 2.01)b
Age, housing type, family history of breast cancer, race, BMI status, smoking status
Gierach, 2006128
Case-control Medium
Population-based case-control study in the Delaware Valley, USA, with controls frequency matched to cases on age and study area (1,151) Incident epithelial ovarian cancer, confirmed by pathologic review (521)
Mean age (yrs): 40-59 Nonwhite: 16%
Cases: 44% Controls: 51% p=0.04
NR None

69
Table 21. Breastfeeding and ovarian cancer: Summary of individual studies (continued)
Author, Year Study Design Risk of Bias
Description of Study (N) Description of Ovarian Cancer Cases (N)
Population Characteristics
Results: Ever Breastfeda
Results: Duration of Breastfeedinga
Confounders Adjusted For
John, 1993123
Case-control Mediumc
Pooled analysis of 7 case-control studies conducted in the USA between 1971 and 1986 (465) Epithelial ovarian cancer (72), ovarian tumors of low malignant potential (borderline cases) (35), and ovarian tumors of unknown behavior (3)
Mean age (yrs) Invasive cases: 53 Borderline cases: 37 Controls: NR Nonwhite: 100%
OR=0.90 (95% CI, 0.42 to 1.90)d Per month of breastfeeding OR=0.99 (p=0.57)d
1-5 mos OR=1.00 (95% CI, 0.39 to 2.60)d ≥6 mos OR=0.85 (95% CI, 0.36 to 2.00)d
Study, year of birth, age, parity
Jordan, 2008;129 Nagle, 2008130
Case-control Medium
Population-based case-control study in Australia, with controls frequency matched to cases on age and state of residence (2,309)129 and (1,740)130
Invasive serous epithelial ovarian cancer, confirmed by histopathology reports (801)129
Invasive endometrioid and clear cell epithelial ovarian cancers, confirmed by histopathology reports (232)130
Mean age (yrs) Serous cases: 60129
Endometrioid and Clear cell cases: 57-59130
Controls: 56 Nonwhite: 4%129
Current or prior HRT use Serous cases: 41%129
Endometriod and Clear cell cases: 27-31%130
Controls: 32-35%
Serous Ovarian Cancer129
Per month of breastfeeding OR=0.98 (95% CI, 0.97 to 0.99)129
Endometrioid Ovarian Cancer130
OR=0.6 (95% CI, 0.4 to 1.0)e Clear Cell Ovarian Cancer130
OR=0.8 (95% CI, 0.4 to 1.4)e
Serous Ovarian Cancer129
≤6 mos OR=0.93 (95% CI, 0.68 to 1.28) 7-12 mos OR=0.66 (95% CI, 0.47 to 0.94) 13-24 mos OR=0.66 (95% CI, 0.47 to 0.93) 25-35 mos OR=0.63 (95% CI, 0.40 to 0.99) ≥36 mos OR=0.26 (95% CI, 0.13 to 0.54) P for trend<0.0001
Parity, hormonal contraceptive use, history of breast or ovarian cancer in first-degree relatives, tubal ligation, hysterectomy, educationf
Kotsopoulos, 2015131
Case-control High
Nested case-control study within cohort of women with BRCA1 and BRCA2 mutations from 72 participating centers in 20 countries with controls frequency matched on BRCA mutation type, year of birth, country of residence, and previous diagnosis of breast cancer (6,596) Invasive epithelial ovarian cancer (1,329)g
Mean age (yrs) Cases: 54 Controls: 55 Nonwhite: 3%
BRCA1 carriers
OR=0.75 (95% CI, 0.61 to 0.93) BRCA2 carriers
OR=0.67 (95% CI, 0.45 to 1.00)
BRCA1 carriers
≤12 mos: OR=0.83 (95% CI, 0.67 to 1.04) >12 mos: 0.62 (95% CI, 0.48 to 0.79) ptrend=0.0002 BRCA2 carriers ≤12 mos: OR=0.79 (95% CI, 0.51 to 1.23) >12 mos: OR=0.50 (95% CI, 0.29 to 0.84) ptrend=0.009
Age at menarche, parity, OC use, tubal ligation, ethnicity

70
Table 21. Breastfeeding and ovarian cancer: Summary of individual studies (continued)
Author, Year Study Design Risk of Bias
Description of Study (N) Description of Ovarian Cancer Cases (N)
Population Characteristics
Results: Ever Breastfeda
Results: Duration of Breastfeedinga
Confounders Adjusted For
Risch, 1994124
Case-control Mediumc
Population-based case-control study conducted in Canada from 1989 to 1992, with controls frequency matched to cases by age (1,014) Incident epithelial ovarian cancer, based on histology (450)
Mean age (yrs) Cases: 57 Controls: 58 Used noncontraceptive estrogens: 18%
NR Mean total duration of lactation (yrs) Cases: 0.51 Controls: 0.65 OR=0.89 (95% CI, 0.75 to 1.05)h Average duration of lactation per pregnancy (mos) Cases: 2.24 Controls: 2.72 OR=0.87 (95% CI, 0.76 to 0.99)h
Age, duration of oral contraceptive use, number of full-term pregnancies
West, 1966125
Case-control Highc
Hospital-based case-control study where ovarian cancer cases and controls with benign ovarian tumors, matched to cases on age, residence, and date of surgery, were ascertained from 50 hospitals in the Boston, MA, area (194) Malignant ovarian cancer based on pathology (97)
Mean age (yrs) Cases: 45-64 Controls: 40-59
NR Duration of lactation (mos) Cases: 6.6 Controls: 5.8 p>0.03
None
Wynder, 1969126
Case-control Highc
Hospital-based case-control study where ovarian cancer cases were matched to controls on age (450) Malignant ovarian cancer, based on pathology; a vast majority (89%) were epithelial (150)
Mean age (yrs) Cases: 52 Controls: NR Nonwhite Cases: 9% Controls: 6%
No difference between cases and controls for never nursing
NR None
a Compared with never breastfed, unless otherwise specified. b Among parous women only (25,975 women). c This study was included in the prior 2007 AHRQ review by Ip and colleagues.2 We did not reassess ROB for individual studies
included in that review; this rating represents the decisions of the authors of that review. d Among parous women only (80 cases, 310 controls). e Among parous women only (109 endometrioid ovarian cancer cases, 59 clear cell ovarian cancer cases, 1,328 controls). f Jordan et al. (2008)129 adjusted for all confounders list; Nagle et al. (2008)130 adjusted only for parity, hormonal contraceptive
use, and education. g Among cases, the mean age at diagnosis was 49.99 yrs, while mean age at interview was 53.85, indicating that some portion of
cases were prevalent (as opposed to incident); ascertainment of cancer diagnoses was self-report. h Among parous women (77% of cases, 89% of controls).
BMI = body mass index; CI = confidence interval; HR = hazard ratio; MA = Massachusetts; mos = months; N = number; NR =
not reported; OC = oral contraceptive; yrs = years
We also included one cohort study and three case-control studies published after the most
recent systematic review (Table 21).128-131 The cohort study followed 28,107 women, ages 50 to

71
64 years, participating in the Singapore Breast Cancer Project from 1994 to 1997; there were 107
ovarian cancer cases identified by the Singapore Cancer Registry through December after an
average 17 years of followup. The mean age of cases was 57 years at the time of enrollment in
the cohort; 90 percent of women were postmenopausal at the time of enrollment. Information on
breastfeeding was collected in 1994 to 1997; total duration of breastfeeding was calculated as the
sum of breastfeeding duration for each child that was breastfed. More than 90 percent of women
were parous at the time of enrollment and 69 percent of them reported ever breastfeeding; the
average total duration of breastfeeding was 1.88 years.127
Two population-based case-control studies were conducted in the United States128 and
Australia.129, 130 The SHARE study in the United States enrolled cases that were identified prior
to surgery for ovarian cancer,128 and the Australian Ovarian Cancer Study, which contributed
cases to two separate analyses, recruited incident cases that had been reported to state-based
cancer registries;129, 130 population-based controls were recruited using random-digit dialing,
Health Care Financing Administration lists, and electoral rolls. Information on parity,
breastfeeding, and other risk factors for ovarian cancer was collected at enrollment during either
an in-person interview128 or questionnaire.129, 130 The Australian Ovarian Cancer Study published
two analyses, one including invasive serous ovarian cancer cases129 and one including invasive
endometrioid and clear cell ovarian cancer cases;130 both analyses compared the breastfeeding
exposure of cases to that of 1,508 controls. We also included a high ROB case-control study,
nested within a cohort of BRCA1 and BRCA2 mutation carriers, that recruited women from 72
participating centers across 20 countries; cases with self-reported invasive ovarian cancer
(n=1,329) were frequency-matched to women without ovarian cancer on BRCA mutation type,
year of birth, and country of residence. For cases, the mean age at diagnosis was 49.99 years and
the mean age at enrollment in the study was 53.85 years, indicating that a proportion of the
ovarian cancer cases were enrolled with prevalent disease.131
With the exception of the SHARE Study, which presented frequencies of ever breastfeeding
among cases and controls only,128 the recent studies used regression analysis to estimate relative
measures of association (i.e., hazard or odds ratios) for ever breastfeeding and different durations
of breastfeeding, compared with never breastfeeding; regression models were adjusted for
potential confounders including age, race/ethnicity, body mass index (BMI), age at menarche,
parity, oral contraceptive use, tubal ligation, hysterectomy, and family history of breast or
ovarian cancer.
Results The case-control studies, conducted across multiple countries and among women at both
average and increased risk of ovarian cancer (i.e., BRCA1 and BRCA2 mutation carriers),
generally reported an association between breastfeeding and reduced risk of ovarian cancer
(Table 21). The SHARE study reported that 51 percent of controls, compared with 44 percent of
cases, reported ever breastfeeding;128 odds ratios in the other studies ranged from 0.60 for
endometrioid ovarian cancer (95% CI, 0.4 to 1.0)130 to 0.80 for clear cell ovarian cancer (95%
CI, 0.4 to 1.4)130 to 0.90 (95% CI, 0.42 to 1.90) for ovarian cancer among black women.123 A
hospital-based case-control study, published in 1969, described no difference between groups
with respect to ever breastfeeding but did not report specific frequencies.126 The cohort study in
Singapore reported an adjusted hazard ratio of 0.97 (95% CI, 0.63 to 1.51); the wide confidence
interval could partially be attributed to only 107 ovarian cancer cases being identified.

72
An association between various durations of breastfeeding and reduced rates of ovarian
cancer was also reported across most studies. In a pooled analysis of black women from seven
case-control studies, the odds ratio for ovarian cancer among women who breastfed 6 months or
more was significantly lower (0.85; 95% CI, 0.36 to 2.00) but not for women who breastfed 1 to
5 months (OR, 1.00, 95% CI, 0.39 to 2.60) when compared with no breastfeeding.123 A Canadian
population-based study reported a higher mean total duration of breastfeeding and average
duration of breastfeeding per pregnancy, respectively, among controls (0.65 years and 2.72
months) than among cases (0.51 years and 2.24 months).124 Cases had a higher mean duration of
breastfeeding (6.6 months) than controls with benign ovarian tumors (5.8 months) in a study
published in 1966, but the difference was not statistically significant.125 The Australian Ovarian
Cancer Study reported a significant trend (p<0.0001) of decreasing odds of invasive serous
ovarian cancer with increasing duration of breastfeeding; for 6 or fewer months of breastfeeding,
with a reported odds ratio of 0.93 (95% CI, 0.68 to 1.28), and 0.26 for 3 or more years of
breastfeeding (95% CI, 0.13 to 0.54).129 One study reported similar results among BRCA1 and
BRCA2 mutation carriers,130 with an odds ratio, per month of breastfeeding, for invasive serous
ovarian cancer of 0.98 (95% CI, 0.97 to 0.99).129 The only study to report increased odds of
ovarian cancer with increasing duration of breastfeeding was the cohort study in Singapore;
because of the small number of cases, confidence intervals were wide and overlapping, however,
and included no difference.127
Cardiovascular Disease and Hypertension
Background Physiologic changes associated with breastfeeding (e.g., increased plasma levels of oxytocin)
have been associated with lower blood pressure.132 In addition, observational studies suggest that
lactation has a beneficial effect on glucose and lipid metabolism that persists long after
weaning.133 For these reasons, it is possible that breastfeeding leads to lower rates of
cardiovascular disease (CVD) and hypertension in women. Commonly considered confounders
in studies of the relationship between CVD and breastfeeding were diet, physical activity,
cholesterol levels, and smoking status.
Methods We included both case-control and cohort studies that examined the link between
breastfeeding and incidence of CVD and hypertension, in addition to recent systematic reviews
(published within the past 5 years). We excluded metabolic markers associated with CVD (e.g.,
lipid levels and C-reactive protein) and measures of vascular characteristics (e.g., carotid artery
intima media thickness) that could not be used to establish a diagnosis of CVD. For
hypertension, we excluded changes in blood pressure levels that did not establish a diagnosis of
hypertension.
Included Studies
Characteristics Seven cohort studies were identified (Table 22); four reported on hypertension only,4, 5, 134, 135
three reported on composite measures of CVD (e.g., myocardial infarction [MI] or stroke),4, 6, 136
and one reported on death from CVD.137 All studies were based on population cohorts. Four

73
were set in the United States,4-6, 136 and one each was set in Korea,134Australia, 135 and
Norway.137 Of the four studies set in the United States, two focused on women enrolled in the
WHI,4, 136 one enrolled participants from the Nurses’ Health Study I,6 and one enrolled
participants from the Nurses’ Health Study II.5 No study followed participants from the time of
exposure; all assessed exposure based on self-report at cohort enrollment. The majority of studies
enrolled women in their 20s or 30s through menopause; two studies (enrolling participants from
the WHI) enrolled postmenopausal women only (mean ages 63 to 64 years).4, 136 Most studies
(seven) reported on smoking; rates ranged from 32 to 60 percent in six studies, but smoking
prevalence was lower (<1%) in the study enrolling Korean women.134 All studies measured self-
reported lifetime duration of lactation but used different categories (Table 22). Outcome
ascertainment varied significantly and included self-report only,135 biennial physical exams,134
and use of medical records or other means to confirm cardiovascular outcomes.6, 136
Results: Hypertension Four studies reported on the association between breastfeeding and hypertension; all reported
some statistically significant association.4, 5, 134, 135 The study enrolling Korean women
(N=177,749) followed women over 6 years from enrollment; compared with those who had no
history of lactation; 1 to 6 months of lactation was associated with a reduced risk of
hypertension, as were longer durations of breastfeeding (Table 22).134 The cohort study enrolling
Australian women (N= 74,785) found that women who breastfed for longer than 6 months per
lifetime (or greater than 3 months per child), on average, had significantly lower odds of having
hypertension when compared with parous women who never breastfed (Table 22); however,
results were only significant for women less than 64 years of age at cohort enrollment.135 In a
study assessing women enrolled in WHI, women who reported a lifetime history of more than 12
months of lactation were less likely to have hypertension at the time of enrollment (OR, 0.88;
p<0.001) than women who had breastfed for less than 12 months.4 Among participants in the
Nurses’ Health Study II (N=55,636), women who did not breastfeed compared with women who
breastfed their first child for 12 months were more likely to develop hypertension (HR,1.27; 95%
CI, 1.18 to 1.36); in addition, women who never breastfed were more likely to develop
hypertension than women who exclusively breastfed their first child for 6 months (HR, 1.29;
95% CI, 1.20 to 1.40).5

74
Table 22. Breastfeeding and CVD or hypertension: Summary of individual studies
Author, Year ROB
Study Description N Participants
Population Definition of Exposure
Definition of CVD Outcome Timing of Followup
Results Confounders Adjusted for
Lee, 2005134
Medium
Women >20 yrs through menopause without HTN at baseline enrolled in the Korean Women’s Cohort Study 177,749 (106,585 ever pregnant)
Mean age (SD): 32.2 (7.1) % nonwhite: NR (presumably all S. Korean) % current or former smokers: 0.3 to 0.9% (across BF categories)
Self-reported history of BF any or all children (lactation records of up to a maximum of 5 children per mother were recorded); duration of lactation was defined by total duration for all children
SBP 140 mmHg,
DBP 90 mmHg or current use of HTN treatment (determine during biennial physical exam) 6 yrs (BP measured twice)
RR (95% CI), mean duration of lifetime lactation (mos): 1-3: 0.90 (0.87 to 0.93) 4-6: 0.92 (0.87 to 0.98) 7-9: 0.93 (0.86 to 0.99) 10-12: 1.00 (0.91 to 1.11) >12: 1.06 (0.99 to 1.14) RR (95% CI), effect of combination obesity and lactation history (ever vs. never) on incident HTN (reference = BMI <23.05 and +lactation) BMI <23.05/no lactation: 1.06 (1.02 to 1.11)
BMI 23.05/lactation: 1.65 (1.58 to 1.72)
BMI 23.05/no lactation: 1.85 (1.75 to 1.90)
Age, obesity, smoking, alcohol drinking, exercise, number of children, and age at first pregnancy
Lupton, 2013135
Medium
Nested case- control study of women >45 yrs participating in an Australian population- based cohort study without HTN during pregnancy 74,785 (64, 199 parous women)
% of cases in each age category: 45 to <54: 35 54 to <64: 33
64: 32 % of cases who were current or former smokers: 35
Self-reported total lifetime BF duration (and average BF duration per child)
Self-reported current treatment of HTN (onset after age of first birth) NA (recruited from 2006 to 2009)
OR (95% CI), lifetime BF category (mos) vs. never BF in parous women: Age 45 to <54 yrs: 1 to <3: 0.88 (0.63 to 1.24) 3 to <6: 0.87 (0.62 to 1.20) 6 to <12: 0.74 (0.55 to 0.98) 12 to <18: 0.71 (0.53 to 0.95) 18 to <24: 0.57 (0.41 to 0.79) >24: 0.58 (0.44 to 0.77) 54 to <64 yrs: 1 to <3: 0.97(0.78 to 1.20) 3 to <6: 0.84 (0.69 to 1.02) 6 to <12: 0.81 (0.68 to 0.96) 12 to <18: 0.78 (0.64 to 0.94 18 to <24: 0.71 (0.57 to 0.89) >24: 0.60 (0.50 to 0.73) >64 yrs: 1 to <3: 1.08 (0.89 to 1.31) 3 to <6: 1.11 (0.94 to 1.31) 6 to <12:1.04 (0.90 to 1.20) 12 to <18: 1.06 (0.91 to 1.24) 18 to <24: 1.07 (0.90 to 1.28) >24: 1.03 (0.88 to 1.22)
Country of origin (Australia or other), income level, BMI, smoking status, alcohol consumption, physical activity, family history of HTN, history of oral contraceptive use, and history of hormone replacement therapy use

75
Table 22. Breastfeeding and CVD or hypertension: Summary of individual studies (continued)
Author, Year ROB
Study Description N Participants
Population Definition of Exposure
Definition of CVD Outcome Timing of Followup
Results Confounders Adjusted for
Natland Fagerhaug, 2013137
Medium
Norwegian population-based cohort enrolling women ages 30 to 85 who attended a health survey followup in 1995-1997a 21,889 (15,000 parous women)
Age: Ever lactated: 52.1 (14.1) Never lactated: 52.5 (12.5) Nulliparous: 55.9 (16.8) % nonwhite: NR % current or former smokers: 51.2 % postmenopausal: NR % with type 2 diabetes: 2.9%
Self-reported lactation history, ever and lifetime lactation (defined as sum of lactation duration for all births)
Death from CVD (MI or stroke) defined by ICD 9: 390-459 and ICD-10: 100-99 Median 14.5 yrs after enrollment
HR (95% CI): never vs. ever lactation in parous women <65 yrs: 2.86 (1.51 to 5.39) 45-64 yrs: 3.15 ((1.66 to 5.00) >65 rs: 1.11 (0.77 to 1.69) HR (95% CI) by lifetime lactation duration in parous women <65 yrs: Never vs. >24 mos: 2.77 (1.28 vs. 5.99) 7-12 mos vs. >24 mos: 0.55 (0.27 to 1.09) HR (95% CI), lifetime lactation duration in parous women 45 to 64 yrs: Never vs. >24 mos: 3.03 (1.38 to 6.70) 7-12 mos vs. >24 mos: 0.45 (0.21 to 0.97)
Age, smoking status, physical activity, education, marital status, parity
Parikh, 2016136
Medium
U.S. women participating in the WHI observational cohort study who had no prior history of CHD 72,982
Mean age (SD): 63.2 (7.3) % nonwhite: 14 % postmeno-pausal: 100 % using HRT: 30 % current or former smokers: 49 % with type 2 diabetes: 4.7
Self-reported lifetime BF duration assessed at WHI enrollment
Physician-adjudicated fatal and nonfatal CHDb Median 12 yrs
HR (95% CI), breastfed for at least 1 month vs. <1 month: 0.90 (0.85-0.96)
Menstrual irregularity, age at first birth, still births, miscarriages, age, high cholesterol requiring pills, currently taking pills for hypertension, log of systolic blood pressure, current smoker, and diabetes mellitus

76
Table 22. Breastfeeding and CVD or hypertension: Summary of individual studies (continued)
Author, Year ROB
Study Description N Participants
Population Definition of Exposure
Definition of CVD Outcome Timing of Followup
Results Confounders Adjusted for
Schwarz, 20094
Medium
Cohort study (WHI) enrolling generally healthy post-menopausal women from the United States who reported at least 1 live birth 139,681
Mean age: 63-64 (SD NR) % nonwhite; 14-19 % with GDM: NR 139,681
Self-reported lifetime BF duration assessed at WHI enrollment Median 7.9 yrs
Self-reported HTN and history of CVDc prior to enrollment; incident CVDd over 7.9 yrs of WHI (validated by physician adjudication)
OR (95% CI), lifetime duration (mos) vs. never breastfed: Prevalent HTN: 1-6: 0.95 (0.92 to 0.98) 7-12: 0.88 (0.84 to 0.91) 13-23: 0.89 (0.84 to 0.93) 24+: 0.87 (0.82 to 0.93) >13: 0.88; p<0.001 Prevalent CVD: 1-6: 1.03 (0.97 to 1.08) 7-12: 0.94 (0.87 to 1.01) 13-23: 0.92 (0.85 to 1.00) 24+: 0.86 (0.89 to 0.98) p for trend: 0.003 >13: 0.91; p=0.0008 Incident CVD, HR (95% CI): 1-6: 1.03 (0.98 to 1.08) 7-12: 0.97 (0.90 to 1.03) 13-23: 0.98 (0.91 to 1.05) 24+: 0.93 (0.85 to 1.02) p for trend: 0.10 Subgroup of women from WHI cohort study who provided information on their weight at age 18 and whether they were breastfed (N=78,825): Prevalent HTN: 1-6: 0.95 (0.91 to 0.99) 7-12: 0.87 (0.82 to 0.93) 13-23: 0.90 (0.85 to 0.97) 24+: 0.88 (0.81 to 0.95) p for trend <0.001 Prevalent CVD: 1-6: 1.06 (0.99 to 1.13) 7-12: 0.97 (0.88 to 1.06) 13-23: 0.98 (0.88 to 1.09) 24+: 0.94 (0.82 to 1.07) p for trend= 0.26
Age, race, parity, age at menopause, education, income, family history (of diabetes mellitus, MI or stroke), physical activity, energy, cholesterol, fat, fiber, and sodium intakes, tobacco history, hormone replacement therapy use, aspirin use, MVI use

77
Table 22. Breastfeeding and CVD or hypertension: Summary of individual studies (continued)
Author, Year ROB
Study Description N Participants
Population Definition of Exposure
Definition of CVD Outcome Timing of Followup
Results Confounders Adjusted for
Stuebe, 20096
High
Participants from the Nurses’ Health Study I who were parous with no history of MI, angina, or CABG before 1986 89,326
Age: 30-55 yrs at enrollment (mean NR) % nonwhite: NR % with type 2 diabetes: 1.7-2.1 % with HTN: 18.5 to 23.3 % past or current smoker: 60.4 to 44.1
Self-reported total duration of lactation for all pregnancies (via questionnaire in 1986)
Incident CHD (nonfatal MIe and mortality due to CHD) confirmed by medical records (from 1986 to 2002)f 16 yrs
HR (95% CI), lifetime BF duration (mos) vs. never: <3: 1.01 (0.91 to 1.11) 3-6: 1.0 (0.88 to 1.14) 6-11 1.02 (0.88 to 1.18) 11-23: 0.93 (0.8 to 1.07) >23: 0.77 (0.62 to 0.94) p for trend: 0.02
Age; parity; history of stillbirth; BMI at age 18 yrs; birthweight of subject; parental history of MI before age 60 yrs; diet quintile; physical activity; smoking; menopausal status; and use of aspirin, alcohol, multivitamins, and postmenopausal hormones.
Stuebe, 20115
Medium
Participants from the Nurses’ Health Study II without HTN,g self-reported diabetes, CVD, hyperlipidemia or cancer (1991-2005) 55,636
Age: 25-42 yrs at enrollment (mean=35.7) in 1989) % nonwhite: 6.2 % current or former smokers: 32.3
Self-reported total duration and exclusive duration of lactation (for first 4 children)
Incident self-reported HTN (excluding pregnancy)
HR (95% CI), duration of BF for first child (mos),
referent= 12 Never: 1.27 (1.18 to 1.36) >0-3: 1.29 (1.20 to 1.39) >3, <6: 1.16 (1.08 to 1.25) 6, -<9: 1.11 (1.03 to 1.19) 9, <12: 1.03 (0.95 to 1.11) p for trend <0.001 HR (95% CI), exclusive duration of BF for first child
(mos), referent= 6 Never BF: 1.29 (1.20 to 1.39) BF, never exclusively: 1.11 (1.03 to 1.19) >0-3: 1.08 (0.99 to 1.18) >3, <6: 1.03 (0.95 to 1.12) p for trend <0.001 HR (95% CI), mean total duration of BF per child
(mos), referent =12 Never: 1.20 (1.10 to 1.29) >0-3: 1.14 (1.06 to 1.23) >3, <6: 1.14 (1.06 to 1.22) 6, -<9: 1.07 (0.99 to 1.15) 9, <12: 1.07 (0.99 to 1.16) p for trend < 0.001
Age and inverse probability weights (derived from models including maternal BMI at age 18, year of first birth, self-reported history of preeclampsia, gestational HTN gestational diabetes, birth of an infant at <37 wks, birth of an infant weighing <2,500 g, miscarriage or stillbirth at >12 wks, smoking status, vigorous physical activity, alcohol consumption, DASH diet score quintile, family history of HTN, current oral contraceptive use, current nonnarcotic analgesic use, and self-reported race)

78
Table 22. Breastfeeding and CVD or hypertension: Summary of individual studies (continued)
Author, Year ROB
Study Description N Participants
Population Definition of Exposure
Definition of CVD Outcome Timing of Followup
Results Confounders Adjusted for
Stuebe, 20115
(continued)
HR (95% CI), exclusive duration of BF per child
(mos), referent= 6 Never BF: 1.14 (1.04 to 1.26) BF, never exclusively: 1.10 (1.01 to 1.20) >0-3: 1.06 (0.97 to 1.15) >3, <6: 1.03 (0.95 to 1.13) p for trend =0.001
a Exclusion criteria included the following: nonresponse to the second questionnaire; current pregnancy; less than 30 or greater
than 85 yrs old; nonattendance at the clinical examination; self-report of MI, stroke, angina pectoris, or diabetes prior to the first
birth; unknown parity; less than 1 year since their last child birth; and unknown lactation history b Composite outcome defined as clinical MI, CHD death, or coronary artery revascularization in the form of coronary artery
bypass surgery or percutaneous coronary intervention. c Prevalent CVD defined as self-reported history of MI, angina, congestive heart failure, peripheral arterial disease,
revascularization, carotid angioplasty, carotid endarterectomy, or stroke. d Incident CVD defined as coronary heart disease, stroke, congestive heart failure, angina, peripheral vascular disease, carotid
artery disease, and coronary revascularization. e Confirmed cases met World Health Organization criteria for MI (symptoms associated with diagnostic electrocardiographic
changes or elevations in cardiac enzymes). Cause of death was determined from hospital records or autopsy, when available. f Incident cases of MI were examined from 1986, when cohort members were ages 40-65 yrs, to 2002, at which point they were
ages 56-81 yrs of age. g Women were excluded if they reported a diagnosis of hypertension prior to 1991 or reported elevated blood pressure (median
systolic blood pressure >120 mm Hg or diastolic blood pressure >80 mm Hg) or antihypertensive medications in 1989. Also
excluded women with diabetes, CVD, hyperlipidemia, or cancer.
BF = breastfeeding; BMI = body mass index; BP = blood pressure; CABG = coronary artery bypass graft; CI = confidence
interval; CVD = cardiovascular disease; DBP = diastolic blood pressure; HR = hazard ratio; HRT = hormone replacement
therapy; HTN = hypertension; ICD = International Classification of Diseases; MI = myocardial infarction; mos = months; MVI = Multivitamin; N = number; NA = not applicable; NR = not reported; OR = odds ratio; ROB = risk of bias; RR = relative risk;
SBP = systolic blood pressure; SD = standard deviation; U.S. = United States; WHI = Women’s Health Initiative; yrs = years.
Results: Cardiovascular Disease Three studies reported on CVD using a composite measure,4, 136 and one reported only on
death due to CVD.137 Two assessed outcomes among women enrolled in the WHI; one focused
on women enrolled in the observational study only,136 and the other included women enrolled in
the RCT and observational study.4 The analysis of women in the WHI observational study
(N=72,982) reported on incidence of fatal and nonfatal coronary heart disease (defined as clinical
MI, coronary heart disease death, or coronary artery revascularization in the form of coronary
artery bypass surgery or percutaneous coronary intervention); women who breastfed for at least 1
month had fewer incident coronary heart disease over 12 years (median) than women who
breastfed for less than 1 month (HR, 0.30; 95% CI, 0.85 to 0.96).136 The study enrolling women
participating in the WHI RCT and observational study (N=139,681) reported on the association
between self-reported lifetime duration of lactation and presence of CVD at enrollment
(composite of self-reported MI, angina, congestive heart failure, peripheral arterial disease,
revascularization, carotid angioplasty, carotid endarterectomy, or stroke) adjusted for multiple
potential confounders; women reporting a cumulative lifetime duration of lactation equal to or
greater than 13 months were less likely to have CVD (OR, 0.91; p=0.008).4 The same study also

79
reported on incident CVD; over an average of 7.9 years of followup the investigators found no
significant difference between women based on lifetime breastfeeding duration and incidence of
CVD in adjusted models (Table 22). Finally, an analysis of participants from the Nurses’ Health
Study 1 who were parous with no history of CVD prior to enrollment (N=89,326) found that
women who had breastfed for greater than 23 months had lower rates of incident MI (defined as
fatal or nonfatal MI) over 16 years of followup (HR, 0.77; 95% CI, 0.62 to 0.94).6 Women who
breastfed for shorter durations (<23 months) did not have a significantly different rate of MI
compared with women who never breastfed (Table 22).
One Norwegian population-based cohort study (N=15,000 parous women) compared incident
CVD mortality among women ages 30 to 85 years at enrollment over approximately 14 years of
followup.137 Parous women younger than 65 at enrollment who had never lactated had higher
CVD mortality than women who lactated 24 months or more (HR 2.77; 95% CI, 1.28 to 5.99).
No clear associations were observed among women 65 years of age or older at cohort enrollment
(Table 22).
Type 2 Diabetes
Background Observational studies suggest that lactation has a beneficial effect on glucose and lipid
metabolism that persists long after weaning.133For women with gestational diabetes, evidence
suggests that lactation is associated with improved pancreatic beta-cell function and glucose
levels.138 Studies have reported that mothers who do not breastfeed (or breastfeed for shorter
durations) have less visceral fat than mothers for at least 3 months. Thus, it is plausible that
lactation could reduce the risk of the development of type 2 diabetes. Commonly considered
confounders in the studies of relationship between maternal type 2 diabetes and breastfeeding
were parity, BMI, diet, physical activity, family history of diabetes, and smoking status.
Methods We included both case-control and cohort studies that examined the association between
breastfeeding and incidence of type 2 diabetes, in addition to recent systematic reviews
(published within the past 5 years). We excluded measures of glucose metabolism that could not
be used to establish a diagnosis of diabetes (e.g., changes in mean levels of fasting blood glucose
in women without known diabetes) and other laboratory markers of abnormal glucose
metabolism (e.g., measures of insulin levels). We included studies enrolling women with a
history of gestational diabetes that reported on the incidence of type 2 diabetes.
Systematic Reviews/Meta-Analyses One systematic review rated unclear ROB examined the association between breastfeeding
and maternal risk of subsequent type 2 diabetes (Table 23).139 The authors identified six
prospective cohort studies (described in 5 publications) that evaluated the association between
breastfeeding and incident type 2 diabetes. Three studies were set in the United States, and one
each was set in Germany, China, and Australia. One study focused on women with gestational
diabetes (N=304), and the others focused on an unselected sample of women with no diabetes at
enrollment (sample sizes ranged from 1,829 to 83,585 participants). All studies defined exposure
as duration of breastfeeding, and most (5 of 6) reported on multiple categories of breastfeeding
exposure defined in months or years of breastfeeding. All studies controlled for a range of known

80
confounds; however, specific measures varied across studies; most studies adjusted for age,
smoking, alcohol, BMI, physical activity, and family history of diabetes, and some had further
adjusted for income, education, and parity. Systematic review authors assessed the risk of bias of
individual studies was assessed using the Newcastle-Ottawa Scale, rating it on a 0 to 9-point
scale (with higher values indicating better quality); four studies were rated a 6, one was rated a 7,
and one was rated an 8.139
Table 23. Breastfeeding and Type 2 diabetes: Summary of published systematic review
Author, Year
Number of Studies (N Participants Study Design
Search Date (Databases)
Study Characteristics
Definition of Exposure
Definition of Outcome
Timing of Followup
Results Risk of Bias
Aune, 2014139
6 (273,961); prospective cohort studies
Inception through September 2013 (PubMed, Embase, Ovid)
Three studies set in the U.S. and one each in Germany, China, and Australia. Studies enrolled and followed women between 1989 and 2008. One focused on women with GDM; the others focused on women without known diabetes.
Measures of BF duration (lifetime, and per-child categories)
NR: any measure of type 2 diabetes appears eligible
Unclear; studies assessed lifetime duration of BF
Pooled RR (95% CI): highest vs. lowest BF duration: 0.68 (0.57-0.82) 3-mo increase in BF duration per child: 0.89 (0.77-1.04) 1-year increase in total BF duration: 0.91 (0.86-0.96)
Unclear
BF = breastfeeding; CI = confidence interval; GDM = gestational diabetes mellitus; N = number; NR = not reported; RR =
relative risk; U.S. = United States.
The review authors conducted meta-analyses using random effects models to calculate
summary risk ratios (RRs) for different durations of breastfeeding.139 Authors first pooled studies
based on comparisons of the highest versus lowest breastfeeding duration reported by each
study; all included a comparison of “no breastfeeding,” longest duration included >3 months (1
study), 6 months (2 studies), >23 months total duration (2 studies), and 4 years (1 study). The
pooled RR for high versus low breastfeeding (6 studies, 273,961 participants) was 0.68 (95% CI,
0.57 to 0.82; I2 74.7%). To explore heterogeneity, authors conducted sensitivity analyses
excluding individual studies. When excluding results from the Nurses’ Health Study I,6 the
pooled RR (5 studies) was 0.62 (95% CI, 0.56 to 0.69) and heterogeneity was lower (I2 0%).
Authors also report on subgroup and meta-regression analyses and report no significant
heterogeneity between subgroups of studies based on country setting, number of cases, study
quality scores, or extent to which individual studies adjusted for confounding factors. There was
no evidence of publication bias with Egger’s test, p=0.27.
Authors also conducted pooled analyses that examine the dose-response of different levels of
breastfeeding duration across four studies (by computing study-specific linear trends across
categories of breastfeeding duration); the summary RR was 0.91 (95% CI, 0.86 to 0.96; I2
80.9%) per 12 months increase in lifetime duration of breastfeeding, and 0.89 (95% CI, 0.77 to
1.04; I2 92.9%) per 3 months increase in duration of breastfeeding per child.139 No further

81
sensitivity analyses were conducted, presumably because of the small number of studies
available.
Included Studies
Characteristics We identified three cohort studies published after the most recent systematic review (Table
24).4, 140, 141 Two enrolled women with gestational diabetes shortly after birth,140, 141 and one
enrolled postmenopausal women from the United States participating in the WHI.4
Table 24. Breastfeeding and type 2 diabetes: Summary of individual studies
Author, Year ROB
Study Description N Participants
Population Definition of Exposure
Definition of Type 2 Diabetes Timing of Followup
Results Confounders Adjusted for
Chamberlain, 2016140
High
Cohort study of women with GDM who gave birth at a regional Australian hospital from 2004-2010 289
Age category (y), N (%): <25: 42 (9) 25-29: 96 (20) 30-34: 134 (28) 35+: 211 (44) % nonwhite: 32a
BF status at hospital discharge, defined as fully BF, partially BF, or no BF
Positive OGTT 7 yrs postpartum
HR (95% CI) Partial vs. full BF (ref): 2.34 (1.23 to 4.47) No vs. full BF (ref): HR 1.33 (0.40 to 4.37)
None
Gunderson, 2007142;
Gunderson, 2015141
Medium
Cohort study of women with GDM who gave birth at Kaiser Northern CA hospitals from 2008-2011 959
Mean age: 33-34 (SD NR) % nonwhite: 77 % with GDM: 100c
BF duration/ intensity assessed prospectively via feeding diaries, phone calls, in-person exams, and monthly mailed questionnaires Intensity represents cumulative amount of formula and breast milk fed since delivery and the intensity for the past 7 days (measured at 6-9 wks after delivery)
Positive OGTT or diagnosis obtained from EMRsb 2 yrs post-partum
Adjusted HR (95% CI), BF group compared with exclusive formula feeding: Exclusive lactation: 0.47 (0.25 to 0.91) Mostly lactation: 0.53 (0.31 to 0.91) Mostly formula: 0.65 (0.37 to 1.13) p for trend=0.017 Adjusted HR (95% CI), BF duration group compared with 0-2m duration: >2-5 m: 0.43 (0.23 to 0.82) >5-10 m: 0.50 (0.25 to 0.99) >10 m: 0.55 (0.31 to 1.01) p for trend=0.007
Age, race/ethnicity, education, prepregnancy BMI, GDM treatment, sum of prenatal oral glucose tolerance test Z score, gestational age at GDM diagnosis, subsequent birth (0 vs. 1) during 2-yr followup, large for gestational age vs. not large for gestational age (reference), hospital stay >3 d, and neonatal intensive care unit admission

82
Table 24. Breastfeeding and Type 2 Diabetes: summary of individual studies (continued)
Author, Year ROB
Study Description N Participants
Population Definition of Exposure
Definition of Type 2 Diabetes Timing of Followup
Results Confounders Adjusted for
Schwarz, 20094
Medium
Cohort study (WHI) enrolling generally healthy, postmenopausal women from the U.S. starting in 1994 who reported at least one live birth 139,681
Mean age: 63-64 (SD NR) % nonwhite; 14-19 % with GDM: NR
Self-reported lifetime BF duration assessed at WHI enrollment
Self-reported need to use medication to control “sugar diabetes”d Average of 35 yr post-lactation (at WHI enrollment)
OR (95% CI), lifetime duration (mos) vs. never breastfed: 1-6: 0.92 (0.85 to 0.99) 7-12: 0.87 (0.78 to 0.97) 13-23: 0.74 (0.65 to 0.84) 24+: 0.89 (0.77 to 1.02) p for trend: <0.0001 ≥13: 0.80 (NR); p<0.001 Subgroup of women from WHI cohort study who provided information on their weight at age 18 and whether they were breastfed (N=78,825): OR (95% CI), lifetime duration (mos) vs. never breastfed: 1-6: 0.94 (0.84 to 1.04) 7-12: 0.91 (0.78 to 1.06) 13-23: 0.69 (0.58 to 0.84) 24+: 0.99 (0.82 to 1.19) p for trend=0.02
Age, race, parity, age at menopause, education, income, family history (of diabetes mellitus, MI or stroke), physical activity, energy, cholesterol, fat, fiber, and sodium intake, tobacco history, HRT use, aspirin use, and MVI use
a Refers to percentage of population that was indigenous, defined as self-identification as Aboriginal, Torres Strait Islander, or
Aboriginal and Torres Strait Islander. b Per authors, data from health plans were also used to identify incident diabetes-based clinical laboratory testing (fasting, 2-hour
OGTT, random glucose or HgA1c); self-report of diabetes with health care provider diagnosis was allowed for women receiving
care from outside facilities. c To be included, women identified with gestational diabetes during pregnancy had to have a normal blood sugar measurement 6-
9 wks postpartum. d Per authors, medication use was validated on enrollment by nurse examination of medication bottles. Women with type 1
diabetes were not eligible to participate in the WHI.
BF = breastfeeding; GDM = gestational diabetes mellitus; HRT = hormone replacement therapy; m = month; MI = myocardial
infarction; MVI = multivitamin; N = number; OGTT = oral glucose tolerance test; OR = odds ratio; WHI = Women’s Health
Initiative
The two studies enrolling women with gestational diabetes included women giving birth
during a similar time frame (approximately 2004 to 2011); one (N= 959) was set in the United
States141and the other (N=289) was set in Australia.140 The U.S. study included a majority of
women (72%) 30 years or older.140 The Australian study enrolled women with a mean age of 33
to 34 years.140 Both measured incident type 2 diabetes based on an oral glucose tolerance test
(OGTT); the study set in the United States also searched an electronic medical record for
diagnoses made on other criteria (e.g., hemoglobin A1c).141 Ascertainment of breastfeeding
exposure and length of followup differed. The study set in the United States obtained
information on breastfeeding duration and exclusivity prospectively over 2 years (via feeding
diaries, telephone interviews, in-person exams, and monthly mailed questionnaires); categories
of breastfeeding exclusivity (exclusive formula, mostly formula, mostly lactation, and exclusive

83
lactation) were based on interviews at 6-9 weeks postpartum and defined by cumulative amount
of formula and breast milk fed since delivery and average 24-hour intake of formula.141 Incident
diabetes was measured at 2 years. The study set in Australia used breastfeeding status at hospital
discharge as the exposure measure (fully breastfeeding, partially breastfeeding, or no
breastfeeding), and incident type 2 diabetes was measured over 7 years postpartum.140 141
The study enrolling women participating in the WHI included women who had at least one
live birth and provided information on lifetime breastfeeding duration (N=139,681) at WHI
enrollment (obtained at an average of 35 years postlactation).4 Participants had a mean age of 63
to 64 years and a minority (14-17%) were nonwhite. Diabetes was assessed by asking women
whether they had a history of needing medication to control “sugar diabetes.” The percentage of
women who had gestational diabetes was not described; although the study did not make a
distinction between whether women had been treated for type 1 or type 2 diabetes, women with
type 1 diabetes were not eligible to participate in the WHI.143
One study was rated high ROB140 (primarily because of no adjustment for potential
confounding factors), and the other two were rated medium ROB. The two studies enrolling
women who had gestational diabetes followed women for a relatively short period of time (2 to 7
years postpartum), which may be inadequate followup to determine a difference in the incidence
of type 2 diabetes.140, 144
Results Despite differences in study design, outcome ascertainment, and followup, all three studies
found reduced incidence of diabetes in women who breastfed for longer durations or increased
intensity (Table 24). Results were consistent with the findings of the published systematic review
described above.139 As noted above, the two cohort studies that enrolled women with gestational diabetes140l, 144
differed in measurement of breastfeeding exposure and in followup duration. The study enrolling
U.S. women found a lower rate of incident type 2 diabetes over 2 years postpartum among
women who reported exclusive breastfeeding 6 to 9 weeks after delivery compared with women
who exclusively formula fed (HR, 0.47; 95% CI, 0.24 to 0.93).145 Women who mostly lactated or
mostly formula fed had a lower incidence of type 2 diabetes than women who exclusively
formula fed, but the difference was not statistically significant (Table 24); the trend across all
groups was significant (p=0.048), controlling for multiple confounders.
The Australian study ascertained breastfeeding exposure via hospital discharge records (as
fully, partially, or no breastfeeding); women were followed up to 2 years postpartum. Compared
with women who fully breastfed, women who partially breastfed had a higher rate of incident
type 2 diabetes (HR 2.34; 95% CI, 1.23 to 4.47); however, there was no significant difference in
incident type 2 diabetes between women not breastfeeding and those fully breastfeeding at
discharge.(HR 1.33; 95% CI, 0.40 to 4.37).140
The study enrolling women participating in the WHI (N=139,681) reported on the
association between self-reported lifetime duration of lactation and presence of diabetes at
enrollment, adjusted for multiple potential confounders (Table 24). Increasing duration of
breastfeeding was associated with lower prevalence of diabetes (p for trend <0001); women
reporting a cumulative lifetime duration of lactation equal to or greater than 13 months were less
likely to have diabetes (OR=0.80, p<0.001).4

84
Breastfeeding and Fracture Risk
Background Pregnancy and lactation lead to changes in bone metabolism. During lactation, the body can
meet the burden of demand of calcium by increasing resorption from maternal bones. However,
such losses typically reverse themselves over time.146 Additionally, increased weight during
gestation and consequent bone strengthening (and expansion) in response to greater loads on the
maternal skeleton may also serve to counteract the effects of loss of bone mass.147 This review
focuses on the long-term and clinically relevant implications of lactation by evaluating the risk of
fractures rather than the risk of loss in bone mass. Other variables that could influence the
relationship between lactation and fractures include age, hormone replacement therapy, physical
activity, parity, and BMI.146
Methods We included all studies that examined the link between breastfeeding and fracture (case-
control or cohort studies). We excluded studies with surrogate measures of fracture (e.g., fracture
risk score or index) or bone turnover markers or with measures of osteoporosis only.
Included Studies
Characteristics We included a total of six case-control studies148-153 and four cohort studies146, 154-156 that
examined the risk of fractures in relation to a history of breastfeeding. The case-controls
included 1,609 cases with hip, forearm, or vertebral fractures and 2,967 controls. Mean ages of
enrolled women ranged from 58 to 75. Four studies were conducted in the United States; one
study each was conducted in Australia, Greece, Hong Kong, Spain, South Korea, and Sweden.
Four studies were rated high risk of bias and the rest were rated medium. In addition, we found
four cohort studies (constructed from cross-sectional data in two cases),154, 155 with 4,170
participants. Two studies did not report the number of cases; the rate of fractures in the other two
studies was reported as 15.6 percent in one study156 and 1.2 percent in a second study.154
All except one study reported on hip, vertebral, or forearm fractures identified from hospital
or clinical records (with or without radiography confirmations). One study relied on recall for
fracture outcomes. Of the six case-control studies, three identified matched or unmatched general
population controls living in the same area; two studies used hospital controls; and in one study,
women with vertebral fractures (classified according to the radiological diagnoses) were defined
as definite or doubtful cases, and the remaining enrolled subjects without fractures were
classified as control subjects. Our analysis is restricted to comparisons of definite versus control
cases. Assessments of breastfeeding history were based on subjects’ long-term recalls in all
studies.
Studies defined exposures as ever versus never breastfeeding, total breastfeeding, and
duration of breastfeeding per child. For studies reporting on duration of breastfeeding, results
were reported as categorical variables with cutpoints that varied by study or as a continuous
variable. No study reported on exclusive breastfeeding. Studies reported on hip, vertebral, or
forearm fractures.

85
Results With the exception of one high risk of bias study of self-reported vertebral fractures, no study
reported statistically significant differences. We rated the evidence as low for no benefit.
Table 25. Breastfeeding and fractures: Summary of individual studies
Author, Year ROB
Study description N of participants
Population Definition of exposure
Definition of outcome Timing of followup
Results Confounders adjusted for
Alderman et al., 1986148
Mediumb
Case-control study of women between 50 and 74 yrs of age in King County, Washington; cases seeking orthopedic care, controls from general population (door-to-door recruitment) Cases: 355 women who sought care from orthopedists between 1976 and 1980; controls: 562 unmatched women from the same county
50-74 years, mean age NR
Duration of lactation: sum of the number of mos of lactation associated with each birth, categorized as 0, 1 to 12, 13 to 24, or more than 24 mosa, b
Hip or forearm fractures NA-case-control
OR for 1-12 mos vs. 0: 1.2 (0.73-1.95) OR for 13-24 mos vs. 0: 0.7 (0.34-1.29) OR for >24 mos vs. 0: 0.8 (0.38-1.51)
Age, relative weight, and exogenous estrogen use
Chan et al., 1996149
Mediumb
Case-control study of Chinese women ages 70-79 yrs who were living in three housing blocks under a Geriatric Priority Housing Scheme in Shatin, Hong Kong Cases: 144 women with one or more definite fractures); controls: 163 women with no fractures
Mean age: 75 yrs
Duration of lactation: categorized as 0, 1<24 mos, or ≥24 mos
Diagnosis of vertebral fracture (when any of the 3 vertebral ratios [anterior to posterior, middle to posterior and posterior to posterior ratios compare with the vertebral bodies above and below the vertebra of interest) was 3 SD or more away from the mean NA-case-control
>24 mos vs. 0: OR: 0.7 (0.4-1.3) ≥24 mos: OR: 0.6 (0.3-1.0)
Age

86
Table 25. Breastfeeding and fractures: Summary of individual studies (continued)
Author, Year ROB
Study Description N of Participants
Population Definition of Exposure
Definition of Outcome Timing of Followup
Results Confounders Adjusted for
Cumming et al., 1993151
Mediumb
Case-control study of women ages 65 yrs or older living in a defined region in Sydney, Australia, during 1990-1991 Cases: 174 women were from 12 hospitals; controls: 137 selected using an area probability sampling method, with additional sampling from nursing homes
Mean age NR
Average duration of BF per child, categorized as 0, 0.5-3, 3-6, 6-9, and >9 mos vs. never BF
Hip fractures presenting to the hospitals NA-case-control
0.5-3 mos vs. 0: OR: 0.64 (0.13-3.06) 3-6 mos vs. 0: OR 0.79 (0.18-3.51) 6-9 mos vs. 0: OR: 0.41 (0.09-1.82) >9 mos vs. 0: OR: 0.24 (0.04-1.53
Age, BMI, history of hormone replacement therapy use, current slate of psychotropic medications, current smoking status, current dairy product consumption, score on mental state questionnaire, current physical activity (number of hours of work in the house or garden per week), and health status (number of self-reported illnesses)
Ever breastfed vs. never vs. never BF
Hip fractures presenting to the hospitals NA-case-control
Ever vs. never breastfed: OR: 0.55 (0.10-2.90)
Age, BMI, history of hormone replacement therapy use, current slate of psychotropic medications, current smoking status, current dairy product consumption, score on mental state questionnaire, current physical activity (number of hours of work in the house or garden per week), and health status (number of self-reported illnesses)
Hoffman et al.,1993150
Mediumb
Case-control study of women ages 45 or older in New York and Philadelphia between 1987-89 174 cases, with radiologically confirmed first hip fracture, from 30 hospitals in New York and Philadelphia (103 parous); 174 controls from general surgical
71% over age 75
All women: lactated ≤12 mos or >12 mos vs. never lactated
Radiologically confirmed first hip fracture NA-case-control
>12 mos OR: 0.64 (0.32-1.29) ≤12 mos OR: 0.67 (0.39-1.13)
Hospital of recruitment, age group, and age
All women: ever breastfed vs. never vs. never BF
Radiologically confirmed first hip fracture NA-case-control
Ever vs. never breastfed: OR: 0.87 (0.47-1.61)
Hospital of recruitment, age group, and age
Parous women: lactated ≤12 mos or >12 mos vs. never lactated
Radiologically confirmed first hip fracture NA-case-control
>12 mos OR: 1.08 (0.45-2.60) ≤12 mos OR: 0.80 (0.42-1.55)
Hospital of recruitment, age group, age, and number of live births

87
Table 25. Breastfeeding and fractures: Summary of individual studies (continued)
Author, Year ROB
Study Description N of Participants
Population Definition of Exposure
Definition of Outcome Timing of Followup
Results Confounders Adjusted for
and orthopedic services during the same time period and were frequency-matched to cases by age and hospital (123 parous)
Parous women: ever breastfed vs. never vs. never BF
Radiologically confirmed first hip fracture NA-case-control
Ever vs. never breastfed: OR: 0.66 (0.41-1.05)
Hospital of recruitment, age group, age, and number of live births
Hwang et al., 2016154
High
Cohorts constructed from the Korea National Health and Nutrition Examination Survey (KHANES, nationwide, population-based, cross-sectional survey) 1222
Mean (SD): 62.8 (8.8)
Breastfed for 7-18 mos, 19-36 mos, and ≥37 mos vs. 0-6 mos
Self-reported lumbar spine fracture NA-cross-sectional
p=0.026 for trend
Mean (SD): 62.8 (8.8)
Breastfed for 7-18 mos, 19-36 mos, and ≥37 mos vs. 0-6 mos
Self-reported hip fracture NA-cross-sectional
p=0.322 for trend
Kreiger et al., 1986152
Highb
Case-control study of women between 45 and 74 yrs of age in Connecticut recruited from 1977-79 Cases: 98 women with hip fractures; controls: 83 trauma cases from the same hospitals
45-74 yrs, mean age NR
BF (12-month increase)
First hip fracture confirmed by radiography identified from hospital record NA-case-control
0.50 (0.20-0.90)
Age and for Quetelet index (0.01 increase), bilateral ovariectomy (yes/no), and estrogen replacement therapy (60-month increase)
Lambrinoudaki et al., 2015155
High
Cohort constructed from cross-sectional survey of all postmenopausal women who presented in a menopause clinic between August 2007 and July 2013 in Greece 454
Mean (SD): 56.8 (7.1)
Months of lactation
Radiologically assessed vertebral fracture NA-cross-sectional
Odds of presenting with at least one vertical fracture: OR: 1.026 (0.993-1.060), p=0.127

88
Table 25. Breastfeeding and fractures: Summary of individual studies (continued)
Author, Year ROB
Study Description N of Participants
Population Definition of Exposure
Definition of Outcome Timing of Followup
Results Confounders Adjusted for
Michaelsson et al., 2000153
Mediumb
Case-control study of Swedish postmenopausal women ages 50-81 yrs between October 1993 and February 1995 Cases: 664 women with hip fractures; controls: 1,848 women randomly selected from the population register
50-81 yrs, mean age NR
BF (3 mos increase)
Hip fracture based on clinical or register records NA-case-control
OR: 0.98 (0.95-1.01)
Adjusted for age (≤54, 55-59, 60-64, 65-69, 70-74, and ≥75 yrs), hormone replacement therapy (never, former, and current use), oral contraceptive use (never and ever use), and BMI (by quintiles)
Total months of BF, categorized as 6-10 mos, 11-16, >16 vs. 1-5
Hip fracture based on clinical or register records NA-case-control
6-10 mos OR: 0.68, 1.11 11-16 mos OR: 0.66, 1.12 >16 mos OR: 0.67, 1.12
Mori et al., 2015146
High
Cohort study of pre- or early perimenopausal women from the Study of Women’s Health Across the Nation (United States): ages 42-52 yrs 2239
46 Accumulated length of lactation before age 42
Self-reported nondigital noncraniofacial fractures after age 42, 95% of them confirmed by medical records 15.7 yrs (median)
Adjusted HR: 0.97 (0.92, 1.02) per every additional 6 mos of lactation (p=NS)
Race/ethnicity, BMI, smoking status, smoking pack-years, alcohol consumption, physical activity, employment status, diabetes, hyperthyroidism, supplementary calcium, supplementary vitamin D, use of sex steroid hormone pill/patch injection, birth control pills, depo-provera injection, oral corticosteroids, proton pump inhibitors, other bone-adverse medications, study site
Naves et al., 2005156
Medium
Cohort of women ages 50 or over, randomly selected from a Spanish population that had participated in a study of prevalence of vertebral fractures 255
Mean (SD): 65 (9)
Breastfed for >3 mos vs. ≤3 mos
Radiologically assessed vertebral osteoporotic fracture (includes Colles, vertebral, ankle, rib, pelvis, humerus)
OR: 3.05 (0.94-9.90)
Age, handgrip strength, femoral neck BMD, prevalent vertebral fracture, and the history of falls during followup
a The authors note that “[s]imilar results were obtained when lactation was treated as a continuous variable” but do not provide
results. b This study was included in the prior 2007 AHRQ review by Ip and colleagues.2 We did not reassess ROB for individual studies
included in that review; this rating represents the decisions of the authors of that review.
BF = breastfeeding; BMD =bone mineral density; BMI = body mass index; BMD =bone mineral density; BMI = body mass
index; NA = not applicable; OR = odds ratio; SD = standard deviation; yrs = years.

89
Postpartum Depression
Background Perinatal depression is a serious health problem; according to 2012 data from the Pregnancy
Risk Assessment Monitoring System, nearly 12 percent of women reported a history of
postpartum depressive symptoms.157 Women with postpartum depression are at increased risk of
maternal suicide, infanticide, and impaired maternal sensitivity and attachment with the
infant.158-161 Women with depression are also less likely to engage in enriching interactions (e.g.,
reading, singing) with their children.162 Prevention of postpartum depression is thus a major
public health priority. Breastfeeding is thought to affect depression risk through the hormone
oxytocin, which is implicated in maternal bonding, and through modulation of the hypothalamic
pituitary adrenal axis.
Elucidating the relationship between breastfeeding and postpartum depression is challenging,
because women with depression may have difficulty initiating and sustaining breastfeeding, and
women who experience breastfeeding difficulties may develop depression. Some of the potential
confounders thought to be important in studies of depressive symptoms and feeding practices
include prior depression history, marital status, employment status, pregnancy intention, and
intention to breastfeed.
Methods We included both case-control and cohort studies that examined the link between
breastfeeding and postpartum depression, in addition to recent systematic reviews (published
within the past 5 years). All methods of assessment of depression were included (e.g., the
Edinburgh Postnatal Depression Scale and other questionnaires). The prior systematic review2
was also limited to studies that had at least 100 nursing mothers; for this update, all newly
included individual studies had a sample size greater than 100 (i.e., we did not exclude any
studies because of inadequate sample size).
Published Systematic Reviews/Meta-Analyses A recent systematic review163 identified 48 articles on associations among breastfeeding,
prenatal, and postpartum depression (Table 26). The review included studies from 12 very high-
income countries (Australia, Canada, Norway, Finland, Iceland, Italy, Japan, Portugal, Sweden,
United Arab Emirates, United Kingdom, and United States) and 7 other countries (Brazil,
Barbados, China, Congo, Mexico, Pakistan, and Turkey). No exclusion criteria were based on
study design. Five of the six studies included in the prior 2007 AHRQ systemic review2 were
included in the review; one study164 was not included but is grouped with the newly identified
individual studies described below.

90
Table 26. Breastfeeding and postpartum depression: Summary of published systematic review
Author, Year
Number of Studies (N Participants Study Design
Search Date (Databases)
Study Characteristics
Definition of Exposure Definition of Outcome
Timing of Followup
Results Risk of Bias
Dias, 2015163
48 (71,245); cohort studies
1980 through December 2013 (MEDLINE, Web of Science, PsycINFO)
Most studies were conducted in the U.S. (n=15) and U.K. (n=6), with others in Australia, Brazil, Canada, Barbados, Norway, Pakistan, Turkey, China, Congo, Finland, Iceland, Italy, Japan, Mexico, Portugal, Sweden, and the UAE
BF status was defined according to different criteria: Labbok and Krasovec criteria (n=5); WHO recommendations (n=1); as a dichotomous variable (n=10); as a 3- or 4-group variable (n=5); with the inclusion of solids (n=2); exclusive BF status (n=7); and not specified (n=13). Duration was assessed at different postpartum time-points: before the 6-month public recommendations (n=26), and at 6 mos (n=12).
Pregnancy depression, postpartum depression (no limitation on measures)
Three studies assessed depression only during pregnancy, 35 measured symptoms postpartum, and nine assessed depression both during pregnancy and postpartum; postpartum followup ranged from 1 wk to 2 yrs
No meta-analyses: authors conclude BF duration is associated with postpartum depression: postpartum depression predicts and is predicted by BF cessation in several studies, pregnancy and postpartum depression are associated with shorter BF duration, BF may mediate the association between pregnancy and postpartum depression; pregnancy depression predicts shorter BF duration and that may increase depressive symptoms during postpartum.
Unclear
BF = breastfeeding; CI = confidence interval; N = number; NR = not reported; RR = relative risk; UAE = United Arab Emirates; UK = United Kingdom; U.S. = United States.

91
The authors explored the relationship between depression and breastfeeding, and in doing so,
accounted for the temporal relationship in an effort to address causal direction.163 They reported
associations between postpartum depression and breastfeeding in 18 included studies; shorter
breastfeeding duration was associated with higher rates of depressive symptoms. However, the
causal direction of this association was unclear. In longitudinal studies that measure depression
symptoms and breastfeeding status over time, the authors reported that three studies in very high-
income countries found no association between early breastfeeding or bottle-feeding and
subsequent depression; two studies found that breastfeeding pain or low breastfeeding self-
efficacy predicts depression. The authors concluded that breastfeeding difficulties predict
postpartum depression.
Notably, they also concluded that depression symptoms during pregnancy and postpartum
depression are associated with early cessation of lactation. Given the potential confounding
between these variables, authors reported mixed results in studies that include prenatal and
postpartum assessment of maternal mood as well as longitudinal assessment of breastfeeding
outcome. Among seven studies that measured the association between prenatal depression and
breastfeeding duration, two found no association, and five found an inverse association. Shorter
breastfeeding duration was associated with postpartum depression in four studies, but not in three
other studies. The authors concluded that approaches are needed to identify and assist women
with prenatal depression or early breastfeeding problems to improve both breastfeeding
outcomes and maternal mood
Included Studies
Characteristics We included 12 individual prospective cohort studies not included in the systematic review
described above (Table 27); 11 were newly identified, and 1 study was included in the prior 2007
review.164 Sample size ranged from 119 to 5,219 participants. Studies generally included women
in their 20s and 30s. Nine studies described the proportion of enrolled women with prior
depression; of these, two excluded women who had a previous or current history of
depression,165, 166 and others enrolled a minority of women with previous or current depression
(10 to 45% of participants). Three studies did not describe whether women had a prior history of
depression.164, 167, 168 Three studies were conducted in the United States,169-171 2 in Canada,172, 173
and 1 each in Australia,174 Denmark,175 Hong Kong,176 Spain,177Sweden,178 United Arab
Emerites,179 and the United Kingdom.164 In general, studies followed women over time (6 weeks
to 6 months postpartum) and measured both depression symptoms and breastfeeding
duration/exclusivity. Studies varied in terms of whether they focused on any versus exclusive
breastfeeding measures (Table 27); most (7 studies) compared women who were not
breastfeeding with those who were currently breastfeeding. Two studies compared women who
had never breastfed, women who had initiated but stopped, and women who were still
breastfeeding,175, 176 and 3 studies used other comparisons: women who did or did not initiate
breastfeeding,168 women who were exclusively breastfeeding, mixed feeding, or formula feeding
at 1 and 6 months,165 and women who were predominantly breastfeeding or predominantly
formula feeding at 6 months.169

92
Table 27. Breastfeeding and postpartum depression: Summary of individual studies
Author, Year ROB
Study Description N Participants
Population Definition of Exposure
Definition of Postpartum Depression
Timing of Followup
Results Confounders Adjusted For
Ahn, 2015169
High
Prospective cohort enrolling women with vaginal birth, no postpartum hemorrhage, discharged within 72 hours of delivery 152 (119 completed 6-month followup)
Age, mean 29-31 % with prior depression: 21-23
Predominantly BF or predominantly bottle-feeding at 6 mos postpartum
Continuous EPDS score Assessed day 7, day 14, mos 1-6
EPDS at 6 mos, mean (SE): Breast: 3.35 (0.34) Bottle: 3.39 (0.60) p=0.94 No association at all time points, p=0.33-0.94
None
Chojenta, 2016174
High
Population cohort study of Australian women born 1973-1978 with one or more children born before 2009 5,219
Age 31-36 at assessment of pregnancy history % with prior postpartum depression: 26
Any BF <6 months vs. ≥6 for each child born
Retrospective self-report, for each child born: “Were you diagnosed or treated for postnatal depression?” NA (age 31-36 at cohort enrollment)
OR (95% CI) of postnatal depression for pregnancy followed by BF <6 mos vs. ≥6: 1.29 (1.12 to 1.50)
Pregnancy complications, social support, proportion of stressful life events, SF-36 mental health index, SF-36 general health index, income stress, education, partner status, mean stress, LOT-R optimism, history of pregnancy, birth, postpartum events, history of self-harm, violent relationship, depression, anxiety, tobacco use
93
Table 27. Breastfeeding and postpartum depression: Summary of individual studies (continued)
Author, Year ROB
Study Description N Participants
Population Definition of Exposure
Definition of Postpartum Depression
Timing of Followup
Results Confounders Adjusted For
Davey, 2011172
Medium
Secondary analysis of RCT enrolling pregnant women 2,015 (1,403 completed 8-week followup)
Age, % <25: 18 ≥25: 82 % with prior depression: No postpartum depression: 20 Subclinical postpartum depression: 37 Major postpartum depression: 45
Any BF at 8 wks postpartum (yes or no)
EPDS score, categorized by score indicating risk of postpartum depression: None: <10 Subclinical: 10-12 Major: 13+ 8 wks postpartum
BF status at 8 wks was not associated with subclinical postpartum depression (OR not reported; p>0.05) Not BF at 8 wks was associated with an increased risk of major postpartum depression, OR (95% CI): 2.12 (1.21 to 3.70) No information on temporality of depression symptom onset and BF cessation
History of depression, country where mother was born, depressive symptoms during pregnancy

94
Table 27. Breastfeeding and postpartum depression: Summary of individual studies (continued)
Author, Year ROB
Study Description N Participants
Population Definition of Exposure
Definition of Postpartum Depression
Timing of Followup
Results Confounders Adjusted For
Hamdan, 2012179
High
Prospective cohort study of women recruited during pregnancy in UAE 137
Age, %: <30: 74 30+: 26 Prior depression: NR
Any BF vs. no BF, 2 and 4 mos postpartum
Postpartum depression diagnosis: women with EPDS ≥10 were assessed using the Mini International Neuro-psychiatric interview 2 and 4 mos postpartum
Unadjusted results were reported for cross-sectional and longitudinal associations between BF status and postpartum depression. N (%) BF at 2 mos x postpartum depression at 2 mos: Any breast: 11 (9) No breast: 3 (17.7) p=0.38 Postpartum depression at 2 mos x BF at 4 mos: Any breast: 8 (7) No breast: 6 (31.6) p<0.01 BF at 2 mos x postpartum depression at 4 mos: Any breast: 6 (5.1) No breast: 3 (17.7) p=0.05 BF at 4 mos x postpartum depression at 4 mos: Any breast: 4(3.3) No breast: 5 (26.3) p<0.01
Multiple confounders measured, no adjusted results reported

95
Table 27. Breastfeeding and postpartum depression: Summary of individual studies (continued)
Author, Year ROB
Study Description N Participants
Population Definition of Exposure
Definition of Postpartum Depression
Timing of Followup
Results Confounders Adjusted For
Illiadis, 2015178
High
Longitudinal cohort study among Swedish-speaking women age 18+ enrolled during pregnancy 365 enrolled 181 included in analysis
Age, %: 20-34: 73 ≥35: 27 % with prior depression: 27
Any BF vs. no BF, 6 wks postpartum
Depressive symptoms, defined as EPDS ≥10 Healthy women: no EPDS ≥10 Symptoms, but not postpartum depression: Depression symptoms before/during pregnancy, but EPDS <10 postpartum Postpartum depression: EPDS ≥10 at 6 wks postpartum
Association with BF status at 6 wks postpartum: EPDS ≥10, N (%): Any BF: 21 (15.4) No BF: 11 (25) History of depression symptoms, but not postpartum, N (%) Any BF: 37 (27.2) No BF: 15 (34.0) No depression symptoms, N (%) Any BF: 78 (57) No BF: 11 (40) p=0.14
None
Lau, 2006176
High
Prospective cohort enrolling Chinese women in Hong Kong with no personal or family psychiatric history 2,178 enrolled (598 completed 6 week followup)
Age, % >25: 89 Prenatal depression: EPDS score, mean(SD) 18 wks: 8.28 (4.63) 32 wks: 7.55 (4.79)
Ever breastfed vs. never breastfed Among those who initiated, duration ≤3wks vs. >3 wks
Continuous EPDS score at 6 wks postpartum
Unadjusted EPDS score at 6 wks, mean (SD): Did not initiate BF: 7.13 (5.30) Initiated BF: 7.25 (4.90 p=0.854 Breastfed, ≤3 wks: 7.21 (4.55) Breastfed, >3 wks: 7.26 (5.01) p=0.943 Odds of BF outcome, by EPDS score at 6 wks, OR (95% CI) Ever breastfed vs. never breastfed: 1.004 (0.962, 1.047) Breastfed >3 wks vs. ≤3 wks: 0.946 (0.870, 1.029)
OR adjusted for age, educational level, ≥1 year in Hong Kong, married, length of marriage ≥1 year, housewife or part-time work, family income <$5K, private housing, size of residence ≥500 ft2, living with parents, living w/parents-in-law

96
Table 27. Breastfeeding and postpartum depression: Summary of individual studies (continued)
Author, Year ROB
Study Description N Participants
Population Definition of Exposure
Definition of Postpartum Depression
Timing of Followup
Results Confounders Adjusted For
Maimburg, 2015175
High
Secondary analysis of RCT enrolling primiparous Danish women between 10+0 and 21+6 days gestation, singleton pregnancy 1138
Age, mean 29-30 % with prior psychiatric history:11-12
Never breastfed Breastfed, < 6 wks Breastfed, ≥6 wks
EDPS score ≥12 at 6 wks postpartum
EPDS score ≥12 at 6 wks vs. breastfed ≥6 wks, OR (95% CI): Breastfed, <6 wks: 3.10 (1.65, 5.85) Never breastfed: 6.41 (1.92, 21.44)
None
McCoy, 2008166
High
Cohort study (chart review) enrolling women who attended a 4-week postpartum visit and had a documented EPDS score, not already taking antidepressants 588
Age, % <21: 35 ≥21: 65 % with depression documented in chart: 2
At 4 wks, any BF vs. not BF
EPDS score ≥13 at 4 wks postpartum
EPDS ≥13 at 4 wks, by infant feeding at 4 wks, N (%) Any BF: 14 (7) Not BF: 33 (9) p=0.48
None
Reifsnider, 2016165
Medium
Secondary analysis of RCT enrolling women of Mexican origin, pregravid BMI ≥25 kg/m2, age 18 to 45, no previous serious medical or psychological disease 150
Age, mean (SD) 29.7 (5.9) % with prior depression: 0 (not eligible)
Exclusive BF, nonexclusive BF, no BF 1 and 6 mos
Continuous EPDS score, 1 month and 6 mos postpartum
EPDS score by feeding group, mean (SD): 1 month Exclusive: 3.64 (5.56) Nonexclusive: 3.04 (4.42) No BF: 5.18 (6.97) 6 mos Exclusive: 5.43 (6.79) Nonexclusive: 3.04 (3.77) No BF: 4.39 (6.99) p (for mixed model): 0.313
Mixed model adjusted for food stamps and having no money for food

97
Table 27. Breastfeeding and postpartum depression: Summary of individual studies (continued)
Author, Year ROB
Study Description N Participants
Population Definition of Exposure
Definition of Postpartum Depression
Timing of Followup
Results Confounders Adjusted For
Sword, 2011168
Some concerns
Prospective cohort study, enrolling Canadian women, >16 yrs delivering singleton at >37 wks gestation 2560
Age, mean (SD) 31 (5.3) % with prior depression: NR
BF initiated vs. not initiated
EPDS ≥12 at 6 wks postpartum
EPDS ≥12 at 6 wks postpartum (BF initiated vs. not initiated), OR (95% CI): 2.07 (1.02 to 4.21) p=0.0449
Maternal age <25 yrs, first pregnancy, MacArthur SES score, number of unmet learning needs, maternal hospital readmission, health since delivery, SF-12 mental component score, SF-12 physical component score, urinary incontinence, mode of delivery, low social support, exhaustion/extreme fatigue, any previous depression, total household income, country of birth outside Canada
Trevino-Juarez, 2016167
Some concerns
Prospective cohort enrolling Spanish-speaking primiparas in Madrid with healthy singleton infants (36-42 wks gestation) not admitted to NICU 364
Age, mean (SD) 32 (5.3) % with prior depression: not reported
Any BF vs. artificial milk feeding 6 wks and 6 mos
EPDS ≥11 EPDS ≥11 at 6 wks, N (%) Any BF: 35 (13.2) No BF: 7 (16.7) p=0.538 At 6 mos, N (%) Any BF: 11 (6.1) No BF: 3 (2.3) p=0.118
Parameter estimate for BF at 6 wks adjusted for infant sex, mode of birth, “baby does not sleep well,” “baby does not eat well,” use of emergency medical services for baby’s health, mother’s employment status, socio-economic level, age at childbearing

98
Table 27. Breastfeeding and postpartum depression: Summary of individual studies (continued)
Author, Year ROB
Study Description N Participants
Population Definition of Exposure
Definition of Postpartum Depression
Timing of Followup
Results Confounders Adjusted For
Warner, 1996164
Medium
Prospective cohort recruited from postnatal wards, followed up with home interview 6-8 wks postpartum 2,375
Mean age (range) 28 (15 to 46) % with prior depression: NR
Not BF vs. BF at home interview at 6-8 wks postpartum
EPDS ≥13 OR (95% CI), EPDS ≥13 at 6 wks, not BF vs. BF: 1.52 (1.12 to 2.06)
Unplanned pregnancy, maternal unemployment, head of household unemployed
BF = breastfeeding; CI = confidence interval; EPDS = Edinburgh Postnatal Depression Scale; LOT-R = Life Orientation Test-Revised; N = number; NR = not
reported; OR = odds ratio; RR = relative risk; UAE = United Arab Emirates; UK = United Kingdom; U.S. = United States.

99
Eleven studies evaluated outcomes using the Edinburgh Postnatal Depression Scale (EPDS).
In eight studies, a threshold score was used to identify women with depression symptoms
(thresholds ranged from ≥10 to ≥13 across studies); three studies analyzed EPDS scores as
continuous variables.165, 169, 176 Two studies used other instruments in addition to the EPDS, one
assessed depression using the Mini International Neuro-psychiatric interview to establish a
diagnosis of depression among women with an EPDS ≥10,179 and the other assessed self-reported
history of postpartum depression diagnosis or treatment.174
Of the 11 new studies, we rated 3 as medium ROB and the remainder as high ROB. Common
methodological limitations included lack of information on the temporality of breastfeeding
cessation and onset of depression symptoms, recall bias, lack of adjustment for potential
confounding factors, and high rate of missing data.
Results Eleven studies measured postpartum depression using the EPDS scale; however, studies
varied in terms of how scores were analyzed and interpreted (Table 27). Overall, results were
mixed.
Eight studies reported on the association between breastfeeding and EPDS scores above and
below a set threshold.164, 166-168, 172, 175, 178, 179 Only one study verified EPDS scores using a
diagnostic instrument.179 Enrolled women (N=137) completed the EDPS and reported on
breastfeeding status at 2 and 4 months postpartum; women with an EPDS ≥10 underwent further
assessment with the Mini International Neuro-psychiatric interview to establish a diagnosis of
depression. In unadjusted analyses, feeding status at 2 months was not associated with
postpartum depression diagnosis; however, postpartum depression at 2 months predicted not
breastfeeding at 4 months (p <0.01), and not breastfeeding at 2 months predicted postpartum
depression at 4 months (p=0.05).179
Two studies accounted for prior history of depression or depressive symptoms in the analysis
and found inconsistent results.172, 178 One of these analyzed data separately for women with and
without a prior history of depression symptoms; enrolled women (N=181) reported data on
breastfeeding status at 6 weeks (any vs. none) and were grouped by prior history of depression
symptoms (none, prepregnancy, or prenatal depression, but EPDS <10 postpartum; and EPDS
≥10 postpartum, regardless of previous history). Breastfeeding status at 6 weeks did not differ
significantly by depression symptom history (p=0.14). However, the authors’ main focus was on
association between depression symptoms and cortisol; results for breastfeeding exposure and
depression symptoms were not adjusted for important confounding factors.178 The second study
was a secondary analysis of women enrolled in an RCT of an unsuccessful prenatal support
intervention to reduce postpartum depression.172 At 8 weeks postpartum, current breastfeeding
status (any breastfeeding vs. no breastfeeding) was not associated with subclinical postpartum
depression (EPDS scores 10-12); however, in a prediction model adjusting for history of
depression, country where the mother was born, and depressive symptoms during pregnancy, not
breastfeeding at 8 weeks was associated with a higher risk of major postpartum depression
(EPDS ≥13, adjusted OR, 2.12; 95% CI, 1.21 to 3.70).172
Five additional studies did not specifically account for depression symptoms before or during
pregnancy.166-168, 175, 180 Three found an association between breastfeeding status at 6 weeks
postpartum and two did not.166, 167 Of those that found an association, one focused on nulliparous
women enrolled in an RCT (N=1,138) evaluating a prenatal care education and support
intervention (“Ready for Child”); postpartum depression was assessed at 6 weeks postpartum and

100
categorized as EPDS score ≥12. In the whole sample, 1 percent of participants had never
breastfed, and 8 percent had stopped breastfeeding at 6 weeks postpartum. In unadjusted
analyses, compared with women who were breastfeeding at 6 weeks, never breastfeeding was
associated with increased risk of depression (OR, 6.41; 95% CI, 1.93 to 21.44) as was cessation
of breastfeeding by 6 weeks (OR, 3.10; 95% CI, 1.65 to 5.85).175 The second study (N=2,560)
followed women from birth through 6 weeks postpartum; never initiating breastfeeding was
associated with an increased risk of postpartum depression (EPDS ≥12) at 6 weeks compared
with initiating breastfeeding (adjusted OR, 2.07; 95% CI, 1.02 to 4.21, p=0.0449).168 The third
study that found an association enrolled women (N=2,375) 6-8 weeks postpartum and assessed
both current feeding status and EPDS. In models adjusted for unplanned pregnancy, maternal
employment, and head of household employment, not breastfeeding was associated with an
increased risk of EPDS ≥13 compared with breastfeeding (adjusted OR, 1.52; 95% CI, 1.12 to
2.06).180 The two studies that found no difference in depression scores and breastfeeding status
measured outcomes at a similar time point (4-6 weeks postpartum). One (N=551) evaluated
records of women presenting for a 4-week postpartum visit; in unadjusted analyses there was no
association between current breastfeeding (at 4 weeks) and EPDS scores ≥13 (7% vs. 9%,
respectively; p=0.48).166 The second study (N=364) assessed postpartum depression symptoms
and breastfeeding status among a cohort of primiparous women; breastfeeding was categorized
as any breastfeeding or no breastfeeding and collected at 6 weeks and 6 months postpartum. In
unadjusted analyses, there were no associations between infant feeding status and EPDS ≥11 at 6
weeks or 6 months.167
Three studies assessed the relationship between breastfeeding status and mean EPDS scores;
all three found no association between breastfeeding status and depressive symptoms.165, 169, 176
One (N=119) enrolled women with an uncomplicated vaginal birth; participants were followed
through 6 months postpartum, and EPDS scores were collected at multiple time points (7 days,
14 days, and monthly from 1 to 6 months). Breastfeeding status was assessed at 6 months and
classified as predominantly breastfeeding vs. predominantly bottle-feeding; in unadjusted
analyses, there was no association between feeding status at 6 months and EPDS scores at any
time point (p value range: 0.33 to 0.94).169 The second enrolled pregnant women (N=2,178) who
had no personal or family psychiatric history. At 6 weeks postpartum, there was no association
between EPDS scores and breastfeeding initiation and noninitiation (p=0.85); among women
who initiated breastfeeding, there was no difference in scores among those who breastfed for 3
weeks or less and those who breastfed for longer than 3 weeks (p=0.94).176 The third study
enrolled Mexican-American participants (N=150) from an RCT focused on prevention of
childhood obesity; the authors analyzed the association between feeding status (categorized as
exclusive breastfeeding, nonexclusive breastfeeding, or not breastfeeding) and EPDS scores at 1
and 6 months postpartum. No significant associations were found between feeding status and
EPDS score or EPDS score trajectory.165
Finally, one Australian population cohort study (the Australian Longitudinal Study on
Women’s Health) assessed self-reported breastfeeding and postpartum depression for each birth
(at age 31 to 36 years). Postpartum depression was ascertained with the question, “Were you
diagnosed or treated for postnatal depression?”; breastfeeding was categorized as <6 months vs.
≥6 months for each child. The authors found a modest association between breastfeeding <6
months and self-reported diagnosis or treatment of postpartum depression (adjusted OR, 1.29;
95% CI, 1.12 to 1.50). Interpretation of this result is limited by lack of information on the
temporal sequence of depression and breastfeeding cessation.174

101
Relationship Between Return to Prepregnancy Weight or
Postpartum Weight Change and Breastfeeding
Background The relationship between breastfeeding and weight retention is not clearly understood; a host
of related factors influence weight, making it difficult to isolate the effect of breastfeeding on
weight change. These include prepregnancy weight, parity, activity level, nutritional intake,
socioeconomic status, and ethnicity, among others.181 Unmeasured confounding could also arise
from an underlying propensity that may influence both the decision to breastfeed and maintain
other health behaviors182 that might influence weight changes.
Methods Our eligibility criteria follow that of the previous systematic review;2 we limited our review
to prospective cohort studies conducted in developed countries that directly compared weight
changes of nonlactating women with weight changes of lactating women and for whom the
exclusivity or the amount of breastfeeding was clear. Studies of the relationship between
postpartum weight change and breastfeeding needed to control for subjects’ gestational weight
gain or prepregnancy weight and have at least 3 months postpartum followup to be included. The
previous review2 also restricted inclusion to studies with at least 50 women per feeding group in
the final analyses (e.g., lactating vs. nonlactating); however, all eligible studies for the update
met this sample size criterion (in other words, we did not exclude studies because of inadequate
sample size). For each included publication that reported multiple timepoints, we focused on the
furthest timepoint available.
Systematic reviews/Meta-analyses We also found one systematic review of breastfeeding and postpartum weight retention
conducted a sensitivity analysis for 7 US-based studies included in their larger review, and found
nonsignificant results for the effects of breastfeeding on postpartum weight retention
(standardized mean difference: 0·79; 95% CI, 0·19, 1·38).183 Because the meta-analysis did not
provide a citation list for the US-specific result, we are unable to comment on the extent of
overlap between the meta-analysis and the primary studies that we included.
Included Studies
Characteristics The previous review included 9 publications (of 7 cohorts) that examined postpartum weight
changes in relation to exclusive breastfeeding.184-187, 188 , 189 , 190-192 One publication, Linne et al.,
2003,188 was a 15-year followup in a cohort for which other publications reported 1-year
outcomes.187, 191 The update searches identified 10 additional publications. 181, 182, 193-200 Of these,
2 reported on the same cohort,193, 199 and 1 reported on two cohorts: in Norway and the United
States.181 The total evidence base includes 45,563 women in 17 study cohorts, predominantly
from the United States (exceptions include 1 publication each on cohorts from Canada, Taiwan,
Sweden, Australia, and Norway). Despite the substantial breadth of this evidence base, its
heterogeneity precluded meta-analysis. Studies varied in their definition of exposure, using
duration, duration and intensity, or duration and exclusivity. Studies also varied in how they
reported outcomes. All reported a change in weight, but the timepoints that marked the beginning

102
and the end of the measurement varied. Start times for outcome measurement included a fixed
timepoint (e.g., 1989), before the index pregnancy, at the first prenatal visit, at the point of the
highest pregnancy weight, within 1-2 days of delivery, or at 14 days after delivery. Stop times
for outcome measurement were similarly varied, ranging from a fixed timepoint (e.g., 1993), just
before a second pregnancy, and at a postpartum date ranging from 6 months to 15 years after the
index delivery. In addition to the heterogeneity in PICOTS, this database spans publication of
results starting in 1989. This period of time also covers secular changes in breastfeeding
practices and women’s weight. We present results below by definition of exposure first and then by the time frame of the
weight change outcome. Table 28 summarizes characteristics and results for individual studies.
Results
Duration Ten studies defined breastfeeding in terms of duration,181, 182, 184, 189, 194-198, 200 but their
measurement of outcomes varied. Three of 10 studies reported weight change between an early
postpartum period (1-14 days after delivery) to later in the postpartum period (12 to 24
months).181, 189, 195 Only 1 of these 3 studies, set in Australia, reported statistically significant
differences. Breastfeeding for at least 3 months predicted lower odds of having postpartum
weight retention from prepregnancy to 12 months within the top quintile, when compared with
breastfeeding for <3 months or not breastfeeding.195 One of 10 studies reported on weight change
between early pregnancy (first prenatal visit) and 1 year postpartum and found a greater and
statistically significant weight reduction.184 The remaining 6 of 10 studies reported on weight
change from prepregnancy weight to postpartum weight measured at timepoints ranging from 6
months to 8 years postpartum.182, 194, 196-198, 200 Of these, 3 reported no statistically significant
differences,182, 194, 198 and 1 reported a difference only for the group with the longest period of
exposure (20 weeks or more). 200 Two studies, set in the United States, reported differences by
exposure. Specifically, 1 study reported a lower risk of weight retention of 20 pounds or more
among those who partially or exclusively breastfed for 6 months or more when compared with
those who did not,197 and a second reported lower weight retention among those who were still
breastfeeding at 6 months postpartum compared with those who were not.196
Duration and Intensity Four studies, reported in six publications, reported on duration and intensity.184, 186-188, 191, 192
Of these, two publications reported on 1 year postpartum outcomes from a Swedish cohort,187, 191
and a third reported on 15-year outcomes.188 One study, evaluating weight change from
immediately after delivery to 9 months postpartum, found no difference. A second, evaluating
weight change from the first prenatal visit to 1 year postpartum, also found no differences.184 The
two studies that evaluated weight change from a prepregnancy measure to weight at 1 year,187, 191
18 months,186 and 15 years188 all reported statistically significant differences favoring greater
intensity of breastfeeding.

103
Table 28. Breastfeeding and postpartum weight change: Summary of individual studies
Author, Year ROB
Study Description Number of Participants
Population Definition of Exposure
Definition of Outcome (Start to End of Followup) Timing of Followup
Results Confounders Adjusted For
Brewer et al., 1989190
Mediuma
Pregnant women recruited through mail and telephone contacts before delivery with assistance from a local woman’s hospital in Louisiana 56
Prepregnancy weight, kg (SD) Exclusive BF: 59.8 ± 13.1 Formula feed: 54.9 ± 6.0 Mixed feed: 57.3 ± 7.5
Exclusive formula feed or mixed feed at 6 mos
Change in weight and weight-height index from 1-2 days to 6 mos postpartum
No statistically significant differences between groups
Age, parity, prepregnancy weight, socioeconomic data, energy intake, energy expenditure exclusive of lactation (physical activity)
Endres et al., 2015197
Medium
Women ages 18-40 with a live birth at 20 wks of gestation or longer from a 5-site prospective cohort NICHD study 774
Prepregnancy weight, lbs (SD) 161.5 (46.2)
Partial or exclusive BF at 6 mos vs. no BF at 6 mos
Weight retention of 20 lbs or more from prepregnancy weight to 1 year postpartum
OR=0.46 (0.24, 0.87)
Age, race, type of insurance, marital status, poverty level, weight gain during pregnancy, prepregnancy BMI, BF, working outside the home, and hours of nightly sleep
Haiek et al., 2001192
Mediuma
Mothers recruited at the immunization clinics while waiting for their child’s visit in 2 public health clinics in Montreal, Canada 236
Mean prepregnancy BMI (SD): 22.5 (3.4)
Mixed-feeding (i.e., average daily intake of formula and breast milk of >4 oz) or predominantly bottle-feeding (i.e., exclusive bottle-feeding or average daily intake of breast milk of 4 oz or less) vs. predominantly BF (i.e., exclusive BF or average daily intake of formula of 4 oz or less) (time-varying measurement of exposure)
Average monthly rate of weight change from delivery to up to 9 mos
No statistically significant differences
Gestational weight gain, postpartum smoking, infant’s solid intake, maternal place of birth

104
Table 28. Breastfeeding and postpartum weight change: Summary of individual studies (continued)
Author, Year ROB
Study Description Number of Participants
Population Definition of Exposure
Definition of Outcome (Start to End of Followup) Timing of Followup
Results Confounders Adjusted For
Janney et al., 1997186
Mediuma
Pregnant nulliparous and primiparous women ages 20-40 yrs in their third trimester recruited from birthing education classes and obstetric practices in the Ann Arbor, Michigan, area 110
Prepregnancy BMI: 22.2±3.4
Fully BFb partially BF, bottle-feeding
Weight change from prepregnancy weight to weight at 18 mos (time varying)
Duration of lactation practice was a significant predictor of postpartum weight retention over time (p<0.001)
Weight gained during pregnancy, months since parturition, marital status, age
Jarlenski et al., 2014193
Medium
Infant Feeding Practices Study II (IFPSII) following women from last trimester through 12 mos; sampled from a national consumer opinion panel 2,102
Exclusive BF: Underweight (<18.5): 2.8 (1.5, 4.0) Healthy Weight (18.5-24.9): 46.4 (42.7, 50.2) Overweight (25-29.9): 28.6 (25.2, 29.9) Obese (>30): 22.3 (19.1, 25.4) Nonexclusive or no BF Underweight: 2.0 (1.2, 2.9) Healthy Weight: 44.0 (41.0, 47.1) Overweight: 29.5 (26.7, 32.2) Obese: 24.5 (21.9, 27.1)
Exclusive BF for 3 mos or more vs. nonexclusive BF for 3 mos or more or never BF
Postpartum weight loss (highest pregnancy weight to her postpreg-nancy weight) at 12 mos postpartum
Difference in weight loss of -3.2 pounds (95% CI, 1.7, 4.7 pounds, p<0.05)
Cohort matched based on propensity score that included the following covariates: maternal age, race/ethnicity, parity, education, WIC enrollment, prepregnancy obesity, prenatal insurance coverage, postpartum smoking, C-section, infant in ICU postpartum, and BF support
Return to prepregnancy BMI category at 12 mos postpartum
6.0 percentage point increase (95% CI, 2.3, 9.7), p<0.01
Cohort matched based on propensity score that included the following covariates: maternal age, race/ethnicity, parity, education, WIC enrollment, prepregnancy obesity, prenatal insurance coverage, postpartum smoking, C-section, infant in ICU postpartum, and BF support

105
Table 28. Breastfeeding and postpartum weight change: Summary of individual studies (continued)
Author, Year ROB
Study Description Number of Participants
Population Definition of Exposure
Definition of Outcome (Start to End of Followup) Timing of Followup
Results Confounders Adjusted for
Return to prepregnancy BMI at 12 mos postpartum
6.1 percentage-point increase (95% CI, 1.0, 11.3), p<0.05
Cohort matched based on propensity score that included the following covariates: maternal age, race/ethnicity, parity, education, WIC enrollment, prepregnancy obesity, prenatal insurance coverage, postpartum smoking, C-section, infant in ICU postpartum, and BF support
Linne et al., 2003188
Higha
Stockholm Pregnancy and Women’s Nutrition Study (SPAWN) 563
Prepregnancy BMI: 21.5
Lactation score (scale 0-48): Every month with full lactation was given 4 points, and every month with mixed feeding was given 2 points
Weight change from prepregnancy to 15 yrs postpartum
Those women who became overweight had lower lactation scores than women who remained normal weight at 15 yrs followup (21.7 vs. 24.0, p<0.05 for t test)
None
Lyu et al., 2009198
Medium
Women over 20 yrs old with Han ethnicity, living in North Taiwan for more than 10 yrs and being less than 20 wks pregnant with singleton gestations 130 at 6 mos, 122 at 12 mos
Mean prepregnancy weight: 53.4 kg (SD=7.97)
BF duration in months Weight retention from prepregnancy to 12 mos postpartum
Regression coefficient in multiple models is not statistically significant
Model with the most variables includes age, socioeconomic status, breast-feeding, parity, physical activity, prepregnancy BMI, gestational weight gain, 1-month postpartum energy intakes, 6-month weight retention, postpartum average energy intakes and energy consumption

106
Table 28. Breastfeeding and postpartum weight change: Summary of individual studies (continued)
Author, Year ROB
Study Description Number of Participants
Population Definition of Exposure
Definition of Outcome (Start to End of Followup) Timing of Followup
Results Confounders Adjusted for
Ng et al., 2014195
Medium
Women who planned to give birth at one of three participating hospitals in Australia and were over age 16 (Environments for Healthy Living cohort) 1,316
Prepregnancy BMI % Underweight: 8.3 Normal weight: 52.4 Overweight: 21.4 Obese: 17.9
BF for at least 3 mos vs. BF for <3 mos or no BF
High postpartum weight retention from prepregnancy to 12 mos (within the top quintile)
Adjusted OR: 0.673 (95% CI, 0.471, 0.961) p=0.03
Maternal age, employment and education, alcohol intake and smoking during pregnancy, nonmedical drug use, primaparity, preexisting hypertension, marital status, paternal employment and education, household ownership, number of children under age 16, and year of recruitment
Ohlin et al., 1990;187
Ohlin et al., 1996191
Mediuma
Stockholm Pregnancy and Women’s Nutrition Study (SPAWN) 1,423
Prepregnancy BMI: 21.5
Lactation score (scale 0-48): Every month with full lactation was given 4 points, and every month with mixed feeding was given 2 points
Weight change from prepregnancy to 1 year postpartum
Correlation between change in weight and lactation score, r=-0.09, p<0.01, multiple stepwise regression analysis had a regression coefficient of -0.04, p<0.001
Weight gain during pregnancy, age, prepregnancy BMI, and parity
Olson et al., 2003184
Mediuma
Prospective cohort study of 622 healthy adult women who gave birth to singleton infants and were followed from early pregnancy until 1 y postpartum. Women were registered for obstetrical care over a 2-y period in a hospital and primary care clinic system serving a 10-county area of upstate New York 540
BMI <19.8 (low) 48 (8.9%) 19.8-26.0 (normal) 273 (50.6%) 26.1-29.0 (overweight) 83 (15.4%) >29.0 (obese) 136 (25.2%)
BF at 1 year vs. no BF Weight change from early pregnancy (first prenatal visit) to 1 year postpartum
Regression coefficient: -1.20 SE: 0.52, p=0.02
Age, single status, income, gestational weight gain, food intake, exercise often
BF score to capture intensity and duration (not described in detail)
Weight change from early pregnancy (first prenatal visit) to 1 year postpartum
Results NR, not statistically significant
NR

107
Table 28. Breastfeeding and postpartum weight change: Summary of individual studies (continued)
Author, Year ROB
Study Description Number of Participants
Population Definition of Exposure
Definition of Outcome (Start to End of Followup) Timing of Followup
Results Confounders Adjusted for
Onyango et al., 2011181
Medium
WHO Multicentre Growth Reference Study (MGRS) in (Norway and USA data reported here) USA: 172 Norway: 262
Prepregnancy weight not reported
BF for 4-12 mos or more vs. BF <3 mos, stratified by prepregnancy BMI
Weight change between 14 days and 24 mos postpartum
No statistically significant differences for normal, overweight, or obese women
NR
Ostbye et al., 2010 200
Medium
North Carolina WIC recipients at least 18 yrs of age and had more than one pregnancy available for analysis 32,920
Prepregnancy BMI: 26.4 (6.9)
Breastfed 1-4, 5-19 wks, or 20 wks or more vs. no BF
Weight retention from prepregnancy weight for the first pregnancy to the beginning of the second pregnancy (mean time between pregnancies: 2.8 yrs)
No statistically significant differences for any exposure other than 20 or more wks of BF; β (SE): -0.39 (0.18), p=0.03
Age, race, ethnicity, education, parity, gestational weight gain, smoking status, and prepregnancy BMI
Palmer et al., 2015194
High
Women from the Black Women’s Health Study who gave birth for the first time from 1995 to 2003 3,147
Prepregnancy BMI: No BF: 27.5 (6.8) <3 mos: 27.5 (7.0) 3-5 mos: 26.2 (5.6) 6-11 mos: 25.2 (5.0) ≥12 mos: 25.4 (5.0)
Duration of BF (<3, 4-7, 8-11, and ≥12 mos) vs. no BF
Weight change from baseline (year of first birth) to an average of 4 and 8 yrs postpartum
No differences by duration of lactation
Age, gestational weight gain, preterm birth, vigorous physical activity, dietary pattern, years of education, number of additional births during followup, and mean duration of lactation for the additional births during followup

108
Table 28. Breastfeeding and postpartum weight change: Summary of individual studies (continued)
Author, Year ROB
Study Description Number of Participants
Population Definition of Exposure
Definition of Outcome (Start to End of Followup) Timing of Followup
Results Confounders Adjusted for
Sicheiri et al., 2003185
Mediuma
Nurse’s Health Study II, with analysis restricted to women who were aged 24 to 40 yrs at baseline (1989), who had a history of no more than one past full-term pregnancy at baseline, gave birth to one child between 1990 and 1991, but had no other pregnancies during the followup Nulliparous: 1,538; Primiparous: 2,810
BMI >25 kg/m2 in 1989 (%) Never: 27.8 <3 mos:18.4 4-7 mos:15.8 8-11 mos:17.9 >12 mos:10.7
Exclusive BFc vs. no BF, stratified by parity and BMI
Weight change from baseline (prepregnancy, 1989) to 1-2 yrs postpartum (1993)
Exclusive BF was associated with a weight gain of approximately 1 kg (statistically significantly greater only for nulliparous women with a baseline BMI <25 who BF 1-3 and 4-7 mos(p<0.05) and for primiparous women with a baseline BMI ≥25 who BF ≥12 mos (p=0.04) when compared with women who did not BF
Age, physical activity, BMI, gestational weight gain
Duration of exclusive BF (<3, 4-7, 8-11, and ≥12 mos)c vs. no BF
Weight change from baseline (prepreg-nancy, 1989) to 1-2 yrs postpartum (1993)
Duration of lactation was unrelated to the magnitude of weight change (p>0.40 for all comparisons)
NR

109
Table 28. Breastfeeding and postpartum weight change: Summary of individual studies (continued)
Author, Year ROB
Study Description Number of Participants
Population Definition of Exposure
Definition of Outcome (Start to End of Followup) Timing of Followup
Results Confounders Adjusted for
Sharma et al., 2014199
Medium
Women who had no additional births after participating in the Infant Feeding Practices Study II (IFPSII) 726
Prepregnancy BMI % by adherence categories Never Initiated BF Normal: 15.8 Overweight: 16.2 Obese: 23.7 Initiated BF, did not exclusively breastfeed for ≥4 mos Normal: 55.4 Overweight: 60.8 Obese: 60.8 Adhered to exclusivity for ≥4 mos, BF duration <12 mos Normal: 8.9 Overweight: 5.9 Obese: 5.4 Adhered to exclusivity for ≥4 mos, BF duration <12 mos Normal: 19.9 Overweight: 17.2 Obese: 10.2
(1) Initiated BF, did not exclusively breastfeed for ≥4 mos, (2) adhered to exclusivity for ≥4 mos, BF duration <12 mos, (3) adhered to exclusivity for ≥4 mos, duration ≥12 mos vs. never BF
Weight change from prepregnancy to 6 yrs postpartum
No statistically significant differences for any category of prepregnancy weight by any category of adherence on weight retention, with the exception of the most adherent obese women (N=19, Mean change in kg: -8.0 [95% CI, -15.4 to -0.7])
Maternal age, race or ethnicity, education, poverty income ratio, marital status, parity, gestational weight gain, smoking status, physical activity

110
Table 28. Breastfeeding and postpartum weight change: Summary of individual studies (continued)
Author, Year ROB
Study Description Number of Participants
Population Definition of Exposure
Definition of Outcome (Start to End of Followup) Timing of Followup
Results Confounders Adjusted for
Stuebe et al., 2010182
Medium
Project Viva participants were recruited from a multispecialty group in eastern Massachusetts and had to be fluent in English, <22 wks gestation at study entry, and have a singleton pregnancy 579
Prepregnancy BMI Overall: NR No lactation: 26.8 (6.0) <3 mos: 26.9 (7.3) 3-<6 mos: 24.9 (5.0) 6-<12 mos: 24.8 (5.2) 12+mos: 23.7 (3.8)
Lactation <3, 3-<6 ,6-<12, 12+ mos
Weight retention at 3 yrs postpartum
Not statistically significant for any category of lactation
Smoking status, intention to lose weight, dietary intake, physical activity
Straub et al., 2016196
High
Women ages 18-40 yrs old with a live birth of 20+ wks of gestation who self-identified as black/African American, white/Caucasian, or Hispanic/Latino; excluded women who underwent permanent sterilization; had more than 4 children; could not provide morning and evening saliva samples; were currently pregnant, currently used steroids, were ≥350 lbs, or were missing prepregnancy or postpartum weights 696
Prepregnancy BMI, N (%): >25: 299 (43) 25-30: 185 (26.6) 30-35: 116 (16.7) 35-40: 41 (5.9) >40: 55 (7.9)
Still BF at the 6-month interview vs. not BF
Weight retention between prepregnancy weight and weight at 6 mos postpartum, evaluated as both a categorical variable (<10, 10-20, >20 lbs) and as a continuous variable
OR for categorical outcomes=0.53 (0.36, 0.79) β for continuous outcome = -3.29, 95 % CI, -4.88 to -1.76).
Prepregnancy BMI, age, cortisol slope, public health insurance status, race/ethnicity, cortisol covariates (tobacco use, birth control pill usage, wake time)

111
Table 28. Breastfeeding and postpartum weight change: Summary of individual studies (continued)
Author, Year ROB
Study Description Number of Participants
Population Definition of Exposure
Definition of Outcome (Start to End of Followup) Timing of Followup
Results Confounders Adjusted for
Walker et al., 2004189
Mediuma
Austin New Mothers Study (ANMS), a longitudinal study of a low-income, tri-ethnic sample of postpartum women that incorporated serial assessment of weight and behavioral and psychosocial variables 382
White: 24.23 ± 5.78 African American: 25.39 ± 5.40 Hispanic: 26.75 ± 6.19201
Partial BF or full bottle-feeding vs. full (exclusive BF) (time-varying measurement of exposure)
Postpartum BMI over time (delivery to 12 mos)
Infant feeding method was not associated with postpartum BMI (p=0.140)
Ethnicity, maternal education, parity, smoking, physical activity, time of weight measurement, interaction of ethnicity and time, prepregnant BMI, gestational weight gain, energy intakes, fat intake, contraception, emotional eating, depressive symptoms
a This study was included in the prior 2007 AHRQ review by Ip and colleagues.2 We did not reassess ROB for individual studies included in that review; this rating represents the
decisions of the authors of that review. b Fully BF was defined as providing at least two-thirds of the needed energy intake per kilogram of the infant’s weight in breast milk. c Introduction of daily formula/milk was assumed to represent the end of exclusive BF period.
ANMS = Austin New Mothers Study; BF = breastfeeding; BMI = body mass index; CI = confidence interval; IFPSII = Infant Feeding Practices Study II; kg = kilogram; lbs =
pounds; mos= month; N = number; NR = not reported; ROB = risk of bias.

112
Duration and Exclusivity Four publications reported on duration and exclusivity of breastfeeding from three
databases185, 190, 193, 199 (2 publications reported on the Infant Feeding Practices Study II but chose
different weight change measures).193, 199 Of the four studies, one study that evaluated weight
change from the highest pregnancy weight to 12 months postpartum reported a difference in
postpartum weight loss return to prepregnancy BMI and BMI category among those who were
exclusively breastfeeding for 3 or more months compared with those who did not.193 Another
publication using a subset of participants from the same sample but evaluating change in weight
from a prepregnancy measure to 6 years postpartum found benefit only for obese women who
were most adherent to breastfeeding guidelines in terms of duration and exclusivity.199 A third
study that evaluated change in weight and weight-height index from 1-2 days to 6 months
postpartum found no statistically significant differences,190 and a fourth that stratified results by
BMI, parity, and intensity found generally found no differences in weight from a prepregnancy
measurement to weight at 1-2 years postpartum, with some exceptions (i.e., higher weight
retention in underweight nulliparous women who breastfed exclusively for up to 7 months vs.
those who did not; obese primiparous women who breastfed exclusively ≥12 months vs. those
who did not).185

113
Discussion
Key Findings and Strength of Evidence For this report, we conducted a systematic review to evaluate the evidence for community,
workplace, and healthcare-system based programs and policies aimed at supporting and
promoting breastfeeding. In addition, we also update the evidence on the association between
breastfeeding and maternal health. Below, we summarize the main findings by each Key
Questions (KQ), including giving the strength of evidence (SOE) for the bodies of evidence
pertaining to the effectiveness and harms of programs and policies on initiation, duration and
exclusivity of breastfeeding (KQ 1) and association between breastfeeding and maternal health
(KQ2). Of the 128 included studies, 34 (from 37 publications) were relevant to KQ1, and 85
individual studies (from 87 publications) and 9 systematic reviews were relevant to one or more
maternal health outcomes.
Key Question 1a. What are the effectiveness and harms of programs and policies on initiation, duration, and exclusivity of breastfeeding?
We cast a broad net in terms of our inclusion criteria that relate to interventions. The 34
studies that met our inclusion criteria evaluated a range of strategies to improve rates of
breastfeeding initiation and duration. No included studies assessed potential harms of
interventions. To aid in synthesizing results of similar studies, we categorized interventions
primarily based on intervention type: BFHI, non-BFHI healthcare system-based interventions,
WIC-based interventions, and community-based interventions (not primarily delivered as part of
the healthcare system). In addition to categorizing interventions by intervention type, we also
summarized results for breastfeeding initiation and duration separately when we had similar
studies reporting on multiple breastfeeding outcome types. Below, we provide a summary of our
main conclusions related to the effectiveness of programs and policies for improving rates of
breastfeeding initiation and duration organized by intervention type.
Baby-Friendly Hospital Initiative Interventions Of the 12 studies assessing BFHI interventions, 7 reported on rates of breastfeeding
initiation58, 59, 61, 62, 65-67 and the majority (10 studies) reported on rates of breastfeeding duration;
two studies reported only on breastfeeding initiation.61, 67 A summary of our main findings and
strength of evidence (SOE) grades are shown in Table 29. Overall, the evidence supports the
effectiveness of BFHI for improving rates of breastfeeding initiation and duration.
For breastfeeding initiation, evidence from seven cohort studies (1,156,033 participants)
comparing women giving birth in BFHI certified (or accredited) hospitals with non-certified
hospitals supports the effectiveness of BFHI (low strength of evidence). Although the included
studies consistently found higher rates of initiation at accredited hospitals, results were imprecise
and the magnitude of benefit varied by breastfeeding measure and country setting. For
breastfeeding duration, based on evidence from one large RCT (PROBIT, N=17,046) and five
cohort studies (62,834 women), we concluded that BFHI increases rates of breastfeeding
duration through 12 months postpartum (moderate strength of evidence). In the PROBIT trial,
women in the intervention group had significantly higher rates of exclusive breastfeeding and
lower rates of weaning across various time points (1 to 12 months postpartum). Although the five

114
Table 29. Summary of key findings and strength of evidence: Studies assessing BFHI
Breastfeeding Outcome Intervention vs. Comparator
N Studies; N Subjects Study Limitations
Outcome and Results Strength of Evidence
Initiation BFHI certified/ accredited vs. no BFHI status
7 cohorts; 1,156,033 Medium
Any BF initiation (k=4): higher initiation rates (by 0.5% to 7.4%) among BFHI accredited hospitals than control hospitals, differences were not statistically significant Exclusive BF initiation (k=3): significantly higher rates of initiation among BFHI accredited hospitals than control hospitals (by approximately 7.2% to 56%)
Low for benefit (consistent, imprecise)
Duration BFHI vs. no BFHI intervention (evidence from RCTs) BFHI certified/ accredited vs. no BFHI status (evidence from observational studies)
1 RCT; 17,046 5 cohorts; 62,834 Medium
One RCT found significantly higher rates of exclusive BF among women at BFHI hospitals at 3 mos (43% vs. 6%; p<0.001) and 6 mos postpartum (7.9% vs. 0.6%; p=0.01), and lower odds of weaning (from any BF) at 3, 6, 9, and 12 mo postpartum than women in control hospitals. Any BF duration (k=5 obs studies): higher rates of BF 1 to 12 mos postpartum among women at BFHI hospitals (by 6% to 15% in 4 studies) than women at control hospitals; one study found slightly higher BF rates at 1 mo among women in control hospitals (by 0.4% to 5%) than BFHI hospitals Exclusive BF duration (k=3 obs studies): higher rates of exclusive BF over 1 to 2 mos among infants born in BFHI hospitals than control hospitals (by 4% to 25%)
Moderate for benefit (consistent, imprecise)
Duration Six or more BFHI steps vs. less than six steps
1 cohort; 1,417 Medium
Significantly higher odds of weaning at or before 8 wks postpartum among women giving birth in hospitals practicing ≤ 4 BFHI steps than women giving birth in hospitals practicing six BFHI steps (ORs ranged from 2.08 and 3.13); no difference between women exposed to 5 vs. 6 steps
Low for benefit (consistent,a precise)
Duration BFHI staff training +10 HVs vs. BFHI alone
1 RCT; 350 Low
Significantly higher rates of any BF at 6 mos. among women giving birth in BFHI hospitals combined with planned HVs than women giving birth in control hospitals (78% vs. 62%; p=0.001) and higher rates of exclusive BF at 5 mos. (45% vs. 13%; p<0.001)
Low for benefit (unknown consistency, precise)
a Although only one study compared groups of women based on number of BFHI practiced by hospitals, we considered evidence
on duration from studies comparing BFHI implementation (or accreditation) with non-accredited hospitals. As shown in the table,
we concluded that moderate SOE supports the effectiveness of BFHI for improving breastfeeding duration.
BF = breastfeeding; BFHI = Baby Friendly Hospital Initiative; CI = confidence interval; HV = home visits; k = number of
studies; mo(s) = months; N = number; OR = odds ratio; RCT = randomized controlled trial; SOE = strength of evidence; UK =
United Kingdom; US = United States.
observational studies were mostly consistent in finding benefit for BFHI, results were imprecise
and the magnitude of benefit varied by breastfeeding measure and country setting. This may
reflect differences in population (PROBIT enrolled only mothers who intended to breastfeed),
differences in fidelity to the 10-steps across settings, or other factors (e.g., differences in
community rates of breastfeeding). One cohort study (N=1,417) compared rates of breastfeeding
at 6 months among women discharged from hospitals that differed in the number of BFHI
implemented; low strength of evidence supports the conclusion that implementation of 4 or more
BFHI steps is associated with lower rates of weaning than implementation of less than 4 steps.
In addition to evidence on BFHI hospital status and breastfeeding outcomes, low strength of
evidence supports the effectiveness of BFHI staff training combined with a series of planned
home visits (for breastfeeding support) compared with BFHI staff training alone for increasing
rates of any and exclusive breastfeeding over 6 months postpartum.

115
Other (non-BFHI) Health Care System-Based Interventions Twelve included studies (described in 13 publications) assessed the effectiveness of
healthcare staff education/training alone, healthcare staff education/training with the addition of
expanded breastfeeding support services (e.g., increased access to breastfeeding groups), or
changes in health service delivery aimed at supporting breastfeeding. (Table 30).70, 71, 73-83
Overall, the evidence supports the effectiveness of two intervention types for improving the
duration of exclusive breastfeeding: modified-BFHI policy implementation in outpatient setting
and continuous nursing care during the perinatal period (low SOE for both). In addition, the
evidence suggest that healthcare provider education and training alone are not effective in
improving rates of breastfeeding initiation (low SOE); four included studies consistently found
no significant difference between groups. We rated the strength of evidence as insufficient for
whether healthcare provider education or training improves rates of breastfeeding duration (due
to study limitations, inconsistent and imprecise findings). Methodological limitations, imprecise
and inconsistent findings led us to rate the strength of evidence for the other three interventions
as insufficient. In addition, the evidence suggest that healthcare provider education and training
alone are not effective in improving rates of breastfeeding initiation (low SOE).
Table 30. Summary of key findings and strength of evidence: Non-BFHI health care system-based interventions
Breastfeeding Outcome Intervention vs. Comparator
N Studies; N Subjects Study Limitations
Outcome and Results Strength of Evidence
Initiation Education/ staff training related to BF vs. usual practice
4 (2 RCTS, 2 NRCTS); 1,532a Medium
No significant difference between intervention and control groups in rates of any or exclusive BF initiation (3 studies assessed a maternity staff or nursing education/training intervention, and one assessed a residency BF curriculum)
Low for no benefit (consistent, imprecise)
Initiation Education and staff training plus additional individual services vs. usual care
3 (2 RCTS, 1 NRCT); 20,979 Medium
Inconsistent findings across four studies: two RCTs assessed interventions combining staff training with additional BF support (expanding access to BF groups, and provision of additional HVs) found no benefit. One NRCT assessing staff training combined with access to long-term BF counseling and parent support (via Web pages) found higher rates of exclusive BF initiation among the intervention group than controls (75 vs. 66%; p=0.0099)
Insufficient (inconsistent, imprecise)
Duration Education and staff training related to BF only vs. usual practice
3 (2 RCTS, 1 NRCT); 1,526a Medium
Inconsistent findings across three studies for rates of any and exclusive BF duration; studies found similar durations across groups, or slightly higher BF rates among the intervention group than controls
Insufficient (inconsistent, imprecise)

116
Table 30. Summary of key findings and strength of evidence: Non-BFHI health care system-based interventions (continued)
Breastfeeding Outcome Intervention vs. Comparator
N Studies; N Subjects Study Limitations
Outcome and Results Strength of Evidence
Duration Education and staff training plus additional individual services vs. usual care
3 RCTS, 20, 903 Medium
Inconsistent findings across 3 RCTs: two found no difference between groups in rates of any or exclusive BF over 6 wks to 9 mons, and one found a lower cessation rate of any BF in the intervention group than controls (HR, 0.86; 95% CI, 0.75 to 0.99)
Insufficient (inconsistent, imprecise)
Duration Adaptation of the BFHI for integration into routine primary care (maternal and child health centers) vs. usual care
1 NRCT; 3,948 Medium
Significantly higher rates of exclusive BF in the intervention group than controls at 5 mos (OR, 1.39; 95% CI, 1.09 to 1.77) and at 6 mos (OR, 1.33; 95% CI, 1.03 to 1.72); no difference between groups in rates of any BF at 5 or 12 mos.
Low for benefit (unknown consistency, precise)
Initiation/ Duration Continuous primary nursing care (same nurse through perinatal period for mother/infant) vs. usual care (task oriented nursing)
1 RCT; 470 Medium
Significantly higher rates of exclusive BF during hospitalization (99% vs. 88%; p=0.001) and higher rates of exclusive BF 6 wks (72% vs. 94%; p=0.001) among women in the intervention group than controls
Low for benefit (unknown consistency, precise)
a Number here includes participants enrolled from three studies; one study focused on 13 residency programs did not report the
number of women included in analyses of breastfeeding outcomes.76
BF = breastfeeding; CI = confidence interval; HV = home visits; mo(s) = months; N = number; NRCT = non-randomized
controlled trial; RCT = randomized controlled trial; SOE = strength of evidence; UK = United Kingdom; US = United States.
Women, Infants and Children-Based interventions Six included studies assessed changes in breastfeeding rates associated a Special
Supplemental Nutrition Program for Women, Infants and Children (WIC) program or policy.50-55
Although all studies were set in the United States, they included women from diverse states and
assessed heterogeneous interventions and policies; key findings and SOE assessments are shown
in Table 31.
We found evidence on four types of WIC interventions. Low strength of evidence supports
the effectiveness of WIC-based peer support programs for improving rates of any breastfeeding
initiation and duration from 6 weeks to 6 months postpartum. We found insufficient evidence
(primarily due to unknown consistency and imprecision) to make a conclusion on the benefit of
other WIC programs or policies for improving breastfeeding outcomes, including policy changes
related to WIC food packages, provision of different types of breast pumps (electric versus
manual), and peer support programs targeted at fathers.

117
Table 31. Summary of key findings and strength of evidence: WIC-based interventions
Breastfeeding Outcome Intervention vs. Comparator
N Studies; N Subjects Study Limitations
Outcome and Results Strength of Evidence
Initiation/ Duration Mother peer support vs. control
3 (1 RCT, 1 NRCT, 1 cohort); 2,480 Medium
All three studies found benefit in favor of peer support; two studies of in-person peer support found significantly higher BF initiation rates and BF duration over 3 to 6 mos among the intervention group than controls, and one study of telephone-based peer support found no difference between groups in BF initiation rates but significantly higher rates of any BF at 3 and 6 mos among the intervention group than controls
Low for benefit (consistent, precise)
Initiation/ Duration BF rates post 2007 policy revising the WIC food package vs. pre-policy implementation
1 (3 pop. cohorts); PRAMS (127,477) NIS (73,991) PedNSS (744 infants): 744 High
No association between the policy change and rates of BF;a rates of BF increased overall with no difference between women receiving WIC benefits and similar groups of women not receiving WIC benefits
Insufficient (unknown consistency, imprecise)
Duration Provision of electric breast pump vs. manual pump
1 RCT; 280 Medium
For Hawaiian mothers on WIC who planned to return to work/school, no difference in BF duration among women assigned to an electric vs. manual breast pump: median duration of BF 12 vs. 11 mos, respectively; HR,1.13; 95% CI, 0.79 to 1.50
Insufficient (unknown consistency, imprecise)
Initiation/ Duration Peer support program for fathers (in addition to mother peer support) vs. peer support for mothers alone
1 NRCT; 200 Medium
Mothers in the intervention group had slightly higher rate of any BF at 6 mos than controls (63% vs. 55%) that was not statistically significant (p=0.20)
Insufficient (unknown consistency, imprecise)
a All three databases measured rates of “ever-breastfeeding”; in addition, PRAMS measured rates of breastfeeding for at least 4
weeks, NIS measured rates of breastfeeding for at least 3 months and PedNSS measured rates of breastfeeding for at least 1
month. Conclusions were consistent across the different measures.
BF = breastfeeding; CI = confidence interval; HV = home visits; mo(s) = months; N = number; NRCT = non-randomized
controlled trial; PRAMS = Pregnancy Risk Assessment Monitoring System; SOE = strength of evidence; UK = United Kingdom; US =
United States; WIC = Special Supplemental Nutrition Program for Women, Infants, and Children.
Community-Based Interventions Four included studies (described in five publications) assessed the effectiveness of a
community-based intervention; key findings and SOE assessments are shown in Table 32. No
studies assessed the same intervention type which limited our ability to make conclusions on the
strength of evidence for most intervention types Low strength of evidence supports the benefit of
community-based interventions that provide mothers with peer-support (via home visits). In
addition, access to a community-based breastfeeding drop-in center among women receiving
early home-based breastfeeding support does not increase breastfeeding duration (low strength of
evidence).

118
Table 32. Summary of key findings and strength of evidence: Community-based interventions
Breastfeeding Outcome Intervention vs. Comparator
N Studies; N Subjects Study Limitations
Outcome and Results Strength of Evidence
Initiation/Duration Community-based policy aimed at promoting BF in nonhospital-based health and community centers vs. no intervention
1 NRCT; 5,094 Medium
No significant difference in rates of exclusive BF at discharge, 3 and 6 mos, or rates of any BF at 5 and 12 mos between groups
Insufficient (unknown consistency, imprecise)
Duration Early home-based BF support vs. early home-based BF support plus access to community-based BF drop-in centers vs. usual care
1 RCT; 9,675 Low
No difference between groups in rates of any BF at 3, 4 or 5 mos.
Low for no benefit (unknown consistency, precise)
Duration Community based peer support vs. usual care
1 RCT; 130 Low
Significantly higher rates of exclusive BF at 3 mos. among intervention groups (50% to 67%) than control group (12%), p<0.001; rates of any BF were significantly longer in intervention groups (combined) than in the control group at 3 mos (but not 6 mos)
Low for benefit (unknown consistency, precise)
Duration Peer-led BF support class vs. Nurse-led BF support class
1 cohort; 109 High
No significant difference between groups in rates of any BF at 1 and 6 mos postpartum
Insufficient (unknown consistency, imprecise)
BF = breastfeeding; CI = confidence interval; mo(s) = months; N = number; NRCT = nonrandomized controlled trial; ROB = risk
of bias; RCT = randomized controlled trial; SOE = strength of evidence; SR = systematic review.
Key Question 1b. To what extent do the effectiveness and harms of programs and policies on initiation, duration, and exclusivity of breastfeeding differ for subpopulations of women defined by sociodemographic factors (e.g., age, race, ethnicity, socioeconomic status)?
Few studies reported on subgroups of women; we found no studies reporting on subgroups
defined by age (at breastfeeding exposure), comorbidity and other factors. Of the three included
studies reporting on subgroups of women, two focused on BFHI and reported on differences by
education status, and one focused on a WIC peer support intervention and reported on subgroups
by language spoken (Spanish only versus English). Table 33 below summarizes our conclusions
below by intervention type.
Two U.S. cohort studies found higher rates of breastfeeding initiation among women with
less education (12 years or less) who gave birth in BFHI certified facilities compared with non-
certified facilities; no significant difference was observed for women with more education (13
years or more). These findings suggest that BFHI certification may be an effective strategy to
reduce socioeconomic disparities in breastfeeding. We found insufficient evidence to make a
conclusion on whether benefit of telephone peer support varies by subgroups of women based on
language spoken (Spanish only versus English), primarily due to inconsistency (across outcome
timings and measures) and imprecision. One RCT of telephone peer counseling found increased
rates of breastfeeding at 3 months among both English-speaking and Spanish-only speaking
women in the intervention group than controls; at 6 months, rates of any breastfeeding were

119
significantly higher among Spanish-speaking women only. There was no significant difference in
rates of exclusive breastfeeding in the overall sample or by language at 3 or 6 months
postpartum.
Table 33. Summary of key findings and strength of evidence: KQ1 studies reporting on subgroups
Breastfeeding Outcome Intervention vs. Comparator
N Studies; N Subjects Study Limitations
Outcome and Results Strength of Evidence
Initiation (subgroups: education status) BFHI certified/ accredited vs. no BFHI status
2 cohorts; 27,341 Medium
Both studies found higher rates of BF initiation among women with lower education (≤12 yrs) at BFHI hospitals compared with control hospitals, but no difference in rates among women with higher education (≥13 yrs)
Low (consistent, imprecise)
Duration (subgroups: education status) BFHI certified/ accredited vs. no BFHI status
2 cohort; 27,341 Medium
Two studies found mixed results: one found significantly higher rates of exclusive BF for ≥4 wks among women with lower education (≤12 yrs) at BFHI hospitals than control hospitals (p=0.02), but no difference for women with higher education (no difference was seen for rates of any BF for ≥4 wks by education), and the other study found no difference in rates of exclusive or any BF for ≥4 wks among women who differed by education status
Insufficient (inconsistent, imprecise)
Initiation/ Duration (subgroups: language spoken) Mother peer support vs. control
1 RCT; 1948 Medium
One RCT of telephone peer support found mixed results for subgroups of women defined by language (English-speaking vs. Spanish-speaking only), results for any BF at 3 mos were significant for both groups; at 6 mo, benefit for any BF was significant only for the Spanish-speaking subgroup. There was no significant difference in rates of exclusive BF in either subgroup at 3 or 6 mo.
Insufficient (unknown consistency, imprecise)
BF = breastfeeding; BFHI = Baby Friendly Hospital Initiative; CI = confidence interval; mo(s) = months; N = number; SOE =
strength of evidence; US = United States; yrs = years.
Key Question 1c. To what extent do intervention-related characteristics (e.g., type of breast pump provided—manual or electric; delivery personnel) influence the initiation, duration, and exclusivity of breastfeeding?
We found no evidence to address this KQ.
Key Question 2a. What are the comparative benefits and harms for maternal health outcomes among women who breastfeed for different intensities and durations?
Table 34 below summarizes our key findings related to KQ2 by outcome. Low strength of
evidence supports the conclusion that ever breastfeeding, as well as longer durations of
breastfeeding, may be associated with a reduced risk of developing (any) breast cancer, luminal
breast cancer, or triple-negative breast cancer. Despite a large body of observational evidence
study and participant characteristics and methodological limitations did not explain the
significant heterogeneity of results. We rated the evidence as insufficient (primarily due to
unknown consistency) for the association between breastfeeding and subtypes of breast cancer

120
defined by tumor behavior (i.e., in situ breast cancer) or hormone receptor status, breast cancer
among BRCA1/2 mutation carriers, and mortality due to breast cancer.
Low strength of evidence supports the association between ever breastfeeding, as well as
longer versus shorter durations of breastfeeding and a reduced risk of developing epithelial
ovarian cancer. The body of evidence is relatively large and includes one systematic review of 41
studies and eight additional studies (39,618 women), however, the results included significant
heterogeneity not explained by study and participant characteristics and methodological
limitations.
For both hypertension and type 2 diabetes, studies varied in terms of outcomes and case
definition; however, evidence was consistent in finding an association between longer duration
of breastfeeding and lower rates of hypertension and type 2 diabetes (low SOE for both
outcomes).
Ten studies (6 case-control and 4 cohort studies) on the association between breastfeeding
using different measures (e.g., ever versus never, and duration per child) and hip, vertebral and
forearm fracture risk. Apart from one study of self-reported vertebral fractures (rated high risk of
bias), no study reported statistically significant association between breastfeeding and fracture.
We rated the strength of evidence as low for no association.
Due to significant heterogeneity in study design, breastfeeding exposure definitions,
outcomes, and inconsistency in results, we found insufficient evidence on whether breastfeeding
is associated with postpartum depression or postpartum weight change. For postpartum
depression, current evidence does not establish the direction of relationship between
breastfeeding and higher or lower rates of postpartum depression.
Table 34. Summary of key findings and strength of evidence: Maternal health outcomes
Intervention type N Studies; N Subjects Study Limitations
Outcome and Resultsa Strength of Evidence
Breast cancer 1 SR of 98 studies; NRb 17 individual cohort/case-control studies; 125,363 women Medium
Although studies consistently find a protective association between ever BF or longer duration of BF and breast cancer, magnitude varies across studies by BF definition and outcome measure
Low (inconsistent, precise)
Breast Cancer: BRCA1/2 Carriers
1 case-control; 5,708 women Medium
Unclear association between BF and breast cancer among BRCA carriers; one study found an association between longer BF duration and lower rates of breast cancer among BRCA1 mutation carriers (p for trend<0.0001), but not BRCA2
mutation carriers (p for trend=0.68)
Insufficient (unknown consistency, imprecise)
Breast cancer: In situ
3 (1 cohort, 2 case-control); 67,234 women Medium
Unclear association between BF and breast cancer in situ. Three studies found inconsistent results: one case-control study found no association between BF and DCIS and one found no association between BF duration and composite DCIS or invasive ductal carcinoma diagnosis; one cohort study found no association between BF duration and incident DCIS
Insufficient (inconsistent, imprecise)

121
Table 34. Summary of key findings and strength of evidence maternal health outcomes (continued)
Intervention type N Studies; N Subjects Study Limitations
Outcome and Results Strength of Evidence
Breast cancer: Hormone receptor subtypes
1 SR of 11 studies; 169,879 women for luminal, 14,266 women for HER2, and 176,430 women for triple-negative analyses 4 individual studies; 454,149 women Medium
Consistent association between ever BF or longer duration of BF and lower rates of luminal and triple negative breast cancer (although magnitude of association varies); for HER2, pooled estimates show unclear association between BF and lower rates of breast cancer (results are imprecise and pooled estimate is not statistically significant)
Low (Luminal, triple-negative; inconsistent, precise); Insufficient (HER2, inconsistent, imprecise)
Breast Cancer: Mortality
1 cohort study; 250,470 parous women Medium
One study found no significant association between BF and breast cancer mortality (HR,1.01;95% CI, 0.79 to 1.29)
Insufficient (unknown consistency, imprecise)
Ovarian cancer 1 SR of 41 studies; NRf 8 individual studies; 39,618 women Medium
Consistent association between ever BF and longer durations of BF and lower risk of ovarian cancer; magnitude of association varies across studies by BF exposure definition
Low (inconsistent, precise)
Hypertension 4 cohorts; 437,265 women High to Medium
Longer duration of BF (>6-12 mos) is associated with significantly lower rates HTN; magnitude of association varies by BF exposure and HTN outcome definition
Low (mostly consistent, imprecise)
CVD 3 cohorts; 301,989 women Medium
Although 3 studies conclude an association between longer BF duration and lower CVD risk, magnitude of association varies and each study reports on a different composite CVD outcome
Insufficient (unknown consistency, imprecise)
Death from CVD 1 cohort; 15,000 women Medium
One study found mixed results: parous women ≤65 yrs at enrollment who had never lactated had higher CVD mortality over 14 yrs of followup than women who lactated ≥24 mos (HR 2.77; 95% CI, 1.28 to 5.99). No clear associations were observed among women ≤65 yrs at enrollment
Insufficient (unknown consistency, imprecise)
Type 2 diabetes 1 SR of 8 studies; 273, 961 women 3 individual (cohort) studies; 140, 929 women Medium to high
Consistent association between ever BF and longer durations of BF and lower risk of type 2 diabetes (among women with and without gestational diabetes); magnitude of association varies by BF duration and study design
Low (consistent, imprecise)
Postpartum Depression
1 SR; 48 studies of 71,245 women 12 individual study; 11,056 women Medium
Magnitude of association and direction of effect unclear; studies are heterogeneous in design and results inconsistent
Insufficient (unknown consistency, imprecise)
Postpartum Weight change
17 cohort; 45,563 women Medium
Magnitude of postpartum weight change varies by BF exposure and outcome measure
Insufficient (inconsistent, imprecise)

122
Table 34. Summary of key findings and strength of evidence maternal health outcomes (continued)
Intervention type N Studies; N Subjects Study Limitations
Outcome and Results Strength of Evidence
Fractures 10 (6 case-control and 4 cohorts); 8,746 women Medium to high
Magnitude varies by exposure and outcome measure, but only 1 high risk of bias study reported statistically significant differences
Low for no association (consistent, imprecise)
a We marked outcomes as indirect for long-term maternal health outcomes primarily due to uncertainty of the relative
contribution of breastfeeding to risk (given that many other potential factors also contribute to outcomes such as hypertension,
fracture and breast cancer); for short-term maternal health outcomes (e.g., postpartum depression) there is uncertainty in the
direction of effect between breastfeeding and health outcomes. b Per authors, there were 52 studies with >1,500 women, 31 studies with 500-1,499 women, and 15 studies with <500 women.
Exact number of participants is unclear.
BF = breastfeeding; CI = confidence interval; CVD = cardiovascular disease; mo(s) = months: HR = hazard ratio; OR = odds
ratio; ROB = risk of bias; SOE = strength of evidence; SR = systematic review; yrs = years.
Deficiencies in Methods Many included studies for KQ1 have methodological limitations. Studies often did not
adequately describe the flow of participants or facilities; this was particularly true of those that
randomized or assigned interventions at the hospital or other systems-level. Many studies do not
adequate describe or define breastfeeding outcome measures; for example, studies vary in terms
of definitions used for breastfeeding exclusivity and also measure initiation rates using different
criteria (e.g., self-reported initiation of any breastfeeding, breastfeeding status at hospital
discharge). Selection bias is also a concern for observational studies. Overall attrition was high in
several studies and many did not conduct an intention-to-treat analysis (i.e., they analyzed only
completers). In general, authors did not describe the potential for contamination (from other,
concurrent programs and policies to promote and support breastfeeding). None of the included
studies assessed potential harms of interventions. For KQ 2, the evidence base comprises
observational studies (cohorts and case-controls) only. For outcomes such as depression and
weight gain, the direction of causality is unclear and the evidence does not offer definitive
guidance. For other outcomes (e.g., cardiovascular disease), confounding and selection bias pose
threats to causal inference and existing studies cannot rule out residual confounding. For most
outcomes, the vast majority of studies rely on self-report to categorize breastfeeding exposure. In
studies that enroll women decades after giving birth, differential recall (particularly for outcomes
where women are aware of the purported benefits of breastfeeding) can result in
misclassification of the duration of exposure.
Findings in Relation to What is Already Known For KQ1, we did not find a previous systematic review that was similar in scope or that
assessed the strength of evidence associated with a wide range of health-care system and
community-based interventions for improving breastfeeding initiation and duration. One recent
narrative review202 focused on BFHI came to similar conclusions as ours, despite differences in
scope (i.e., inclusion of a broader range of observational study designs). The authors conclude
that adherence to the BFHI Ten Steps has a positive influence on breastfeeding outcomes;
however, authors do not comment on the magnitude of effect and how many studies found a
significant increase in breastfeeding rates compared with a control. One Cochrane review from
2012 found no RCTs or controlled trials investigating the effect of workplace interventions for
promoting breastfeeding in employed women.202 Our findings related to peer support are

123
consistent with a 2017 Cochrane review (100 trials, approximately 83,246 mother-infant pairs)
that concluded lay support was effective for improving breastfeeding duration and exclusivity.203
For KQ2, the results of our current review are, in general, consistent with those in previous
reviews with respect to conclusions about the limitations of the evidence base. For certain
outcomes (e.g., breast cancer, ovarian cancer and type 2 diabetes), we include published
systematic reviews in our evidence synthesis. This includes the conclusions from the 2007
AHRQ review by Ip and colleagues that breastfeeding is associated with breast cancer, ovarian
cancer, and type 2 diabetes, and that there is no association between breastfeeding and fracture.
As was the case in 2007, we are not able to make a conclusion about the association between
breastfeeding and postpartum weight change or postpartum depression (due to study limitations,
imprecise and inconsistent results). For this review, we added two additional maternal health
outcomes: hypertension and cardiovascular disease. We did not find a recent systematic review
that specifically addressed these outcomes.
Applicability For KQ1, several factors may limit the applicability of findings. Although most studies
enrolled women of a similar age (20s to 30s), many had other specific inclusion criteria related to
parity or health status (of the mother, infant, or both); a few enrolled only women who intended
to breastfeed or were undecided.53, 56 In general, the findings are applicable to healthy women
who have access to routine maternity care and gave birth to healthy infants. Interventions
focused on critically ill infants were beyond the scope of this review. Factors most likely to limit
the applicability of the evidence include country setting, variation in usual maternity care
practices (including other policies and practices to support breastfeeding), and potentially
socioeconomic factors. Limited data from the US suggests that the magnitude of benefit for
BFHI policies may be greater among women with less education than women with more
education.58, 59
For KQ2, similar concerns about applicability apply. However, for KQ2, we did limit to
studies conducted in very high income countries. One limitation of the evidence related to time
frame of enrollment. Many observational studies (including data from WHI participants4)
enrolled women who breastfed decades ago; given a secular trend in breastfeeding rates,
evidence on the association between breastfeeding from cohorts of older women may or may not
reflect the strength of association for women currently breastfeeding. Women who chose to
breastfeed when breastfeeding rates in the United States were lower could be different in ways
that affect risk of adverse maternal health outcome.
Limitations of the Review Process For KQ1, we looked for and included broad net in terms of our inclusion criteria that relate to
interventions to promote and support breastfeeding. At the same time, we specifically excluded
primary-care relevant interventions delivered to individual women (so as not to duplicate a
recent review conducted for the USPSTF).34 The studies that met our inclusion criteria assessed a
variety of different intervention types but did not fully span all interventions potentially relevant
to policy makers. Due to our inclusion criteria, we may have excluded some interventions that
could be considered system-level or community based. The breadth of our eligibility criteria was
also limitation in terms of the evidence synthesis; included studies may have been categorized in
different ways. We chose to focus on intervention type and setting as these may be important
factors for decision-makers who plan to implement breastfeeding programs and policies.

124
Publication bias and selective reporting of outcomes are potential limitations. Although we
searched for unpublished trials and unpublished outcomes, we did not find direct evidence of
either of these biases. However, the majority of included studies are not trials (and were
published before trial registries became available); these factors limit our certainty about the
potential for publication bias. Finally, for this review, we excluded non-English-language studies
based largely on limitations of time and resources.
For KQ2, we chose include recent, relevant, systematic reviews in our evidence synthesis.
Although this may improve efficiency, this approach has limitations. Some included systematic
reviews do not fully report details related to methods (particularly risk of bias assessment). In
addition, reporting of study characteristics was often lacking. Among the included systematic
reviews that conducted meta-analyses, strategies to assess clinical and statistical heterogeneity
were not always clearly described.
The scope of outcomes evaluated for KQ2 was limited to an update of the 2007 review,36, 204
with the addition of hypertension and cardiovascular disease. These outcomes represent common
conditions that contribute significantly to burden of disease in very high income countries.
However, studies have linked lactation with other maternal health outcomes, including reduced
risk of endometrial cancer, multiple sclerosis,205 endometriosis,206 rheumatoid arthritis,207 and
short-interval pregnancy.208, 209 These outcomes, and others, may be of interest for future
systematic reviews.
Limitations of the Evidence Base For KQ1, we found no evidence on certain types of interventions (e.g., workplace and
school-based interventions), limited evidence for subgroups of women, and no included studies
reported on potential harms of interventions. In addition, due to heterogeneity across studies, we
were not able to assess whether certain characteristics of interventions have a greater influence
on breastfeeding initiation, duration, and exclusivity. We were also not able to determine
whether heterogeneity within some categories of interventions such as BFHI is due to study
design, differences in outcome measures, fidelity of implementation, or country setting (since
variation exists across all these factors).
For KQ2, although we found a large volume of evidence supporting the association between
breastfeeding and improved maternal health, methodological limitations specific to observational
study designs limit the ability to determine the magnitude the effect that lactation has on
maternal health. Although a growing literature documents protective associations between
lifetime lactation and improved maternal health, these findings do not establish that
breastfeeding prevents poor maternal health. Several other factors may be at work. First, women
in very high income countries who choose to breastfeed and succeed in doing so are typically
better educated, wealthier, and more likely to engage in other beneficial health behaviors.210, 211
Moreover, it is plausible that, rather than breastfeeding preventing poor maternal health, poor
maternal health may prevent breastfeeding. This is of particular concern for studies of
postpartum depression, in that preexisting depression or anxiety may disrupt breastfeeding,
leading to early weaning;212, 213 moreover, there is evidence that early breastfeeding difficulties
are associated with depressive symptoms.214 Similarly, emerging evidence similarly suggests that
women who are insulin resistant are more likely to experience breastfeeding difficulties,215
potentially leading to shorter breastfeeding durations. In this context, rather than breastfeeding
preventing cardiometabolic disease, early weaning may be a marker for maternal risk.216

125
Future Research Needs For KQ1, future research should assess the benefit of workplace, school-based and other
community-based interventions for improving rates of breastfeeding. Studies are also needed to
inform context-specific types of professional and material support (e.g., double-electric versus
manual breast pumps) that enable women to achieve their infant feeding goals. Authors of future
studies should more clearly describe characteristics of usual care and other breastfeeding support
services are available. For studies conducted in the United States, future research could address
whether certain interventions are more effective for groups of women who differ by
socioeconomic factors in order to assess the consistency of current evidence suggesting a
difference by education status. Methods to address selection bias, confounding and measurement
bias should also be considered in future research related to breastfeeding programs and policies.
In addition, future studies assessing breastfeeding interventions should collect outcomes related
to potential harms of interventions.
For KQ2, observational studies will likely remain the major source of evidence on the
association between breastfeeding and maternal health. Long term follow-up of prospectively
assessed breastfeeding duration may eliminate or significantly reduce potential of recall bias.
Use of standardized breastfeeding definitions and clear reporting of how participants were
selected would help minimize bias. In terms of analyses, authors should adequately address
known confounders and clearly report a rationale for why certain factors were chosen.
Conclusions The body of evidence for breastfeeding programs and policies was diverse in terms of
interventions and settings. Current evidence supports the effectiveness of BFHI for improving
rates of breastfeeding initiation and duration; however, evidence from one large RCT (PROBIT)
has limited applicability, and observational studies do not clearly establish the magnitude of
benefit. For U.S. women enrolled in WIC, low strength of evidence supports peer-support
interventions for improving breastfeeding outcomes. Although low strength of evidence supports
the association between breastfeeding and improved health outcomes (breast cancer, ovarian
cancer, hypertension, and type 2 diabetes), methodological limitations specific to observational
study designs precludes establishment of a causal association between breastfeeding and
improved maternal health.

126
References
1. Chowdhury R; Sinha B; Sankar MJ;
Taneja S; Bhandari N; Rollins N;
Bahl R; Martines J. Breastfeeding
and maternal health outcomes: a
systematic review and meta-analysis.
Acta Paediatr. 2015
Dec;104(467):96-113. doi:
10.1111/apa.13102. PMID:
26172878.
2. Ip S; Chung M; Raman G; Chew P;
Magula N; DeVine D; Trikalinos T;
Lau J. Breastfeeding and maternal
and infant health outcomes in
developed countries. Evid Rep
Technol Assess (Full Rep). 2007
Apr(153):1-186. PMID: 17764214.
3. Victora CG; Bahl R; Barros AJ;
Franca GV; Horton S; Krasevec J;
Murch S; Sankar MJ; Walker N;
Rollins NC. Breastfeeding in the 21st
century: epidemiology, mechanisms,
and lifelong effect. Lancet. 2016 Jan
30;387(10017):475-90. doi:
10.1016/s0140-6736(15)01024-7.
PMID: 26869575.
4. Schwarz EB; Ray RM; Stuebe AM;
Allison MA; Ness RB; Freiberg MS;
Cauley JA. Duration of lactation and
risk factors for maternal
cardiovascular disease. Obstet
Gynecol. 2009 May;113(5):974-82.
doi:
10.1097/01.AOG.0000346884.67796
.ca. PMID: 19384111.
5. Stuebe AM; Schwarz EB; Grewen
K; Rich-Edwards JW; Michels KB;
Foster EM; Curhan G; Forman J.
Duration of lactation and incidence
of maternal hypertension: a
longitudinal cohort study. Am J
Epidemiol. 2011 Nov
15;174(10):1147-58. doi:
10.1093/aje/kwr227. PMID:
21997568.
6. Stuebe AM; Michels KB; Willett
WC; Manson JE; Rexrode K; Rich-
Edwards JW. Duration of lactation
and incidence of myocardial
infarction in middle to late
adulthood. Am J Obstet Gynecol.
2009 Feb;200(2):138.e1-8. doi:
10.1016/j.ajog.2008.10.001. PMID:
19110223.
7. Schwarz EB; McClure CK; Tepper
PG; Thurston R; Janssen I; Matthews
KA; Sutton-Tyrrell K. Lactation and
maternal measures of subclinical
cardiovascular disease. Obstet
Gynecol. 2010 Jan;115(1):41-8. doi:
10.1097/AOG.0b013e3181c5512a.
PMID: 20027032.
8. Centers for Disease Control and
Prevention. Breastfeeding report
cards. Atlanta, GA: Centers for
Disease Control and Prevention;
2017.
http://www.cdc.gov/breastfeeding/da
ta/reportcard.htm. Accessed on
November 28, 2017.
9. Office of Disease Prevention and
Health Promotion. Maternal, Infant,
and Child Health. Washington, DC:
Office of Disease Prevention and
Health Promotion; 2016.
https://www.healthypeople.gov/2020
/topics-objectives/topic/maternal-
infant-and-child-health/objectives.
Accessed on September 8, 2016.
10. Stuebe AM; Horton BJ; Chetwynd
E; Watkins S; Grewen K; Meltzer-
Brody S. Prevalence and risk factors
for early, undesired weaning
attributed to lactation dysfunction. J
Womens Health (Larchmt). 2014
May;23(5):404-12. doi:

127
10.1089/jwh.2013.4506. PMID:
24655291.
11. Centers for Disease Control and
Prevention. Progress in increasing
breastfeeding and reducing
racial/ethnic differences—United
States, 2000-2008 Births. Atlanta,
GA: Centers for Disease Control and
Prevention; 2013.
www.cdc.gov/breastfeeding/resource
s/breastfeeding-trends.htm. Accessed
on January 3, 2017.
12. Centers for Disease Control and
Prevention. Breastfeeding among
U.S. Children Born 2002–2012,
CDC National Immunization
Surveys. Atlanta, GA: Centers for
Disease Control and Prevention;
2016.
www.cdc.gov/breastfeeding/data/nis
_data/index.htm.
13. Ahluwalia IB; Li R; Morrow B.
Breastfeeding practices: does method
of delivery matter? Matern Child
Health J. 2012 Dec;16 Suppl 2:231-
7. doi: 10.1007/s10995-012-1093-9.
PMID: 22926268.
14. Skafida V. The relative importance
of social class and maternal
education for breast-feeding
initiation. Public Health Nutr. 2009
Dec;12(12):2285-92. doi:
10.1017/s1368980009004947.
PMID: 19243673.
15. McKinney CO; Hahn-Holbrook J;
Chase-Lansdale PL; Ramey SL;
Krohn J; Reed-Vance M; Raju TN;
Shalowitz MU. Racial and Ethnic
Differences in Breastfeeding.
Pediatrics. 2016 Aug;138(2). doi:
10.1542/peds.2015-2388. PMID:
27405771.
16. World Health Organization.
International Code of Marketing
Breast-milk Substitutes. Geneva:
World Health Organization; 1981.
17. Baby-Friendly USA. Guidelines and
evaluation criteria for facilities
seeking baby-friendly designation
Baby-Friendly USA. Sandwich,
MA: 2010.
18. Baby-Friendly USA. The Gold
Standard of Care. Albany, NY:
Baby-Friendly USA; 2012. Accessed
on January 3, 2017.
19. Texas Department of State Health
Services. Texas 10 Step Program.
Austin, TX: Texas Department of
State Health Services Texas Ten
Step Program; 1999.
http://texastenstep.org/. Accessed on
January 3, 2017.
20. North Carolina Nutrition Services
Branch. North Carolina Maternity
Center Breastfeeding-Friendly
Designation Program Raleigh, NC:
N.C. Department of Health and
Human Services; 2016.
www.nutritionnc.com/breastfeeding/
breastfeeding-friendly.htm. Accessed
on January 3, 2017.
21. Centers for Disease Control and
Prevention. Maternity Practices in
Infant Nutrition and Care (mPINC)
Survey. Atlanta, GA: Centers for
Disease Control and Prevention;
2016.
www.cdc.gov/breastfeeding/data/mpi
nc/. Accessed on January 3, 2017.
22. Baby-Friendly USA. Baby-Friendly
Hospital Initiative. The Ten Steps to
Successful Breastfeeding. Albany,
NY: Baby-Friendly USA; 2010.
www.babyfriendlyusa.org/about-
us/baby-friendly-hospital-
initiative/the-ten-steps. Accessed on
January 3, 2017.
23. Health Resources and Services
Administration. Women’s Preventive
Services Guidelines. Rockville, MD:
Health Resources and Services
Administration; 2016.

128
www.hrsa.gov/womensguidelines/.
Accessed on January 3, 2017.
24. Abdulwadud OA; Snow ME.
Interventions in the workplace to
support breastfeeding for women in
employment. Cochrane Database
Syst Rev. 2012 Oct
17;10:Cd006177. doi:
10.1002/14651858.CD006177.pub3.
PMID: 23076920.
25. U.S. Department of Labor. Wage and
hour division (WHD): Break time for
nursing mothers. Washington, DC:
U.S. Department of Labor.
www.dol.gov/whd/nursingmothers/.
26. American Academy of Pediatrics.
Breastfeeding and the use of human
milk. Pediatrics. 2012
Mar;129(3):e827-41. doi:
10.1542/peds.2011-3552. PMID:
22371471.
27. American College of Obstetricians
and Gynecologists. Optimizing
support for breastfeeding as part of
obstetric practice. Committee
Opinion No. 658. Obstet Gynecol
Annu. 2016;127:e86-92.
28. World Health Organization. Health
topics. Breastfeeding. Switzerland:
World Health Organization; 2017.
Accessed on January 3, 2017.
29. World Health Organization,
UNICEF. Protecting, promoting and
supporting breast-feeding: the
special role of maternity services.
Geneva: World Health Organization;
1989.
30. American Academy of Family
Physicians. Breastfeeding (policy
statement): American Academy of
Family Physicians [serial on the
Internet]; 2012.
31. Philipp BL; Merewood A; Miller
LW; Chawla N; Murphy-Smith MM;
Gomes JS; Cimo S; Cook JT. Baby-
friendly hospital initiative improves
breastfeeding initiation rates in a US
hospital setting. Pediatrics. 2001
Sep;108(3):677-81. PMID:
11533335.
32. Cohen R; Mrtek MB. The impact of
two corporate lactation programs on
the incidence and duration of breast-
feeding by employed mothers. Am J
Health Promot. 1994 Jul-
Aug;8(6):436-41. PMID: 10147273.
33. Forster D; McLachlan H; Lumley J;
Beanland C; Waldenstrom U; Amir
L. Two mid-pregnancy interventions
to increase the initiation and duration
of breastfeeding: a randomized
controlled trial. Birth. 2004
Sep;31(3):176-82. doi:
10.1111/j.0730-7659.2004.00302.x.
PMID: 15330879.
34. Patnode CD; Henninger ML; Senger
CA; Perdue LA; Whitlock EP.
Primary Care Interventions to
Support Breastfeeding: Updated
Evidence Report and Systematic
Review for the US Preventive
Services Task Force. JAMA. 2016
Oct 25;316(16):1694-705. doi:
10.1001/jama.2016.8882. PMID:
27784101.
35. Bibbins-Domingo K; Grossman DC;
Curry SJ; Davidson KW; Epling JW,
Jr.; Garcia FA; Kemper AR; Krist
AH; Kurth AE; Landefeld CS;
Mangione CM; Phillips WR; Phipps
MG; Pignone MP. Primary Care
Interventions to Support
Breastfeeding: US Preventive
Services Task Force
Recommendation Statement. JAMA.
2016 Oct 25;316(16):1688-93. doi:
10.1001/jama.2016.14697. PMID:
27784102.
36. Wang L; Li J; Shi Z. Association
between Breastfeeding and
Endometrial Cancer Risk: Evidence
from a Systematic Review and Meta-

129
Analysis. Nutrients. 2015 Jul
14;7(7):5697-711. doi:
10.3390/nu7075248. PMID:
26184301.
37. Chen H; Wang J; Zhou W; Yin H;
Wang M. Breastfeeding and Risk of
Rheumatoid Arthritis: A Systematic
Review and Metaanalysis. J
Rheumatol. 2015 Sep;42(9):1563-9.
doi: 10.3899/jrheum.150195. PMID:
26178286.
38. Zhou Y; Chen J; Li Q; Huang W;
Lan H; Jiang H. Association between
breastfeeding and breast cancer risk:
evidence from a meta-analysis.
Breastfeed Med. 2015
Apr;10(3):175-82. doi:
10.1089/bfm.2014.0141. PMID:
25785349.
39. United Nations Development
Programme (UNDP). Human
Development Report 2015: Work for
Human Development. New York,
NY: UNDP; 2015.
www.hdr.undp.org/en/2015-report.
40. National Statistics, Republic of
China (Taiwan). What is the human
development index (HDI)? How is
relevant data queried? Taiwan City,
Taiwan, R. O. C.; n.d.
https://eng.stat.gov.tw/ct.asp?xItem=
31068&ctNode=5710&mp=5.
Accessed on March 6, 2017.
41. Programme UND. Human
Development Report 2015: Work for
Human Development. Table 1:
Human Development Index and its
components. United Nations
Development Programme; n.d. New
York, NY: 2015.
http://hdr.undp.org/en/composite/HD
I.
42. Sterne JA; Hernan MA; Reeves BC;
Savovic J; Berkman ND;
Viswanathan M; Henry D; Altman
DG; Ansari MT; Boutron I;
Carpenter JR; Chan AW; Churchill
R; Deeks JJ; Hrobjartsson A;
Kirkham J; Juni P; Loke YK; Pigott
TD; Ramsay CR; Regidor D;
Rothstein HR; Sandhu L; Santaguida
PL; Schunemann HJ; Shea B; Shrier
I; Tugwell P; Turner L; Valentine
JC; Waddington H; Waters E; Wells
GA; Whiting PF; Higgins JP.
ROBINS-I: a tool for assessing risk
of bias in non-randomised studies of
interventions. BMJ. 2016 Oct
12;355:i4919. doi:
10.1136/bmj.i4919. PMID:
27733354.
43. Higgins JPT; Green S. Cochrane
Handbook for Systematic Reviews of
Interventions. The Cochrane
Collaboration.; 2011.
www.handbook.cochrane.org.
Accessed on January 10, 2017.
44. Agency for Healthcare Research and
Quality. Methods Guide for
Effectiveness and Comparative
Effectiveness Reviews. AHRQ
Publication No. 10(14)-EHC063-EF.
Rockville, MD: Agency for
Healthcare Research and Quality;
January 2014.
www.effectivehealthcare.ahrq.gov/m
ethodsguide.cfm.
45. Whiting P; Savovic J; Higgins JP;
Caldwell DM; Reeves BC; Shea B;
Davies P; Kleijnen J; Churchill R.
ROBIS: A new tool to assess risk of
bias in systematic reviews was
developed. J Clin Epidemiol. 2016
Jan;69:225-34. doi:
10.1016/j.jclinepi.2015.06.005.
PMID: 26092286.
46. Cornell JE; Mulrow CD; Localio R;
Stack CB; Meibohm AR; Guallar E;
Goodman SN. Random-effects meta-
analysis of inconsistent effects: a
time for change. Ann Intern Med.
2014 Feb 18;160(4):267-70. doi:

130
10.7326/m13-2886. PMID:
24727843.
47. Berkman ND; Lohr KN; Ansari MT;
Balk EM; Kane R; McDonagh M;
Morton SC; Viswanathan M; Bass
EB; Butler M; Gartlehner G;
Hartling L; McPheeters M; Morgan
LC; Reston J; Sista P; Whitlock E;
Chang S. Grading the strength of a
body of evidence when assessing
health care interventions: an EPC
update. J Clin Epidemiol. 2015
Nov;68(11):1312-24. doi:
10.1016/j.jclinepi.2014.11.023.
PMID: 25721570.
48. Atkins D; Chang SM; Gartlehner G;
Buckley DI; Whitlock EP; Berliner
E; Matchar D. Assessing
applicability when comparing
medical interventions: AHRQ and
the Effective Health Care Program. J
Clin Epidemiol. 2011
Nov;64(11):1198-207. doi:
10.1016/j.jclinepi.2010.11.021.
PMID: 21463926.
49. Ryan AS; Zhou WJ; Acosta A.
Breastfeeding continues to increase
into the new millennium. Pediatrics.
2002 Dec;110(6):1103-9. doi: DOI
10.1542/peds.110.6.1103. PMID:
WOS:000179549200024.
50. Hayes DK; Prince CB; Espinueva V;
Fuddy LJ; Li R; Grummer-Strawn
LM. Comparison of manual and
electric breast pumps among WIC
women returning to work or school
in Hawaii. Breastfeed Med. 2008
Mar;3(1):3-10. doi:
10.1089/bfm.2007.0022. PMID:
18333763.
51. Joyce T; Reeder J. Changes in
breastfeeding among WIC
participants following
implementation of the new food
package. Matern Child Health J.
2015 Apr;19(4):868-76. doi:
10.1007/s10995-014-1588-7. PMID:
25095768.
52. Lovera D; Sanderson M; Bogle ML;
Vela Acosta MS. Evaluation of a
breastfeeding peer support program
for fathers of Hispanic participants in
a Texas special supplemental
nutrition program for women,
infants, and children. J Am Diet
Assoc. 2010 Nov;110(11):1696-702.
doi: 10.1016/j.jada.2010.08.001.
PMID: 21034883.
53. Reeder JA; Joyce T; Sibley K;
Arnold D; Altindag O. Telephone
peer counseling of breastfeeding
among WIC participants: a
randomized controlled trial.
Pediatrics. 2014 Sep;134(3):e700-9.
doi: 10.1542/peds.2013-4146.
PMID: 25092936.
54. Schafer E; Vogel MK; Viegas S;
Hausafus C. Volunteer peer
counselors increase breastfeeding
duration among rural low-income
women. Birth. 1998 Jun;25(2):101-6.
PMID: 9668744.
55. Shaw E; Kaczorowski J. The effect
of a peer counseling program on
breastfeeding initiation and longevity
in a low-income rural population. J
Hum Lact. 1999 Mar;15(1):19-25.
PMID: 10578771.
56. Kramer MS; Chalmers B; Hodnett
ED; Sevkovskaya Z; Dzikovich I;
Shapiro S; Collet JP; Vanilovich I;
Mezen I; Ducruet T; Shishko G;
Zubovich V; Mknuik D; Gluchanina
E; Dombrovskiy V; Ustinovitch A;
Kot T; Bogdanovich N; Ovchinikova
L; Helsing E. Promotion of
Breastfeeding Intervention Trial
(PROBIT): a randomized trial in the
Republic of Belarus. JAMA. 2001
Jan 24-31;285(4):413-20. PMID:
11242425.

131
57. Yang S; Platt RW; Dahhou M;
Kramer MS. Do population-based
interventions widen or narrow
socioeconomic inequalities? The
case of breastfeeding promotion. Int
J Epidemiol. 2014 Aug;43(4):1284-
92. doi: 10.1093/ije/dyu051. PMID:
24639438.
58. Hawkins SS; Stern AD; Baum CF;
Gillman MW. Evaluating the impact
of the Baby-Friendly Hospital
Initiative on breast-feeding rates: a
multi-state analysis. Public Health
Nutr. 2015 Feb;18(2):189-97. doi:
10.1017/s1368980014000238.
PMID: 24625787.
59. Hawkins SS; Stern AD; Baum CF;
Gillman MW. Compliance with the
Baby-Friendly Hospital Initiative
and impact on breastfeeding rates.
Arch Dis Child Fetal Neonatal Ed.
2014 Mar;99(2):F138-43. doi:
10.1136/archdischild-2013-304842.
PMID: 24277661.
60. Tarrant M; Wu KM; Fong DY; Lee
IL; Wong EM; Sham A; Lam C;
Dodgson JE. Impact of baby-friendly
hospital practices on breastfeeding in
Hong Kong. Birth. 2011
Sep;38(3):238-45. doi:
10.1111/j.1523-536X.2011.00483.x.
PMID: 21884232.
61. Mydlilova A; Sipek A; Vignerova J.
Breastfeeding rates in baby-friendly
and non-baby-friendly hospitals in
the Czech Republic from 2000 to
2006. J Hum Lact. 2009
Feb;25(1):73-8. doi:
10.1177/0890334408325820. PMID:
19020285.
62. Abolyan LV. The breastfeeding
support and promotion in Baby-
Friendly Maternity Hospitals and
Not-as-Yet Baby-Friendly Hospitals
in Russia. Breastfeed Med. 2006
Summer;1(2):71-8. doi:
10.1089/bfm.2006.1.71. PMID:
17661566.
63. Coutinho SB; de Lira PI; de
Carvalho Lima M; Ashworth A.
Comparison of the effect of two
systems for the promotion of
exclusive breastfeeding. Lancet.
2005 Sep 24-30;366(9491):1094-
100. doi: 10.1016/s0140-
6736(05)67421-1. PMID: 16182897.
64. Bosnjak AP; Batinica M; Hegedus-
Jungvirth M; Grguric J; Bozikov J.
The effect of baby friendly hospital
initiative and postnatal support on
breastfeeding rates--Croatian
experience. Coll Antropol. 2004
Jun;28(1):235-43. PMID: 15636080.
65. Gau ML. Evaluation of a lactation
intervention program to encourage
breastfeeding: a longitudinal study.
Int J Nurs Stud. 2004
May;41(4):425-35. doi:
10.1016/j.ijnurstu.2003.11.002.
PMID: 15050853.
66. Bartington S; Griffiths LJ; Tate AR;
Dezateux C. Are breastfeeding rates
higher among mothers delivering in
Baby Friendly accredited maternity
units in the UK? Int J Epidemiol.
2006 Oct;35(5):1178-86. doi:
10.1093/ije/dyl155. PMID:
16926214.
67. Broadfoot M; Britten J; Tappin DM;
MacKenzie JM. The Baby Friendly
Hospital Initiative and breast feeding
rates in Scotland. Arch Dis Child
Fetal Neonatal Ed. 2005
Mar;90(2):F114-6. doi:
10.1136/adc.2003.041558. PMID:
15724033.
68. Yotebieng M; Labbok M; Soeters
HM; Chalachala JL; Lapika B; Vitta
BS; Behets F. Ten Steps to
Successful Breastfeeding programme
to promote early initiation and
exclusive breastfeeding in DR

132
Congo: a cluster-randomised
controlled trial. Lancet Glob Health.
2015 Sep;3(9):e546-55. doi:
10.1016/s2214-109x(15)00012-1.
PMID: 26246225.
69. Osband YB; Altman RL; Patrick PA;
Edwards KS. Breastfeeding
education and support services
offered to pediatric residents in the
US. Acad Pediatr. 2011 Jan-
Feb;11(1):75-9. doi:
10.1016/j.acap.2010.11.002. PMID:
21272827.
70. Bærug A; Langsrud Ø; Løland BF;
Tufte E; Tylleskär T; Fretheim A.
Effectiveness of Baby-friendly
community health services on
exclusive breastfeeding and maternal
satisfaction: a pragmatic trial.
Matern Child Nutr. 2016;12(3):428-
39. doi: 10.1111/mcn.12273. PMID:
116415662. Language: English.
Entry Date: 20160713. Revision
Date: 20160713. Publication Type:
Article. Journal Subset: Allied
Health.
71. Hannula LS; Kaunonen ME; Puukka
PJ. A study to promote breast
feeding in the Helsinki Metropolitan
area in Finland. Midwifery. 2014
Jun;30(6):696-704. doi:
10.1016/j.midw.2013.10.005. PMID:
24210842.
72. Minkovitz C; Strobino D; Hughart
N; Scharfstein D; Guyer B. Early
effects of the healthy steps for young
children program. Arch Pediatr
Adolesc Med. 2001 Apr;155(4):470-
9. PMID: 11296075.
73. Ekstrom A; Abrahamsson H;
Eriksson RM; Martensson BL.
Women's use of nipple shields-their
influence on breastfeeding duration
after a process-oriented education for
health professionals. Breastfeed
Med. 2014 Nov;9(9):458-66. doi:
10.1089/bfm.2014.0026. PMID:
25188544.
74. Ekstrom A; Kylberg E; Nissen E. A
process-oriented breastfeeding
training program for healthcare
professionals to promote
breastfeeding: an intervention study.
Breastfeed Med. 2012 Apr;7(2):85-
92. doi: 10.1089/bfm.2010.0084.
PMID: 22168946.
75. Wan H; Hu S; Thobaben M; Hou Y;
Yin T. Continuous primary nursing
care increases satisfaction with
nursing care and reduces postpartum
problems for hospitalized pregnant
women. Contemp Nurse. 2011
Feb;37(2):149-59. doi:
10.5172/conu.2011.37.2.149. PMID:
21692586.
76. Feldman-Winter L; Barone L;
Milcarek B; Hunter K; Meek J;
Morton J; Williams T; Naylor A;
Lawrence RA. Residency curriculum
improves breastfeeding care.
Pediatrics. 2010 Aug;126(2):289-97.
doi: 10.1542/peds.2009-3250.
PMID: 20603262.
77. Hoddinott P; Britten J; Prescott GJ;
Tappin D; Ludbrook A; Godden DJ.
Effectiveness of policy to provide
breastfeeding groups (BIG) for
pregnant and breastfeeding mothers
in primary care: cluster randomised
controlled trial. BMJ. 2009 Jan
30;338:a3026. doi:
10.1136/bmj.a3026. PMID:
19181729.
78. Senarath U; Fernando DN; Rodrigo
I. Effect of training for care
providers on practice of essential
newborn care in hospitals in Sri
Lanka. J Obstet Gynecol Neonatal
Nurs. 2007 Nov-Dec;36(6):531-41.
doi: 10.1111/j.1552-
6909.2007.00183.x. PMID:
17973696.

133
79. Kronborg H; Vaeth M; Olsen J;
Iversen L; Harder I. Effect of early
postnatal breastfeeding support: a
cluster-randomized community
based trial. Acta Paediatr. 2007
Jul;96(7):1064-70. doi:
10.1111/j.1651-2227.2007.00341.x.
PMID: 17524018.
80. Kools EJ; Thijs C; Kester AD; van
den Brandt PA; de Vries H. A breast-
feeding promotion and support
program a randomized trial in The
Netherlands. Prev Med. 2005
Jan;40(1):60-70. doi:
10.1016/j.ypmed.2004.05.013.
PMID: 15530582.
81. Martens PJ. Does breastfeeding
education affect nursing staff beliefs,
exclusive breastfeeding rates, and
Baby-Friendly Hospital Initiative
compliance? The experience of a
small, rural Canadian hospital. J
Hum Lact. 2000 Nov;16(4):309-18.
PMID: 11155609.
82. Taddei JA; Westphal MF; Venancio
S; Bogus C; Souza S. Breastfeeding
training for health professionals and
resultant changes in breastfeeding
duration. Sao Paulo Med J. 2000
Nov 09;118(6):185-91. PMID:
11120550.
83. Madden JM; Soumerai SB; Lieu TA;
Mandl KD; Zhang F; Ross-Degnan
D. Effects on breastfeeding of
changes in maternity length-of-stay
policy in a large health maintenance
organization. Pediatrics. 2003
Mar;111(3):519-24. PMID:
12612230.
84. Cattaneo A; Bettinelli M; Chapin E;
Macaluso A; Cordova DESL;
Murante A; Montico M.
Effectiveness of the baby friendly
community initiative in Italy: a non-
randomised controlled study. BMJ
Open; 2016.
85. McLachlan HL; Forster DA; Amir
LH; Cullinane M; Shafiei T; Watson
LF; Ridgway L; Cramer RL; Small
R. Supporting breastfeeding In Local
Communities (SILC) in Victoria,
Australia: a cluster randomised
controlled trial. BMJ Open. 2016
Feb 01;6(2):e008292. doi:
10.1136/bmjopen-2015-008292.
PMID: 26832427.
86. Morrow AL; Guerrero ML; Shults J;
Calva JJ; Lutter C; Bravo J; Ruiz-
Palacios G; Morrow RC; Butterfoss
FD. Efficacy of home-based peer
counselling to promote exclusive
breastfeeding: a randomised
controlled trial. Lancet. 1999 Apr
10;353(9160):1226-31. doi:
10.1016/s0140-6736(98)08037-4.
PMID: 10217083.
87. Rempel LA; Moore KC. Peer-led
prenatal breast-feeding education: a
viable alternative to nurse-led
education. Midwifery. 2012
Feb;28(1):73-9. doi:
10.1016/j.midw.2010.11.005. PMID:
21236530.
88. Macaluso A; Bettinelli ME; Chapin
EM; Cordova do Espirito Santo L;
Mascheroni R; Murante AM;
Montico M; Cattaneo A. A
controlled study on baby-friendly
communities in Italy: methods and
baseline data. Breastfeed Med. 2013
Apr;8:198-204. doi:
10.1089/bfm.2012.0130. PMID:
23398142.
89. Siegel RL; Miller KD; Jemal A.
Cancer statistics, 2017. CA Cancer J
Clin. 2017 Jan;67(1):7-30. doi:
10.3322/caac.21387. PMID:
28055103.
90. American Cancer Society. Cancer
Facts & Figures 2017. Atlanta, GA:
American Cancer Society; 2017.

134
91. Bernier MO; Plu-Bureau G; Bossard
N; Ayzac L; Thalabard JC.
Breastfeeding and risk of breast
cancer: a metaanalysis of published
studies. Hum Reprod Update. 2000
Jul-Aug;6(4):374-86. PMID:
10972524.
92. Breast cancer and breastfeeding:
collaborative reanalysis of individual
data from 47 epidemiological studies
in 30 countries, including 50302
women with breast cancer and 96973
women without the disease. Lancet.
2002 Jul 20;360(9328):187-95. doi:
10.1016/s0140-6736(02)09454-0.
PMID: 12133652.
93. Lipworth L; Bailey LR;
Trichopoulos D. History of breast-
feeding in relation to breast cancer
risk: a review of the epidemiologic
literature. J Natl Cancer Inst. 2000
Feb 16;92(4):302-12. PMID:
10675379.
94. Lambertini M; Santoro L; Del
Mastro L; Nguyen B; Livraghi L;
Ugolini D; Peccatori FA; Azim HA,
Jr. Reproductive behaviors and risk
of developing breast cancer
according to tumor subtype: a
systematic review and meta-analysis
of epidemiological studies. Cancer
Treat Rev. 2016 Sep;49:65-76. doi:
10.1016/j.ctrv.2016.07.006. PMID:
27529149.
95. Stendell-Hollis NR; Thompson PA;
Thomson CA; O'Sullivan MJ; Ray
RM; Chlebowski RT. Investigating
the association of lactation history
and postmenopausal breast cancer
risk in the Women's Health
Initiative. Nutr Cancer.
2013;65(7):969-81. doi:
10.1080/01635581.2013.815787.
PMID: 24127779.
96. Sugawara Y; Kakizaki M; Nagai M;
Tomata Y; Hoshi R; Watanabe I;
Nishino Y; Kuriyama S; Tsuji I.
Lactation pattern and the risk for
hormone-related female cancer in
Japan: the Ohsaki Cohort Study. Eur
J Cancer Prev. 2013 Mar;22(2):187-
92. doi:
10.1097/CEJ.0b013e3283564610.
PMID: 23358107.
97. Al-Amri FA; Saeedi MY; Al-Tahan
FM; Ali AM; Alomary SA; Arafa M;
Ibrahim AK; Kassim KA. Breast
cancer correlates in a cohort of breast
screening program participants in
Riyadh, KSA. J Egypt Natl Canc
Inst. 2015 Jun;27(2):77-82. doi:
10.1016/j.jnci.2015.04.002. PMID:
25935858.
98. Al-Qutub ST; Al-Raddadi RM; Bin
Sadiq BM; Sait W; Al-Gahmi A; Al-
Amoudi S. Potential breast cancer
risk factors among Saudi women
aged 19-50 years in Jeddah: a case-
control study. J Egypt Public Health
Assoc. 2013 Dec;88(3):165-70. doi:
10.1097/01.EPX.0000435728.60811.
bd. PMID: 24374950.
99. Beaber EF; Holt VL; Malone KE;
Porter PL; Daling JR; Li CI.
Reproductive factors, age at
maximum height, and risk of three
histologic types of breast cancer.
Cancer Epidemiol Biomarkers Prev.
2008 Dec;17(12):3427-34. doi:
10.1158/1055-9965.epi-08-0641.
PMID: 19064558.
100. Castello A; Martin M; Ruiz A; Casas
AM; Baena-Canada JM; Lope V;
Antolin S; Sanchez P; Ramos M;
Anton A; Munoz M; Bermejo B; De
Juan-Ferre A; Jara C; Chacon JI;
Jimeno MA; Rosado P; Diaz E;
Guillem V; Lluch A; Carrasco E;
Perez-Gomez B; Vioque J; Pollan M.
Lower breast cancer risk among
women following the World Cancer
Research Fund and American

135
Institute for Cancer Research
Lifestyle Recommendations:
EpiGEICAM Case-Control Study.
PLoS One. 2015;10(5):e0126096.
doi: 10.1371/journal.pone.0126096.
PMID: 25978407.
101. Dalamaga M; Karmaniolas K;
Papadavid E; Pelekanos N;
Sotiropoulos G; Lekka A. Elevated
serum visfatin/nicotinamide
phosphoribosyl-transferase levels are
associated with risk of
postmenopausal breast cancer
independently from adiponectin,
leptin, and anthropometric and
metabolic parameters. Menopause.
2011 Nov;18(11):1198-204. doi:
10.1097/gme.0b013e31821e21f5.
PMID: 21712732.
102. Ge I; Rudolph A; Shivappa N;
Flesch-Janys D; Hebert JR; Chang-
Claude J. Dietary inflammation
potential and postmenopausal breast
cancer risk in a German case-control
study. Breast. 2015 Aug;24(4):491-6.
doi: 10.1016/j.breast.2015.04.012.
PMID: 25987487.
103. Hadji P; Gottschalk M; Ziller V;
Kalder M; Jackisch C; Wagner U.
Bone mass and the risk of breast
cancer: the influence of cumulative
exposure to oestrogen and
reproductive correlates. Results of
the Marburg breast cancer and
osteoporosis trial (MABOT).
Maturitas. 2007 Mar 20;56(3):312-
21. doi:
10.1016/j.maturitas.2006.09.005.
PMID: 17049767.
104. Kruk J. Association between
vegetable, fruit and carbohydrate
intake and breast cancer risk in
relation to physical activity. Asian
Pac J Cancer Prev.
2014;15(11):4429-36. PMID:
24969864.
105. Lee E; Ma H; McKean-Cowdin R;
Van Den Berg D; Bernstein L;
Henderson BE; Ursin G. Effect of
reproductive factors and oral
contraceptives on breast cancer risk
in BRCA1/2 mutation carriers and
noncarriers: results from a
population-based study. Cancer
Epidemiol Biomarkers Prev. 2008
Nov;17(11):3170-8. doi:
10.1158/1055-9965.epi-08-0396.
PMID: 18990759.
106. Li DP; Du C; Zhang ZM; Li GX; Yu
ZF; Wang X; Li PF; Cheng C; Liu
YP; Zhao YS. Breastfeeding and
ovarian cancer risk: a systematic
review and meta-analysis of 40
epidemiological studies. Asian Pac J
Cancer Prev. 2014;15(12):4829-37.
PMID: 24998548.
107. Ma H; Bernstein L; Ross RK; Ursin
G. Hormone-related risk factors for
breast cancer in women under age 50
years by estrogen and progesterone
receptor status: results from a case-
control and a case-case comparison.
Breast Cancer Res. 2006;8(4):R39.
doi: 10.1186/bcr1514. PMID:
16846528.
108. Phillips LS; Millikan RC; Schroeder
JC; Barnholtz-Sloan JS; Levine BJ.
Reproductive and hormonal risk
factors for ductal carcinoma in situ
of the breast. Cancer Epidemiol
Biomarkers Prev. 2009
May;18(5):1507-14. doi:
10.1158/1055-9965.epi-08-0967.
PMID: 19423528.
109. Pieta B; Opala T; Wilczak M;
Grodecka-Gazdecka S; Kramer L;
Samulak D; Wieznowska-
Maczynska K. Past obstetric history
and risk of malignant breast
neoplasms. Eur J Gynaecol Oncol.
2008;29(4):374-7. PMID: 18714573.
136
110. Press DJ; Pharoah P. Risk factors for
breast cancer: a reanalysis of two
case-control studies from 1926 and
1931. Epidemiology. 2010
Jul;21(4):566-72. doi:
10.1097/EDE.0b013e3181e08eb3.
PMID: 20498604.
111. Ruszczyk M; Zirpoli G; Kumar S;
Bandera EV; Bovbjerg DH; Jandorf
L; Khoury T; Hwang H; Ciupak G;
Pawlish K; Schedin P; Masso-Welch
P; Ambrosone CB; Hong CC. Breast
cancer risk factor associations differ
for pure versus invasive carcinoma
with an in situ component in case-
control and case-case analyses.
Cancer Causes Control. 2016
Feb;27(2):183-98. doi:
10.1007/s10552-015-0696-z. PMID:
26621543.
112. Guedes KM; Guimaraes AM; Bastos
Ade S; Salviano KG; Sales NJ;
Almeida ML; Gurgel RQ.
Stomatognathic evaluation at five
years of age in children born
premature and at term. BMC Pediatr.
2015 Mar 29;15:27. doi:
10.1186/s12887-015-0343-6. PMID:
25880084.
113. Lumachi F; Frigo AC; Basso U;
Tombolan V; Ermani M. Estrogen
therapy and risk of breast cancer in
postmenopausal women: a case-
control study and results of a
multivariate analysis. Menopause.
2010 May-Jun;17(3):524-8. doi:
10.1097/gme.0b013e3181ca0c74.
PMID: 20130492.
114. Kotsopoulos J; Lubinski J; Lynch
HT; Kim-Sing C; Neuhausen S;
Demsky R; Foulkes WD; Ghadirian
P; Tung N; Ainsworth P; Senter L;
Karlan B; Eisen A; Eng C; Weitzel J;
Gilchrist DM; Blum JL; Zakalik D;
Singer C; Fallen T; Ginsburg O;
Huzarski T; Sun P; Narod SA.
Oophorectomy after menopause and
the risk of breast cancer in BRCA1
and BRCA2 mutation carriers.
Cancer Epidemiol Biomarkers Prev.
2012 Jul;21(7):1089-96. doi:
10.1158/1055-9965.epi-12-0201.
PMID: 22564871.
115. Jernstrom H; Lubinski J; Lynch HT;
Ghadirian P; Neuhausen S; Isaacs C;
Weber BL; Horsman D; Rosen B;
Foulkes WD; Friedman E; Gershoni-
Baruch R; Ainsworth P; Daly M;
Garber J; Olsson H; Sun P; Narod
SA. Breast-feeding and the risk of
breast cancer in BRCA1 and BRCA2
mutation carriers. J Natl Cancer Inst.
2004 Jul 21;96(14):1094-8. doi:
10.1093/jnci/djh211. PMID:
15265971.
116. Kotsopoulos J; Lubinski J; Salmena
L; Lynch HT; Kim-Sing C; Foulkes
WD; Ghadirian P; Neuhausen SL;
Demsky R; Tung N; Ainsworth P;
Senter L; Eisen A; Eng C; Singer C;
Ginsburg O; Blum J; Huzarski T;
Poll A; Sun P; Narod SA.
Breastfeeding and the risk of breast
cancer in BRCA1 and BRCA2
mutation carriers. Breast Cancer Res.
2012 Mar 09;14(2):R42. doi:
10.1186/bcr3138. PMID: 22405187.
117. Kabat GC; Kim MY; Woods NF;
Habel LA; Messina CR; Wactawski-
Wende J; Stefanick ML; Chlebowski
RT; Wassertheil-Smoller S; Rohan
TE. Reproductive and menstrual
factors and risk of ductal carcinoma
in situ of the breast in a cohort of
postmenopausal women. Cancer
Causes Control. 2011
Oct;22(10):1415-24. doi:
10.1007/s10552-011-9814-8. PMID:
21750889.
118. Ritte R; Tikk K; Lukanova A;
Tjonneland A; Olsen A; Overvad K;
Dossus L; Fournier A; Clavel-

137
Chapelon F; Grote V; Boeing H;
Aleksandrova K; Trichopoulou A;
Lagiou P; Trichopoulos D; Palli D;
Berrino F; Mattiello A; Tumino R;
Sacerdote C; Quiros JR; Buckland
G; Molina-Montes E; Chirlaque MD;
Ardanaz E; Amiano P; Bueno-de-
Mesquita HB; van Gils CH; Peeters
PH; Wareham N; Khaw KT; Key TJ;
Travis RC; Weiderpass E; Dumeaux
V; Lund E; Sund M; Andersson A;
Romieu I; Rinaldi S; Vineis P;
Merritt MA; Riboli E; Kaaks R.
Reproductive factors and risk of
hormone receptor positive and
negative breast cancer: a cohort
study. BMC Cancer. 2013 Dec
09;13:584. doi: 10.1186/1471-2407-
13-584. PMID: 24321460.
119. Warner ET; Tamimi RM; Boggs
DA; Rosner B; Rosenberg L; Colditz
GA; Palmer JR. Estrogen receptor
positive tumors: do reproductive
factors explain differences in
incidence between black and white
women? Cancer Causes Control.
2013 Apr;24(4):731-9. doi:
10.1007/s10552-013-0153-9. PMID:
23380944.
120. Atkinson RL; El-Zein R; Valero V;
Lucci A; Bevers TB; Fouad T; Liao
W; Ueno NT; Woodward WA;
Brewster AM. Epidemiological risk
factors associated with inflammatory
breast cancer subtypes. Cancer
Causes Control. 2016
Mar;27(3):359-66. doi:
10.1007/s10552-015-0712-3. PMID:
26797453.
121. Merritt MA; Riboli E; Murphy N;
Kadi M; Tjonneland A; Olsen A;
Overvad K; Dossus L; Dartois L;
Clavel-Chapelon F; Fortner RT;
Katzke VA; Boeing H; Trichopoulou
A; Lagiou P; Trichopoulos D; Palli
D; Sieri S; Tumino R; Sacerdote C;
Panico S; Bueno-de-Mesquita HB;
Peeters PH; Lund E; Nakamura A;
Weiderpass E; Quiros JR; Agudo A;
Molina-Montes E; Larranaga N;
Dorronsoro M; Cirera L; Barricarte
A; Olsson A; Butt S; Idahl A;
Lundin E; Wareham NJ; Key TJ;
Brennan P; Ferrari P; Wark PA;
Norat T; Cross AJ; Gunter MJ.
Reproductive factors and risk of
mortality in the European
Prospective Investigation into
Cancer and Nutrition; a cohort study.
BMC Med. 2015 Oct 30;13:252. doi:
10.1186/s12916-015-0484-3. PMID:
26515238.
122. Luan NN; Wu QJ; Gong TT;
Vogtmann E; Wang YL; Lin B.
Breastfeeding and ovarian cancer
risk: a meta-analysis of
epidemiologic studies. Am J Clin
Nutr. 2013 Oct;98(4):1020-31. doi:
10.3945/ajcn.113.062794. PMID:
23966430.
123. Gammon MD; Neugut AI; Santella
RM; Teitelbaum SL; Britton JA;
Terry MB; Eng SM; Wolff MS;
Stellman SD; Kabat GC; Levin B;
Bradlow HL; Hatch M; Beyea J;
Camann D; Trent M; Senie RT;
Garbowski GC; Maffeo C;
Montalvan P; Berkowitz GS;
Kemeny M; Citron M; Schnabe F;
Schuss A; Hajdu S; Vincguerra V;
Collman GW; Obrams GI. The Long
Island Breast Cancer Study Project:
description of a multi-institutional
collaboration to identify
environmental risk factors for breast
cancer. Breast Cancer Res Treat.
2002 Jun;74(3):235-54. PMID:
12206514.
124. Risch HA; Marrett LD; Howe GR.
Parity, contraception, infertility, and
the risk of epithelial ovarian cancer.

138
Am J Epidemiol. 1994 Oct
01;140(7):585-97. PMID: 7942759.
125. West RO. Epidemiologic study of
malignancies of the ovaries. Cancer.
1966 Jul;19(7):1001-7. PMID:
5939299.
126. Wynder EL; Dodo H; Barber HR.
Epidemiology of cancer of the ovary.
Cancer. 1969 Feb;23(2):352-70.
PMID: 5764976.
127. Gay GM; Lim JS; Chay WY; Chow
KY; Tan MH; Lim WY.
Reproductive factors, adiposity,
breastfeeding and their associations
with ovarian cancer in an Asian
cohort. Cancer Causes Control. 2015
Nov;26(11):1561-73. doi:
10.1007/s10552-015-0649-6. PMID:
26342607.
128. Gierach GL; Modugno F; Ness RB.
Gender of offspring and maternal
ovarian cancer risk. Gynecol Oncol.
2006 Jun;101(3):476-80. doi:
10.1016/j.ygyno.2005.11.008.
PMID: 16364411.
129. Jordan SJ; Green AC; Whiteman
DC; Moore SP; Bain CJ; Gertig DM;
Webb PM. Serous ovarian, fallopian
tube and primary peritoneal cancers:
a comparative epidemiological
analysis. Int J Cancer. 2008 Apr
01;122(7):1598-603. doi:
10.1002/ijc.23287. PMID:
18058817.
130. Nagle CM; Olsen CM; Webb PM;
Jordan SJ; Whiteman DC; Green
AC. Endometrioid and clear cell
ovarian cancers: a comparative
analysis of risk factors. Eur J Cancer.
2008 Nov;44(16):2477-84. doi:
10.1016/j.ejca.2008.07.009. PMID:
18707869.
131. Kotsopoulos J; Lubinski J; Gronwald
J; Cybulski C; Demsky R;
Neuhausen SL; Kim-Sing C; Tung
N; Friedman S; Senter L; Weitzel J;
Karlan B; Moller P; Sun P; Narod
SA. Factors influencing ovulation
and the risk of ovarian cancer in
BRCA1 and BRCA2 mutation
carriers. Int J Cancer. 2015 Sep
01;137(5):1136-46. doi:
10.1002/ijc.29386. PMID:
25482078.
132. Jonas W; Nissen E; Ransjo-Arvidson
AB; Wiklund I; Henriksson P;
Uvnas-Moberg K. Short- and long-
term decrease of blood pressure in
women during breastfeeding.
Breastfeed Med. 2008 Jun;3(2):103-
9. doi: 10.1089/bfm.2007.0031.
PMID: 18563998.
133. Stuebe AM; Rich-Edwards JW. The
reset hypothesis: lactation and
maternal metabolism. Am J
Perinatol. 2009 Jan;26(1):81-8. doi:
10.1055/s-0028-1103034. PMID:
19031350.
134. Lee SY; Kim MT; Jee SH; Yang HP.
Does long-term lactation protect
premenopausal women against
hypertension risk? A Korean
women's cohort study. Prev Med.
2005 Aug;41(2):433-8. doi:
10.1016/j.ypmed.2004.11.025.
PMID: 15917038.
135. Lupton SJ; Chiu CL; Lujic S;
Hennessy A; Lind JM. Association
between parity and breastfeeding
with maternal high blood pressure.
Am J Obstet Gynecol. 2013
Jun;208(6):454.e1-7. doi:
10.1016/j.ajog.2013.02.014. PMID:
23395924.
136. Parikh NI; Jeppson RP; Berger JS;
Eaton CB; Kroenke CH; LeBlanc
ES; Lewis CE; Loucks EB; Parker
DR; Rillamas-Sun E; Ryckman KK;
Waring ME; Schenken RS; Johnson
KC; Edstedt-Bonamy AK; Allison
MA; Howard BV. Reproductive risk
factors and coronary heart disease in

139
the Women's Health Initiative
Observational Study. Circulation.
2016 May 31;133(22):2149-58. doi:
10.1161/circulationaha.115.017854.
PMID: 27143682.
137. Natland Fagerhaug T; Forsmo S;
Jacobsen GW; Midthjell K;
Andersen LF; Ivar Lund Nilsen T. A
prospective population-based cohort
study of lactation and cardiovascular
disease mortality: the HUNT study.
BMC Public Health. 2013 Nov
13;13:1070. doi: 10.1186/1471-
2458-13-1070. PMID: 24219620.
138. Much D; Beyerlein A; Rossbauer M;
Hummel S; Ziegler AG. Beneficial
effects of breastfeeding in women
with gestational diabetes mellitus.
Mol Metab. 2014 Jun;3(3):284-92.
doi: 10.1016/j.molmet.2014.01.002.
PMID: 24749058.
139. Aune D; Norat T; Romundstad P;
Vatten LJ. Breastfeeding and the
maternal risk of type 2 diabetes: a
systematic review and dose-response
meta-analysis of cohort studies. Nutr
Metab Cardiovasc Dis. 2014
Feb;24(2):107-15. doi:
10.1016/j.numecd.2013.10.028.
PMID: 24439841.
140. Chamberlain CR; Oldenburg B;
Wilson AN; Eades SJ; O'Dea K;
Oats JJ; Wolfe R. Type 2 diabetes
after gestational diabetes: greater
than fourfold risk among Indigenous
compared with non-Indigenous
Australian women. Diabetes Metab
Res Rev. 2016 Feb;32(2):217-27.
doi: 10.1002/dmrr.2715. PMID:
26385131.
141. Gunderson EP; Hurston SR; Ning X;
Lo JC; Crites Y; Walton D; Dewey
KG; Azevedo RA; Young S; Fox G;
Elmasian CC; Salvador N; Lum M;
Sternfeld B; Quesenberry CP, Jr.
Lactation and progression to Type 2
Diabetes Mellitus after Gestational
Diabetes Mellitus: a prospective
cohort study. Ann Intern Med. 2015
Dec 15;163(12):889-98. doi:
10.7326/m15-0807. PMID:
26595611.
142. Gunderson EP; Lewis CE; Wei GS;
Whitmer RA; Quesenberry CP;
Sidney S. Lactation and changes in
maternal metabolic risk factors.
Obstet Gynecol. 2007
Mar;109(3):729-38. doi:
10.1097/01.aog.0000252831.06695.0
3. PMID: 17329527.
143. The Women’s Health Initiative
Study. Design of the women’s health
initiative clinical trial and
observational study. Control Clin
Trials. 1998;19(1):61-109.
144. Gunderson EP; Hedderson MM;
Chiang V; Crites Y; Walton D;
Azevedo RA; Fox G; Elmasian C;
Young S; Salvador N; Lum M;
Quesenberry CP; Lo JC; Sternfeld B;
Ferrara A; Selby JV. Lactation
intensity and postpartum maternal
glucose tolerance and insulin
resistance in women with recent
GDM: the SWIFT cohort. Diabetes
Care. 2012 Jan;35(1):50-6. doi:
10.2337/dc11-1409. PMID:
22011407.
145. Al-Akour NA; Gharaibeh M; Al-
Sallal RA. Perception of Jordanian
mothers to nursing support during
their children hospitalisation. J Clin
Nurs. 2013 Jan;22(1-2):233-9. doi:
10.1111/j.1365-2702.2012.04278.x.
PMID: 23039220.
146. Mori T; Ishii S; Greendale GA;
Cauley JA; Ruppert K; Crandall CJ;
Karlamangla AS. Parity, lactation,
bone strength, and 16-year fracture
risk in adult women: findings from
the Study of Women's Health Across
the Nation (SWAN). Bone. 2015

140
Apr;73:160-6. doi:
10.1016/j.bone.2014.12.013. PMID:
25528102.
147. Wiklund PK; Xu L; Wang Q;
Mikkola T; Lyytikainen A; Volgyi
E; Munukka E; Cheng SM; Alen M;
Keinanen-Kiukaanniemi S; Cheng S.
Lactation is associated with greater
maternal bone size and bone strength
later in life. Osteoporos Int. 2012
Jul;23(7):1939-45. doi:
10.1007/s00198-011-1790-z. PMID:
21927916.
148. Alderman BW; Weiss NS; Daling
JR; Ure CL; Ballard JH.
Reproductive history and
postmenopausal risk of hip and
forearm fracture. Am J Epidemiol.
1986 Aug;124(2):262-7. PMID:
3728442.
149. Chan HH; Lau EM; Woo J; Lin F;
Sham A; Leung PC. Dietary calcium
intake, physical activity and the risk
of vertebral fracture in Chinese.
Osteoporos Int. 1996;6(3):228-32.
PMID: 8783297.
150. Hoffman S; Grisso JA; Kelsey JL;
Gammon MD; O'Brien LA. Parity,
lactation and hip fracture.
Osteoporos Int. 1993 Jul;3(4):171-6.
PMID: 8338971.
151. Cumming RG; Klineberg RJ.
Breastfeeding and other reproductive
factors and the risk of hip fractures
in elderly women. Int J Epidemiol.
1993 Aug;22(4):684-91. PMID:
8225744.
152. Kreiger N; Kelsey JL; Holford TR;
O'Connor T. An epidemiologic study
of hip fracture in postmenopausal
women. Am J Epidemiol. 1982
Jul;116(1):141-8. PMID: 7102649.
153. Michaelsson K; Baron JA;
Farahmand BY; Ljunghall S.
Influence of parity and lactation on
hip fracture risk. Am J Epidemiol.
2001 Jun 15;153(12):1166-72.
PMID: 11415951.
154. Hwang IR; Choi YK; Lee WK; Kim
JG; Lee IK; Kim SW; Park KG.
Association between prolonged
breastfeeding and bone mineral
density and osteoporosis in
postmenopausal women: KNHANES
2010-2011. Osteoporos Int. 2016
Jan;27(1):257-65. doi:
10.1007/s00198-015-3292-x. PMID:
26373982.
155. Lambrinoudaki I; Flokatoula M;
Armeni E; Pliatsika P; Augoulea A;
Antoniou A; Alexandrou A; Creatsa
M; Panoulis C; Dendrinos S;
Papacharalambous X. Vertebral
fracture prevalence among Greek
healthy middle-aged postmenopausal
women: association with
demographics, anthropometric
parameters, and bone mineral
density. Spine J. 2015 Jan
01;15(1):86-94. doi:
10.1016/j.spinee.2014.07.021.
PMID: 25106754.
156. Naves M; Diaz-Lopez JB; Gomez C;
Rodriguez-Rebollar A; Cannata-
Andia JB. Determinants of incidence
of osteoporotic fractures in the
female Spanish population older than
50. Osteoporos Int. 2005
Dec;16(12):2013-7. doi:
10.1007/s00198-005-1983-4. PMID:
16091836.
157. Ko JY; Rockhill KM; Tong VT;
Morrow B; Farr SL. Trends in
postpartum depressive symptoms -
27 States, 2004, 2008, and 2012.
MMWR Morb Mortal Wkly Rep.
2017 Feb 17;66(6):153-8. doi:
10.15585/mmwr.mm6606a1. PMID:
28207685.
158. Lindahl V; Pearson JL; Colpe L.
Prevalence of suicidality during
pregnancy and the postpartum. Arch

141
Womens Ment Health. 2005
Jun;8(2):77-87. doi: 10.1007/s00737-
005-0080-1. PMID: 15883651.
159. Campbell SB; Brownell CA;
Hungerford A; Spieker SI; Mohan R;
Blessing JS. The course of maternal
depressive symptoms and maternal
sensitivity as predictors of
attachment security at 36 months.
Dev Psychopathol. 2004
Spring;16(2):231-52. PMID:
15487594.
160. McLearn KT; Minkovitz CS;
Strobino DM; Marks E; Hou W. The
timing of maternal depressive
symptoms and mothers' parenting
practices with young children:
implications for pediatric practice.
Pediatrics. 2006 Jul;118(1):e174-82.
doi: 10.1542/peds.2005-1551.
PMID: 16818531.
161. Paulson JF; Dauber S; Leiferman JA.
Individual and combined effects of
postpartum depression in mothers
and fathers on parenting behavior.
Pediatrics. 2006 Aug;118(2):659-68.
doi: 10.1542/peds.2005-2948.
PMID: 16882821.
162. Pries AM; Huffman SL; Adhikary I;
Upreti SR; Dhungel S; Champeny
M; Zehner E. Promotion and
prelacteal feeding of breastmilk
substitutes among mothers in
Kathmandu Valley, Nepal. Matern
Child Nutr. 2016 Apr;12 Suppl 2:8-
21. doi: 10.1111/mcn.12205. PMID:
27061953.
163. Dias CC; Figueiredo B.
Breastfeeding and depression: a
systematic review of the literature. J
Affect Disord. 2015 Jan 15;171:142-
54. doi: 10.1016/j.jad.2014.09.022.
PMID: 25305429.
164. Warner R; Appleby L; Whitton A;
Faragher B. Demographic and
obstetric risk factors for postnatal
psychiatric morbidity. Br J
Psychiatry. 1996 May;168(5):607-
11. PMID: 8733800.
165. Reifsnider E; Flowers J; Todd M;
Bever Babendure J; Moramarco M.
The relationship among
breastfeeding, postpartum
depression, and postpartum weight in
Mexican American Women. J Obstet
Gynecol Neonatal Nurs.
2016;45(6):760-71. doi:
10.1016/j.jogn.2016.05.009. PMID:
119339849.
166. McCoy SJ; Beal JM; Saunders B;
Hill EN; Payton ME; Watson GH.
Risk factors for postpartum
depression: a retrospective
investigation. J Reprod Med. 2008
Mar;53(3):166-70. PMID: 18441719.
167. Trivino-Juarez JM; Nieto-Pereda B;
Romero-Ayuso D; Arruti-Sevilla B;
Aviles-Gamez B; Forjaz MJ; Oliver-
Barrecheguren C; Mellizo-Diaz S;
Soto-Lucia C; Pla-Mestre R. Quality
of life of mothers at the sixth week
and sixth month post partum and
type of infant feeding. Midwifery.
2016 Mar;34:230-8. doi:
10.1016/j.midw.2015.11.003. PMID:
26621376.
168. Sword W; Landy CK; Thabane L;
Watt S; Krueger P; Farine D; Foster
G. Is mode of delivery associated
with postpartum depression at 6
weeks: a prospective cohort study.
BJOG. 2011 Jul;118(8):966-77. doi:
10.1111/j.1471-0528.2011.02950.x.
PMID: 21489126.
169. Ahn S; Corwin EJ. The association
between breastfeeding, the stress
response, inflammation, and
postpartum depression during the
postpartum period: prospective
cohort study. Int J Nurs Stud. 2015
Oct;52(10):1582-90. doi:

142
10.1016/j.ijnurstu.2015.05.017.
PMID: 26143358.
170. Otokpa AO; Lawoyin TO; Asuzu
MC. HIV/AIDS-related knowledge
and misconceptions among women
attending government-owned
antenatal clinics in Gwagwalada
Area Council of Abuja, Nigeria. Afr
J Reprod Health. 2013
Mar;17(1):114-21. PMID: 24069740.
171. Grover S; Gupta S; Mehra A;
Avasthi A. Comorbidity, knowledge
and attitude towards sex among
patients with Dhat syndrome: a
retrospective study. Asian J
Psychiatr. 2015 Oct;17:50-5. doi:
10.1016/j.ajp.2015.07.002. PMID:
26259894.
172. Davey HL; Tough SC; Adair CE;
Benzies KM. Risk factors for sub-
clinical and major postpartum
depression among a community
cohort of Canadian women. Matern
Child Health J. 2011 Oct;15(7):866-
75. doi: 10.1007/s10995-008-0314-8.
PMID: 18256913.
173. Guilkey DK; Popkin BM; Flieger W;
Akin JS. Changes in breast-feeding
in the Philippines 1973-1983. Soc
Sci Med. 1990;31(12):1365-75.
PMID: 2287963.
174. Chojenta CL; Lucke JC; Forder PM;
Loxton DJ. Maternal health factors
as risks for postnatal depression: a
prospective longitudinal study. PLoS
One. 2016;11(1):e0147246. doi:
10.1371/journal.pone.0147246.
PMID: 26785131.
175. Maimburg RD; Vaeth M. Postpartum
depression among first-time mothers
- results from a parallel randomised
trial. Sex Reprod Healthc. 2015
Jun;6(2):95-100. doi:
10.1016/j.srhc.2015.01.003. PMID:
25998877.
176. Lau Y; Chan KS. Perinatal
depressive symptoms,
sociodemographic correlates, and
breast-feeding among Chinese
women. J Perinat Neonatal Nurs.
2009 Oct-Dec;23(4):335-45. doi:
10.1097/JPN.0b013e3181bbbea9.
PMID: 19915417.
177. Holmberg KS; Peterson UM;
Oscarsson MG. A two-decade
perspective on mothers' experiences
and feelings related to breastfeeding
initiation in Sweden. Sex Reprod
Healthc. 2014 Oct;5(3):125-30. doi:
10.1016/j.srhc.2014.04.001. PMID:
25200973.
178. Iliadis SI; Comasco E; Sylven S;
Hellgren C; Sundstrom Poromaa I;
Skalkidou A. Prenatal and
postpartum evening salivary cortisol
levels in association with peripartum
depressive symptoms. PLoS One.
2015;10(8):e0135471. doi:
10.1371/journal.pone.0135471.
PMID: 26322643.
179. Hamdan A; Tamim H. The
relationship between postpartum
depression and breastfeeding. Int J
Psychiatry Med. 2012;43(3):243-59.
PMID: 22978082.
180. De Palma G; Capilla A; Nadal I;
Nova E; Pozo T; Varea V; Polanco I;
Castillejo G; Lopez A; Garrote JA;
Calvo C; Garcia-Novo MD;
Cilleruelo ML; Ribes-Koninckx C;
Palau F; Sanz Y. Interplay between
human leukocyte antigen genes and
the microbial colonization process of
the newborn intestine. Curr Issues
Mol Biol. 2010;12(1):1-10. PMID:
19478349.
181. Onyango AW; Nommsen-Rivers L;
Siyam A; Borghi E; de Onis M;
Garza C; Lartey A; Baerug A;
Bhandari N; Dewey KG; Araujo CL;
Mohamed AJ; Van den Broeck J.

143
Post-partum weight change patterns
in the WHO Multicentre Growth
Reference Study. Matern Child Nutr.
2011 Jul;7(3):228-40. doi:
10.1111/j.1740-8709.2010.00295.x.
PMID: 21338469.
182. Stuebe AM; Kleinman K; Gillman
MW; Rifas-Shiman SL; Gunderson
EP; Rich-Edwards J. Duration of
lactation and maternal metabolism at
3 years postpartum. J Womens
Health (Larchmt). 2010
May;19(5):941-50. doi:
10.1089/jwh.2009.1660. PMID:
20459331.
183. He X; Zhu M; Hu C; Tao X; Li Y;
Wang Q; Liu Y. Breast-feeding and
postpartum weight retention: a
systematic review and meta-analysis.
Public Health Nutr. 2015
Dec;18(18):3308-16. doi:
10.1017/s1368980015000828.
PMID: 25895506.
184. Olson CM; Strawderman MS;
Hinton PS; Pearson TA. Gestational
weight gain and postpartum
behaviors associated with weight
change from early pregnancy to 1 y
postpartum. Int J Obes Relat Metab
Disord. 2003 Jan;27(1):117-27. doi:
10.1038/sj.ijo.0802156. PMID:
12532163.
185. Sichieri R; Field AE; Rich-Edwards
J; Willett WC. Prospective
assessment of exclusive
breastfeeding in relation to weight
change in women. Int J Obes Relat
Metab Disord. 2003 Jul;27(7):815-
20. doi: 10.1038/sj.ijo.0802285.
PMID: 12821967.
186. Janney CA; Zhang D; Sowers M.
Lactation and weight retention. Am J
Clin Nutr. 1997 Nov;66(5):1116-24.
PMID: 9356528.
187. Ohlin A; Rossner S. Maternal body
weight development after pregnancy.
Int J Obes. 1990 Feb;14(2):159-73.
PMID: 2341224.
188. Linne Y; Dye L; Barkeling B;
Rossner S. Weight development over
time in parous women--the SPAWN
study--15 years follow-up. Int J Obes
Relat Metab Disord. 2003
Dec;27(12):1516-22. doi:
10.1038/sj.ijo.0802441. PMID:
14634683.
189. Walker L; Freeland-Graves JH;
Milani T; George G; Hanss-Nuss H;
Kim M; Sterling BS; Timmerman
GM; Wilkinson S; Arheart KL;
Stuifbergen A. Weight and
behavioral and psychosocial factors
among ethnically diverse, low-
income women after childbirth: II.
Trends and correlates. Women
Health. 2004;40(2):19-34. doi:
10.1300/J013v40n02_02. PMID:
15778136.
190. Brewer MM; Bates MR; Vannoy LP.
Postpartum changes in maternal
weight and body fat depots in
lactating vs nonlactating women. Am
J Clin Nutr. 1989 Feb;49(2):259-65.
PMID: 2916446.
191. Ohlin A; Rossner S. Factors related
to body weight changes during and
after pregnancy: the Stockholm
Pregnancy and Weight Development
Study. Obes Res. 1996
May;4(3):271-6. PMID: 8732961.
192. Haiek LN; Kramer MS; Ciampi A;
Tirado R. Postpartum weight loss
and infant feeding. J Am Board Fam
Pract. 2001 Mar-Apr;14(2):85-94.
PMID: 11314929.
193. Jarlenski MP; Bennett WL; Bleich
SN; Barry CL; Stuart EA. Effects of
breastfeeding on postpartum weight
loss among U.S. women. Prev Med.
2014 Dec;69:146-50. doi:
10.1016/j.ypmed.2014.09.018.
PMID: 25284261.

144
194. Palmer JR; Kipping-Ruane K; Wise
LA; Yu J; Rosenberg L. Lactation in
relation to long-term maternal weight
gain in African-American Women.
Am J Epidemiol. 2015 Jun
15;181(12):932-9. doi:
10.1093/aje/kwv027. PMID:
25944887.
195. Ng SK; Cameron CM; Hills AP;
McClure RJ; Scuffham PA.
Socioeconomic disparities in
prepregnancy BMI and impact on
maternal and neonatal outcomes and
postpartum weight retention: the
EFHL longitudinal birth cohort
study. BMC Pregnancy Childbirth.
2014 Sep 08;14:314. doi:
10.1186/1471-2393-14-314. PMID:
25201481.
196. Straub H; Simon C; Plunkett B;
Endres L; Adam E; McKinney C;
Hobel C; Thorp J; Raju T; Shalowitz
M. Evidence for a complex
relationship among weight retention,
cortisol and breastfeeding in
postpartum women. Matern Child
Health J. 2016;20(7):1375-83. doi:
10.1007/s10995-016-1934-z. PMID:
116170909.
197. Endres LK; Straub H; McKinney C;
Plunkett B; Minkovitz CS; Schetter
CD; Ramey S; Wang C; Hobel C;
Raju T; Shalowitz MU. Postpartum
weight retention risk factors and
relationship to obesity at 1 year.
Obstet Gynecol. 2015
Jan;125(1):144-52. doi:
10.1097/aog.0000000000000565.
PMID: 25560116.
198. Lyu LC; Lo CC; Chen HF; Wang
CY; Liu DM. A prospective study of
dietary intakes and influential factors
from pregnancy to postpartum on
maternal weight retention in Taipei,
Taiwan. Br J Nutr. 2009
Dec;102(12):1828-37. doi:
10.1017/s0007114509991243.
PMID: 19678967.
199. Sharma AJ; Dee DL; Harden SM.
Adherence to breastfeeding
guidelines and maternal weight 6
years after delivery. Pediatrics. 2014
Sep;134 Suppl 1:S42-9. doi:
10.1542/peds.2014-0646H. PMID:
25183755.
200. Ostbye T; Krause KM; Swamy GK;
Lovelady CA. Effect of
breastfeeding on weight retention
from one pregnancy to the next:
results from the North Carolina WIC
program. Prev Med. 2010
Nov;51(5):368-72. doi:
10.1016/j.ypmed.2010.07.017.
PMID: 20655944.
201. Walker LO; Freeland-Graves JH;
Milani T; Hanss-Nuss H; George G;
Sterling BS; Kim M; Timmerman
GM; Wilkinson S; Arheart KL;
Stuifbergen A. Weight and
behavioral and psychosocial factors
among ethnically diverse, low-
income women after childbirth: I.
Methods and context. Women
Health. 2004;40(2):1-17. doi:
10.1300/J013v40n02_01. PMID:
15778135.
202. Perez-Escamilla R; Martinez JL;
Segura-Perez S. Impact of the Baby-
friendly Hospital Initiative on
breastfeeding and child health
outcomes: a systematic review.
Matern Child Nutr. 2016
Jul;12(3):402-17. doi:
10.1111/mcn.12294. PMID:
26924775.
203. McFadden A; Gavine A; Renfrew
MJ; Wade A; Buchanan P; Taylor
JL; Veitch E; Rennie AM; Crowther
SA; Neiman S; MacGillivray S.
Support for healthy breastfeeding
mothers with healthy term babies.
Cochrane Database Syst Rev. 2017

145
Feb 28;2:Cd001141. doi:
10.1002/14651858.CD001141.pub5.
PMID: 28244064.
204. Zhan B; Liu X; Li F; Zhang D.
Breastfeeding and the incidence of
endometrial cancer: A meta-analysis.
Oncotarget. 2015 Nov
10;6(35):38398-409. doi:
10.18632/oncotarget.5049. PMID:
26384296.
205. Langer-Gould A; Smith JB; Hellwig
K; Gonzales E; Haraszti S; Koebnick
C; Xiang A. Breastfeeding, ovulatory
years, and risk of multiple sclerosis.
Neurology. 2017 Aug 08;89(6):563-
9. doi:
10.1212/wnl.0000000000004207.
PMID: 28701499.
206. Farland LV; Eliassen AH; Tamimi
RM; Spiegelman D; Michels KB;
Missmer SA. History of breast
feeding and risk of incident
endometriosis: prospective cohort
study. BMJ. 2017 Aug 29;358:j3778.
doi: 10.1136/bmj.j3778. PMID:
28851765.
207. Karlson EW; Mandl LA; Hankinson
SE; Grodstein F. Do breast-feeding
and other reproductive factors
influence future risk of rheumatoid
arthritis? Results from the Nurses'
Health Study. Arthritis Rheum. 2004
Nov;50(11):3458-67. doi:
10.1002/art.20621. PMID:
15529351.
208. Kennedy KI; Visness CM.
Contraceptive efficacy of lactational
amenorrhoea. Lancet. 1992 Jan
25;339(8787):227-30. PMID:
1346183.
209. Van der Wijden C; Manion C.
Lactational amenorrhoea method for
family planning. Cochrane Database
Syst Rev. 2015 Oct
12(10):Cd001329. doi:
10.1002/14651858.CD001329.pub2.
PMID: 26457821.
210. Beck LF; Morrow B; Lipscomb LE;
Johnson CH; Gaffield ME; Rogers
M; Gilbert BC. Prevalence of
selected maternal behaviors and
experiences, Pregnancy Risk
Assessment Monitoring System
(PRAMS), 1999. MMWR Surveill
Summ. 2002;51(2):1-27.
211. Pesa JA; Shelton MM. Health-
enhancing behaviors correlated with
breastfeeding among a national
sample of mothers. Public Health
Nurs. 1999;16(2):120-4.
212. Paul IM; Downs DS; Schaefer EW;
Beiler JS; Weisman CS. Postpartum
Anxiety and Maternal-Infant Health
Outcomes. Pediatrics. 2013 March 4,
2013. doi: 10.1542/peds.2012-2147.
213. Dennis C-L; McQueen K. The
relationship between infant-feeding
outcomes and postpartum
depression: a qualitative systematic
review. Pediatrics. 2009 April 1,
2009;123(4):e736-51. doi:
10.1542/peds.2008-1629.
214. Watkins S; Meltzer-Brody S;
Zolnoun D; Stuebe A. Early
breastfeeding experiences and
postpartum depression. Obstet
Gynecol. 2011 Aug;118(2 Pt 1):214-
21. doi:
10.1097/AOG.0b013e3182260a2d.
PMID: 21734617.
215. Nommsen-Rivers LA. Does insulin
explain the relation between
maternal obesity and poor lactation
outcomes? An overview of the
literature. Adv Nutr. 2016
Mar;7(2):407-14. doi:
10.3945/an.115.011007. PMID:
26980825.
216. Stuebe AM. Does breastfeeding
prevent the metabolic syndrome, or
does the metabolic syndrome prevent

146
breastfeeding? Semin Perinatol. 2015
Jun;39(4):290-5. doi:
10.1053/j.semperi.2015.05.008.
PMID: 26187772.