Draft Summary of Blending Practices and the … · the Discharge of Pollutants for Different...
49
Draft Summary of Blending Practices and the Discharge of Pollutants for Different Blending Scenarios Background information June 4, 2014 Developed by Tetra Tech, Inc. Under EPA Contract No. EP-C-11-009 Work Assignment No. 3-05 Prepared for: U.S. Environmental Protection Agency Office of Water Office of Wastewater Management Water Permits Division Blending Summary – Draft – June 4, 2014 1
Transcript of Draft Summary of Blending Practices and the … · the Discharge of Pollutants for Different...
Draft Summary of Blending Practices and the Discharge of Pollutants for Different Blending Scenarios Background information
June 4, 2014
Developed by Tetra Tech, Inc. Under EPA Contract No. EP-C-11-009 Work Assignment No. 3-05 Prepared for: U.S. Environmental Protection Agency Office of Water Office of Wastewater Management Water Permits Division
Blending Summary – Draft – June 4, 2014 1
Contents Introduction ............................................................................................................................................ 3
Key Literature ........................................................................................................................................ 3
Background on Wet-Weather Operations and Blending Treatment Options......................................... 4
Wastewater Treatment and the Impact of Wet-Weather Events on their Performance ..................... 4
Management Options ......................................................................................................................... 5
Reducing peak flows through storage or collection system improvements ................................... 5
Maximizing existing treatment systems ......................................................................................... 5
The Spectrum of Treatment Options for Blending ............................................................................ 6
Screening processes ....................................................................................................................... 6
Clarification processes ................................................................................................................... 6
Side-stream treatment processes .................................................................................................... 7
Disinfection processes ................................................................................................................... 9
Summary of Data from Facilities that Blend ..................................................................................... 9
Facilities without side-stream treatment ........................................................................................ 9
Facilities with side-stream treatment ........................................................................................... 10
Pollutants of Concern under Blending Scenarios and Potential Human Health Impacts .................... 12
Pathogens ......................................................................................................................................... 12
Literature that examined blended effluent ................................................................................... 13
Additional literature ..................................................................................................................... 17
Toxics ............................................................................................................................................... 20
Pharmaceuticals and Personal Care Products (PPCPs) .................................................................... 20
Conventional Parameters ................................................................................................................. 21
Susceptible Populations ................................................................................................................... 22
EPA’s 2012 Recreational Water Quality Criteria (RWQC) ............................................................ 22
References ............................................................................................................................................ 23
Additional Literature Reviewed ........................................................................................................... 26
Attachment 1: Examples of Waterborne Pathogens (NRDC 2004) ..................................................... 27
Attachment 2: Summary of Characterizing the Quality of Effluent and Other Contributory Sources during Peak Wet Weather Events (Gray et al. 2009) ............................................................ 31
Attachment 3: Summary of Impact of Wet-Weather Peak Flow Blending on Disinfection and Treatment: A Case Study at Three Wastewater Treatment Plants (Rukovets and Mitchell 2010) ...... 34
Attachment 4: Ballasted Flocculation—Case Studies on the Use of High-Rate Clarification Technologies ........................................................................................................................................ 37
Blending Summary – Draft – June 4, 2014 2
Introduction The U.S. Environmental Protection Agency (EPA) is holding an experts forum June 19–20, 2014 (see http://cfpub.epa.gov/npdes/sso/peakflowsforum.cfm). This forum is being held to discuss the differing public health implications of discharges from publicly owned treatment works (POTWs) served by separate sanitary sewers that employ different blending scenarios. The information below is meant to provide public health experts participating in the forum with background information on wastewater treatment practices during weather events, including various engineering approaches used when blending, pollutants of concern associated with various blending scenarios, and potential impacts to public health.
Key Literature A literature review was conducted to provide background information on blending practices and pollutants of concern. Some documents provide good descriptions of blending and other practices at POTWs. Only a few documents looked at fate and transport of pollutants from blended effluent during wet-weather events or potential public health implications.
Two key studies were identified that provide an in-depth look at pollutants in blended effluent from facilities without significant side-stream treatment. These include:
1. Characterizing the Quality of Effluent and Other Contributory Sources during Peak Wet Weather Events (Gray et al. 2009)
2. Impact of Wet-Weather Peak Flow Blending on Disinfection and Treatment: A Case Study at Three Wastewater Treatment Plants (Rukovets and Mitchell 2010)
Gray et al. (2009) examined and reported pathogen and conventional parameters at one wastewater treatment plant (WWTP). In addition, the report estimated the number of annual infections associated with blended discharges from the WWTP studied based on two pathogens and three exposure sites. The highest risk found was for Giardia, which the authors examined more in-depth. They estimated that the individual risk exposure event for people recreating in waters receiving wet-weather blended effluent compared to wet-weather effluent from full secondary treatment was one order of magnitude greater at one WWTP outfall and less than one order of magnitude greater at three other sites.
Rukovets and Mitchell (2010) reported pathogens and conventional parameters for three WWTPs served by combined sewers. The authors found that blended effluent that is disinfected might meet permit limits, but that measured values of pathogens might be lower than actual values, because pathogens hide inside the particles associated with blending. Detailed summaries of these two studies are included as Attachments 2 and 3.
Many other documents were reviewed, some of which offer additional information on wet-weather treatment processes and pollutants found in wastewater. Some of these were obtained during a literature search and some were submitted from the public through the April 18, 2014, Federal Register notice announcing the forum on the public health impacts of blending. Those documents that provide additional insight on the risk to public health are listed in the reference section and are included in the following summary. Some of these documents cited secondary references, which have not been verified; however, full citations are included in the reference section when they were provided in the original document.
Blending Summary – Draft – June 4, 2014 3
Background on Wet-Weather Operations and Blending Treatment Options
Wastewater Treatment and the Impact of Wet-Weather Events on their Performance Wastewater collection systems collect wastewater from domestic and industrial sources and convey it to WWTPs for proper treatment and disposal. Wastewater treatment typically consists of preliminary treatment (screening), primary treatment (settling), secondary treatment (biological processes), and disinfection (killing pathogens) prior to discharge to surface waters. Primary treatment consists of removing organic and inorganic particles from the waste stream through settling, which helps lower the organic load entering the biological processes. Secondary treatment involves a two-step process: (1) biological treatment removes biodegradable organic substances achieved by microbes consuming the organic matter as food and converting it to carbon dioxide, water, and energy for their own growth and reproduction; and (2) clarification, which allows for settling of the resulting biomass and other suspended solids. Disinfection inactivates pathogens prior to discharge. During dry weather, wastewater is treated through these processes sequentially.
Treatment processes that are effective for treating dry-weather influent might not be the same processes that are most effective for treating wet-weather influent. Secondary or biological treatment systems are efficient when treating steady-state conditions, but are sensitive to the effects of intermittent and sudden excessive flows generated by peak wet-weather events (Fitzpatrick et al. 2010). Peak wet-weather flows could overwhelm the hydraulic capacity of a WWTP’s secondary treatment system and create washouts of slow-growing biological organisms critical to the processes needed to effectively treat wastewater. Secondary treatment technologies include fixed-film or attached-growth systems (e.g., trickling filters) or suspended-growth systems (e.g., activated sludge [AS]). Biological treatment relies upon microorganisms to break down organic matter. To effectively treat wastewater, microorganisms require adequate contact time with and an optimum amount of organic matter, along with other favorable conditions for growth and reproduction.
The variation in significantly higher flow volumes and pollutant concentrations attributed to wet-weather influent stresses conventional biological treatment processes, due to a loss or inhibition of available biomass required to effectively treat influent (Fitzpatrick et al. 2010). Further, biomass growth rates are too slow to respond rapidly to wet-weather peak flow events. The recovery of biomass from exposure to peak wet-weather flows could result in several weeks of inefficient treatment (Fitzpatrick et al. 2010). AS systems are particularly vulnerable to high-volume peak flows because peak flows that approach or exceed design capacity at an AS unit can shift the solids inventory from the aeration basin to the clarifier and can result in significant solids losses from the clarifier. If a clarifier experiences excessive loss of solids, treatment efficiencies can be lowered for weeks or months until the biological mass in the aeration basins is reestablished. In addition to the hydraulic concerns, wastewater associated with peak flows might have low concentrations of oxygen-demanding pollutants, which can also decrease treatment efficiencies (79 FR 21918, April 18, 2014).
A number of alternative wastewater treatment options are available for facilities that blend during high-volume peak flow events. One option is to divert a portion of peak wet-weather flows after primary treatment around secondary treatment units and recombine prior to disinfection and subsequent discharge to surface waters. Another option is to implement alternative treatment technologies that effectively produce results comparable to the combined effects of primary and secondary treatment.
Blending Summary – Draft – June 4, 2014 4
Management Options Wet-weather events must be managed to sustain conditions within all treatment units so that the system can provide efficient and effective treatment performance once the wet-weather event has ended (Wagner et al., n.d.).
Reducing peak flows through storage or collection system improvements Storage or flow equalization is used to lessen operational problems caused by variations in flow rates. The goal is to provide sufficient storage capacity to effectively eliminate the need to divert flows around the secondary treatment process during peak wet-weather events. Storage is a means to reduce the magnitude of peak flow events and to spread the loading to the treatment plant over a period of time. Using storage upstream of the treatment plant equalizes the flow to the treatment plant and reduces the hydraulic shocks to the system (WERF 2002). Flow equalization basins, tunnels, and converted abandoned treatment facilities are possible methods available to temper peak flow loadings to the treatment plant. The excess wet-weather flows would then be returned to the full treatment plant process after wet-weather flows subside.
The upstream portions of the collection system have adequate capacity to convey peak wet-weather flows that exceed the capacity of the downstream components; therefore, a system is capable of retaining some flow in the upstream systems and releasing it later. Natural flow attenuation in collection systems can be enhanced by oversizing upstream sewers or by incorporating mechanical devices such as vortex flow control devices, or gates to force the flow retention (WEF 2013). In addition, the collection system could be increased in size to convey and store wastewater flows. It could involve constructing new collection system infrastructure, such as installing tunnels along existing sewer lines, to provide additional storage capacity (Gray et al. 2009). Tunnels for wet-weather control can be used to store overflows or excess wet-weather flow during storm events, and then to dewater the stored flow to a treatment plant after the storm event (WEF 2013).
Maximizing existing treatment systems Operators strive to maximize the use of existing facilities within the treatment plant and at the same time, protect the facilities and their processing capabilities, post-storm event.
Facilities equipped with primary clarifiers may temporarily convert them to a chemically enhanced operation. Chemically enhanced clarification increases the processing capability of existing primary clarifiers while providing higher total suspended solids (TSS) removal efficiencies.
As discussed previously in regards to facilities that employ AS treatment, the greatest concern for providing biological treatment of wet-weather flows is losing biomass in the effluent caused by high hydraulic and solids overflow rates on the secondary clarifiers. This could result in a lesser biomass population returned to the bioreactors, and therefore would be unable to treat the organic matter in the influent. Because these microorganisms multiply slowly, treatment performance could be lowered for an extended period of time after the wet-weather event has ended (WEF 2013).
Some treatment facilities might be able to divert wet-weather flows around certain unit processes if the capacity of those units would be exceeded, to receive split treatment (WEF 2013). The two flows would be recombined prior to discharge to surface waters. For example, influent that has received preliminary treatment (screening and grit removal) may be diverted around primary treatment directly to receive biological treatment, or primary effluent may be diverted around biological treatment and recombining upstream of the disinfection process.
In addition, some facilities may operate an AS system in a conventional mode during dry-weather conditions and in step-feed or contact stabilization mode during wet-weather conditions. Step-feed is
Blending Summary – Draft – June 4, 2014 5
when an operator adjusts the influent flow pattern distribution among different biological reactors (WERF 2002). Step-feed enhances secondary effluent by reducing the solids loading in the mixed liquor applied to the secondary clarifiers during wet-weather events. Step-feeding helps to extend the hydraulic capacity of the secondary clarifiers by reducing the solids loading (WEF 2013).
Fixed-film systems are better able to handle wider fluctuations in short-duration peak flow and loading events than are suspended growth systems such as AS; however, fixed-film systems might not produce an effluent as high quality as that produced by an AS system (WEF 2013).
Secondary clarifiers can be designed to enhance the settling of biological solids during peak flow conditions by using baffles to spread the flow uniformly across the clarifier and direct it to the bottom of the clarifier and enhance solids separation. Use of such devices has been proven to improve secondary clarifier performance during average and peak flow periods (WEF 2013).
The Spectrum of Treatment Options for Blending WWTP operators can increase pollutant removals during high flow conditions using various methods including adding chemicals to the primary treatment process that increase solids removal; providing additional primary treatment capacity; providing structural changes to primary treatment units, such as the installation of lamella settlers; and providing supplemental side-stream physical/chemical treatment units such as high-rate clarification (HRC) systems or fine-screen systems, to provide supplemental treatment to flows that are diverted around secondary treatment processes (79 FR 21918, April 18, 2014).
The addition of high-rate treatment processes can expand treatment plant capacity by allowing wastewater treatment facilities to be operated at significantly higher process loading rates than conventional or traditional design. Chemically enhanced primary treatment involves adding a coagulant and flocculant to the influent during primary clarification during wet-weather conditions to enhance the removal rate of TSS and biochemical oxygen demand (BOD) and increase the surface overflow rate of the clarifier to improve overall treatment capacity (WEF 2013). Vortex or swirl concentrators are physical treatment devices that use the incoming energy of influent wastewater to promote the settling of solids before primary treatment. This existing technology has been successfully used at treatment plants for many years for wet-weather flow treatment (USEPA 2007). Coagulants and flocculants can also be added when using a vortex or swirl separator to increase removal and settling of solids and floatables.
Screening processes Fine screening (openings 0.2 to 2.0 millimeters) can remove significant amounts of suspended solids, achieving removal efficiencies that are close to those achieved by primary clarifiers. Vortex or swirl concentrators regulate flow and remove solids and floatable materials by using the incoming energy in the influent wastewater to induce a vortex flow pattern in a cylindrical tank, which helps flocculate solids and accumulates the settleable solids at the bottom-center of the unit for removal (King County DNRP 2012). Chemical addition (coagulant and flocculation aid) to both fine screening and vortex concentrators allow for greater solids removal.
Clarification processes Operators can add chemicals to primary clarifiers to induce chemically enhanced clarification and achieve greater removal efficiencies for TSS and BOD. As discussed previously, this additional load removal during primary clarification reduces the load to downstream biological treatment processes, potentially increasing the capacity of the downstream process units during wet-weather events. In
Blending Summary – Draft – June 4, 2014 6

addition, chemically enhanced clarification also improves the quality of diverted flows for side-stream treatment (WEF 2013). In addition to optimizing the removal of suspended and settleable solids, chemically enhanced primary treatment can remove colloidal materials that would not be removed by conventional clarification. Depending on the chemical coagulants and flocculants used, there is also the potential for coagulation and precipitation of soluble copper and other metals (King County DNRP 2012).
Clarification with lamella plates uses lamella plates to enhance the performance of conventional clarification. Lamella plates are inclined plates installed near the surface of a primary sedimentation basin that reduce the distance a particle must settle to be removed; resulting in an increased effective settling area. The removal efficiencies that can be achieved using clarification with lamella plates are comparable to conventional clarification (King County DNRP 2012).
Chemically enhanced primary treatment with lamella plates combines chemically enhanced primary treatment with the use of lamella plates to further improve performance by increasing removal efficiencies.
HRC processes are similar to conventional sedimentation in that they employ gravity settling, but they incorporate specific enhancements, including chemical coagulation and flocculation, lamella settlers, solids contact, sludge recirculation, and ballasted flocculation. High-rate filtration typically relies on media other than granular media to function at higher hydraulic loading rates, which greatly reduces the total surface area requirements as compared to conventional granular systems (Fitzpatrick 2010). High-rate filtration options include deep-bed granular media, cloth media, and compressible media.
Numerous pilot and full-scale studies of these technologies have demonstrated that these high-rate treatment technologies can consistently provide significantly higher levels of treatment to wet-weather flows than can conventional sedimentation technologies. Their use in auxiliary treatment systems is an effective approach to minimizing the risks of wet-weather upsets to biological treatment systems (Fitzpatrick 2010).
Side-stream treatment processes Auxiliary, or parallel, treatment systems are operated to treat peak wet-weather flows that exceed the capacity of a WWTP’s normal dry-weather biological processes (Fitzpatrick 2010). Facilities can install new treatment systems in parallel to existing systems, whereby influent during peak wet-weather flows would be split between the two treatment trains, treated, and subsequently recombined prior to disinfection and discharge from the treatment facility. Parallel treatment technologies generally involve fine screening, vortex, or swirl concentrators; chemically enhanced clarification; HRC; or high-rate filtration processes. Physical and chemical treatment processes remove organic matter and suspended solids without using biomass. As described earlier, physical processes remove solids in wastewater using screens or filter media, or are settled out via gravity. Chemical additions increase the ability of solids to be removed.
HRC is a physical-chemical treatment process used to achieve high BOD and TSS removal rates at surface overflow rates much greater than conventional gravity settling processes. HRC processes typically include adding coagulants and flocculants to the wastewater with lamella plates or inclined tubes to enhance performance in the settling zone. HRC has been achieved through the addition of a ballast (i.e., ballasted flocculation) to improve settling or via chemical sludge recirculation in a solids contact clarifier. High-rate treatment processes are well-suited for managing wet-weather flows because of their ability to respond to rapid flow increases (Gray et al. 2009).
Blending Summary – Draft – June 4, 2014 7
Enhanced HRC is optimized when integrated as a parallel train into existing and new wastewater treatment facilities to provide peak flow side-stream treatment and to allow the biological process to treat a constant flow (WERF 2002). Effluent from the enhanced HRC unit would be combined with AS effluent, disinfected, and discharged to the receiving stream. During non-peak wet-weather flows, the enhanced high-rate process could be used as a chemically enhanced primary clarifier to help maintain flow during construction periods at the head of the plant (WERF 2002).
Innovations to the physical/chemical clarification process include the ballasted high-rate clarification (BHRC) process that uses a coagulant and polymer to form suspended solids onto a ballast particle. The BHRC process includes the patented Actiflo® and DensaDeg® processes. Because solids are settled out more quickly than in conventional treatment systems, the Actiflo® and DensaDeg® processes require a smaller footprint. Both processes are very similar to conventional solids removal technology in that they both use coagulant for the destabilization and polymer for the aggregation of suspended materials for subsequent removal by settling. However, the differences lie in what material is used as the “seed” for forming high-density flocs.
The Actiflo® process begins with the addition of a coagulant to wastewater in a coagulation tank to destabilize suspended solids. Wastewater then overflows into an injection tank where microsand is added. The microsand serves as a “seed” for floc formation, providing a large surface area for suspended solids to bond to, which is the unique feature of Actiflo®. In addition to providing more surface area for floc formation, the microsand acts as a ballast or weight. Where the Actiflo® process surpasses conventional treatment is the addition of microsand as a “seed” and ballast for the formation of high-density flocs that have a relatively high-density microsand nucleus and are easily removed by settling (USEPA 2013). The microsand ballasted floc that is formed has significantly improved settling characteristics compared to a conventional or chemical floc (King County DNRP 2012).
The DensaDeg® process is another high-rate chemical and physical clarification process that combines sludge ballasted clarification and lamellar filtration, both established processes. The DensaDeg® process also begins with the addition of a coagulant to destabilize suspended solids, and then flow enters a rapid-mix tank for flash mixing to allow the coagulant to take effect. The wastewater then overflows into a reactor tank where sludge and polymer are added. A draft tube and mixer in the reactor allow for thorough mixing of the wastewater with the recirculated sludge and added chemicals. In the DensaDeg® process, the sludge serves as a “seed” for floc formation, providing a large surface area for suspended solids to bond to, which allows solids to settle out more quickly (USEPA 2013).
Wastewater flows over a weir from the reactor tank through a transition zone before entering the clarifier. The clarifier effectively removes the flow with help from settling tubes, allowing further tank size reduction. Clarified water exits the process by overflowing weirs above the settling tubes. Sludge is collected at the bottom of the clarifier with a conventional scraper system and recirculated back to the reactor tank. Periodically, a separate sludge pump energizes and wastes a small portion of the sludge from the system. Scum is removed from the process at the top of the transition zone by a cylindrical collector that automatically rotates periodically (USEPA 2013).
Where the DensaDeg® process differs from and improves upon conventional solids removal is the use of recirculated sludge as a “seed” for forming high-density flocs for easy removal by settling (USEPA 2013). The DensaDeg® process has been installed in Toledo, Ohio.
Blending Summary – Draft – June 4, 2014 8
Disinfection processes Disinfection is required prior to discharge to surface waters. Chlorine gas, liquid sodium hypochlorite solution, and ultraviolet light are common disinfection methods. Disinfection by chlorine requires a specific amount of contact time to sufficiently destroy pathogens. In some cases, dechlorination of the effluent is also required prior to discharge to surface waters. Research and full-scale implementation indicates pathogens might be killed with lower detention times in chlorine contact basins than required by most regulatory standards; therefore, it is encouraging when considering disinfection options during wet-weather events. Although chlorine and ultraviolet disinfection are most commonly used at WWTPs in the United States, other disinfectants exist, including some emerging technologies such as peracetic acid, bromo chloro dimethylhydantoin (BCDMH) (WEF 2013). Peracetic acid acts as a high-rate disinfectant and BCDMH is typically used to treat drinking water, but is suitable for intermittent use, as in treating wet-weather events (USEPA 2013). In some cases, operators may implement primary clarification with concurrent disinfection. This approach is based on conventional clarification and provides disinfection concurrent with sedimentation by adding a chemical disinfectant (typically sodium hypochlorite) to the wastewater as it enters the sedimentation basin (King County DNRP 2012). The hydraulic retention time provided by the sedimentation basin, therefore, also serves as the contact time for the disinfectant.
Summary of Data from Facilities that Blend
Facilities without side-stream treatment RUKOVETS AND MITCHELL 2010 (IEC STUDY) Researchers monitored three full-scale New York City WWTPs to evaluate the microbiological impact of blending primary effluent flows that are in excess of secondary treatment capacity with the secondary effluent before disinfection at large municipal WWTPs. The study’s objective was to evaluate the effect of wet-weather blending on the concentration of fecal coliform and Enterococcus indicator bacteria, total residual chlorine, protozoa, and viruses in the WWTP final effluent.
The average of 5-day biochemical oxygen demand (BOD5) wet-weather blending effluent concentrations were 24 milligrams per liter (mg/L) at WWTP 1 (values ranged from 9.5 to 37 mg/L), and 22 mg/L at WWTP 2 (values ranged from 9 to 30 mg/L). The average of TSS wet-weather blending effluent concentrations were 20 mg/L at WWTP 1 (values ranged from 22 to 33 mg/L) and 20 mg/L at WWTP 2 (values ranged from 13 to 26 mg/L). All of these average values are below the Interstate Environmental Commission (IEC) effluent limit of 30 mg/L as a 30-day average. The average removal values for wet-weather blending samples at WWTP 1 were 77 percent for BOD5 and 71percent for TSS; and at WWTP 2 were 81 percent for BOD5 and 89 percent for TSS.
Because the total percent removal during blending at both WWTPs was slightly below the expected average of 85 percent, closer analysis of the removal data during blending indicated that the possible limiting factor was the percent removal in the primary treatment portion of the WWTPs. The percent removal achieved during the primary treatment portion during blending were 28 percent for BOD5 and 31 percent for TSS at WWTP 1, and 23 percent for BOD5 and 49 percent for TSS at WWTP 2. These are slightly lower than the preferred range of removals of 25 to 40 percent for BOD5 and 50 to 60 percent for TSS during standard primary treatment operations. Another reason for the lower removals is that a portion of the flow did not receive secondary treatment.
Results indicated that during blending, the sampled WWTPs remove, on average, between 97 and 99 percent of coliphage and enteric viruses; approximately 71 percent of Cryptosporidium; and between 40 and 88 percent of Giardia. Geometric means measured during blending for fecal coliform ranged from 520 to 19,000 MPN/100 mL and for Enterococcus from 870 to 17,000 MPN/100 mL.
Blending Summary – Draft – June 4, 2014 9
A statistical evaluation of macerated particulate matter indicated the maceration of effluent samples resulted in an increase in both fecal coliform and Enterococcus concentrations when compared to unmacerated samples.
GRAY ET AL. 2009 (WERF STUDY) The project team evaluated the effects of blending (diverting excess primary effluent around secondary treatment and blending with secondary treatment flow before being disinfected and discharged) practices at a municipal WWTP on effluent and receiving water quality, and estimated public health risks associated with recreation in surface waters receiving blended flows.
Mean and median particle size values and particle number concentrations were higher at the plant effluent for wet-weather blending events than for the non-blending events at facilities that blended without side-stream treatment. Results show that during blending events median particle size, mean particle size, and particle number concentrations were higher in flows from primary treatment units than from secondary treatment units. In addition, these parameters were higher in the final effluent for wet-weather blending events in comparison to wet-weather non-blending and dry-weather events (Gray et al. 2009).
The study summarized field sampling results indicating that Giardia, adenovirus, fecal coliform, E. coli, F+ coliphage, TSS, 5-day carbonaceous biochemical oxygen demand (CBOD5), and particle concentrations from final effluent grab samples appeared higher during blending events than during wet-weather non-blending events. No increase was observed in volatile organic compound (VOC) levels during blending events. The grab samples from the East Bay Municipal Utility District (EBMUD) main WWTP’s (MWWTP’s) effluent resulted in concentrations for CBOD5 and TSS below permit limits.
Further, Gray et al. (2009) concluded that based on seven blending events at the EBMUD’s MWWTP, grab samples collected from the plant’s final effluent showed no increase in Cryptosporidium (enumeration and infectivity), enteric viruses, rotavirus, and pathogen indicator organisms including fecal coliform, E. coli, Enterococcus, and male-specific coliphage, compared to seven wet-weather non-blending events (i.e., peak secondary) and two dry-weather events sampled.
T-test results indicated that the differences between blending and non-blending events were not statistically significant for any of the pathogen and indicator organisms except Giardia cysts.
The study mentions that a microbial risk assessment of human health impacts associated with water contact recreation during blending events was conducted on microbial pathogens in EBMUD WWTP’s effluent. The study indicates that while the microbial risk assessment results showed discernable differences in per-event risk between blending and non-blending scenarios, the estimated incremental increase in annual number of infections due to blending was small.
Gray et al. (2009) acknowledged that the study results are specific to EBMUD and might not be representative of impacts from blending at other wastewater treatment facilities that implement blending operations.
Facilities with side-stream treatment
TOLEDO, OHIO (BLACK & VEATCH 2009) The City of Toledo’s wastewater collection system is served by combined sewers. The City of Toledo added wet-weather treatment facilities to the Toledo, Ohio, Bayview Wastewater Treatment Plant (BVWWTP) to provide treatment to all flows received at the plant in excess of its secondary treatment capacity of approximately 200 million gallons per day (mgd). The ballasted flocculation
Blending Summary – Draft – June 4, 2014 10
process is a HRC process that is specifically designed for chemically treating excess flows that are diverted around secondary treatment and then recombined at the outfall. A study was conducted from 2007 to 2009 to evaluate the effectiveness of the ballasted flocculation facilities at removing TSS, carbonaceous biochemical oxygen demand (CBOD), total Kajeldahl nitrogen (TKN), ammonia, and total phosphorus (TP). The wet-weather treatment facilities produced an effluent of comparable quality to that of secondary treatment for TSS and TP, and sufficiently low concentrations of CBOD to comply with National Pollutant Discharge Elimination System (NPDES) permit limits for all but one of the wet-weather events. Wet-weather treatment effluent TSS complied with the NPDES permit limit for all of the events. Percent removals remain relatively consistent over the range of varying influent concentrations, hydraulic loadings, and chemical dosages. Attachment 4 provides additional data.
LAWRENCE, KANSAS (WAGNER ET AL., N.D.) The Kaw River Wastewater Treatment Plant (KRWWTP) is a separate sanitary sewer system with 6.25 million gallons of wet-weather storage within the collection system. The treatment facility is designed to treat 12.5 mgd of dry-weather flows and up to 65 mgd of peak wet-weather flows using conventional AS treatment and a parallel HRC Actiflo® treatment system. All effluent flows are chlorinated and dechlorinated prior to discharge to the Kansas River. The plant’s data indicate that effluent from HRC treatment during peak wet-weather flow events is equal to or better than the quality of the effluent discharged from AS treatment in all parameters including E.coli. Effluent discharged from both treatment processes (AS and HRC) meets the secondary treatment standard (CBOD, TSS, and minimum percent removal for CBOD and TSS) and other water quality-based NPDES permit limits (ammonia and E. coli). For all parameters, the concentrations measured in each discharge flow were well below the NPDES permit limits. It is notable that the Actiflo® discharge concentrations alone were below permit requirements for all parameters, including E. coli and ammonia. Attachment 4 provides additional data.
AKRON, OHIO (HEATH ET AL., N.D.) The City of Akron’s wastewater collection system contains storm, sanitary, and combined sewers. The City of Akron’s Water Reclamation Facility (WRF) receives all dry-weather flows and a portion of wet-weather flows in the sanitary and combined sewer systems (Heath et al., n.d.). As part of a Consent Decree with EPA and Ohio EPA, the City of Akron constructed a parallel excess flow wet-weather treatment facility at the city’s WRF. The City of Akron incorporates high-rate AS with the Actiflo® high-rate ballasted flocculation process during high flow periods. The City of Akron conducted pilot-scale testing to assess BioActiflo® performance for potential full-scale application for treatment of peak wet-weather flow at the City’s WRF (Heath et al., n.d.).
Data collected during the pilot period (average and geometric mean results for 20 wet-weather events that resulted in a bypass of the secondary treatment system) indicate the BioActiflo® system reduced TSS, CBOD5, and E. coli concentrations below the facility’s performance criteria established in the Long Term Control Plan (LTCP). In addition, data collected from each of the individual 20 qualifying wet-weather events indicate treatment to levels below those performance criteria (AECOM 2013). The study also demonstrated that BioActiflo® effluent was as readily disinfected as effluent from the WRF secondary treatment process, and that both sodium hypochlorite and ultraviolet light were effective (Heath et al., n.d.). Results from the pilot study conducted by the City of Akron demonstrate that by incorporating high-rate AS contact with the Actiflo® high-rate ballasted flocculation process, BioActiflo® can remove soluble BOD5 that would not otherwise be removed (Heath et al., n.d.). Attachment 4 provides additional data.
Blending Summary – Draft – June 4, 2014 11
Pollutants of Concern under Blending Scenarios and Potential Human Health Impacts
Pathogens The primary concern for human health risk associated with sewage discharges is from microbial contaminants (Fitzpatrick et al. 2010, 2013; USEPA 2004). According to Blatchley et al. (2005), enteric viruses represent the greatest public health risk. The Natural Resources Defense Council (NRDC) put together a list of pathogens that have been found in sewage-contaminated bathing waters. This list represents pathogens that can be found in effluent from sewage treatment plants, including blended effluent. This list is included as Attachment A and includes a variety of bacteria, viruses, protozoa, and helminths.
Disease-causing pathogens can be found in domestic sewage, and there is concern about whether blending and other peak flow treatments adequately protect public health. Many studies show that primary treatment alone is not effective in removing microbial contaminants. Unfortunately, there are limited studies and data on blended effluent and even less data on the impacts on human health of blended discharges. As described in EPA’s Report to Congress (USEPA 2004), data on human health impacts from all wet-weather discharges are not readily available, mainly because of the underreporting of waterborne disease and the reliance of water quality monitoring activities on indicator bacteria instead of microbial pathogens. Relevant data found during the literature review are summarized below.
Gray et al. (2009), Rukovets and Mitchell (2010), and Rose (2004) compare pollutant concentrations in wet-weather blended effluent to dry-weather effluent. Wagner et al. (n.d.) and Black & Veatch (2014) examine pollutant removals during wet weather at facilities that use HRC to treat excess flow.
Giardia and Cryptosporidium were mentioned the most frequently in the literature as having the largest risk to human health. Although Rose (2004) only examined data from two wet-weather events, she estimated using the Giardia data there was about a 1,000-fold increased risk of contracting Giardiasis from swimming in Lake Michigan after blended sewage has been discharged into it (although the blending treatment used at the WWTP is unknown). This contrasts to Gray et al. (2009) who concluded that the relative increase of annualized risk for people recreating in waters receiving blended effluent was less than one infection annually, assuming 180 exposure events per day for 30 blending days per year. Rukovets and Mitchell (2010) found that effluent values of Giardia were one order of magnitude higher during wet-weather blending versus dry weather at both treatment plants studied. The other studies that were reviewed and summarized examined pollutant concentrations and removal percentages, but did not estimate risk.
Results from the HRC studies indicate that HRC treatment is capable of providing some pathogen removal. Wagner et al. (n.d.) found that effluent from HRC during peak wet-weather flow events is equal to or better quality than effluent discharged from AS treatment for fecal coliform and E. coli and discharge consistently met the secondary treatment standard and other water quality-based permit limits and therefore reduces risk to public health by avoiding bypass of untreated wastewater. Black & Veatch (2014) also found that both HRC and AS treatments removed pathogens and the HRC train showed slightly better removal of Cryptosporidium and Giardia.
Blending Summary – Draft – June 4, 2014 12

Literature that examined blended effluent GRAY ET AL. (2009)
Gray et al (2009) monitored blended and non-blended effluent for Giardia, Cryptosporidium, viruses (adenovirus, enteric viruses, rotavirus, norovirus), and pathogen indicator organisms (fecal coliform, Escherichia coli, Enterococcus, and male-specific coliphage) and found that only Giardia and adenovirus concentrations in plant final effluent increased during wet-weather blending events in comparison to wet-weather non-blending events and dry-weather events. They conducted receiving water modeling, and T-tests indicated at the differences between blending and non-blending were not statistically significant for any of the pathogen and indicator organisms except Giardia cysts.
This study also looked at risk of exposure. The authors found that the estimated individual risk per exposure event for people recreating in waters receiving blended flows were greater by about an order of magnitude (10-fold) at the EBMUD MWWTP outfall location and less than an order of magnitude at three other exposure sites, than if these blended flows received full secondary biological treatment during wet-weather conditions. The relative increase of annualized risk was less than one infection annually, assuming 180 exposure events per day for 30 blending days per year. Attachment 2 contains a full summary of Gray et al. (2009).
RUKOVETS AND MITCHELL (2010)
In a study funded in part by EPA, Rukovets and Mitchell (2010) of the IEC evaluated the microbiological impact of blending primary effluent flows that are in excess of secondary treatment capacity with the secondary effluent prior to disinfection at large municipal WWTPs with combined sewer overflows (CSOs). The excess diverted flow from primary treatment does not receive any side-stream treatment before blending occurs. The results showed that during blending, the sampled WWTPs remove, on average, between 97 and 99 percent of coliphage and enteric viruses; approximately 71percent of Cryptosporidium; and between 40 percent and 88 percent of Giardia. The geometric mean for fecal coliform effluent concentrations during blending at the three WWTPs ranged from 520 to 19,000 MPN/100 mL and the corresponding geometric mean for Enterococcus effluent concentrations ranged from 870 to 17,000 MPN/100 mL.
For fecal coliform and Enterococcus at WWTP 3 and for fecal coliform at WWTP1, the difference between wet-weather blending and dry-weather effluent concentrations was between a half and one order of magnitude. Effluent fecal coliform and Enterococcus levels were three orders of magnitude higher during wet-weather blending vs. dry-weather blending for both parameters at WWTP 2 and for Enterococcus at WWTP 1. Table 1 shows the results.
Table 1. Comparison of bacteria concentrations for blended effluent and dry non-blended effluent WWTP Avg.
Flow (mgd)
Operating mode
Fecal coliform GM (MPN/100 mL) Enterococcus GM (MPN/100 mL) Influent Effluent Order of
magnitude reduction
Influent Effluent Order of magnitude reduction
1 239 Wet blending
4,200,000 4,900 103 890,000 17,000 102
122 Dry 19,000,000 890 104 470,000 20 104 2 125 Wet
blending 1,100,000 19,000 102 260,000 14,000 10
31 Dry 5,000,000 16 105 220,000 3 105 3 469 Wet
blending 1,600,000 520 103 280,000 870 103
239 Dry 5,600,000 31 105 1,700,000 120 104
Blending Summary – Draft – June 4, 2014 13

Additional inspection results indicate that during dry weather only one out of six hourly samples for fecal coliform was in violation at only one of the three WWTPs inspected. In addition, when IEC inspected WWTP 1 on August 18, 2006, the WWTP began blending and five out of six hourly samples collected by IEC on the same day were above the permit limit, (i.e., > 16,000; 3,000; 5,000; > 16,000; 5,000) with geometric average of > 5,300 MPN/100 mL, consistent with wet-weather results of this study.
Effluent values of Giardia spp. were one order of magnitude higher during wet-weather blending vs. dry weather blending at both WWTP 1 and WWTP 2. The geometric mean of Giardia effluent results during wet weather were in the low triple digits, with 88 percent removal at WWTP 1 and 40 percent removal at WWTP 2. Effluent concentrations for Cryptosporidium were higher during wet-weather blending at WWTP 1 compared to dry-weather blending. Results for wet weather were mostly in the single or low double digits with an average percent removal of 71 percent for WWTP 1. There were not enough detectable results to estimate average percent removal for WWTP 2. Table 2 shows the results of the protozoa. Attachment 3 contains a full summary of Rukovets and Mitchell (2010).
Table 2. Comparison of virus concentrations for blended effluent and dry non-blended effluent WWTP Operating
mode Giardia cysts/L (enumerated values)
Enterococcus GM (MPN/100 mL)
Infectious Cryptosporidium MPN/L
Range GM Range GM Range GM 1 Wet
blending 40-720 148 <0.2-52 8 <0.3-<9.2 NA
Dry 6-21 12 1-8 2 <0.2 NA
2 Wet blending
7-720 105 <0.2-2 NA <0.5-<2.4 NA
Dry 2-4 3 2-4 2 <0.2 NA
MILWAUKEE, WI, ROSE (2004) Rose (2004) analyzed data from two blending incidents (May 1 and December 10, 2003) at the Jones Island Sewage Treatment Plant in Milwaukee, Wisconsin, which discharges to Lake Michigan. She found the average number of Giardia cysts in the effluent during blending was 387/L; the average without blending was 0.2/L (i.e., more than 1,000 times higher). For Cryptospiridium, the average number of oocysts in the effluent during blending was 0.86/L; the average without blending was 0.29/L (i.e., about three times higher). Using the Giardia data, Rose states that her risk assessment model indicated that at the time of the study, there was about a 1,000-fold increased risk of contracting Giardiasis from swimming in Lake Michigan after blended sewage has been discharged into it. Based on an assumption of 1/10 dilution, for fully treated sewage the risk was 4/10,000 and for bypassed sewage, the risk was 5.3/10 or just over 1 in 2 chance that people would get sick from swimming immediately adjacent to the outfall. Note that the blending scenario used at this treatment plant is unknown.
Blending Summary – Draft – June 4, 2014 14

HRC STUDIES BY AECOM (2013); BLACK & VEATCH (2014); HEATH ET AL. (N.D.); AND WAGNERET AL. (N.D.) Several studies examined the performance of using HRC, also referred to as ballasted flocculation, as a treatment for excess flow during wet-weather events. This includes the use of DensaDeg®, Actiflo®, and BioActiflo®. Attachment 4 provides detailed information on these processes and related studies.
The KRWWTP in Lawrence, Kansas (Wagner et al., n.d.), found that effluent from HRC during peak wet-weather flow events is equal to or better quality than effluent discharged from AS treatment for fecal coliform and E. coli. In their pilot study, discharge consistently met the secondary treatment standard and other water quality-based permit limits, and they concluded using HRC reduces risk to public health by avoiding bypass of untreated wastewater. This is supported by the data in Table 3, which summarizes the average values with a ±95 percent confidence interval along with the number of data points averaged for each parameter for dry weather (using AS) and wet weather (using HRC).
Table 3. Comparison of average bacteria concentrations ± 95% confidence interval for wet-weather and dry-weather discharges at the KRWWTP
Parameter Dry-Weather Activated
Sludge (AS)
Wet-Weather HRC
Final Discharge
HRC Discharge
Final Discharge
E. coli (col/100 ML)
20 ± 20 24 ± 33 19 ± 16
Fecal coliform and E. coli (col/100 mL)
31 ± 18 51 ± 30a 456 ± 509b
a The average fecal coliform levels in the final discharge are 1 log higher than the HRC discharge due to a few outlier events in 2005. b If data were to be omitted from 2004 and 2005, the average is 35 ± 31. The high fecal coliform counts from HRC in 2005 were discovered when measured values from the AS discharge were greater than 3 log because an emergency overflow pipe from the excess flow basin to the discharge was discovered.
The City of Toledo, Ohio (Black & Veatch 2014) examined two wet-weather events at the Ohio BVWWTP. The study compared and contrasted pathogen removal and inactivation by the auxiliary HRC and AS trains when both systems are simultaneously discharging treated wet-weather flows to the Maumee River. Both treatment trains reduced bacteria, protozoans, and viruses. There was no difference between HRC and AS treatment for pathogenic bacteria. The HRC train showed slightly more removal of Cryptosporidium and Giardia. There was higher removal of bacteria and viruses during HRC pre-chlorination; however, there was no difference post-chlorination. Tables 4 and 5 show the results from the studies.
Blending Summary – Draft – June 4, 2014 15

Table 4. Summary of sampling results for pathogenic microbes for the BVWWTP
Table 5. Summary of sampling results for potential indicator organisms for BVWWTP
The City of Akron Water Pollution Control Station (WPCS) conducted a pilot study to demonstrate whether or not the BioActiflo® biological ballasted flocculation process is capable of achieving the effluent limitations established in the LTCP and to collect data to compare the performance of the BioActiflo® system to the city’s conventional secondary treatment system in treating pathogens and conventional pollutants. The pilot was operated during wet-weather events, which resulted in secondary treatment system bypasses at the WPCS; a total of 20 events were evaluated (AECOM 2013). Effluent from both the main plant and BioActiflo® processes were readily disinfected using either sodium hypochlorite or UV. In addition, a blend of main plant secondary effluent and BioActiflo® pilot effluent was readily disinfected using sodium hypochlorite. E. coli concentrations in the BioActiflo® pilot influent were in the typical range at an average of 749,570 cfu/100 mL for all
Blending Summary – Draft – June 4, 2014 16
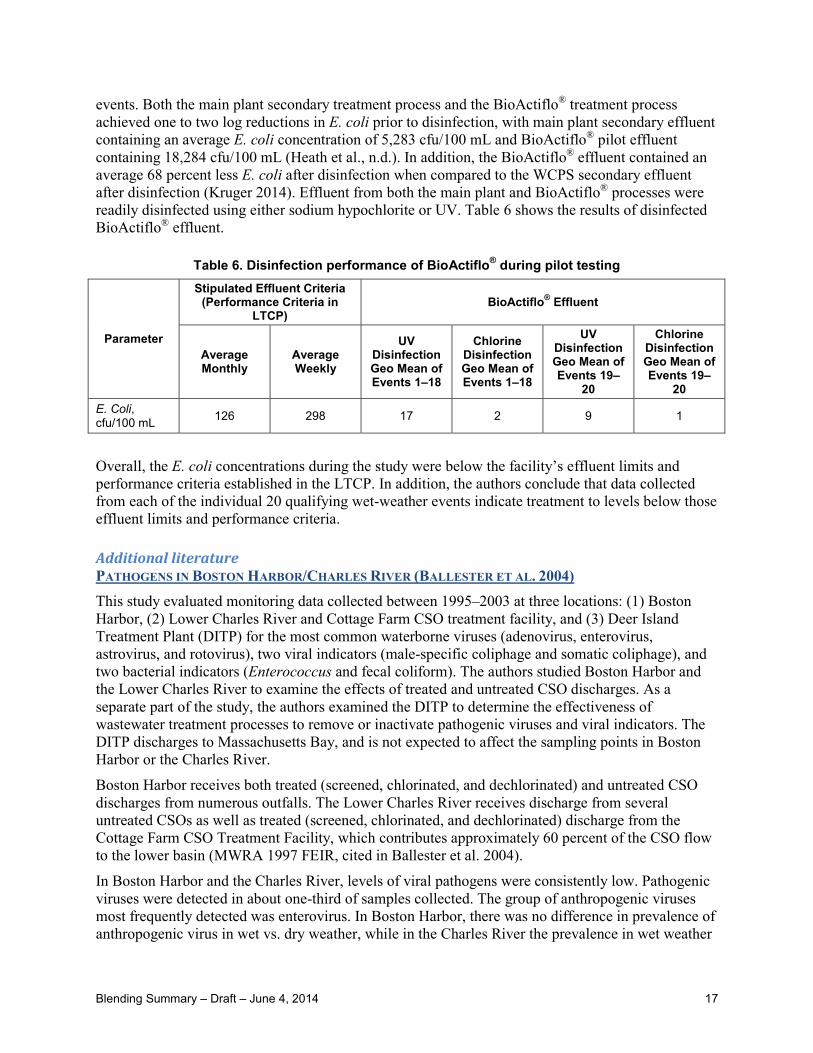
events. Both the main plant secondary treatment process and the BioActiflo® treatment process achieved one to two log reductions in E. coli prior to disinfection, with main plant secondary effluent containing an average E. coli concentration of 5,283 cfu/100 mL and BioActiflo® pilot effluent containing 18,284 cfu/100 mL (Heath et al., n.d.). In addition, the BioActiflo® effluent contained an average 68 percent less E. coli after disinfection when compared to the WCPS secondary effluent after disinfection (Kruger 2014). Effluent from both the main plant and BioActiflo® processes were readily disinfected using either sodium hypochlorite or UV. Table 6 shows the results of disinfected BioActiflo® effluent.
Table 6. Disinfection performance of BioActiflo® during pilot testing
Parameter
Stipulated Effluent Criteria (Performance Criteria in
LTCP) BioActiflo® Effluent
Average Monthly
Average Weekly
UV Disinfection Geo Mean of Events 1–18
Chlorine Disinfection Geo Mean of Events 1–18
UV Disinfection Geo Mean of Events 19–
20
Chlorine Disinfection Geo Mean of Events 19–
20 E. Coli, cfu/100 mL 126 298 17 2 9 1
Overall, the E. coli concentrations during the study were below the facility’s effluent limits and performance criteria established in the LTCP. In addition, the authors conclude that data collected from each of the individual 20 qualifying wet-weather events indicate treatment to levels below those effluent limits and performance criteria.
Additional literature PATHOGENS IN BOSTON HARBOR/CHARLES RIVER (BALLESTER ET AL. 2004) This study evaluated monitoring data collected between 1995–2003 at three locations: (1) Boston Harbor, (2) Lower Charles River and Cottage Farm CSO treatment facility, and (3) Deer Island Treatment Plant (DITP) for the most common waterborne viruses (adenovirus, enterovirus, astrovirus, and rotovirus), two viral indicators (male-specific coliphage and somatic coliphage), and two bacterial indicators (Enterococcus and fecal coliform). The authors studied Boston Harbor and the Lower Charles River to examine the effects of treated and untreated CSO discharges. As a separate part of the study, the authors examined the DITP to determine the effectiveness of wastewater treatment processes to remove or inactivate pathogenic viruses and viral indicators. The DITP discharges to Massachusetts Bay, and is not expected to affect the sampling points in Boston Harbor or the Charles River.
Boston Harbor receives both treated (screened, chlorinated, and dechlorinated) and untreated CSO discharges from numerous outfalls. The Lower Charles River receives discharge from several untreated CSOs as well as treated (screened, chlorinated, and dechlorinated) discharge from the Cottage Farm CSO Treatment Facility, which contributes approximately 60 percent of the CSO flow to the lower basin (MWRA 1997 FEIR, cited in Ballester et al. 2004).
In Boston Harbor and the Charles River, levels of viral pathogens were consistently low. Pathogenic viruses were detected in about one-third of samples collected. The group of anthropogenic viruses most frequently detected was enterovirus. In Boston Harbor, there was no difference in prevalence of anthropogenic virus in wet vs. dry weather, while in the Charles River the prevalence in wet weather
Blending Summary – Draft – June 4, 2014 17
was about double that in dry weather, from 18 to 37 percent, which the authors note could be due to greater stormwater and CSO loading on the smaller volume of receiving water in the river compared to Boston Harbor. Spatial and temporal patterns of viral prevalence in both the river and the harbor are consistent with multiple sources of viruses, including dry-weather and stormwater sources as well as treated and untreated CSO. The sampling did not find an increased prevalence of viruses in wet weather near CSO treatment facilities when a discharge had occurred compared to when a discharge had not occurred. In Boston Harbor, the lowest viral prevalence was near beaches, and the prevalence of viruses was similar at beaches affected by CSO discharges or stormwater discharges or both.
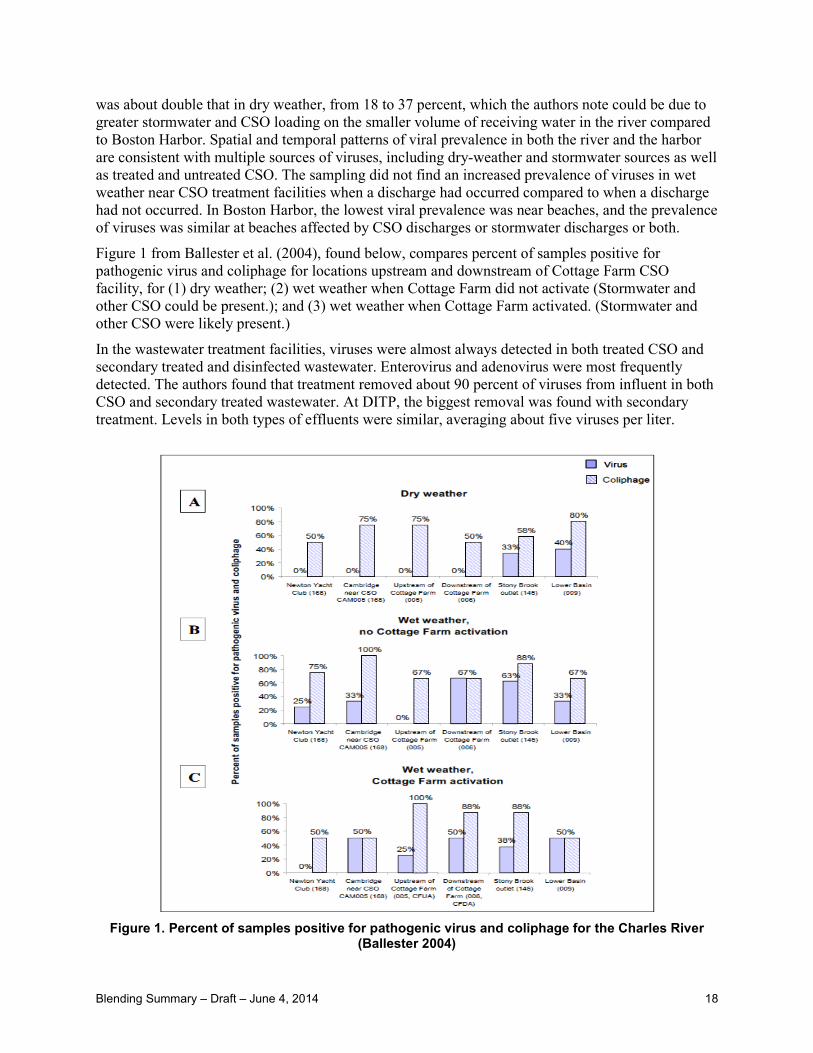
Figure 1 from Ballester et al. (2004), found below, compares percent of samples positive for pathogenic virus and coliphage for locations upstream and downstream of Cottage Farm CSO facility, for (1) dry weather; (2) wet weather when Cottage Farm did not activate (Stormwater and other CSO could be present.); and (3) wet weather when Cottage Farm activated. (Stormwater and other CSO were likely present.)
In the wastewater treatment facilities, viruses were almost always detected in both treated CSO and secondary treated and disinfected wastewater. Enterovirus and adenovirus were most frequently detected. The authors found that treatment removed about 90 percent of viruses from influent in both CSO and secondary treated wastewater. At DITP, the biggest removal was found with secondary treatment. Levels in both types of effluents were similar, averaging about five viruses per liter.
Figure 1. Percent of samples positive for pathogenic virus and coliphage for the Charles River
(Ballester 2004)
Blending Summary – Draft – June 4, 2014 18
IMPLACTS OF TREATED WASTEWATER ON SHELLFISH (GOBLICK ET AL. 2011; GOBLICK ET AL. 2013; MCCOUBREY 2014; USFDA 2010) Consuming contaminated shellfish can pose a human health risk from discharge of wastewater into waters near shellfish-growing areas. Molluscan bivalve species (oysters, mussels and clams) have a very high food safety risk profile because of their filter feeding systems and because shellfish are often eaten raw. Enteric viruses can persist in estuarine and marine waters and within shellfish for up to several months. If shellfish are consumed from harvest areas contaminated with human or animal wastes there is a strong likelihood of human illness. The U.S. Food and Drug Administration (FDA) recommends a minimum of 1,000:1 dilution of estuarine water to treated (not defined but assumed to be secondary treatment with disinfection) wastewater effluent when authorities establish conditionally approved and restricted shellfish-growing area classifications adjacent to WWTP discharges. FDA is undertaking studies to determine whether its 1,000:1 dilution of effluent recommendation is sufficient to maintain the safety of molluscan shellfish.
FDA performed a dye study to investigate the impacts to shellfish of treated wastewater effluent from a large WWTP that discharges effluent after secondary treatment with disinfection to Mobile Bay in Alabama (Goblick et al. 2011, 2013). They detected norovirus genogroup II in oysters as far as 5.74 kilometers from the discharge, near the 1,000:1 dilution line. They also found that levels of indicator microorganisms and viral pathogens in the shellfish inversely correlated with increased dilutions of the wastewater effluent. They could not conclude from this study whether the 1,000:1 dilution recommendation is adequate for the protection of public health.
FDA also performed a study of effluent from the Yarmouth WWTP, which discharges to the Royal River and Cousins River. Wastewater is disinfected year-round with sodium hypochlorite in three chlorine contact tanks and dechlorinated using sodium bisulfite. Researchers placed five oyster cages at various distances along the path of the effluent plume from the WWTP from May 20, 2010, to June 2, 2010, giving the oysters 2 weeks exposure to the WWTP effluent. They injected dye over half a tidal cycle (12.4 hours) and it remained in the Royal River system for at least 3 days. They analyzed the oysters for fecal coliform, E. coli, male-specific coliphage, and norovirus genogroups I and II. Spinney Creek Shellfish, Inc., also collected soft-shell clams during the study period and tested for the same parameters with the exception of E. coli. Results showed many low or non-detect levels of the parameters tested in the final effluent and the oysters, but they found significant levels of male-specific coliphage in the soft-shell clams near the sentinel stations. The clams were exposed to a significant rainfall event and higher WWTP flows the week before the study period, which allowed more time to accumulate these pathogens, while the weather was unusually dry and warm during the 2-week study period. The authors concluded that the Yarmouth WWTP was efficient at removing fecal coliform and E. coli under all types of flow conditions. It is efficient at removing male-specific coliphage under low-flow conditions, but high levels are detected during higher flows during wet weather. In addition, male-specific coliphage in clams seems to be dependent on season and temperature and decrease significantly in the summer.
BALLESTER 2005 Ballester (2005) cited several studies on HRC in a memo to Ed Locke of WASA. The original references have not been verified because they were not fully cited in the memo, but the information from the memo is summarized here. All the studies cited showed good removal of fecal coliforms using Actiflo® systems. However, Ballester (2005) does not specify whether the systems were tested during wet weather in these studies, so it is assumed it was during dry weather and normal operating conditions. In an Actiflo® pilot study in Port Clinton, Ohio, the Actiflo® effluent fecal coliform levels were found to be only 20–30 percent of the secondary effluent produced at the plant. The Actiflo®
Blending Summary – Draft – June 4, 2014 19
pilot effluent levels ranged from 10,000 to 50,000 fecal coliforms per 100 mL as compared to 40,000 to 340,000 per 100 mL for the secondary effluent (Radick 2001, cited in Ballester 2005), approximately 1 log lower than the secondary effluent. Pilot studies of the Actiflo® process in Cincinnati, Ohio, produced effluent with 4 to 48 percent UV transmittance and had up to 98 percent removal of fecal coliforms (Pitt 2000; Radick 2001, cited in Ballester 2005). A pilot study at Greenville Utilities in Greenville, North Carolina, on primary wastewater with Actiflo® found that 90 to 99 percent of fecal coliforms were removed and start up runs had 95 percent of fecal coliforms removed. A 6-month pilot study in Mexico City, Mexico, on primary wastewater with Actiflo® found that 96 percent of Helminth eggs and 83 percent of fecal coliforms were removed prior to disinfection.
Toxics Generally, metals and synthetic organic chemicals are the toxic substances present in CSO and sanitary sewer overflow (SSO) discharges that can cause human health impacts. Chronic health effects might be seen after prolonged periods of ingestion or consumption of water, fish, and shellfish contaminated by toxics (USEPA 2004). The following might be of most concern to public health: lead, mercury, copper, zinc, arsenic, polycyclic aromatic hydrocarbons, polychlorinated bipheyls, and pesticides. Although the occurrence and concentration of specific toxics in CSOs and SSOs vary considerably from community to community and from event to event depending on site-specific conditions, USEPA (2004) noted that the Agency has found no evidence of human health impacts due to toxics in CSO and SSO discharges. There was no information on toxics in the literature related to blending; however, the level of toxics in blended effluent is expected to depend on factors such as the concentration of toxics in the plant effluent, the type of treatment, industrial discharges, improper drain disposal of chemicals, and urban runoff.
Pharmaceuticals and Personal Care Products (PPCPs) Other pollutants from wastewater effluent that are a concern to human health include pharmaceuticals and personal care products (PPCPs). PPCPs include, but are not limited to, prescription pharmaceuticals, over-the-counter medications, naturally occurring compounds, and compounds used in consumables for human health and safety. According to the National Association of Clean Water Agencies (NACWA), the most common route by which these compounds enter the environment is via treated and untreated wastewater. Carballa et al. (2004) noted that a major factor influencing the efficiency of removing PPCPs is their ability to interact with solid particles. Therefore, compounds with low adsorption coefficients tend to remain in the aqueous phase, which allows mobility through a sewage treatment plant and the receiving environment (Hirsh et al. 1996, cited in Carballa et al. 2004). Although less is known about the impacts of substances to human health, and there are currently no federal regulations limiting the levels of pharmaceuticals in wastewater or drinking water, EPA has added some pharmaceuticals to the most recent contaminant candidate list.
There was no information found in the literature for PPCPs in blended effluent, but there are studies that examine the fate and transport of PPCPs through typical wastewater treatment. NACWA (n.d.) notes that a critical solids retention time is important for removal of pharmaceuticals in AS and biological nutrient removal processes is maintaining to promote the growth of a more diverse biological community that is probably able to degrade compounds more efficiently. According to Oppenheimer and Stephenson (2006, cited in NACWA, n.d.), biological processes do a good job at removing caffeine, ibuprofen, oxybenzone, chloroxylenol, methylparaben, benzyl salicylate, 3-phenylpropionate, butylbenzyl phthalate, and octylmethoxycinnamate. They also found that galaxolide; tris (2-carboxyethyl) phosphine hydrochloride; and N,N-diethly-3-methylbenzamide
Blending Summary – Draft – June 4, 2014 20

(DEET) are not well removed given the same treatment. WERF (2008) found that galaxolide was found frequently in wastewater and had poor removal. WERF (2008) also found that butylated hydroxyanisole, DEET, and musk ketone occurred an intermediate amount in wastewater and had poor removal while triclosan and benzophenone occurred frequently and had moderate removal. Carballa et al. (2004) found that primary treatment only partially removed fragrances (30–50 percent) and 17β -estradiol (20 percent).
Conventional Parameters POTWs monitor wastewater effluent for a variety of conventional parameters, including BOD and TSS. These parameters don’t necessarily pose a risk to human health themselves, but they can indicate how well the water is being treated. Some of the literature reviewed examined levels of these parameters in blended effluent and the results are highlighted below. None of the literature reviewed concluded that conventional parameters, including TSS and BOD, were high enough from blended effluent to be a concern.
RUKOVETS AND MITCHELL (2010) This study evaluated BOD5 and TSS in wet-weather blending effluent compared to dry-weather effluent. In two of the three WWTPs removal of TSS and BOD was between 71 and 89 percent for wet-weather blended effluent compared to 88-99 percent removal during dry weather. Table 7 shows the results.
Table 7. Comparison of BOD5 and TSS in wet-weather blended effluent and dry-weather effluent BOD5 (mg/L) BOD5 (% removal)
Wet-weather blending effluent Dry-weather effluent Wet-weather
blending effluent Dry-weather effluent
WWTP 1 24 15 77 92
WWTP 2 22 13 81 88
WWTP 3 37 9 45 93 TSS (mg/L) TSS (% removal)
Wet-weather blending effluent Dry-weather effluent Wet-weather
blending effluent Dry-weather effluent
WWTP 1 29 12 71 89
WWTP 2 20 2 89 99
WWTP 3 56 8 17 93 Note: During sampling a major upgrade was performed at WWTP 3, likely adversely affecting treatment quality. These results should be used with caution. GRAY ET AL. (2009) This study also examined BOD5, TSS, VOCs, and particle concentrations in wet-weather blended effluent compared to dry-weather effluent. Although values were higher in the blended effluent for all parameters but VOCs, they were still below permit limits.
BLACK & VEATCH (2009 AND 2014) From 2007–2009 the City of Toledo evaluated the performance of their HRC system in removing TSS, CBOD, TKN, ammonia, and TP. The wet-weather treatment facilities produced effluent of comparable quality to that of secondary treatment for TSS and TP, plus sufficiently low
Blending Summary – Draft – June 4, 2014 21
concentrations of CBOD to comply with maximum allowable 7-day average NPDES Discharge Permit requirements. The wet-weather treatment effluent CBOD (monitoring station 603) was less than the 40 mg/L 7-day average limit required by the BVWWTP NPDES permit for all but one of the events. Wet-weather treatment effluent TSS was less than the 40 mg/L 7-day average limit required by the BVWWTP NPDES permit for all of the events. In addition, the city monitored TSS and BOD5 during two wet-weather events in 2011 and 2013 and did not find significant differences between effluent from the AS train and effluent of the HRC train. Attachment 4 includes additional details on these studies.
Susceptible Populations Several demographic groups face increased risk of exposure to the pollutants in CSOs and SSOs, and subsequently blending scenarios, because they are more likely to spend time in locations affected by such discharges. These groups include people recreating in CSO- and SSO-affected waters, subsistence fishers, shellfishers, and wastewater workers (USEPA 2004). Certain demographic groups, including pregnant women, children, individuals with compromised immune systems, and the elderly, might be at greater risk than the general population for serious illness or a fatal outcome resulting from exposure to the types of pollutants present in CSOs and SSOs. Also, tourists and travelers might be more prone to waterborne illnesses than local residents. EPA research has found that when exposed to pathogens found in local sewage, local residents have been shown to develop fewer symptoms than nonresidents or visitors (USEPA 1983, cited in USEPA 2004).
EPA’s 2012 Recreational Water Quality Criteria (RWQC) Public health agencies have long used fecal indicator bacteria (FIB) to identify potential for illness resulting from recreational activities in surface waters contaminated by fecal pollution. EPA based its 1986 criteria for recreational marine and fresh waters on observed illness levels in swimmers and corresponding levels of bacterial indicators of fecal contamination, specifically enterococci and E. coli for fresh water and enterococci for marine water. Although most strains of FIB are not pathogenic, they demonstrate characteristics that make them good indicators of fecal contamination (i.e., often of fecal origin and simple methods of detection) and thus, indirectly indicate the potential presence of fecal pathogens capable of causing GI illnesses.
Enterococci (in both marine and fresh water) and E. coli (in freshwater) have consistently performed well as indicators of illness in sewage-contaminated waters during epidemiological studies (Prüss 1998; Wade et al. 2003; Zmirou et al. 2003, cited in USEPA 2012). Two recent epidemiological studies also demonstrate the utility of E. coli as an indicator as recommended in the 1986 criteria (Marion et al. 2010; Wiedenmann 2006, cited in USEPA 2012), thus EPA continues to recommend these indicator bacteria in the Agency’s 2012 RWQC.
Results from EPA’s National Epidemiological and Environmental Assessment of Recreational (NEEAR) study and previous epidemiological studies indicate that criteria based on protecting the public from gastrointestinal illness via the use of FIB will prevent most types of recreational waterborne illnesses. In general, these other illnesses occur at a lower rate than gastrointestinal illness (as defined by any widely accepted definition) (Fleisher et al. 1998; Haile et al. 1999; McBride et al. 1998; Wade et al. 2008, cited in USEPA 2012).
Some studies question whether EPA’s RWQC adequately protect against certain pathogens of concern, including viruses, in waters that receive wastewater effluent. For example, Ballester et al. (2004) note that coliphages have potential for use as a tracer for fecal contamination from multiple sources—though not exclusively human sources. They are similar in genetic make-up and size as norovirus and have been used as viral surragates by many researchers (USFDA 2010). In addition,
Blending Summary – Draft – June 4, 2014 22
they can multiply in wastewater (while the infected coliform bacteria are still alive) and persist in the environment long after the coliform bacteria have died off. Coliphages can function as a highly conservative and sensitive indicator of the presence of fecal contamination. According to Goblick et al. (2013), FDA CFSAN engineers have become increasingly concerned about the breakthrough of male-specific coliphage in wastewater effluent when flow rates increase and they use male-specific coliphage as an indicator of viral contamination for the same reasons listed by Ballester et al. (2004) and USFDA (2010).
References AECOM. 2013. City of Akron WPCS BIOACTIFLO™ Wet Weather Treatment System Pilot Study
Final Report.
Ballester, N.A., A.C. Rex, and K.A. Coughlin. 2004. Study of anthropogenic viruses in Boston Harbor, Charles River, Cottage Farm CSO Treatment Facility and Deer Island Treatment Plant: 1995-2003. Boston, Massachusetts, Water Resources Authority. Report Enquad 2004-15.
Ballester, N.A. 2005. Memo from Ballester to Ed Lock on anticipated pathogen reduction at Blue Plains after enhanced clarification.
Black & Veatch. 2009. Ballasted Flocculation Performance Testing 2-Year Final Report. Prepared for City of Toledo – Bayview Wastewater Treatment Plant. Black & Veatch Project Nos. 132633/161731/162478.
Black & Veatch. 2014. Toledo Waterways Initiative: Pathogen Study, 2013 Annual Report.
Blatchley, E.R., W.L. Gong, J. Rose, D.E. Huffman, M. Otaki, and J.T. Lisle. 2005. Effects of Wastewater Disinfection on Human Health. Water Environment Research Foundation, Alexandria, VA, and IWA Publishing, London, UK.
Carballa, M., F. Omil, J.M. Lema, M. Llompart, C. Garcia-Jares, I. Rodriguez, M. Gomez, and T. Ternes. 2004. Behavior of pharmaceuticals, cosmetics and hormones in a sewage treatment plant. Water Research 38:2918–2926.
Fitzpatrick, J., H. Andrews, A. Bahar, L. Jaworski, S. Tarallo, and D. Wagner. 2010. A Case for Keeping High-Rate Auxiliary Treatment Facilities in the Secondary Treatment Picture. Presented at the 2010 Water Environment Federation Technical Exhibition and Conference. Water Environment Federation, Alexandria, VA.
Fitzpatrick, J., J. Broz1, S. Eisner, B. George, G. Hunter, T. Lu, G. Robinson, and A. Shields. 2013. Decades of Pathogen Protection with Auxiliary High-Rate Treatment Technologies.
Fleisher, J.M., D. Kay, M.D. Wyer, and A.F. Godfree. 1998. Estimates of the severity of illnesses associated with bathing in marine recreational waters contaminated with domestic sewage. International Journal of Epidemiology 27(4): 722–726.
Goblick, G.N., J.M. Anbarchian, J. Woods, W. Burkhardt, III, and K. Calci. 2011. Evaluating the dilution of wastewater treatment plant effluent and viral impacts on shellfish growing areas in Mobile Bay, Alabama. Journal of Shellfish Research 30:3(1–9).
Goblick, G. et al. 2013. Hydrographic Dye Studies – Determining Pollution Impacts on Shellfish Growing Areas. Power Point Presentation.
Blending Summary – Draft – June 4, 2014 23
Gray, D.M., Y. Shang, J.M. Hake, V.P. De Lange, M.H. Chien, E.R. Gardner, J. Konnan, and S. Grinbergs. 2009. Characterizing the Quality of Effluent and Other Contributory Sources during Peak Wet Weather Events. WERF 03-CTS-12PP/PPa. Water Environment Research Foundation, Alexandria, VA, and IWA Publishing, London, UK.
Haile, R.W., J.S. Witte, M. Gold, R. Cressey, C. McGee, R.C. Millikan, A. Glasser. N. Harawa C. Ervin, P. Harmon, J. Harper, J. Dermand, J. Alamillo, K. Barrett, M. Nides, and G.Y. Wang. 1999. The health effects of swimming in ocean water contaminated by storm drain runoff. Epidemiology 10(4): 355–363.
Heath, G., P. Gsellman, G. Hanna, D. Starkey. n.d. Pilot Testing of BIOACTIFLO™ for Wet Weather Treatment at the Akron, Ohio Water Reclamation Facility.
Hirsch R, T.A. Ternes., K. Haberer, and K.L. Kratz. Determination of betablockers and b-sympathomimetics in the aquatic environment. Vom Wasser 1996; 87:263–74.
King County DNRP (King County Department of Natural Resources and Parks). 2012. 2012 King County Long-term Combined Sewer Overflow Control Plan Amendment, Technical Memo TM700. Seattle, WA.
Marion, J.W., J. Lee, S. Lemeshow, and T.J. Buckley. 2010. Association of gastrointestinal illness and recreational water exposure at an inland U.S. beach. Water Research 44(16): 4796–4804.
McBride, G.B., C.E. Salmond, D.R. Bandaranayake, S.J. Turner, G.D. Lewis, and D.G. Till. 1998. Health effects of marine bathing in New Zealand. International Journal of Environmental Health Research 8(3): 173–189.
Mccoubrey, D.J, U.S. Food and Drug Administration Center for Food Safety and Applied Nutrition. 2014, April 29. Personal communication.
NRDC (Natural Resources Defense Coucil). 2004. Swimming in Sewage. Natural Resources Defense Council.
Oppenheimer, J., and R. Stephenson. 2006. Time out – Longer retention time can remove some PPCPs. In Water Environment and Technology, pp. 77-82. Water Environment Federation, Alexandria, VA.
Pitt, R. 2000. Designs for the Future and Retrofitting Existing Facilities for Wet Weather Flows. Module 11. Tech Univ of Darmstadt, Germany.
Prüss, A. 1998. Review of epidemiological studies on health effects from exposure to recreational water. International Journal of Epidemiology 27(1): 1–9.
Radick, K.A., and M.A. Morgan. 2001. Ballasted Flocculation-A Technology for Long Term CSO Control. Presentation at Water Environment Federation Technical Exhibition and Conference 2001.
Rose, J. 2004. Letter to Nancy Stoner of the Natural Resources Defense Council on Risk Analysis of Milwaukee Blending Data.
Rukovets, R.B., and B.J. Mitchell. 2010. Impact of Wet-Weather Peak Flow Blending on Disinfection and Treatment: A Case Study at Three Wastewater Treatment Plants. EPA/600/R-10/003. U.S. Environmental Protection Agency, Office of Research and Development, National Risk Management Research Laboratory, Water Supply and Water Resources Division, Cincinnati, OH.
Blending Summary – Draft – June 4, 2014 24
USEPA (U.S. Environmental Protection Agency). 1983. Health Effects Criteria for Marine Recreational Waters. EPA 600-1-80-031. U.S. Environmental Protection Agency, Office of Research and Development. Washington, DC.
USEPA (U.S. Environmental Protection Agency). 2004. Chapter 6—Human Health Impacts and Control of CSOs and SSOs in Report to Congress. EPA 833-R-04-001. U.S. Environmental Protection Agency, Office of Water, Washington, DC.
USEPA (U.S. Environmental Protection Agency). 2007. Wastewater Management Fact Sheet, In-Plant Wet Weather Peak Flow Management. EPA 832-F-07-016. U.S. Environmental Protection Agency, Office of Water, Washington DC.
USEPA (U.S. Environmental Protection Agency). 2012. Recreational Water Quality Criteria. EPA 820-F-12-058. U.S. Environmental Protection Agency, Office of Water, Washington DC.
USEPA (U.S. Environmental Protection Agency). 2013. Emerging Technologies for Wastewater Treatment and In-Plant Wet Weather Management. EPA 832-R-12-011. Prepared for U.S. Environmental Protection Agency, Office of Wastewater Management, Washington, DC, by Tetra Tech, Inc., Fairfax, VA.
USFDA (U.S. Food and Drug Administration). 2010. Hydrographic Study of Wastewater Treatment Plant Effluent in the Royal and Cousins Rivers of Yarmouth, Maine. Report of Findings from the May 24 – 26, 2010 Study Period. U.S. Food and Drug Administration, Center for Food Safety and Applied Nutrition, Office of Food Safety, Shellfish and Aquaculture Policy Branch, Field Engineering and Data Analysis Team. College Park, MD.
Wade, T.J., N. Pai, J.N.S. Eisenberg, and J.M. Colford, Jr. 2003. Do U.S. Environmental Protection Agency water quality guidelines for recreational waters prevent gastrointestinal illness? A systematic review and meta-analysis. Environmental Health Perspectives 111(8): 1102–1109.
Wade, T.J., R.L. Calderon, K.P. Brenner, E. Sams, M. Beach, R. Haugland, L. Wymer, and A.P. Dufour. 2008. High sensitivity of children to swimming-associated gastrointestinal illness – Results using a rapid assay of recreational water quality. Epidemiology 19(3): 375–383.
Wagner, D., M. Lawless, M. Hegeman, T. Wilson, R. Whaley, A. Ensz, A. Shields, B. Sturm. n.d. A Decade of Operational Experience Using Ballasted Flocculation: City of Lawrence Wet Weather Flow Management and Performance.
WEF (Water Environment Federation). 2013. Guide for Municipal Wet Weather Strategies. Water Environment Federation, Alexandria, VA.
WERF (Water Environment Research Foundation). 2002. Best Practices for the Treatment of Wet Weather and Wastewater Flows. 00-CTS-6. Prepared for the Water Environment Research Foundation, Alexandria, VA, by Camp Dresser and McKee, Inc., Edison, NJ.
WERF (Water Environment Research Foundation). 2008. Fate of Pharmaceuticals and Personal Care Products in Wastewater Treatment. Executive Summary. Water Environment Research Foundation. Alexandria, VA.
Wiedenmann, A., P. Krüger, K. Dietz, J.M. López-Pila, R. Szewzyk, and K. Botzenhart. 2006. A randomized controlled trial assessing infectious disease risks from bathing in fresh recreational waters in relation to the concentration of Escherichia coli, intestinal enterococci, Clostridium perfringens, and somatic coliphages. Environmental Health Perspectives 114(2): 228–236.
Blending Summary – Draft – June 4, 2014 25

Zmirou, N., L. Pena, M. Ledrans, and A. Leterte. 2003. Risks Associated with the Microbiological Quality of Bodies of Fresh and Marine Water Used for Recreational Purposes: Summary Estimates Based on Published Epidemiological Studies. Archives of Environmental Health 53, 703-711.
Additional Literature Reviewed Anderson, P.D. 2008. Technical Brief: Trace Organic Compounds and Implications for Wastewater
Treatment. Water Environment Research Foundation, Alexandria, VA, and IWA Publishing, London, UK.
Drewes, J.E., E. Dickenson, and S. Snyder. 2009. Contributions of Household Chemicals to Sewage and Their Relevance to Municipal Wastewater Systems and the Environment/Water. Environment Research Foundation, Alexandria, VA, IWA Publishing, London, UK, and WateReuse Foundation, Alexandria, VA.
Fitzpatrick, J., M. Long, D. Wagner, C. Middlebrough. 2008. Meeting Secondary Effluent Standards at Peaking Factors of Five and Higher. In Proceedings from the Water Environment Federation 81st Annual Technical Exhibition and Conference, Chicago, IL.
Lu, T., B. George, M. Lodor, D. Metz, J. Parrott, J. Fitzpatrick, G. Hunter, V. Kapoor, and D. Wendell. 2013. What is the right biomarker for water quality monitoring? Water Environment & Technology 25(10): 52–55.
USFDA (U.S. Food and Drug Administration). 2013. Proposal for Task Force Consideration at the Interstate Shellfish Sanitation Conference 2013 Biennial Meeting. U.S. Food and Drug Administration, Center for Food Safety and Applied Nutrition, College Park, MD.
Blending Summary – Draft – June 4, 2014 26

Attachment 1: Examples of Waterborne Pathogens (NRDC 2004)
Blending Summary – Draft – June 4, 2014 27
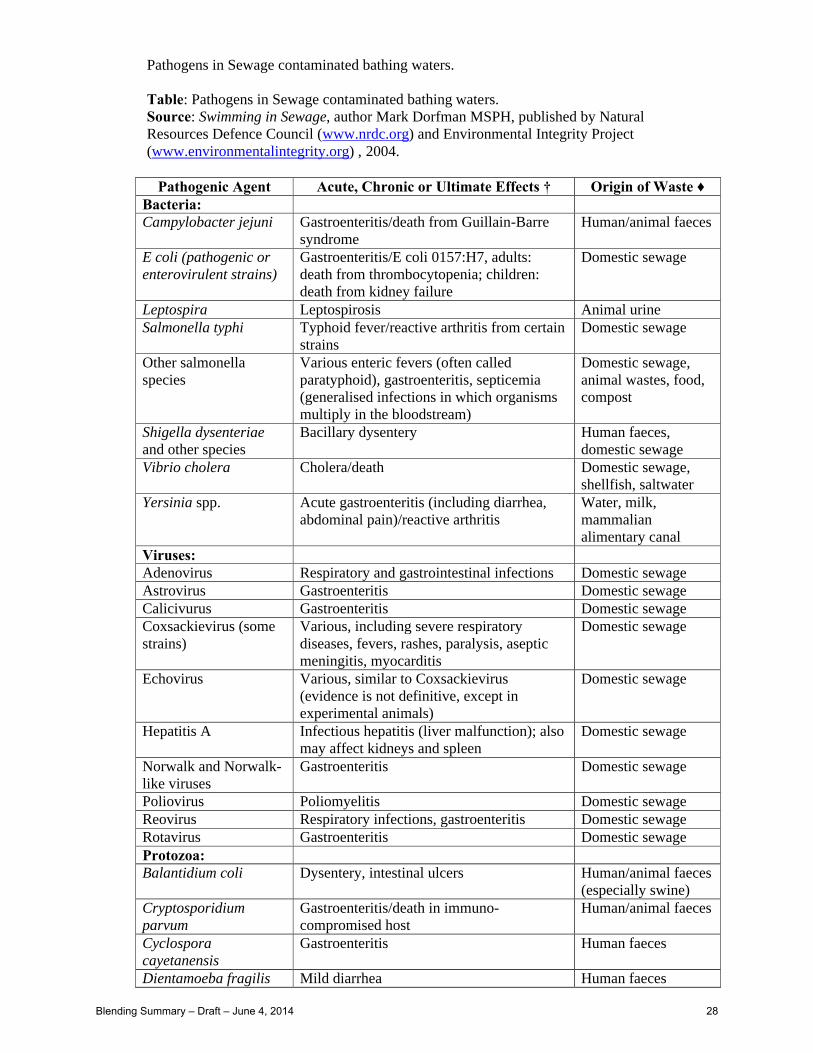
Pathogens in Sewage contaminated bathing waters.
Table: Pathogens in Sewage contaminated bathing waters.Source: Swimming in Sewage, author Mark Dorfman MSPH, published by Natural Resources Defence Council (www.nrdc.org) and Environmental Integrity Project (www.environmentalintegrity.org) , 2004.
Pathogenic Agent Acute, Chronic or Ultimate Effects † Origin of Waste ♦Bacteria:Campylobacter jejuni Gastroenteritis/death from Guillain-Barre
syndromeHuman/animal faeces
E coli (pathogenic or enterovirulent strains)
Gastroenteritis/E coli 0157:H7, adults: death from thrombocytopenia; children: death from kidney failure
Domestic sewage
Leptospira Leptospirosis Animal urineSalmonella typhi Typhoid fever/reactive arthritis from certain
strainsDomestic sewage
Other salmonella species
Various enteric fevers (often called paratyphoid), gastroenteritis, septicemia (generalised infections in which organisms multiply in the bloodstream)
Domestic sewage, animal wastes, food, compost
Shigella dysenteriaeand other species
Bacillary dysentery Human faeces, domestic sewage
Vibrio cholera Cholera/death Domestic sewage, shellfish, saltwater
Yersinia spp. Acute gastroenteritis (including diarrhea, abdominal pain)/reactive arthritis
Water, milk, mammalian alimentary canal
Viruses:Adenovirus Respiratory and gastrointestinal infections Domestic sewageAstrovirus Gastroenteritis Domestic sewageCalicivurus Gastroenteritis Domestic sewageCoxsackievirus (some strains)
Various, including severe respiratory diseases, fevers, rashes, paralysis, aseptic meningitis, myocarditis
Domestic sewage
Echovirus Various, similar to Coxsackievirus (evidence is not definitive, except in experimental animals)
Domestic sewage
Hepatitis A Infectious hepatitis (liver malfunction); also may affect kidneys and spleen
Domestic sewage
Norwalk and Norwalk-like viruses
Gastroenteritis Domestic sewage
Poliovirus Poliomyelitis Domestic sewageReovirus Respiratory infections, gastroenteritis Domestic sewageRotavirus Gastroenteritis Domestic sewageProtozoa:Balantidium coli Dysentery, intestinal ulcers Human/animal faeces
(especially swine)Cryptosporidium parvum
Gastroenteritis/death in immuno-compromised host
Human/animal faeces
Cyclospora cayetanensis
Gastroenteritis Human faeces
Dientamoeba fragilis Mild diarrhea Human faeces
Blending Summary – Draft – June 4, 2014 28
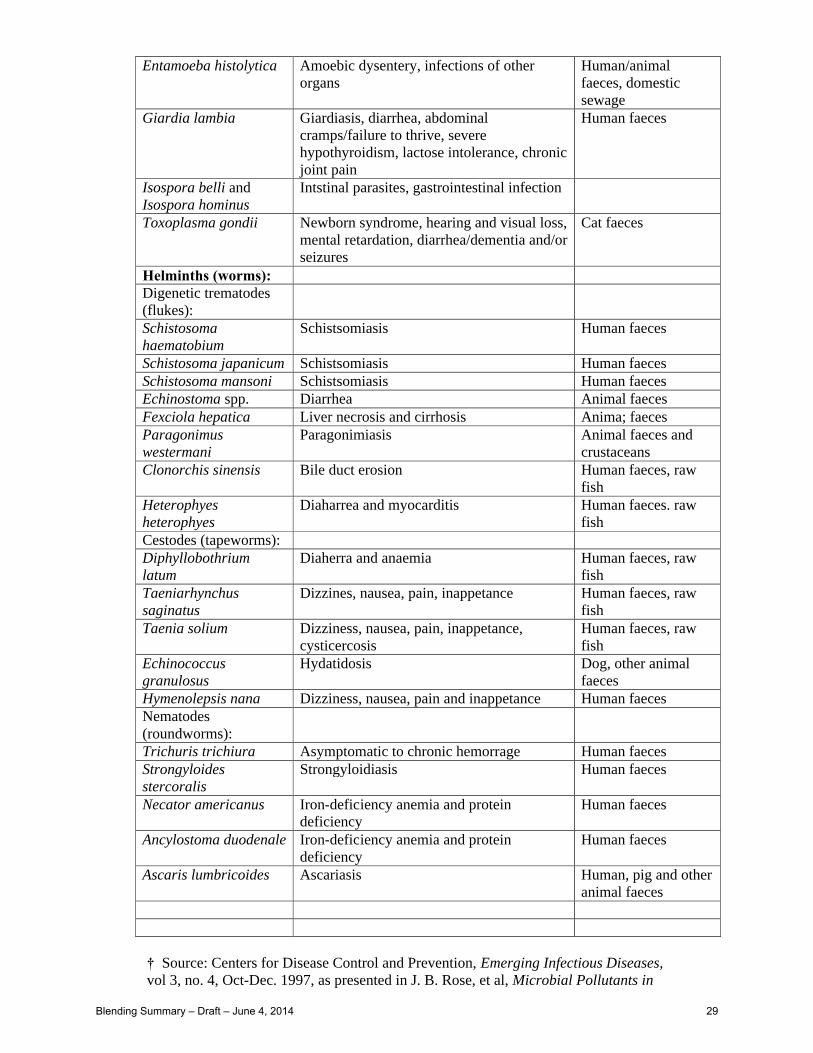
Entamoeba histolytica Amoebic dysentery, infections of other organs
Human/animal faeces, domestic sewage
Giardia lambia Giardiasis, diarrhea, abdominal cramps/failure to thrive, severe hypothyroidism, lactose intolerance, chronic joint pain
Human faeces
Isospora belli and Isospora hominus
Intstinal parasites, gastrointestinal infection
Toxoplasma gondii Newborn syndrome, hearing and visual loss, mental retardation, diarrhea/dementia and/or seizures
Cat faeces
Helminths (worms):Digenetic trematodes (flukes):Schistosoma haematobium
Schistsomiasis Human faeces
Schistosoma japanicum Schistsomiasis Human faecesSchistosoma mansoni Schistsomiasis Human faeces Echinostoma spp. Diarrhea Animal faecesFexciola hepatica Liver necrosis and cirrhosis Anima; faecesParagonimus westermani
Paragonimiasis Animal faeces and crustaceans
Clonorchis sinensis Bile duct erosion Human faeces, raw fish
Heterophyes heterophyes
Diaharrea and myocarditis Human faeces. raw fish
Cestodes (tapeworms):Diphyllobothrium latum
Diaherra and anaemia Human faeces, raw fish
Taeniarhynchus saginatus
Dizzines, nausea, pain, inappetance Human faeces, raw fish
Taenia solium Dizziness, nausea, pain, inappetance, cysticercosis
Human faeces, raw fish
Echinococcus granulosus
Hydatidosis Dog, other animal faeces
Hymenolepsis nana Dizziness, nausea, pain and inappetance Human faecesNematodes (roundworms):Trichuris trichiura Asymptomatic to chronic hemorrage Human faecesStrongyloides stercoralis
Strongyloidiasis Human faeces
Necator americanus Iron-deficiency anemia and protein deficiency
Human faeces
Ancylostoma duodenale Iron-deficiency anemia and protein deficiency
Human faeces
Ascaris lumbricoides Ascariasis Human, pig and other animal faeces
† Source: Centers for Disease Control and Prevention, Emerging Infectious Diseases, vol 3, no. 4, Oct-Dec. 1997, as presented in J. B. Rose, et al, Microbial Pollutants in
Blending Summary – Draft – June 4, 2014 29

Our Nation’s Waters :Environmental and Public Health Issues, American society for Microbiology, Washington D. C. , 1999, p.8.
♦ Source: Katonak, R, and J. B. Rose, Public Health Risks Associated with Wastewater Blending, Michigan State University, East Lansing, November 17, 2003, pp30,39.
Blending Summary – Draft – June 4, 2014 30
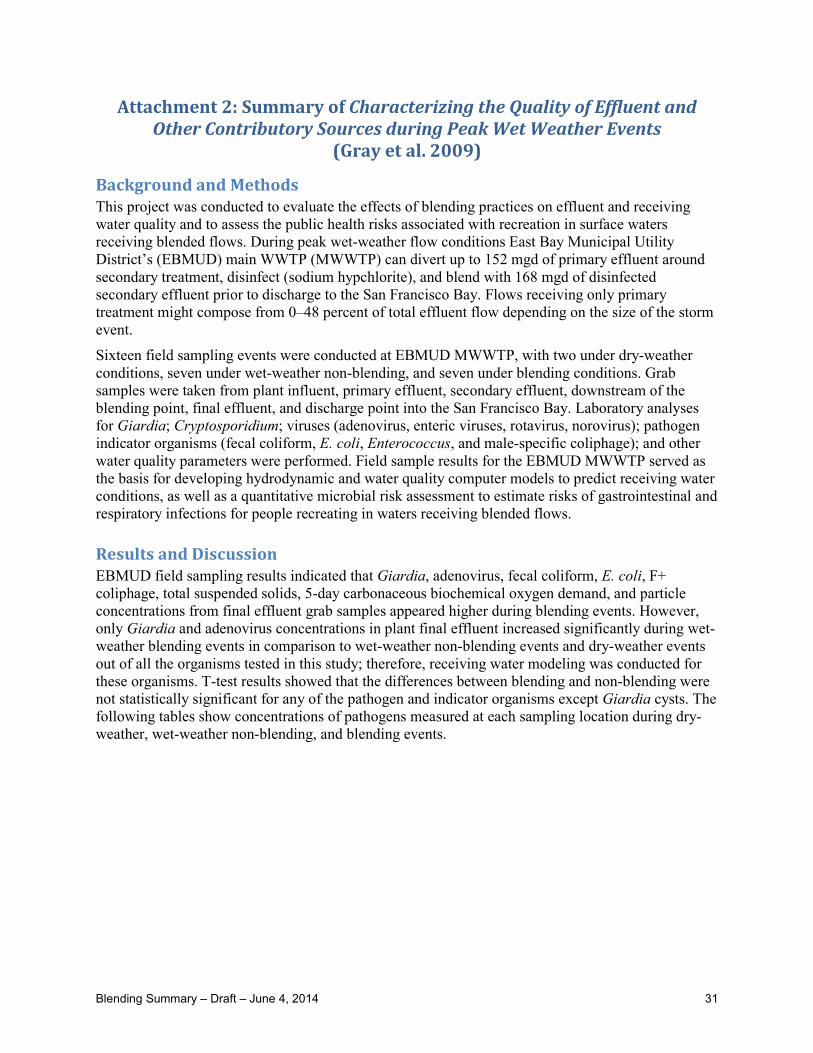
Attachment 2: Summary of Characterizing the Quality of Effluent and Other Contributory Sources during Peak Wet Weather Events
(Gray et al. 2009)
Background and Methods This project was conducted to evaluate the effects of blending practices on effluent and receiving water quality and to assess the public health risks associated with recreation in surface waters receiving blended flows. During peak wet-weather flow conditions East Bay Municipal Utility District’s (EBMUD) main WWTP (MWWTP) can divert up to 152 mgd of primary effluent around secondary treatment, disinfect (sodium hypchlorite), and blend with 168 mgd of disinfected secondary effluent prior to discharge to the San Francisco Bay. Flows receiving only primary treatment might compose from 0–48 percent of total effluent flow depending on the size of the storm event.
Sixteen field sampling events were conducted at EBMUD MWWTP, with two under dry-weather conditions, seven under wet-weather non-blending, and seven under blending conditions. Grab samples were taken from plant influent, primary effluent, secondary effluent, downstream of the blending point, final effluent, and discharge point into the San Francisco Bay. Laboratory analyses for Giardia; Cryptosporidium; viruses (adenovirus, enteric viruses, rotavirus, norovirus); pathogen indicator organisms (fecal coliform, E. coli, Enterococcus, and male-specific coliphage); and other water quality parameters were performed. Field sample results for the EBMUD MWWTP served as the basis for developing hydrodynamic and water quality computer models to predict receiving water conditions, as well as a quantitative microbial risk assessment to estimate risks of gastrointestinal and respiratory infections for people recreating in waters receiving blended flows.
Results and Discussion EBMUD field sampling results indicated that Giardia, adenovirus, fecal coliform, E. coli, F+ coliphage, total suspended solids, 5-day carbonaceous biochemical oxygen demand, and particle concentrations from final effluent grab samples appeared higher during blending events. However, only Giardia and adenovirus concentrations in plant final effluent increased significantly during wet-weather blending events in comparison to wet-weather non-blending events and dry-weather events out of all the organisms tested in this study; therefore, receiving water modeling was conducted for these organisms. T-test results showed that the differences between blending and non-blending were not statistically significant for any of the pathogen and indicator organisms except Giardia cysts. The following tables show concentrations of pathogens measured at each sampling location during dry-weather, wet-weather non-blending, and blending events.
Blending Summary – Draft – June 4, 2014 31
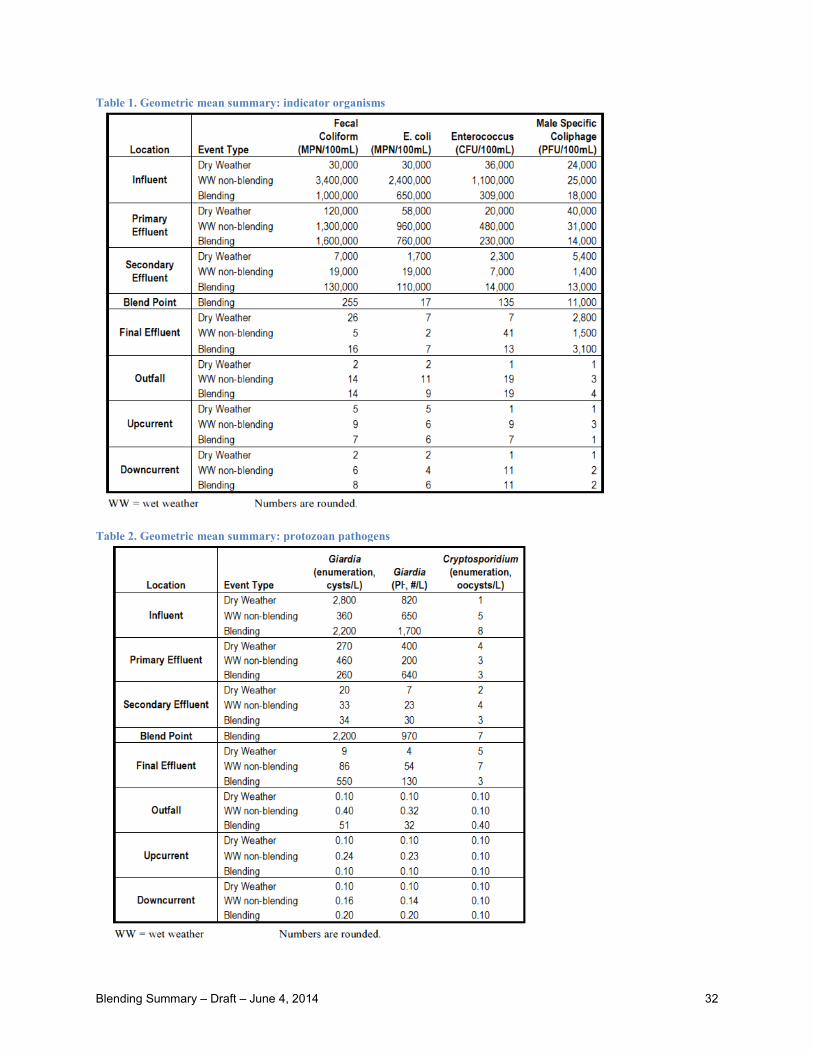
Table 1. Geometric mean summary: indicator organisms
Table 2. Geometric mean summary: protozoan pathogens
Blending Summary – Draft – June 4, 2014 32
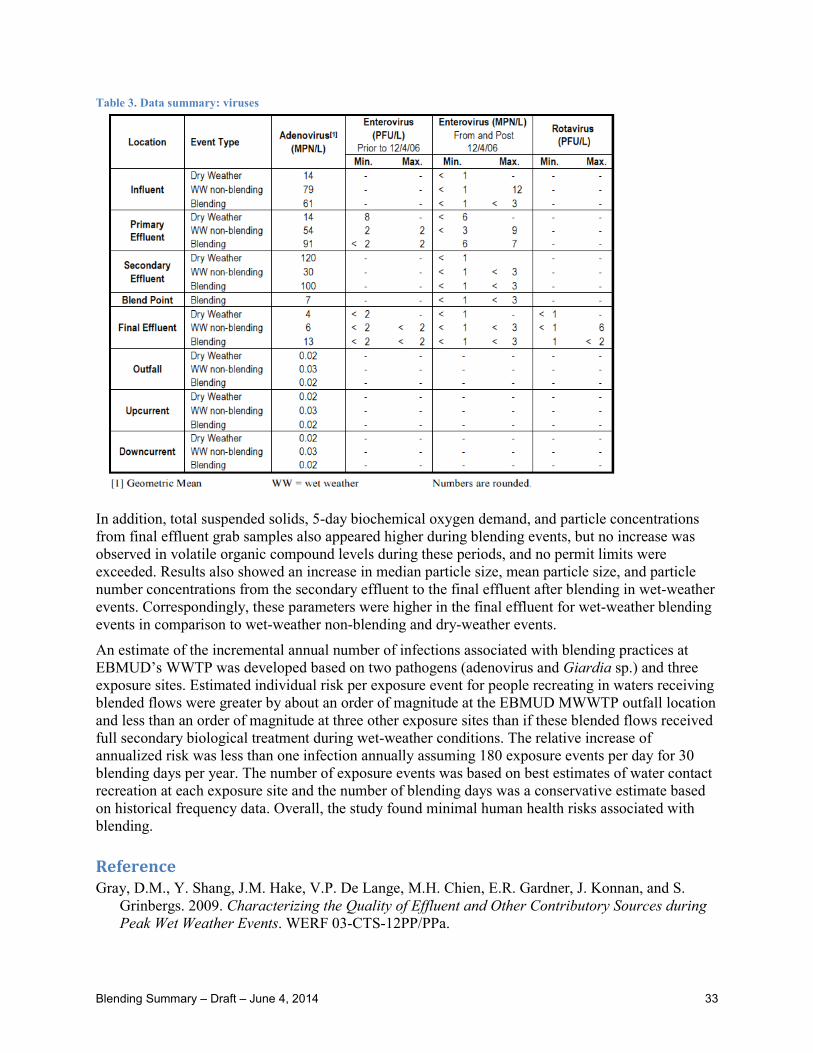
Table 3. Data summary: viruses
In addition, total suspended solids, 5-day biochemical oxygen demand, and particle concentrations from final effluent grab samples also appeared higher during blending events, but no increase was observed in volatile organic compound levels during these periods, and no permit limits were exceeded. Results also showed an increase in median particle size, mean particle size, and particle number concentrations from the secondary effluent to the final effluent after blending in wet-weather events. Correspondingly, these parameters were higher in the final effluent for wet-weather blending events in comparison to wet-weather non-blending and dry-weather events.
An estimate of the incremental annual number of infections associated with blending practices at EBMUD’s WWTP was developed based on two pathogens (adenovirus and Giardia sp.) and three exposure sites. Estimated individual risk per exposure event for people recreating in waters receiving blended flows were greater by about an order of magnitude at the EBMUD MWWTP outfall location and less than an order of magnitude at three other exposure sites than if these blended flows received full secondary biological treatment during wet-weather conditions. The relative increase of annualized risk was less than one infection annually assuming 180 exposure events per day for 30 blending days per year. The number of exposure events was based on best estimates of water contact recreation at each exposure site and the number of blending days was a conservative estimate based on historical frequency data. Overall, the study found minimal human health risks associated with blending.
Reference Gray, D.M., Y. Shang, J.M. Hake, V.P. De Lange, M.H. Chien, E.R. Gardner, J. Konnan, and S.
Grinbergs. 2009. Characterizing the Quality of Effluent and Other Contributory Sources during Peak Wet Weather Events. WERF 03-CTS-12PP/PPa.
Blending Summary – Draft – June 4, 2014 33
Attachment 3: Summary of Impact of Wet-Weather Peak Flow Blending on Disinfection and Treatment: A Case Study at Three Wastewater Treatment
Plants (Rukovets and Mitchell 2010)
Background Researchers evaluated the microbiological impact of blending primary effluent flows that are in excess of secondary treatment capacity with the secondary effluent before disinfection at large municipal wastewater treatment plants (WWTPs). This approach is commonly used by a number of municipal WWTPs within the Interstate Environmental Commission's (IEC) jurisdiction during wet weather to maximize the flow to the WWTP and reduce combined sewer overflow events. The study’s primary objective was to evaluate the effect of wet-weather blending on the concentration of fecal coliform and Enterococcus indicator bacteria, total residual chlorine, protozoa, and viruses in the WWTP final effluent.
Researchers monitored three full-scale New York City WWTPs functioning as usual during actual dry-weather non-blending and wet-weather blending operations. The three WWTPs receive most of their flow from combined sewer systems. The process includes coarse screening and degritting, primary treatment, secondary treatment, disinfection, and sludge treatment. During wet-weather flow, the process is mostly the same until the plant reaches the threshold of 1.5 times the design flow. Flows beyond this are diverted around secondary treatment and recombines (blends) with the secondary effluent for disinfection.
Results and Discussion The results showed that during blending, the sampled WWTPs remove, on average, between 97 and 99 percent of coliphage and enteric viruses; approximately 71 percent of Cryptosporidium; and between 40 and 88 percent of Giardia. The geometric mean for fecal coliform effluent concentrations during blending at the three WWTPs ranged from 520 to 19,000 MPN/100 mL and the corresponding geometric mean for Enterococcus effluent concentrations ranged from 870 to 17,000 MPN/100 mL. During blending, effluent biochemical oxygen demand (BOD) and total suspended solids (TSS) concentrations remained below 30 milligrams per liter (mg/L) (a monthly average permit limit for both parameters) at two out of three WWTPs. The third WWTP, that had results above 30 mg/L for both parameters, was undergoing a partial construction at the time of sampling.
The average of 5-day biochemical oxygen demand (BOD5) wet-weather blending effluent concentrations were 24 mg/L at WWTP 1 (values ranged from 9.5 to 37 mg/L), and 22 mg/L at WWTP 2 (values ranged from 9 to 30 mg/L). The average of TSS wet-weather blending effluent concentrations were 29 mg/L at WWTP 1 (values ranged from 22 to 33 mg/L) and 20 mg/L at WWTP 2 (values ranged from 13 to 26 mg/L). The average removal values for wet-weather blending samples collected during the study at WWTP 1 were 77 percent for BOD5 and 71 percent for TSS; and at WWTP 2 were 81 percent for BOD5 and 89 percent for TSS.
The dry-weather effluent concentrations for BOD5 were 15 mg/L at WWTP 1, 13 mg/L at WWTP 2, and 9 mg/L at WWTP 3. The dry-weather effluent concentrations for TSS were 12 mg/L at WWTP 1, 2 mg/L at WWTP 2, and 8 mg/L at WWTP 3. The average percent removal for dry-weather samples collected during the study was 92 percent for BOD5 and 89 percent for TSS at WWTP 1, 88 percent for BOD5 and 99 percent for TSS at WWTP 2, and 93 percent for BOD5 and 93 percent for TSS at WWTP 3. All of these dry-weather results exceeded the expected 85 percent removal.
Blending Summary – Draft – June 4, 2014 34

The project team also looked at the results of IEC's compliance monitoring inspections conducted at all three WWTPs over the previous 2 years. During that time, IEC carried out four inspections at each of the three WWTPs. Most of these inspections took place during dry weather, at which time both WWTP 1 and WWTP 2 were in compliance with their respective permit. Only one out of six hourly samples for fecal coliform at WWTP 3 (also collected during dry weather) was in violation during one of the inspections. However, when IEC inspected WWTP 1 on August 18, 2006, the WWTP began blending and five out of six hourly samples collected by IEC on the same day were above the permit limit, (i.e., > 16,000; 3,000; 5,000; > 16,000; 5,000) with geometric average of > 5,300 MPN/100 mL, consistent with wet-weather results of this study.
For fecal coliform and Enterococcus at WWTP 3 and for fecal coliform at WWTP 1, the difference between wet-weather blending and dry-weather effluent concentrations was between a half and one order of magnitude. Effluent fecal coliform and Enterococcus levels were three orders of magnitude higher during wet-weather blending vs. dry-weather for both parameters at WWTP 2 and for Enterococcus at WWTP 1. Table 1 shows the results. Table 1. Fecal coliform and Enterococcus concentrations WWTP Avg.
Flow (mgd)
Operating mode
Fecal coliform GM (MPN/100 mL) Enterococcus GM (MPN/100 mL) Influent Effluent Order of
magnitude reduction
Influent Effluent Order of magnitude reduction
1 239 Wet blending
4,200,000 4,900 103 890,000 17,000 102
122 Dry 19,000,000 890 104 470,000 20 104 2 125 Wet
blending 1,100,000 19,000 102 260,000 14,000 10
31 Dry 5,000,000 16 105 220,000 3 105 3 469 Wet
blending 1,600,000 520 103 280,000 870 103
239 Dry 5,600,000 31 105 1,700,000 120 104 Notes: mgd = million gallons per day.
Effluent values of Giardia spp. were one order of magnitude higher during wet-weather blending vs. dry-weather at both WWTP 1 and WWTP 2. The geometric mean of Giardia effluent results during wet weather were in the low triple digits, with 88 percent removal at WWTP 1 and with 40 percent removal at WWTP 2. Although no estimation of infectivity of Giardia was performed for this study, it is logical to assume that, similar to Cryptosporidium, a portion of remaining Giardia should be noninfectious.
Effluent concentrations for Cryptosporidium were higher during wet-weather blending at WWTP 1 compared to dry-weather. Results for wet weather were mostly in the single or low double digits with an average percent removal of 71 percent for WWTP 1. There were not enough detectable results to estimate average percent removal for WWTP 2. Table 2 shows results of the protozoa.
Blending Summary – Draft – June 4, 2014 35
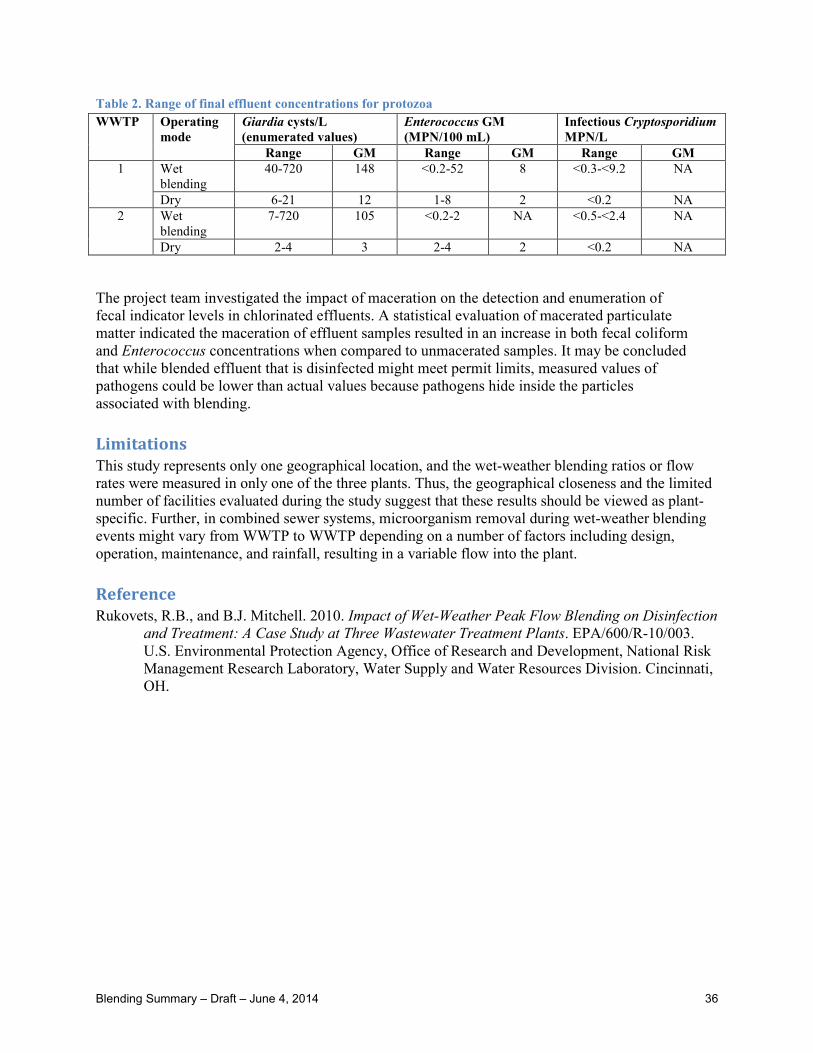
Table 2. Range of final effluent concentrations for protozoa WWTP Operating
mode Giardia cysts/L (enumerated values)
Enterococcus GM (MPN/100 mL)
Infectious Cryptosporidium MPN/L
Range GM Range GM Range GM 1 Wet
blending 40-720 148 <0.2-52 8 <0.3-<9.2 NA
Dry 6-21 12 1-8 2 <0.2 NA 2 Wet
blending 7-720 105 <0.2-2 NA <0.5-<2.4 NA
Dry 2-4 3 2-4 2 <0.2 NA
The project team investigated the impact of maceration on the detection and enumeration of fecal indicator levels in chlorinated effluents. A statistical evaluation of macerated particulate matter indicated the maceration of effluent samples resulted in an increase in both fecal coliform and Enterococcus concentrations when compared to unmacerated samples. It may be concluded that while blended effluent that is disinfected might meet permit limits, measured values of pathogens could be lower than actual values because pathogens hide inside the particles associated with blending.
Limitations This study represents only one geographical location, and the wet-weather blending ratios or flow rates were measured in only one of the three plants. Thus, the geographical closeness and the limited number of facilities evaluated during the study suggest that these results should be viewed as plant-specific. Further, in combined sewer systems, microorganism removal during wet-weather blending events might vary from WWTP to WWTP depending on a number of factors including design, operation, maintenance, and rainfall, resulting in a variable flow into the plant.
Reference Rukovets, R.B., and B.J. Mitchell. 2010. Impact of Wet-Weather Peak Flow Blending on Disinfection
and Treatment: A Case Study at Three Wastewater Treatment Plants. EPA/600/R-10/003. U.S. Environmental Protection Agency, Office of Research and Development, National Risk Management Research Laboratory, Water Supply and Water Resources Division. Cincinnati, OH.
Blending Summary – Draft – June 4, 2014 36

Attachment 4: Ballasted Flocculation—Case Studies on the Use of High-Rate Clarification Technologies
Ballasted flocculation, also known as high-rate clarification (HRC) is a physical-chemical treatment process that uses continuously recycled media and a variety of additives to improve the settling properties of suspended solids.1 Faster floc formation and decreased particle settling time allow clarification to occur up to 10 times faster than with conventional clarification, allowing treatment of flows at a significantly higher rate than traditional processes. Ballasted flocculation can be used as part of a traditional treatment train or as a parallel treatment train for peak flow reduction for combined sewer overflow (CSO) and sanitary sewer overflow treatment (USEPA 2005). HRC alone is limited by its inability to remove soluble biochemical oxygen demand (BOD) (Norton et al., n.d.; McKnight et al. 2009, cited in Norton et al., n.d.). Actiflo®, DensaDeg®, and BioActiflo® are three examples of patented HRC processes described in each section below, followed by studies conducted at facilities using these treatment technologies. This summary introduces the following studies:
Actiflo® treatment • City of Lawrence (Kansas) wet-weather flow management and performance study • Other studies cited by reviewed reports looking at the performance of Actiflo® treatments
DensaDeg® treatment • City of Toledo (Ohio) ballasted flocculation performance testing study (2007–2009) • Toledo Waterways (Ohio) initiative pathogen study (2011–2013)
BioActiflo® treatment • Knoxville (Tennessee) pilot study • Ackron (Ohio) pilot study
Actiflo® Process Krüger Inc., a Veolia Water Solutions & Technologies Company, developed the Actiflo® technology. The process is a high-rate chemical and physical clarification process that involves forming suspended solids onto a ballast particle (microsand) followed by lamellar settling. It is considered an established process for treating wet-weather flows, but can also be applied to primary and tertiary effluents. The process starts by adding a coagulant to destabilize suspended solids. The flow enters the coagulation tank for flash mixing to allow the coagulant to take effect, which then overflows into the injection tank where microsand is added. The microsand serves as a “seed” for floc formation, providing a large surface area for suspended solids to bond to, and is the key to Actiflo®. It allows solids to settle out more quickly, thereby requiring a smaller footprint than conventional clarification (USEPA 2013). Figure 1 shows a schematic of the Actiflo® process (Veolia Water Solutions & Technologies n.d.).
1 Also called a Ballasted High-Rate Clarification (BHRC) process.
Blending Summary – Draft – June 4, 2014 37
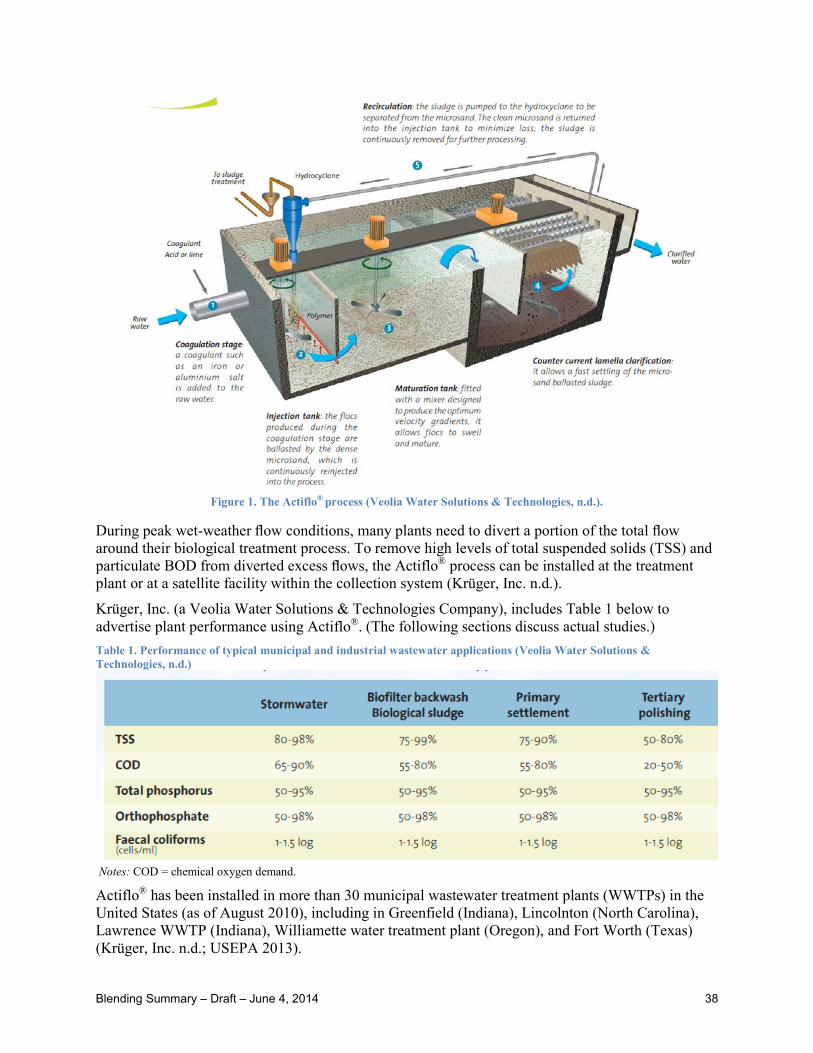
Figure 1. The Actiflo process (Veolia Water Solutions & Technologies, n.d.). ®
During peak wet-weather flow conditions, many plants need to divert a portion of the total flow around their biological treatment process. To remove high levels of total suspended solids (TSS) and particulate BOD from diverted excess flows, the Actiflo® process can be installed at the treatment plant or at a satellite facility within the collection system (Krüger, Inc. n.d.).
Krüger, Inc. (a Veolia Water Solutions & Technologies Company), includes Table 1 below to advertise plant performance using Actiflo®. (The following sections discuss actual studies.) Table 1. Performance of typical municipal and industrial wastewater applications (Veolia Water Solutions & Technologies, n.d.)
Blending Summary – Draft – June 4, 2014 38
Notes: COD = chemical oxygen demand.
Actiflo® has been installed in more than 30 municipal wastewater treatment plants (WWTPs) in the United States (as of August 2010), including in Greenfield (Indiana), Lincolnton (North Carolina), Lawrence WWTP (Indiana), Williamette water treatment plant (Oregon), and Fort Worth (Texas) (Krüger, Inc. n.d.; USEPA 2013).
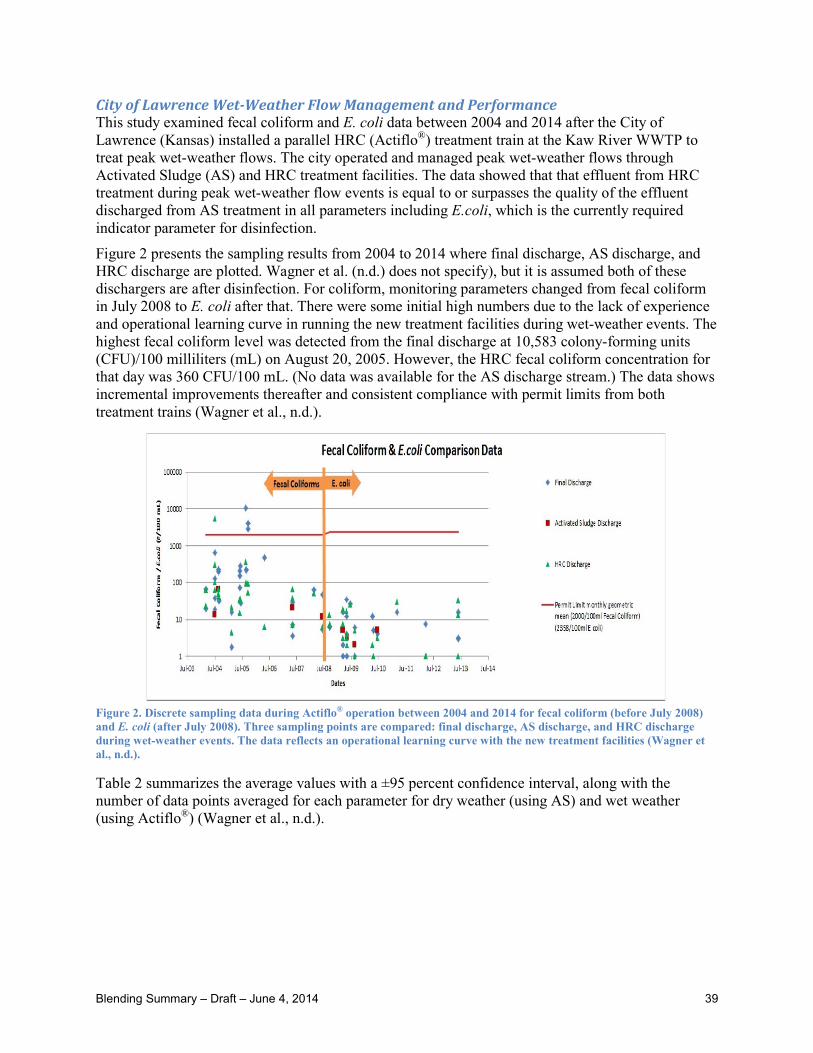
City of Lawrence Wet-Weather Flow Management and Performance This study examined fecal coliform and E. coli data between 2004 and 2014 after the City of Lawrence (Kansas) installed a parallel HRC (Actiflo®) treatment train at the Kaw River WWTP to treat peak wet-weather flows. The city operated and managed peak wet-weather flows through Activated Sludge (AS) and HRC treatment facilities. The data showed that that effluent from HRC treatment during peak wet-weather flow events is equal to or surpasses the quality of the effluent discharged from AS treatment in all parameters including E.coli, which is the currently required indicator parameter for disinfection.
Figure 2 presents the sampling results from 2004 to 2014 where final discharge, AS discharge, and HRC discharge are plotted. Wagner et al. (n.d.) does not specify), but it is assumed both of these dischargers are after disinfection. For coliform, monitoring parameters changed from fecal coliform in July 2008 to E. coli after that. There were some initial high numbers due to the lack of experience and operational learning curve in running the new treatment facilities during wet-weather events. The highest fecal coliform level was detected from the final discharge at 10,583 colony-forming units (CFU)/100 milliliters (mL) on August 20, 2005. However, the HRC fecal coliform concentration for that day was 360 CFU/100 mL. (No data was available for the AS discharge stream.) The data shows incremental improvements thereafter and consistent compliance with permit limits from both treatment trains (Wagner et al., n.d.).
Figure 2. Discrete sampling data during Actiflo® operation between 2004 and 2014 for fecal coliform (before July 2008) and E. coli (after July 2008). Three sampling points are compared: final discharge, AS discharge, and HRC discharge during wet-weather events. The data reflects an operational learning curve with the new treatment facilities (Wagner et al., n.d.).
Table 2 summarizes the average values with a ±95 percent confidence interval, along with the number of data points averaged for each parameter for dry weather (using AS) and wet weather (using Actiflo®) (Wagner et al., n.d.).
Blending Summary – Draft – June 4, 2014 39
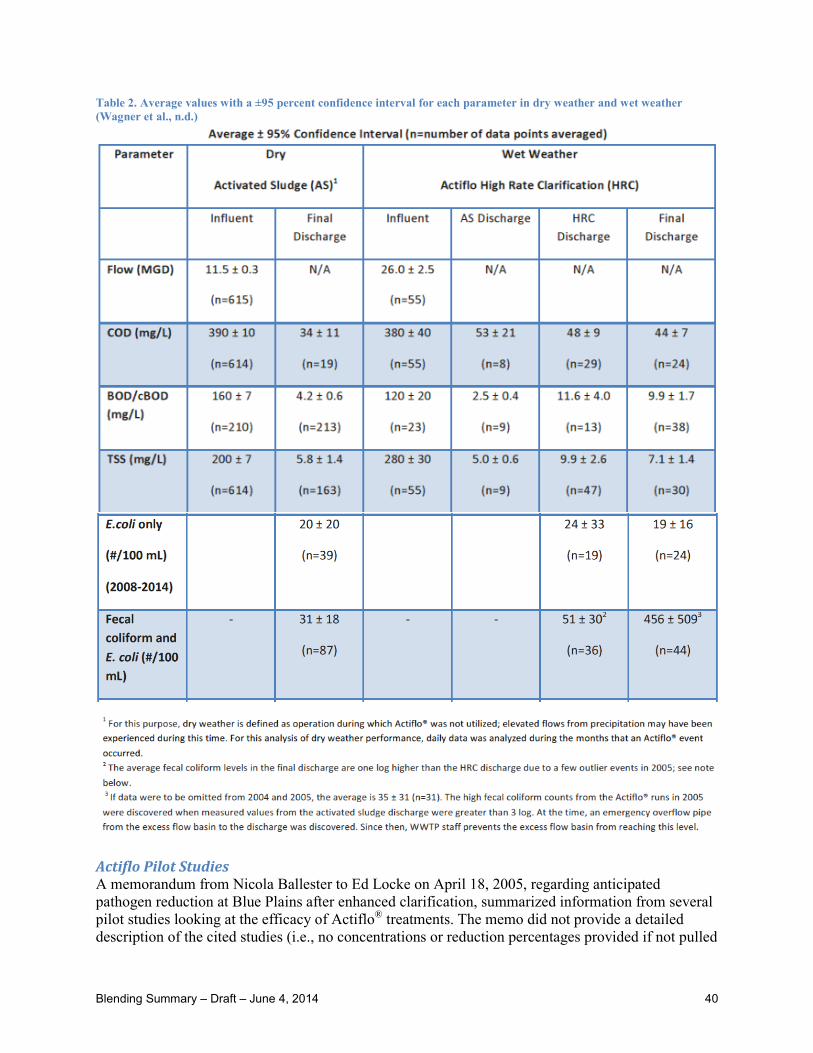
Table 2. Average values with a ±95 percent confidence interval for each parameter in dry weather and wet weather (Wagner et al., n.d.)
Actiflo Pilot Studies A memorandum from Nicola Ballester to Ed Locke on April 18, 2005, regarding anticipated pathogen reduction at Blue Plains after enhanced clarification, summarized information from several pilot studies looking at the efficacy of Actiflo® treatments. The memo did not provide a detailed description of the cited studies (i.e., no concentrations or reduction percentages provided if not pulled
Blending Summary – Draft – June 4, 2014 40
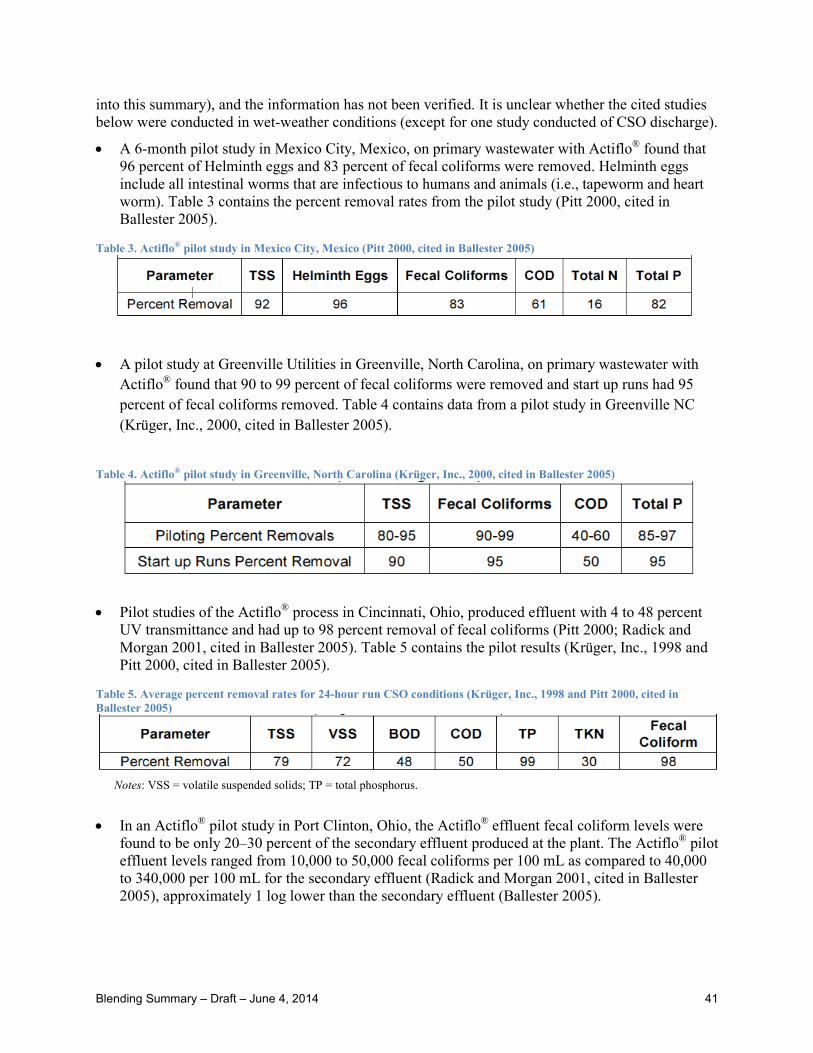
into this summary), and the information has not been verified. It is unclear whether the cited studies below were conducted in wet-weather conditions (except for one study conducted of CSO discharge).
• A 6-month pilot study in Mexico City, Mexico, on primary wastewater with Actiflo® found that 96 percent of Helminth eggs and 83 percent of fecal coliforms were removed. Helminth eggs include all intestinal worms that are infectious to humans and animals (i.e., tapeworm and heart worm). Table 3 contains the percent removal rates from the pilot study (Pitt 2000, cited in Ballester 2005).
Table 3. Actiflo® pilot study in Mexico City, Mexico (Pitt 2000, cited in Ballester 2005)
Notes: Total N = total nitrogen.
• A pilot study at Greenville Utilities in Greenville, North Carolina, on primary wastewater with Actiflo® found that 90 to 99 percent of fecal coliforms were removed and start up runs had 95 percent of fecal coliforms removed. Table 4 contains data from a pilot study in Greenville NC (Krüger, Inc., 2000, cited in Ballester 2005).
Table 4. Actiflo® pilot study in Greenville, North Carolina (Krüger, Inc., 2000, cited in Ballester 2005)
• Pilot studies of the Actiflo® process in Cincinnati, Ohio, produced effluent with 4 to 48 percent
UV transmittance and had up to 98 percent removal of fecal coliforms (Pitt 2000; Radick and Morgan 2001, cited in Ballester 2005). Table 5 contains the pilot results (Krüger, Inc., 1998 and Pitt 2000, cited in Ballester 2005).
Table 5. Average percent removal rates for 24-hour run CSO conditions (Krüger, Inc., 1998 and Pitt 2000, cited in Ballester 2005)
N otes: VSS = volatile suspended solids; TP = total phosphorus.
Blending Summary – Draft – June 4, 2014 41
• In an Actiflo® pilot study in Port Clinton, Ohio, the Actiflo® effluent fecal coliform levels were found to be only 20–30 percent of the secondary effluent produced at the plant. The Actiflo® pilot effluent levels ranged from 10,000 to 50,000 fecal coliforms per 100 mL as compared to 40,000 to 340,000 per 100 mL for the secondary effluent (Radick and Morgan 2001, cited in Ballester 2005), approximately 1 log lower than the secondary effluent (Ballester 2005).
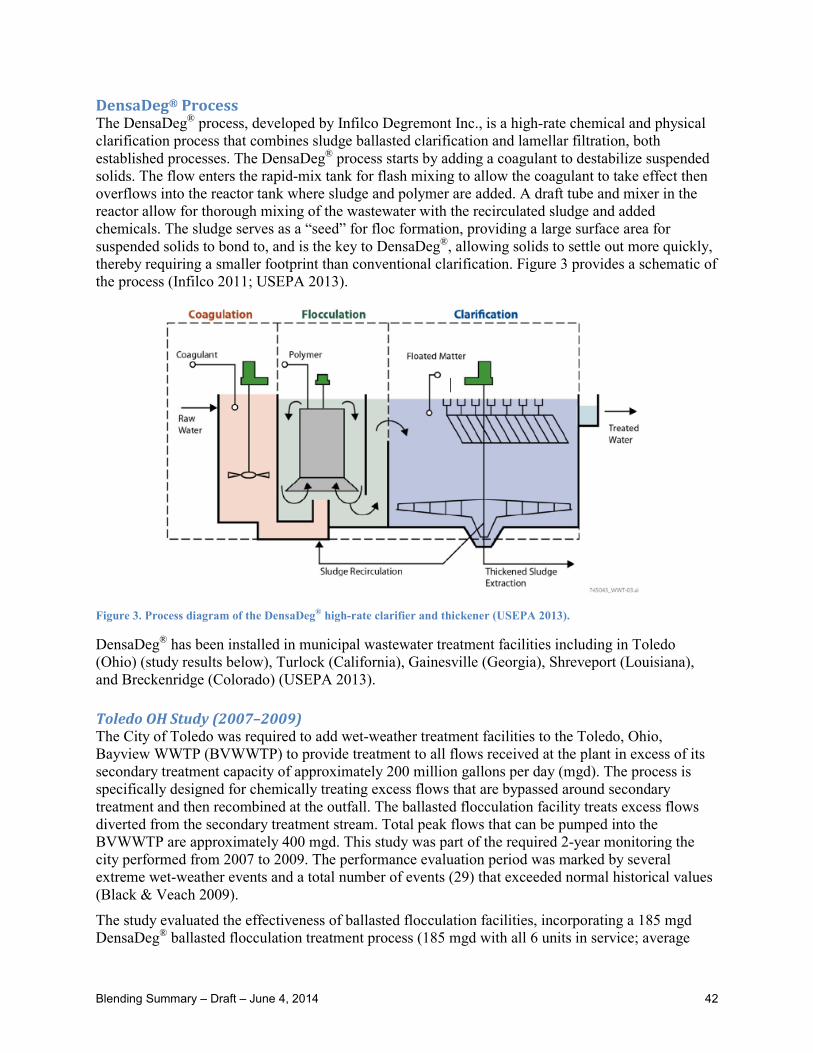
DensaDeg® Process The DensaDeg® process, developed by Infilco Degremont Inc., is a high-rate chemical and physical clarification process that combines sludge ballasted clarification and lamellar filtration, both established processes. The DensaDeg® process starts by adding a coagulant to destabilize suspended solids. The flow enters the rapid-mix tank for flash mixing to allow the coagulant to take effect then overflows into the reactor tank where sludge and polymer are added. A draft tube and mixer in the reactor allow for thorough mixing of the wastewater with the recirculated sludge and added chemicals. The sludge serves as a “seed” for floc formation, providing a large surface area for suspended solids to bond to, and is the key to DensaDeg®, allowing solids to settle out more quickly, thereby requiring a smaller footprint than conventional clarification. Figure 3 provides a schematic of the process (Infilco 2011; USEPA 2013).
Figure 3. Process diagram of the DensaDeg® high-rate clarifier and thickener (USEPA 2013).
DensaDeg® has been installed in municipal wastewater treatment facilities including in Toledo (Ohio) (study results below), Turlock (California), Gainesville (Georgia), Shreveport (Louisiana), and Breckenridge (Colorado) (USEPA 2013).
Toledo OH Study (2007–2009) The City of Toledo was required to add wet-weather treatment facilities to the Toledo, Ohio, Bayview WWTP (BVWWTP) to provide treatment to all flows received at the plant in excess of its secondary treatment capacity of approximately 200 million gallons per day (mgd). The process is specifically designed for chemically treating excess flows that are bypassed around secondary treatment and then recombined at the outfall. The ballasted flocculation facility treats excess flows diverted from the secondary treatment stream. Total peak flows that can be pumped into the BVWWTP are approximately 400 mgd. This study was part of the required 2-year monitoring the city performed from 2007 to 2009. The performance evaluation period was marked by several extreme wet-weather events and a total number of events (29) that exceeded normal historical values (Black & Veach 2009).
The study evaluated the effectiveness of ballasted flocculation facilities, incorporating a 185 mgd DensaDeg® ballasted flocculation treatment process (185 mgd with all 6 units in service; average
Blending Summary – Draft – June 4, 2014 42

flow of 27 mgd per unit) for removing TSS, carbonaceous biochemical oxygen demand (CBOD), total Kjeldahl nitrogen (TKN), ammonia, and total phosphorus (TP). (Bacteria and pathogens were not included in the study.) The DensaDeg wet-weather treatment facilities produced effluent of comparable quality to that of secondary treatment for TSS and TP, plus sufficiently low concentrations of CBOD to comply with maximum allowable 7-day average National Pollutant Discharge Elimination System (NPDES) Discharge Permit requirements. The wet-weather treatment effluent CBOD (monitoring station 603) was less than the 40 mg/L, 7-day average limit required by the BVWWTP NPDES permit for all but one of the events. Wet-weather treatment effluent TSS was less than the 40 mg/L, 7-day average limit required by the BVWWTP NPDES permit for all of the events (Black & Veatch 2009).
The ballasted flocculation process proved very effective for treating wet-weather flows, even at relatively low chemical dosages. Performance of the full-scale facilities is very similar to that achieved during pilot testing, confirming the applicability of design criteria developed from the pilot tests. The plant has optimized the performance of the facility to manage variable influent flow and pollutant concentrations and treatment results have been better than expected for treating wet-weather flows (Black & Veatch 2009).
Toledo Waterways Initiative: Pathogen Study (2011–2013) The pathogen study was intended to expand upon Toledo’s wet-weather treatment facility performance study (described above) and to further characterize the effectiveness of the DensaDeg® high-rate clarification (ballasted flocculation) auxiliary treatment technology employed by Toledo for controlling the potential discharge to the environment of pathogens. The study compared and contrasted pathogen removal and inactivation by the auxiliary HRC and AS trains when both systems are simultaneously discharging treated wet-weather flows to the Maumee River (Black & Veatch 2014).
Dry-weather and wet-weather flows are treated in the AS treatment until flows reach 168 mgd—when the HRC treatment is placed in service to treat the additional wet-weather flow. This additional flow goes back to the AS treatment (Black & Veatch 2014).
Since the beginning of this study, there have been only two wet-weather discharge events that have met the qualifying conditions: (1) events must occur during the portion of the year when the plant is required to disinfect; and (2) have sufficient precipitation to cause simultaneous discharge from both the AS and HRC trains for a period of at least 6 hours (Black & Veatch 2014).
Preliminary results suggested that both the AS train and HRC train provided reductions in bacteria, protozoans, and viruses (Black & Veatch 2014).
• No significant differences between the trains were observed for pathogenic bacteria. The trends for bacterial indicators suggested differences between the trains before chlorination, but no significant difference after chlorination.
• Cryptosporidium and Giardia data suggested that the HRC train might have provided slightly more removal of protozoans than the AS train. The TSS and turbidity data indicated that the HRC train might have also provided slightly more removal of particulate matter than the AS trains, which further suggests similar or better removal of protozoan oocysts and cysts through the HRC train compared to the AS train.
• Viruses exhibited similar trends as those described above for bacteria. The trends from viral pathogens did not appear to show a significant difference between the HRC and AS trains, as opposed to the trends from the viral indicators.
Blending Summary – Draft – June 4, 2014 43

Tables 6 through 8 show sampling results from the two qualifying events. Table 6. Summary of sampling results for pathogenic microbes from the two qualifying events (Black & Veatch 2014)
Table 7. Summary of sampling results for potential indicator organisms from the two qualifying events (Black & Veatch 2014)
Blending Summary – Draft – June 4, 2014 44
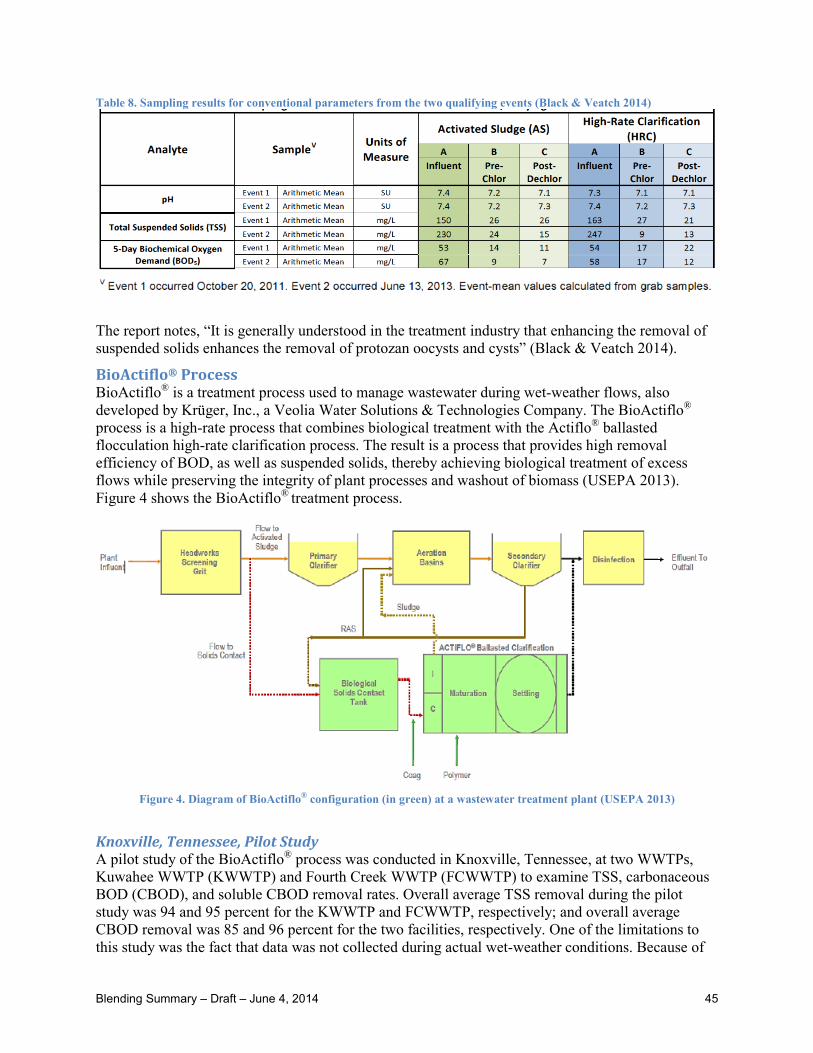
Table 8. Sampling results for conventional parameters from the two qualifying events (Black & Veatch 2014)
The report notes, “It is generally understood in the treatment industry that enhancing the removal of suspended solids enhances the removal of protozan oocysts and cysts” (Black & Veatch 2014).
BioActiflo® Process BioActiflo® is a treatment process used to manage wastewater during wet-weather flows, also developed by Krüger, Inc., a Veolia Water Solutions & Technologies Company. The BioActiflo® process is a high-rate process that combines biological treatment with the Actiflo® ballasted flocculation high-rate clarification process. The result is a process that provides high removal efficiency of BOD, as well as suspended solids, thereby achieving biological treatment of excess flows while preserving the integrity of plant processes and washout of biomass (USEPA 2013). Figure 4 shows the BioActiflo® treatment process.
Figure 4. Diagram of BioActiflo® configuration (in green) at a wastewater treatment plant (USEPA 2013)
Knoxville, Tennessee, Pilot Study A pilot study of the BioActiflo® process was conducted in Knoxville, Tennessee, at two WWTPs, Kuwahee WWTP (KWWTP) and Fourth Creek WWTP (FCWWTP) to examine TSS, carbonaceous BOD (CBOD), and soluble CBOD removal rates. Overall average TSS removal during the pilot study was 94 and 95 percent for the KWWTP and FCWWTP, respectively; and overall average CBOD removal was 85 and 96 percent for the two facilities, respectively. One of the limitations to this study was the fact that data was not collected during actual wet-weather conditions. Because of
Blending Summary – Draft – June 4, 2014 45

the availability of pilot equipment and unpredictable weather conditions, the study was conducted by simulating wet-weather wastewater to feed the pilot unit (Norton et al., n.d.).
Akron, Ohio, Pilot Study The City of Akron Water Pollution Control Station (WPCS) conducted a pilot study in accordance with the City’s Long Term Control Plan (LTCP), to demonstrate whether or not the BioActiflo® biological ballasted flocculation process is capable of achieving the effluent limitations established in the LTCP (“performance criteria”) and to collect data to compare the performance of the BioActiflo® system to the City’s conventional secondary treatment system in treating pathogens and conventional pollutants. The pilot was operated during wet-weather events which resulted in secondary treatment system bypasses at the WPCS; a total of 20 events were evaluated (AECOM 2013).
The average and geometric mean results summarized below indicate the BioActiflo® system reduced TSS, CBOD5, and E. coli concentrations below the facility’s performance criteria established in the LTCP (AECOM 2013). In addition, data collected from each of the individual 20 qualifying wet-weather events indicate treatment to levels below those performance criteria, summarized below.
Table 9. TSS and CBOD5 Performance of BioActiflo® During Pilot Testing
Parameter
Stipulated Effluent Criteria (Performance Criteria in LTCP) BioActiflo® Effluent
30-day Average 7-day Average Average of Events 1-181
Average of Events 19-202
TSS, mg/L 30 45 4.0 3.7
CBOD5, mg/L 25 40 5.9 3.0 1 For the first 18 events, the pilot unit was operated using operational criteria determined during the start-up and calibration testing period. 2 For events 19 and 20, the pilot plant operational criteria were modified to assess performance with a slightly higher mixed liquor suspended solids (MLSS) concentration, as requested by USEPA.
Table 10. Disinfection Performance of BioActiflo® During Pilot Testing
Parameter
Stipulated Effluent Criteria (Performance Criteria in
LTCP) BioActiflo® Effluent
Average Monthly
Average Weekly
UV Disinfection Geo Mean of Events 1-18
Chlorine Disinfection Geo Mean of Events 1-18
UV Disinfection Geo Mean of Events 19-20
Chlorine Disinfection Geo Mean of Events 19-20
E. Coli, cfu/100 mL 126 298 17 2 9 1
Blending Summary – Draft – June 4, 2014 46

Average CBOD5 removal efficiencies prior to disinfection, following disinfection using sodium hypochlorite, and following disinfection by UV light presented in the report are summarized below.
Table 11. Average CBOD5 Percent Removals During Pilot Testing
Sample Location
Average CBOD5 Removal Efficiency
WPCS Main Plant
BioActiflo® Pilot Plant
Events 1-18
BioActiflo® Pilot Plant
Events 19 & 20
Before Disinfection 94.1% 85.2% 91.4%
After Sodium Hypochlorite Disinfection 69.1% 56.1% 70.4%
After UV Light Disinfection 94.1% 86.8% 92.8%
The reduction in CBOD5 removal efficiency following sodium hypochlorite disinfection is attributed to the dechlorination chemical, sodium bisulfite. Sodium bisulfite interferes with the CBOD5 analysis by reacting with the oxygen present in the sample and causing a greater oxygen depletion which is measured in the CBOD5 test.
Average TSS removal efficiencies prior to disinfection, following disinfection using sodium hypochlorite, and following disinfection by UV light presented in the report are summarized below.
Table 12. Average TSS Percent Removals During Pilot Testing
Sample Location
Average TSS Removal Efficiency
WPCS Main Plant
BioActiflo® Pilot Plant
Events 1-18
BioActiflo® Pilot Plant
Events 19 & 20
Before Disinfection 93.5% 96.8% 95.9%
After Sodium Hypochlorite Disinfection 94.0% 95.1% 95.7%
After UV Light Disinfection 92.2% 95.1% 95.8%
TSS removal efficiencies were consistent among the three sampling locations. Slightly higher TSS removal efficiencies were observed across the BioActiflo® pilot plant as compared to the WPCS conventional secondary treatment plant.
The average BioActiflo® effluent total phosphorus concentration for events 1-18 was 0.21 mg/L and an average for events 19 and 20 of 0.09 mg/L. These averages are 66 and 89 percent lower when compared to the average secondary effluent phosphorus concentrations for the same time periods. In addition, COD levels were similar for events 1-18 and for events 19 and 20, the BioActiflo® effluent COD concentrations were 37 percent less than the secondary effluent levels (Krüger 2014, p. 6).
E. coli concentrations in the BioActiflo® pilot influent were in the typical range at an average of 749,570 cfu/100 mL for all events. Both the main plant secondary treatment process and the BioActiflo® treatment process achieved one to two log reductions in E. coli prior to disinfection, with main plant secondary effluent containing an average E. coli concentration of 5,283 cfu/100 mL and BioActiflo® pilot effluent containing 18,284 cfu/100 mL (Heath et al., n.d. p. 12). Effluent from both the main plant and BioActiflo® processes were readily disinfected using either sodium hypochlorite
Blending Summary – Draft – June 4, 2014 47
or UV. In addition, a blend of main plant secondary effluent and BioActiflo® pilot effluent was readily disinfected using sodium hypochlorite. The City’s intended full-scale practice would be to blend main plant secondary effluent and BioActiflo® effluent prior to disinfection in a common contact tank using sodium hypochlorite, as tested in the pilot study (Heath et al., n.d.). E coli counts for both sources with both disinfection types were below the average monthly performance criterion of 126 MPN/100 mL but the BioActiflo® effluent contained an average 68 percent less E. coli after disinfection when compared to the WCPS secondary effluent after disinfection (Krüger 2014).
In conclusion, the BioActiflo® system reduced TSS, CBOD5, and E. coli concentrations below the facility’s effluent limits/performance criteria established in the LTCP. In addition, data collected from each of the individual 20 qualifying wet-weather events indicate treatment to levels below those effluent limits/performance criteria.
Reference
AECOM. 2013. City of Akron WPCS BIOACTIFLO™ Wet Weather Treatment System Pilot Study Final Report.
Ballester, N. 2005, April 18. WASA Pathogen Reduction Memo. A memorandum from Nicola Ballester to Ed Locke regarding anticipated pathogen reduction at Blue Plains after enhanced clarification.
Black & Veatch. 2009. Ballasted Flocculation Performance Testing 2-Year Final Report. Prepared for City of Toledo – Bayview Wastewater Treatment Plant. Black & Veatch Project Nos. 132633/161731/162478.
Black & Veatch. 2014. Toledo Waterways Initiative: Pathogen Study, 2013 Annual Report.
Heath, G., P. Gsellman, G. Hanna, D. Starkey. n.d. Pilot Testing of BIOACTIFLO™ for Wet Weather Treatment at the Akron, Ohio Water Reclamation Facility.
Infilco. 2011. Densadeg® Clarifier.Softner (Brochure). Accessed May 2014. http://www.degremont-technologies.com/IMG/pdf/DENSADEG_US_Infilco.pdf.
Krüger, Inc. n.d. Actiflo® for Wastewater Treatment (Brochure). Accessed May 2014. http://www.krugerusa.com/medias/files/actiflo-wastewater.htm.
Krüger, Inc. 2014. City of Akron Water Pollution Control Station, Akron, OH BIOACTIFLO™ Pilot Study Summary. Prepared for City of Akron, Ohio by I. Kruger, Inc.
McKnight, D., B. Cole, J. Ray, and J. Sandino. 2009. Four Ways to Use One Process Wilson Creek Regional WWTP. Accessed August 2010. http://tacwa.org/images/2009-09-25_TACWA-Bio_HRC.pdf.
Norton, J., K.Y. Bell, and J. Johnson. n.d. Pilot Plant Results of Biologically Enhanced High-Rate Clarification for Wet-Weather Treatment.
Pitt, R. 2000. Designs for the Future and Retrofitting Existing Facilities for Wet Weather Flows. Module 11. Tech University of Darmstadt, Germany.
Blending Summary – Draft – June 4, 2014 48
Radick, K.A., and M.A. Morgan. 2001. Ballasted Flocculation-A Technology for Long Term CSO Control. Presentation at the Water Environment Federation’s Annual Technical Exhibition and Conference 2001.
USEPA (U.S. Environmental Protection Agency). 2005. Wastewater Technology Fact Sheet: Ballasted Flocculation. Municipal Technology Branch, Washington, DC. Accessed May 2014. http://water.epa.gov/scitech/wastetech/upload/2005_07_28_mtb_ballasted_flocculation.pdf.
USEPA (U.S. Environmental Protection Agency). 2013. Emerging Technologies for Wastewater Treatment and In-Plant Wet Weather Management. EPA 832-R-12-011. Office of Wastewater Management, Washington, D.C. Accessed May 2014. http://water.epa.gov/scitech/wastetech/upload/Emerging-Technologies-Report-2.pdf.
Veolia Water Solutions & Technologies. n.d.. ACTIFLO® – The Ultimate Clarifier (Brochure). Accessed May 2014. http://www.veoliawaterst.com/processes/lib/pdfs/productbrochures/key_technologies/C698D9Ldk09jWy12cE4PL46B.pdf.
Wagner, D., M. Lawless, M. Hegeman, T. Wilson, R. Whaley, A. Ensz, A. Shields, and B. Sturm. n.d. A Decade of Operational Experience Using Ballasted Flocculation: City of Lawrence Wet Weather Flow Management and Performance.
Blending Summary – Draft – June 4, 2014 49


![Occurrence and Elimination of Organic Micro Pollutants in … · 2006-04-10 · Effluent final sedimentation Effluent filtration Load [g/d] ResultsMassFlowBalance Polycyclic Musk](https://static.fdocuments.net/doc/165x107/5ed3aed7c4540779ca664efe/occurrence-and-elimination-of-organic-micro-pollutants-in-2006-04-10-effluent.jpg)