DRAFT PRELIMINARY REPORT - NRCan
53
FINAL REPORT TO THE MINISTER OF NATURAL RESOURCES AND THE MINISTER OF INDUSTRY PROPANE MARKET REVIEW APRIL 25, 2014 A joint report by the National Energy Board and Competition Bureau
Transcript of DRAFT PRELIMINARY REPORT - NRCan

FINAL REPORT
TO THE
MINISTER OF NATURAL RESOURCES AND THE MINISTER OF INDUSTRY
PROPANE MARKET REVIEW
APRIL 25, 2014
A joint report by the
National Energy Board and Competition Bureau
TABLE OF CONTENTS
1. EXECUTIVE SUMMARY .......................................................................................................... 1
2. INTRODUCTION .................................................................................................................... 2
3. THE CANADIAN PROPANE INDUSTRY ..................................................................................... 3
THE CANADIAN PROPANE SUPPLY CHAIN .......................................................................... 6
UPSTREAM PRODUCTION OF PROPANE .............................................................................. 7
MIDSTREAM STORAGE OF PROPANE .................................................................................. 8
MIDSTREAM TRANSPORTATION OF PROPANE ..................................................................... 9
DOWNSTREAM DISTRIBUTION OF PROPANE.......................................................................11
HOUSEHOLD CONSUMER DEMAND ...................................................................................12
THE INTEGRATED CANADA-U.S. PROPANE INDUSTRY ........................................................13
HOW CANADIAN PROPANE PRICES ARE DETERMINED ........................................................15
REGULATION OF PROPANE ...............................................................................................16
4. CURRENT SITUATION ..........................................................................................................18
PRICES ...........................................................................................................................18
PRODUCTION ..................................................................................................................19
INVENTORIES AND SUPPLY ...............................................................................................20
CANADIAN EXPORTS........................................................................................................24
5. CAUSES OF RECENT PROPANE PRICE INCREASES ................................................................26
INCREASED DEMAND GIVEN COLD WEATHER ....................................................................27
INCREASED DEMAND FOR CROP DRYING ..........................................................................31
SUPPLY CHAIN CONGESTION AND DISRUPTIONS ...............................................................32
DECREASED AVAILABILITY DUE TO INCREASED U.S. EXPORTS ...........................................33
6. FUTURE PROPANE SUPPLY, DEMAND, AND EXPORTS ...........................................................36
CANADIAN SITUATION ......................................................................................................36
U.S. SITUATION ..............................................................................................................38
7. EXAMINATION OF ANTI-COMPETITIVE BEHAVIOUR .................................................................40
SCOPE AND CONDUCT OF EXAMINATION ...........................................................................42
ANALYSIS OF UPSTREAM PRODUCTION .............................................................................42
ANALYSIS OF MIDSTREAM FIRMS ......................................................................................44
ANALYSIS OF DOWNSTREAM DISTRIBUTORS .....................................................................45
ANALYSIS OF PROPANE PRICING ......................................................................................46
CONCLUSION REGARDING ANTI-COMPETITIVE BEHAVIOUR ................................................47
8. CONCLUSIONS ....................................................................................................................48
APPENDIX: DATA SOURCES AND CHALLENGES ............................................................................49
1
1. Executive Summary
1.1 On February 4, 2014, the Ministers of Natural Resources and Industry requested that the
National Energy Board and Competition Bureau work together to review propane market issues.
This final report builds upon the preliminary report released publicly on March 11, 2014, and
provides a detailed analysis of the overall propane market in Canada.
1.2 In Canada, propane is produced, stored, transported, and distributed across a broad supply
chain. Upstream firms produce propane through natural gas processing and crude oil refining.
Propane is then either stored in underground storage caverns or transported by pipeline, rail, or
truck by midstream firms. Finally, downstream distributors move propane to consumers, who
purchase it for business and personal use. Propane supplies are also traded with the U.S.
1.3 During the winter of 2013-2014, initial propane inventories were lower than average and
demand was unexpectedly high in Canada and the U.S. Supply tightened, prices increased
rapidly, and there were local reports, especially in Ontario and western Quebec, of retail delivery
problems. Factors contributing to this were:
A colder-than-normal winter across the eastern parts of Canada and the U.S. that resulted
in greatly increased demand for home or “space” heating fuels;
An exceptionally large and wet corn harvest in the U.S. Midwest, resulting in greater-
than-normal demand for propane to dry the corn prior to storage;
Supply chain congestion and disruptions due to weather and maintenance, resulting in
less propane being available for distribution and delivery; and
Rapidly growing U.S. exports of propane to overseas markets, reallocating volumes
which might otherwise be available in Canada and the U.S.
1.4 Tight supply continued for most of the winter, but prices came down considerably after
peaking in late January, and local delivery problems eased. Redirection of supply from the U.S.
Gulf Coast to the U.S. Midwest helped moderate prices in both Canada and the U.S. Propane
consumers, including households, were significantly impacted by these price fluctuations, but an
independent examination conducted by the Competition Bureau did not uncover sufficient
evidence, based on the information collected, to conclude that anti-competitive behaviour
exacerbated the impact of high prices on consumers. Should the Bureau become aware of
behaviour that contravenes the Competition Act, it will not hesitate to take the appropriate action.
1.5 An examination of the factors that could contribute to future propane shortages and price
increases indicates that there is no overall supply-demand imbalance in the propane industry that
will create ongoing shocks or prevent the market from correcting future shocks. However,
propane demand and prices are historically volatile and unforeseen events such as those that
occurred this winter will likely continue to cause volatility.
2
2. Introduction
2.1 The National Energy Board (NEB) and Competition Bureau (Bureau) were asked to work
together to review propane market issues, including price increases, scarcity, and the volume of
propane exports to the U.S. More specifically, in a letter dated February 4, 2014,1 the Ministers
of Natural Resources and Industry requested that the NEB and Bureau examine:
the propane supply and demand situation in Canada, including production, inventories,
exports/imports and end-use;
the propane distribution network;
wholesale and retail propane pricing;
composition of the wholesale and retail market;
the factors that have contributed to the recent shortages and price spikes;
whether there have been any anti-competitive activities that may have exacerbated the
impact on consumers; and
any potential factors that could exacerbate the current market challenges or contribute to
future propane shortages and related price increases.
2.2 The NEB and the Bureau prepared a preliminary report analyzing the above issues, with
emphasis on the availability of current supplies and initial perspectives on the factors that may
have led to recent propane shortages and price increases in Canada. The preliminary report was
released publicly on March 11, 2014.2
2.3 This more detailed final report updates and builds upon the findings of the preliminary
report and adds new analysis in areas such as potential anti-competitive activities and factors that
could contribute to future propane shortages and related price increases.
2.4 The NEB and the Bureau are well-equipped to undertake this market review. As
Canada’s energy regulator, the NEB has a significant understanding of, and experience with, the
Canadian propane industry.3 The Bureau has substantial expertise in assessing the performance
1 “Letter to the National Energy Board and the Competition Bureau”, Natural Resources Canada. Available online
at: http://www.nrcan.gc.ca/media-room/news-release/2014/14980.
2 “Propane Market Review: Preliminary Report to the Minister of Natural Resources and the Minister of Industry”.
Available online at: http://www.nrcan.gc.ca/energy/alternative-fuels/fuel-facts/propane/15681.
3 The NEB is an independent federal, quasi-judicial, regulatory tribunal. The NEB regulates international and
interprovincial aspects of the oil, gas and electric utility industries including the construction and operation of
interprovincial and international oil and gas pipelines and the export of natural gas, oil, natural gas liquids (including
propane) and electricity, and the import of natural gas. The NEB’s powers and jurisdiction are set out in the National
Energy Board Act and other legislation.
3
of various industries and examining the role that competitive forces play in market outcomes.4
The two organizations worked together on the preliminary and final reports, with the exception
of Section 7 of this final report, which describes an independent examination conducted by the
Bureau.
2.5 In drafting this report, the NEB and the Bureau examined proprietary and publicly
available information from across Canada and the U.S. Canadian data was collected from the
NEB, Statistics Canada, Kent Marketing Services, Natural Resources Canada, and Environment
Canada. There is limited information on propane demand in Canada, but production data is
compiled by the Alberta Energy Regulator, the Saskatchewan Ministry of the Economy, and the
B.C. Ministry of Energy and Mines.
2.6 U.S. data and information was collected from the Energy Information Association (EIA)
and the National Oceanic and Atmospheric Administration (NOAA). Hub pricing data was
collected from Bloomberg, Butane-Propane News, and Barchart.com.
2.7 These Canadian and U.S. sources, combined with reports from various media outlets,
consultants, and industry publications, paint a relatively detailed image of the propane industry.
However, limitations exist within the data (see Appendix).
2.8 As a result, this data-based research was supplemented by consultations with a range of
stakeholders from all parts of the propane supply chain. Interviews with sixty-eight market
participants have been completed, including twelve firms performing upstream and/or midstream
activities, forty-one firms performing downstream activities, and fifteen industry associations,
consumer groups, and other stakeholders.
3. The Canadian Propane Industry
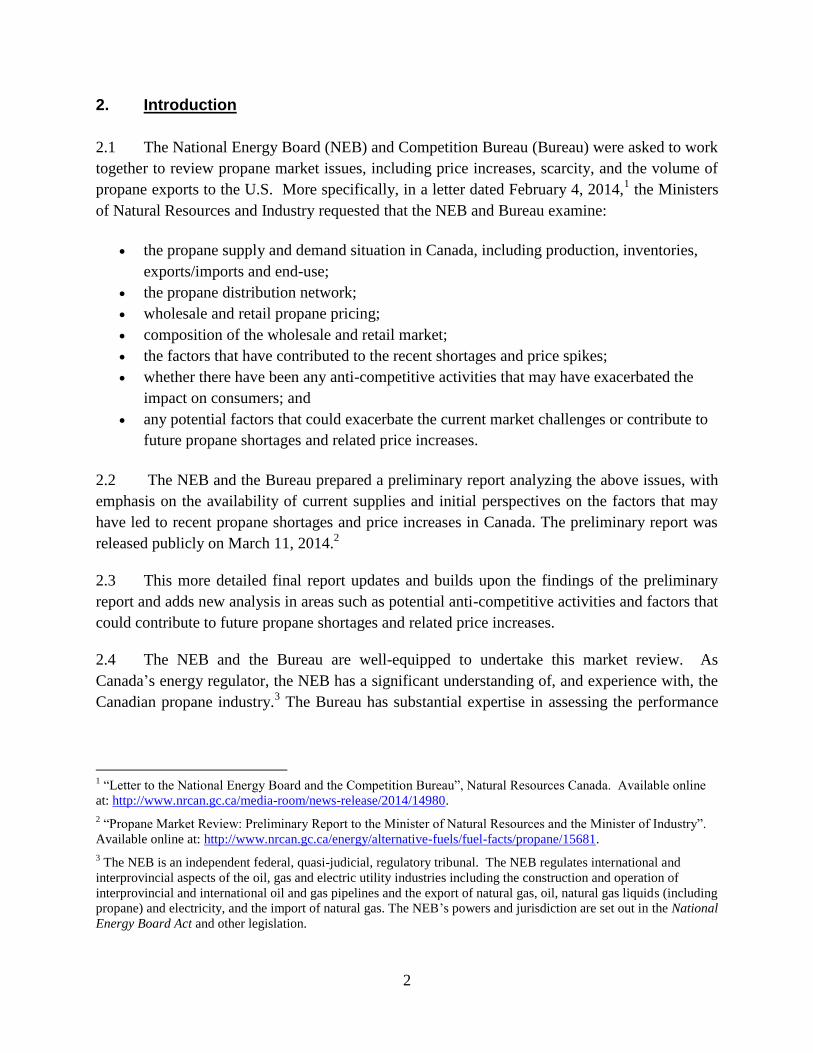
3.1 Propane is a natural gas liquid5 (NGL) that is relied on by Canadians for a variety of
purposes, from home heating and cooking to agricultural crop drying and fueling vehicles. In
2012, approximately 10.2 million cubic metres of propane were consumed in Canada.6 Table
3.1 reports the most common end uses of propane in Canada. Figure 3.1 shows the percentage
4 The Competition Bureau is an independent law enforcement agency responsible for, among other things, the
administration and enforcement of the Competition Act, which provides for the general regulation of trade and
commerce in respect of conspiracies, trade practices and mergers affecting competition, and ensures Canadian
businesses and consumers benefit from a competitive marketplace.
5 “Natural gas liquid” is a term used to describe all types of hydrocarbons that can be liquefied and removed from a
stream of natural gas. A natural gas well, in addition to producing gaseous methane, may also produce various
amounts of liquid ethane, propane, butane and pentanes. These natural gas liquids remain in the raw natural gas
stream until the stream is processed. Liquids can also be produced through refinery processes. Another common
term is “liquefied petroleum gases” (LPG), a subset of natural gas liquids that refers to propane and butane only.
6 Statistics Canada, CANSIM Table 128-0012. The most recent data available is for 2012.
4
of propane consumed by sector during 2012, with residential uses, including home heating,
accounting for 9 per cent.
Table 3.1: End Uses of Propane
Sector End Uses
Residential Home heating, water heating, cooking
Commercial Space heating, water heating, cooking
Industrial Forklifts, heating for refining
Transportation Automotive
Agriculture Crop drying, barn and stable heating
Non-Energy Plastics manufacturing
Figure 3.1: Canadian Propane Demand by Sector,7 2012
7 Residential - All personal residences including single family residences, apartments, apartment hotels,
condominiums, and farm homes.
Transportation - Use of fuel by the transportation industry for transportation purposes only. Excluded are any fuels
used for activities not directly involved in transportation (e.g., train stations, warehouses, airports, etc.).
Industrial - Manufacturing industries, including total mining and oil and gas extraction; pulp and paper; iron and
steel; smelting and refining (non-ferrous); cement; petroleum refining; chemicals; and other manufacturing.
Non-Energy (Petrochemical) - Amounts used for purposes other than fuel purposes. Includes products being used as
petrochemical feedstock, anodes/cathodes, greases, lubricants, etc.
Agriculture - Establishments primarily engaged in agricultural, hunting and trapping activities. Excluded are any
operations primarily engaged in food processing, farm machinery manufacture and repair.
Commercial - Final and other institutional consumers other than those listed above.
Please see Statistics Canada “Report on Energy Supply and Demand” (57-003-X) – Data Quality, Concepts and
Methodology”. Available online: http://www.statcan.gc.ca/pub/57-003-x/2014002/technote-notetech1-eng.htm.

5
3.2 Propane is a common source of heating fuel for residences and businesses that are not
served by natural gas pipelines. Statistics Canada estimates that approximately one per cent of
Canadian households heat with propane,8 with the highest rate in Ontario at two per cent.
9
Figure 3.2 shows the geographic distribution of residential demand for propane, which is
concentrated in Ontario.
Figure 3.2: Residential Propane Demand by Canadian Province or Region, 2005-2012
3.3 Propane is produced through two means. Approximately 85 to 90 per cent of Canadian
propane is produced as a result of natural gas processing, and the remaining 10 to 15 per cent is
produced as a by-product of crude oil refining. In 2013, approximately 11 million cubic metres
of propane were produced in Canada.10
3.4 Propane for resale is universally processed to an industry standard called “HD-5.”11
Once
propane has been processed to this standard, there is no meaningful chemical difference between
the propane sold by one firm and another.
8 Propane is less common for residential heating in Canada than in the U.S., where the EIA estimates that six per
cent of households heat with propane, primarily in the Midwest and Rocky Mountain regions (Propane Education
and Research Council, 2013 Propane Market Outlook).
9 Statistics Canada, Households and the Environment: Energy Use, Cat. No. 11-526-SWE.
10 Statistics Canada, CANSIM Table 128-0012 and NEB estimates.
11 “HD-5” is consumer grade propane that contains a maximum of five per cent propylene.
6
The Canadian Propane Supply Chain
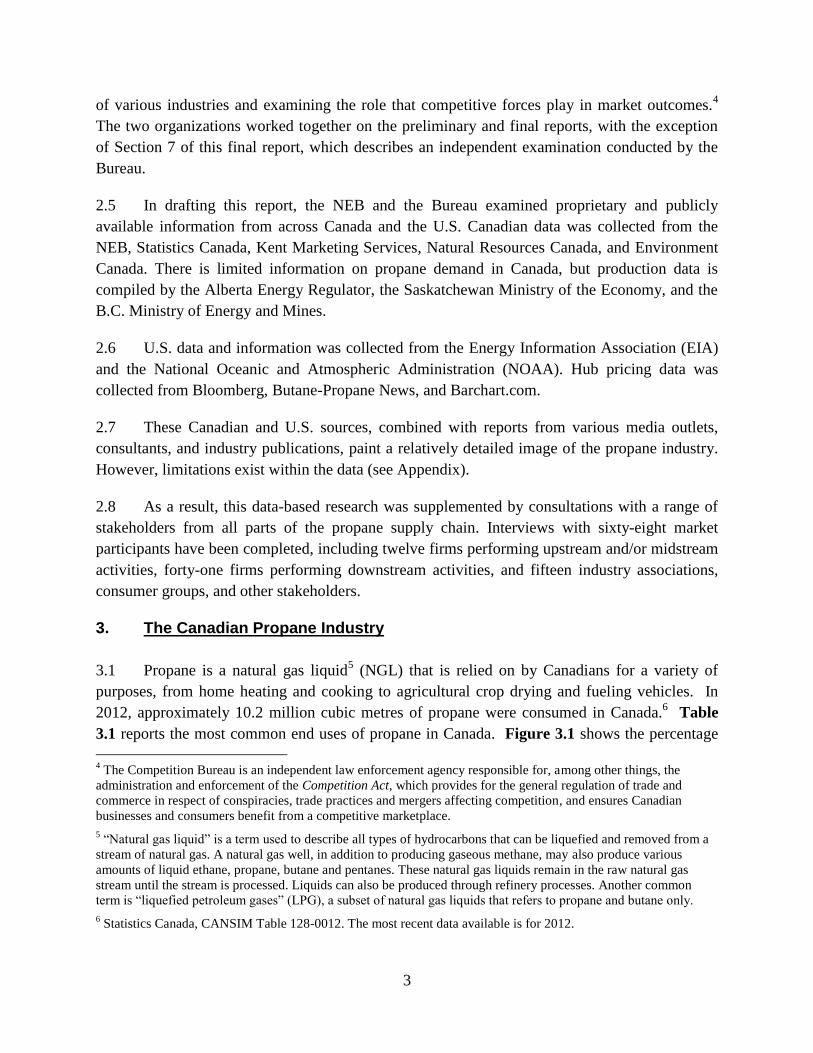
3.5 Participants in the Canadian propane industry operate in a supply chain (see Figure 3.3)
that can be separated into three categories:
a) Upstream producers separate propane from natural gas through gas plant
processing and fractionation,12
or produce it as a by-product of crude oil refining;
b) Midstream firms store large quantities of bulk propane in salt caverns and/or
transport propane long distances via pipeline, rail, or truck from the areas where it
is produced to where it is consumed; and
c) Downstream distributors deliver propane to end users.
3.6 Initial observations indicate that each level in the supply chain is generally served by a
separate group of firms, with no single entity responsible for every function of the supply chain.
Although some firms may be present at more than one level, this appears to be the exception and
not the norm.
Figure 3.3: Illustration of Canadian Propane Industry Supply Chain
12
Natural gas is first processed at gas plants to produce a mix of pipeline gas and natural gas liquids. “Fractionation”
is the process of splitting a stream of natural gas liquids into components (or fractions, including propane) through a
distillation process.
7
Upstream Production of Propane
3.7 Canadian propane production is centred in western Canada. As described above,
approximately 85 to 90 per cent of Canadian propane is produced from natural gas processing.
Of that amount, approximately 88 per cent is produced in Alberta due to the large amount of
natural gas development in that province. British Columbia is the second largest gas plant
producer of propane and is responsible for seven per cent of the Canadian total. Small volumes
are also produced from gas plants in Saskatchewan and from offshore gas fields in Nova
Scotia.13
The 10 to 15 per cent of Canadian propane production that comes as a byproduct of
crude oil refining and upgrading is distributed more evenly across Canada.
3.8 There are a number of upstream propane producers in Canada but the majority of
Canadian fractionation capacity is owned and operated by a few firms. Other producers of
propane include firms that own and operate oil refineries and bitumen upgraders.
3.9 An upstream firm has three options to dispose of propane once it has been produced:
a) immediately sell the propane locally to downstream firms or third parties;
b) move bulk quantities of propane along midstream transportation assets (i.e.,
pipeline, rail, or truck) to downstream firms located elsewhere; or
c) store the propane for later use or sale.
3.10 Volumes produced by upstream firms are generally sold to large midstream or
downstream customers. These sales are typically made according to annually-negotiated
contracts that specify target volumes and pricing mechanisms.14
3.11 When negotiating purchase contracts, upstream suppliers typically require that midstream
and downstream customers buy at least one barrel during the low demand summer months for
every three barrels that they require during the high demand winter season.15
13
Alberta Energy Regulator (ST-3 Report); Saskatchewan Ministry of the Economy (Annual Petroleum Statistics);
BC Ministry of Energy and Mines, Oil and Gas Division (Byproducts Report); NEB.
14 Suppliers prefer that customers stay within a certain percentage of their contracted volumes. Buying less than
contracted volumes during summer months can result in either: (a) smaller monthly allocations for midstream and
downstream customers during winter months, or (b) a deterioration of the business relationship between the
upstream firm and their midstream or downstream customer. If customers take possession of less than contracted
volumes in the winter (e.g., because of a milder-than-expected winter), the supplier is left holding the product and
would typically store it for future sale, or send it via rail to other markets in Canada and the U.S. or, ultimately,
overseas.
15 However, despite this practice, some downstream customers have noted that, in past winters, suppliers were
willing to provide volume at contracted rates over and above contracted volumes.

8
Midstream Storage of Propane
3.12 Propane demand is highly seasonal and variable, with peaks occurring in the fall and
winter due to crop drying and heating fuel end use. Propane storage enables firms to amass
inventories of propane over the course of the year to meet peak-season demand and to mitigate
price volatility.
3.13 Underground salt caverns are the preferred storage option for large volumes of propane,
as they can safely hold bulk quantities at a relatively low cost compared to above-ground
options. Salt caverns are also easier to use than other underground options such as depleted oil
and gas reservoirs or aquifers.16
3.14 Underground storage caverns are developed in locations with underground salt
formations that are in the vicinity of, or connected by pipeline, to NGL fractionators, truck and
rail terminals, or major NGL consumers such as petrochemical facilities or refineries. In Canada,
underground storage caverns are located in Alberta (Fort Saskatchewan, Edmonton, and
Redwater), Saskatchewan (Kerrobert, Regina, and Richardson), and Ontario (Windsor and
Sarnia).17
The total underground storage capacity for propane in Canada is estimated at 2.6
million cubic meters.18
Over the last five years, the actual capacity used has fluctuated between
6 per cent and 65 per cent of this total depending on seasonality and other demand variables.19
3.15 In order to move propane into a storage cavern, salt water (brine) is pumped out while
propane is injected into the top of the cavern. Propane and other hydrocarbons have a lower
density than brine and therefore float on top of the brine in the cavern. To remove propane from
the cavern, brine is injected into the cavern while propane is pumped out.20
The salt walls of the
cavern are insoluble to hydrocarbons, which prevents leakage.
3.16 Underground storage caverns are owned by upstream and midstream firms, and storage
space in these caverns is generally leased by certain downstream distributors to store their
16
Keyera “Fort Saskatchewan Underground Storage Expansion Project” December 7, 2009. Available online at:
https://www.keyera.com/titanweb/keyera/webcms.nsf/AllDoc/A1AD49A587A229DE8725768500707E23?OpenDo
cument.
17 Storage caverns are also operated at Marysville, Michigan, which is approximately 20 kilometres from Sarnia and
90 kilometres from Windsor. These caverns are connected to storage caverns at Sarnia and Windsor by pipeline,
train, and truck infrastructure.
18 Underground storage capacity is variable and depends on the quantity of brine in the cavern. Underground storage
capacity is expected to increase in the coming years at certain storage caverns through increased efforts to remove
excess brine.
19 These figures are for “specification” (HD-5) propane only. Underground inventories are updated and published
monthly by the NEB at: http://www.neb-one.gc.ca/clf-nsi/rnrgynfmtn/sttstc/lqdptrlmgs/lqdptrlmgs-eng.html.
20 Ontario Ministry of Natural Resources “Underground Storage – Salt Caverns”. Available online at:
http://www.mnr.gov.on.ca/en/Business/OGSR/2ColumnSubPage/STEL02_167109.html.
9
supplies until they are needed, at which point they are withdrawn from caverns for further
transport. Underground storage space is typically leased according to yearly or multi-year
contracts that specify volumes and prices.
Midstream Transportation of Propane
3.17 The two most common means for transporting propane long distances from storage
facilities or producers to downstream distributors are pipeline and rail. Transporting long
distances via truck is often uneconomic.21
.
3.18 Currently, one major pipeline system supplies propane from western Canada to central
Canada: the Enbridge System.22
The system is primarily used to transport crude oil, but two of
its lines also transport refined petroleum products and a propane-plus mix23
from Fort
Saskatchewan, Alberta to Sarnia, Ontario, where the mix is fractionated into propane, butane and
condensate:
Line 1 has a capacity of 37,600 cubic meters per day (236,500 barrels per day) and runs
from Fort Saskatchewan to Superior, Wisconsin. It transports batches24
of natural gas
liquids, refined petroleum products, and light synthetic crude oil.
Line 5 has a capacity of 78,100 cubic metres per day (491,200 barrels per day) and runs
from Superior to Sarnia. It transports batches of natural gas liquids, as well as various
types of crude oil.
3.19 From 2006 to March 2014, another pipeline system also supplied propane from western
Canada to central Canada.25
Kinder Morgan’s Cochin pipeline had a 7,950 cubic metres per day
(50,000 barrels per day) operating capacity and delivered propane from western Canada
primarily to markets in the U.S. Midwest. Cochin also delivered small volumes of propane to
Windsor, Ontario and later to Sarnia via the Eastern Delivery System pipeline (see Figure 3.4).
The capacity and utilization of the Cochin pipeline was significantly less than that of the
21
In any industry, the economic range of a transportation asset contracts and expands in response to prices. In
situations where rail infrastructure is congested or delayed by inclement weather, trucks may offer more timely
delivery than rail cars and the effective radius of trucking may expand.
22 A configuration of the entire Enbridge System (Canadian Mainline) is available online at:
http://www.enbridge.com/DeliveringEnergy/OurPipelines/LiquidsPipelines.aspx.
23 “Propane-plus” is a mixture of propane, butanes, and condensate.
24 Pipelines that move different types of liquid hydrocarbons inject each one in a sequence, creating separate parcels
or “batches” that are pumped one after another in the pipeline.
25 Several other pipelines deliver NGL from the U.S. to the Sarnia area, including the Kalkaska Pipeline, which
transports NGL from gas processing facilities in Kalkaska, Michigan, and the SCL Pipeline, which connects Sarnia
to NGL storage caverns in Marysville, Michigan.
10
Enbridge System and the vast majority of NGL (including propane) supplied to central Canada
via pipeline was through the Enbridge System.
3.20 Historically, the Cochin pipeline operated below capacity. Given declining propane
production and exports from western Canada, and growing demand for condensate in the oil
sands, Kinder Morgan applied to the NEB in 2012 for approval to reverse the section of pipeline
west of Kankakee County, Illinois to allow for condensate imports into Alberta. The NEB
approved this application in June 2013, with conditions.26
The Cochin pipeline stopped
receiving propane at the end of March 2014 and Kinder Morgan is undertaking the physical work
associated with the reversal.
3.21 The Cochin Reversal Project also required approval in the U.S. It received a presidential
permit from the U.S. State Department to proceed with the project in November 2013.27
3.22 In order for propane to be moved by rail, rail car filling and unloading infrastructure
(commonly called “racks” or “terminals”) is constructed at both the origin and the destination.
Facilities located at an originating production plant are generally owned by upstream firms,
while facilities at the destination are generally owned by a downstream firm.
3.23 Rail transit of propane can encounter significant disruptions during winter months.
Frozen signals can delay progress and cause congestion. Cold weather can also cause train
engine issues, and significant snowfalls can cause delays while tracks are cleared. Additionally,
it has been reported that one significant rail line experiences air pressure issues when the weather
is cold and, as a result, is forced to run shorter trains.28
This can result in a shortage of engines,
which further reduces the effective capacity of rail.
3.24 During the winter peak home heating season, propane rail transportation may operate at,
or near, full capacity. In this situation, if a shipment is not transported on its scheduled day, it can
be cancelled if there is no extra capacity on the following day. When this happens, downstream
firms may not obtain their contracted or planned supply.
26
The NEB decision is available online at https://docs.neb-one.gc.ca/ll-
eng/llisapi.dll/fetch/2000/90464/90552/457425/846117/962916/A3I4G9_-_Letter_Decision_-
_Kinder_Morgan_Cochin_ULC_-_KM_Cochin_Reversal_Project.pdf?nodeid=962584&vernum=-2.
27Available online at: http://www.state.gov/e/enr/applicant/applicants/217905.htm.
28 For example, trains are typically 10,000-12,000 feet long, while shorter trains used during cold weather can be
5,000-5,500 feet long.

11
Downstream Distribution of Propane
3.25 Downstream distributors generally purchase supplies from terminals directly, by sending
trains or trucks to those locations,29
or indirectly, by drawing supplies from another downstream
firm’s storage facilities or using third-party shipping.
3.26 Large downstream distributors typically have storage facilities of their own in the form of
above-ground “tank farms” containing large propane storage tanks from which delivery trucks
(or “tank wagons”) are filled.
3.27 Smaller firms, particularly those located near a terminal or near a large distributor, may
choose to run trucks to the terminal or distributor on a daily basis rather than invest in storage
facilities. Downstream firms with a small customer base typically do not own storage assets. This
reliance on trucking, especially in the case of smaller firms without storage assets, makes
downstream distribution particularly susceptible to logistical challenges during cold weather.
Snow can block or slow access roads to terminals, tank farms, and end-users (including
homeowners).
3.28 Downstream distributors that have invested in storage facilities typically have sufficient
storage capacity to fulfill one or two days’ worth of peak demand. Downstream distributors
have reported that the limited benefits30
of additional storage are outweighed by the financial and
regulatory costs associated with storage expansion, especially for downstream distributors with
only a small number of customers.31
3.29 Purchases by downstream distributors are typically made according to annually-
negotiated contracts that specify target volumes and pricing mechanisms. Under these contracts,
downstream distributors typically pay a “floating”, variable price upon receipt of their propane
supplies (the “rack rate”) and few, if any, are on fixed price contracts. When wholesale prices
fluctuate, these changes are reflected in the retail prices paid by end consumers. Most
downstream customers pay a retail price at the time of tank filling, with few negotiating fixed
price contracts in advance.32
29
Distributors in southern Ontario are primarily supplied by trucks from Sarnia truck terminals. Some of these
trucks continue into western Quebec, though rail likely becomes more economical when propane is shipped as far as
Montreal. Distributors in northwestern Ontario may be supplied by trucks from Fort Whyte, Manitoba, or by rail.
30 In the case of a severe shortage, additional storage assets still may not be sufficient to meet demand.
31 Firms estimate that adding extra storage to double their effective storage capacity would cost from $250,000 to
$500,000 and take approximately one year to become operational. Contributing to these costs are tightened
regulations on propane storage imposed following the 2008 Sunrise Propane explosion in Toronto, Ontario.
32 One exception may be northwestern Ontario, where a greater proportion of customers are reported to be on fixed
price contracts. Such contracts do not appear to be common in any other area of Canada.
12
Household Consumer Demand
3.30 Contractual terms for end-use consumers on floating price contracts vary by retailer, but
most allow for immediate customer exit subject to certain costs discussed below. For customers
on fixed price contracts, retailers pre-buy equivalent volumes from their suppliers immediately
upon entering the contract. Pre-buying in this manner comes at a premium to account for storage
costs. This premium is passed on to consumers, which may account in part for limited consumer
interest in such contracts.
3.31 Downstream distributors report that they supply propane storage tanks to customers on a
rental basis, with a small proportion of customers opting to purchase their own tanks. Once a
retailer has placed a rental tank at a customer’s site, no other supplier can fill the tank due to
contractual restrictions. If a customer wishes to switch its supplier, downstream distributors
often charge fees for tank installation, tank removal, or both. While these fees vary across
distributors and depend on the nature of the customer-supplier relationship, they represent a
deterrent to customer switching.33
3.32 Once a consumer chooses to use propane, significant investments must be made to
acquire equipment and appliances that are specifically designed to use propane only.34
As a
result, these consumers cannot easily switch to other fuels, and it is therefore likely that
residential demand for propane is inelastic in the short term.35
3.33 Given this inelastic demand, and the significant costs associated with switching from
propane to another fuel, consumers have limited options when prices rise.36
Households that rely
on propane will either consume the same volume of propane and pay substantially more for it, or
reduce their consumption in order to partially offset the higher prices. As a result, many
Canadians have been significantly impacted by the recent price increases and supply challenges.
33
See, for example, Commissioner of Competition vs. Superior Propane Inc. et al (CT-1998-002), available online
at: http://www.ct-tc.gc.ca/CasesAffaires/CasesDetails-eng.asp?CaseID=202 (“Superior Propane”); Commissioner of
Competition vs. Enbridge Services Inc. (CT-2001-008), available online at: http://www.ct-
tc.gc.ca/CasesAffaires/CasesDetails-eng.asp?CaseID=170; and Director of Investigation and Research v. Laidlaw
Waste Systems Ltd. (CT-1991-002), available online at: http://www.ct-tc.gc.ca/CasesAffaires/CasesDetails-
eng.asp?CaseID=186.
34 At the time of the Superior Propane-ICG Propane merger in 1999, the total costs associated with converting from
propane to another fuel for home heating and cooking purposes were approximately $12,300 per household. See
Superior Propane at paragraph 31.
35 Demand is “inelastic” when a small price increase results in a less-than-proportional decrease in the amount of
that product being demanded. In other words, when demand is inelastic, many consumers facing a price increase
will continue to purchase the product, rather than substituting their purchases to other products.
36 This is equally true with other fuels, such as heating oil and natural gas – once a consumer chooses which fuel to
use, there are often substantial costs that must be incurred to use other fuels.
13
The Integrated Canada-U.S. Propane Industry
3.34 The Canadian propane industry is integrated with its counterpart in the U.S. Canada
produces more propane than it consumes and exports this surplus to the U.S., its only export
market. Canada also imports small volumes of propane (equivalent to less than five per cent of
Canadian propane exports) from the U.S. into Ontario, eastern Canada, and British Columbia.37
Terminal facilities do not exist in Canada that allow for propane exports to, or propane imports
from, overseas markets.38
3.35 The primary U.S. regional markets for Canadian propane exports are the Midwest and
East Coast. In 2013, approximately 85 per cent of Canadian propane exports were to these two
regions. Canadian propane is exported to the U.S. primarily by rail (55 per cent) and pipeline (35
per cent), with trucking accounting for the remainder (10 per cent).39
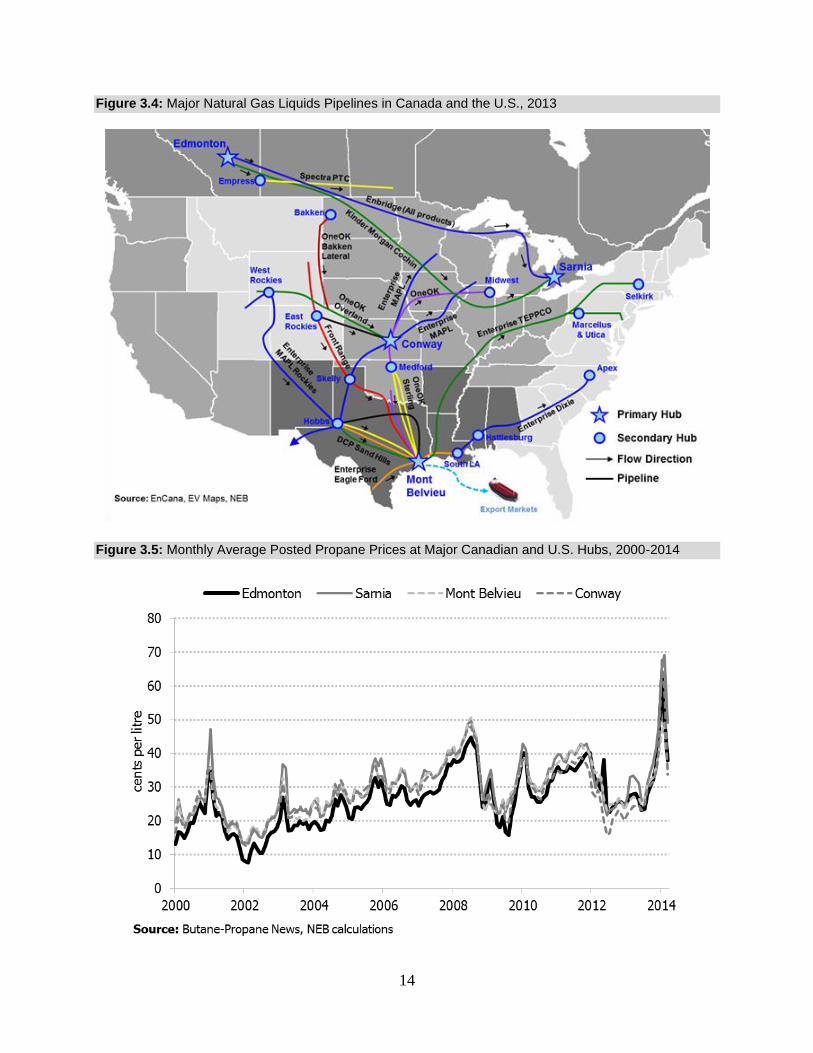
3.36 Major propane hubs in Canada include Edmonton, Alberta and Sarnia, Ontario. In the
U.S., the two largest hubs are Mont Belvieu, Texas and Conway, Kansas. Figure 3.4 shows
these four hubs along with major Canadian and U.S. pipeline infrastructure for natural gas
liquids (including propane). Figure 3.5 shows that posted wholesale prices at these hubs tend to
track each other, a further indication of the integrated nature of the Canada-U.S. industries.
37
Statistics Canada, CANSIM Table 128-0012. The most recent data available is for 2012 and shows Canadian
propane imports of 255 thousand cubic meters. Equivalent statistics from the EIA (i.e. U.S. propane exports to
Canada) are not collected.
38 The export of propane from Canada is discussed in further detail in paragraphs 3.44-3.48 and paragraphs 4.15-
4.17 below.
39 NEB data.
14
Figure 3.4: Major Natural Gas Liquids Pipelines in Canada and the U.S., 2013
Figure 3.5: Monthly Average Posted Propane Prices at Major Canadian and U.S. Hubs, 2000-2014
15
How Canadian Propane Prices are Determined
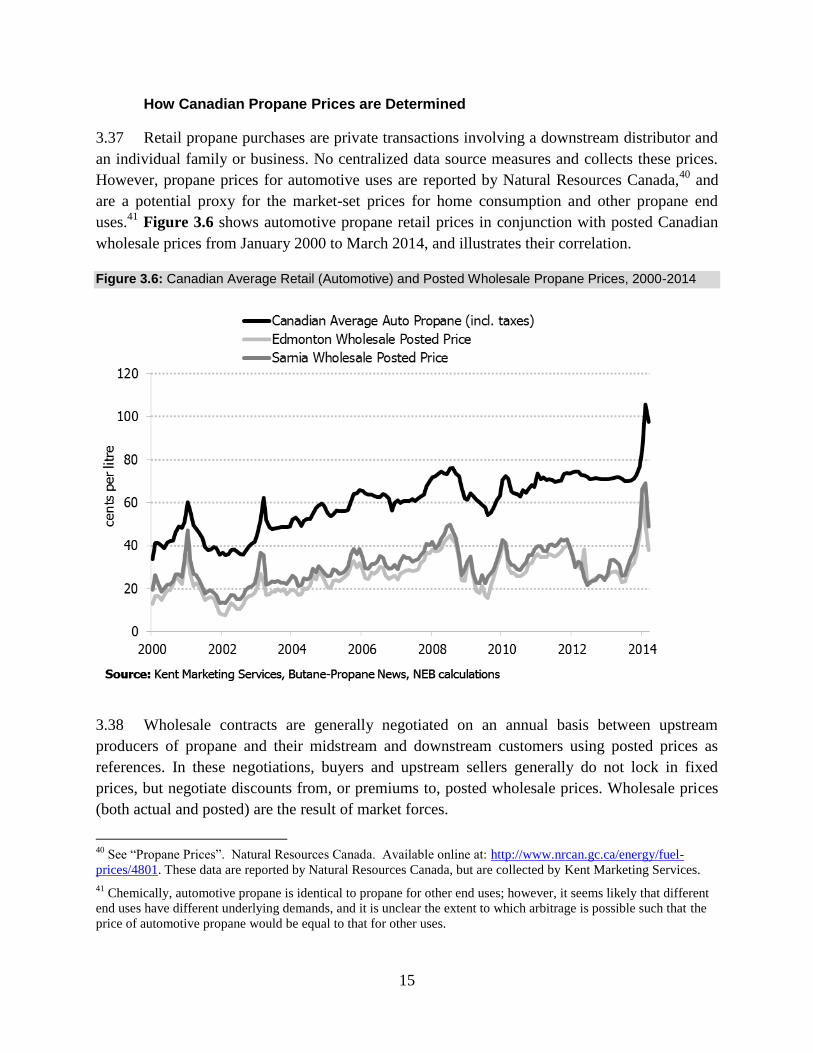
3.37 Retail propane purchases are private transactions involving a downstream distributor and
an individual family or business. No centralized data source measures and collects these prices.
However, propane prices for automotive uses are reported by Natural Resources Canada,40
and
are a potential proxy for the market-set prices for home consumption and other propane end
uses.41
Figure 3.6 shows automotive propane retail prices in conjunction with posted Canadian
wholesale prices from January 2000 to March 2014, and illustrates their correlation.
Figure 3.6: Canadian Average Retail (Automotive) and Posted Wholesale Propane Prices, 2000-2014
3.38 Wholesale contracts are generally negotiated on an annual basis between upstream
producers of propane and their midstream and downstream customers using posted prices as
references. In these negotiations, buyers and upstream sellers generally do not lock in fixed
prices, but negotiate discounts from, or premiums to, posted wholesale prices. Wholesale prices
(both actual and posted) are the result of market forces.
40
See “Propane Prices”. Natural Resources Canada. Available online at: http://www.nrcan.gc.ca/energy/fuel-
prices/4801. These data are reported by Natural Resources Canada, but are collected by Kent Marketing Services.
41 Chemically, automotive propane is identical to propane for other end uses; however, it seems likely that different
end uses have different underlying demands, and it is unclear the extent to which arbitrage is possible such that the
price of automotive propane would be equal to that for other uses.
16
3.39 When wholesale prices rise or fall (which increases or decreases producers’ margins),
midstream and downstream firms generally pass on this change, at least partially, to end-use
consumers. Market participants have indicated that midstream and downstream distributors
focus on achieving a certain cents-per-litre margin on propane, rather than attempting to earn a
particular percentage margin.42
Fixed price contracts, in which consumers pay a premium for
price certainty, are uncommon for household uses.
Regulation of Propane
3.40 The propane industry is subject to various federal, provincial, and municipal regulations,
including general business and environmental regulations applicable to many industries. Two
areas of Canadian propane regulation particularly relevant for this report are retail prices and
exports.43
3.41 Retail propane prices are regulated to varying degrees in five Canadian provinces by the
following authorities:
Prince Edward Island Regulatory and Appeals Commission;
Newfoundland and Labrador Board of Commissioners of Public Utilities;
New Brunswick Energy and Utilities Board;
Public Utilities Board of Manitoba; and
British Columbia Utilities Commission.
3.42 The manner in which retail propane prices are regulated varies from province to
province,44
as does the application of the regulated price (e.g., whether regulation applies to all
propane, only propane for space heating, only propane delivered through the pipeline grid, etc.).
These regulations are made pursuant to specific provincial legislation and only apply to propane
prices within a given province. Unregulated retail prices in these and other provinces are
determined by the market.
42
When prices rise, the downstream distributor’s margin as a percentage of its costs falls, but its cents-per-litre
margin remains unchanged.
43 Propane market activities are also subject to the federal Competition Act. Section 7 of this report presents the
Bureau’s independent analysis of the extent to which anti-competitive activities may have exacerbated the impact of
recent price spikes on consumers.
44 Regulation often takes the form of maximum prices based on maximum mark-ups to posted wholesale prices. As
such, regulated prices are still linked to the market and fluctuate. For an example, see the New Brunswick Energy
and Utility Board’s explanation of how it sets propane prices at: http://www.nbeub.ca/index.php/en/petroleum-
products/how-the-maximum-prices-are-set-and-other-questions.
17
3.43 Canadian propane exports are regulated by the NEB and governed by the National
Energy Board Act (NEB Act) and related regulations.45
All propane exports must be authorized
by a licence or order, and must be reported to the NEB on a monthly basis.46
3.44 In the case of propane export licences, the Board must satisfy itself that the propane to be
exported is surplus to Canadian needs.47
A propane export licence requires Governor in Council
(i.e. federal Cabinet) approval, and cannot exceed 25 years. The Board has discretion to include
terms and conditions in the license on subject matters set out in the NEB Act and its
regulations.48
3.45 Propane export orders are not subject to the “surplus test” applicable to export licenses
and do not require Governor in Council approval. Propane export orders cannot exceed one
year49
and contain different terms and conditions than those applicable to export licenses.50
Export order applications normally require minimal information and are processed in two
working days by the NEB. Export licence applications have more detailed information
requirements51
and entail significantly more assessment time. Holders of both licenses and
orders are required to report certain information to the NEB, including monthly export volumes
and revenues.
3.46 In recent decades, the propane industry has exported propane by means of short-term
orders rather than long-term licences. No propane licenses are currently in effect. Between 64
and 72 export orders have been issued in each of the last five years.
3.47 The NEB’s current propane export regime reflects a broader policy trend, initiated in
198552
and reinforced in later years through trade agreements and other measures, toward a more
flexible and market-oriented regulatory framework for the energy industry. The NEB affirmed
45
Related regulations are the National Energy Board Act Part VI (Oil and Gas) Regulations (Part VI Regulations)
and the National Energy Board Export and Import Reporting Regulations.
46 Exports are published monthly by the NEB at: http://www.neb-one.gc.ca/CommodityStatistics/?language=english.
47 See section 118 of the NEB Act.
48 For example, see Section 21 of the Part VI Regulations, which includes export point and volume conditions
applicable to propane export licenses. Any terms and conditions must be consistent with Canada’s trade obligations.
49 Proposed changes to the Part VI Regulations would amend propane export orders to not exceed two years, making
them consistent with export orders for other regulated commodities such as natural gas, ethane, and heavy crude oil.
50 See Section 23 of the Part VI Regulations. The NEB does not, as a matter of federal policy, apply some of the
terms and conditions applicable to propane export orders, including those related to export point and volume.
51 See Section 20 of the Part VI Regulations. There are no equivalent requirements for export orders.
52 In 1985, the Governments of Canada, Alberta, British Columbia, and Saskatchewan signed what are known as the
Western Accord and the Halloween Agreement, which significantly restructured the Canadian regulatory regime for
energy.
18
this policy direction in a 2002 decision on Atlantic Canadian export order procedures for natural
gas: “The Board believes that the public interest is best served by allowing markets to work
unless there is clear evidence of significant market dysfunction.”53
In that decision, the Board
decided against implementing “procedures that would unduly interfere with the normal operation
of the market.”
4. Current Situation
Prices
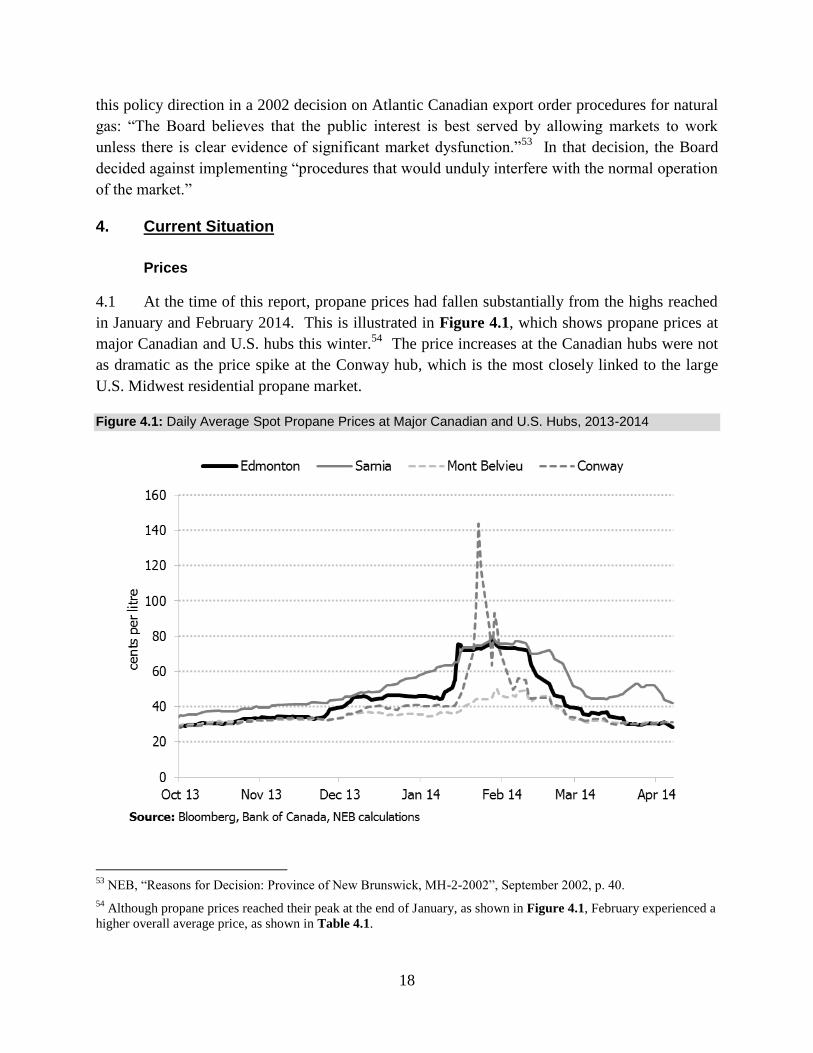
4.1 At the time of this report, propane prices had fallen substantially from the highs reached
in January and February 2014. This is illustrated in Figure 4.1, which shows propane prices at
major Canadian and U.S. hubs this winter.54
The price increases at the Canadian hubs were not
as dramatic as the price spike at the Conway hub, which is the most closely linked to the large
U.S. Midwest residential propane market.
Figure 4.1: Daily Average Spot Propane Prices at Major Canadian and U.S. Hubs, 2013-2014
53
NEB, “Reasons for Decision: Province of New Brunswick, MH-2-2002”, September 2002, p. 40.
54 Although propane prices reached their peak at the end of January, as shown in Figure 4.1, February experienced a
higher overall average price, as shown in Table 4.1.
19
4.2 Figure 3.5 and Figure 3.6 illustrate both the size of the price increases this winter and
the historic volatility of propane prices more generally. Although this winter’s price increases
were notable for the pace at which they occurred and for breaking nominal price records, they
are comparable, in terms of percentage increase, to other rapid propane price spikes that have
occurred in Canada since 2000, as shown in Table 4.1.
Table 4.1: Propane Price Spikes at Sarnia Using Average Monthly Prices, 2000-2014
Period Low Price Month
Low Price (cents/L)
High Price Month
High Price (cents/L)
Percentage increase
2000-01 April 2000 18.8 January 2001 47.2 151 %
2002-03 January 2002 13.7 February 2003 36.8 167 %
2009-10 July 2009 22.7 January 2010 42.8 89 %
2013-14 June 2013 26.0 February 2014 69.2 166 %
Production
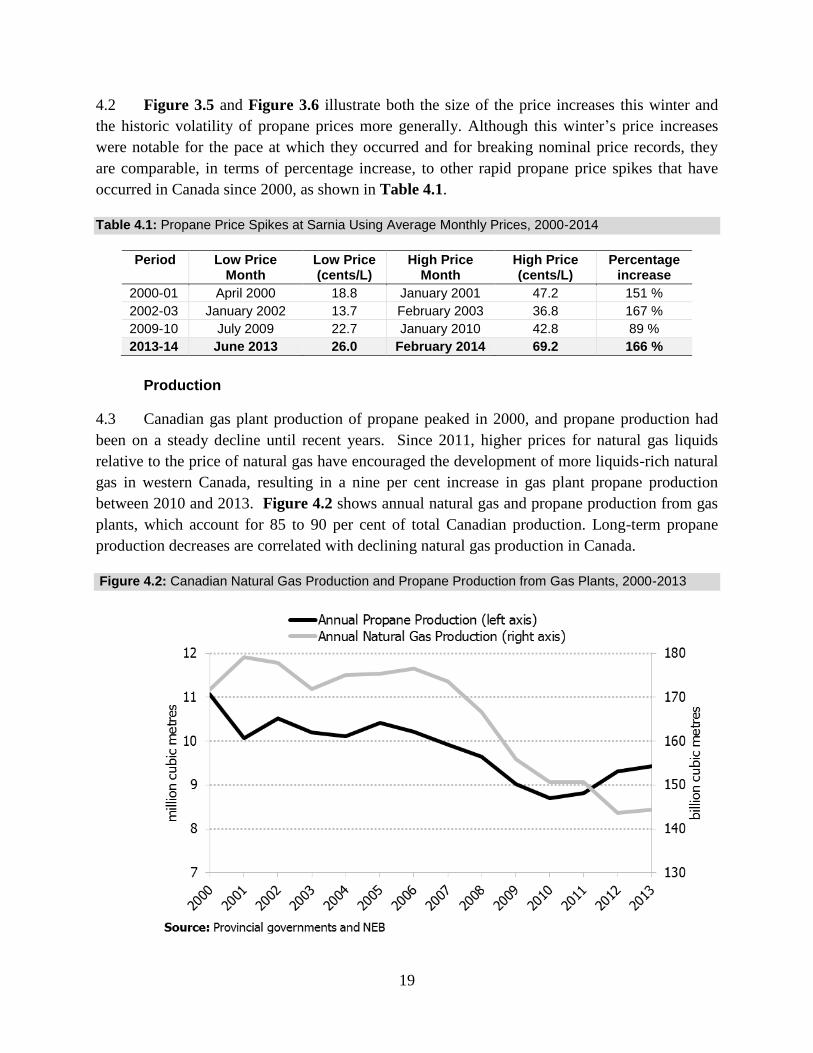
4.3 Canadian gas plant production of propane peaked in 2000, and propane production had
been on a steady decline until recent years. Since 2011, higher prices for natural gas liquids
relative to the price of natural gas have encouraged the development of more liquids-rich natural
gas in western Canada, resulting in a nine per cent increase in gas plant propane production
between 2010 and 2013. Figure 4.2 shows annual natural gas and propane production from gas
plants, which account for 85 to 90 per cent of total Canadian production. Long-term propane
production decreases are correlated with declining natural gas production in Canada.
Figure 4.2: Canadian Natural Gas Production and Propane Production from Gas Plants, 2000-2013
20
4.4 Because propane is produced as a by-product of natural gas extraction and crude oil
refining, production of propane cannot be expanded without also expanding the production of
either natural gas or refined petroleum products – extensive processes that require significant
time and resources, and which cannot be achieved in the short term.
Inventories and Supply
4.5 Interviews with Canadian industry participants indicate that downstream distributors, and
ultimately consumers, had mixed success in acquiring sufficient supplies of propane to meet their
needs this winter. Most distributors were subject to delays of varying lengths in accessing
propane supplies, and some were put on “allotment”, whereby they could not access the full
quantity of propane that they had contracted for. In certain cases, downstream suppliers were
denied supply on a temporary basis, and this led to shortages of supplies for consumers. These
problems seem to have manifested themselves more severely in eastern Ontario and western
Quebec than in other areas of Canada, as reflected in reports of local delivery problems in these
regions during December and January.
4.6 Industry interviews also indicated that small-scale propane retailers, particularly those
with only one source of supply and no formal supply contract in place, sometimes had to provide
less propane than the amount desired by consumers. Rationing of this nature was reported by
smaller suppliers in greater proportion compared to larger, more established retailers with
diverse supply contracts in place. These shortages were felt most severely in late December and
early January, with downstream distributors generally indicating that these restrictions were
eliminated by late January. Full service resumed shortly thereafter, once missed deliveries had
been made.
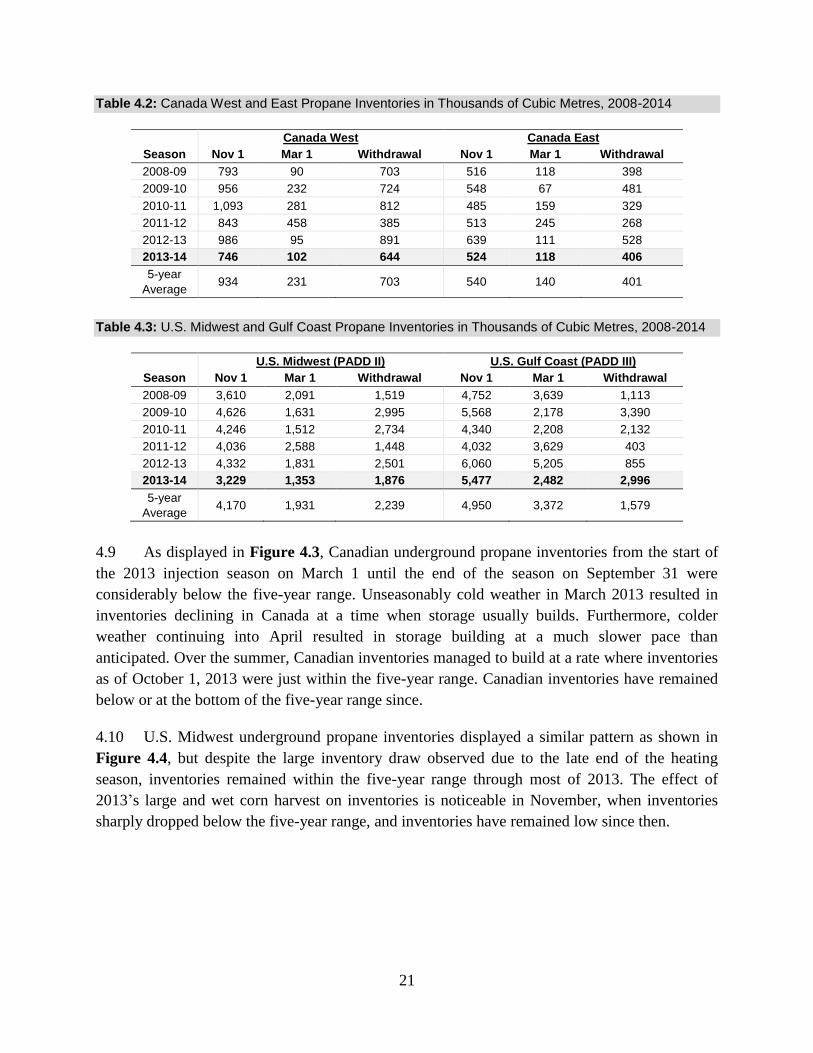
4.7 More generally, Table 4.2 displays historical inventory levels and heating season
withdrawals in eastern Canada and western Canada, while Table 4.3 shows the same information
for the U.S. Midwest and Gulf Coast. The Midwest is a primary export market for Canadian
propane, and is also the U.S. region that relies most heavily on propane for home and space
heating needs. Additionally, wholesale prices at Midwest storage and trading hubs, such as
Conway, Kansas, are linked with hubs in Canada. The U.S. Gulf Coast is the center of the
petrochemical and refining industry in the U.S. and is also where the vast majority of propane is
exported to overseas markets.
4.8 Table 4.2 and Table 4.3 also illustrate the effect of seasonal temperatures on propane
inventories. For example, the 2011-2012 winter was notable for being one of the warmest on
record for parts of Canada and the U.S., and the withdrawal of propane from underground
inventories in most regions was close to half the size of the withdrawals observed during winters
with more “normal” seasonal temperatures, such as the winters of 2010-2011 and 2012-2013.
21
Table 4.2: Canada West and East Propane Inventories in Thousands of Cubic Metres, 2008-2014
Canada West Canada East
Season Nov 1 Mar 1 Withdrawal Nov 1 Mar 1 Withdrawal
2008-09 793 90 703 516 118 398
2009-10 956 232 724 548 67 481
2010-11 1,093 281 812 485 159 329
2011-12 843 458 385 513 245 268
2012-13 986 95 891 639 111 528
2013-14 746 102 644 524 118 406
5-year
Average 934 231 703 540 140 401
Table 4.3: U.S. Midwest and Gulf Coast Propane Inventories in Thousands of Cubic Metres, 2008-2014
U.S. Midwest (PADD II) U.S. Gulf Coast (PADD III)
Season Nov 1 Mar 1 Withdrawal Nov 1 Mar 1 Withdrawal
2008-09 3,610 2,091 1,519 4,752 3,639 1,113
2009-10 4,626 1,631 2,995 5,568 2,178 3,390
2010-11 4,246 1,512 2,734 4,340 2,208 2,132
2011-12 4,036 2,588 1,448 4,032 3,629 403
2012-13 4,332 1,831 2,501 6,060 5,205 855
2013-14 3,229 1,353 1,876 5,477 2,482 2,996
5-year
Average 4,170 1,931 2,239 4,950 3,372 1,579
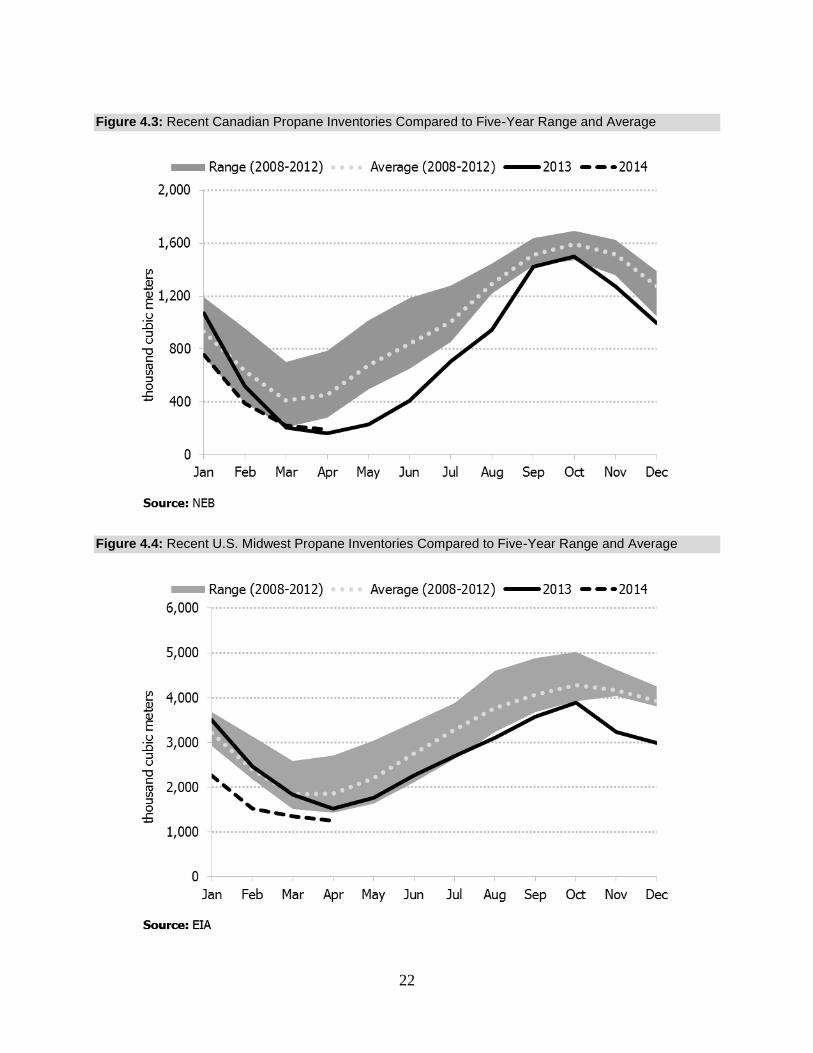
4.9 As displayed in Figure 4.3, Canadian underground propane inventories from the start of
the 2013 injection season on March 1 until the end of the season on September 31 were
considerably below the five-year range. Unseasonably cold weather in March 2013 resulted in
inventories declining in Canada at a time when storage usually builds. Furthermore, colder
weather continuing into April resulted in storage building at a much slower pace than
anticipated. Over the summer, Canadian inventories managed to build at a rate where inventories
as of October 1, 2013 were just within the five-year range. Canadian inventories have remained
below or at the bottom of the five-year range since.
4.10 U.S. Midwest underground propane inventories displayed a similar pattern as shown in
Figure 4.4, but despite the large inventory draw observed due to the late end of the heating
season, inventories remained within the five-year range through most of 2013. The effect of
2013’s large and wet corn harvest on inventories is noticeable in November, when inventories
sharply dropped below the five-year range, and inventories have remained low since then.
22
Figure 4.3: Recent Canadian Propane Inventories Compared to Five-Year Range and Average
Figure 4.4: Recent U.S. Midwest Propane Inventories Compared to Five-Year Range and Average
23
4.11 In early 2014, large storage draws continued in Canada and the U.S. Midwest, primarily
due to colder-than-average weather. Recent data, including that shown in Table 4.3, suggest that
the low inventory situation in the U.S. Midwest was mitigated by propane from the U.S. Gulf
Coast flowing northward to markets. The Gulf Coast withdrawal this winter was nearly double
the five-year average and the largest since 2009-2010 due to both higher exports and increased
volumes flowing northward.55
As of early April 2014, U.S. Midwest inventories still remain low,
but are closer to the five-year range.
4.12 This redirection of supply was achieved through market responses to price differentials
(see Figure 4.1 and Figure 5.8) and policy responses at the U.S. state and federal levels. With
regard to the latter, states of energy emergency were declared in more than 30 U.S. states. This
led to the relaxation of trucking hours-of-service restrictions, which in turn facilitated increased
propane deliveries from the U.S. Gulf Coast.
4.13 Furthermore, the Federal Energy Regulatory Commission (FERC) invoked its emergency
authority for the first time56
to help redirect propane supplies.57
FERC issued an order that
directed Enterprise TE Products Pipeline Company, LLC (TEPPCO) to temporarily provide
priority treatment58
to propane shipments on its pipelines from Mont Belvieu to the U.S.
Midwest and Northeast from February 7, 2014 to February 14, 2014. During that week, shippers
injected an additional 80 thousand cubic metres (500 thousand barrels) of propane into
TEPPCO.59
The FERC extended the order to February 21, 2014, which TEPPCO accepted.60
4.14 Authorities in Canada did not pursue the mitigation measures that were used in the U.S.
The relevant Canadian authorities have extended trucking hours in response to previous energy-
related shortages,61
but did not appear to do so in this instance. Also, though the NEB may have
55
PIRA, U.S. Weekly Propane Stocks by PADD Report, February 12, 2014 and February 26, 2014.
56 See http://www.ferc.gov/media/news-releases/2014/2014-1/02-07-14.asp.
57 The FERC acted upon information from the Department of Homeland Security and information in correspondence
from Governors, Senators and Members of Congress. The FERC also received a request to exercise its emergency
powers from the National Propane Gas Association. See FERC Docket Nos. OR14-19-000, OR14-20-000.
58 Typically, companies operating pipelines do not own the commodities shipped in their pipelines; rather, they
transport commodities owned by the shippers.
59 “Enterprise increasing TEPPCO propane shipments following US FERC order”, Platts, February 10, 2014.
Available online at: http://www.platts.com/latest-news/oil/houston/enterprise-increasing-teppco-propane-shipments-
21198473.
60 Available online at: http://www.ferc.gov/CalendarFiles/20140211142718-OR14-20-000A.pdf. Another U.S.
midstream company, ONEOK, filed tariff revisions with the FERC on January 31, 2014 to enable a section of the
North Line 5 pipeline between Medford, Oklahoma and Bushton, Kansas to move propane from south to north, if
operating circumstances permitted.
61 For example, Ontario waived certain trucking rules in 2007 in response to shortages at retail fueling stations. See:
http://www.cbc.ca/news/business/trucking-rules-waived-to-help-ont-deal-with-fuel-crunch-1.669761.
24
the authority to hold a short proceeding to consider, for example, what measures within its
jurisdiction could be taken and be most effective, the NEB does not have broad emergency
powers equivalent to those of the FERC. The NEB did not receive any requests this winter for
emergency proceedings related to propane.62
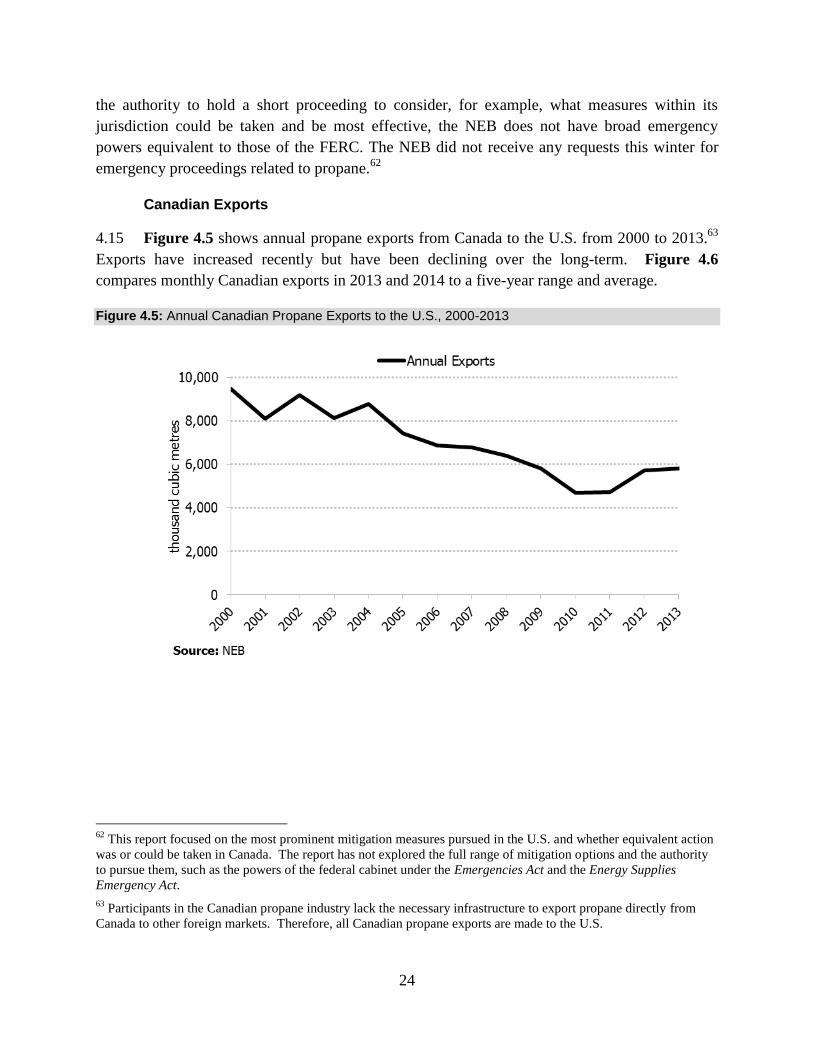
Canadian Exports
4.15 Figure 4.5 shows annual propane exports from Canada to the U.S. from 2000 to 2013.63
Exports have increased recently but have been declining over the long-term. Figure 4.6
compares monthly Canadian exports in 2013 and 2014 to a five-year range and average.
Figure 4.5: Annual Canadian Propane Exports to the U.S., 2000-2013
62
This report focused on the most prominent mitigation measures pursued in the U.S. and whether equivalent action
was or could be taken in Canada. The report has not explored the full range of mitigation options and the authority
to pursue them, such as the powers of the federal cabinet under the Emergencies Act and the Energy Supplies
Emergency Act.
63 Participants in the Canadian propane industry lack the necessary infrastructure to export propane directly from
Canada to other foreign markets. Therefore, all Canadian propane exports are made to the U.S.
25
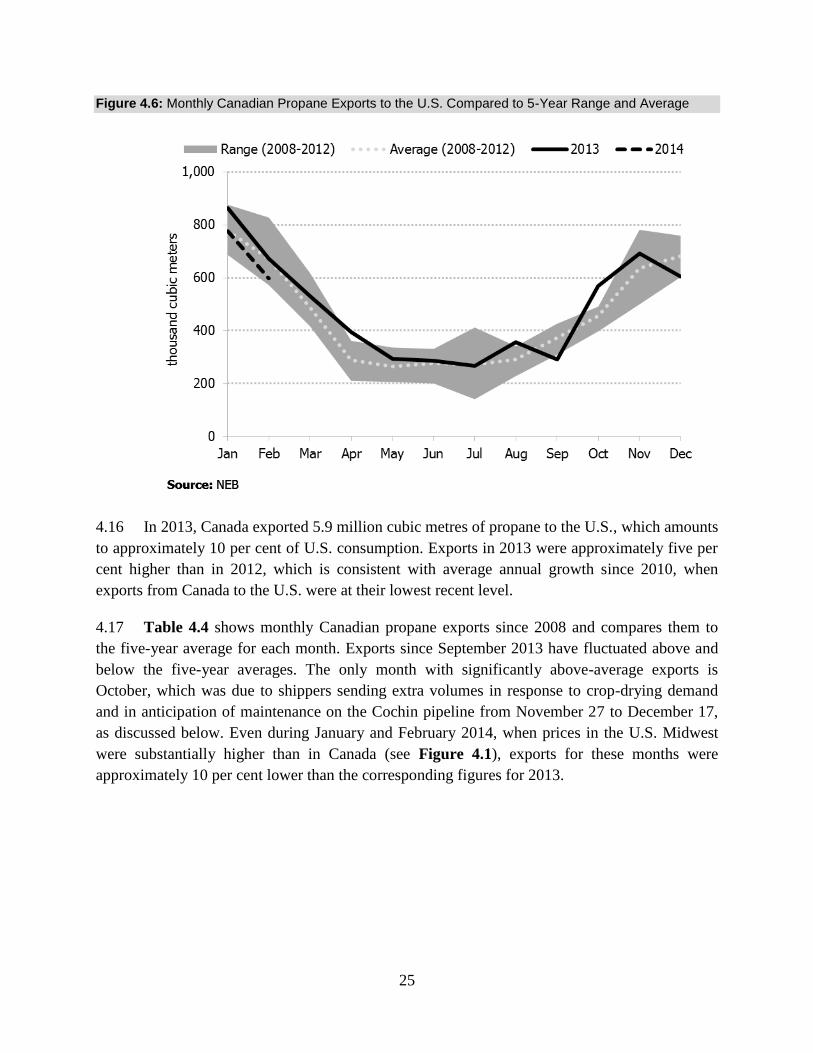
Figure 4.6: Monthly Canadian Propane Exports to the U.S. Compared to 5-Year Range and Average
4.16 In 2013, Canada exported 5.9 million cubic metres of propane to the U.S., which amounts
to approximately 10 per cent of U.S. consumption. Exports in 2013 were approximately five per
cent higher than in 2012, which is consistent with average annual growth since 2010, when
exports from Canada to the U.S. were at their lowest recent level.
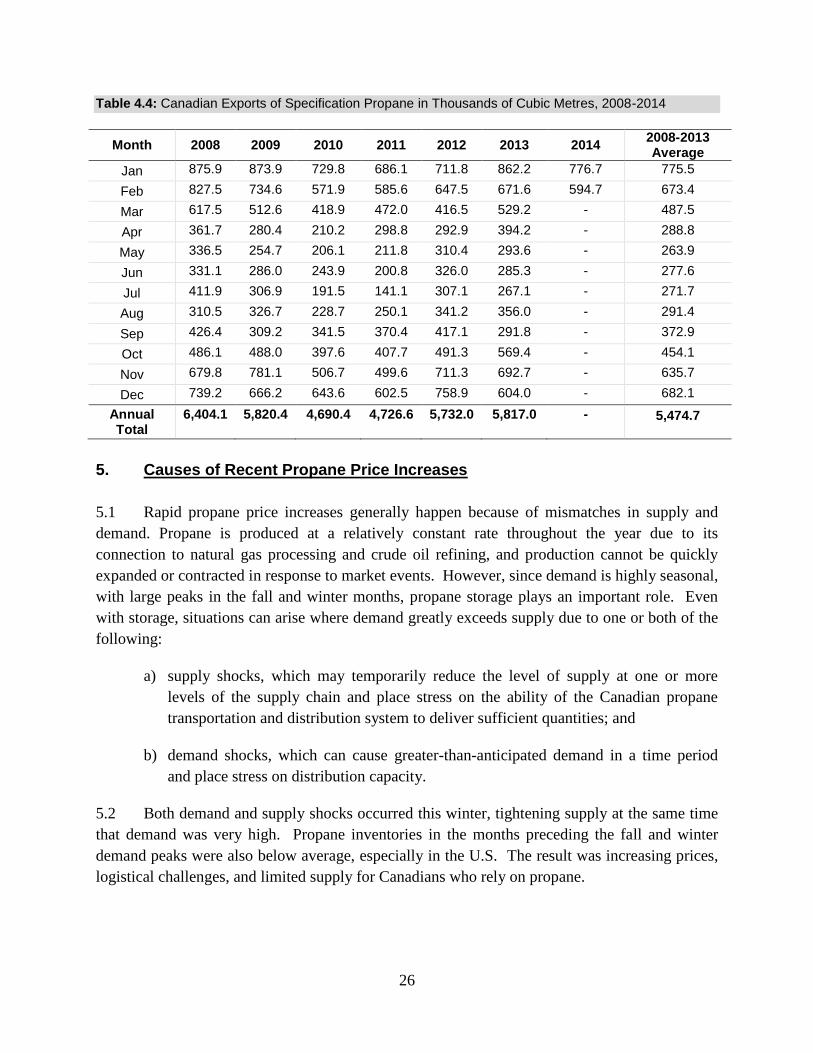
4.17 Table 4.4 shows monthly Canadian propane exports since 2008 and compares them to
the five-year average for each month. Exports since September 2013 have fluctuated above and
below the five-year averages. The only month with significantly above-average exports is
October, which was due to shippers sending extra volumes in response to crop-drying demand
and in anticipation of maintenance on the Cochin pipeline from November 27 to December 17,
as discussed below. Even during January and February 2014, when prices in the U.S. Midwest
were substantially higher than in Canada (see Figure 4.1), exports for these months were
approximately 10 per cent lower than the corresponding figures for 2013.
26
Table 4.4: Canadian Exports of Specification Propane in Thousands of Cubic Metres, 2008-2014
Month 2008 2009 2010 2011 2012 2013 2014 2008-2013 Average
Jan 875.9 873.9 729.8 686.1 711.8 862.2 776.7 775.5
Feb 827.5 734.6 571.9 585.6 647.5 671.6 594.7 673.4
Mar 617.5 512.6 418.9 472.0 416.5 529.2 - 487.5
Apr 361.7 280.4 210.2 298.8 292.9 394.2 - 288.8
May 336.5 254.7 206.1 211.8 310.4 293.6 - 263.9
Jun 331.1 286.0 243.9 200.8 326.0 285.3 - 277.6
Jul 411.9 306.9 191.5 141.1 307.1 267.1 - 271.7
Aug 310.5 326.7 228.7 250.1 341.2 356.0 - 291.4
Sep 426.4 309.2 341.5 370.4 417.1 291.8 - 372.9
Oct 486.1 488.0 397.6 407.7 491.3 569.4 - 454.1
Nov 679.8 781.1 506.7 499.6 711.3 692.7 - 635.7
Dec 739.2 666.2 643.6 602.5 758.9 604.0 - 682.1
Annual Total
6,404.1 5,820.4 4,690.4 4,726.6 5,732.0 5,817.0 - 5,474.7
5. Causes of Recent Propane Price Increases
5.1 Rapid propane price increases generally happen because of mismatches in supply and
demand. Propane is produced at a relatively constant rate throughout the year due to its
connection to natural gas processing and crude oil refining, and production cannot be quickly
expanded or contracted in response to market events. However, since demand is highly seasonal,
with large peaks in the fall and winter months, propane storage plays an important role. Even
with storage, situations can arise where demand greatly exceeds supply due to one or both of the
following:
a) supply shocks, which may temporarily reduce the level of supply at one or more
levels of the supply chain and place stress on the ability of the Canadian propane
transportation and distribution system to deliver sufficient quantities; and
b) demand shocks, which can cause greater-than-anticipated demand in a time period
and place stress on distribution capacity.
5.2 Both demand and supply shocks occurred this winter, tightening supply at the same time
that demand was very high. Propane inventories in the months preceding the fall and winter
demand peaks were also below average, especially in the U.S. The result was increasing prices,
logistical challenges, and limited supply for Canadians who rely on propane.
27
5.3 In years with less severe demand and/or supply shocks, demand in excess of contracted
volumes can be covered by supplies from a spot market.64
In situations with high sustained
demand, however, few market participants have the ability to supply excess propane, and spot
markets cannot effectively fulfill this role.
Increased Demand given Cold Weather
5.4 The winter of 2013-2014 has been colder than previous winters. Since a significant
proportion of annual demand for propane occurs during winter (i.e., for home and space heating),
the unusually cold weather created a demand shock. Retailers indicated in interviews that
customer demand for home heating increased by 20 to 25 per cent compared to prior winters.
5.5 One way to measure how cold a winter has been in a geographic area is the number of
“heating degree days”65
experienced in that area. Figure 5.1 reports the number of heating
degree days experienced during the past three winters across Canada, and shows that the winter
of 2013-2014 was abnormally cold, whereas the two previous winters were relatively mild.66
5.6 Firms throughout the Canadian propane supply chain indicated that, when choosing
appropriate inventory levels for winter, they make forecasts based on their experience during the
past three to five winters. The cold temperatures this winter were unexpected in these forecasts,
and this contributed to propane inventories being drawn down more quickly than anticipated.67
5.7 Feedback from industry participants indicated that few industry players accurately
predicted the tight supplies, increased demand, or price increases experienced this winter.
Figure 5.2 presents propane price futures curves at the Conway price hub68
at the end of each
64
Spot market prices are typically not guaranteed for any length of time, and can be either greater than (in times of
tight supply) or less than (in times of abundant supply) contracted prices. Participants in a spot market can be any
mix of upstream, midstream, and downstream firms – literally anyone who has surplus propane at a point in time.
65 See Environment Canada’s Climate “Glossary”. Available online at: http://climate.weather.gc.ca/glossary_e.html.
Heating degree days measure both: (1) the amount of days that a particular geographic area has experienced
temperatures below 18 degrees Celsius, and (2) the amount of the deviation from the 18 degrees Celsius benchmark.
For example, two days of -20 degree Celsius weather is 76 “heating degree days” – a 38 degree deviation from 18
degrees Celsius felt across (multiplied by) two days.
66 This graph reports heating degree days for all of Canada and not only for the areas where significant propane
demand exists. Therefore, the January 2014 data point may understate the extent of cold in eastern Canada, as
western Canada experienced uncharacteristic warmth during this period. Conversely, the February and March data
points may be indicative of exceptional cold in all regions of Canada and not just areas with high propane demand.
67 Storage capacity must be rented, so firms have an incentive to forecast conservatively in order to minimize costs.
In the case of a firm that owns storage assets, there is an opportunity cost associated with filling those assets with its
own propane, as opposed to having sufficient excess capacity available for rental to third parties. In years where this
conservative forecasting leads to shortages at any one firm, extra supplies can be acquired via a spot market. This
year, few market participants had excess propane, and spot markets were unable to fulfill this role.
68 Conway is a key propane storage and trading hub in Kansas and is closely linked with areas in the Midwest
affected by the tight supply situation. See Figure 3.5.
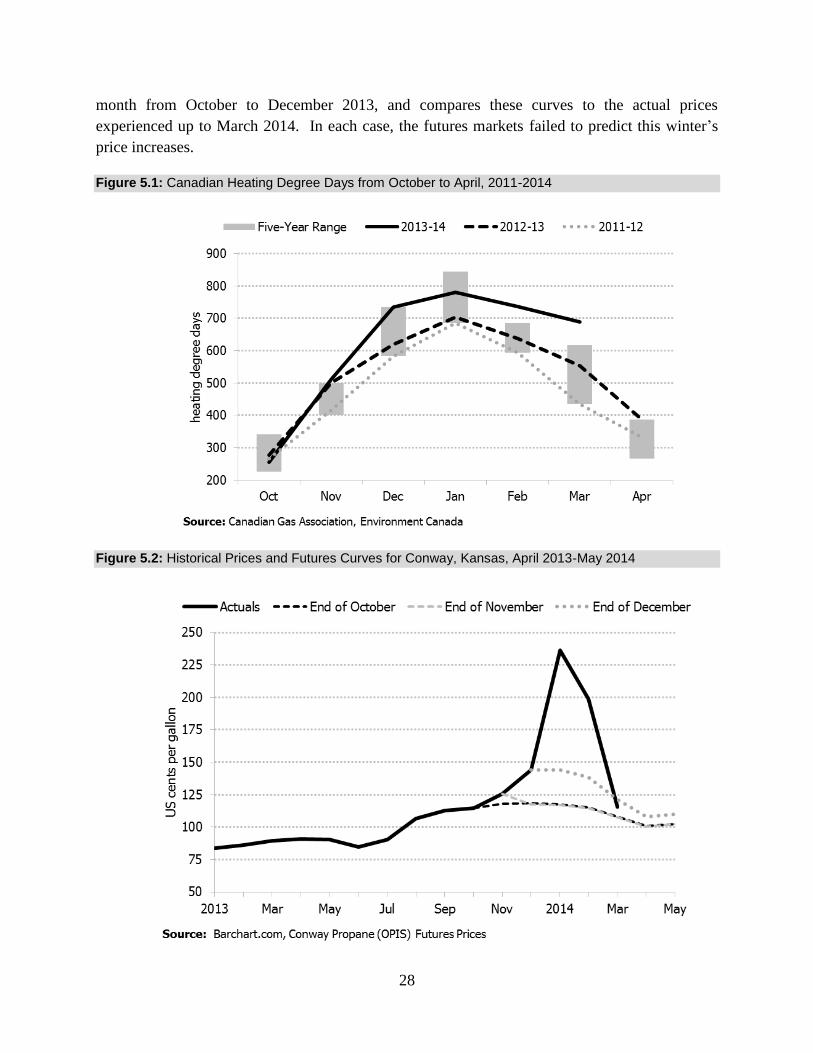
28
month from October to December 2013, and compares these curves to the actual prices
experienced up to March 2014. In each case, the futures markets failed to predict this winter’s
price increases.
Figure 5.1: Canadian Heating Degree Days from October to April, 2011-2014
Figure 5.2: Historical Prices and Futures Curves for Conway, Kansas, April 2013-May 2014
29
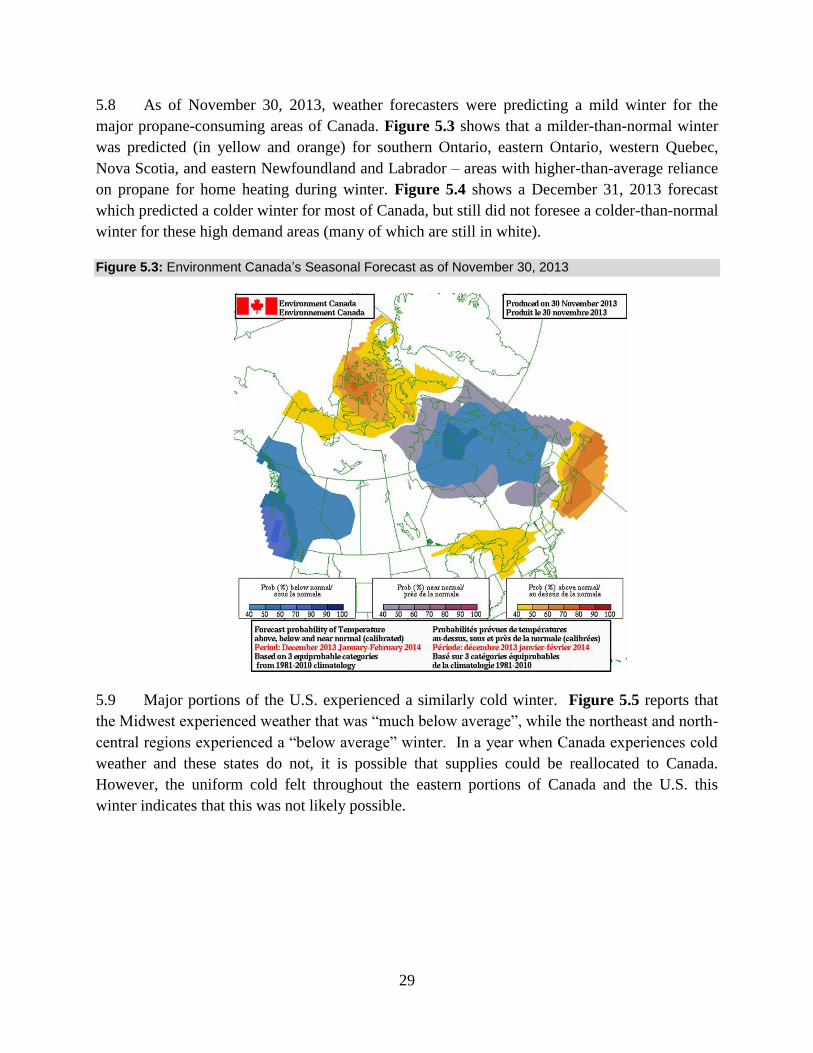
5.8 As of November 30, 2013, weather forecasters were predicting a mild winter for the
major propane-consuming areas of Canada. Figure 5.3 shows that a milder-than-normal winter
was predicted (in yellow and orange) for southern Ontario, eastern Ontario, western Quebec,
Nova Scotia, and eastern Newfoundland and Labrador – areas with higher-than-average reliance
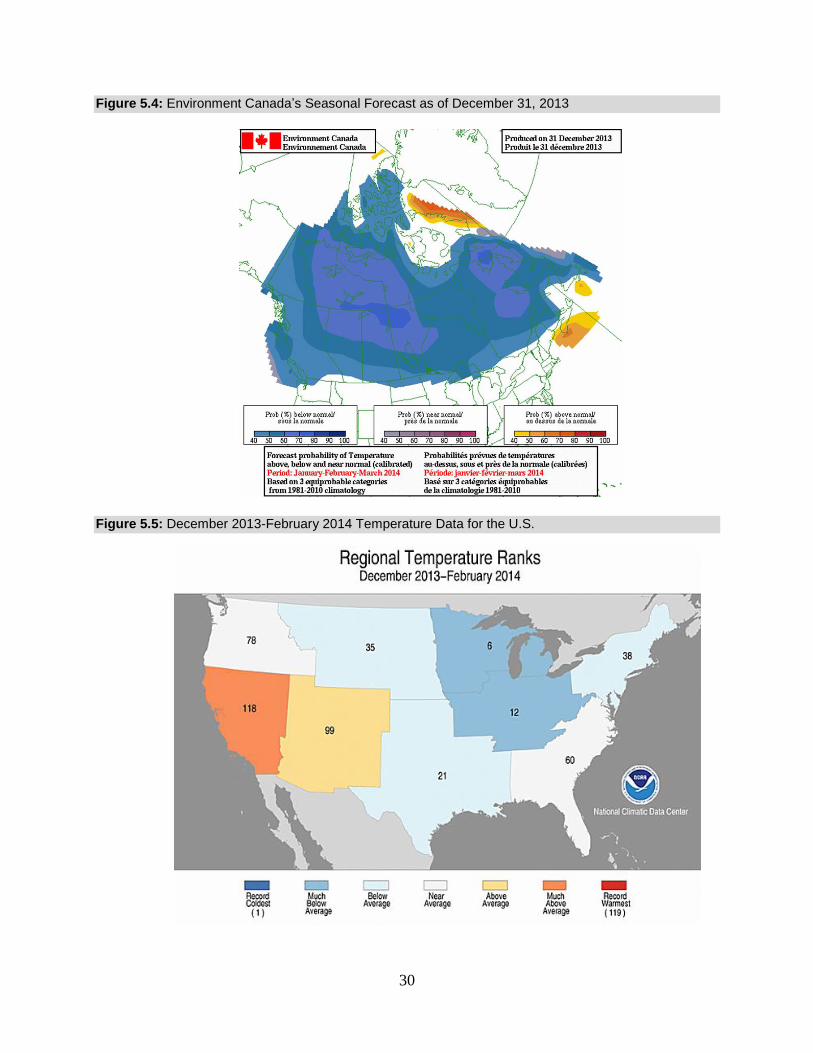
on propane for home heating during winter. Figure 5.4 shows a December 31, 2013 forecast
which predicted a colder winter for most of Canada, but still did not foresee a colder-than-normal
winter for these high demand areas (many of which are still in white).
Figure 5.3: Environment Canada’s Seasonal Forecast as of November 30, 2013
5.9 Major portions of the U.S. experienced a similarly cold winter. Figure 5.5 reports that
the Midwest experienced weather that was “much below average”, while the northeast and north-
central regions experienced a “below average” winter. In a year when Canada experiences cold
weather and these states do not, it is possible that supplies could be reallocated to Canada.
However, the uniform cold felt throughout the eastern portions of Canada and the U.S. this
winter indicates that this was not likely possible.
30
Figure 5.4: Environment Canada’s Seasonal Forecast as of December 31, 2013
Figure 5.5: December 2013-February 2014 Temperature Data for the U.S.
31
5.10 The cold weather experienced across Canada and the U.S. also delayed and/or reduced
the volume of propane shipped by train. As mentioned previously, at times of high demand for
all propane-related assets, it can be difficult or impossible to make up for such shortcomings in
the short run due to congestion issues and tight capacity utilization.
Increased Demand for Crop Drying
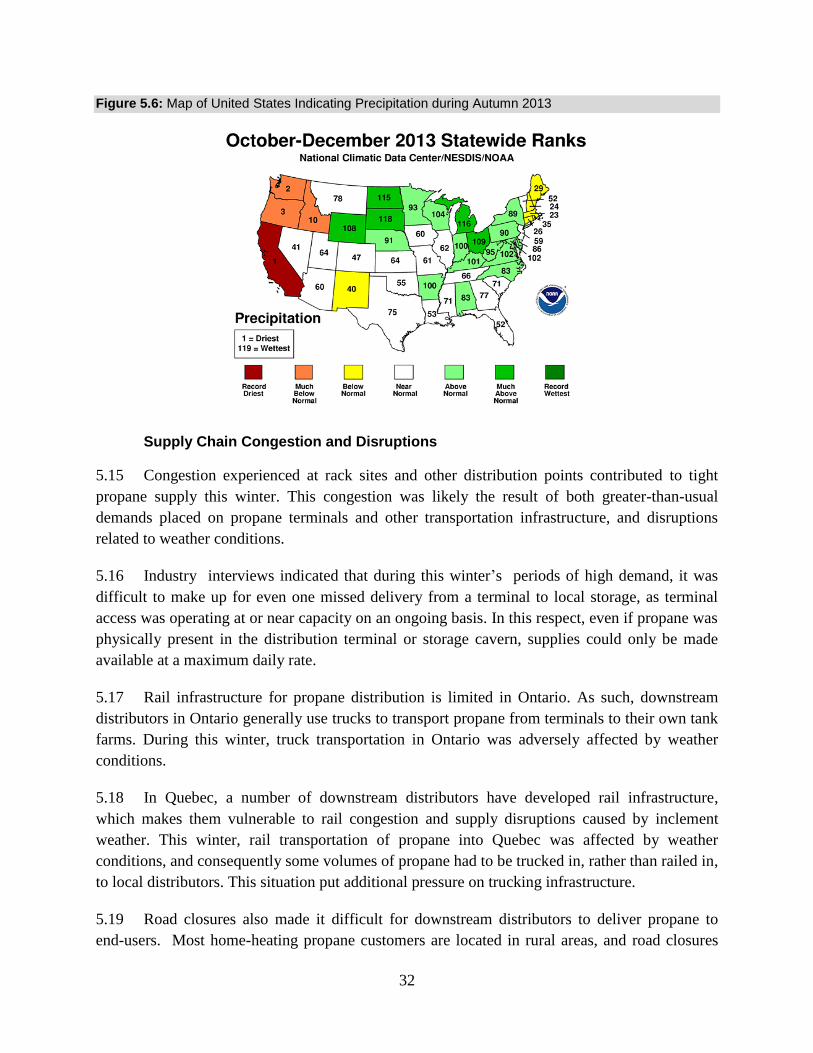
5.11 By some reports, 2013’s corn crop in the U.S. was 34 per cent larger than 2012’s.69
In
addition, Figure 5.6 illustrates that much of the U.S. Midwest region, which grows a significant
volume of corn, experienced a very wet autumn, with most Midwest states experiencing above
normal precipitation between October and December 2013.
5.12 Prior to storage, corn must be dried to a moisture content of less than 15 per cent.70
The
size of the 2013 crop, the high moisture content of the harvest, and colder-than-average
temperatures (thus requiring more propane to account for heat loss while drying) resulted in
unusually high demand for propane in mid-October and November. Agricultural demand for
propane in the U.S. during 2013 was estimated to be as much as five times greater than in
2012.71
According to industry interviews, downstream distributors selling in Ontario and Quebec
also saw an increase in agricultural demand in October and November.
5.13 Crop drying demand was so high that some Midwest states issued hours-of-service
exemptions for commercial truck drivers delivering propane to meet high agricultural demand.
Propane shortages and loading delays at terminals were reported in the Midwest starting in
October 2013.72
By November, the price for propane at the Conway hub had increased 50 per
cent from June 2013 and 57 per cent from November 2012.
5.14 The corn harvest in 2013 also occurred later in the year than normal, resulting in the high
crop drying demand overlapping with seasonal heating demand. This overlap provided less time
for propane inventories to recover before the heating season.
69
“Corn Pile Biggest Since 1994 as Crop Overwhelms Use: Commodities”, Bloomberg, January 9, 2014. Available
online at: http://www.bloomberg.com/news/2014-01-09/corn-pile-biggest-since-1994-as-crop-overwhelms-use-
commodities.html.
70 Corn producers generally do not have the option of letting crops dry in the field, and rely on large dryers to
remove excess moisture prior to storage.
71 “Midwest Propane Prices Push Record as Pipelines Can’t Catch Up”, Bloomberg, January 22, 2014. Available
online at: http://www.bloomberg.com/news/2014-01-22/midwest-propane-prices-push-record-as-pipelines-can-t-
catch-up.html.
72 “Crop drying at a standstill in Upper Midwest”, LP Gas Magazine, October 25, 2013. Available online at:
http://www.lpgasmagazine.com/crop-drying-at-a-standstill-in-upper-midwest/.
32
Figure 5.6: Map of United States Indicating Precipitation during Autumn 2013
Supply Chain Congestion and Disruptions
5.15 Congestion experienced at rack sites and other distribution points contributed to tight
propane supply this winter. This congestion was likely the result of both greater-than-usual
demands placed on propane terminals and other transportation infrastructure, and disruptions
related to weather conditions.
5.16 Industry interviews indicated that during this winter’s periods of high demand, it was
difficult to make up for even one missed delivery from a terminal to local storage, as terminal
access was operating at or near capacity on an ongoing basis. In this respect, even if propane was
physically present in the distribution terminal or storage cavern, supplies could only be made
available at a maximum daily rate.
5.17 Rail infrastructure for propane distribution is limited in Ontario. As such, downstream
distributors in Ontario generally use trucks to transport propane from terminals to their own tank
farms. During this winter, truck transportation in Ontario was adversely affected by weather
conditions.
5.18 In Quebec, a number of downstream distributors have developed rail infrastructure,
which makes them vulnerable to rail congestion and supply disruptions caused by inclement
weather. This winter, rail transportation of propane into Quebec was affected by weather
conditions, and consequently some volumes of propane had to be trucked in, rather than railed in,
to local distributors. This situation put additional pressure on trucking infrastructure.
5.19 Road closures also made it difficult for downstream distributors to deliver propane to
end-users. Most home-heating propane customers are located in rural areas, and road closures
33
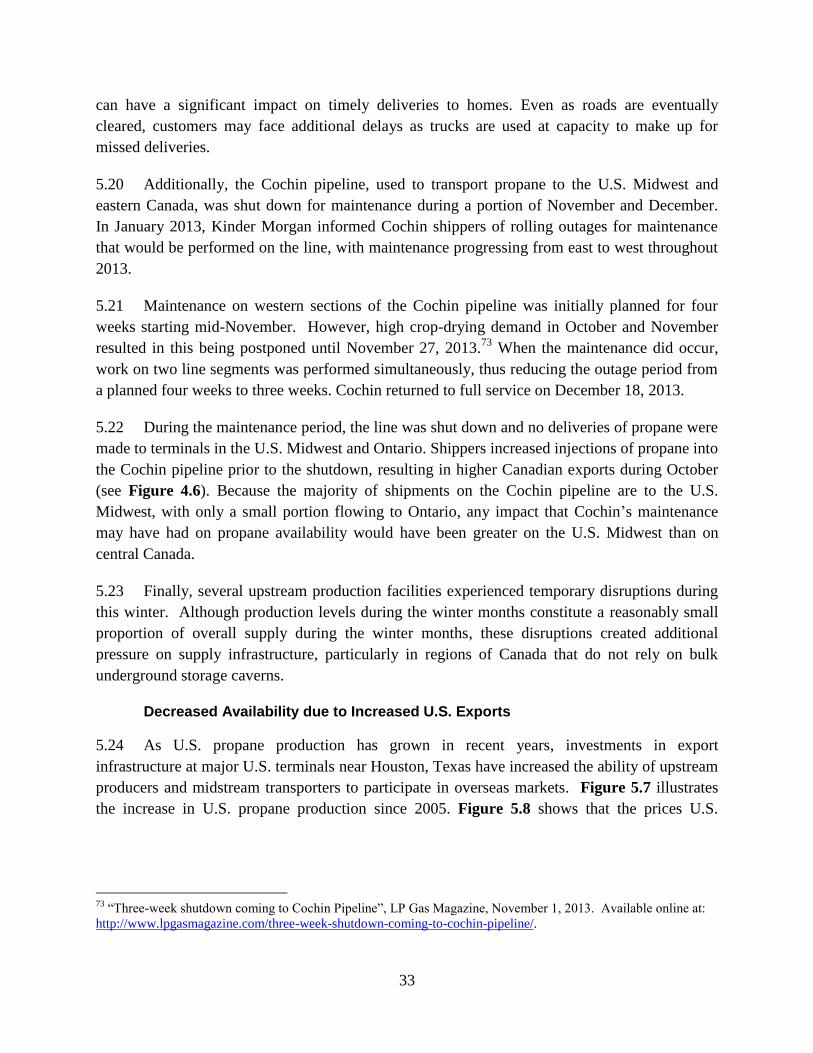
can have a significant impact on timely deliveries to homes. Even as roads are eventually
cleared, customers may face additional delays as trucks are used at capacity to make up for
missed deliveries.
5.20 Additionally, the Cochin pipeline, used to transport propane to the U.S. Midwest and
eastern Canada, was shut down for maintenance during a portion of November and December.
In January 2013, Kinder Morgan informed Cochin shippers of rolling outages for maintenance
that would be performed on the line, with maintenance progressing from east to west throughout
2013.
5.21 Maintenance on western sections of the Cochin pipeline was initially planned for four
weeks starting mid-November. However, high crop-drying demand in October and November
resulted in this being postponed until November 27, 2013.73
When the maintenance did occur,
work on two line segments was performed simultaneously, thus reducing the outage period from
a planned four weeks to three weeks. Cochin returned to full service on December 18, 2013.
5.22 During the maintenance period, the line was shut down and no deliveries of propane were
made to terminals in the U.S. Midwest and Ontario. Shippers increased injections of propane into
the Cochin pipeline prior to the shutdown, resulting in higher Canadian exports during October
(see Figure 4.6). Because the majority of shipments on the Cochin pipeline are to the U.S.
Midwest, with only a small portion flowing to Ontario, any impact that Cochin’s maintenance
may have had on propane availability would have been greater on the U.S. Midwest than on
central Canada.
5.23 Finally, several upstream production facilities experienced temporary disruptions during
this winter. Although production levels during the winter months constitute a reasonably small
proportion of overall supply during the winter months, these disruptions created additional
pressure on supply infrastructure, particularly in regions of Canada that do not rely on bulk
underground storage caverns.
Decreased Availability due to Increased U.S. Exports
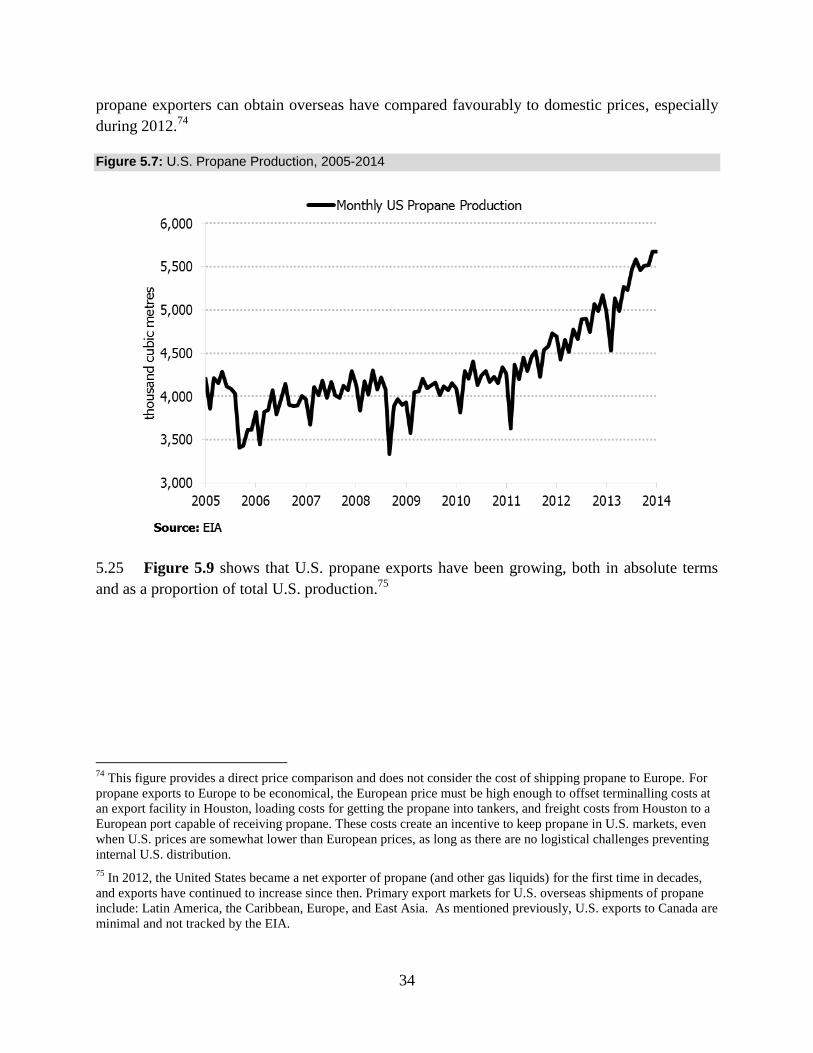
5.24 As U.S. propane production has grown in recent years, investments in export
infrastructure at major U.S. terminals near Houston, Texas have increased the ability of upstream
producers and midstream transporters to participate in overseas markets. Figure 5.7 illustrates
the increase in U.S. propane production since 2005. Figure 5.8 shows that the prices U.S.
73
“Three-week shutdown coming to Cochin Pipeline”, LP Gas Magazine, November 1, 2013. Available online at:
http://www.lpgasmagazine.com/three-week-shutdown-coming-to-cochin-pipeline/.
34
propane exporters can obtain overseas have compared favourably to domestic prices, especially
during 2012.74
Figure 5.7: U.S. Propane Production, 2005-2014
5.25 Figure 5.9 shows that U.S. propane exports have been growing, both in absolute terms
and as a proportion of total U.S. production.75
74
This figure provides a direct price comparison and does not consider the cost of shipping propane to Europe. For
propane exports to Europe to be economical, the European price must be high enough to offset terminalling costs at
an export facility in Houston, loading costs for getting the propane into tankers, and freight costs from Houston to a
European port capable of receiving propane. These costs create an incentive to keep propane in U.S. markets, even
when U.S. prices are somewhat lower than European prices, as long as there are no logistical challenges preventing
internal U.S. distribution.
75 In 2012, the United States became a net exporter of propane (and other gas liquids) for the first time in decades,
and exports have continued to increase since then. Primary export markets for U.S. overseas shipments of propane
include: Latin America, the Caribbean, Europe, and East Asia. As mentioned previously, U.S. exports to Canada are
minimal and not tracked by the EIA.
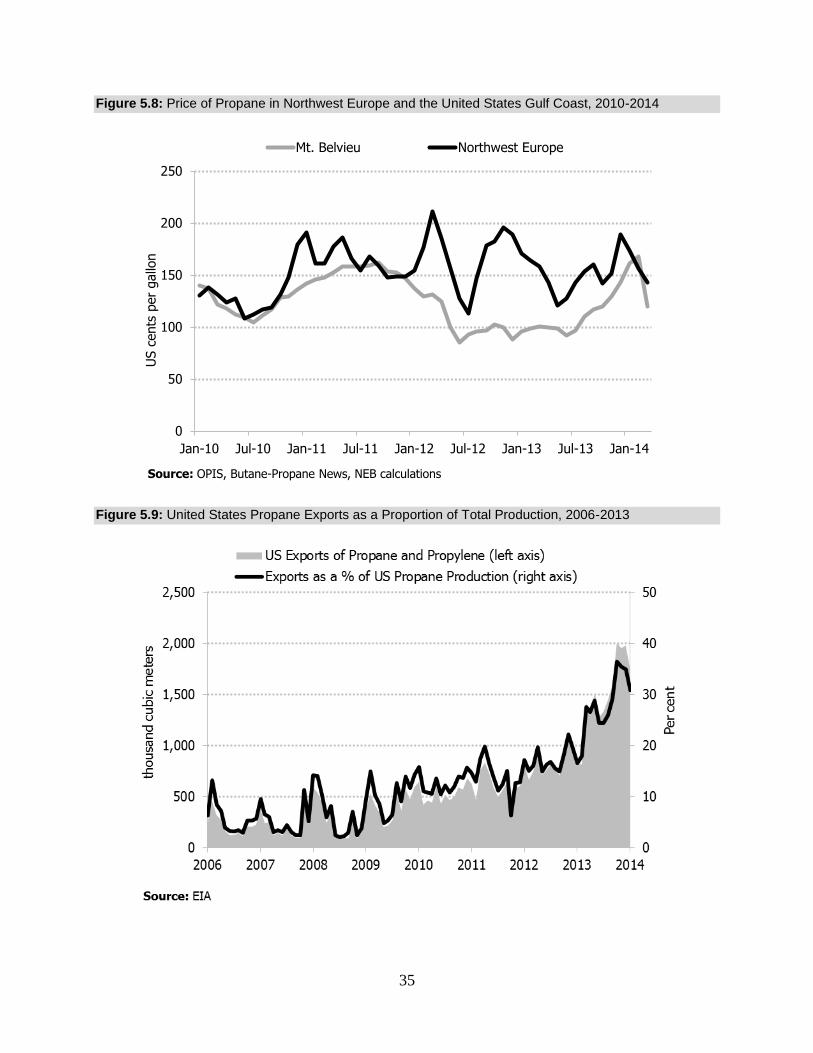
35
Figure 5.8: Price of Propane in Northwest Europe and the United States Gulf Coast, 2010-2014
Figure 5.9: United States Propane Exports as a Proportion of Total Production, 2006-2013
0
50
100
150
200
250
Jan-10 Jul-10 Jan-11 Jul-11 Jan-12 Jul-12 Jan-13 Jul-13 Jan-14
US c
ents
per
gallo
n
Mt. Belvieu Northwest Europe
Source: OPIS, Butane-Propane News, NEB calculations
36
5.26 Thus, even though U.S. production has increased significantly in recent years, the
simultaneous increase in the percentage of U.S. production exported overseas has likely affected
the availability of propane for end-users in Canada and the U.S. When combined with low
inventories and very high demand, these U.S. exports likely impacted the ability of the Canadian
and U.S. propane industry to adjust quickly during the winter of 2013-2014.
5.27 At the same time, Figure 5.8 shows that the price premium in European markets over
Mont Belvieu narrowed during 2013 and that these prices were essentially the same by February
2014. Six U.S. Gulf Coast export cargoes equaling 475 thousand cubic metres (3 million barrels)
of propane and butane were reported cancelled in February 2014 as overseas prices became less
attractive.76
Figure 5.9 also shows some curtailing of exports from the U.S. Gulf Coast in
January and February of 2014.
6. Future Propane Supply, Demand, and Exports
Canadian Situation
6.1 In the 2013 edition of Canada’s Energy Future,77
the NEB forecasts declining Canadian
propane production in the short term as conventional natural gas production declines. Propane
production is forecast to stabilize by 2020, before increasing after 2025 as production of
unconventional shale and tight gas compensates for the decline in conventional gas production.
Propane production from oil sands off-gas is also forecast to increase. These supply trends are
illustrated in Figure 6.1.
6.2 A gradual increase in propane demand growth is also illustrated in Figure 6.1. Growth in
the commercial, industrial, and agricultural sectors, as well as general population growth, are the
primary drivers behind the NEB’s forecast of increasing propane demand in Canada. This
combination of increasing demand and lower supply is forecast to result in declining volumes of
propane available for export in the long term.
76
“USGC LPG cargo cancellations total 3 million barrels in February: trade”, Platts, February 26, 2014. Available
online at: http://www.platts.com/latest-news/shipping/houston/usgc-lpg-cargo-cancellations-total-3-million-
21273356.
77 Available online at: http://www.neb-one.gc.ca/clf-nsi/rnrgynfmtn/nrgyrprt/nrgyftr/2013/nrgftr2013-eng.html.
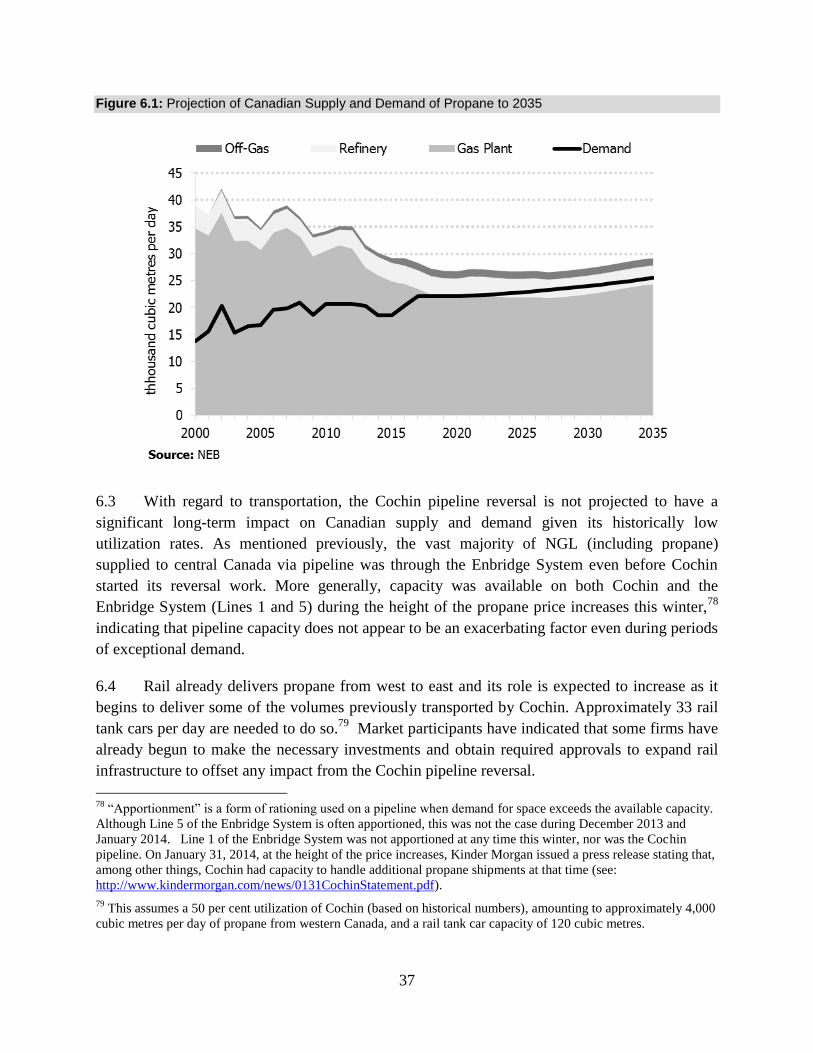
37
Figure 6.1: Projection of Canadian Supply and Demand of Propane to 2035
6.3 With regard to transportation, the Cochin pipeline reversal is not projected to have a
significant long-term impact on Canadian supply and demand given its historically low
utilization rates. As mentioned previously, the vast majority of NGL (including propane)
supplied to central Canada via pipeline was through the Enbridge System even before Cochin
started its reversal work. More generally, capacity was available on both Cochin and the
Enbridge System (Lines 1 and 5) during the height of the propane price increases this winter,78
indicating that pipeline capacity does not appear to be an exacerbating factor even during periods
of exceptional demand.
6.4 Rail already delivers propane from west to east and its role is expected to increase as it
begins to deliver some of the volumes previously transported by Cochin. Approximately 33 rail
tank cars per day are needed to do so.79
Market participants have indicated that some firms have
already begun to make the necessary investments and obtain required approvals to expand rail
infrastructure to offset any impact from the Cochin pipeline reversal.
78
“Apportionment” is a form of rationing used on a pipeline when demand for space exceeds the available capacity.
Although Line 5 of the Enbridge System is often apportioned, this was not the case during December 2013 and
January 2014. Line 1 of the Enbridge System was not apportioned at any time this winter, nor was the Cochin
pipeline. On January 31, 2014, at the height of the price increases, Kinder Morgan issued a press release stating that,
among other things, Cochin had capacity to handle additional propane shipments at that time (see:
http://www.kindermorgan.com/news/0131CochinStatement.pdf).
79 This assumes a 50 per cent utilization of Cochin (based on historical numbers), amounting to approximately 4,000
cubic metres per day of propane from western Canada, and a rail tank car capacity of 120 cubic metres.
38
6.5 For example, in February 2014, midstream operator Keyera announced construction of a
propane rail terminal near Fort Saskatchewan, Alberta, with a targeted start-up date of mid-
2015.80
Keyera also announced that it would expand its underground storage capabilities,
through the addition of two new salt caverns in Fort Saskatchewan, in order to meet demand.
6.6 Kinder Morgan and NOVA Chemicals have proposed to continue the Cochin pipeline in
west to east service for the section of line east of Riga, Michigan.81
The proposal, named the
UTOPIA pipeline project, would deliver a mix of previously refined or fractionated natural gas
liquids, including propane and ethane, to petrochemical and fuel markets in Ontario. The mix of
liquids would originate from shale gas-processing facilities in Ohio and be delivered to Windsor,
Ontario. The pipeline is expected to have an initial capacity of 7,950 cubic metres per day
(50,000 barrels per day) and be operational by mid-2017.
6.7 In light of this planned transportation infrastructure, gradual demand growth, and
declining but eventually rebounding supply, there does not appear to be a long-term imbalance in
the Canadian propane market. There will be industry adjustments (including increased reliance
on storage and inventory accumulated during the summer) due to supply and demand
developments, but there do not appear to be significant domestic factors that would exacerbate
the market challenges experienced this winter or that would lead to sustained shortages or price
increases. This conclusion is reinforced by the U.S. factors discussed below.
U.S. Situation
6.8 U.S. propane production is expected to grow significantly in the near term. This is due to
growth in NGL production from gas plant processing, which is in turn due to horizontal drilling
and hydraulic fracturing technologies that are increasing U.S. production from shale and tight
gas basins.82
For example, total NGL production (which is mostly propane) from the Marcellus
and Utica shale formations83
is forecast by the EIA to increase from 60,000 barrels per day in
2013 to at least 650,000 barrels per day in 2016. At least 39 gas processing projects have been
80
“Keyera Corp. Announces Year End 2013 Results”, February 13, 2014. Available at:
https://www.keyera.com/titanweb/keyera/webcms.nsf/AllDocs/A9641FC438C1341787257C7E007A6EAA?OpenD
ocument#.U0h1_6JN1Fo.
81 “Kinder Morgan Energy Partners Announces Letter of Intent with NOVA Chemicals Corporation for New Utica
to Ontario Pipeline”, Business Wire, December 16, 2013. Available at:
http://www.businesswire.com/news/home/20131216006291/en/Kinder-Morgan-Energy-Partners-Announces-Letter-
Intent#.U0h34KJN1Fo.
82“Growth in U.S. hydrocarbon production from shale resources driven by drilling efficiency”, EIA, March 11,
2014. Available online at http://www.eia.gov/todayinenergy/detail.cfm?id=15351.
83 The Marcellus shale basin covers parts of the U.S. states of New York, Ohio, Pennsylvania, and West Virginia.
The Utica shale basin is located below the Marcellus and covers parts of the states of New York, Ohio, and West
Virginia, with extensions under adjacent parts of Kentucky, Maryland, Tennessee, Ontario and Quebec.

39
announced or planned in these two basins, including seven new gas processing plants.84
A
portion of this expanded production will be available to provide additional propane supplies to
markets in both Canada and the U.S.
6.9 According to a 2013 report prepared by ICF International for the Propane Education and
Research Council,85
U.S. propane production from gas plants and refineries is forecast to
increase twenty per cent between 2012 and 2020. This increase is in addition to the twenty per
cent increase that already occurred between 2005 and 2012 (as shown in Figure 5.7). The same
report projects that U.S. propane demand is expected to grow slowly until 2020.
6.10 Industry analysts forecast that the trend of growing U.S. exports to overseas markets will
continue in the near and long-term. Targa and Enterprise, who completed major export facility
expansions in 2013, have already announced plans for further expansions. Other U.S. companies
have also announced new projects. Most of these new export terminals are scheduled for
completion in 2015, when the expected expansion of the Panama Canal will improve access to
growing propane markets in Asia. By 2017, the U.S. Gulf Coast’s export capacity for propane
could exceed 220,000 cubic metres per day (1.4 million barrels per day), which is more than
triple the 2013 capacity.86
6.11 Even with surplus U.S. propane for export, which could be redirected to domestic
markets in times of high demand, shortages and price increases such as those experienced this
winter may still occur. In periods of very high propane demand, pipeline capacity is limited.
Alternatives such as rail and trucking also have capacity limits and can be delayed by cold
weather, especially over long distances. Even when price incentives and policy directions are in
place, as they were by February 2014, these logistical challenges mean that extra time may still
be needed to re-direct propane supplies.
6.12 Additional logistical challenges can also come into play. In the case of the U.S. East
Coast, propane needed to be delivered from Europe and North Africa this winter, not only
because U.S. propane pipelines were fully committed, but also because there were no U.S.-
flagged tankers available to ship propane from the Gulf Coast to the East Coast.87
The volumes
imported may have also been limited by the storage capabilities of the receiving areas.88
84
“Gas processing in the mighty Marcellus and uber Utica”, Gas Processing News, October 2013. Available at:
http://www.gasprocessingnews.com/features/201310/gas-processing-in-the-mighty-marcellus-and-ueber-utica.aspx.
85 ICF International, “2013 Propane Market Outlook”. Available online at:
http://www.afdc.energy.gov/uploads/publication/2013_Propane_Market_Outlook_1_.pdf.
86 “Sail Away – Propane Exports Exceed 400 Mb/d for the First Time”, RBN Energy, January 28, 2014. Available
online at: https://rbnenergy.com/sail-away-propane-exports-exceed-400mbd (Subscription required).
87 Movements of propane and other goods between U.S. ports are reserved under the Jones Act to U.S. built and
manned vessels. “Frozen East Coast Pays as Law Blocks Cheaper Fuel Flows”, Bloomberg News, February 28,
40
6.13 Due to the integrated nature of the Canadian and U.S. propane industries, these delays in
the resupply of the U.S. Midwest and East Coast will have an impact on Canadians during times
of tight supply. The market will respond and eventually lower prices, as it did this winter, but
time lags should be expected.
7. Examination of Anti-Competitive Behaviour
7.1 Canadian consumers have experienced high propane prices this winter. In situations
where demand is high and supply is tight, this can be an expected short-term result of the market,
as prices reflect the scarcity of the good and adjust to allocate the limited supplies of that good to
their highest value use in the economy.89
In circumstances where high prices occur in an efficient
market, economic welfare is maximized by allowing these high prices to persist.90
High prices
can encourage additional supply which would ultimately tend to moderate a short term price
increase.91
7.2 However, high prices can also result from market inefficiencies. In some circumstances,
elevated prices may be the result of an exercise of market power92
or an illegal agreement to fix
prices in all or part of an industry. In these circumstances, high prices become a symptom of
anti-competitive behaviour rather than the outcome of an efficient market. When firms engage
in anti-competitive conduct, this typically results in high prices, less selection, lower quality
products or services, and a reduction of innovative offerings.
7.3 Some types of anti-competitive conduct can be imposed unilaterally by a single firm,
without the need for cooperation between market participants.93
This type of behaviour is more
2014. Available online at: http://www.bloomberg.com/news/2014-02-28/frozen-east-coast-pays-as-law-blocks-
cheaper-fuel-flows.html.
88 “Tight supply means propane prices headed upward”, Concord Monitor, January 19, 2014. Available online:
www.concordmonitor.com/home/10242975-95/tight-supply-means-propane-prices-headed-upward. Also, “Propane
imports may help ease regional shortage that is driving up prices”, Portland Press, January 7, 2014. Available online:
www.pressherald.com/news/Propane_imports_may_help_ease_regional_shortage_that_is_driving_up_prices_.html?
pagenum=full.
89 Church, J. and R. Ware (2000), Industrial Organization: A Strategic Approach at pp. 750-751.
90 Mankiw, N.G. (2006), Principles of Microeconomics. Fourth Edition at pp. 114-116.
91 For example, as described in this report in paragraphs 5.27 and 6.12, this winter’s high propane prices attracted
overseas cargos to the U.S. East Coast and resulted in cancelled export cargoes from the U.S. Gulf Coast.
92 Market power is the ability of a firm (or group of firms) to profitably influence price above a competitive level for
a significant amount of time. In most cases, when a firm exercises market power, economic efficiency is harmed.
93 For instance, a dominant firm may implement strategies that raise the costs for entrant firms to compete
effectively against the dominant firm. Alternatively, a firm may: impose a requirement that it act as a sole supplier to
a customer; engage in tied selling; refuse to supply a customer; influence the price at which a product is resold; or
employ other behaviour that results in market power being created, preserved, or enhanced.
41
common when markets are served by a small number of firms and when barriers to entry and
expansion are high. Otherwise, when customers have choice among many competing
alternatives, there is a greater potential that customers can switch their purchases to other firms
in sufficient numbers to deter anti-competitive behaviour.94
7.4 Alternatively, a group of firms can, tacitly or explicitly, coordinate their marketplace
actions to effect anti-competitive results. Markets may be more susceptible to this type of
behaviour when firms can: (a) mutually recognize the benefits from competing less aggressively
with one another; (b) monitor the conduct of other firms and detect deviations from the terms of
coordination; and (c) respond to deviations through credible deterrent mechanisms.95
When a
group of firms engages in coordinated behaviour with anti-competitive outcomes, this conduct
can be subject to the civil provisions in the Competition Act.96
When firms coordinate their
behaviour by engaging in price fixing, bid rigging, or market allocation, this can constitute an
indictable offence under the Competition Act, and those found responsible can be subject to
imprisonment and fines.97
7.5 High prices can also result in times of shortage, typically following disasters or other
events that disrupt the normal flow of goods, when sellers use marketplace disruption to
artificially increase prices.98
This is commonly known as “price gouging”, and is another
situation where an inefficient market can result in higher prices. Charging high prices is not, by
itself, prohibited in the Competition Act; high prices are a concern under the Competition Act
when they are the result of anti-competitive conduct.99
7.6 While economics provides several different models of firm interaction, the basic premise
behind industrial organization economics and competition policy is that more competition results
in a more efficient allocation of resources in the economy. When firms engage in the types of
behaviour discussed above, market distortion and inefficiency can occur, which can result in
higher prices to consumers and harm to the economy. Given the fact that propane is an essential
94
The Abuse of Dominance Provisions, Competition Bureau, at pp. 7-10. Available online at:
http://www.competitionbureau.gc.ca/eic/site/cb-bc.nsf/vwapj/cb-abuse-of-dominance-provisions-e.pdf/$FILE/cb-
abuse-of-dominance-provisions-e.pdf.
95 Stigler, G (1964), “A Theory of Oligopoly”, 44-61 Journal of Political Economy 72.
96 Competition Act, (“Competition Act”) at Part VIII.
97 Competition Act at Part VI.
98 U.S. Federal Trade Commission (2006), “Analysis of Price Increases in the Aftermath of Hurricane Katrina”.
Investigation of Gasoline Price Manipulation and Post-Katrina Gasoline Price Increases at pp. 137-154. Available
online at: http://www.ftc.gov/reports/federal-trade-commission-investigation-gasoline-price-manipulation-post-
katrina-gasoline.
99 Competition Bureau (2006), “Competition Bureau Concludes Gasoline Pricing Examinations”. Available online
at: http://news.gc.ca/web/article-
en.do?mthd=advSrch&crtr.page=1&nid=204259&crtr.kw=competition+bureau+gasoline+pricing+examinations.
42
good for some consumers, any such anti-competitive activities would be likely to have
substantial negative effects on Canadian consumers.
Scope and Conduct of Examination
7.7 The Bureau has undertaken an examination of whether Canadian propane markets have
been subject to anti-competitive activities that may have exacerbated the impact of recent
propane price spikes on consumers. In conducting this examination, the Bureau has completed
interviews with a broad range of industry stakeholders, and has reviewed information supplied
on a voluntary basis by market participants. The Bureau also attempted to undertake a
quantitative review of propane pricing, which is discussed in further detail below.
7.8 This examination was not a formal inquiry under the Competition Act. In this respect, the
Bureau’s examination relied on the voluntary participation of industry stakeholders and, in a
market study like the current examination, the Bureau does not have the ability to use formal
information gathering tools pursuant to the Competition Act.
7.9 The Bureau’s findings, as reflected in this report, are not findings of fact or law that have
been tested before a tribunal or court. Competition enforcement decisions are made on a case-
by-case basis and the conclusions discussed in the report are specific to the present matter and
are not binding on the Commissioner of Competition. Readers should exercise caution in
interpreting the Bureau’s assessment.
7.10 Based on the information collected, the Bureau’s examination has not found sufficient
evidence, at this time, to conclude that anti-competitive activities have exacerbated the impact of
recent propane price spikes on consumers. Should any person have information regarding anti-
competitive activities that have occurred or are occurring in Canadian propane markets, this
information should be provided to the Bureau, and the Bureau will not hesitate to take the
appropriate action if it becomes aware of anti-competitive conduct that contravenes the
Competition Act.100
Analysis of Upstream Production
7.11 One symptom of anti-competitive behaviour is excess profits being earned by market
participants.101
As mentioned above, the Bureau’s general practice when assessing anti-
competitive behaviour is to determine whether market participants have the ability to exercise
market power by influencing price above a competitive level. In circumstances where a market
100
Information can be submitted via the online form at: http://www.competitionbureau.gc.ca/eic/site/cb-bc.nsf/frm-
eng/GH%C3%89T-7TDNA5.
101 “Reasons and Order” in Director of Investigation and Research v. Tele-Direct (Publications) Inc., at paragraph
144. CT-1994-003. Available online at: http://www.ct-tc.gc.ca/CasesAffaires/CasesDetails-eng.asp?CaseID=181.
43
participant can exercise market power, it is generally expected that such a firm will earn excess
profits.
7.12 Market participants in the Canadian propane industry have generally noted that upstream
propane producers realize the greatest financial benefit when propane prices rise, and bear the
largest risk when propane prices fall. This is generally because midstream and downstream
propane firms make contracted purchases and sales of propane against one or more indexed
prices from major North American propane hubs, such that their cents-per-litre margin remains
constant regardless of the ultimate price of the propane. Therefore, it is perhaps most likely that
anti-competitive behaviour would occur at the upstream level of the industry, as upstream
producers have the greatest ability to directly gain from higher propane prices.
7.13 However, the Bureau received no complaints from either midstream or downstream
market participants about the pricing practices of upstream firms during the recent periods of
high propane prices. Since upstream firms sell their propane directly to midstream or
downstream firms, it is likely that these customers would be well positioned to recognize and
report any attempt by upstream firms to raise prices above a competitive level. While it may be
difficult to recognize anti-competitive behaviour during times of rapidly rising prices, it is worth
noting that most midstream and some downstream market participants have a significant history
and expertise in Canadian propane markets, and the sophistication of these customers, coupled
with the fact that these customers would not likely benefit from higher propane prices, reduces
the likelihood that an exercise of market power by upstream firms would go undetected.
7.14 It also appears unlikely that any one upstream firm could profitably influence prices, as
propane production at the upstream level is spread across a reasonably large number of firms.
Since many independent companies produce propane in Canada, it does not appear likely that a
single producer, acting alone, could unilaterally raise prices, as any such attempt would likely be
disciplined by customers obtaining supplies from other upstream producers. Having said that,
the Bureau notes that there are relatively few producers of propane in Ontario and Quebec, and
in periods where rail infrastructure is significantly congested, there is a greater possibility that
such behaviour could result.
7.15 Certain upstream production facilities in Canada experienced outages and maintenance
periods either during or immediately before January and February 2014, when propane prices
reached their highest levels. These outages could also be a symptom of an exercise of market
power if such an outage could sufficiently restrict supply to influence prices upwards. However,
it appears that these outages resulted from legitimate safety and/or maintenance needs, and were
not a result of attempts by upstream producers to limit supplies and realize higher prices.
Furthermore, given the fact that upstream production supplies a reasonably small proportion of
overall supply during the winter months, it is not clear that one single propane producer
44
unilaterally restricting supply could have a material effect during the short periods of time in
which the outages occurred.
7.16 Finally, even though upstream producers may benefit the most from a propane price
increase, a key cause of higher than normal pricing during this winter involved congestion and
low inventories at midstream transportation and storage assets, and not at the upstream
production level. Upstream propane producers that do not participate at other levels of the
industry would likely have little direct ability to influence the midstream level of the
marketplace.
Analysis of Midstream Firms
7.17 An exercise of market power by midstream rail, pipeline, or storage firms could bear
resemblance to the supply shortage issues experienced this winter. In other words, midstream
transportation firms could restrict supply available for transport in an attempt to increase propane
prices, or midstream storage firms could deliberately keep inventory levels low to create an
artificial supply shock that would also result in high prices.
7.18 In the case of rail firms transporting propane across Canada, the issues experienced this
winter appear to be well understood consequences of extreme winter weather, and do not appear
to be unique to this recent shortage period. Therefore, it appears unlikely that the service
disruptions experienced this winter are the result of an exercise of market power by rail
companies.
7.19 Propane is also moved across Canada by pipeline. In the case of the Cochin pipeline, the
decision to reverse the pipeline, and the regulatory approvals necessary for the plan to be
affected, were all made in advance of the recent shortage period. Kinder Morgan’s decision to
reverse the pipeline appears to be more likely related to low historical capacity utilization on
Cochin and new demand for condensates in western Canada, rather than being motivated by a
desire to increase propane prices. Furthermore, Kinder Morgan has no other propane related
assets in Canada, and restricting supply in order to increase prices would not likely bring any
benefit.
7.20 With regard to the Enbridge System, the rates that Enbridge charges its shippers are
regulated by the NEB and FERC. This regulatory oversight restricts Enbridge’s potential ability
to raise rates for its own financial benefit. Additionally, Enbridge participates only at the
midstream level of the Canadian propane industry, and does not take ownership of the NGL
transported via its pipelines. Finally, in 2017, the eastern portion of the Cochin pipeline will once
again be available to transport NGL into Ontario from the U.S. Midwest.
7.21 The structure of midstream processing and storage assets in Ontario may make these
markets more susceptible to an exercise of market power. Specifically, in southern Ontario,
45
these assets are generally owned by a small number of firms and are substantially controlled by a
single operator. However, the evidence gathered during the Bureau’s examination is not
consistent with any strategy to restrict supply or otherwise influence propane pricing in Canada.
Several firms indicated their intention to expand their propane storage capacity in eastern
Canadian markets, which is inconsistent with a strategy to limit supply in order to raise prices.
7.22 Furthermore, as discussed above, high demand for propane this year created, or
contributed to, congestion issues at midstream facilities. While congestion could be a side effect
of an anti-competitive supply restriction, it appears to be well supported that demand for propane
was considerably higher this winter than in previous winters, and that this increased demand was
a significant contributor to congestion at midstream supply sites.
Analysis of Downstream Distributors
7.23 During the 1990s, Superior Propane and ICG Propane operated as the two major propane
suppliers across a large number of Canadian propane markets. In 1998, Superior Propane
acquired ICG Propane and, following completion of the acquisition, the Commissioner of
Competition applied to the Competition Tribunal seeking to dissolve the acquisition on the
grounds that the merger would lessen or prevent competition substantially in 74 local propane
markets across Canada.102
The application was fully contested in front of the Competition
Tribunal and the courts but, ultimately, the Commissioner’s application was dismissed, and
Superior Propane became the sole or dominant supplier in a large number of Canadian propane
markets.
7.24 Since that time, however, local propane markets have seen the establishment of new
downstream propane distributors. Some market participants have indicated that consumer
switching from fuel oil to propane for home heating may have contributed to demand increases
that induced new downstream firms to commence operations in certain local retail markets.
7.25 For the purpose of competition analysis, what is important is the extent to which firms in
a market can act as a competitive constraint to each other, and not simply participate on the
fringes of the market. In this sense, the Bureau differentiates between firms merely providing
service in a market, and those firms who can effectively compete in that market. The extent to
which downstream distributors can act as effective competitors depends on, at least: the firm’s
ability to independently source propane supply, its storage capacity, number of delivery trucks,
customer base, and ability to offer value-added services to consumers. In other words, a
downstream distributor is more likely to act as a competitive constraint when: it does not have to
rely on its competitors to obtain propane supplies; it has significant storage assets and delivery
102
Superior Propane, supra note 33, at paragraph 110.
46
trucks to serve a large customer base sufficient to achieve a competitively low cost; and it has the
ability to offer quality service to its customers.
7.26 To examine the extent to which downstream propane markets have experienced effective
entry, the Bureau surveyed the operations of more than twenty-five downstream distributors of
propane in the regions of Ontario and Quebec that were most affected by this winter’s high
propane prices.103
This analysis showed a significant amount of entry into local propane markets
in the past five years, and concluded that a minimum of two, and in many cases more than two,
suppliers likely act as effective competitors in each local market. While the nature of this
examination prevents the Bureau from concluding that all of these markets are served at a
competitive level, it appears likely that local propane markets are not subject to the same level of
market dominance as may have been the case immediately following the Superior Propane-ICG
Propane merger.
Analysis of Propane Pricing
7.27 In previous market studies, the Bureau has been able to use marketplace data to
quantitatively assess whether, and the extent to which, market participants may possess market
power. For example, in 2005, the Bureau was able to undertake an econometric analysis of local
gasoline markets across Canada, and conclude that abnormally high gasoline prices observed in
2004 were the result of “market conditions”, rather than anti-competitive behaviour by market
participants.104
7.28 The Bureau has been unable to perform a similar quantitative analysis for this report,
primarily due to necessary data being unavailable. Specifically, the Bureau attempted to perform
a “difference-in-difference” analysis, which compared wholesale pricing at certain Canadian
propane hubs to the same pricing at a certain U.S. benchmark hub in an attempt to determine
whether propane prices at these Canadian hubs increased relative to propane prices at the U.S.
hub after controlling for local market conditions.105
If Canadian price increases are not explained
by local market conditions, then differences in prices may be symptomatic of an exercise of
market power.
103
Due to resource constraints, our analysis was unable to survey the competitive situation in markets outside of
Ontario and Quebec. Therefore, it is unclear the extent to which effective competition occurs outside of these
markets.
104 Competition Bureau “Gasoline Empirical Analysis”. March 2005. Available online at:
http://www.competitionbureau.gc.ca/eic/site/cb-bc.nsf/eng/00223.html.
105 “Difference-in-Difference” analysis compares the setting where an event occurred to a control setting where the
event did not occur, over time, to isolate the effects of that event after controlling for unobservable characteristics.
For a detailed discussion of Difference-in-Difference models, see, e.g., James H. Stock and Mark W. Watson,
Introduction to Econometrics, Second Edition (Pearson Addison Wesley, 2007), pp. 481-517.
47
7.29 This econometric analysis could not explain a substantial portion of pricing variability at
Canadian propane hubs. However, it is not clear whether this unexplained variation is the result
of market power or is caused by a lack of sufficient information to control for differences in
supply and demand conditions between the markets being studied. Ultimately, the Bureau is
unable to assert that this analysis is evidence of market power being exercised.
7.30 The Bureau would have been able to obtain clearer results with access to better data. For
example, a comparison of wholesale pricing between Canadian and U.S. hubs would benefit
from additional information on the types and amounts of end-use demand that are sourced from
each hub, and these data are not publicly available. As another example, the Bureau is aware
that certain propane production and transportation assets experienced temporary disruptions
during this winter, but data to accurately describe the extent of these disruptions are generally not
publicly available.
7.31 Additionally, the Bureau’s analysis would benefit from more timely access to Canadian
data, as there is a significant time lag before these data are collected, compiled, and made
available. Even as of now, key data describing the full extent of production and consumption
during the January and February 2014 price spikes remain unavailable.
7.32 Furthermore, even if the Bureau had obtained robust results with the available data,
differences in posted wholesale prices provide no information about the extent to which market
power may have been exercised by downstream distributors. In order to examine downstream
issues, retail pricing information would need to be available for each end use, and these data are
not collected in Canada. The issues associated with accessing necessary data have, at least in
part, limited the Bureau’s ability to quantitatively assess whether anti-competitive activities may
have exacerbated the impact of recent propane price spikes on consumers.
Conclusion Regarding Anti-Competitive Behaviour
7.33 At this point in time, the Bureau has not found sufficient evidence to conclude that anti-
competitive activities have exacerbated the impact of recent propane price spikes on consumers.
However, the Bureau notes that this examination of propane market issues is limited by certain
factors discussed above and, should any person have information regarding anti-competitive
activities that have occurred or are occurring in Canada propane markets, this information should
be provided to the Bureau, and the Bureau will not hesitate to take the appropriate action if it
becomes aware of anti-competitive conduct that contravenes the Competition Act.106
106
Information can be submitted via the online form at: http://www.competitionbureau.gc.ca/eic/site/cb-bc.nsf/frm-
eng/GH%C3%89T-7TDNA5.
48
8. Conclusions
8.1 The Canadian propane industry encompasses upstream producers, midstream storage and
transportation companies, and downstream distributors. This wide-reaching supply chain works
together to provide propane to Canadian end-users.
8.2 The Canadian and U.S. propane industries are integrated and Canadian propane prices,
supplies, and infrastructure are linked to major propane trading hubs in the U.S. Canada exports
significant amounts of propane to the U.S. These commercial realities are supported by a
longstanding, market-oriented regulatory framework for propane and other energy products.
8.3 This winter, a unique combination of unusually cold weather, high U.S. agricultural
demand, lower-than normal inventories, and rapidly growing U.S. overseas exports led to tight
supplies and increased prices in Canada and the U.S. This price increase had a significant impact
on Canadians, including households that use propane for home heating.
8.4 Propane prices moderated after peaking in January, as inventories recovered and propane
stored in the U.S. Gulf Coast was redirected to the U.S. Midwest. Canadian prices did not spike
to the same extent as in the U.S. Additionally, reports of the local shortages concentrated in
Ontario and western Quebec did not continue throughout the winter. The market responded,
although factors such as logistical challenges and the propane industry’s inherent inability to
significantly increase production in the short term, prevented consumers from obtaining relief
more immediately.
8.5 The Bureau’s examination did not uncover sufficient evidence, based on the information
collected during its review, to conclude that anti-competitive activities exacerbated the impact of
recent propane price spikes on consumers.
8.6 This winter’s price increases and initial local shortages are not indicative of long-term
supply-demand imbalances in the Canadian propane industry. Short-term propane prices have
historically been volatile due to the industry’s traditional combination of steady supply,
fluctuating demand, and complex logistics. While there is sufficient production, storage, and
transportation infrastructure to meet the future needs of Canadians, utilization of this
infrastructure throughout the year is often based on market expectations of variables such as
weather. Accordingly, temporary price spikes and shortages are likely in the future. No other
factors are expected to exacerbate these challenges or contribute to future shortages and price
increases.
8.7 Long-term supply and demand of propane in Canada is projected to be relatively stable,
as is long-term U.S. demand. U.S. supply is expected to grow significantly in the long term,
with this surplus mostly flowing overseas as exports. The growing U.S. surplus may provide
some additional relief in times of very high demand in Canada and the U.S., as it did this winter.
49
Appendix: Data Sources and Challenges
A.1 The NEB and the Bureau analysed a significant amount of data while preparing this
report. Nonetheless, challenges were encountered with regard to the availability of timely,
detailed, and high-quality data on the Canadian propane industry. The lack of such data can
hinder the ability of governments, regulators, and industry participants to identify in a timely and
precise manner what, if any, measures should be taken in response to propane market events
such as those that occurred this winter.
A.2 Statistics Canada reports Canadian propane supply and disposition data on an annual
basis in CANSIM Table 128-0012.107
The data reported in this CANSIM table comes from
multiple sources and is collected with different methodologies. For example, some of the data in
the table comes from the NEB’s Product Supply and Disposition Report, which the NEB
provides to Statistics Canada but no longer publishes. Industrial consumption figures come from
Statistics Canada’s large-sample Industrial Consumption of Energy survey. Other industry data
comes from Statistics Canada’s surveys of producers and end-users.
A.3 A consequence of the various data collection methodologies is that the reported Canadian
propane production, consumption, and export numbers are not consistent. When calculating
availability and net supply figures for propane, Statistics Canada includes an item referred to as
“other adjustments” which includes “cyclical billing variations, metering differences and losses
in transportation”. In 2012, this addition to net supply was approximately 4,145 thousand cubic
metres, which is equivalent to more than a third of the figure for total Canadian supply.
A.4 With regard to Canadian propane export data, the NEB collects data from holders of
export licenses and orders issued pursuant to the NEB Act and its regulations. Under section 5 of
the National Energy Board Export and Import Reporting Regulations, persons holding a propane
export licence or order shall submit to the Board on a monthly basis information pertaining to the
export of propane (volume, price, destination and mode of transport), and the supply and
disposition of propane volumes, including opening and closing inventories. The NEB aggregates
the information provided by holders of propane export authorizations and publishes it on the
NEB website on a monthly basis.
A.5 By comparison, data on the U.S. propane industry comes primarily from the EIA, which
is a part of the U.S. Department of Energy and is responsible for the collection, analysis and
dissemination of energy information. The majority of the EIA’s data surveys are based on
mandates set forward in the Federal Energy Administration Act of 1974 and the Department of
107
Prior to 2002, the data was reported on a quarterly basis in CANSIM Table 128-0003.
50
Energy Organization Act of 1977. In the latter, section 205 established the EIA as the authority
to carry out a central, comprehensive, and unified energy data and information program.
A.6 The EIA reports a broader range of propane data, and with greater frequency, than any
source in Canada. For example, residential propane prices for each U.S. region and state are
reported on a weekly basis. Also reported weekly are regional propane statistics for underground
inventories, production, demand, exports, and imports.
A.7 In a 2004 document entitled “Looking Ahead to 2010: Natural Gas Markets in
Transition”, the NEB noted widespread industry recognition that energy information in Canada
is more widely dispersed than in the U.S., where the EIA offers a “one-stop shop” approach to
energy data.108
In the 2004 report, the NEB noted that industry participants suggested “a central
repository for Canadian energy information would be very useful in helping market sectors and
governments make timely and informed decisions”. More recently, the Canadian media have also
written about data gaps in the Canadian energy industry, particularly with respect to the need for
up-to-date data.109
A.8 Collecting and publishing propane industry data in Canada comparable to what is
available in the U.S. may be facilitated by increased coordination and information sharing
between: federal, provincial, and territorial governments and regulators; organizations within
each level of government; and governments and industry.
108
National Energy Board (2004), “Looking Ahead to 2010: Natural Gas Markets in Transition” pp. 22-23.
Available online at: http://www.neb-one.gc.ca/clf-nsi/rnrgynfmtn/nrgyrprt/ntrlgs/gslknghd2010gst2004-eng.pdf.
109 “Trading in the dark: Crude supply data scarce in Canada”, The Globe and Mail, August 23, 2012. Available
online at: http://www.theglobeandmail.com/report-on-business/industry-news/energy-and-resources/trading-in-the-
dark-crude-supply-data-scarce-in-canada/article4324881/.