Draft NA protocol - FRTR · 3.1.4 Hand auger ... 4.0 Summary and conclusion ... (Schnoor, 2002)....
53
Draft Technical Protocol for Characterizing Natural Attenuation of Chlorinated Solvent Ground-Water Plumes Discharging into Wetlands ESTCP Project No. CU-9913 U.S. Geological Survey January 2006 The contents of this report have been approved for public release and unlimited distribution by the U.S. Army – clearance number 4582-A-6. Rev 1
Transcript of Draft NA protocol - FRTR · 3.1.4 Hand auger ... 4.0 Summary and conclusion ... (Schnoor, 2002)....

Draft Technical Protocol for Characterizing Natural Attenuation of Chlorinated Solvent Ground-Water
Plumes Discharging into Wetlands
ESTCP Project No. CU-9913 U.S. Geological Survey
January 2006
The contents of this report have been approved for public release and unlimited distribution by the U.S. Army – clearance number 4582-A-6. Rev 1

Draft Technical Protocol for Characterizing Natural Attenuation of Chlorinated Solvent Ground-Water Plumes Discharging into Wetlands
1.0 Introduction and background............................................................................................. 5 2.0 Initial conceptual model and site screening........................................................................7 3.0 Field investigation methodologies to support characterization of natural attenuation in wetlands ..................................................................................................................................16
3.1 Soil/sediment boring collection ..................................................................................16 3.1.1 Tripod and hammer to drive split-spoon ...........................................................17 3.1.2 Vibracore ...........................................................................................................17 3.1.3 Direct-push devices on all-terrain vehicles .......................................................19 3.1.4 Hand auger.........................................................................................................20 3.1.5 Shallow wetland sediment coring devices.........................................................20
3.2 Reconnaissance methods and strategies ....................................................................20 3.2.1 Indicators of ground-water discharge areas......................................................21 3.2.2 On-site chlorinated volatile organic compound screening ...............................23 3.2.3 Tree core survey ...............................................................................................23 3.2.4 Surface-water sampling ....................................................................................25 3.2.5 Direct-push piezometers ...................................................................................25 3.2.6 Hypothetical reconnaissance example..............................................................27
3.3 Multilevel transects ...................................................................................................33 3.3.1 Direct-push piezometers ...................................................................................36 3.3.2 Multilevel monitoring systems .........................................................................36 3.3.3 Tubing samplers ...............................................................................................40 3.3.4 Peepers..............................................................................................................40 3.3.5 Comparison of multilevel transect sampling devices .......................................44
3.4 Characterization of hydrogeology .............................................................................46 3.5 Biogeochemical characterization...............................................................................48
4.0 Summary and conclusion..................................................................................................49 5.0 References cited................................................................................................................50
List of Figures
1. Flow chart showing process of assessing natural attenuation of chlorinated solvents.........8
2. Flow chart showing the initial screening process in assessing natural attenuation ofchlorinated solvents ..................................................................................................................9
3. Classification of wetland areas according to relative importance of water source............10
4. Example of conceptual model for a chlorinated solvent plume discharging into a marsh or swamp wetland .......................................................................................................................11
5. Example of conceptual model for a chlorinated solvent plume discharging into a seep/spring wetland ................................................................................................................12
2

6. Initial screening process flow chart for evaluating natural attenuation of chlorinated solvents in wetlands ................................................................................................................14
7. Schematic showing additional data-collection locations required for screening of natural attenuation of chlorinated solvents in wetlands .....................................................................15
8. Photographs showing vibracore systems used at the West Branch Canal Creek wetland site at Aberdeen Proving Ground, MD ...................................................................................18
9. Photograph showing direct-push GeoProbe rig mounted onto a John Deere Gator...........19
10. Photographs showing tree core sampling procedure for analysis of chlorinated volatile organic compounds ................................................................................................................24
11. Photograph showing installation of narrow-diameter drive-point piezometer using percussion hammer .................................................................................................................26
12. Schematic of a hypothetical site with a trichloroethene ground-water contamination plume showing available site ground-water data closest to the wetland ................................28
13. Schematic of a hypothetical site with a trichloroethene ground-water contamination plume showing tree core survey results of first phase of chlorinated solvent natural attenuation reconnaissance activity ........................................................................................30
14. Schematic of a hypothetical site with a trichloroethene ground-water contamination plume showing trichloroethene concentrations in surface water and sediment porewater (1meter depth using minipiezometers) from second phase of chlorinated solvent natural attenuation reconnaissance activity ........................................................................................31
15. Schematic of a hypothetical site with a trichloroethene ground-water contamination plume showing vinyl chloride concentrations in surface water and sediment porewater (1meter depth using minipiezometers) from second phase of chlorinated solvent natural attenuation reconnaissance activity ........................................................................................32
16. Schematic of a hypothetical site with a trichloroethene ground-water contamination plume showing concentrations of trichloroethene in ground water (3.6-meter depth using drive-point piezometers) from third phase of chlorinated solvent natural attenuation reconnaissance activity ...........................................................................................................34
17. Schematic of a Solinst Canada Ltd. Model 615S shielded drive-point piezometer .........37
18. Schematic of the Multilevel Monitoring System (Precision Sampling, Inc.) and emplacement within borehole.................................................................................................38
19. Photographs showing preparation and installation of Multilevel Monitoring System at wetland study site ...................................................................................................................39
3

20. Photographs showing tubing and screen components of tubing sampler and tubing sampler array at wetland field site ..........................................................................................40
21. Schematic showing a type of passive-diffusion sampler that is commonly known as a peeper......................................................................................................................................42
22. Photographs showing field recovery and sampling of peepers ........................................43
23. Concentrations of redox-sensitive constituents and of parent, daughter, and total volatile organic compounds in samples collected from peepers compared to samples collected from other sampling devices installed at site WB36 at the West Branch Canal Creek wetland site, Aberdeen Proving Ground, MD, June 2000 ...........................................45
List of Tables
1. Comparison of sampling devices.......................................................................................35
**************************************
The use of trade, product or firm names in this report is for descriptive purposes only and does not imply endorsement by the U.S. Government.
Frontspiece photograph by Daniel J. Soeder, USGS
4

Draft Technical Protocol for Characterizing Natural Attenuation of Chlorinated Solvent Ground-Water Plumes Discharging into Wetlands
An Addendum to the Air Force Center for Environmental Excellence (AFCEE) Chlorinated Solvent Natural Attenuation Protocol (Wiedemeier and others, 1996)
1.0 Introduction and Background
The U.S. Environmental Protection Agency (USEPA) has defined natural attenuation processes as “a variety of physical, chemical, or biological processes that, under favorable conditions, act without human intervention to reduce the mass, toxicity, mobility, volume, or concentration of contaminants in soil and ground water. These in-situ processes include biodegradation, dispersion, dilution, sorption, volatilization, and chemical or biological stabilization, transformation, or destruction of contaminants” (Wiedemeier and others, 1998). Monitored natural attenuation (MNA) as a remedial action alternative for contaminants dissolved in ground water has gained considerable acceptance in recent years, particularly with respect to dissolved petroleum hydrocarbons (Stauffer and others, 1993; Wiedemeier and others, 1994, 1996, 1998; National Research Council, 2000). In aquifers, trichloroethene (TCE) and other chlorinated solvents tend to be relatively resistant to transformations, either biotic or abiotic, compared to the biodegradation potential of petroleum hydrocarbons. Reductive dechlorination is the most important biodegradation process for the more heavily chlorinated ethenes such as TCE and tetrachloroethene (PCE). In reductive dechlorination, the chlorinated solvent acts as an electron acceptor and is sequentially reduced to lower chlorinated compounds. Reductive dechlorination of PCE and TCE occurs primarily by sequential hydrogenolysis to 1,2-dichloroethene (12DCE), vinyl chloride (VC), and ethene (Vogel and McCarty, 1985; Freedman and Gossett, 1989; Bouwer, 1994). This biodegradation process can result in accumulation of toxic chlorinated intermediates and relies on an adequate supply of other organic substrates as electron donors, therefore, natural attenuation generally is considered a less favorable remediation technology for chlorinated solvents than for petroleum hydrocarbons (National Research Council, 2000).
MNA may be a favorable remediation option for chlorinated-solvent ground-water plumes discharging to wetland sediments, because the organic-rich nature of wetland sediments and their typically high population density and diversity of microorganisms can enhance biodegradation (Lorah and others, 1997). Under methanogenic conditions, the highly chlorinated solvents have been shown to biodegrade faster and undergo more complete reductive dechlorination than under the less reducing conditions of nitrate or sulfate reduction (McCarty and Semprini, 1994; Lorah and others, 1997). Methanogenic conditions are often predominant in freshwater wetland sediments (Capone and Kiene, 1988). In addition to biotic transformations of chlorinated solvents in wetlands, abiotic transformations and physical attenuation processes may be greater than in other ground-water systems (Lorah and others, 1997).
Wetlands are extremely important ecosystems, containing high biodiversity and providing habitat for many threatened or endangered species (Mitsch and Gosselink, 2000). Traditional pump-and-treat remediation and other engineered remediation technologies could destroy some wetland ecosystems by dewatering or altering ground-water flow. Potentially damaging and costly engineered remedial interventions may be avoided if sufficient natural
5

attenuation of the dissolved chlorinated solvents occurs within the reduced organic carbon-rich wetland sediment zone prior to discharge into the surface water of the wetlands.
A draft protocol for MNA of chlorinated solvents was prepared by the Air Force Center for Environmental Excellence (AFCEE) (Wiedemeier and others, 1996) and later formalized in a U.S. Environmental Protection Agency (USEPA) document (Wiedemeier and others, 1998). The protocol states that “for sites where contaminated ground water discharges to surface water, the philosophy of monitoring is not well developed.” This document presents an addendum to the AFCEE MNA protocol for chlorinated solvents. It does not supersede that protocol, but rather enhances its implementation with respect to wetlands and seeps/springs. The addendum was developed as part of an Environmental Security Technology Certification Program (ESTCP) study of natural attenuation of chlorinated solvents in wetlands. Much of the information presented is based on experience gained during the ESTCP investigation at three sites (a freshwater tidal wetland along the West Branch Canal Creek, Aberdeen Proving Ground, (APG), Maryland (MD); a forested swamp in the Colliers Mills Wildlife Management Area at McGuire Air Force Base (AFB), New Jersey (NJ); and a seep/spring wetland at Hill AFB, Utah), and from previous investigations at the APG wetland site (Lorah and others, 1997; Lorah and Olsen, 1999a,b).
The same fundamental principles of the AFCEE protocol apply to characterizing natural attenuation of chlorinated solvents in wetland environments. The main differences lie in the development of a site conceptual model and in the appropriate field methodologies for characterizing natural attenuation processes. Natural attenuation tends to occur in wetlands at a much smaller spatial scale than in aquifers; thus, site characterization and monitoring methods require greater spatial resolution. The complex hydrology and logistical difficulties associated with most wetland work also require special consideration in the selection of field methodologies. The technical methodologies included in this protocol for wetlands include collection of soil/sediment borings, reconnaissance methods and strategies, installation of multilevel piezometer (or ground-water sampler) transects, and characterization of the hydrogeology and biogeochemistry.
Sorption and phytoremediation are mechanisms that can be significant in wetlands, but a review of methodologies for these processes is beyond the scope of this project. Sorption calculations are addressed in the AFCEE (Wiedemeier and others, 1996) and USEPA MNA protocol for chlorinated solvents (Wiedemeier and others, 1998). Additional methods to measure sorption coefficients are given in Lorah and others (1997). The Ground-Water Remediation Technologies Analysis Center has recently published an overview of phytoremediation technology (Schnoor, 2002). The protocol presented here is intended to be a guide and not a firm, inflexible procedure to follow. Each site is unique, and discretion should be applied when deciding which methodologies may be most appropriate.
The central elements involved in the consideration of MNA as a remedial action include determination and documentation of operational natural attenuation processes, and assessment of the level or extent of natural attenuation taking place, as well as its potential for future occurrence, relative to regulatory and site-specific remedial action levels. The National Research Council (2000) lists three basic steps to document natural attenuation for ground-water remediation:
a) Develop a conceptual model of the site: The model should show where and how fast the ground water flows, where the contaminants are located and at what concentrations, and which types of natural attenuation processes could theoretically affect the contaminants.
6

b) Analyze site measurements: Samples of ground water should be analyzed chemically to look for footprints of the natural attenuation processes and to determine whether natural attenuation processes are sufficient to control the contamination.
c) Monitor the site: The site should be monitored until regulatory requirements are achieved to ensure that documented natural attenuation processes continue to occur. “Footprints” are concentrations of reactants or products of biogeochemical processes that transform or immobilize contaminants. This protocol describes the development of a site conceptual model for wetland environments and specific considerations for collecting and analyzing measurements at wetland sites.
2.0 Initial Conceptual Model and Site Screening
The main objective of a natural attenuation investigation is to determine whether regulatory criteria (standards) are met by natural means before receptor exposure pathways are completed. In making this assessment, projections of the extent and magnitude of the contaminant plume in time and space are required. The steps involved in a natural attenuation demonstration, as outlined in Wiedemeier and others (1996), are shown schematically in figure 1. The first step is to review the available site data and determine the present extent of contamination. The site data are used to construct a preliminary conceptual model of the site with particular emphasis on the possible operational natural attenuation processes. An initial screening process (fig. 2) is applied to assess the potential of natural attenuation. If data are insufficient to adequately apply the screening process, additional data are collected. Although the general steps for a natural attenuation assessment of a plume discharging to a wetland area are the same as those outlined by Wiedemeier and others (1996), development of a conceptual model and the initial screening process (fig. 2) would differ in the case of a suspected discharging plume.
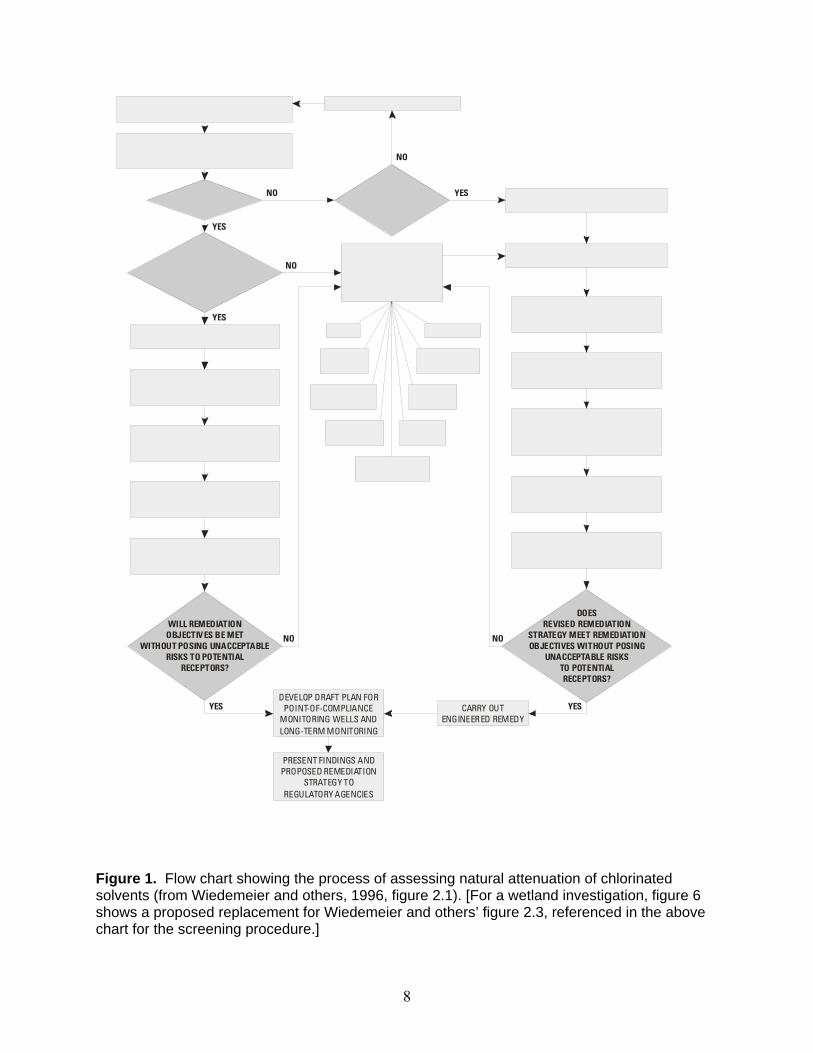
Development of a site conceptual model includes a review of all available information regarding the nature, sources, extent, and magnitude of the contamination; ground-water flow and solute transport; zones where natural attenuation processes may be operational; and locations of potential receptor exposure endpoints. Review of existing classification systems for wetlands and associated theory can be helpful in developing a site conceptual model. A popular hydrogeomorphic approach classifies wetlands according to the location of the wetland in the landscape and the dominant sources of water for the wetland (fig. 3) (Brinson, 1993; Richardson 1999; Cole and Brooks, 2000). A similar approach to classifying wetland function considers hydrogeologic setting and climate (Winter, 1992; Winter, 2001; Winter and others, 2001). A generic wetland conceptual model for marshes and swamps is shown in figure 4 to help in conceptual model development. A similar conceptual model for seep/spring-type wetlands is shown in figure 5. For wetlands, data addressing the following questions are critical: 1) is it a ground-water discharge wetland? (rather than one that is primarily recharged with surface water); 2) is the plume entering into the wetland system? (including the sediment zone); and 3) in the case of a seep/spring, is the plume truncating in the vicinity of the seep/spring area? If available site assessment data are insufficient to clearly indicate that the plume discharges to the wetland, traditional ground-water data collection is required to delineate the approximate boundaries of the plume from the contaminant source area to the wetland boundary. If the contaminant plume
7
REVIEW AVAILABLE SITE DATA AND COLLECT MORE SCREENING DATA DEVELOP PRELIMINARY CONCEPTUAL MODEL
SCREEN THE SITE USING THE PRO CEDUREPRESENTED IN FIGURE 2.3 OF WIEDEMEI ER
NOAND OTHERS, 1996
ARE ARE NO SUFFICIENT DATA YES ENGINEERED REMEDIATION REQUIRED,
SCREENING CRITERIA AVAI LABLE T O PROPERLY IMPLEMENT OTHER PROTOCOLS MET? SCREEN THE
SITE?YES
DOES IT EVALUATE USE OF PERFORM SITE CHARACTERIZATION APPEAR THAT NO SELECTED ADDITIONAL TO SUPPORT REMEDY DECISION MAKING
NATURAL ATTENUATION ALONE REMEDIAL OPTIONS W ILL MEET REGULATORY ALONG WITH
CRITERIA? NATURAL ATTENUATION ASSESS POTENTIAL FOR
NATURAL ATTENUATION WITH REMEDIATION SYSTEM INSTALLED
YES
EXCAVATIONTO SUPPORT NATURAL ATTENUATION
NAPL
PERFORM SITE CHARACTERIZATION OTHER
COMETABOLIC REFINE CONCEPTUAL MODEL AND RECOVERY BIOVENTING COMPLETE PRE-MODELING REFINE CONCEPTUAL MODEL AND CALCULATIONS CO MPLETE PRE -MODELING HYDRAULIC AIR
CALCULATIONS CONTAINMENT SPARGING SIMULATE NATURAL ATTENUATION
VACUUM REACTIVE COMBINED WITH REMEDIAL SIMU LATE NATURAL AT TENUAT ION BARR IER OPTION SELECTED ABOVE DE WATERING USING SOLUTE FATE AND
USING SO LUT E T RANSPO RT MODEL TRA NSPOR T MOD ELS ENHANCED
BI OREMEDIATION INITIATE VERIFICATION OF INITIATE VERIFICATION OF NATURAL ATTENUATION NATURAL ATTENUATION USING USING LONG-TERM MONITORING LONG-TERM MONITORING
USE RESULTS OF MODELING AND USE RESULTS OF MODELING AND SITE-SPECIFIC INFORMATION IN SITE-SPECIFIC INFORMATION IN AN AN EXPOSURE ASSESSMENT EXPOSURE PATHWAYS ANALYSIS
DO ES WILL REMEDIATION REVISED REMEDIATION
OBJECTIV ES BE MET NO NO STRATEGY MEET REMEDIATION WITHOUT POSING UNACCEPTABLE OB JE CTIVES WIT HOUT POSING
RISKS TO POTENTIAL UNACCEPTABLE RISKS RECEPTORS? TO POTENTIAL
RECEPTORS?
DEVELOP DRAFT PLAN FOR YES POINT-OF-COMPLIANCE CARRY OUT YES
MONITORING WELLS AND ENGINE ER ED REMEDY LONG-TERM MONITORING
PRESENT FINDINGS AND PROPOSE D REMEDIATION
STRATEGY TO REGULATORY AGENCIES
Figure 1. Flow chart showing the process of assessing natural attenuation of chlorinated solvents (from Wiedemeier and others, 1996, figure 2.1). [For a wetland investigation, figure 6 shows a proposed replacement for Wiedemeier and others’ figure 2.3, referenced in the above chart for the screening procedure.]
8

I
(S) (S)
I
IS
NO
NO
NO
ANALYZE AVA LABLE SITE D ATA TO DETERMINE IF BIODEGRADATION
IS OCCURRING
EVALUATE USE OF SELECTED ADDI TIONAL REME DI AL OPTIONS
ALONG WITH NATURAL ATTENUATION
LOCATE SOURCEAND RECEPTOR
ESTIM ATE BIODEG RAD ATI ON RATE CONSTANT
PROCEED TO WIEDEMEIER
AND OTHERS,1996, FIGURE 2.1
COMPARE THE RATE OF TRANSPORT TO THE RATE O F ATTE NUATION US NG
ANALYTICAL SOLU TE TRANSPORT MODEL
DETERMINE GROU ND-WATER FLOW AND SOLUTE TRANSPORT
PARAMETERS US ING SITE-SPECIFIC DATA; POROSITY AND DISPERSIVITY
MAY BE ESTIMATED
BIODEGRADATION OCCUR RING?
ARE SCREEN CRITERIA
MET?
DOES IT APPEAR THAT
NATURAL ATTENUATION ALONE WILL MEET
REGULATORY CRITERIA?
ARE SUFFICIENT DATA
AVAILA BLE ?
NO OR YES
YES
INSUFFICIENT DATA
COLLECT MORE SCREENING DATA
YES
ENGINEERED REMEDIATION REQUIRED, IMPLEMENT
OT HE R PRO TOCOLS
YES
PERFORM SITE CHARACTERIZATION TO SUPPORT NATURAL ATTENUATION
PROCEED TO WIEDEMEIER AND OTHERS,1996,
FIGURE 2.1
Figure 2. Flow chart showing the initial screening process in assessing natural attenuation of chlorinated solvents (from Wiedemeier and others, 1996, figure 2.3).
9

McGuire Air Force Base/ Colliers Mills Wildlife
Management Area (Inland Forested Bog)
Peat Bogsand
PocosinO
N
TITA
Peatlands I
PREC
PIInterior
(nontidal)Marshes
100%
Fringe Marshes
%0
Riverine Marshes
Mangrove Tidal Swamps Marshes
Forest and Graminoid Fens
Seeps
0%
RETAW
DN
UO
RG
%001
0%
100% SURFACE FLOW
Hill Air For ce Base Aberdeen Proving Ground (Seep/Spring Area) (Freshw ater Tidal Marsh)
Figure 3. Classification of wetland areas according to relative importance of water source [modified from Richardson (1999) and Brinson (1993)].
10
11
EXPLANATION
NOT TO SCALE
NOT TO SCALE
Creek
TCE Plume
AQUIFER
Wetland
AQUITARD
GENERALIZED GROUND-WATER FLOW
DIRECTION OF
WATER TABLE
LINE OF SECTIONA A'
Volatilization
High Organic Carbon Sedimentof Wetland ( reducing conditionsconducive to biodegradation)
Evapotranspiration/Phytoremediation
Creek
TCE DNAPLSource Area
Wetland
A
A
A'
A'
(a)
(b)
Dissolved TCE Ground-water
Plume
Figure 4. Example of conceptual model for a chlorinated solvent plume discharging into a marsh or swamp wetland. (a) plan view, (b) cross-sectional view.

12
NOT TO SCALE
Creek
TCE DNAPLSource Area
Wetland
A
A'
(a)
Dissolved TCE Ground-water
Plume
EXPLANATIONGENERALIZED GROUND-WATER FLOW
DIRECTION OF
WATER TABLE
SPRING OR SEEP
LINE OF SECTIONA A'
NOT TO SCALE
TCE Plume
AQUIFER
Wetland
AQUITARD
Volatilization at ground surface
Evapotranspiration/Phytoremediation
A A'(b)
Figure 5. Example of conceptual model for a chlorinated solvent plume discharging into a seep/spring wetland. (a) plan view, (b) cross-sectional view.

does not currently discharge to the wetland, it should be determined whether the plume may reach the wetland in the future, or if natural attenuation processes within the aquifer upgradient of the wetland are sufficient to lower contaminant concentrations to regulatory criteria before the plume reaches the wetland boundary.
There are sufficient differences between natural attenuation processes in aquifers and wetland discharge areas to warrant variations in the initial screening process approach from that of Wiedemeier and others (1996) (fig. 2). A modified initial screening flow chart for wetlands is presented in figure 6. A key change in the initial screening process is that it must be determined whether ground water is discharging to the wetland, or the wetland is recharging the ground water. If ground water is not discharging through the wetland material, natural attenuation within the wetland will not occur and other options should be sought. Surface features, such as whether the wetland is at the headwaters of a stream, can frequently indicate that the wetland is fed by ground water. Head distributions provide more concrete proof of ground-water-flow directions. Factors indicating the presence of a “ground-water discharge” wetland include: 1) surficial aquifer heads adjacent to the wetland are higher than the water level in the wetland; and/or 2) heads within the aquifer beneath the wetland become greater with increasing depth (upward vertical gradient). The first decision loop in the screening process for wetland assessments involves determination of ground-water-flow direction in the wetland vicinity. A positive response to the ground-water discharge wetland determination moves the initial screening to an evaluation of natural attenuation potential at the site . Another difference in the wetland screening flow chart (fig. 6) compared to the Wiedemeier and others (1996) protocol (fig. 2) is that the specific mention of only assessing biodegradation rates to consider the feasibility of natural attenuation has been removed. Other natural attenuation processes in addition to biodegradation are likely to occur in wetland environments. For example, phytoremediation may be the dominant natural attenuation process in seep/spring wetlands. In this case, it would be more important to estimate hydraulic plume capture efficiency (ability of the “pumping” action of the plants to control the plume) than biodegradation rates. It should be noted that the initial screening process presented by Wiedemeier and others (1996) (fig. 2) contains a “scoring system” that is not used in this protocol addendum (fig. 6). The National Research Council (2000) recommended elimination of the use of scoring systems for decisions regarding natural attenuation because they tend to be too simplistic to represent the complex and site-specific processes involved in natural attenuation. It was recommended that the scoring systems be replaced by evaluation methods using conceptual models and biogeochemical footprints (concentrations of reactants or products of biogeochemical processes that transform or immobilize contaminants).
There also are differences in the data-collection requirements to assess both subsurface hydrogeology and geochemistry (which reflects biological activity) in a wetland. Because data from the aquifer already exist upgradient from the wetland, the additional data requirements are focused on locations within the wetland itself. Using the generic conceptual model of a groundwater contaminant plume discharging into a wetland (fig. 4), data-collection locations for screening are schematically shown in figure 7. Multiple sampling locations are needed in the vertical direction, as well as the lateral direction, because ground-water-flow directions may be predominantly vertical in a discharge wetland. The multilevel sampling transect approach is crucial in the evaluation of natural attenuation in wetlands. In addition to ground-water sampling locations for hydrogeological and geochemical data, soil-boring information within the wetland
13

I I
NO
NO
NO
NO
NO
I
ANALYZE AVAILABLE SITE DATA TO DETERMINE IF GROUND-WATER
S DI SCHARG NG I NTO WETLAND
IS IT A GRO UND -WAT ER
DISCHARGE WETLAND?
IS "FOOT PRI NT" AD EQUAT E TO SUPPORT N ATURAL ATTEN UATION
OPTION?
ARE SU FFICIENT DATA
AVA ILABLE ?
ARE SU FFICIENT DATA
AVA ILABLE ?
YES
YES
COLLECT MORE SCREENING DATA
COLLECT MORE "FOOTPRINT" SCREENING DATA
YES
ENGINEERED REMEDIATION AND/0R NATURAL ATTENUATION
REQUIRED, IMPLEMENT OT HE R PROTO COLS
ANALYZE AVAILABLE S TE DATA TO DETERMINE IF NATURAL ATTENUATION "FOOTPRINT"
IS PRESENT
ENGINEERED REMEDIATION REQUIRED, IMPLEMENT
OTHER PROTOCOLS
DOES IT APP EAR THAT
NATURAL ATTENUATION ALONE WILL MEET REGULATORY
CRITERIA?
EVALUATE USE OF SELECTED ADDI TIONAL REME DI AL OPTIONS
ALONG WITH NATURAL ATTENUATION PROCEED TO FIGURE 1
YES
YES
PERFORM SITE CHARACTERIZATION TO SUPPORT NATURAL ATTENUATION
PROCEED TO FIGURE 1
Figure 6. Initial screening process flow chart for evaluating natural attenuation of chlorinated solvents in wetlands. [For a wetland investigation, this flow chart would replace Figure 2.3 in Weidemeier and others (1996), shown in this document as figure 1].
14

15
EXPLANATION
NOT TO SCALE
NOT TO SCALE
Creek
TCE Plume
AQUIFER
Wetland
AQUITARD
GENERALIZED GROUND-WATER FLOW
DIRECTION OF
WATER TABLE
PIEZOMETER NEST SITE ANDIDENTIFICATION LETTER
LINE OF SECTIONA A'
High Organic Carbon Sedimentof Wetland ( reducing conditionsconducive to biodegradation)
A A'
(a)
(b)
Xa
a b c d
Creek
TCE DNAPLSource Area
Wetland
A
A'
Dissolved TCE Ground-water
Plume
X
X
X
X
a
b
c
d
Figure 7. Schematic of additional data-collection locations required for screening of natural attenuation of chlorinated solvents in wetlands (using the conceptual model shown in figure 4) (a) plan view, (b) cross-sectional view.

is needed during the initial screening process. Two or more soil borings along the transect within the wetland would provide valuable information regarding subsurface features, particularly: 1) the amount of natural organic carbon matter in the wetland sediments; 2) thickness of the organic carbon zone; 3) qualitative evaluation of the redox status of the wetland sediment by visual inspection and odor (for example, a rotten egg odor indicates the presence of sulfide); and 4) lithology of the wetland sediment and underlying aquifer, including the presence of clay lenses or low conductivity zones. (Descriptions of appropriate field methods for monitoring system installation, sampling, and soil-boring collection are given in Section 3.)
As shown in figure 7, there is an increase in data-collection location requirements in the wetland protocol for a total of 18 sampling locations in 6 well clusters, compared to about 6 total sampling locations in 3 well clusters in the standard MNA protocol of Wiedemeier and others (1996). This can significantly increase sample analysis costs if all analytes proposed by Wiedemeier and others (1996) are selected for analysis. An abbreviated list of analytical parameters for screening purposes can focus on those that are most relevant to the assessment of biodegradation within a wetland system, increasing cost-effectiveness: 1) volatile chlorinated organics (parent chlorinated compounds and daughter products), 2) ferrous iron, 3) sulfide, and 4) methane. The strongest evidence to assess natural attenuation is the spatial distribution of parent and daughter compounds. The decrease of parent chlorinated compound concentrations along the vertical flowpath in conjunction with the production and subsequent removal of daughter products is the strongest indication of biodegradation. The other parameters help to confirm whether the conditions conducive to those biological transformations also exist, providing indirect evidence in support of natural attenuation assessment.
If the outcome of the initial screening process (fig. 6) yields an affirmative answer, the next phase in the assessment of natural attenuation at the wetland site is to more fully characterize the site to evaluate MNA as a remedial option. This is a phased approach where the results of the initial site screening need to be taken into account in planning and carrying out the full site characterization. This addendum more closely adheres to Wiedemeier and others (1996) at this stage by returning to the process flow chart in figure 1. The main addition for characterization of wetland systems is the high spatial resolution required in sampling and monitoring because of vertical ground-water-flow directions and potentially rapid transformations over shorter distances than normally occurs in aquifers (Lorah and others, 1997; Lorah and Olsen 1999a,b; Dyer and others, 2002). Increased frequency of temporal sampling also may be required to characterize natural attenuation processes because shallow wetland systems are more affected by seasonal hydrology, temperature, and vegetation changes and seasonal man-made influences (such as salting of roads) than deeper aquifer systems (Lorah and others, 2002; Lorah and others, 2003).
3.0 Field Investigation Methodologies to Support Characterization of Natural Attenuation in Wetlands
3.1 Soil/Sediment Boring Collection: Site investigations to characterize a chlorinated solvent plume moving downgradient towards a wetland generally include soil-boring logs and drill cores, which provide valuable information on the subsurface geology. The AFCEE chlorinated solvent natural attenuation protocol (Wiedemeier and others, 1996) provides information on traditional drilling methods (such as hollow-stem auger drilling) and direct-push
16

methods for obtaining subsurface soil samples. While these methodologies are useful in the upland areas of a site, large, heavy drill rigs are usually not practical within wetlands because of access difficulties, soft ground, and excessive disturbance of sensitive habitat. Assessing natural attenuation in wetlands requires critical stratigraphic information from within the wetland itself, however, especially the thickness and nature of the wetland sediments (such as organic carbon content), and the nature of the material beneath the wetland sediments, including dominant water-bearing units and low-conductivity units. As such, specialized soil-boring methods have been developed for use within wetlands, although the utility of any particular technique will depend upon the site-specific characteristics of the wetland. Small, all-terrain vehicles rigged with direct-push drilling equipment may be appropriate at some sites, while more marshy locations may use similarly equipped amphibious craft. Some sites may not have any vehicle access at all, and require lightweight soil-boring equipment that can be manually carried on floating work platforms. The following sections describe potential methods.
3.1.1 Tripod and Hammer to Drive Split-Spoon: Split-spoon core samples can be obtained at hard-to-access locations in wetlands using tripod and hammer devices that can be assembled at the sampling location. Sediment cores were collected at the APG West Branch Canal Creek wetland site (Lorah and others, 1997) using a 4.6-m (meter)-high tripod equipped with a motorized (5-horsepower) cathead to operate a pulley attached to a 150-pound hammer. The tripod equipment was used to hammer 1.5-m lengths of 0.1-m-diameter polyvinyl chloride (PVC) casing into the wetland and aquifer sediments. Cores were obtained through the PVC casing using a 0.61 m-long split-spoon sampler attached to 0.073-m-diameter drill rods. In the sand aquifer, sediment was prevented from filling the casing by pumping water from an approved water source through the 0.073-m-diameter drill rods set at depth within the drive casing. Sediment cores were collected until the lower clayey unit was reached at a depth of about 36 m below land surface.
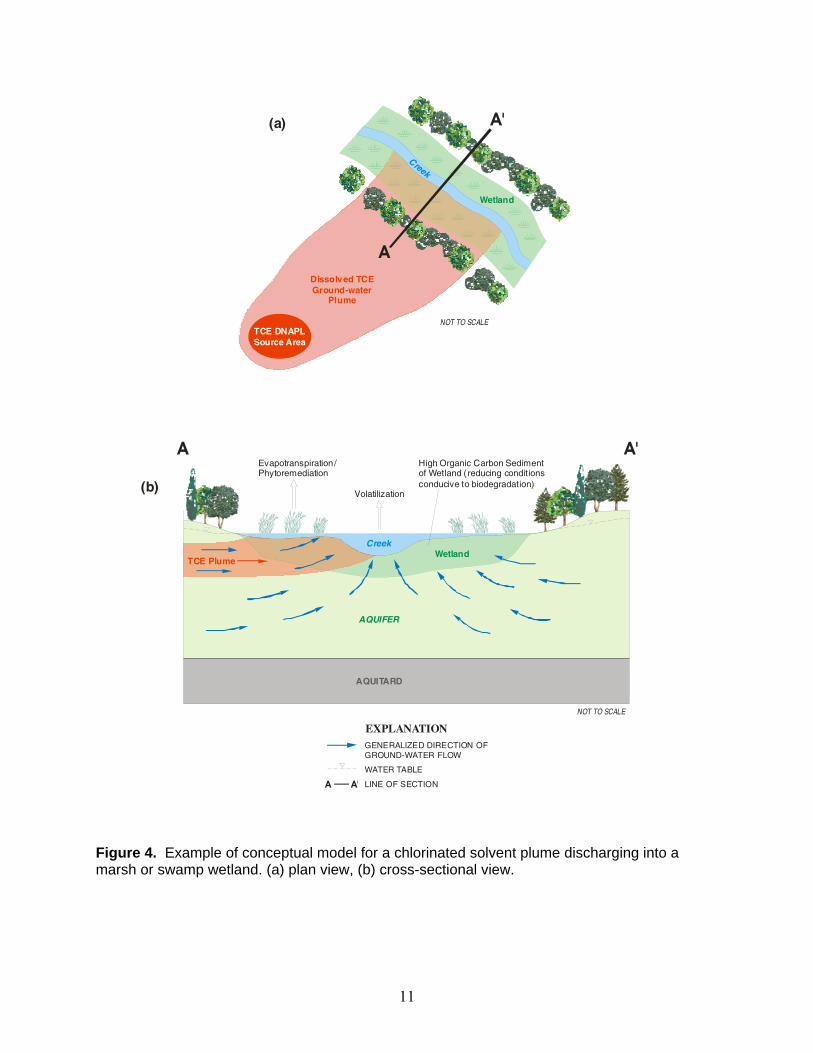
3.1.2 Vibracore: Vibracore technology uses vibration to reduce the drive casing into the subsurface. It is a commonly used technique for obtaining cores in shallow marine or lake sediments. Vibracore systems are sometimes mounted on vehicles, but vehicle mounting is not required. Like the tripod and hammer, one of the advantages of vibracore systems for use in wetland environments is that they can be disassembled into relatively lightweight parts that can be hand-carried into the sampling location, thus causing minimal disturbance to sensitive habitat, and allowing access to sites that would be difficult to reach in a vehicle.
There are a number of vibracore systems available. Some are hydraulically controlled with only vibration, and some are hydraulically controlled with vibration and a hammering action (fig. 8). Others have a gasoline engine power source that connects to a vibration unit (either as vibrator head on top of the casing or as a unit that is clamped onto the side of the casing) by a vibrator cable (much like a speedometer cable). Steel or aluminum casings with a diameter of 0.076 m can be used. A core sample retainer is used to keep the core within the casing during withdrawal. Withdrawal can be accomplished by either a hydraulic unit (if the hydraulic vibracore systems are used), or by winch and a tripod.
A unique vibracore system application has been developed by the U.S. Geological Survey (USGS) in cooperation with Hovertechnics, Inc. of Benton Harbor, Michigan, and MPI Drilling, Inc. of Picton, Ontario (Phelan and others, 2001). A hydraulic vibracore system was mounted on a small hovercraft, creating a “hoverprobe” that can be used for drilling and ground-water sampling in locations accessible to a hovercraft (fig. 8). Hovercrafts can be flown on land,
17
USGS photos
Figure 8. Vibracore systems used at the West Branch Canal Creek wetland site at Aberdeen Proving Ground, MD: (upper left) portable hydraulic unit with vibration only; (upper right) portable hydraulic unit with vibration and hammer action; and (lower) hoverprobe with attached hydraulic vibracore unit with vibration only.
18

water, mud, snow, or ice, and are propelled by one or more fans that provide both lift and thrust. A scoop behind the fan diverts part of the air under the craft to provide the lift. A rubber-coated segmented skirt surrounds the base of the craft, trapping most of the pressurized air and allowing a constant ground clearance between the craft and the surface. The segmented skirt conforms to various surface textures and conditions, allowing the hovercraft to fly directly between land, water, ice, snow, or mud (Phelan and others, 2001). The drill rig on the USGS hoverprobe is a Metaprobe vibracore drill, which is manufactured by MPI Drilling, Inc. Hydraulically driven cams are used to generate high-frequency vibrations at the cutting edge of a hollow drill string. A hole and core can be cut, or a monitoring well installed rapidly, with almost no cuttings resulting at the surface. The drill can be used to retrieve continuous core up to a maximum depth of about 30 m from saturated, unconsolidated materials. The hoverprobe was used to obtain ground-water and lithologic samples to depths of about 15 m along a tidal creek at APG, MD, drilling as tides changed surface-water levels (Phelan and others, 2001).
3.1.3 Direct-Push Devices on All-Terrain Vehicles: A number of drilling firms have mounted direct-push rigs such as GeoProbes on various all-terrain vehicles (ATVs). Direct-push rigs are useful for obtaining soil borings from moderate depths (less than about 15 m). A GeoProbe mounted to a John Deere multiwheel ATV known as a “Gator” (fig. 9) was used at a McGuire AFB wetland site located in a protected area of the New Jersey Pine Barrens (Colliers Mills Wildlife Management Area). The narrow width (1.5 m) of the Gator allowed access to some sites without cutting trees. The use of the Gator-mounted direct-push rig, however, is limited to wetlands that do not have a large amount of standing water and have relatively level surfaces to drive on. Vertical clearance was found to be a difficulty at the Colliers Mills wetland site due to a highly irregular surface caused by roots and undergrowth.
Figure 9. Direct-push GeoProbe rig mounted onto a John Deere Gator. (The narrow width of the Gator allows access to difficult-to-reach locations within swamp-like wetlands.) USGS photo
19

3.1.4 Hand Auger: Hand augers can be used to obtain disturbed core material to gain information on shallow subsurface geologic conditions. Hand augers can be convenient in some wetland environments because they are very portable. One of the difficulties with hand augering in wetlands is that the borehole may collapse when sampling below the water table. A possible remedy is to drive a PVC pipe with an inside diameter slightly larger than the hand auger outside diameter into the borehole to keep it open. This will cause some mixing of subsurface materials, so care must be taken in interpreting the soil type from the material in each auger bucket load. The material at the bottom of the auger bucket is likely the most representative of the material at depth.
3.1.5 Shallow Wetland Sediment Coring Devices: Although mechanical coring devices are needed to obtain deeper sediment samples, these devices typically give poor recovery of organic-rich wetland soils or greatly compact them. Many different types of samplers have been described in the literature for hand-operated sampling of organic-rich soils at shallow depths (generally less than 2.5 m). Landva and others (1983) and Sheppard and others (1993) discuss many of these samplers, giving details of their design, operation, and suitability for accomplishing different objectives. The selection of a soil sampler depends on the wetland sediment characteristics of a particular site and the purpose for which the sediment sample is needed. Many samplers can be made relatively easily from inexpensive materials. In the soft, freshwater marsh sediment at APG, a 1.5-m-long section of 0.10-m-diameter PVC pipe had been sharpened and beveled at one end to obtain sediment cores that had been minimally disturbed (Daniel J. Phelan, U.S. Geological Survey, oral commun., 2003). A thin acetate liner was placed inside the PVC pipe, and a well cap with a small hole in it was placed over the top of the pipe to allow air to escape while the pipe was manually pushed into the sediment with a twisting motion. Once the desired depth was reached, a solid well cap was installed, and the pipe was recovered by pulling upward with wrenches. The vacuum created by the solid cap was sufficient to retain the sediment inside the pipe. Core recovery was 100 percent using this method in marsh sediment that had some clay content near the bottom. The acetate liner could be gripped with pliers and withdrawn from the pipe, allowing the sediment core to be removed without using a plunger, which can greatly disturb soft sediment. During insertion of a sediment sampling device in organic-rich sediments, compaction as great as 50 percent is a common problem and must be accounted for by measuring depths from the top of the corer to soil on both the inside and outside of the pipe.
3.2 Reconnaissance Methods and Strategies: The preliminary site conceptual model and initial screening process (fig. 6) form the basis for reconnaissance strategy and activities. The conceptual model should include the presumed contaminant source area, status of that source area relative to the contaminant ground-water plume, ground-water flowpaths, approximate location of the contaminant plume in the aquifer upgradient of the wetland, location of the wetland, ground-water flowpaths in the wetland, natural attenuation processes that may be occurring in the aquifer, and natural attenuation processes that may be occurring in the wetland (in wetland sediments, plants, and surface water). Site reconnaissance activities should not be designed to provide a full assessment of operational natural attenuation processes at the site, but rather to test principal aspects of the preliminary site conceptual model and to determine whether an adequate natural attenuation footprint (National Research Council, 2000) exists to support further assessment of natural attenuation as a remediation option. The critical first step in the initial screening process is to determine if ground water is discharging into the wetland. Some direct and indirect methods for determining whether the wetland is a ground-water discharge
20

wetland are described in Section 3.2.1. Subsequent sections of this protocol describe relatively rapid and inexpensive methods of sampling different media, including surface water, ground water, and tree cores, to obtain a preliminary estimate of areas of contaminated ground water within the wetland and to guide placement of the final monitoring and assessment network. An effective reconnaissance strategy at many wetland sites is to use a dynamic approach, in which a rapid turn-around of volatile organic compound (VOC) analyses from an on-site or local laboratory provides results that can be used to guide further sampling while the investigators are still in the field. Even though on-site screening or overnight analytical results for VOCs can be expensive, a dynamic approach can reduce the overall cost of reconnaissance activities by eliminating the need for mobilizing a field team multiple times. Aspects of on-site VOC analysis are described in Section 3.2.2.
Wetlands often have thick vegetation, and access pathways within the wetland may need to be cleared to begin reconnaissance sampling activities. Access pathways also are important to minimize disturbance to the wetland ecosystem (field workers should remain on access pathways to the greatest extent possible). Selective cutting or pruning of shrubbery, grasses, or marsh reeds may be necessary to create access pathways. This type of disturbance is generally shortterm, due to rapid re-growth of vegetation in wetland systems. If standing water or soft sediment are present, temporary wood planking or other materials may be necessary in sampling areas to facilitate sample collection. Access pathways can be marked with highly visible fluorescent plastic survey tape. A small hand-held global positioning system (GPS) unit can be useful to rapidly determine site locations – often within an accuracy of 3 m. Otherwise, compass and field measurement tape can be used to determine approximate sample locations for the purpose of plotting locations on a site map during reconnaissance. Surveying of sample locations and piezometers and land-surface elevations generally would not be conducted as part of the reconnaissance phase, but would be completed after most of the piezometers have been installed for the full natural attenuation assessment phase.
3.2.1 Indicators of Ground-Water Discharge Areas: Determination of areas of groundwater discharge within wetlands, both to the wetland surface and to surface-water bodies if they are present within the wetlands, is critical for mapping the contaminant plume and evaluating natural attenuation in wetland sediments. Areas of ground-water discharge can be highly variable spatially in wetland systems. Indicators of ground-water discharge, including physical, chemical, and biological methods, are extremely useful as reconnaissance tools for locating specific sites where detailed measurements and sampling can be focused, helping to guide the monitoring network design in a cost- and time-efficient manner. This section discusses possible qualitative indicators or indirect measurements of ground-water and/or contaminant discharge, and quantitative measures of ground-water and contaminant discharge believed to be most useful for the reconnaissance phase of a study. Brief summaries of qualitative and quantitative measures of ground-water discharge, in addition to extended abstracts and case studies, are listed in U.S. Environmental Protection Agency (2000). Selection of a specific reconnaissance method requires consideration of site-specific logistical, physical, and chemical characteristics. For tidal areas, ground-water discharge areas are best observed or measured at low tide.
Common indirect or qualitative indicators include observations of seeps and springs, thermal infrared mapping, drag probes for temperature, conductivity, or gamma anomalies, and plant distributions. In some settings where flow rates are high, seeps and springs may be easily observed by walking the field area. Chemical constituents such as iron and manganese that are dissolved in anoxic ground water precipitate upon contact with oxygenated surface water,
21

causing formation of colored oxides. If the contaminated ground water has a distinct odor, this could assist in locating ground-water discharge areas. Seeps also may be located by walking an area during colder seasons where ground-water, surface-water, and air temperatures are considerably different, causing water vapor or melted ice areas to be visible above seeps. Temperature measured with thermal infrared imagery also has been used as a reconnaissance tool for finding areas of ground-water discharge to lakes, streams, and wetlands (Lee and Tracey, 1984; Silliman and Booth, 1993; Banks and others, 1996; Rosenberry, 2000).
Airborne thermal-infrared imaging, which measures the relative differences in radiant thermal energy emitted from the surface of various Earth features, would be most time- and costeffective for relatively large wetland systems, where the benefits of limiting the areas needing detailed in situ measurements would be greatest. This technique is most likely to be successful in temperate climates during colder months, when the greatest temperature differences would be expected between surface water and ground water, and vegetation growth (which can obscure the line of site contact with the land surface) is at a minimum (Banks and others, 1996). Predawn flights in early March were most successful for delineating ground-water discharge areas using a thermal-infrared-multispectral scanner at APG, MD (Banks and others, 1996). At APG, Banks and others (1996) distinguished between two types of ground-water discharge—(1) diffuse discharge, which was observed in the estuaries as a pattern of water temperature grading from warmer to cooler in an offshore direction, and (2) concentrated discharge, which was observed in isolated or restricted surface-water bodies that had relatively warm surface temperatures similar to the ambient ground-water temperature. Newer, high-resolution digital infrared thermography has increased the accuracy of this technique. Airborne thermal infrared imaging can be followed up by ground-view thermal infrared video camera sweeps to identify discharge areas on a smaller scale. In larger river or estuarine systems, drag probes that measure temperature and conductivity also may be useful for locating ground-water discharge areas (U.S. Environmental Protection Agency, 2000; Lee, 1985). Dense submerged vegetation, however, can interfere with the performance of this towing method, and it is relatively time-consuming (Rosenberry, 2000).
The distribution of aquatic plants has been used as an indicator of ground-water discharge areas in wetlands (Rosenberry, 2000; U.S. Environmental Protection Agency, 2000). The distribution of cattail clumps (Typha latifolia L.) has been recognized as a fairly reliable indicator of discharge areas of low-salinity ground water in highly saline wetlands (Swanson and others, 1984), and the distribution of marsh marigold (Caltha palustris L.) has been used to map seeps and springs next to a lake and in wetlands in Minnesota (Rosenberry, 2000). Marsh marigold preferentially grows in ground-water discharge areas across the upper Midwest states and south central Canada (Rosenberry, 2000). This plant has been shown to be a valid indicator of discharge areas in the northern extent of its range (Rosenberry, 2000), but not along the southern margins of its distribution across the United States (Amon, 2002; Pearson and Leoschke, 1992). Goslee and others (1997) describe numerous other plant species that are indicators of ground-water discharge in other locations, and Klijn and Witte (1999) discuss the relation between plants and ground-water flow.
There are many possible direct chemical and physical measurements (for example, specific conductance, temperature, electrical resistivity) that can be made in shallow ground water and surface water to assist in locating plume discharge areas (U.S. Environmental Protection Agency, 2000). If a site is contaminated, however, direct measurement of VOCs is probably best logistically once the site has been accessed. Passive-diffusion samplers, made of polyethylene bags filled with VOC-free deionized water (Vroblesky, 2001) and buried in shallow
22

sediment for approximately 2 to 3 weeks, are one possible reconnaissance tool for locating contaminant discharge areas. The required equilibration time may be a disadvantage, however, for reconnaissance investigations. A combination of VOC analyses and head measurements, which can be done with minipiezometers, provides even more information. Different handdriven minipiezometer devices have been successfully used for decades to measure the direction of seepage into a surface-water body and head differences between the surface water and ground water (Lee and Cherry, 1978; Woessner and Sullivan, 1984; Winter and others, 1988). These devices consist of a small-diameter tube (plastic or steel) with a perforated or screened tip inserted by hand in streambed sediment. Use of a small-diameter tube is essential to minimize disturbance of the sediment during insertion and to reduce lag times for attaining hydrostatic equilibrium (Winter and others, 1988). To obtain a direct measurement of hydraulic-head difference between surface water and ground water, a manometer can be attached with flexible tubes that extend to the inserted minipiezometer and to the surface water. Head differences can also be determined simply by measuring the level of ground water in the well and level of the surface water outside the well, but the use of a manometer can provide better accuracy and better indication of when hydraulic equilibrium is reached in the inserted minipiezometer. Winter and others (1988) called the combination of a minipiezometer and a manometer a “hydraulic potentiomanometer” and describe their design and method in detail. Potential problems that can be encountered also are described, including difficulties in fine-grained organic-rich sediment, such as clogging of the minipiezometer screen, slow hydraulic equilibrium, or interference from gas release from the sediment (Winter and others, 1988). Ground-water samples for analyses of VOCs also can be obtained from minipiezometers or hydraulic potentiomanometers.
3.2.2 On-Site Chlorinated Volatile Organic Compound Screening: The most efficient and informative type of reconnaissance effort is a dynamic one, in which the placement of sampling locations in the latter part of the effort is guided by results obtained in the earlier part. Because remobilization costs to a field site can be substantial, it could be cost-effective to have on-site analysis of chlorinated VOCs during the reconnaissance phase. On-site analytical services are readily available by a number of firms. On-site analyses will not comply with certified contract laboratory standards, so it may be necessary to send some duplicate samples to an appropriate certified laboratory. Aqueous sample detection limits in the low micrograms per liter range and compound-specific determinations are required for the chlorinated VOCs. The most common on-site analytical procedures will likely involve gas chromatography, with analytical times of approximately 15 to 30 minutes per sample. Another suitable on-site compound-specific analysis option for aqueous samples is direct-sampling ion-trap mass spectrometry (DSITMS), which does not require compound separation by gas chromatography (Wise and Guerin, 1997). DSITMS allows rapid sample analysis times (less than 5 minutes per sample) that can be advantageous when multiple field teams are collecting samples simultaneously. On-site analysis with DSITMS was used with considerable success in the reconnaissance phase of the natural attenuation assessment of a TCE plume at the McGuire AFB, NJ wetland site (Colliers Mills Wildlife Management Area).
3.2.3 Tree Core Survey: Tree core analysis can be used to delineate shallow groundwater contamination by chlorinated VOCs because these moderately hydrophobic compounds can readily enter trees during transpiration (Vroblesky and others, 1999). If trees are present along the edge or, especially within the wetland, they may be uptaking shallow ground water containing chlorinated VOCs. The sampling, extraction, and analysis of tree core samples is relatively easy, rapid, and inexpensive. Procedures for tree core sampling and analysis can be
23

found in Vroblesky and others (1999). Because different trees have different uptake rates and root depths that can alter the observed concentrations in the tree cores, it is important to use a single tree species of approximately the same size and to collect the core sample from the same height of each tree. A different extraction and analysis method from Vroblesky and others (1999) gave good results in the wetland study at McGuire AFB, NJ (Colliers Mills Wildlife Management Area) (fig. 10). In this method, the tree core is extracted in 10 mL (milliliters) of methanol for a minimum of 12 hours. A second core is taken and put into a vial for later determination of water content. A 1-mL aliquot of the methanol extract is then diluted in a 40mL VOC vial with water. The tree core extract can then be analyzed as if it were an aqueous sample (by purge-and-trap gas chromatography or other appropriate method), and can be done in an on-site or fixed laboratory. If water samples also are being analyzed in the field, this method may be easier to use than the gas analyses detailed by Vroblesky and others (1999). Obtaining tree cores and analyzing them for chlorinated VOCs can provide a rapid and costeffective means to assess chlorinated VOC distributions in shallow ground water. If trees are within the wetland, wide site coverage is possible. If trees are present only along the wetland edge, a tree core survey will only provide information on the shallow ground-water chlorinated VOC distribution along the wetland edge. If upward ground-water discharge is minimal at the wetland edge and the VOC plume is at some depth in the aquifer, a tree core survey along the wetland edge may give negative results. This was the case at the McGuire AFB, NJ wetland site—tree cores along the wetland edge did not have detectable VOCs, whereas those within the wetland where head gradients were upward did have detectable VOCs. Driving and developing piezometers is a more labor-intensive (thus more costly) activity than obtaining tree cores, and a tree core survey may assist in placement of piezometers. Thus, if a tree core survey is to be conducted at the site, it is useful to conduct it early in the reconnaissance phase. A second benefit of a tree core survey is that it provides information regarding the potential for phytoremediation at the site.
Figure 10. Tree core sampling procedure for analysis of chlorinated volatile organic compounds: (left) tree coring using standard forestry coring device, and (right) addition of core to vial containing methanol for extraction. USGS photos
24

3.2.4 Surface-Water Sampling: A good description of surface-water sampling methodologies is presented in Appendix A-5 of the Wiedemeier and others (1998) chlorinated solvent natural attenuation protocol. It is important to note that surface-water samples are best obtained as close to the sediment/water interface as possible since surface-water advection carries water downstream and volatilization will occur at the atmosphere/water interface. The easiest way to collect surface-water samples near the bottom sediment in shallow streams is to simply submerge the sampling container and uncap and fill it at depth. This submerged method can only be used, however, if non-preserved sample bottles are used. Peristaltic pumps could be used if needed. Surface-water samples can be very important because surface-water bodies, which can be viewed as receptor endpoints, are often the areas of greatest regulatory concern. During a reconnaissance activity, surface-water samples generally are easy to obtain because surface water in most wetland sites is relatively shallow.
Due to dilution and transport of ground water that is discharged into a surface-water body, it also is important to attempt to get sediment porewater samples prior to discharge. Two methods of obtaining sediment porewater samples in surface-water bodies are: 1) hand-installed drive-point minipiezometers; and 2) passive-diffusion samplers. The minipiezometers can be pushed easily to shallow depths (less than about 1.5 m) in soft sediments, and may be more convenient than passive-diffusion samplers if they purge and recharge rapidly enough for porewater samples to be obtained during the initial visit to the sample location. Passivediffusion samplers made of polyethylene bags filled with VOC-free deionized water (Vroblesky, 2001) can be buried in the shallow sediment for approximately 2 to 3 weeks, at which point chlorinated VOC concentrations inside the bag are essentially identical to those in the surrounding porewater. A potential disadvantage of using the passive-diffusion samplers for a reconnaissance activity is the time required to establish equilibrium.
3.2.5 Direct-Push Piezometers: The reconnaissance sampling activities in the preceding sections should help delineate the areal extent of the plume, narrowing the area where piezometers need to be installed. Piezometers are used to obtain water levels to determine ground-water-flow directions, and to better define the extent of the plume. The goals of reconnaissance-phase piezometer installation should include determining a major flowpath in the aquifer and wetland sediments near the core of the contaminant plume through the wetland area. Due to potentially slow recoveries in piezometers in wetland sediments, a longer period of time may be required for water-level measurements and sampling than in many aquifer sediments. A variety of direct-push piezometers are available commercially. Care should be taken to ensure sample integrity and prevent blockage of the intake screen or slots during installation. For shallow applications (depths of less than 1.5 m) in soft wetland sediment, narrow-diameter PVC minipiezometers with slotted drive-point tips can be used and installed by hand insertion. For deeper depths, narrow-diameter piezometers with stainless-steel drive-point tips with screens are available. With some drive-point piezometers (Solinst Canada Ltd., Ontario), Teflon tubing can be connected to the stainless-steel drive point at the top of the screened interval, helping to maintain sample integrity. Drive points with a stainless-steel sacrificial sleeve also are available to protect the screen from getting clogged during installation. After the drive point is driven to depth, it is pulled up about 2.5 cm (centimeters) to separate the stainless-steel protective sleeve from the body of the drive point, exposing the inlet screens to formation water.
Drive-point piezometers can be driven into the subsurface by a number of methods. Direct-push hydraulic units can be used to install them, although there may be site-access constraints (see Section 3.1.3). For reconnaissance activities, it may be most appropriate to use
25

more portable methods of drive-point installation. Slide bar hammers can be used in many site locations to install piezometers to depths of about 3 to 4 m. A slide-bar adaptor piece is attached to the casing to prevent damage to the casing so that additional casing lengths can be attached. A gasoline-powered percussion hammer (such as a Cobra hammer) also can be used to install drive-point piezometers (fig. 11). Using a Cobra percussion hammer, drive-point piezometers as deep as 9.8 m (mostly in sand) were installed at the McGuire AFB, NJ wetland site (Colliers Mills Wildlife Management Area). The maximum depth until refusal, however, was generally about 6 m.
Figure 11. Installation of narrow-diameter drive-point piezometer using percussion hammer. [Note the Teflon tubing inner sleeve extruding out of the hammer adapter. The Teflon tubing is connected by tubing barb to a stainless-steel drive-point tip with screens for ground-water inflow.] (Solinst Canada Ltd. photo)
26

3.2.6 Hypothetical Reconnaissance Example: Reconnaissance activities are highly dependent on site conditions, available site assessment information, and site data required to complete the initial screening process (fig. 6). Much thought is required in planning the site reconnaissance activities. The main goals of the reconnaissance activities are to complete the initial site screening process and to provide adequate data to develop a comprehensive plan to assess natural attenuation of the chlorinated solvent plume at the wetland site. Although no two sites are identical and approaches to reconnaissance will be distinctly site-dependent, it is useful to go through a hypothetical reconnaissance exercise for the purpose of illustrating some potential strategies.
The hypothetical site used for this exercise has a mixture of features of the West Branch Canal Creek wetland site, APG, MD and the Colliers Mills Wildlife Management Area wetland site near McGuire AFB, NJ. Mixing the features of the two sites allows for a wider range of reconnaissance tools to be utilized in the illustration. Although the pre-reconnaissance site data and the reconnaissance results presented here are hypothetical, real site features and some actual results are included in this example. A partial site map of the hypothetical site with TCE groundwater contamination is shown in figure 12. The type of information shown is typical of data collected during a traditional contaminated site assessment. Clusters (3 and 9 m deep) of conventional ground-water monitoring wells were installed only in areas readily accessible by a drill rig (such as the edge of the wetland, which is a dense wooded area with periodic standing water). The piezometric head data indicate that ground-water flow is towards the wetland. Soil boring logs provide evidence that the shallow aquifer consists of unconsolidated sand, and that an aquitard is present at approximately 14 m below ground surface. Historical information shows that a waste solvent disposal ditch is located approximately 500 m upgradient of the edge of the site map. As is typical with many TCE source areas, actual dense non-aqueous phase liquid (DNAPL) was not found, although ground-water TCE concentrations strongly indicate that DNAPL is present. Unless the source area is removed or contained, TCE will continue to dissolve, causing a steady-state ground-water plume to discharge to the wetland for an extended period of time. This pattern of available site data was observed in many of the sites considered for inclusion in the ESTCP wetland natural attenuation study.
Beyond the wooded area is a heavily vegetated marsh that often has shallow standing water. The surface wetland sediment in the marsh is very dark, with a high organic carbon content. Hydrogen sulfide odors are common in the marsh, especially when the substrate is disturbed, indicating reducing conditions conducive to microbial reductive dechlorination of the chlorinated solvents within the wetland. A creek mapped as a perennial stream runs through the marsh. The head of the creek is only about 300 m upgradient of the portion of the creek shown on the site map. The close proximity of the head of the creek and the constant flow in the creek provide indirect indications that shallow ground water normally discharges in the wooded and marsh wetland areas, although limited periods of ground-water recharge in the wetland might occur during periods of high rainfall.
The available ground-water monitoring data indicate that the TCE contaminant plume approaching the wetland is some distance beneath the water table (i.e., there is a layer of relatively uncontaminated ground water above the plume). This is a common phenomenon in contaminant plumes extending from DNAPL sources in upland areas, where recharge from the surface into the aquifer along the flowpath of the plume drives the plume to greater depths. Very low or undetectable concentrations of 12DCE and VC are measured, which indicate that little or no reductive dechlorination occurs while the plume is within the aquifer prior to reaching the
27

Creek
Surface-water
flowdirection
Known d isposal ditch approximately
500 meters upgradient
TCE
plume
DENSE WOODS (periodic standing water)
DENSE WOODS (periodic standing water)
VEGETATED MARSH (normally standing water)UPLAND
MW13 TCE 3m -15 ppb 9m -250 ppb
MW10 TCE 3m -10 ppb 9m -700 pp b
MW11 TCE 3m -2 ppb 9m -10 ppb
MW12 TCE 3m -8 ppb 9m -650 ppb
DENSE WOODS(periodic standing water)
DENSE WOODS(periodic standing water)
0 500 1,000 1,500 FEET
0 200 400 METERS
EXPLANATION GENERALIZED DIRECTION OF GROUND-WATER FLOW
MW13 TCE 3m-15 ppb 9m- 250 ppb
LOCATION OF MONITORING WELL AND SITE IDENTIFIER (Italicized numbers are screen depths, in meters, and trichloroethene concentrations, in parts per billion.)
Figure 12. Schematic of a hypothetical site with a trichloroethene ground-water contamination plume showing available site ground-water data closest to the wetland. [Chlorinated anaerobic trichloroethene degradation products (cis-1,2-dichloroethene or vinyl chloride) were either very low or not detected.]
wetland. Dissolved oxygen (DO) levels are greater than 2 ppm (parts per million), further indicating that favorable anaerobic conditions are not present within the aquifer for NA by reductive dechlorination.
The presence of a wooded wetland area allows the use of a tree core survey to provide a rapid and cost-effective indication of shallow ground-water TCE concentrations over a relatively broad area immediately downgradient of where the TCE plume is known to exist. The tree core survey is conducted early in the reconnaissance activity in an attempt to define the location where the TCE plume enters the marsh. The wooded area contains a mixture of hardwood and pine trees. Pines are chosen for the tree core survey due to their wide distribution and shallow
28

root systems, thus serving as potential indicators of relatively shallow TCE ground-water concentrations. The results of the tree core survey for TCE are shown in figure 13. On-site chlorinated VOC screening for the tree core samples is conducted to provide results within 1 day of sampling. Two parallel transects are made and trees are sampled about 200 m apart—one transect close to the upgradient edge of the wooded area and the other along the downgradient edge closest to the marsh. The placement of these transects was governed by the previously available site data indicating that the TCE plume is flowing towards the wetland in this area. The upgradient tree core transect showed mostly non-detectable concentrations, but low TCE concentrations are observed in trees downgradient of wells MW-12 and MW-13 (12DCE is not observed in the upgradient transect). The downgradient tree core transect shows substantially higher levels of TCE, particularly in the region downgradient of wells MW-12 and MW-13, while low or non-detectable TCE concentrations are observed at both ends of this transect. Low levels of 12DCE are observed in the tree core data from the downgradient transect. The tree core survey indicates that the core of the TCE ground-water plume continues downgradient of wells MW-12 and MW-13. The TCE plume appears to be rising vertically along the ground-water flowpath. This is likely due to both the ground-water “pumping” action of the trees and to an upward head gradient within the wooded and marsh portions of the wetland. The 12DCE observed in the downgradient tree transect indicates that some reductive dechlorination may be occurring in the shallow subsurface at that point.
The next phase of the reconnaissance effort is to collect and analyze creek surface-water samples and shallow creek sediment porewater samples for on-site VOC screening. Samples were collected along the creek at locations about 200 m apart. Sediment porewater samples were collected from a depth of 1 m below land surface using minipiezometers. At each location, surface water and porewater samples were collected at the same time. The TCE and VC results of the surface water and porewater samples are shown in figures 14 and 15, respectively. The results of the surface-water sampling indicate that low levels of TCE are entering the creek. Concentrations were below the 5 ppb (parts per billion) TCE maximum contaminant level (MCL) for drinking water, although concentrations may vary with changing hydrogeologic and rainfall conditions. The sediment porewater TCE results indicate that the TCE ground-water plume continues along the presumed ground-water flowpath from wells MW-12 and MW-13, through the area where the tree core TCE results were highest, and then directly towards the creek. TCE concentrations in the sediment porewater were significantly lower than those observed in MW-12 and MW-13, indicating that natural attenuation is reducing the TCE concentrations within the plume as it enters the wetland sediment. Although not shown, concentrations of 12DCE in the sediment porewater are generally within a factor of 3 of the TCE concentrations, indicating that reductive dechlorination is occurring. On-site analyses of sediment porewater samples for DO, ferrous iron, and sulfide indicated reducing conditions. Low concentrations of VC are observed in the porewater samples with the highest TCE concentrations, indicating that reductive dechlorination of TCE is continuing past 12DCE to VC. VC also may be degrading, by either anaerobic reductive dechlorination to ethene or by anaerobic oxidation to carbon dioxide. The fate of VC will require additional investigation after the reconnaissance phase.
The downgradient tree transect and creek porewater results indicate that the TCE plume has risen vertically upward as it has moved downgradient. The final part of this reconnaissance is to gain additional confirmation that the TCE plume has risen vertically as it goes through the wetland system and to confirm the main axis of the plume. Drive-point piezometers are installed
29

CreekSurface-water
flowdirection
Known d isposal ditch approximately
500 meters upgradient
TCE
plume
ndnd
nd nd
nd nd
20
75
nd
10 nd
70 nd
22010
30015027
350
30 200
25 180
10
DENSE WOODS (periodic standing water)
VEGETATED MARSH (normally standing water)UPLAND
MW13 TCE 3m -15 ppb 9m -250 ppb
MW10 TCE 3m -10 ppb 9m -700 pp b
MW11 TCE 3m -2 ppb 9m -10 ppb
MW12 TCE 3m -8 ppb 9m -650 ppb
DENSE WOODS(periodic standing water)
0 500 1,000 1,500 FEET
0 200 400 METERS
EXPLANATION GENERALIZED DIRECTION OF GROUND-WATER FLOW
MW13 LOCATION OF MONITORING WELL AND SITE IDENTIFIER TCE (Italicized numbers are screen depths, in meters, and 3m-15 ppb trichloroethene concentrations, in parts per billion.)9m- 250 ppb
25 LOCATION OF TREE CORE SAMPLING SITES (Italicized number is concentration of trichloroethene, in micrograms per kilogram; "nd" indicates not detectable.)
Figure 13. Schematic of a hypothetical site with a trichloroethene ground-water contamination plume showing tree core survey results of first phase of chlorinated solvent natural attenuation reconnaissance activity. [Tree cores were taken at about 1.2 meters above ground surface from pine trees of approximately the same size.]
30

CreekSurface-water
flowdirection
Known d isposal ditch approximately
500 meters upgradient
TCE
plume
SW 1m - TCE
(nd)
(10 ppb) SW 1m - TCE
(3 ppb)
(40 ppb) SW 1m - TCE
(5 ppb)
(60 ppb) SW 1m - TCE
(4 ppb)
(50 ppb) SW 1m - TCE
(nd)
(10 ppb)
SW 1m - TCE
(nd)
(5 ppb) SW 1m - TCE
(nd)
(nd) SW 1m - TCE
(nd)
(nd)
SW 1m - TCE
(nd)
(nd)
ndnd
nd nd
nd nd
20
75
nd
10 nd
70 nd
22010
30015027
350
30 200
25 180
10
DENSE WOODS (periodic standing water)
VEGETATED MARSH (normally standing water)
UPLAND
MW1 3 TCE 3m -15 ppb 9m -250 ppb
MW10 TCE 3m -10 ppb 9m -700 pp b
MW11 TCE 3m -2 ppb 9m -10 ppb
MW12 TCE 3m -8 ppb 9m -650 ppb
DENSE WOODS(periodic standing water)
MW13 TCE 3m-15 ppb 9m- 250 ppb
25
SW (nd) 1m - TCE (10 pp b)
0 500 1,000 1,500 FEET
0 200 400 METERS
EXPLANATION GENERALIZED DIRECTION OF GROUND-WATER FLOW
LOCATION OF MONITORING WELL AND SITE IDENTIFIER (Italicized numbers are screen dept hs, in meters, and trichloroethene concentrations, in parts per billion.)
LOCATION OF TREE CORE SAMPLING SITES (Italicized number is concentration of trichloroethene, in micrograms per kilogram; "nd" indicates not detectable.)
LOCATION OF SURFACE WATER SAMPLING SITES AND STREAMBED MINIPIEZOMETERS (Italicized numbers are concentrations of trichloroethene in surface water and ground water, respectively, in parts per billion; "nd" indicates not detectable.)
Figure 14. Schematic of a hypothetical site with a trichloroethene ground-water contamination plume showing trichloroethene concentrations in surface water and sediment porewater (1meter depth using minipiezometers) from second phase of chlorinated solvent natural attenuation reconnaissance activity.
31

Creek Surface-water
flowdirection
Known d isposal ditch approximately
500 meters upgradient
TCE
plume
SW 1m - VC
(nd)
( )nd
SW 1m - VC
(nd)
(3 ppb) SW 1m -
(nd)
(5 ppb) VC SW
1m -(nd)
(5 ppb) VC
SW 1m -
(nd)
( ) VC
nd
SW 1m -
(nd)
( ) VC
nd SW 1m -
(nd)
(nd) VC
SW 1m -
(nd)
(nd) VC
SW 1m -
(nd)
(nd) VC
ndnd
nd nd
nd nd
20
75
nd
10 nd
70 nd
22010
30015027
350
30 200
25 180
10
DENSE WOODS (periodic standing water)
VEGETATED MARSH (normally standing water)
UPLAND
MW1 3 TCE 3m -15 ppb 9m -250 ppb
MW10 TCE 3m -10 ppb 9m -700 pp b
MW11 TCE 3m -2 ppb 9m -10 ppb
MW12 TCE 3m -8 ppb 9m -650 ppb
DENSE WOODS(periodic standing water)
MW13 TCE 3m-15 ppb 9m- 250 ppb
25
SW (nd) 1m - VC (5 pp b)
0 500 1,000 1,500 FEET
0 200 400 METERS
EXPLANATION GENERALIZED DIRECTION OF GROUND-WATER FLOW
LOCATION OF MONITORING WELL AND SITE IDENTIFIER (Italicized numbers are screen dept hs, in meters, and trichloroethene concentrations, in parts per billion.)
LOCATION OF TREE CORE SAMPLING SITES (Italicized number is concentration of trichloroethene, in micrograms per kilogram; "nd" indicates not detectable.)
LOCATION OF SURFACE WATER SAMPLING SITES AND STREAMBED MINIPIEZOMETERS (Italicized numbers are concentrations of vinyl chloride in surface water and ground water, respectively, in parts per billion; "nd" indicates not detectable.)
Figure 15. Schematic of a hypothetical site with a trichloroethene ground-water contamination plume showing vinyl chloride concentrations in surface water and sediment porewater (1-meter depth using minipiezometers) from second phase of chlorinated solvent natural attenuation reconnaissance activity.
32

manually along a transect in the marsh near the downgradient tree core transect. Sample locations are carefully selected based on results from the tree core survey, and on results from surface-water and sediment-porewater sampling in the creek. Six piezometers are installed in the aquifer to a sampling depth of 3.6 m below land surface. Piezometer locations and ground-water TCE concentrations are shown in figure 16. Low 12DCE concentrations and no VC concentrations are observed in the ground water at these piezometers, indicating that little natural attenuation by anaerobic reductive dechlorination in the aquifer is occurring. DO levels above 2 ppm in all of the piezometers indicate that aerobic conditions exist. The TCE concentrations confirm the presumed flowpath of the plume. In addition, TCE concentrations in the 3.6-m-deep wetland piezometers are similar to those observed in the 9-m-deep MW-12 and MW-13 wells, indicating upward movement of the plume in the wetland area. The similar TCE concentrations at these upgradient and downgradient locations further indicate that little natural attenuation is occurring in the aquifer.
The net result of this hypothetical reconnaissance is the ability to confirm that this is a ground-water discharge wetland and that significant natural attenuation processes appear to be occurring within the wetland and creek-bottom sediments. These results provide the basis for planning further investigations of the natural attenuation processes occurring at this site. The hypothetical reconnaissance activities described could likely be conducted in 1 week with a field team of four individuals (field analysis chemist, field team chief, and two field technicians). Note that additional time would be required for mobilization, demobilization, and report preparation.
3.3 Multilevel Transects: To evaluate the natural attenuation of chlorinated solvents discharging into wetland environments, the biogeochemistry of the ground-water plume as it moves through the wetland needs to be defined. This subsurface biogeochemical information must be obtained both vertically and horizontally, requiring multilevel transects of ground-water sampling devices. Installation of traditional ground-water monitoring wells that require large drill rigs is not feasible in most wetland environments due to the wet conditions and the fragile nature of wetlands. Mobile and less-intrusive installation methods are required. At most sites, the use of only one ground-water sampling methodology will generally not suffice, since two types of subsurface environments must be sampled: 1) the deeper aquifer beneath the wetland; and 2) the shallower, organic-rich wetland sediments. Much of the most valuable biogeochemical information indicative of natural attenuation is gained from the shallower organic-rich wetland sediments that cannot easily be sampled using traditional piezometers. The organic-rich layer of wetland sediments is often less than 2 m thick; diffusion can be a significant upward transport mechanism of solutes, and steep vertical changes in concentrations can occur. To characterize the biogeochemical reactions in these environments, porewater samples need to be obtained at closely spaced vertical intervals. Wells and piezometers with 5-cm diameters and screen lengths of 30 cm or more that are used in traditional ground-water investigations may be unsuitable for characterization of wetland sediments.
A number of new ground-water sampling methodologies appropriate for wetland systems are available. The following section describes four methodologies examined in the ESTCP chlorinated solvent wetland study: 1) direct-push piezometers that have narrow diameters and short screen lengths; 2) a multilevel monitoring system; 3) tubing samplers; and 4) peepers (a type of passive-diffusion sampler). Advantages and disadvantages of each of these methodologies are summarized in table 1. Results of the comparison of the four sampling
33

methodologies that was conducted as part of the ESTCP chlorinated solvent wetland study are summarized in Section 3.3.5.
Creek Surface-water
flowdirection
Known d isposal ditch approximately
500 meters upgradient
TCE
plume
360
150
nd
380
550
160
ndnd
nd nd
nd nd
20
75
nd
10 nd
70 nd
22010
30015027
350
30 200
25 180
10
DENSE WOODS (periodic standing water)
VEGETATED MARSH (normally standing water)
UPLAND
MW1 3 TCE 3m -15 ppb 9m -250 ppb
MW10 TCE 3m -10 ppb 9m -700 pp b
MW11 TCE 3m -2 ppb 9m -10 ppb
MW12 TCE 3m -8 ppb 9m -650 ppb
DENSE WOODS(periodic standing water)
SW 1m - TCE
(nd)
(10 ppb) SW 1m - TCE
(3 ppb)
(40 ppb) SW 1m - TCE
(5 ppb)
(60 ppb) SW 1m - TCE
(4 ppb)
(50 ppb) SW 1m - TCE
(nd)
(10 ppb)
SW 1m - TCE
(nd)
(5 ppb) SW 1m - TCE
(nd)
(nd) SW 1m - TCE
(nd)
(nd)
SW 1m - TCE
(nd)
(nd)
0 500 1,000 1,500 FEET
0 200 400 METERS
EXPLANATION GENERALIZED DIRECTION OF GROUND-WATER FLOW
MW13 LOCATION OF MONITORING WELL AND SITE IDENTIFIER TCE (Italicized numbers are screen dept hs, in meters, and 3m-15 ppb trichloroethene concentrations, in parts per billion.)9m- 250 ppb
25 LOCATION OF TREE CORE SAMPLING SITES (Italicized number is concentration of trichloroethene, in micrograms per kilogram; "nd" indicates not detectable.)
SW (nd) LOCATION OF SURFACE WATER SAMPLING SITES AND1m - TCE (10 ppb) STREAMBED MINIPIEZOMETERS (Italicized numbers are
concentrations of trichloroethene in surface water and ground water, respectively, in parts per billion; "nd" indicates not detectable.)
360 LOCATION OF DRIVE-POINT PIEZOMETERS SCREENED AT 3.6 METERS DEPTH (Italicized number is concentration of trichloroethene in ground water, in parts per billion; "nd" indicates not detectable.)
Figure 16. Schematic of a hypothetical site with a trichloroethene ground-water contamination plume showing concentrations of trichloroethene in ground water (3.6-meter depth using drivepoint piezometers) from third phase of chlorinated solvent natural attenuation reconnaissance activity.
34

Table 1. Comparison of Sampling Devices [Fe, iron; VOC, volatile organic compound; cm, centimeter; >, greater than]
Sampling Device Advantages Disadvantages
Drive-Point Piezometer
- Shallow/moderate depth multilevel sampling - Fe results generally similar to peepers - Generally good comparisons to other devices at >100 cm depths - Able to obtain hydraulic parameters - Moderate expense/maintenance - Moderate ease of installation
- VOC concentrations generally lower than peepers - VOCs and redox species subject to aeration if poor water-level recovery - May draw water from other areas during sampling - Can create channeling if well diameter too large or too close - May reflect local spatial heterogeneities because of nest - Slow recovery after purging in wetland sediments
Tube Sampler
- Shallow depth multilevel sampling - Total VOC results similar to peepers - Fe good at depth compared to other devices - Assesses potential impact from macropore flow - Low expense/maintenance - Ease of installation (no drilling)
- Interception of macropore flow may obscure biodegradation reactions occurring in rest of wetland sediments - Difficult to sample because of low well volume - Unable to obtain hydraulic parameters - May reflect local spatial heterogeneities because of nest - Can easily move up or down unless well-anchored at land surface - Slow recovery after purging
Peeper
- Shallow depth multilevel sampling - Gives the best vertical resolution of porewater chemistry - Best indicator of porewater chemistry (highest overall VOC and redox-sensitive concentrations) - Least affected by spatial heterogeneities because of diffusion - Less chance of aeration during sample removal and no recovery time problems - Large number of porewater samples collected simultaneously - Ease of use (no drilling) and inexpensive to install, mobile, reusable
- Small sample volume; unable to repeat sampling without reinstalling - Labor intensive/time-consuming for preparation - Unable to obtain hydraulic parameters - Difficult to insert/remove in semi-dry or tight sediments, or where tough roots are present - Porous membrane expensive but overall are least expensive in terms of material and installation - Repeated installation and removal at same site disturbs sediment
- Shallow/moderate depth multilevel sampling - Methane results similar to, or greater than, peepers - Discrete vertical increments without effects from
- VOC results lower than other devices at shallow depths (less than 60 cm) - Bentonite and chamber sealants may affect results
Multilevel Sampler
lateral spatial heterogeneities as may be observed in clustered samplers - Possibly able to obtain hydraulic parameters - Fast recovery after purging - Ease of sampling—seven depths in one borehole
- Possible problems with inadequate seals between bentonite packs - Possible cross-contamination by diffusion through polyethylene - Water-level measurements may be inaccurate - Drilling equipment required (difficult logistics in wetlands) - High initial cost
35

3.3.1 Direct-Push Piezometers: For most wetland sampling locations deeper than 1 m, direct-push piezometers may be appropriate. Hardware and supplies for direct-push piezometers are available from a number of vendors. Piezometers with maximum diameters of 1.9 cm and maximum screen lengths of 15 cm are most appropriate for characterization of wetland porewater chemistry and hydrology. Larger piezometers may take too long to recover after purging, may respond too slowly to changing hydrologic conditions (such as tidal changes in head), and sample water from too many biogeochemical zones to allow an understanding of degradation processes. The Solinst Canada Ltd. Model 615S shielded drive-point piezometers (fig. 17) were used for the ESTCP wetland chlorinated solvent natural attenuation study. The shielded drive point is driven to depth and then pulled back about 15 cm to detach the drive-point tip from the screened sample ports (the detachable drive-point tip is attached to the rest of the drive point with a rubber o-ring). This helps to prevent clogging of the sample ports with silt or clay during installation. At one of the ESTCP sites, difficulties were encountered in detaching the drive point and were solved by simply omitting the o-ring. The drive-point components (detachable tip and unit with sample ports) are made of stainless steel. The drive point is attached to 1.27-cm outer-diameter Teflon tubing by a tubing barb, so that sampled ground water contacts only the stainless steel and Teflon. The Teflon tubing fits within 1.90-cm diameter steel pipe. Pipe segments are connected with threaded couplers, with heavy-duty couplers (thicker couplers with steel extending beyond the threads for extra support) recommended for greater depths. Drive-point piezometers can be driven into the subsurface using a number of different methods. Some installation methods that use portable hammers or small drilling equipment appropriate for wetland environments were discussed in earlier sections on soil/sediment boring and reconnaissance methods, including vibratory rigs (fig. 8), GeoProbe rigs (fig. 9), and gasoline-powered percussion hammers (fig. 11).
3.3.2 Multilevel Monitoring Systems: Multilevel monitoring systems (MLMS) that typically consist of multiple screened intervals separated by packers are available from several vendors to obtain vertically spaced sampling intervals in a single borehole. In addition, bundletype MLMS commonly have been constructed by individuals using tubing of various lengths covered at the tips with mesh screens and secured into a bundle that will fit into one borehole (Cherry and others, 1983). Similarly, multi-port samplers that have individual tubes inside an outer casing have been constructed (Delin and Landon, 1996). Bentonite packers above the screens help limit cross-flow between the screened intervals of multilevel or multi-port samplers. Installation of MLMS generally involves placing them in a cased borehole and then removing the outer casing, and relying on collapse of the sediments around the borehole to secure the MLMS and provide a complete seal around the screened intervals. Although this method can work well in unconsolidated sands, clayey wetland sediments might not collapse as easily as sands, potentially leaving channels around the MLMS that connect the screened intervals. Incomplete collapse of wetland sediments was observed at the APG site when hand-made bundle-type piezometers were used in a ground-water tracer test in 1998. For the ESTCP wetland study, a MLMS that is complete within one single length of tubing was tested. The MLMS from Precision Sampling, Inc. (Richmond, California) was used in a sampling method comparison study as part of the ESTCP wetland demonstration. The basis of the Precision Sampling MLMS is a seven-chamber polyethylene tubing unit (known as Continuous Multi-Channel Tubing) that is used to make seven discrete sampling levels within a single borehole (figs. 18 and 19). The seven chambers are arranged in a wagon-wheel fashion
36

l
i
i ll of l wi le
ing
l
Pi
i inl
i lon i
nch NPT stee
Barbed tub ng connector
nner wad to sea th samp
Screen support spr
ess stee screen
ezometer
es w th sta ess screens
Shield
nch x 1/2- nch Tefe tub ng
5/8-i sampl
3/4-i drive pipe
O-ring on shielport unit
Stainl
Inlet holsteel
Figure 17. Schematic of a Solinst Canada Ltd. Model 615S shielded drive-point piezometer.
37

38
71 2
3456
7-chamber high-densitypolyethylene tubing
Multichamberpolyethylene
tubing
Bentonite pellets withinexpansive polye hylene nettingt
Sand Pack
Centralizer
Hydration and expansion of bentonite packer
ZONE 1 INTAKE
ZONE 2 INTAKE
ZONE 3 INTAKE
ZONE 4 INTAKE
ZONE 5 INTAKE
ZONE 6 INTAKE
ZONE 7 INTAKE
Borehole
1/4-inch bentonite pelletswithin polyethylene netting
Stainless steel clamp
7/16-inch holes drilledinto chamber no. 4
Polypropylene sock
Stainless steel screen
Polyethylene sealantinjected below intake-forming plug
Sand
Vent hole
Sealant plug in all butcentral chamber (Zone 7)
Stainless steel screen cap (Zone 7 only)
Land Landsurface surface
BEFORE HYDRATIONOF BENTONITE PACKERS
AFTER HYDRATIONOF BENTONITE PACKERS
Figure 18. Schematic of the Multilevel Monitoring System (Precision Sampling, Inc.) and emplacement within borehole.

Figure 19. Preparation and installation of Multilevel Monitoring System (MLMS) at wetland study site: (clockwise from upper left) coiled 7-chamber polyethylene tubing, preparation of MLMS with sand packers and bentonite packers, drilling of borehole with vibratory rig, and insertion of MLMS down borehole casing. Precision Sampling, Inc. photos
with the “spokes” defining six pie-shaped chambers spaced around a single round chamber in the “hub.” The center chamber can only be accessed through the bottom without going through one of the side chambers, so the center chamber is used for the deepest sampling location. The MLMS can be prepared on-site after screen locations are determined. At the bottom of the tubing, the six outer chambers are sealed off using silicone sealant and hot glue. A stainless-steel screen is placed around the bottom and secured in place with stainless-steel wire. For each of the six outer chambers, several sample ports are drilled into the individual channel to create a sampling interval at the desired depth (7.6-cm-long sampling intervals were used in the ESTCP study). Sealant is injected in another hole to create the bottom of the sampling chamber for each sampling level. Stainless-steel mesh and sand packers are secured around each sampling interval with wire. Bentonite packers are placed between each of the sampling intervals and their associated sand packers. As soon as the MLMS is placed to the bottom of the borehole, the outer
39

casing has to be withdrawn rapidly while manually holding the MLMS in position. If the bentonite packers are made too thick and/or the casing is not withdrawn rapidly enough, swelling of the bentonite may cause the MLMS to come out with the casing, making it necessary to reconstruct and re-install the MLMS.
3.3.3 Tubing Samplers: A simple method for obtaining closely spaced (centimeter-scale) vertical samples needed for multilevel transects in wetland sediments is to use tubing samplers. The tubing samplers that were evaluated as part of the ESTCP chlorinated solvent wetland study are similar to a minipiezometer, except for the inverted screen that is placed pointing upward from the bottom of the tube (fig. 20). These tubing samplers were originally constructed for use in a ground-water-flow tracer test in the wetland sediments at the APG site, which required piezometers that did not have protruding screens that might cause channeling of flow along the outside of the piezometer casing (a problem that was observed with bundle-type multilevel piezometers in these wetland sediments). The tube samplers are constructed of thick-walled 0.64-cm-diameter stainless-steel tubing. The narrow diameter tubing allows several of these samplers to be placed close together on a horizontal spatial scale, minimizing disturbance of vegetation and minimizing possible spatial heterogeneities across a nest of tube samplers. A conical 7.6-cm-long, 100-mesh stainless-steel screen is inserted tightly into one end of the tube, forming an inverted screen that gives an extremely small discrete sampling interval. To prevent clogging of the screen, organic-free deionized water was forced into the tube while it was being manually inserted into the sediment. The tubes are emplaced through holes drilled into two small, untreated plywood platforms, mounted one atop the other, which prevent leaning or horizontal movement once in place, and ensure that the thin tubes are installed vertically from the surface. The platforms can be anchored to nearby secure pipes.
Figure 20. Photographs of tubing and screen components of tubing sampler (left) and the tubing sampler array at wetland field site (right). USGS photos
40

3.3.4 Peepers: Peepers are a type of passive-diffusion sampler that were originally designed for obtaining closely spaced (millimeter-scale) vertical samples in fine-grained bottom sediments in lakes without disturbing natural flow (Hesslein, 1976). Diffusion samplers are useful for obtaining samples in sediments where flow velocities are low (about a meter per year or less), and diffusion is a major transport mechanism. Peepers commonly have been used for sampling redox-sensitive constituents and trace metals; the APG wetland study at West Branch Canal Creek first demonstrated the use of peepers for sampling of volatile organic contaminants (Lorah and others, 1997; Lorah and Olsen, 1999a, b). A schematic of a typical peeper design is shown in figure 21.
Peepers typically are constructed of acrylic or polycarbonate, and sampling cells are covered with a permeable membrane. For the ESTCP wetland demonstration and previous work at the APG site, a polysulfone film (HT Tuffryn, Pell Corporation, Ann Arbor, Michigan) with a thickness of 0.2 μm (micrometer) was used for the permeable membrane. A local plastics manufacturing company machined the peeper components according to specifications for this project. The bodies of the peepers are constructed from a solid 2.5-cm-thick acrylic plate. Oval chambers are cut completely through the plate to form sample chambers at the desired spacing; for the previous ESTCP study at APG, chambers were spaced 3.0 cm apart for a 60-cm-long peeper and 5.5 cm apart for a 120-cm-long peeper (a total of 21 to 22 rows of sample chambers in each peeper). Two thin acrylic sheets, known as “membrane support plates,” are machined in a similar fashion and attached with nylon screws to either side of the thick plate. The membrane support plates hold the permeable membrane (cut to cover the length of the peeper in one piece) over the sampling chambers. A handle is machined into the top of the plate, and the bottom is tapered into a sharp blade for ease of insertion into sediments.
To prepare the peeper for use, a membrane sheet is installed between the support plate on one side of the peeper held tightly in place using nylon screws. The sample chambers are then filled with VOC-free, deionized water, overfilling to remove any trapped air bubbles, before the second membrane sheet is laid on top and the other support plate fastened. Because anaerobic subsurface conditions likely exist in organic-rich wetland sediment, it is important not to introduce oxygen into the sediment from the peeper. Oxygen is removed from the deionized water in the peeper chambers and from the pores of the plastic by placing the peeper in a sparging container filled with deionized water, through which nitrogen gas is bubbled for at least 12 hours. A large-diameter PVC pipe can be made into a sparging container for this process by sealing a cap onto the bottom of the pipe and making fittings in a top cap to extend a length of flexible tubing from the N2 gas tank to the bottom of the water-filled PVC pipe.
The peeper should be inserted in the sediment immediately after removal from the sparging container. The peepers can be pushed manually or pounded gently into the sediment (hard pounding can cause deionized water to be lost from the sample chambers and could crack the plastic). Peepers are generally left in the sediment for about 2 weeks to equilibrate before removing them to sample. Webster and others (1998) discuss equilibration dynamics for peepers and the effect of peeper dimensions and solute diffusivities on equilibration times. Sometimes the peeper can be removed simply by grabbing the handle by hand and pulling out of the sediment, although a lever device may be needed to assist in removing the peeper (for example, figure 22). Once extracted, one side of the membrane for each sample chamber is pierced one at a time, and sample is removed using syringes with short pieces of soft flexible tubing attached to the tip. Tests performed at the APG wetland site indicated that one peeper can be sampled for VOCs, ferrous iron, sulfide, and methane in about 1 hour, and that sample integrity was
41

HANDLE
SAMPLE CHAMBERS AT VARIOUS DEPT H INTERVALS
SCREWS TO SECUR E MEMBRANE AND SIDE PANELS
61 C
EN
TIM
ETE
RS
MAIN BODY (1.52 CENTIMETERS THICK)
SIDE PANELS (0.30 CENTIMETERS THICK)
PERMEABLE MEMBRAN E SHEETS
FRONT VIEW SIDE VIEW OF MAIN BODY
Figure 21. Schematic showing a type of passive-diffusion sampler that is commonly known as a peeper.
42

USGS photos
Figure 22. Field recovery and sampling of peepers. (Upper left) Removing peeper from wetland sediment using simple wooden lever system. (Upper right) Withdrawing aqueous samples from peeper chambers for analysis of various parameters to assess natural attenuation of chlorinated solvents discharging into Aberdeen Proving Ground, MD wetland field site. (Lower two photos): Recovering peeper from streambed using a ladder and winch at Norman, Oklahoma wetland site. (The Norman, Oklahoma site is a research site for the U.S. Geological Survey Toxic Substances Hydrology Program.)
43

maintained during this period. The sediment that typically coats the peeper membrane (fig. 22, upper right) probably assists in slowing oxygen diffusion into the membrane or volatilization of constituents out of the chambers during this period. An anaerobic glove bag can be used if longer sampling times are needed; inexpensive, disposable glove bags are suitable for field sampling.
3.3.5 Comparison of Multilevel Transect Sampling Devices: During the ESTCP wetland study, additional sampling devices were added to six sites where clusters of drive-point piezometers already existed—MLMSs (Precision Sampling, Inc.), tubing samplers, and peepers. All the devices at each site were sampled for VOCs, ferrous iron, sulfide, and methane. The different screen sizes of the sampling devices probably account in part for the differences observed in concentrations between the sampling devices. The drive-point piezometers had the longest screened interval (15.2 cm) and thus were most likely to obtain water from a mixture of zones during sampling. The tubing samplers and peepers had the most discrete sampling intervals. Because peepers provided the most closely spaced sampling points, they gave the greatest vertical resolution of changes in biogeochemical constituents in the wetland porewater, providing the best indication of redox conditions and degradation reactions in the wetland sediment (fig. 23). Higher concentrations of ferrous iron, sulfide, and methane were generally found in the peeper samples than in samples at comparable depths collected from the other sampling devices. In addition to higher concentrations of the redox-sensitive species, the peepers sometimes showed higher concentrations of daughter VOCs and total VOCs compared to the other devices. These results may be attributed in part to the lower chance of sample aeration and volatilization in the peepers because samples are passively collected, and in part to the peepers measuring constituents transported through the wetland sediments by diffusion where greater biodegradation can occur. Diffusion may be the primary transport mechanism in wetland sediments that have a low permeability. At both the APG and McGuire AFB wetland sites studied during the ESTCP demonstration, peepers were crucial in determining biodegradation efficiency and evaluating seasonal changes in biodegradation in the shallow wetland sediments (Dyer and others, 2002; Lorah and others, 2002).
At depths greater than about 100 cm, concentrations of VOCs and redox-sensitive constituents measured with the MLS, tubing, and piezometers were more consistent than at shallower depths. Drive-point piezometers may be needed to reach deeper depths and to obtain water-level measurements, but chemical data for volatile and redox-sensitive constituents obtained from piezometers in shallow anaerobic wetland sediments (less than 100 cm) should be interpreted with caution.
Of the four sampling devices used, water levels could be measured only in the drive-point piezometers and MLMSs. Water levels were generally lower in the MLMSs compared to the piezometers at the same depth. The small diameter of the sample chambers in the MLMSs could be one cause of the inaccurate water-level measurements. Another possible explanation for the discrepancies is the difference in screened lengths between the MLSs and piezometers, and the use of a sand pack around the MLS screens.
Other logistical considerations for the four sampling devices also are summarized in table 1. For example, the MLMS wells were the most productive of the four devices. The channels were of adequate diameter to hold sufficient ground water for sampling, and because sand packs surround each of the sampling ports, relatively fast recovery occurred during purging. In contrast, the tube samplers delivered the lowest volumes of sample water. Given their small well diameters, it was often difficult to extract the necessary volumes for analysis of all constituents,
44

(a) Methane, WB36 Wells, June 2000 (b) Fe(II), WB36 Wells, June 2000 (c) Sulfide, WB36 Wells, June 2000 0 0 0
20 20 20
40 40 40
60 60 60
80 80 80
100 100 100
120 120 120
0 100 200 300 400 500 600 700 800 0 100 200 300 400 500 600 700 800 0 10 20 30 40 50 60 70 80
CONCENTRATION, CONCENTRATION, CONCENTRATION,IN M ICROMOLES PER LIT ER IN M ICROMOLES PER LIT ER IN M ICROMOLES PER LIT ER
(d) Sum Parents, WB36 Wells, June 2000 (e) Sum Daughters, WB36 Wells, June 2000 (f) Total VOCs, WB36 Wells, June 2000 0 0 0
20 20 20
40 40 40
60 60 60
80 80 80
100 100 100
120 120 120
0. 0 0. 5 1. 0 1.5 2. 0 2. 5 3. 0 0. 0 0. 5 1. 0 1. 5 2. 0 2.5 3. 0 0. 0 0. 5 1. 0 1.5 2. 0 2. 5 3. 0
CONCENTRATION, CONCENTRATION, CONCENTRATION,IN M ICROMOLES PER LIT ER IN M ICROMOLES PER LIT ER IN M ICROMOLES PER LIT ER
EXPLANATION LONG PEEPER SH ORT PEEPER PIEZOMETER TUBE SAMPLER MULTI-LEVEL SAMPLER
Figure 23. Concentrations of redox-sensitive constituents and of parent, daughter, and total volatile organic compounds in samples collected from peepers compared to samples collected from other sampling devices installed at site WB36 at the West Branch Canal Creek wetland site, Aberdeen Proving Ground, MD June 2000. Upper row: (a) methane, (b) ferrous iron (Fe(II), (c) sulfide, Lower row: (a) sum of parent volatile organic compounds (sum parents), (b) sum of daughter volatile organic compounds (sum daughters), and (c) total volatile organic compounds (total VOCs).
DE
PT
H,
IN C
EN
TIM
ET
ER
S B
EL
OW
LA
ND
SU
RF
AC
E
DE
PT
H,
IN C
EN
TIM
ET
ER
S B
EL
OW
LA
ND
SU
RF
AC
E
45

particularly in the shallower wells. Some tube samplers did not recharge after purging in a timely manner to obtain all of the desired samples. The tube samplers had the advantage of being the least expensive and least complicated of the devices to construct and install. The peeper’s mobility is a distinct advantage compared to the other devices; however, repeated installation and removal at a particular site may disturb the sediments.
3.4 Characterization of Hydrogeology: Wetland hydrology is complex and poorly understood compared to the hydrology of deeper flow systems. Complicating factors include the high degree of heterogeneity in lithology common in wetland sediments, the complex hydraulic properties of organic-rich soils, and the greater temporal variations (from seasonal recharge changes, tidal effects, evapotranspiration effects, and storm-related effects) in wetlands compared to deeper flow systems (Hunt and others, 1996). Some considerations for characterizing the hydrogeology of wetland sites are discussed here.
Darcy’s law commonly is used to calculate ground-water-flow rates, using measured hydraulic heads and estimates of hydraulic conductivity. In wetlands, it is critical to obtain both horizontal and vertical head gradients to calculate horizontal and vertical flow rates. Vertical flow may be dominant in much of the wetland. However, calculating vertical flow has a greater uncertainty than calculating horizontal flow, largely because of the greater difficulty in determining vertical hydraulic conductivity (Hunt and others, 1996). Vertical hydraulic conductivity commonly is estimated from the horizontal hydraulic conductivity, because accurate methods of independently determining this term are lacking. The vertical component of hydraulic conductivity can be calculated using the equation (Lee and Fetter, 1994, p. 127-128):
bK = z b K
i i
where
Kz is the mean vertical hydraulic conductivity (LT-1); b is the total length of the flow line (L); bi is the length of the ith increment (L); and Ki is the horizontal hydraulic conductivity of the ith increment (LT-1).
Horizontal hydraulic conductivities traditionally are measured using pump tests, slug tests, or sieve analysis of sediments (Lorah and others, 1997; Wiedemeier and others, 1996). Hydraulic conductivities also can be estimated from the response of water levels in piezometers to cyclic fluctuations from tides or evapotranspiration (Lorah and others, 1997). Pump tests are not appropriate for wetland environments because the large hydraulic stresses associated with prolonged pumping can change pore diameters in organic-rich sediments and cause conductivities to vary over time. A similar problem can occur with slug tests in wetland sediments. Hunt and others (1996) compared flow rates measured in wetland sediments at three sites using three independent methods—Darcy’s law calculations with horizontal hydraulic conductivity estimated from slug tests, stable isotope mass balance techniques, and temperature profile modeling. The Darcy’s law calculations gave lower estimates of flow rates than the other two methods. The results of the stable isotope method and temperature profiling agreed within the same order of magnitude and had smaller uncertainty associated with the results than the Darcy’s law calculations. In a study of a fringing wetland in Virginia, Tobias and others (2001)
46

found that the best method to measure ground-water discharge varied seasonally. The Darcy’s law method provided the most reliable estimate during low ground-water-flow conditions in the fall, whereas a salt mass balance method provided a better estimate of discharge during highflow conditions in the spring (Tobias and others, 2001). Ground-water tracer tests with a conservative tracer are another method to obtain ground-water flow rates (Tobias and others, 2001). Despite the uncertainties that may be associated with the Darcy’s law method for wetland sediments, this method requires the least manpower and other resources to complete. Because of the spatial heterogeneity common in wetlands, hydraulic conductivity and flow estimates are best estimated for as many different areas of the site as possible. Although a wetland may be predominantly classified as a discharge area, localized recharge areas also can occur in a wetland (Hunt and others, 1996).
Temporal variability in ground-water-flow rates and directions also can be large, requiring semi-continuous or repeated measurements of hydraulic head at time-scales appropriate to assess this variability. Development of a conceptual model of the hydrogeomorphic landscape (Brinson, 1993; Winter, 2001; Winter and others, 2001) of the wetland can assist in determining appropriate scales over which to make hydrologic measurements. If a wetland is thought to derive a large component of its water source from precipitation (fig. 3), measurements during rainfall events will assist in evaluating the hydrology and contaminant attenuation processes. This was illustrated at the McGuire AFB, NJ wetland site, where high periods of recharge resulted in reversals in ground-water flow and a subsequent increase in the oxidation state of the ground water, which caused biodegradation of TCE to decrease (Lorah and others, 2002). Another example of the need to make site-specific decisions on collection of hydrologic data was demonstrated at the APG, MD wetland site, where tidally induced changes in head caused reversals in ground-water-flow directions at some sites and resulted in focused ground-water discharge of contaminants in unexpected areas of the wetland (Lorah and others, 1997; Lorah and Olsen, 1999b).
Ground-water discharge rates to surface-water bodies in the wetland area can be calculated by the same methods as discussed in the preceding section. In addition, seepage meters commonly have been used to directly measure ground-water discharge rates to surface water, including lakes, streams, and coastal waters (Lee, 1977; Lee and Cherry, 1978; Woessner and Sullivan, 1984; Shaw and Prepas, 1989; Cable and others, 1997). The basic seepage meter consists of the bottom section of a 55-gallon drum or smaller bucket (depending on the area of the study site) and a plastic water collection bag, connected to the bottom of the drum with an open port. The seepage rate is measured from the volume of water that enters the bag over a known time and area. Controlled experiments in tanks have indicated that seepage meters provide reliable measurements, although there was a constant bias in the measurements related to frictional resistance and head losses within the prefilled collection bags (Belanger and Montgomery, 1992; Isiorho and Meyer, 1999). The highly variable seepage measurements that can be found in the field probably are related largely to the spatial variability in hydraulic conductivity (Shaw and Prepas, 1989; Belanger and Montgomery, 1992).
3.5 Biogeochemical Characterization: Characterization of natural attenuation of chlorinated solvents in wetlands requires the same biogeochemical data as outlined by Wiedemeier and others (1996) for other subsurface environments, including parent and possible daughter compound VOCs, constituents that indicate the redox state of the ground water (such as DO, ferrous iron, sulfide, sulfate, nitrate, ammonia, methane, and hydrogen), and other waterquality measurements (such as pH and alkalinity). These data can be used to evaluate
47

geochemical footprints at a site (National Research Council, 2000). Demonstration of natural attenuation includes demonstrating decreasing contaminant concentrations along ground-water flowpaths or through time from historical data, and linking the decreasing concentrations to attenuation mechanisms. For assessment of natural attenuation in wetlands, changes in flowpaths and the potentially strong temporal variability in biogeochemical processes must be considered. Changes in concentrations must be evaluated along both horizontal and vertical ground-water flowpaths, requiring multilevel transects and closely spaced sampling intervals in the wetland sediment as previously discussed. To assess historical changes in contamination in the wetland, changes in contaminant concentrations in the contaminant source area and upland area of the aquifer also need to be evaluated. In addition, seasonal and other temporal effects on contaminant concentrations and attenuation processes would need to be evaluated. During 4 years of monitoring at the APG wetland site, an annual cycle of maximum VOC concentrations in the shallow wetland porewater in the late spring and summer and minimum VOC concentrations in the winter and early spring was observed. VOC concentrations in the shallow wetland porewater change by a factor of 3 to 4 in this annual cycle, while concentrations in the underlying aquifer remain approximately the same. These seasonal changes in the wetland contaminant concentrations are believed to be associated with changing hydraulic heads in the aquifer (and thus changes in the flux of VOCs being transported upward to the wetland sediments), rather than with changes in biodegradation or other attenuation processes (Lorah and others, 2002; Lorah and others, 2003).
Biogeochemical characterization in wetlands also requires unique consideration of sampling methods. Because of the small-diameter, closely spaced samplers needed for sampling wetland sediments and the generally low permeability of wetland sediments, only low sample volumes can usually be obtained without altering the natural flowpaths and consequently mixing water from different biogeochemical zones. For sampling drive-point piezometers and other devices that do not have a sand pack or other construction materials surrounding the casing, removal of one to two well volumes generally is sufficient for purging. Only one well volume commonly was purged from piezometers screened in the wetland sediment during the ESTCP wetland study because they would become dry. The generally low recovery rate and narrow diameter of the sampling devices in wetland sediments often required a non-traditional sampling method. Piezometers screened in the wetland sediment were purged and sampled with syringes that had tubing extending to the piezometer screen. Gently drawing sample into the syringe after expelling air allows sample to be collected at a low flow rate and with minimum aeration. The use of a 3-way valve between the tubing and syringe allows air from the top of a sample stream to be eliminated before collecting the sample, and shutting the valve to the tube holds the water in the tubing while the syringe is removed to expel sample into a bottle.
As the piezometers and the peepers give limited sample volumes, not all analytes recommended by Wiedemeier and others (1996) can be measured. Available site data and preliminary tests of the water could be used to decide on the critical parameters needed for a specific site. Available data on the low nitrate concentrations in the aquifer and in initial tests of the wetland porewater were used to eliminate nitrate and ammonia from the sampling list at the APG, MD wetland site. Analytes that required a constant, relatively high flowing sample stream to obtain accurate measurements, such as DO, commonly cannot be obtained for wetland porewater by current standard methods. Analysis of methane, ferrous iron, and sulfide, however, can be done on a total sample volume of 10 to 40 mL, although dilutions frequently were required to measure the ferrous iron and sulfide using standard methods. If one or more of these
48

constituents are present in the sample in high concentrations, DO can be assumed to be negligible. To further limit the sample volume for the ESTCP wetland study and previous work at the APG wetland site, VOCs were collected in 8-mL vials rather than the 40-mL vials that are usually used, and analyses were completed on a 5-mL sample volume. Finding commercial laboratories equipped to analyzed 5-mL sample volumes for VOCs may be difficult. Another common problem encountered in sampling wetland porewater is that coloration of the water from natural organic carbon interfered with the colorimetric tests used to determine sulfide, ammonia, ferrous iron, requiring filtration (if not usually already filtered), dilution, or use of an alternative analytical method.
Microcosms can be used to assist in assessing biodegradation processes and rates in natural attenuation studies in wetlands, but may require some additional considerations compared to other subsurface environments (Wiedemeier and others, 1996). The typically high organic carbon content of wetland sediments may result in a large amount of sorption of the organic contaminants added to the microcosms. An estimate or measure of the sorption coefficients will assist in determining the amount of the contaminant to add to attain the desired dissolved or headspace concentrations in the microcosms. For microcosms constructed with wetland sediment from the APG site, about 1,100 ppb of TCE or 1,1,2,2-tetrachloroethene had to be added to attain initial aqueous concentrations of 500 ppb (Lorah and others, 1997; Lorah and Olsen, 1999a). Killed controls are necessary to assist in accounting for the effect of sorption on VOC losses in the microcosms. In addition, the high biodegradation rates sometimes measured in organic-rich wetland sediments (Lorah and others, 2003) may require substantially shorter incubation times and sampling intervals than the 12 to 18 months suggested for microcosms with other subsurface sediments (Wiedemeier and others, 1996).
4.0 Summary and Conclusion
The protocol presented here expands the general protocol developed for evaluation of MNA in ground water to focus on wetlands. Wetland investigations require unique considerations in developing a site conceptual model and in selecting field methodologies for characterizing natural attenuation processes. This protocol discusses possible field methodologies for site characterization and monitoring in wetlands. These methods sometimes include equipment that is not commercially available and drilling and analytical methods that are non-standard. As with all remediation investigations, careful communication and documentation of all methods with site managers and regulators is suggested. Because wetland systems are complex and highly variable, characterization methods appropriate for one site may not be appropriate for another site.
49
5.0 References Cited
Amon, J.P., Thompson, C.A., Carpenter, Q.J., and Miner, J., 2002, Temperate zone fens of the glaciated midwestern USA: Wetlands, v. 22, p. 301-317.
Banks, W.S.L., Paylor, R.L., and Hughes, W.B., 1996, Using thermal-infrared imagery to delineate ground-water discharge: Ground Water, v. 34, no. 3, p. 434-443.
Belanger, T.V., and Montgomery, M.T., 1992, Seepage meter errors: Limnology and Oceanography, v. 37, no. 8, p. 1,787-1,795.
Bouwer, E.J., 1994, Bioremediation of chlorinated solvents using alternate electron acceptors, in Norris, R.D. and others, Handbook of Bioremediation: Ann Arbor, Michigan, Lewis Publishers, p. 149-175.
Brinson, M.M., 1993, A hydrogeomorphic classification for wetlands: U.S. Army Corps of Engineers Technical Report WRP-DE-4, 79 p.
Cable, J.E., Burnett, W.C., Chanton, J.P., Corbett, D.R., and Cable, P.H., 1997, Evaluation of seepage meters in the coastal marine environment: Estuarine, Coastal and Shelf Science, v. 45, p. 367-375.
Capone, D.G., and Kiene, R.P., 1988, Comparison of microbial dynamics in marine and freshwater sediments: Contrasts in anaerobic catabolism: Limnology and Oceanography, v. 33, p. 725-749.
Cherry, J.A., Gilham, R.W., Anderson, E.G., and Johnson, P.E., 1983, Migration of contaminants in groundwater at a landfill: A case study, groundwater monitoring devices: Journal of Hydrology, v. 63, no. 1-2, p. 31-49.
Cole, C.A., and Brooks, R.P., 2000, Patterns of wetland hydrology in the Ridge and Valley Province, Pennsylvania, USA: Wetlands, v. 20, no. 3, p. 438-447.
Delin, G.N., and Landon, M.K., 1996, Multiport well design for sampling of ground water at closely spaced vertical intervals: Ground Water, v. 34, no. 6, p. 1,098-1,104.
Dyer, L.J., Lorah, M.M., and Burris, D.R., 2002, Effect of sampling method on measured porewater concentrations in a wetland contaminated by chlorinated solvents, in Nehring, K.W and Brauning, S.E. (eds.), Proceedings of the Second International Conference on Wetlands & Remediation, September 5-6, 2001, Burlington, Vermont: Columbus, Ohio, Battelle Press, p. 33-40.
Freedman, D.L., and Gossett, J.M., 1989, Biological reductive dehalogenation of tetrachloroethylene and trichloroethylene under methanogenic conditions: Applied and Environmental Microbiology, v. 55, p. 1,009-1,014.
Goslee, S.C., Brooks, R.P., and Cole, C.A., 1997, Plants as indicators of wetland water source: Plant Ecology, v. 131, p. 199-206.
Hesslein, R. H., 1976, An in situ sampler for close interval pore water studies: Limnology and Oceanography, v. 21, p. 912-914.
Hunt, R.J., Krabbenhoft, D.P., and Anderson, M.P., 1996, Groundwater inflow measurements in wetland systems: Water Resources Research, v. 32, no. 3, p. 495-507.
Isiorho, S.A., and Meyer, J.H., 1999, The effects of bag type and meter size on seepage meter measurements: Ground Water, v. 37, no. 3, p. 411-413.
Klijn, F., and Witte, J-P, 1999, Eco-hydrology: Groundwater flow and site factors in plant ecology: Hydrogeology Journal, v. 7, p. 65-77.
50

Landva, A.O., Pheeney, P.E., and Mersereau, D.E., 1983, Undisturbed sampling of peat, in Jarrett, P.M. (ed), Testing of peats and organic soils: ASTM STP 820, American Society for Testing Materials, Philadelphia, Pennsylvania, p. 141-156.
Lee, D.R., 1977, A device for measuring seepage flux in lakes and estuaries: Limnology and Oceanography, v. 22, no. 1, p. 140-147.
Lee, D.R., 1985, Method for locating sediment anomalies in lakebeds that can be caused by groundwater flow: Journal of Hydrology, v. 79, p. 187-193.
Lee, D.R., and Cherry, J.A., 1978, A field exercise on groundwater flow using seepage meters and minipiezometers: Journal of Geologic Education, v. 27, p. 6-10.
Lee, K., and Fetter, C.W., 1994, Hydrogeology laboratory manual: New York, MacMillan, 136 p.
Lee, D.R., and Tracey, J.P., 1984, Identification of groundwater discharge locations using thermal infrared imagery, in Proceedings of the Ninth Canadian Symposium on Remote Sensing, St. Johns, Newfoundland, Canada, p. 301-308.
Lorah, M.M., Burris, D.R., and Dyer, L.J., 2002, Efficiency of natural attenuation of chlorinated solvents in two freshwater wetlands, in Nehring, K.W and Brauning, S.E. (eds.), Proceedings of the Second International Conference on Wetlands & Remediation, September 5-6, 2001, Burlington, Vermont: Columbus, Ohio, Battelle Press, p. 9-16.
Lorah, M.M., and Olsen, L.D., 1999a, Degradation of 1,1,2,2-tetrachloroethane in a freshwater tidal wetland: Field and laboratory evidence: Environmental Science and Technology, v. 33, no. 2, p. 227-234.
Lorah, M.M. and Olsen, L.D., 1999b, Natural attenuation of chlorinated volatile organic compounds in a freshwater tidal wetland: Field evidence of anaerobic biodegradation: Water Resources Research, v. 35, no. 12, p. 3,811-3,827.
Lorah, M.M., Olsen, L.D., Smith, B.L., Johnson, M.A., and Fleck, W.B., 1997, Natural attenuation of chlorinated volatile organic compounds in a freshwater tidal wetland, Aberdeen Proving Ground, Maryland: U.S. Geological Survey Water-Resources Investigations Report 97-4171, 95 p.
Lorah, M.M., Voytek, M.A., Kirshtein, J.D., and (Phillips) Jones, E.J., 2003, Anaerobic degradation of 1,1,2,2-tetrachloroethane and association with microbial communities in a freshwater tidal wetland, Aberdeen Proving Ground, Maryland: Laboratory experiments and comparisons to field data: U.S. Geological Survey Water-Resources Investigations Report 02-4157, 64 p.
McCarty, P. L., and Semprini, Lewis, 1994, Ground-water treatment for chlorinated solvents, in Norris, R.D. and others, Handbook of Bioremediation: Ann Arbor, Michigan, Lewis Publishers, p. 87-116.
Mitsch, W.J., and Gosselink, J.G., 2000, Wetlands, 3rd Edition: New York, John Wiley & Sons, 920 p.
National Research Council, 2000, Natural attenuation for groundwater remediation: Washington, D.C., National Academy Press, 274 p.
Pearson, J.A., and Leoschke, M.J., 1992, Floristic composition and conservation status of fens in Iowa: Journal of the Iowa Academy of Science, v. 99, p. 41-52.
Phelan, D. J., Senus, M.P., and Olsen, L.D., 2001, Lithologic and ground-water-quality data collected using hoverprobe drilling techniques at the West Branch Canal Creek wetland, Aberdeen Proving Ground, Maryland, April-May 2000: U.S. Geological Survey Open-File Report 00-446, 43 p.
51

Richardson, C.J., 1999, Ecological functions of wetlands in the landscape, in Lewis and others (eds.), Ecotoxicology and risk assessment for wetlands: Pensacola, Florida, Society of Environmental Toxicology and Chemistry (SETAC), p. 9-25.
Rosenberry, D.O., 2000, Plants as indicators of focused ground water discharge to a northern Minnesota Lake: Ground Water, v. 38, no. 2, p. 296-303.
Schnoor, J.L., 2002, Phytoremediation of soil and groundwater: Pittsburgh, Pennsylvania, Ground-Water Remediation Technologies Analysis Center, Technology Evaluation Report TE-02-01, 45 p.
Shaw, R.D., and Prepas, E.E., 1989, Groundwater-lake interactions: I. Accuracy of seepage meter estimates of lake seepage: Journal of Hydrology, v. 119, p. 105-120.
Silliman, S.E., and Booth, D.F., 1993, Analysis of time-series measurements of sediment temperature for identification of gaining vs. losing portions of Juday Creek, Indiana: Journal of Hydrology, v. 146, p. 131-148.
Sheppard, M.I., Tarnocai, C., and Thibault, D.H., 1993, Sampling organic soils, in Carter, M.R (ed.), Soil sampling and methods of analysis, Canadian Society of Soil Science: Boca Raton, Florida, Lewis Publishers, p. 423-439.
Stauffer, T.B., Antworth, C.P., Young, R.G., MacIntyre, W.G., Boggs, J.M. and Beard, L.M., 1993, Degradation of aromatic hydrocarbons in an aquifer during a field experiment demonstrating the feasibility of remediation by natural attenuation: Tyndall Air Force Base, Florida, Report No. AL/EQ TR 1993-0007, [variously paged].
Swanson, G.A., Adomaitis, V.A., Lee, F.B., Serie, J.R., and Shoesmith, J.A., 1984, Limnological conditions influencing duckling use of saline lakes in south-central North Dakota: Journal of Wildlife Management, v. 48, p. 340-349.
Tobias, C.R., Harvey, J.W., and Anderson, I.C., 2001, Quantifying groundwater discharge through fringing wetlands to estuaries: Seasonal variability, methods comparison, and implications for wetland-estuary exchange: Limnology and Oceanography, v. 46, no. 3, p. 604-615.
U.S. Environmental Protection Agency, 2000, Proceedings of the Ground-Water/Surface-Water Interactions Workshop: U.S. Environmental Protection Agency, Report No. EPA/542/R-00/007, 200 p.
Vogel, T.M., and McCarty, P.L., 1985, Biotransformation of tetrachloroethylene to trichloroethylene, dichloroethylene, vinyl chloride, and carbon dioxide under methanogenic conditions: Applied and Environmental Microbiology, v. 49, p. 1,080-1,083.
Vroblesky, D.A., 2001, User’s guide for polyethylene-based passive diffusion bag samplers to obtain volatile organic compound concentrations in wells, Part 1: Deployment, recovery, data interpretation, quality control and assurance: U.S. Geological Survey Water-Resources Investigations Report 01-4060, 18 p.
Vroblesky, D.A., Nietch, C.T., and Morris, J.T., 1999, Chlorinated ethenes from groundwater in tree trunks: Environmental Science and Technology, v. 33, p. 510-515.
Webster, I.T., Teasdale, P.R., and Grigg, N.J., 1998, Theoretical and experimental analysis of peeper equilibration dynamics: Environmental Science and Technology, v. 32, no. 11, p. 1,727-1,733.
Wiedemeier, T.H., Downey, D.C., Wilson, J.T., Kampbell, D.H., Miller, R., and Hansen, J., 1994, Technical protocol for implementing the intrinsic remediation with long-term monitoring option for natural attenuation of dissolved-phase fuel contamination in
52

groundwater: Proceedings of the U.S. Air Force/National Center for Manufacturing Sciences Conference on Natural Restoration, July 1994, Ann Arbor, Michigan.
Wiedemeier, T.H., Swanson, M.A., Moutoux, D.E., Gordon, E.K., Wilson, J.T., Wilson, B.H., Kampbell, D.H., Hansen, J.E., Haas, P. and Chapelle, F.H., 1996, Technical Protocol for Evaluating Natural Attenuation of Chlorinated Solvents in Groundwater. Available from Air Force Center for Environmental Excellence (AFCEE), Brooks Air Force Base, Texas.
Wiedemeier, T.H., Swanson, M.A., Moutoux, D.E., Gordon, E.K., Wilson, J.T., Wilson, B.H., Kampbell, D.H., Hansen, J.E., Haas, P., and Chapelle, F.H., 1998, Technical protocol for evaluating natural attenuation of chlorinated solvents in ground water: U.S. Environmental Protection Agency, Report No. EPA/600/R-98/128, September 1998.
Winter, T.C., 1992, A physiographic and climatic framework for hydrologic studies of wetlands, in Robards, R.D., and Bothwell, M.L. (eds.), Aquatic ecosystems in semi-arid regions, implications for resource management: Saskatoon, Saskatchewan, Canada, Environment Canada, The National Hydrology Research Institute Symposium Series No. 7, p. 127-148.
Winter, T.C., 2001, The concept of hydrologic landscapes: Journal of the American Water Resources Association, v. 37, no.2, p. 335-349.
Winter, T.C., LaBaugh, J.W., and Rosenberry, D.O., 1988, Direct measurement of differences in hydraulic head between ground water and surface water using a hydraulic potentiomanometer: Limnology and Oceanography, v. 33, no. 5, p. 1,209-1,214.
Winter, T.C., Rosenberry, D.O., Buso, D.C., and Merk, D.A., 2001, Water source to four U.S. wetlands: Implications for wetland management: Wetlands, v. 21, no. 4, p. 462-473.
Wise, M.B. and Guerin, M.R., 1997, Direct sampling MS for environmental screening: Analytical Chemistry, v. 69, p. 26A-32A.
Woessner, W.W., and Sullivan, K.E., 1984, Results of seepage meter and mini-piezometer study, Lake Mead, Nevada: Ground Water, v. 22, no. 5, p. 561-568.
DJS 01/10/2006
53