DRAFT - formal adoption and publication of the final ...€¦ · DRAFT - formal adoption and...
54
ENVIRONMENTAL RESEARCH PLAN OF THE FEDERAL MINISTER FOR THE ENVIRONMENT, NATURE CONSERVATION AND NUCLEAR SAFETY - Air Pollution Control - Federal Environment Agency, Germany FKZ 3709 52 141 "Future Development of the EU Directive for Measuring the CO 2 Emissions of Passenger Cars - Investigation of the Influence of Different Parameters and the Improvement of Measurement Accuracy” - Final Report, 14 December 2010 - by Helge Schmidt Ralf Johannsen Institute for Vehicle Technology and Mobility Drivetrain / Emissions Passenger cars / Motorcycles By order of the Federal Environment Agency, Germany DRAFT - formal adoption and publication of the final report by UBA is expected soon
Transcript of DRAFT - formal adoption and publication of the final ...€¦ · DRAFT - formal adoption and...
ENVIRONMENTAL RESEARCH PLAN OF THE FEDERAL MINISTER FOR THE ENVIRONMENT, NATURE CONSERVATION AND NUCLEAR SAFETY - Air Pollution Control -
Federal Environment Agency, Germany FKZ 3709 52 141
"Future Development of the EU Directive for Measuring the
CO2 Emissions of Passenger Cars - Investigation of the Influence of Different Parameters and
the Improvement of Measurement Accuracy”
- Final Report, 14 December 2010 -
by Helge Schmidt Ralf Johannsen Institute for Vehicle Technology and Mobility Drivetrain / Emissions Passenger cars / Motorcycles By order of the Federal Environment Agency, Germany
DRAFT - formal adoption and publication of the final report by UBA is expected soon
redmann
Hervorheben
redmann
Hervorheben
redmann
Textfeld
WLTP-LabProcICE-038
- 2 -
Future development of the EU Directive for measuring CO2 emissions of passenger cars
Final report
Index
1 ABBREVIATIONS 3
2 INTRODUCTION 4
3 PROJECT IMPLEMENTATION 7
3.1 Investigation Programme 7 3.2 Selection of Test Vehicles 12 3.3 Performance of the Investigations 14
4 TEST RESULTS 17
4.1 Test Vehicle VW GOLF 1.4 TSI 17 4.2 Test Vehicle OPEL CORSA 1.2 L 20 4.3 Test Vehicle BMW 320i 23 4.4 Test Vehicle PEUGEOT 207 HDI 26 4.5 Test Vehicle AUDI A4 AVANT TDI 29 4.6 Test Vehicle DAIMLER C 200 CDI 32
5 EVALUATION 35
5.1 Parameters affecting CO2 measurements 35 5.1.1 BASIC MEASUREMENT 37 5.1.2 INERTIA MASS 38 5.1.3 DRIVING RESISTANCE 40 5.1.4 INFLUENCE OF THE DRIVER 41 5.1.5 AMBIENT CONDITIONS 42 5.1.6 BEST CASE 43 5.1.7 GEAR SHIFTING 44 5.1.8 START-STOP SYSTEM 45 5.1.9 BATTERY STATE OF CHARGE 46
6 RECOMMENDATIONS FOR THE FUTURE DEVELOPMENT OF THE EU DIRECTIVE 47
7 SUMMARY / CONCLUSION 52
8 REFERENCES 54
DRAFT - formal adoption and publication of the final report by UBA is expected soon
- 3 -
Future development of the EU Directive for measuring CO2 emissions of passenger cars
Final report
1 Abbreviations
A4, A5 4-speed or 5-speed automatic transmission CI compression ignition CO carbon monoxide CO2 carbon dioxide DSG Direktschaltgetriebe (dual-clutch transmission) EUDC Extra Urban Driving Cycle Euro 1 Type approval in accordance with Directive 91/441/EEC Euro 2 Type approval in accordance with Directive 94/12/EEC Euro 3 Type approval in accordance with Directive 98/69/EC Euro 4 Type approval in accordance with Directive 98/69/EC, more
stringent requirements compared with Euro 3 (e.g. reduced limits, -7°C test for passenger cars using petrol engines)
Euro 5 Euro 6
type approval in accordance with Regulation (EC) No. 715/2007 on type approval of motor vehicles with respect to emissions from light passenger and commercial vehicles (Euro 5 and Euro 6) and on access to vehicle repair and maintenance information, Official Journal of the European Union
FC Fuel consumption GSI Gear shift indicator HC Hydrocarbons KBA Kraftfahrt-Bundesamt (German Federal Office for Motor Traffic) KraftStÄndG Kraftfahrzeugsteueränderungsgesetz (German Motor Vehicle
Tax Reform Act) of 18 April 1997 KV Kraftstoffverbrauch (fuel consumption),
calculated from carbon components of exhaust gases M5, M6 5-speed or 6-speed manual gearbox NEDC New European Driving Cycle NEFZ Neuer Europäischer Fahrzyklus (NEDC) in accordance with
Directive 98/69/EC NO nitrogen monoxide NOX nitrogen oxides SMK Schwungmassenklasse (inertia mass class) UBA Umweltbundesamt (Federal Environment Agency) UDC Urban Driving Cycle = inner city part of NEDC
DRAFT - formal adoption and publication of the final report by UBA is expected soon

- 4 -
Future development of the EU Directive for measuring CO2 emissions of passenger cars
Final report
2 Introduction
Global warming has focussed the debate on the environmental compatibility of road traffic on carbon dioxide emissions. Since the beginning of the industrial revolution the CO2 concentration in the atmosphere has risen by about 30%. With a share of 12 % in anthropogenic CO2 emissions in Europe, road traffic is one of the main causes of global warming. Limited oil resources and the resulting rises in fuel prices have made fuel consumption a key criterion for new car purchase decisions. The EU has undertaken to reduce greenhouse gas emissions by at least 20 % by 2020 compared with the figure for 1990. The Commission has developed a strategy for reducing carbon dioxide emissions caused by passenger cars. Regulation (EC) No. 443/2009 for the reduction of the CO2 emissions of new passenger cars was adopted on 23 April 2009. The objective is to reduce average CO2 emissions to 95 g/km by 2020. The aim for 2012 is to reach average emissions of 120 grams of CO2 per kilometre. The target for average CO2 emissions determined in accordance with Regulation (EC) No. 715/2007 is 130 g/km. The gap between the target of 120 g/km for 2012 and the limit of 130 g/km on CO2 emissions determined during type approval testing is to be bridged by additional measures such as the increased use of fuel from renewable sources, an upper limit on the rolling resistance of tyres and the use of gear shift indicators for consumption-optimized gear-shifting. Regulation (EC) No. 443/2009 provides for a CO2 limit of 130 g/km for new passenger cars to be introduced step by step by 2015. The limit is to be met by 65% of the new vehicles of each manufacturer in 2012, 75 % in 2013, 80 % in 2014 and 100 % in 2015. For manufacturers whose average fleet emissions exceed the target set, it is proposed to introduce an "excess emissions premium" for each additional gram of carbon dioxide emissions from 2012 onwards. By 2019, this premium is to be increased to 95 euros per gram. The amount of premium payable is to be determined on the basis of average fleet emissions. This value will be calculated on the basis of the number of new passenger cars registered and the CO2 emissions measured during type approval testing. Figure 2.1 shows the average fuel consumption of all new vehicles registered in Germany calculated from the CO2 emissions determined during type approval testing. The diagram clearly shows that the efficiency of the new vehicle fleet has been significantly improved over the past few years. The growing number of vehicles equipped with compression ignition engines, especially in the case of larger, heavier cars, has played a key role in reducing average fuel consumption.
DRAFT - formal adoption and publication of the final report by UBA is expected soon

- 5 -
Future development of the EU Directive for measuring CO2 emissions of passenger cars
Final report
Figure 2.1: Average fuel consumption and share of diesel vehicles in
new passenger car registrations in Germany (Source: BMVBS, KBA)
This trend continued in 2009. The average CO2 emissions determined for newly registered passenger cars in Germany in 2009 over the NEDC were 154.2 g/km. In this context, it should be noted that many small vehicles with low fuel consumption were sold in Germany in 2009 as a result of the German vehicle scrappage scheme. A slight increase in the average CO2 emissions of newly registered vehicles is therefore to be expected in 2010. In view of the average CO2 emissions of 154.4 g/km for the first half of the 2010, the automobile industry will need to make considerable efforts to reach the targets set by the European Commission. The basis for the determination of the CO2 emissions of passenger cars and light commercial vehicles is Regulation (EC) No. 715/2007. During type approval testing, exhaust emissions are measured on a dynamometer over the New European Driving Cycle (NEDC). The fuel consumption is calculated from the emissions of exhaust gas components (CO2, CO and THC) containing carbon. No limits on carbon dioxide emissions or fuel consumption are defined in the type approval procedure. The CO2
emissions and fuel consumption values declared by manufacturer must not exceed the results of type approval testing by more than 4 per cent. The CO2 emissions and the fuel consumption determined during type approval are influenced by a number of different factors. The mass and driving resistance of the test vehicle play a key role. Other factors such as vehicle preparation before testing may have a significant impact on the test results. Especially the test room temperature and the state of charge of the vehicle battery must be taken into consideration.
9.2
9.1
9.1
8.9
8.8
8.7
8.7
8.6
8.5
8.3
8.1
8.1
8.0
7.9
7.8
7.7
7.6
7.4
0
1
2
3
4
5
6
7
8
9
10
1991 1992 1993 1994 1995 1996 1997 1998 1999 2000 2001 2002 2003 2004 2005 2006 2007 2008
Avera
ge f
uel
co
nsu
mp
tio
n [
l/100km
]
0%
10%
20%
30%
40%
50%
60%
70%
Perc
en
tag
e o
f d
iesel
cars
[%
]
DRAFT - formal adoption and publication of the final report by UBA is expected soon

- 6 -
Future development of the EU Directive for measuring CO2 emissions of passenger cars
Final report
The engine speed and the gear shift points have a crucial effect on fuel consumption. The driving cycle defined by the Directive includes fixed gear shift points for vehicles equipped with internal combustion engines and manual gearboxes. In contrast, the manufacturer can define gear shift points for vehicles using automatic transmissions and hybrid vehicles with gear shift indicators. This allows such vehicles to be operated at lower engine speeds and to reach lower fuel consumptions over the driving cycle. In view of the rising importance of CO2 emissions and fuel consumption for consumer's purchase decisions and the excess emissions premiums proposed for manufacturers, the conditions for type approval testing must be defined in such a way that the test results are reproducible and realistic. This research programme investigates the effects of various parameters on the results of type approval testing. /1/, /2/, /3/, /4/, /5/, /6/, /7/, /8/
DRAFT - formal adoption and publication of the final report by UBA is expected soon
- 7 -
Future development of the EU Directive for measuring CO2 emissions of passenger cars
Final report
3 Project Implementation
3.1 Investigation Programme
This research programme investigated the effects of various factors on the carbon dioxide emissions and fuel consumption determined during type approval testing. For this purpose the CO2 emissions and the fuel consumption of 6 passenger cars were determined with reference to the variations in the different parameters allowed by the Directive. The first step was to measure the exhaust emissions and fuel consumption of the test vehicles as delivered. The various parameters were then varied in order to determine their influence on the test results. The measurements focussed on the vehicle mass used for the measurements, the load setting of the dynamometer, the driving cycle with the tolerances permitted and shift points used, vehicle preparation and the influence of battery charge state, The following factors were investigated: • variation of the inertia mass • variation of the driving resistance on the dynamometer • influence of the driver, by using the tolerances in the driving cycle • preparation of the test vehicle • optimized measurement • variation in gear shifting • automatic start-stop function • partially discharged starter battery (“low battery”) The various measurements and the conditions taken into consideration are presented and explained in the following paragraphs. Basic measurements: Initially, the exhaust emissions and the fuel consumption of the vehicles in delivery condition were measured on a dynamometer and the test results were compared with the values declared by the manufacturers. The measurements were based on the inertia mass and the load setting used for type approval testing. During testing the driving cycle was followed as closely as possible. Before the tests were started, the temperature of the vehicles was set to 22°C and the battery was fully charged. /9/ The following parameters relevant to the current type approval procedure were varied: Inertia mass: A key parameter for determining CO2 emissions and fuel consumption is the equipment of the test vehicle and the vehicle mass. In Directive 92/21/EEC, Annex II, Art. 2.3 the
DRAFT - formal adoption and publication of the final report by UBA is expected soon

- 8 -
Future development of the EU Directive for measuring CO2 emissions of passenger cars
Final report
“mass of load in excess” is declared as the “ the difference between the technically permissible maximum laden mass and the mass in running order increased by the mass of the conventional load. The mass of the load in excess may include the mass of optional equipment, e.g. sunroof, air conditioning, coupling device“. Many manufacturers take advantage of this definition and determine the CO2 emissions using a lower vehicle mass without consideration of this optional equipment. To evaluate the influence of the vehicle mass on CO2 emissions, the inertia mass was increased by 2 classes in comparison to the value used during type approval testing. This means an extra weight of about 220 kg (500 lbs) due to better equipment. Within the framework of this programme, the measurements with increased inertia mass compared to the base test can be seen as representing a worst case scenario. Table 3.1 shows the relationship between unladen mass, reference mass and inertia mass of the test vehicles. /10/, /11/
Inertia mass Unladen mass
[kg]
Reference mass
[kg]
[kg] [lbs]
1,055 < UM ≤ 1,165 1,080 < RM ≤ 1,190 1,130 2,500
1,165 < UM ≤ 1,280 1,190 < RM ≤ 1,305 1,250 2,750
1,280 < UM ≤ 1,395 1,305 < RM ≤ 1,420 1,360 3,000
1,395 < UM ≤ 1,505 1,420 < RM ≤ 1,530 1,470 3,250
1,505 < UM ≤ 1,615 1,530 < RM ≤ 1,640 1,590 3,500
1,615 < UM ≤ 1,735 1,640 < RM ≤ 1,760 1,700 3,750
1,735 < UM ≤ 1,845 1,760 < RM ≤ 1,870 1,810 4,000
1,845 < UM ≤ 1,955 1,870 < RM ≤ 1,980 1,930 4,250
Table 3.1: Unladen mass, reference mass and inertia mass in accordance
with ECE Regulation No. 83 (excerpt) Driving resistance: The driving resistance of the test vehicle has a decisive impact on the results of exhaust emission tests for type approval. To determine the driving resistance of a vehicle, the energy change during coast-down is measured on a test track. The test vehicle is first accelerated, then the gearbox is shifted to neutral and deceleration times for a number of different speed intervals are measured. The driving resistance of the vehicle at different speeds can be determined from these coast-down times. The vehicle mass, the rotating masses, resistances in the power train, the rolling resistance and the aerodynamic resistance of the vehicle are determined under realistic driving conditions. For later tests, the dynamometer is adjusted to obtain the same deceleration times as on the test track. This allows the driving resistance measured under real driving conditions to be simulated on the test track. For the setting of the driving resistance curve on the dynamometer, tolerances of ±5 % in the higher speed
DRAFT - formal adoption and publication of the final report by UBA is expected soon

- 9 -
Future development of the EU Directive for measuring CO2 emissions of passenger cars
Final report
range (120 km/h to 40 km/h) and ±10 % in the lower speed range (20 km/h) are permitted. The results of driving resistance measurements on the test track are strongly influenced by the equipment of the test vehicle. Especially the tyres play a major role. It was not possible to carry out any coast-down tests as part of the program. The influence of driving resistance was therefore investigated by making maximum use of the permissible tolerances and reducing the load setting of the dynamometer by 20 % at 20 km/h and by 10 % in the upper speed range of 40 km/h to 120 km/h compared with the type approval setting. Figure 3.1 shows the driving resistance value for type approval determined on the test track, the dynamometer setting for the basic test and the reduced load setting as an example for one test vehicle.
Figure 3.1: Driving resistance, dynamometer setting and reduced load
Driving Resistance
0.0
5.0
10.0
15.0
20.0
25.0
0 20 40 60 80 100 120 140 Speed [km/h]
Po
wer
[kW
]
Driving Resistance Dynamometer Setting Reduced Load
DRAFT - formal adoption and publication of the final report by UBA is expected soon
- 10 -
Future development of the EU Directive for measuring CO2 emissions of passenger cars
Final report
Influence of the driver: The New European Driving Cycle (NEDC), as amended by Directive 98/69/EC, defines certain tolerances on the driving curve. The deviation from the target curve must not exceed ±2 km/h or ±1.0 seconds. CO2 emissions can be improved if specially trained drivers make full use of these tolerances. Manufacturers are allowed to use their own drivers and dynamometers The drivers can be trained in the special features of the test vehicles and can follow instructions given by the development department. To evaluate the impact of the driver's influence, attempts were made to make the maximum possible use of the permitted tolerances on the driving curve. Conditioning: Before starting the measurement over the NEDC the test vehicle has to be parked at ambient temperatures for six hours to simulate a cold start. Before the measurements are started, the deviation between the oil temperature and the temperature of the room must be no more than 2°C. For CO2 emission measurements, the test vehicle can be conditioned to a temperature between 20°C and 30°C. If the upper limit is used, the higher oil temperature can minimize the friction loss during cold starts. If maximum use is made of the permitted tolerances, lower fuel consumption can therefore be expected. The influence of the soak temperature was investigated by placing the vehicle in a soak room with an ambient temperature of 28°C for at least 6 hours. The oil temperature at the start of the measurements was between 28°C and 30°C. Optimized measurement (best case) In order to assess the leeway allowed by current type approval testing regulations, all the optimization measures described above were combined for these measurements. The same inertia mass as during type approval testing was used. The driving resistance was reduced, the permitted tolerances on the driving curve were utilized and the vehicles were conditioned at an ambient temperature of 28°C for at least six hours before the tests were started. In addition, investigations were made of certain parameters which are currently of no importance for type approval but may possibly provide new information for future regulations. Gear shift points: In the case of vehicles with automatic transmissions and hybrid vehicles equipped with a gear shift indicator, the manufacturer is allowed to determine the gear shift points to be used in the NEDC. In contrast, the gear shift points for vehicles with manual transmissions are laid down in the Directive although the driving curve with gear shift points and the engine speed/road speed relationship are not always in line with the characteristics of the vehicle. Utilizing gear shift indicators (GSI) and the elimination of the shift points from the driving curve would be one possibility of adapting the driving curve to the state of the art.
DRAFT - formal adoption and publication of the final report by UBA is expected soon
- 11 -
Future development of the EU Directive for measuring CO2 emissions of passenger cars
Final report
Start-stop system: The number of modern vehicles with automatic start-stop system is steadily growing. With a system of this type the engine is stopped automatically when the vehicle comes to a standstill and the clutch is disengaged; when the clutch is re-engaged, the engine is automatically started. The objective of a start-stop system is to reduce fuel consumption and emissions. In order to assess the influence of an automatic start-stop system, measurements were made with the system activated and de-activated. State of charge (SOC) of the battery: Ancillary systems such as air conditioning systems, heaters, power-assisted steering pumps etc. remain deactivated for type approval testing. It is therefore difficult to assess actual fuel consumption because the manufacturer only indicates that additional equipment may lead to higher fuel consumption. Another factor which affects the results is the state of charge (SOC) of the battery which is subject to deterioration over the battery lifetime. In many cases, the battery is charged during conditioning prior to type approval testing to ensure that the vehicle needs to generate as little electric power as possible during the tests. To assess the influence of additional electrical equipment and the deterioration of battery charge, measurements were made with a battery discharged to a level where the battery had to be charged during the CO2 measurement and higher energy output was required from the internal combustion engine. The objective of the investigation is to evaluate the influence of different parameters on the measurement of CO2 emissions and fuel consumption during type approval testing. Proposals for the future development of the directive concerning CO2 emissions testing of passenger cars as part of type approval testing were made on the basis of the test results.
DRAFT - formal adoption and publication of the final report by UBA is expected soon

- 12 -
Future development of the EU Directive for measuring CO2 emissions of passenger cars
Final report
3.2 Selection of Test Vehicles The objective of the investigation is to evaluate the influence of different parameters on the measurement of CO2 emissions and fuel consumption during type approval testing. The investigations therefore concentrated on the influence of the various parameters rather than on an assessment of the vehicles selected. In order to investigate the range of effects of the various parameters, different vehicle designs were considered. The choice of vehicles was based on a number of different criteria. State-of-the-art vehicles were selected for the investigations and vehicles equipped with spark-ignition and compression-ignition engines were considered. The selection of the test vehicles was based on the vehicle registration statistics of KBA (the German Federal Office for Motor Traffic). /7/, /8/, /12/
New passenger car registrations in Germany
0,0
0,5
1,0
1,5
2,0
2,5
3,0
3,5
4,0
1990
1991
1992
1993
1994
1995
1996
1997
1998
1999
2000
2001
2002
2003
2004
2005
2006
2007
2008
Re
gis
trati
on
s [
mil
lio
n p
ass
en
ger
ca
rs]
All passenger cars
Diesel passenger cars
Figure 3.2: New passenger car registrations in Germany from 1990 to
2008, Source: KBA Figure 3.2 shows the percentage of diesel vehicles in newly registered passenger cars in Germany from 1990 to 2008. In 2009 the proportion of diesel vehicles dropped to 30.7 % as a result of the German car scrappage incentive, which led to an increase in sales of smaller and less expensive vehicles. In the first few months of 2010, the share of diesel passenger cars stabilized at approx. 40 %. For this programme, it was decided that 50 % of the test vehicles should be powered by diesel engines. /9/, /10/
DRAFT - formal adoption and publication of the final report by UBA is expected soon
- 13 -
Future development of the EU Directive for measuring CO2 emissions of passenger cars
Final report
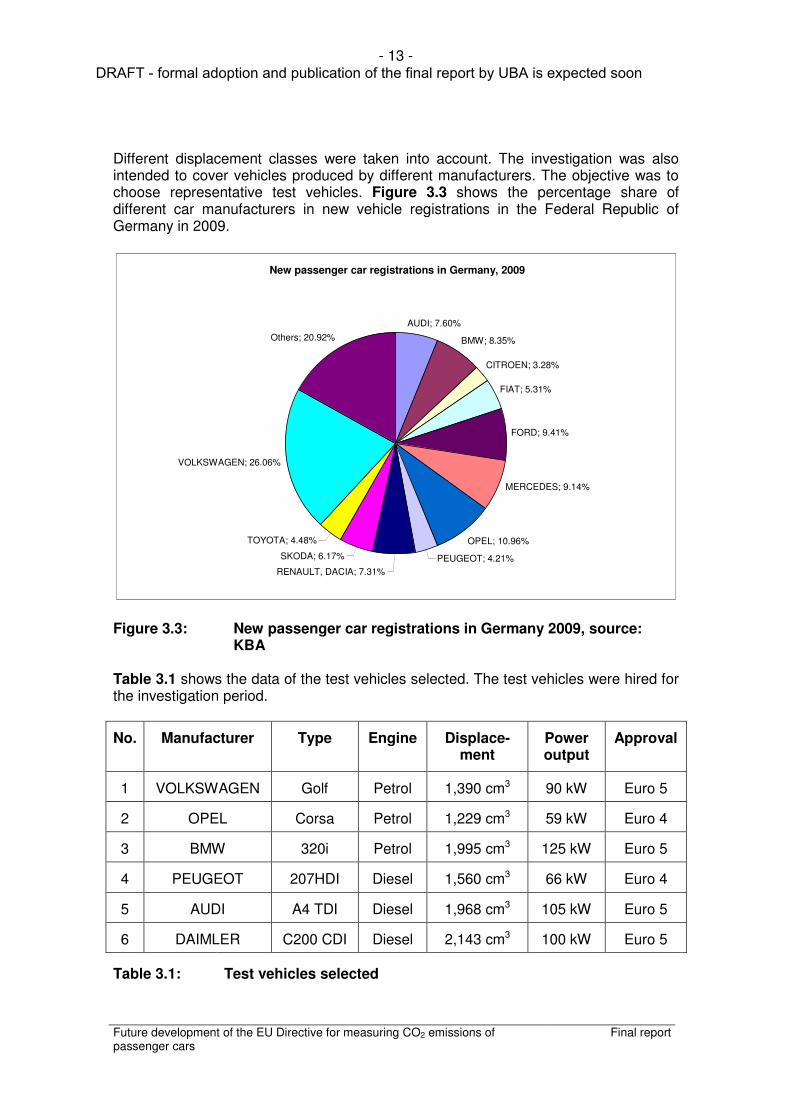
Different displacement classes were taken into account. The investigation was also intended to cover vehicles produced by different manufacturers. The objective was to choose representative test vehicles. Figure 3.3 shows the percentage share of different car manufacturers in new vehicle registrations in the Federal Republic of Germany in 2009.
Figure 3.3: New passenger car registrations in Germany 2009, source:
KBA Table 3.1 shows the data of the test vehicles selected. The test vehicles were hired for the investigation period.
No. Manufacturer Type Engine Displace-ment
Power output
Approval
1 VOLKSWAGEN Golf Petrol 1,390 cm3 90 kW Euro 5
2 OPEL Corsa Petrol 1,229 cm3 59 kW Euro 4
3 BMW 320i Petrol 1,995 cm3 125 kW Euro 5
4 PEUGEOT 207HDI Diesel 1,560 cm3 66 kW Euro 4
5 AUDI A4 TDI Diesel 1,968 cm3 105 kW Euro 5
6 DAIMLER C200 CDI Diesel 2,143 cm3 100 kW Euro 5
Table 3.1: Test vehicles selected
New passenger car registrations in Germany, 2009
AUDI; 7.60% BMW; 8.35%
CITROEN; 3.28%
FIAT; 5.31%
FORD; 9.41%
OPEL; 10.96% PEUGEOT; 4.21%
RENAULT, DACIA; 7.31% SKODA; 6.17%
TOYOTA; 4.48%
VOLKSWAGEN; 26.06%
Others; 20.92%
MERCEDES; 9.14%
DRAFT - formal adoption and publication of the final report by UBA is expected soon
- 14 -
Future development of the EU Directive for measuring CO2 emissions of passenger cars
Final report
After the vehicles had been delivered, checks were made to ensure compliance with the specified servicing intervals (using the service manuals) and to ensure that the vehicles were in proper condition. Before tests on the dynamometer were started, the on-board diagnosis systems were read out. No errors were stored in the diagnosis system memories of any of the vehicles.
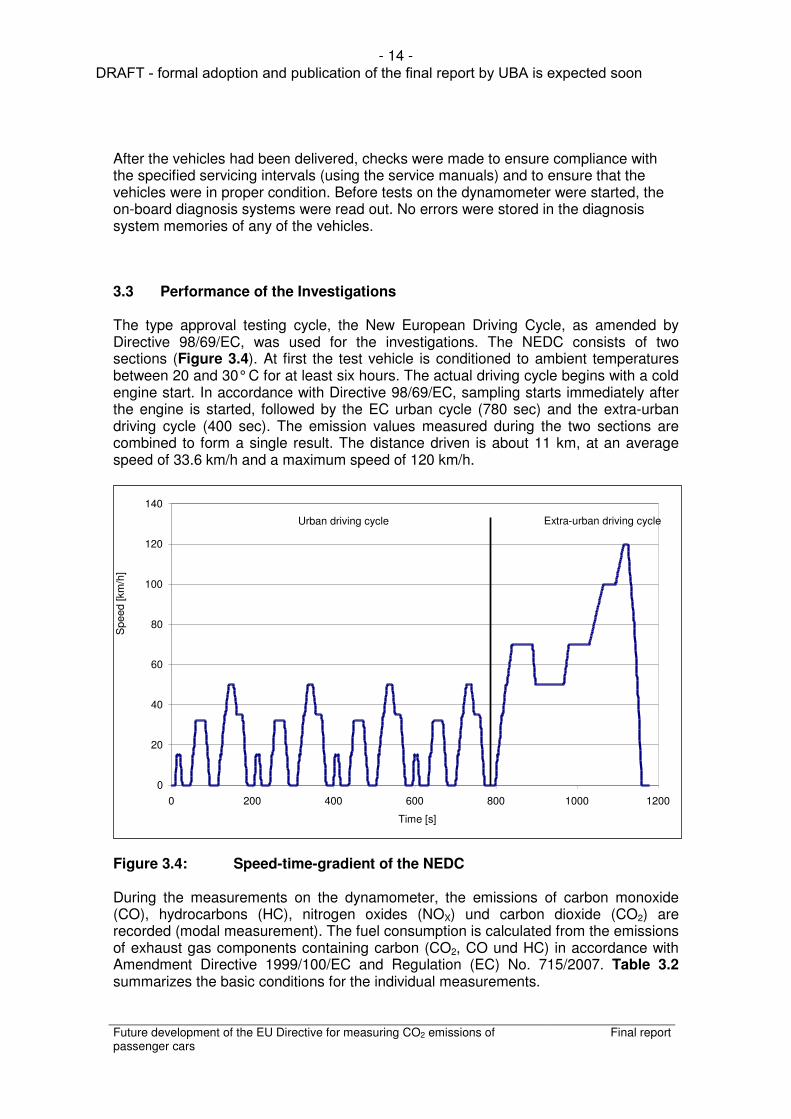
3.3 Performance of the Investigations The type approval testing cycle, the New European Driving Cycle, as amended by Directive 98/69/EC, was used for the investigations. The NEDC consists of two sections (Figure 3.4). At first the test vehicle is conditioned to ambient temperatures between 20 and 30° C for at least six hours. The actual driving cycle begins with a cold engine start. In accordance with Directive 98/69/EC, sampling starts immediately after the engine is started, followed by the EC urban cycle (780 sec) and the extra-urban driving cycle (400 sec). The emission values measured during the two sections are combined to form a single result. The distance driven is about 11 km, at an average speed of 33.6 km/h and a maximum speed of 120 km/h.
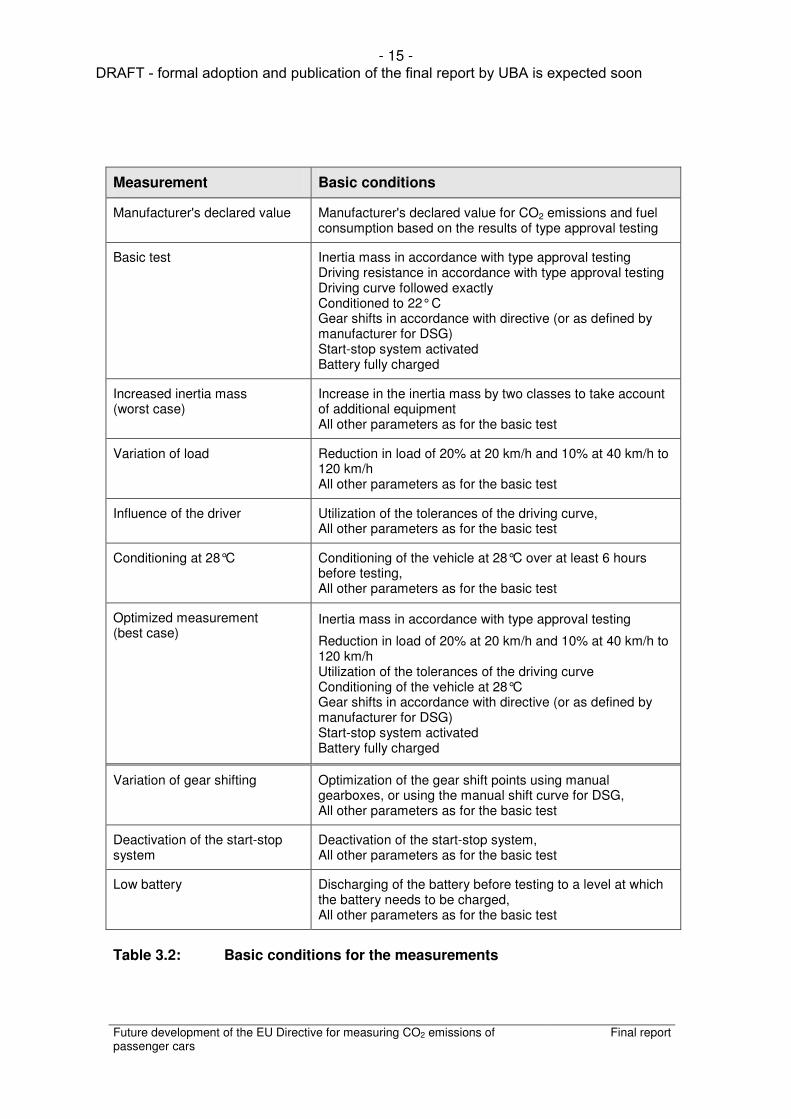
Figure 3.4: Speed-time-gradient of the NEDC During the measurements on the dynamometer, the emissions of carbon monoxide (CO), hydrocarbons (HC), nitrogen oxides (NOX) und carbon dioxide (CO2) are recorded (modal measurement). The fuel consumption is calculated from the emissions of exhaust gas components containing carbon (CO2, CO und HC) in accordance with Amendment Directive 1999/100/EC and Regulation (EC) No. 715/2007. Table 3.2 summarizes the basic conditions for the individual measurements.
0
20
40
60
80
100
120
140
0 200 400 600 800 1000 1200 Time [s]
Spe
ed [k
m/h
]
Urban driving cycle Extra-urban driving cycle
DRAFT - formal adoption and publication of the final report by UBA is expected soon
- 15 -
Future development of the EU Directive for measuring CO2 emissions of passenger cars
Final report
Measurement Basic conditions
Manufacturer's declared value Manufacturer's declared value for CO2 emissions and fuel consumption based on the results of type approval testing
Basic test Inertia mass in accordance with type approval testing Driving resistance in accordance with type approval testing Driving curve followed exactly Conditioned to 22° C Gear shifts in accordance with directive (or as defined by manufacturer for DSG) Start-stop system activated Battery fully charged
Increased inertia mass (worst case)
Increase in the inertia mass by two classes to take account of additional equipment All other parameters as for the basic test
Variation of load Reduction in load of 20% at 20 km/h and 10% at 40 km/h to 120 km/h All other parameters as for the basic test
Influence of the driver Utilization of the tolerances of the driving curve, All other parameters as for the basic test
Conditioning at 28°C Conditioning of the vehicle at 28°C over at least 6 hours before testing, All other parameters as for the basic test
Optimized measurement (best case)
Inertia mass in accordance with type approval testing
Reduction in load of 20% at 20 km/h and 10% at 40 km/h to 120 km/h Utilization of the tolerances of the driving curve Conditioning of the vehicle at 28°C Gear shifts in accordance with directive (or as defined by manufacturer for DSG) Start-stop system activated Battery fully charged
Variation of gear shifting Optimization of the gear shift points using manual gearboxes, or using the manual shift curve for DSG, All other parameters as for the basic test
Deactivation of the start-stop system
Deactivation of the start-stop system, All other parameters as for the basic test
Low battery Discharging of the battery before testing to a level at which the battery needs to be charged, All other parameters as for the basic test
Table 3.2: Basic conditions for the measurements
DRAFT - formal adoption and publication of the final report by UBA is expected soon
- 16 -
Future development of the EU Directive for measuring CO2 emissions of passenger cars
Final report
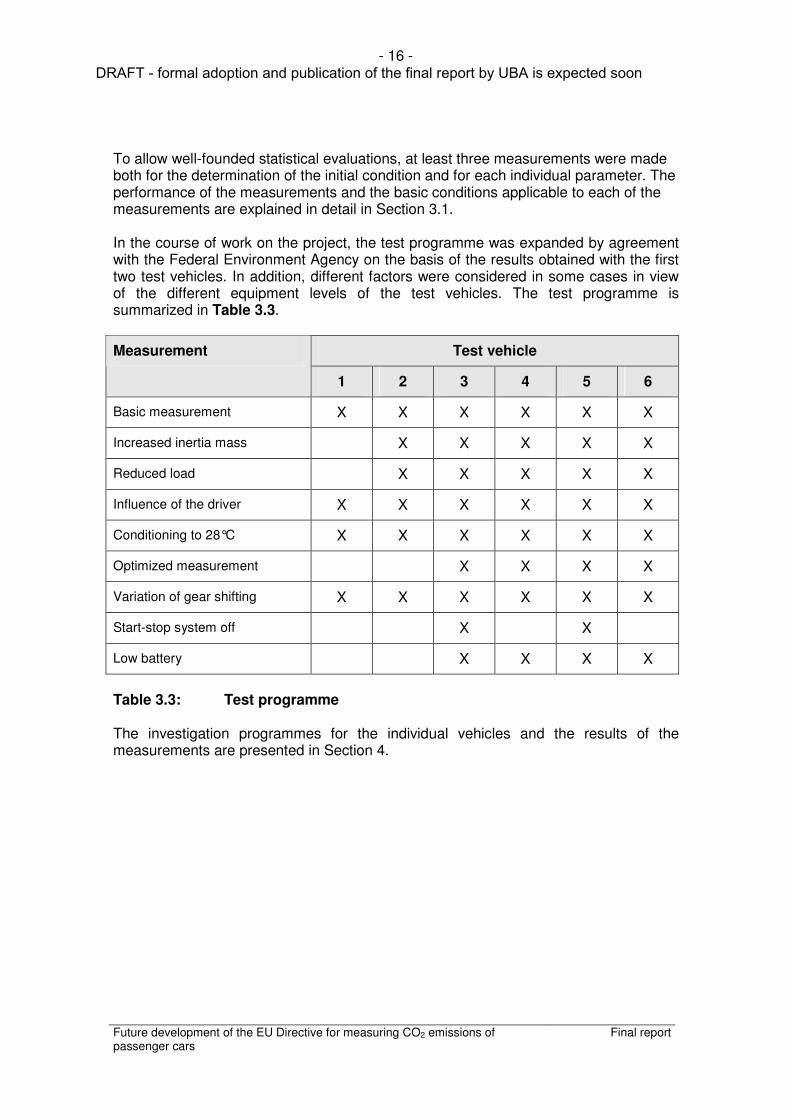
To allow well-founded statistical evaluations, at least three measurements were made both for the determination of the initial condition and for each individual parameter. The performance of the measurements and the basic conditions applicable to each of the measurements are explained in detail in Section 3.1. In the course of work on the project, the test programme was expanded by agreement with the Federal Environment Agency on the basis of the results obtained with the first two test vehicles. In addition, different factors were considered in some cases in view of the different equipment levels of the test vehicles. The test programme is summarized in Table 3.3.
Test vehicle Measurement
1 2 3 4 5 6
Basic measurement X X X X X X
Increased inertia mass X X X X X
Reduced load X X X X X
Influence of the driver X X X X X X
Conditioning to 28°C X X X X X X
Optimized measurement X X X X
Variation of gear shifting X X X X X X
Start-stop system off X X
Low battery X X X X
Table 3.3: Test programme The investigation programmes for the individual vehicles and the results of the measurements are presented in Section 4.
DRAFT - formal adoption and publication of the final report by UBA is expected soon

- 17 -
Future development of the EU Directive for measuring CO2 emissions of passenger cars
Final report
4 Test Results
4.1 Test Vehicle VW GOLF 1.4 TSI
The technical data of the VW GOLF VI test vehicle were as follows:
Manufacturer: VOLKSWAGEN
Vehicle type: 1K
Model name: Golf VI
Emission class: Euro 5
Mileage: 13,921 km
Engine model: CAX (1.4 l TSI)
Engine type: Petrol (direct injection / turbocharged)
Engine power output: 90 kW / 5000 rpm
Gearbox: dual-clutch transmission, 7-speed (DSG-7)
Tyre size: 225/45R17 91W
Inertia mass: 1470 kg
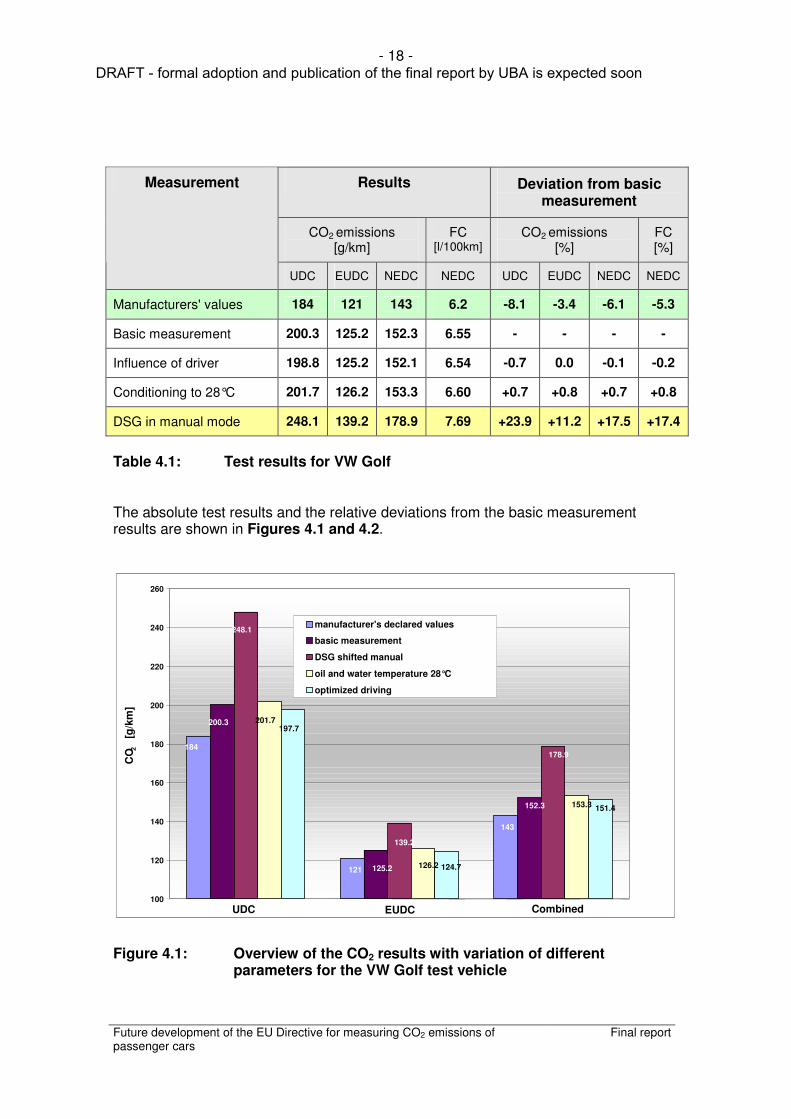
The following tests were carried out on this test vehicle: • Basic measurement • Influence of the driver, utilizing the tolerances of the driving curve • Conditioning to 28°C ambient temperature • Variation of gear shifting (DSG, shifted manually) The VW Golf test vehicle was equipped with a DSG dual-clutch transmission that combines the benefits of an automatic transmission and a manual gearbox. This means that the vehicle could be driven both using the automatic driving curve and using the driving curve for manual gearboxes. All the measurements were made in the automatic mode, as for the type approval tests, except that the "variation of gear shifting" tests were carried out using the manual shift mode with the appropriate driving curve. The test results for the VW Golf are shown in Table 4.1.
DRAFT - formal adoption and publication of the final report by UBA is expected soon
- 18 -
Future development of the EU Directive for measuring CO2 emissions of passenger cars
Final report
Results Deviation from basic measurement
CO2 emissions [g/km]
FC [l/100km]
CO2 emissions [%]
FC [%]
Measurement
UDC EUDC NEDC NEDC UDC EUDC NEDC NEDC
Manufacturers' values 184 121 143 6.2 -8.1 -3.4 -6.1 -5.3
Basic measurement 200.3 125.2 152.3 6.55 - - - -
Influence of driver 198.8 125.2 152.1 6.54 -0.7 0.0 -0.1 -0.2
Conditioning to 28°C 201.7 126.2 153.3 6.60 +0.7 +0.8 +0.7 +0.8
DSG in manual mode 248.1 139.2 178.9 7.69 +23.9 +11.2 +17.5 +17.4
Table 4.1: Test results for VW Golf The absolute test results and the relative deviations from the basic measurement results are shown in Figures 4.1 and 4.2.
Figure 4.1: Overview of the CO2 results with variation of different
parameters for the VW Golf test vehicle
143
121
184
152.3
125.2
200.3
178.9
139.2
248.1
153.3
126.2
201.7
151.4
124.7
197.7
100
120
140
160
180
200
220
240
260
CO
2 [
g/k
m]
manufacturer's declared values basic measurement DSG shifted manual oil and water temperature 28°C optimized driving
UDC EUDC Combined
DRAFT - formal adoption and publication of the final report by UBA is expected soon
- 19 -
Future development of the EU Directive for measuring CO2 emissions of passenger cars
Final report
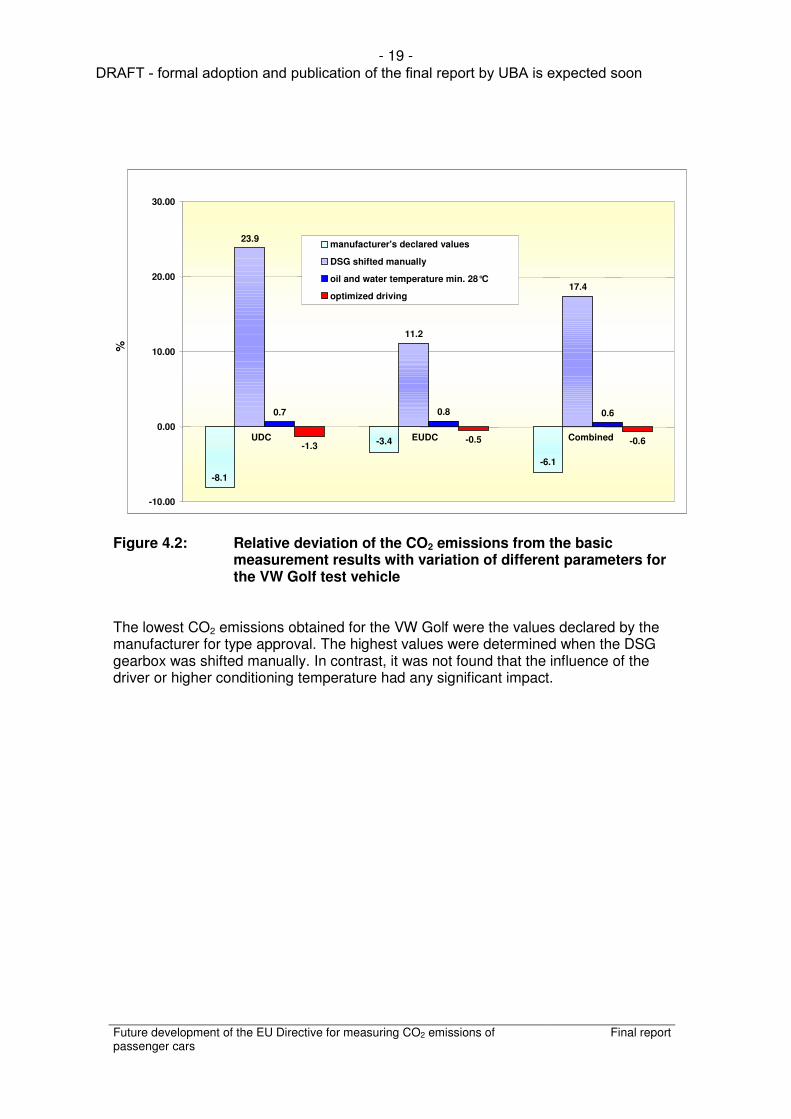
Figure 4.2: Relative deviation of the CO2 emissions from the basic
measurement results with variation of different parameters for the VW Golf test vehicle
The lowest CO2 emissions obtained for the VW Golf were the values declared by the manufacturer for type approval. The highest values were determined when the DSG gearbox was shifted manually. In contrast, it was not found that the influence of the driver or higher conditioning temperature had any significant impact.
23.9
11.2
17.4
0.7 0.8 0.6
-1.3 -0.5 -0.6
-6.1
-3.4
-8.1
-10.00
0.00
10.00
20.00
30.00
%
manufacturer's declared values DSG shifted manually oil and water temperature min. 28°C optimized driving
UDC EUDC Combined
DRAFT - formal adoption and publication of the final report by UBA is expected soon
- 20 -
Future development of the EU Directive for measuring CO2 emissions of passenger cars
Final report
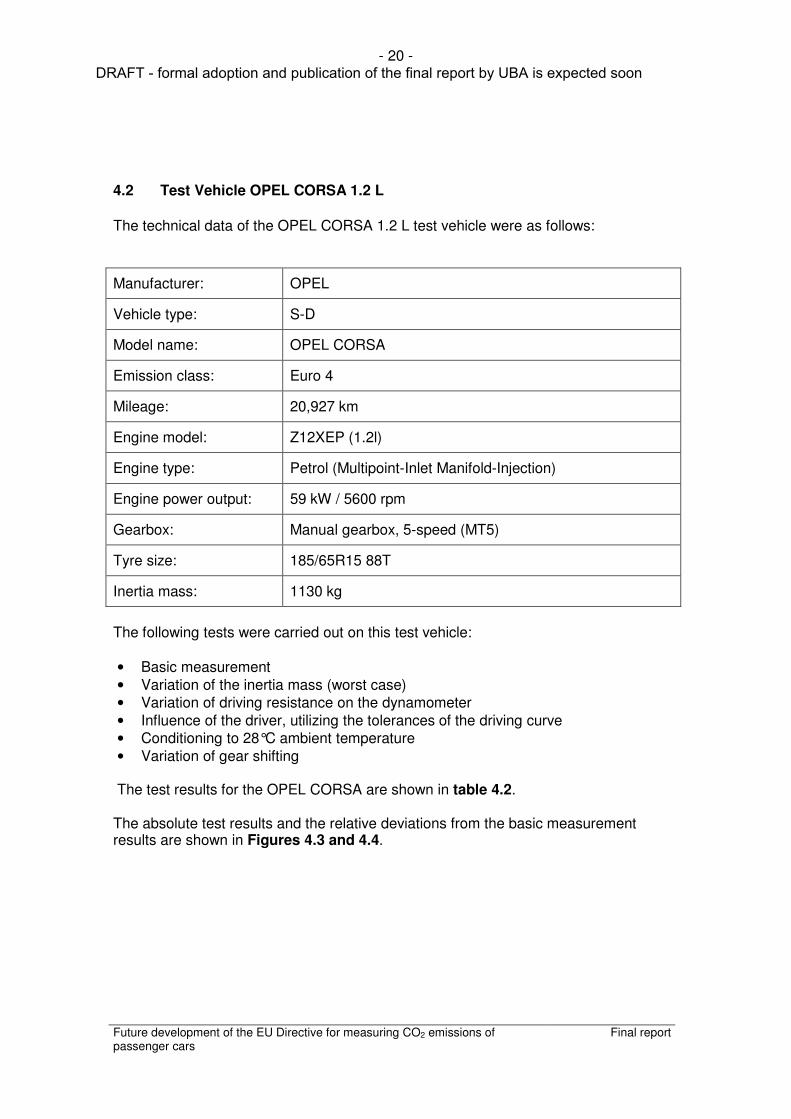
4.2 Test Vehicle OPEL CORSA 1.2 L
The technical data of the OPEL CORSA 1.2 L test vehicle were as follows:
Manufacturer: OPEL
Vehicle type: S-D
Model name: OPEL CORSA
Emission class: Euro 4
Mileage: 20,927 km
Engine model: Z12XEP (1.2l)
Engine type: Petrol (Multipoint-Inlet Manifold-Injection)
Engine power output: 59 kW / 5600 rpm
Gearbox: Manual gearbox, 5-speed (MT5)
Tyre size: 185/65R15 88T
Inertia mass: 1130 kg
The following tests were carried out on this test vehicle: • Basic measurement • Variation of the inertia mass (worst case) • Variation of driving resistance on the dynamometer • Influence of the driver, utilizing the tolerances of the driving curve • Conditioning to 28°C ambient temperature • Variation of gear shifting The test results for the OPEL CORSA are shown in table 4.2. The absolute test results and the relative deviations from the basic measurement results are shown in Figures 4.3 and 4.4.
DRAFT - formal adoption and publication of the final report by UBA is expected soon

- 21 -
Future development of the EU Directive for measuring CO2 emissions of passenger cars
Final report
Results Deviation from basic measurement
CO2 emissions [g/km]
FC [l/100km]
CO2 emissions [%]
FC [%]
Measurement
UDC EUDC NEDC NEDC UDC EUDC NEDC NEDC
Manufacturer’s values 192 120 146 6.1 -2.1 -1.1 -1.7 -2.6
Basic measurement 196.1 121.3 148.5 6.26 - - - -
Increased inertia mass 195.3 122.4 149.1 6.29 -0.4 +0.9 +0.4 +0.5
Reduced load 192.3 115.3 143.4 6.05 -1.9 -4.9 -3.4 -3.4
Influence of the driver 197.3 120.6 147.8 6.23 +0.6 -0.6 -0.5 -0.5
Conditioning to 28°C 177.8 121.5 142.1 5.99 -9.3 +0.2 -4.3 -4.3
Variation of gear shifting 151.8 116.9 129.6 5.48 -22.6 -3.6 -12.7 -12.5
Table 4.2: Test results for OPEL CORSA
Figure 4.3:
Overview of the CO2 results with variation of different parameters for the OPEL CORSA test vehicle
19
2
12
0
14
6
19
6.1
12
1.3
14
8.5
19
7.3
12
0.6
14
7.8
17
7.8
12
1.5
14
2.1
19
2.3
11
5.3
14
3.4
15
1,8
11
6.9
12
9.6
19
5.3
12
2.4
14
9.1
100
120
140
160
180
200
CO
2 [
g/k
m]
manufacturer's declared values basic measurement driving curve optimized oil and water temperature min. 28°C tolerance adaptation coast down curve optimized gear shifting inertia mass high (2 steps)
UDC EUDC Combined
DRAFT - formal adoption and publication of the final report by UBA is expected soon

- 22 -
Future development of the EU Directive for measuring CO2 emissions of passenger cars
Final report
Figure 4.4: Relative deviation of the CO2 emissions from the basic
measurement results with variation of different parameters for the OPEL CORSA test vehicle
The lowest CO2 emissions obtained for the OPEL CORSA were measured during the tests with optimized gear shifting. The highest values were measured during tests with the inertia mass increased by 2 classes, which can be considered as the worst case scenario with reference to the current type approval testing conditions. A significant reduction in CO2 emissions was also observed during the tests with reduced load and increased conditioning temperature.
-2.1 -1.0
-1.7
0,6
-0.6 -0.5
0.2
-1.9
-4.9
-22.6
-3.6
-12.8
-0.4
0,9 0.4
-4.4
-9.3
-3.4
-25.00
-20.00
-15.00
-10.00
-5.00
0.00
5.00
manufacturer's declared values driving curve optimized oil and water temperature min. 28°C tolerance adaptation coast down curve (low load) optimized gear shifting inertia mass high (2 steps)
%
UDC EUDC Combined
DRAFT - formal adoption and publication of the final report by UBA is expected soon

- 23 -
Future development of the EU Directive for measuring CO2 emissions of passenger cars
Final report
4.3 Test Vehicle BMW 320i
The technical data of the BMW 320i test vehicle were as follows:
Manufacturer: BMW
Vehicle type: 390L
Model name: BMW 320i
Emission class: Euro 5
Mileage: 17,527 km
Engine model: N43D20A (2.0 l)
Engine type: Petrol (direct injection)
Engine power output: 125 kW / 6700 rpm
Gearbox: manual gearbox, 6-speed (MT-6)
Tyre size: 205/55R16 91H
Inertia mass: 1470 kg
Special feature: start-stop system
The following tests were carried out on this test vehicle: • Basic measurement • Variation of the inertia mass (worst case) • Variation of driving resistance on the dynamometer • Influence of the driver, utilizing the tolerances of the driving curve • Conditioning to 28°C ambient temperature • Optimized measurement (best case: combination of low inertia mass, utilization of
the tolerances for adapting the driving resistance curve, increasing the water and oil temperature to 28°C and optimized driving inside the tolerance range of the NEDC)
• Deactivation of the start-stop function • Variation of gear shifting • Partially discharged starter battery (“low battery”) The test results for the BMW 320i are shown in Table 4.3.
DRAFT - formal adoption and publication of the final report by UBA is expected soon

- 24 -
Future development of the EU Directive for measuring CO2 emissions of passenger cars
Final report
Results Deviation from basic measurement
CO2 emissions [g/km]
FC [l/100km]
CO2 emissions [%]
FC [%]
Measurement
UDC EUDC NEDC NEDC UDC EUDC NEDC NEDC
Manufacturer's values 194 125 150 6.5 -18.0 -7.0 -12.6 -12.5
Basic measurement 236.6 134.4 171.7 7.43 - - - -
Increased inertia mass 238 138.9 175.1 7.57 +0.6 +3.3 +2.0 +1.9
Reduced load 235 129.9 168.3 7.27 -0.7 -3.3 -2.0 -2.2
Influence of the driver 238.7 132.8 170.3 7.35 +0.9 -1.2 -0.8 -1.1
Conditioning to 28°C 227.9 132 167 7.22 -3.7 -1.8 -2.7 -2.8
Best case 229.6 130.9 165.7 7.16 -3.0 -2.6 -3.5 -3.6
Variation of gear shifting 180.8 125.7 145.7 6.29 -23.6 -6.5 -15.1 -15.3
Without start/stop system 243.3 132.9 173.3 7.49 +2.8 -1.1 +0.9 +0.8
Low battery 319.7 145.2 208.9 9.02 +35.1 +8.0 +21.7 +21.4
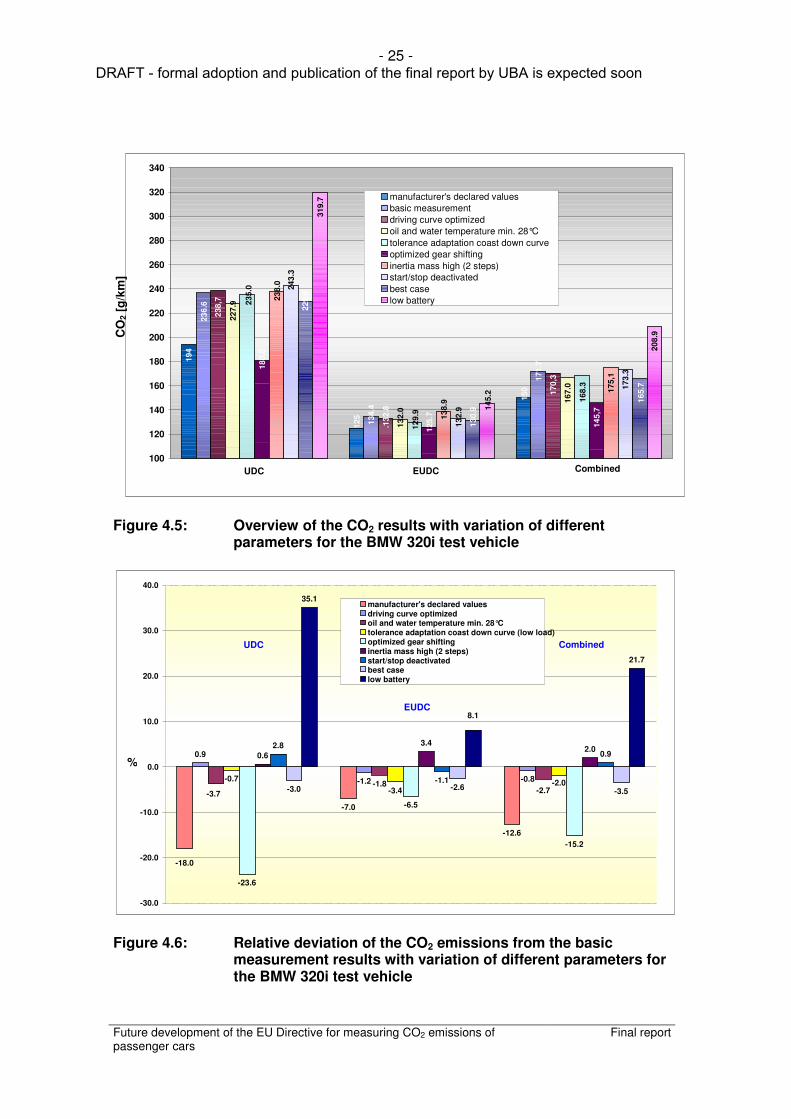
Table 4.3: Test results for BMW 320i The lowest CO2 emissions for the BMW 320i test vehicle were measured during the test with optimized gear shifting. The highest values were measured with the battery partially discharged before testing. A significant reduction in CO2 emissions compared with the basic measurement was obtained by reducing the load setting, adopting optimized driving behaviour and conditioning to 28°C. The absolute test results and the relative deviations from the basic measurement results are shown in Figures 4.5 and 4.6.
DRAFT - formal adoption and publication of the final report by UBA is expected soon
- 25 -
Future development of the EU Directive for measuring CO2 emissions of passenger cars
Final report
Figure 4.5: Overview of the CO2 results with variation of different
parameters for the BMW 320i test vehicle
Figure 4.6: Relative deviation of the CO2 emissions from the basic
measurement results with variation of different parameters for the BMW 320i test vehicle
19
4
12
5
15
0
23
6.6
13
4.4
17
1.7
23
8,7
.13
2.8
17
0,3
22
7.9
13
2.0 1
67
.0
23
5.0
12
9.9 1
68
.3
18
0.8
12
5.7
14
5,7
23
8.0
13
8.9 1
75
,1
17
3.3
13
2.9
24
3.3
16
5.7
13
0.9
22
9.6
20
8.9
14
5.2
31
9.7
100
120
140
160
180
200
220
240
260
280
300
320
340
CO
2 [
g/k
m]
manufacturer's declared values basic measurement driving curve optimized oil and water temperature min. 28°C tolerance adaptation coast down curve optimized gear shifting inertia mass high (2 steps) start/stop deactivated best case low battery
UDC EUDC Combined
-7.0
-12.6
0.9
-1.2 -0.8 -1.8 -0.7
-3.4
-23.6
-6.5
-15.2
0.6 3.4
2.0 2.8
-1.1
0.9
-3.0 -2.6 -3.5
35.1
21.7
-18.0
-2.7 -3.7 -2.0
8.1
-30.0
-20.0
-10.0
0.0
10.0
20.0
30.0
40.0 manufacturer's declared values driving curve optimized oil and water temperature min. 28°C tolerance adaptation coast down curve (low load) optimized gear shifting inertia mass high (2 steps) start/stop deactivated best case low battery
%
UDC
EUDC
Combined
DRAFT - formal adoption and publication of the final report by UBA is expected soon

- 26 -
Future development of the EU Directive for measuring CO2 emissions of passenger cars
Final report
4.4 Test Vehicle PEUGEOT 207 HDI
The technical data of the PEUGEOT 207 HDI test vehicle were as follows:
Manufacturer: PEUGEOT
Vehicle type: WE9HVC
Model name: Peugeot 207 SW HDI
Emission class: Euro 4
Mileage: 9100 km
Engine model: 9HV (1.6 l)
Engine type: Diesel (turbocharged / particle filter)
Engine power output: 66 kW / 4000 rpm
Gearbox: manual gearbox, 5–speed (MT-5)
Tyre size: 185/65R15 88H
Inertia mass: 1250 kg
The following tests were carried out on this test vehicle: • Basic measurement • Variation of the inertia mass (worst case) • Variation of driving resistance on the dynamometer • Influence of the driver, utilizing the tolerances of the driving curve • Conditioning to 28°C ambient temperature • Optimized measurement (best case: combination of low inertia mass, utilization of
the tolerances for adapting the driving resistance curve, increasing the water and oil temperature to 28°C and optimized driving inside the tolerance range of the NEDC)
• Variation of gear shifting • Partially discharged starter battery (“low battery”) The test results for the PEUGEOT 207 HDI are shown in Table 4.4.
DRAFT - formal adoption and publication of the final report by UBA is expected soon

- 27 -
Future development of the EU Directive for measuring CO2 emissions of passenger cars
Final report
Test results Deviation from basic measurement
CO2 emissions [g/km]
FC [l/100km]
CO2 emissions [%]
FC [%]
Measurement
UDC EUDC NEDC NEDC UDC EUDC NEDC NEDC
Manufacturer's values 153 101 120 4.5 +3.6 -4.4 -0.9 -2.0
Basic measurement 147.7 105.7 121.1 4.59
Increased inertia mass 149.9 109.8 124.5 4.71 +1.5 +3.9 +2.8 +2.6
Reduced load 140.2 99.4 114.3 4.33 -5.1 -6.0 -5.6 -5.7
Influence of the driver 147.5 103.8 119.3 4.52 -0.1 -1.8 -1.5 -1.5
Conditioning to 28°C 142.1 105.4 118.9 4.5 -3.8 -0.3 -1.8 -2.0
Best case 144.2 98.5 114.7 4.35 -2.4 -6.8 -5.3 -5.2
Variation of gear shifting 128.4 104.2 113.1 4.28 -13.1 -1.4 -6.6 -6.8
Low battery 169.7 109.5 131.5 4.97 +14.9 +3.6 +8.6 +8.3
Table 4.4: Test results for PEUGEOT 207 HDI The lowest CO2 emissions for the PEUGEOT 207 HDI test vehicle were obtained by using optimized gear shifting. The highest values were determined with the battery partially discharged before testing. Reduced load and conditioning to 28°C led to significantly lower carbon dioxide emissions. In contrast an increase in CO2 emissions was, as expected, determined with an increase of two classes in the inertia mass. The absolute test results and the relative deviations from the basic measurement results are shown in Figures 4.7 and 4.8.
DRAFT - formal adoption and publication of the final report by UBA is expected soon

- 28 -
Future development of the EU Directive for measuring CO2 emissions of passenger cars
Final report
Figure 4.7: Overview of the CO2 results with variation of different
parameters for the PEUGEOT 207 HDI test vehicle
Figure 4.8: Relative deviation of the CO2 emissions from the basic
measurement results with variation of different parameters for the PEUGEOT 207 HDI test vehicle
12
0
10
1
15
3
12
1.1
10
5.7
14
7.7
11
9.3
.10
3.8
14
7,5
11
6.9
10
4.2
13
8.8
11
4.3
99,4
14
0.2
11
3.1
10
4.2
12
8.4
12
4.5
10
9.8
14
9.9
14
4.2
98
.5
11
4.7
16
9.7
10
9.5
13
1.5
80
100
120
140
160
180
CO
2 [
g/k
m]
manufacturer's declared values basic measurement driving curve optimized oil and water temperature min. 28°C tolerance adaptation coast down curve optimized gear shifting inertia mass high (2 steps) best case low battery
UDC EUDC Combined
3.6
-4.5
-0.9 -0.1 -1.9 -1.5
-0.3
-5.1 -6.0
-13.1
-1.5
1.5 2.9
-2.4
-6.8 -5.3
14.9
8.6
-1.8 -3.8
-5.6 -6.6
3.8 3.5
-15.0
-10.0
-5.0
0.0
5.0
10.0
15.0
20.0 manufacturer's declared values driving curve optimized oil and water temperature min. 28°C tolerance adaptation coast down curve (low load) optimized gear shifting inertia mass high (2 steps) best case low battery
%
UDC
EUDC Combined
DRAFT - formal adoption and publication of the final report by UBA is expected soon
- 29 -
Future development of the EU Directive for measuring CO2 emissions of passenger cars
Final report
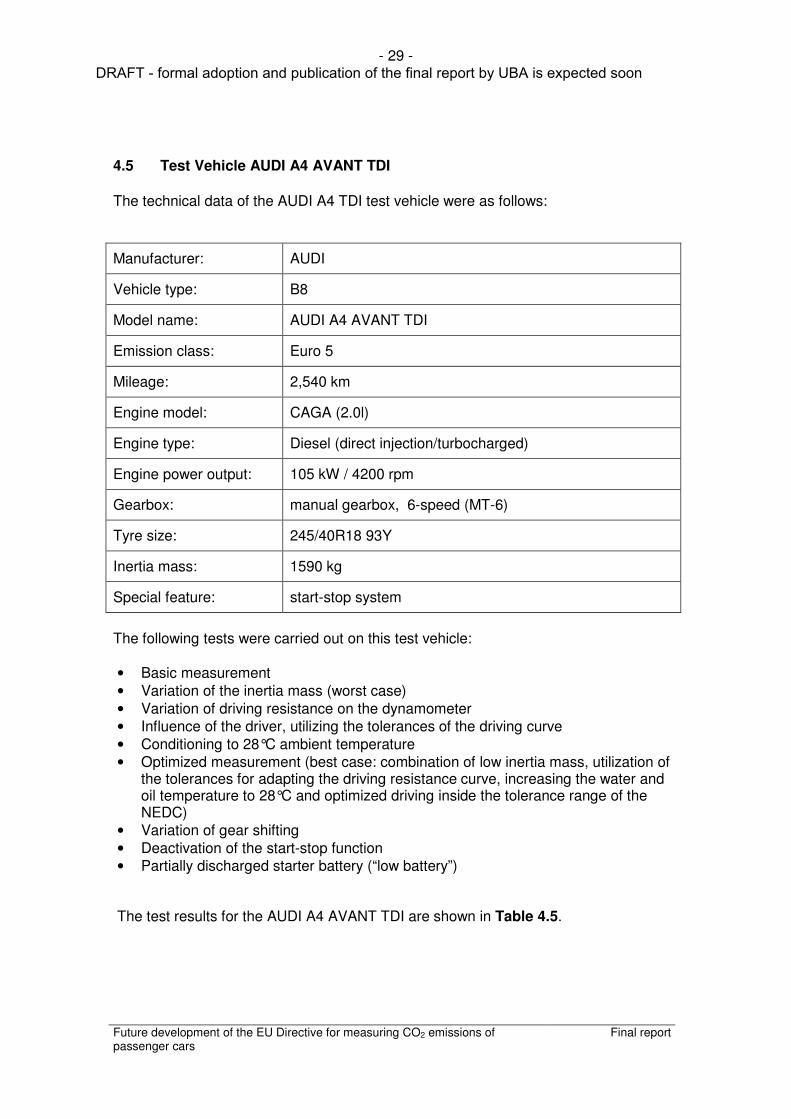
4.5 Test Vehicle AUDI A4 AVANT TDI
The technical data of the AUDI A4 TDI test vehicle were as follows:
Manufacturer: AUDI
Vehicle type: B8
Model name: AUDI A4 AVANT TDI
Emission class: Euro 5
Mileage: 2,540 km
Engine model: CAGA (2.0l)
Engine type: Diesel (direct injection/turbocharged)
Engine power output: 105 kW / 4200 rpm
Gearbox: manual gearbox, 6-speed (MT-6)
Tyre size: 245/40R18 93Y
Inertia mass: 1590 kg
Special feature: start-stop system
The following tests were carried out on this test vehicle: • Basic measurement • Variation of the inertia mass (worst case) • Variation of driving resistance on the dynamometer • Influence of the driver, utilizing the tolerances of the driving curve • Conditioning to 28°C ambient temperature • Optimized measurement (best case: combination of low inertia mass, utilization of
the tolerances for adapting the driving resistance curve, increasing the water and oil temperature to 28°C and optimized driving inside the tolerance range of the NEDC)
• Variation of gear shifting • Deactivation of the start-stop function • Partially discharged starter battery (“low battery”) The test results for the AUDI A4 AVANT TDI are shown in Table 4.5.
DRAFT - formal adoption and publication of the final report by UBA is expected soon
- 30 -
Future development of the EU Directive for measuring CO2 emissions of passenger cars
Final report
Test results Deviation from basic
measurement
CO2 emissions [g/km]
FC [l/100km]
CO2 emissions [%]
FC [%]
Measurement
UDC EUDC NEDC NEDC UDC EUDC NEDC NEDC
Manufacturer's values 173 119 139 5.3 -16.8 -10.1 -13.1 -12.7
Basic measurement 207.9 132.3 159.9 6.07 - - - -
Increased inertia mass 204.6 132.7 159 6.04 -1.6 +0.3 -0.6 -0.5
Reduced load 190.7 115 142.6 5.42 -8.3 -13.1 -10.8 -10.7
Influence of the driver 207.7 131.9 158.9 6.03 -0.1 -0.3 -0.6 -0.7
Conditioning to 28°C 194.6 129.1 153.1 5.81 -6.4 -2.4 -4.3 -4.3
Best case 174.5 111.1 133.5 5.07 -16.1 -16.0 -16.5 -16.5
Variation of gear shifting 171.8 126.3 142.8 5.42 -17.4 -4.5 -10.7 -10.7
Without start/stop system 221.6 133.8 165.9 6.30 +6.6 +1.1 +3.8 +3.8
Low battery 305 150.9 207.1 7.86 +46.7 +14.1 +29.5 +29.5
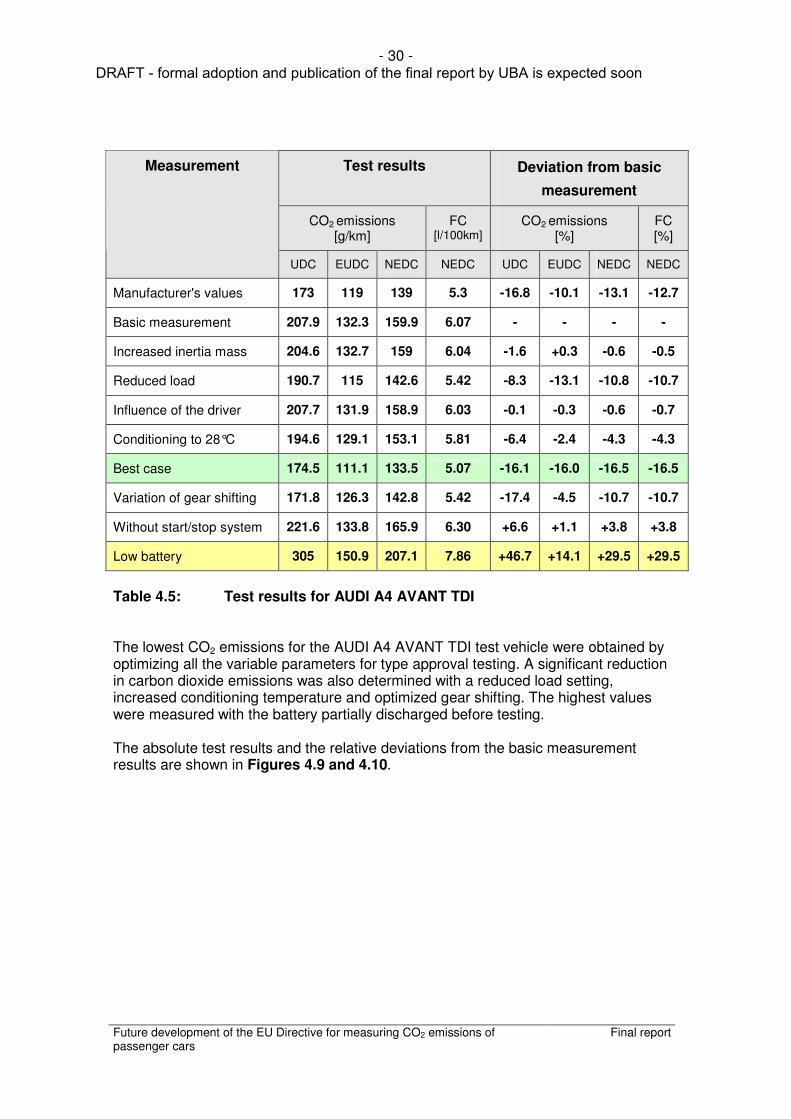
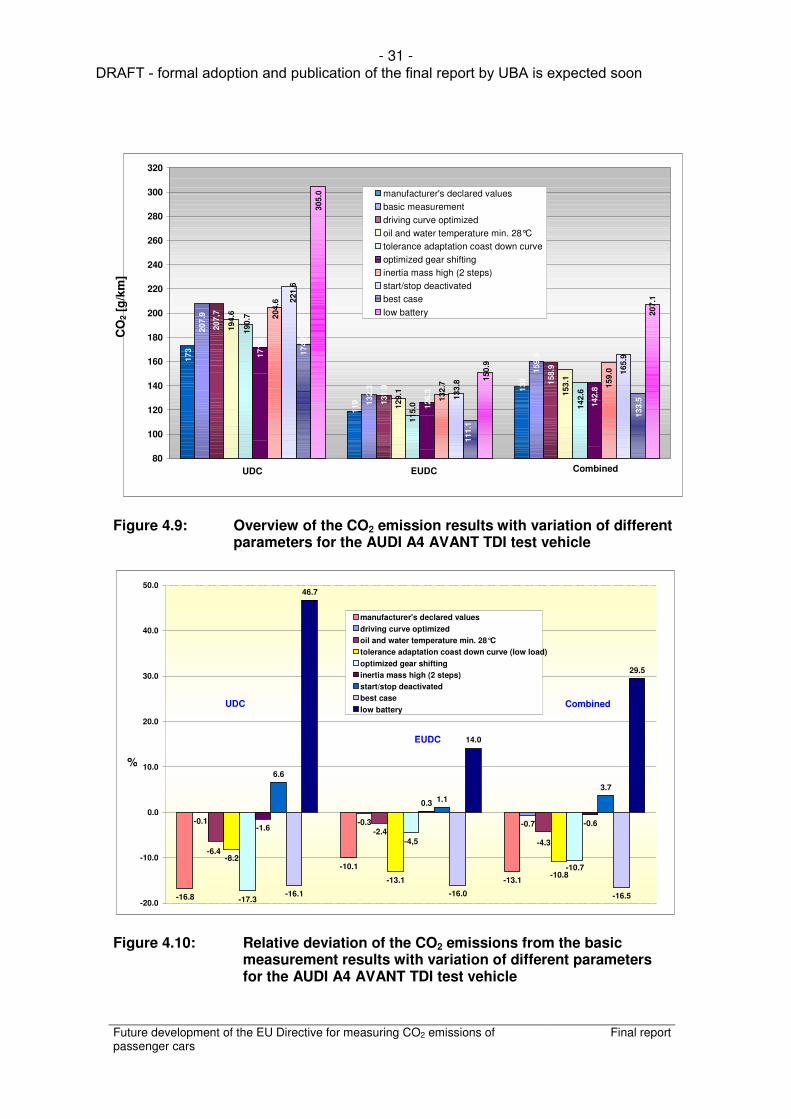
Table 4.5: Test results for AUDI A4 AVANT TDI The lowest CO2 emissions for the AUDI A4 AVANT TDI test vehicle were obtained by optimizing all the variable parameters for type approval testing. A significant reduction in carbon dioxide emissions was also determined with a reduced load setting, increased conditioning temperature and optimized gear shifting. The highest values were measured with the battery partially discharged before testing. The absolute test results and the relative deviations from the basic measurement results are shown in Figures 4.9 and 4.10.
DRAFT - formal adoption and publication of the final report by UBA is expected soon
- 31 -
Future development of the EU Directive for measuring CO2 emissions of passenger cars
Final report
Figure 4.9: Overview of the CO2 emission results with variation of different
parameters for the AUDI A4 AVANT TDI test vehicle
Figure 4.10: Relative deviation of the CO2 emissions from the basic
measurement results with variation of different parameters for the AUDI A4 AVANT TDI test vehicle
17
3
11
9
13
9
20
7.9
13
2.3
15
9.9
20
7,7
13
1.9 15
8.9
19
4.6
12
9.1
15
3.1
19
0.7
11
5.0
14
2.6
17
1.8
12
6.3
14
2.8
20
4.6
13
2.7
15
9.0
16
5.9
13
3.8
22
1.6
13
3.5
11
1.1
17
4.5
20
7.1
15
0.9
30
5.0
80
100
120
140
160
180
200
220
240
260
280
300
320
CO
2 [
g/k
m]
manufacturer's declared values basic measurement driving curve optimized oil and water temperature min. 28°C tolerance adaptation coast down curve optimized gear shifting inertia mass high (2 steps) start/stop deactivated best case low battery
UDC EUDC Combined
-16.8
-10.1 -13.1
-0.1 -0.3 -0.7 -2.4
-8.2
-13.1 -17.3
-4,5 -1.6
0.3
-0.6
6.6
1.1 3.7
-16.1 -16.0 -16.5
46.7
29.5
-4.3 -6.4
-10.8 -10.7
14.0
-20.0
-10.0
0.0
10.0
20.0
30.0
40.0
50.0
manufacturer's declared values driving curve optimized oil and water temperature min. 28°C tolerance adaptation coast down curve (low load) optimized gear shifting inertia mass high (2 steps) start/stop deactivated best case low battery
%
UDC
EUDC
Combined
DRAFT - formal adoption and publication of the final report by UBA is expected soon

- 32 -
Future development of the EU Directive for measuring CO2 emissions of passenger cars
Final report
4.6 Test Vehicle DAIMLER C 200 CDI
The technical data of the DAIMLER C 200 CDI test vehicle were as follows:
Manufacturer: DAIMLER
Vehicle type: 204 K
Model name: Daimler C200 CDI
Emission class: Euro 5
Mileage: 4,800 km
Engine model: 651913 (2.2 l)
Engine type: Diesel (direct injection / turbocharged)
Engine power output: 100 kW / 4600 rpm
Gearbox: manual gearbox, 6-speed (MT-6)
Tyre size: 225/45R17
Inertia mass: 1700 kg
The following tests were carried out on this test vehicle: • Basic measurement • Variation of the inertia mass (worst case) • Variation of driving resistance on the dynamometer • Influence of the driver, utilizing the tolerances of the driving curve • Conditioning to 28°C ambient temperature • Optimized measurement (best case: combination of low inertia mass, utilization of
the tolerances for adapting the driving resistance curve, increasing the water and oil temperature to 28°C and optimized driving inside the tolerance range of the NEDC)
• Variation of gear shifting • Partly discharged starter battery (“low battery”) The test results for the DAIMLER C 200 CDI are shown in Table 4.6.
DRAFT - formal adoption and publication of the final report by UBA is expected soon

- 33 -
Future development of the EU Directive for measuring CO2 emissions of passenger cars
Final report
Test results Deviation from basic measurement
CO2 emissions [g/km]
FC [l/100km]
CO2 emissions [%]
FC [%]
Measurement
UDC EUDC NEDC NEDC UDC EUDC NEDC NEDC
Manufacturer's values 186 124 146 5.6 -11.8 -7.3 -9.9 -8.9
Basic measurement 210.8 133.8 162 6.15 - - - -
Increased inertia mass 224.6 149.4 177 6.72 +6.5 +11.7 +9.3 +9.3
Reduced load 205.5 125.1 154.6 5.87 -2.5 -6.5 -4.6 -4.6
Influence of the driver 213.4 129.8 159.4 6.06 +1.2 -3.0 -1.6 -1.5
Conditioning to 28°C 208.5 133.1 160.8 6.11 -1.1 -0.5 -0.7 -0.7
Best case 199.2 122.2 149.5 5.68 -5.5 -8.7 -7.7 -7.6
Variation of gear shifting 175.9 130.5 147 5.58 -16.6 -2.5 -9.3 -9.3
Low battery 275.7 140.2 189.6 7.19 +30.8 +4.8 +17.0 +16.9
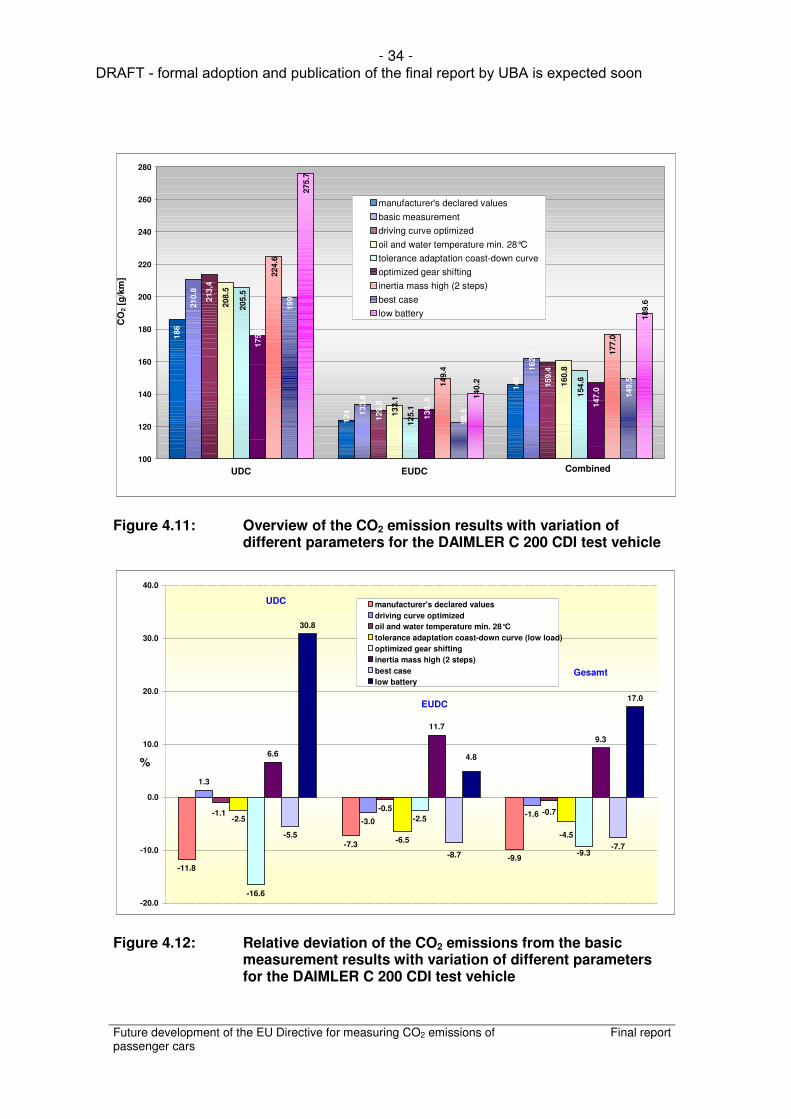
Table 4.6: Test results for DAIMLER C 200 CDI The lowest CO2 emissions for the DAIMLER C 200 CDI test vehicle were obtained by optimizing all the variable parameters for type approval testing. The highest values were measured with the battery partially discharged before testing. A significant reduction in carbon dioxide emissions was also determined with a reduced load setting and optimized gear shifting. The absolute test results and the relative deviations from the basic measurement results are shown in Figures 4.11 and 4.12.
DRAFT - formal adoption and publication of the final report by UBA is expected soon
- 34 -
Future development of the EU Directive for measuring CO2 emissions of passenger cars
Final report
Figure 4.11: Overview of the CO2 emission results with variation of
different parameters for the DAIMLER C 200 CDI test vehicle
Figure 4.12: Relative deviation of the CO2 emissions from the basic
measurement results with variation of different parameters for the DAIMLER C 200 CDI test vehicle
18
6
12
4
14
6
21
0.8
13
3.8
16
2.0
21
3,4
12
9,8
15
9.4
20
8.5
13
3.1
16
0.8
20
5.5
12
5.1
15
4.6
17
5.9
13
0..
5
14
7.0
22
4.6
14
9.4
17
7.0
14
9.5
98
.5
19
9.2
18
9.6
14
0.2
27
5.7
100
120
140
160
180
200
220
240
260
280
CO
2 [
g/k
m]
manufacturer's declared values basic measurement driving curve optimized oil and water temperature min. 28°C tolerance adaptation coast-down curve optimized gear shifting inertia mass high (2 steps) best case low battery
UDC EUDC Combined
-11.8
-7.3 -9.9
1.3
-3.0 -1.6 -0.5 -2.5
-6.5
-16.6
-2.5
6.6
11.7 9.3
-5.5 -7.7
30.8
17.0
-0.7 -1.1
-4.5 -9.3 -8.7
4.8
-20.0
-10.0
0.0
10.0
20.0
30.0
40.0 manufacturer's declared values driving curve optimized oil and water temperature min. 28°C tolerance adaptation coast-down curve (low load) optimized gear shifting inertia mass high (2 steps) best case low battery
%
UDC
EUDC
Gesamt
DRAFT - formal adoption and publication of the final report by UBA is expected soon

- 35 -
Future development of the EU Directive for measuring CO2 emissions of passenger cars
Final report
5 Evaluation
5.1 Parameters affecting CO2 measurements Table 5.1 provides an overview of the deviations of the CO2 emissions from the results of the basic measurement determined by varying the different parameters for the individual test vehicles. The results of the urban driving cycle (UDC), the extra-urban driving cycle (EUDC) and the entire New European Driving Cycle (NEDC) are shown separately. The effects of the individual parameters on the results of the CO2 measurements are presented and explained in the following paragraphs.
DRAFT - formal adoption and publication of the final report by UBA is expected soon

- 36 -
Deviation of the CO2 emissions from the basic measurement [%]
Petrol vehicles Diesel vehicles
1 2 3 4 5 6
Measurement
UDC EUDC NEDC UDC EUDC NEDC UDC EUDC NEDC UDC EUDC NEDC UDC EUDC NEDC UDC EUDC NEDC
Manufacturer's declared values
-8.1 -3.4 -6.1 -2.1 -1.1 -1.7 -18.0 -7.0 -12.6 +3.6 -4.4 -0.9 -16.8 -10.1 -13.1 -11.8 -7.3 -9.9
Increased inertia mass - - - -0.4 +0.9 +0.4 +0.6 +3.3 +2.0 +1.5 +3.9 +2.8 -1.6 +0.3 -0.6 +6.5 +11.7 +9.3
Reduced load - - - -1.9 -4.9 -3.4 -0.7 -3.3 -2.0 -5.1 -6.0 -5.6 -8.3 -13.1 -10.8 -2.5 -6.5 -4.6
Influence of the driver -0.7 0.0 -0.1 +0.6 -0.6 -0.5 +0.9 -1.2 -0.8 -0.1 -1.8 -1.5 -0.1 -0.3 -0.6 +1.2 -3.0 -1.6
Conditioning to 28°C +0.7 +0.8 +0.7 -9.3 +0.2 -4.3 -3.7 -1.8 -2.7 -3.8 -0.3 -1.8 -6.4 -2.4 -4.3 -1.1 -0.5 -0.7
Optimized measurement
- - - - - - -3.0 -2.6 -3.5 -2.4 -6.8 -5.3 -16.1 -16.0 -16.5 -5.5 -8.7 -7.7
Variation of gear shifting
23.9 * 11.2 * 17.4 * -22.6 -3.6 -12.7 -23.6 -6.5 -15.1 -13.1 -1.4 -6.6 -17.4 -4.5 -10.7 -16.6 -2.5 -9.3
Start-stop system deactivated
- - - - - - +2.8 -1.1 +0.9 - - - +6.6 +1.1 +3.8 - - -
Low battery
- - - - - - +35.1 +8.0 +21.7 +14.9 +3.6 +8.6 +46.7 +14.1 +29.5 +30.8 +4.8 +17.0
*) explanation see chapter 4.1
Table 5.1: Effect of the parameters on CO2 emissions over the NEDC for the different test vehicles
DRAFT - formal adoption and publication of the final report by UBA is expected soon
- 37 -
- 37 -
5.1.1 Basic Measurement
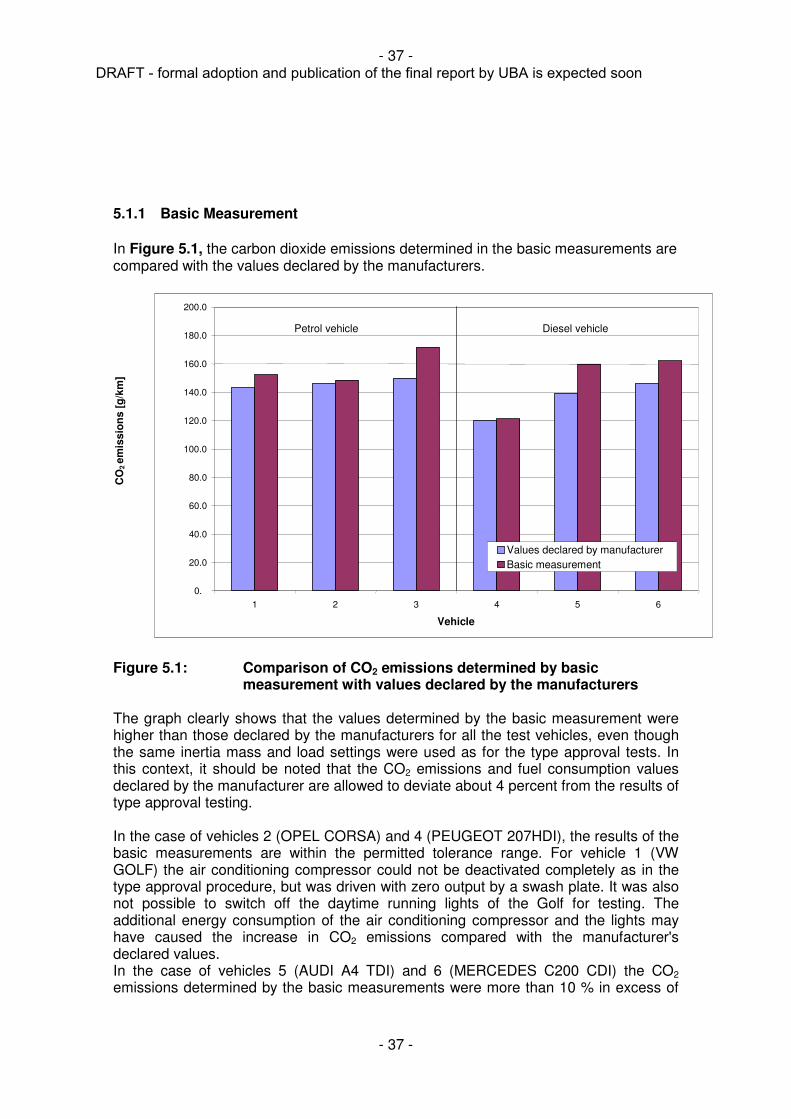
In Figure 5.1, the carbon dioxide emissions determined in the basic measurements are compared with the values declared by the manufacturers.
Figure 5.1: Comparison of CO2 emissions determined by basic measurement with values declared by the manufacturers
The graph clearly shows that the values determined by the basic measurement were higher than those declared by the manufacturers for all the test vehicles, even though the same inertia mass and load settings were used as for the type approval tests. In this context, it should be noted that the CO2 emissions and fuel consumption values declared by the manufacturer are allowed to deviate about 4 percent from the results of type approval testing. In the case of vehicles 2 (OPEL CORSA) and 4 (PEUGEOT 207HDI), the results of the basic measurements are within the permitted tolerance range. For vehicle 1 (VW GOLF) the air conditioning compressor could not be deactivated completely as in the type approval procedure, but was driven with zero output by a swash plate. It was also not possible to switch off the daytime running lights of the Golf for testing. The additional energy consumption of the air conditioning compressor and the lights may have caused the increase in CO2 emissions compared with the manufacturer's declared values. In the case of vehicles 5 (AUDI A4 TDI) and 6 (MERCEDES C200 CDI) the CO2 emissions determined by the basic measurements were more than 10 % in excess of
0.
20.0
40.0
60.0
80.0
100.0
120.0
140.0
160.0
180.0
200.0
1 2 3 4 5 6 Vehicle
CO
2 e
mis
sio
ns [
g/k
m]
Values declared by manufacturer Basic measurement
Petrol vehicle Diesel vehicle
DRAFT - formal adoption and publication of the final report by UBA is expected soon
- 38 -
Future development of the EU Directive for measuring CO2 emissions of passenger cars
Final report
the manufacturers' declared values. Values remotely approximating to those declared by the manufacturers were only measured during tests with all the optimization measures permitted by the Directive. The CO2 emissions determined by the basic measurement for vehicle 3 (BMW 320i) exceeded the declared values by 14 %. Even when all the optimization measures permitted for type approval were taken, the values declared by the manufacturer could not be reached. The results suggest that some vehicle manufacturers already take advantage of the possibilities allowed by the Directive to declare optimized values for CO2 emissions and fuel consumption. Another reason for the deviation from the manufacturers' declared values can be seen in the running-in condition of the test vehicle. Amendment Directive 2004/3/EC allows the test vehicles to be run in for 15,000 km. Discussions with car manufacturers indicate that carbon dioxide emissions and fuel consumption can be reduced quite significantly by appropriate running-in. Normally, manufacturers aim to run test vehicles in for 10,000 km before carrying out the fuel consumption measurements for type approval. It was not possible to run the test vehicles used for the investigation in for such distances. 5.1.2 Inertia Mass
In Figure 5.2 the CO2 emissions measured with inertia mass increased by 2 classes are compared with the results of the basic measurements.
DRAFT - formal adoption and publication of the final report by UBA is expected soon
- 39 -
Future development of the EU Directive for measuring CO2 emissions of passenger cars
Final report
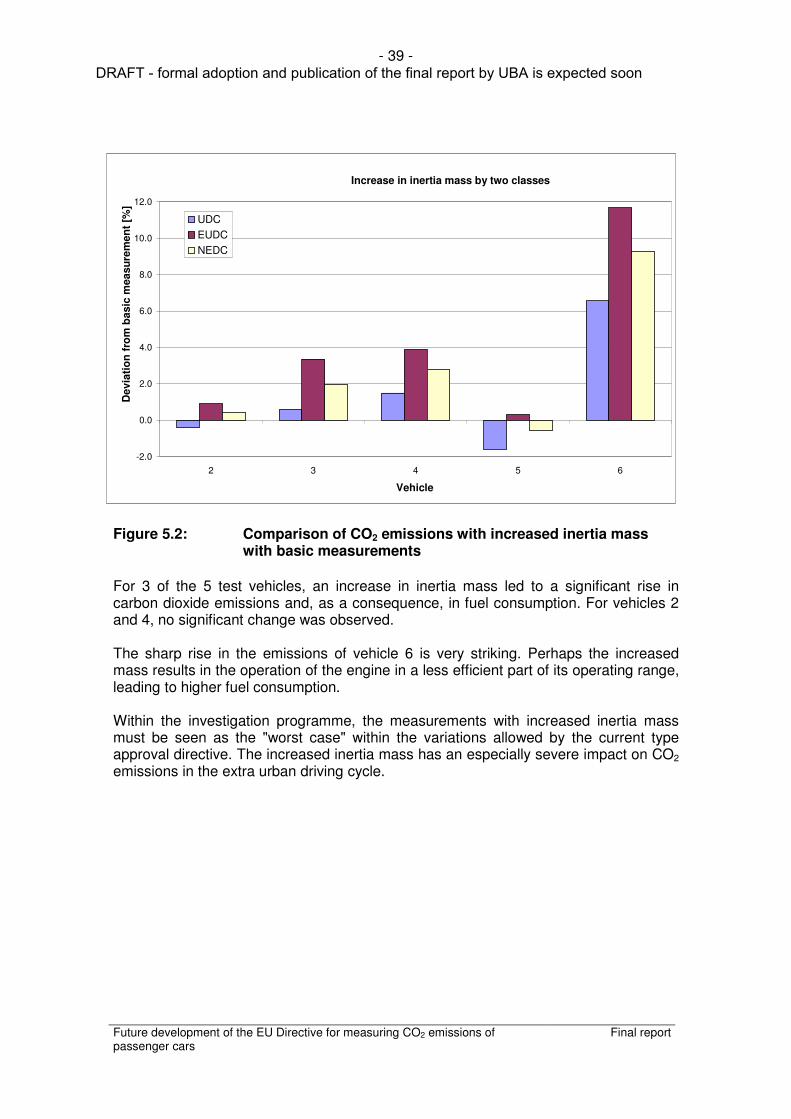
Figure 5.2: Comparison of CO2 emissions with increased inertia mass with basic measurements
For 3 of the 5 test vehicles, an increase in inertia mass led to a significant rise in carbon dioxide emissions and, as a consequence, in fuel consumption. For vehicles 2 and 4, no significant change was observed. The sharp rise in the emissions of vehicle 6 is very striking. Perhaps the increased mass results in the operation of the engine in a less efficient part of its operating range, leading to higher fuel consumption. Within the investigation programme, the measurements with increased inertia mass must be seen as the "worst case" within the variations allowed by the current type approval directive. The increased inertia mass has an especially severe impact on CO2 emissions in the extra urban driving cycle.
Increase in inertia mass by two classes
-2.0
0.0
2.0
4.0
6.0
8.0
10.0
12.0
2 3 4 5 6 Vehicle
Devia
tio
n f
rom
basic
measu
rem
en
t [%
]
UDC EUDC NEDC
DRAFT - formal adoption and publication of the final report by UBA is expected soon
- 40 -
Future development of the EU Directive for measuring CO2 emissions of passenger cars
Final report
5.1.3 Driving Resistance
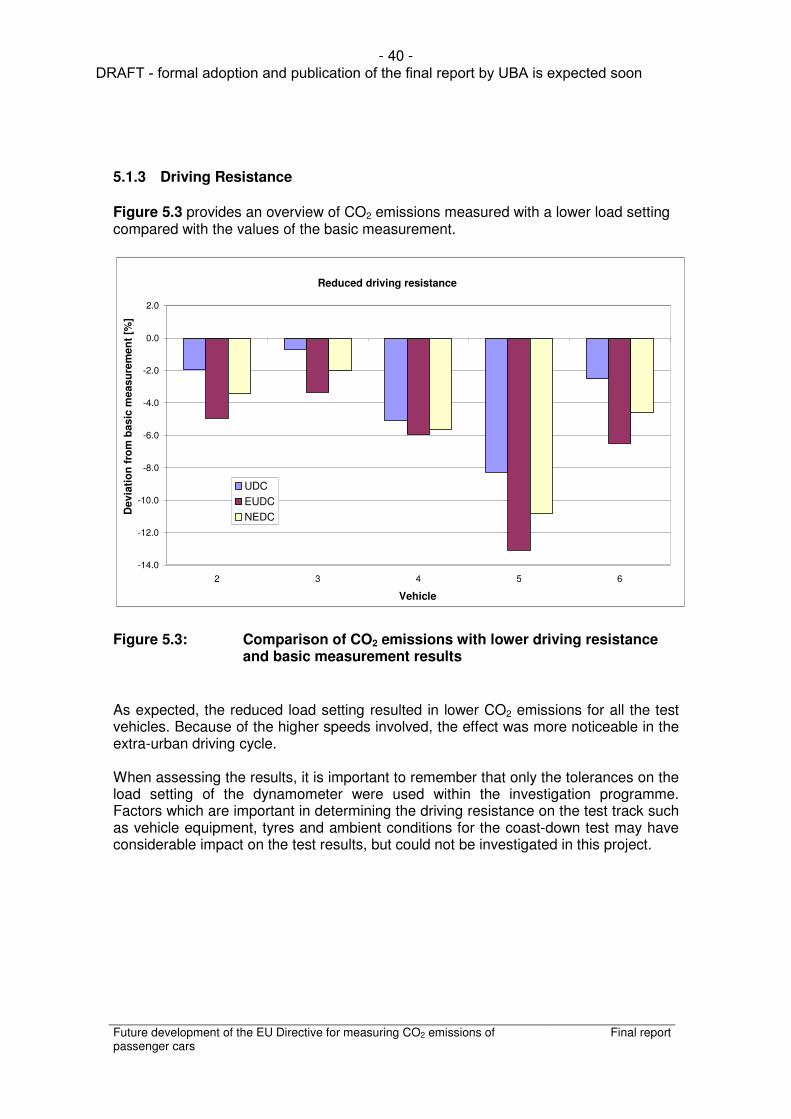
Figure 5.3 provides an overview of CO2 emissions measured with a lower load setting compared with the values of the basic measurement.
Figure 5.3: Comparison of CO2 emissions with lower driving resistance
and basic measurement results
As expected, the reduced load setting resulted in lower CO2 emissions for all the test vehicles. Because of the higher speeds involved, the effect was more noticeable in the extra-urban driving cycle. When assessing the results, it is important to remember that only the tolerances on the load setting of the dynamometer were used within the investigation programme. Factors which are important in determining the driving resistance on the test track such as vehicle equipment, tyres and ambient conditions for the coast-down test may have considerable impact on the test results, but could not be investigated in this project.
Reduced driving resistance
-14.0
-12.0
-10.0
-8.0
-6.0
-4.0
-2.0
0.0
2.0
2 3 4 5 6 Vehicle
Devia
tio
n f
rom
basic
measu
rem
en
t [%
]
UDC EUDC NEDC
DRAFT - formal adoption and publication of the final report by UBA is expected soon
- 41 -
Future development of the EU Directive for measuring CO2 emissions of passenger cars
Final report
5.1.4 Influence of the Driver
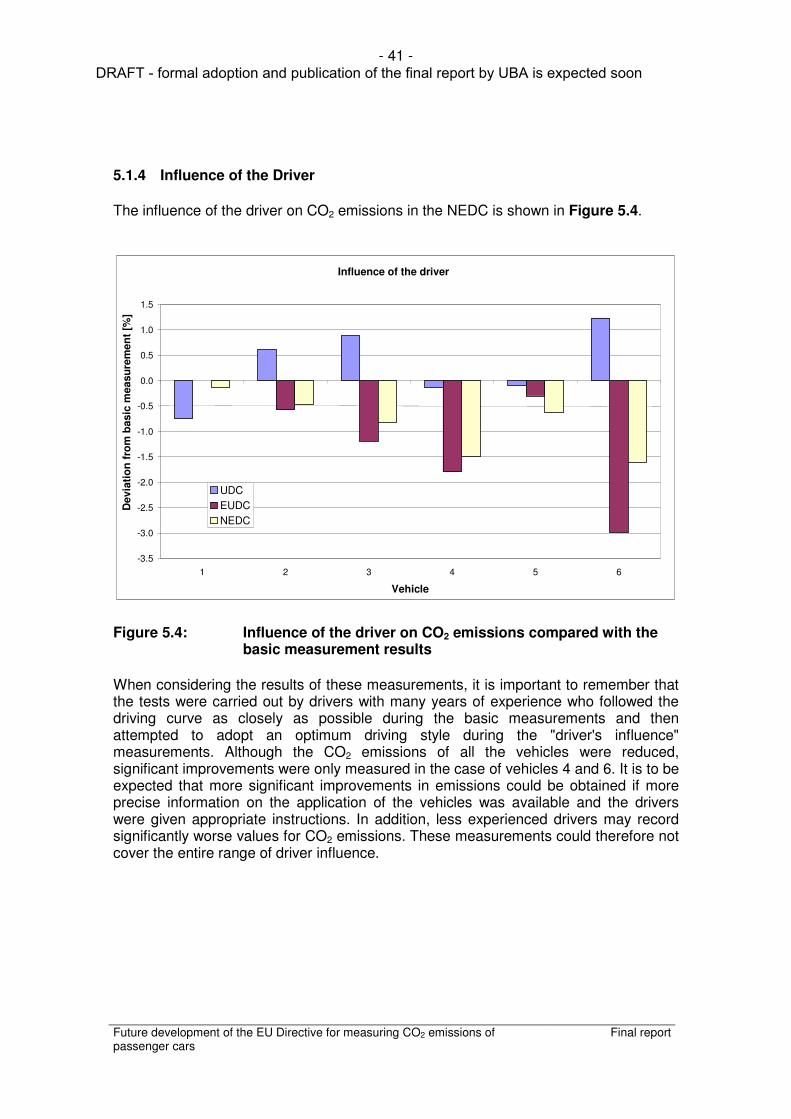
The influence of the driver on CO2 emissions in the NEDC is shown in Figure 5.4.
Figure 5.4: Influence of the driver on CO2 emissions compared with the
basic measurement results
When considering the results of these measurements, it is important to remember that the tests were carried out by drivers with many years of experience who followed the driving curve as closely as possible during the basic measurements and then attempted to adopt an optimum driving style during the "driver's influence" measurements. Although the CO2 emissions of all the vehicles were reduced, significant improvements were only measured in the case of vehicles 4 and 6. It is to be expected that more significant improvements in emissions could be obtained if more precise information on the application of the vehicles was available and the drivers were given appropriate instructions. In addition, less experienced drivers may record significantly worse values for CO2 emissions. These measurements could therefore not cover the entire range of driver influence.
Influence of the driver
-3.5
-3.0
-2.5
-2.0
-1.5
-1.0
-0.5
0.0
0.5
1.0
1.5
1 2 3 4 5 6 Vehicle
Devia
tio
n f
rom
basic
measu
rem
en
t [%
]
UDC EUDC NEDC
DRAFT - formal adoption and publication of the final report by UBA is expected soon
- 42 -
Future development of the EU Directive for measuring CO2 emissions of passenger cars
Final report
5.1.5 Ambient Conditions
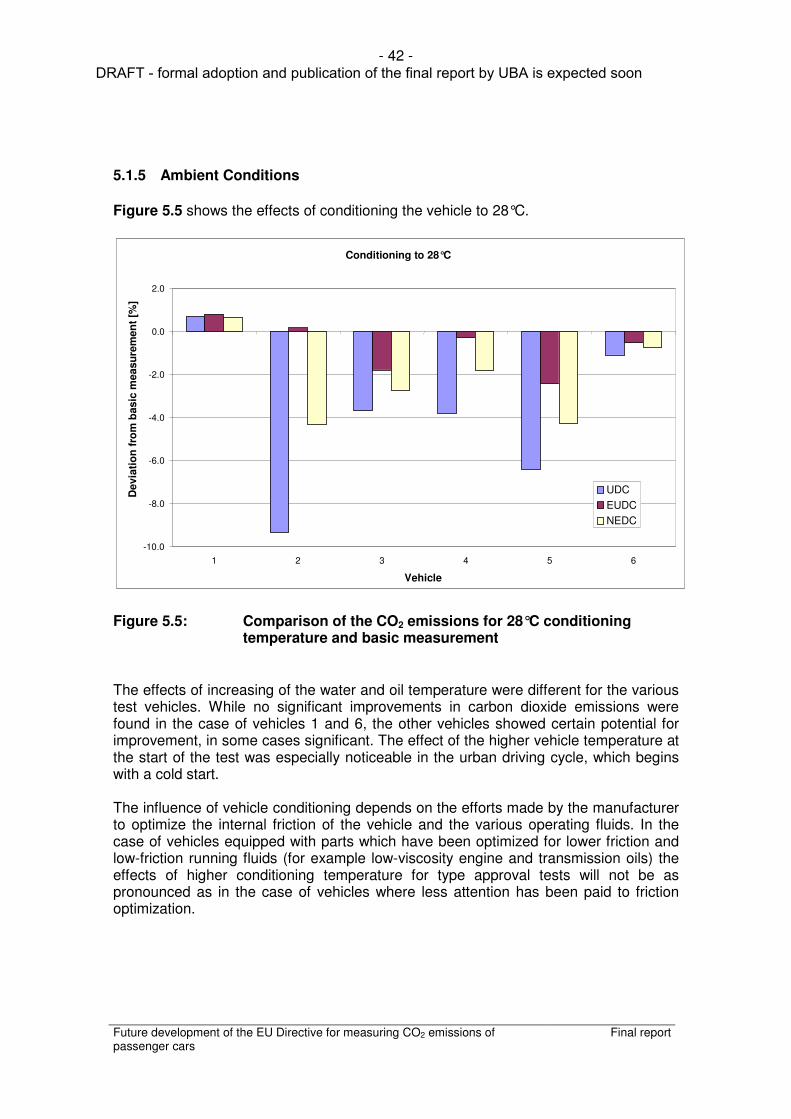
Figure 5.5 shows the effects of conditioning the vehicle to 28°C.
Figure 5.5: Comparison of the CO2 emissions for 28°C conditioning
temperature and basic measurement
The effects of increasing of the water and oil temperature were different for the various test vehicles. While no significant improvements in carbon dioxide emissions were found in the case of vehicles 1 and 6, the other vehicles showed certain potential for improvement, in some cases significant. The effect of the higher vehicle temperature at the start of the test was especially noticeable in the urban driving cycle, which begins with a cold start. The influence of vehicle conditioning depends on the efforts made by the manufacturer to optimize the internal friction of the vehicle and the various operating fluids. In the case of vehicles equipped with parts which have been optimized for lower friction and low-friction running fluids (for example low-viscosity engine and transmission oils) the effects of higher conditioning temperature for type approval tests will not be as pronounced as in the case of vehicles where less attention has been paid to friction optimization.
Conditioning to 28°C
-10.0
-8.0
-6.0
-4.0
-2.0
0.0
2.0
1 2 3 4 5 6 Vehicle
Devia
tio
n f
rom
basic
measu
rem
en
t [%
]
UDC EUDC NEDC
DRAFT - formal adoption and publication of the final report by UBA is expected soon

- 43 -
Future development of the EU Directive for measuring CO2 emissions of passenger cars
Final report
5.1.6 Best Case
Figure 5.6 shows the reduction in CO2 emissions measured by optimizing the various conditions for type approval testing.
Figure 5.6: CO2 emissions for low inertia mass, low load setting,
optimized driving behaviour and conditioning to 28°C compared with the basic measurement
The combination of low inertia mass and reduced driving resistance, the use of the permitted tolerances on the driving curve by the driver and the conditioning of the vehicles to 28°C ambient temperature leads to noticeably reduced CO2 emissions compared with the basic measurement. In the case of vehicle 5, carbon dioxide emissions were reduced by about 16% by taking the optimization measures allowed for type approval testing. The results show that parameters for type approval testing must be precisely defined in order to ensure that the type approval values are reproducible and comparable.
Best case
-18.0
-16.0
-14.0
-12.0
-10.0
-8.0
-6.0
-4.0
-2.0
0.0
2.0
3 4 5 6 Vehicle
Devia
tio
n f
rom
basic
measu
rem
en
t [%
]
UDC EUDC NEDC
DRAFT - formal adoption and publication of the final report by UBA is expected soon

- 44 -
Future development of the EU Directive for measuring CO2 emissions of passenger cars
Final report
5.1.7 Gear Shifting
Figure 5.7 shows the effect of gear shift points on CO2 emissions. The graph compares the carbon dioxide emissions determined with optimized gear shift points with the basic measurement results. Vehicle 1 was equipped with a DSG dual-clutch transmission. During type approval testing, the transmission was operated in the automatic mode. For this vehicle, it was assumed that the manufacturer had optimized the gear shift points for the automatic mode. As a basis for comparison, additional measurements were made with the DSG operated manually, using the NEDC shift points for manual gearboxes.
Figure 5.7: Comparison of CO2 emissions obtained with optimized gear
shift points and the basic measurement results
The diagram shows that a significant reduction in carbon dioxide emissions can be obtained using optimized gear shift points because of the lower engine speeds involved. However, this option is currently only available for vehicles with automatic gearboxes or hybrid drive trains and gear shift indicators. Especially in the urban driving cycle, the optimization of gear shift points offers considerable potential for reducing CO2 emissions. In the case of vehicle 3, emissions in the UDC were some 20% lower than in the basic measurement. In the EUDC relatively low engine speeds are used (50 km/h in 4th gear, 70 km/h in 5th gear, for speeds above 70km/h a higher gear if the manufacturer recommends) and the saving potential is therefore lower.
Optimization of gear shifting
-28.0
-23.0
-18.0
-13.0
-8.0
-3.0
2.0
1 2 3 4 5 6 Vehicle
Devia
tio
n f
rom
basic
measu
rem
en
t [%
]
UDC EUDC NEDC
DRAFT - formal adoption and publication of the final report by UBA is expected soon

- 45 -
Future development of the EU Directive for measuring CO2 emissions of passenger cars
Final report
Furthermore, the results suggest that the reduction which can be obtained by using optimized gear shifting is higher for spark ignition engines than for compression ignition engines. This is explained by the fact that diesel engines are designed for use at lower engine speeds than petrol engines because of the high torque available at low engine speeds. 5.1.8 Start-Stop System
Figure 5.8 shows the influence of a start-stop system on CO2 emissions over the New European Driving Cycle.
Figure 5.8: Comparison of CO2 emissions without start-stop system and
basic measurement results
As a result of the considerable time spent at idling speed in urban driving, the start-stop function reduces both carbon dioxide emissions and fuel consumption during the UDC. In contrast, the start-stop system only slightly reduces consumption during the EUDC. Even when the start-stop system is activated, the engine is only stopped under defined conditions. For example, the engine is not stopped if cooling water and catalytic converter temperature is too low. The NEDC begins with a cold start, which means that the engine only reaches the operating temperature required in the course of the UDC. Depending on the effort made by the manufacturer, different fuel consumption savings can therefore be achieved in the driving cycle.
Start-stop system deactivated
-2.0
-1.0
0.0
1.0
2.0
3.0
4.0
5.0
6.0
7.0
3 5 Vehicle
Devia
tio
n f
rom
basic
measu
rem
en
t [%
]
UDC EUDC NEDC
DRAFT - formal adoption and publication of the final report by UBA is expected soon

- 46 -
Future development of the EU Directive for measuring CO2 emissions of passenger cars
Final report
5.1.9 Battery State of Charge Figure 5.9 shows the effect of the battery state of charge on CO2 emissions. For the measurements the starter battery was discharged before starting the test to ensure higher energy demand for battery charging during the NEDC. These measurements allow the effect of additional electrical equipment on carbon dioxide emissions to be assessed.
Figure 5.9: CO2 emissions for low battery charge compared with basic
measurement results
In general, the higher energy demand for battery charging is reflected directly by carbon dioxide emissions. However, the effects for the individual test vehicles are very different. The 40 % increase in fuel consumption in the UDS for vehicle 5 is especially striking. Some manufacturers already install intelligent systems which charge the battery when the vehicle is on the overrun, allowing kinetic energy to be converted into electric power, which results in lower fuel consumption and carbon dioxide emissions.
Low battery charge
-10.0
0.0
10.0
20.0
30.0
40.0
50.0
3 4 5 6 Vehicle
Devia
tio
n f
rom
basic
measu
rem
en
t [%
]
UDC EUDC NEFZ
DRAFT - formal adoption and publication of the final report by UBA is expected soon

- 47 -
Future development of the EU Directive for measuring CO2 emissions of passenger cars
Final report
6 Recommendations for the Future Development of the EU Directive Table 6.1 gives an overview of the effects of the various parameters investigated on CO2 emissions measured in the NEDC.
Parameter Measuring conditions Effect on CO2 emissions
Inertia mass Increase of about 2 classes in inertia mass Increase of up to 10%
Driving resistance Reduction in the load setting of about 20% at 20 km/h and about 10% from 40 km/h to 120 km/h
Reduction of up to 11%
Influence of the driver Use of the tolerances on the driving curve Increase/reduction of up to 2%
Ambient conditions Conditioning of the vehicle to 28°C for at least 6 hours before starting the test
Reduction of up to 4%
Optimized measurement Inertia mass in accordance with type approval conditions, lower load setting, use of the tolerances on the driving curve, conditioning to 28°C, gear shifting in accordance with the Directive, start-stop system activated, starter battery fully charged
Reduction of up to 17%
Gear shifting Optimized gear shift points Reduction of up to15%
Start-stop system Deactivating the start-stop system Increase of up to 4%
Low battery Battery charging during tests Increase of up to 30%
Table 6.1: Influence of the various parameters on the
CO2 emissions determined for type approval
In order to indicate the possible range of CO2 emissions determined for type approval, Figure 6.1 shows the worst case with increased inertia mass compared with the basic measurement and the best case, with a combination of all the optimization measures considered.
DRAFT - formal adoption and publication of the final report by UBA is expected soon
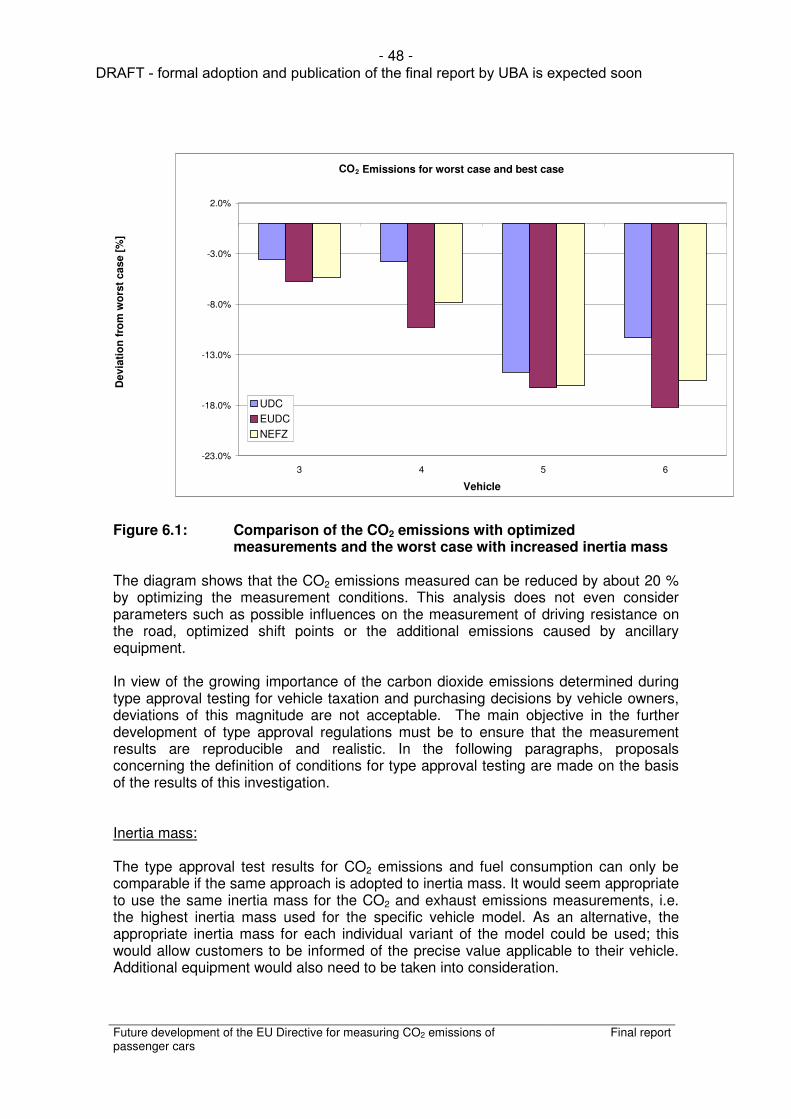
- 48 -
Future development of the EU Directive for measuring CO2 emissions of passenger cars
Final report
Figure 6.1: Comparison of the CO2 emissions with optimized
measurements and the worst case with increased inertia mass The diagram shows that the CO2 emissions measured can be reduced by about 20 % by optimizing the measurement conditions. This analysis does not even consider parameters such as possible influences on the measurement of driving resistance on the road, optimized shift points or the additional emissions caused by ancillary equipment. In view of the growing importance of the carbon dioxide emissions determined during type approval testing for vehicle taxation and purchasing decisions by vehicle owners, deviations of this magnitude are not acceptable. The main objective in the further development of type approval regulations must be to ensure that the measurement results are reproducible and realistic. In the following paragraphs, proposals concerning the definition of conditions for type approval testing are made on the basis of the results of this investigation. Inertia mass: The type approval test results for CO2 emissions and fuel consumption can only be comparable if the same approach is adopted to inertia mass. It would seem appropriate to use the same inertia mass for the CO2 and exhaust emissions measurements, i.e. the highest inertia mass used for the specific vehicle model. As an alternative, the appropriate inertia mass for each individual variant of the model could be used; this would allow customers to be informed of the precise value applicable to their vehicle. Additional equipment would also need to be taken into consideration.
CO 2 Emissions for worst case and best case
-23.0%
-18.0%
-13.0%
-8.0%
-3.0%
2.0%
3 4 5 6 Vehicle
Devia
tio
n f
rom
wo
rst
case [
%]
UDC EUDC NEFZ
DRAFT - formal adoption and publication of the final report by UBA is expected soon
- 49 -
Future development of the EU Directive for measuring CO2 emissions of passenger cars
Final report
Driving resistance: The driving resistance of the test vehicle has a decisive impact on the results of the emission type approval tests. The current regulations allow tolerances on load adjustment of ±5 % in the upper speed range (120 km/h to 40 km/h) and ±10 % in the lower speed range (20 km/h) with reference to the values determined on the test track. For practicability reasons, it would not be feasible to reduce these tolerances. More important in this context are the parameters for driving resistance measurement on the test track. Further investigations would be necessary to assess the effects of parameters such as tyres (size and tread), tyre pressure, ambient conditions and the surface of the test circuit. Influence of the driver: The New European Driving Cycle defined by Amendment Directive 98/69/EC allows certain tolerances on the driving curve. Maximum deviations of +/- 2 km/h and +/- 1.0 seconds from the target curve are allowed. These investigations have suggested that the driver only has a small influence on the test result compared with other parameters. Nevertheless, for the further development of the Directive, it is important to remember that the tolerances on the driving curve should not be increased. As a general principle, the target curve should be followed; even within the tolerance band, justification should be provided for any deviations. Conditioning: Before the measurements in the driving cycle are started, the test vehicle is conditioned to ambient temperatures for a minimum of six hours to simulate a cold start. The results of this investigation suggest that higher ambient temperatures mainly benefit vehicles where little attention has been paid to friction optimization and low-viscosity operating fluids during design and production. To establish comparable conditions for type approval testing, conditioning should be carried out for at least six hours in such a way that the oil and water temperatures are within a range of 25°C ± 2°C before starting the test. Gear shifting: Optimized gear shift points have considerable impact on CO2 emissions and fuel consumption. In the case of vehicles with automatic transmissions or hybrid drivetrains and gear shift indicators, the manufacturer can define the shift points to be used during the NEDC. In order to establish comparable conditions for type approval testing, the manufacturer should also be allowed to use gear shift indicators on conventional manual vehicles and the shift points defined in the driving curve should be omitted to adapt the procedure to the state of the art.
DRAFT - formal adoption and publication of the final report by UBA is expected soon
- 50 -
Future development of the EU Directive for measuring CO2 emissions of passenger cars
Final report
Start-stop system: A start-stop system has positive effects on carbon dioxide emissions and fuel consumption. To demonstrate the advantages of this technology, the start-stop system should also be used during type approval testing. The regulations currently in force allow the tests to be conducted with the start-stop system activated. State of charge of the starter battery: The state of charge of the starter battery at the start of the test has considerable impact on the results of type approval testing. Currently, the state of charge required before starting tests is not defined. It is difficult and time-consuming to determine the state of charge. In addition to the state of charge, the state of health (SOH) of the battery is a decisive parameter. The battery state of charge can be determined on the basis of the acid density measured using reference electrodes on or in the battery. Special electrical pulses can also be applied to the battery; the reaction of the battery gives an indication of the state of charge. However, it is difficult to generate these pulses in a vehicle. Another possibility is the integration of the electric current delivered by the battery over time. However, this method accumulates any errors which may occur. A reliable integration of electric current is only possible if a starting value is initialized and this starting value must be determined by an appropriate method, which is very time-consuming. The inaccuracy of the current measurement results in a drift, which must be compensated, over the course of time. In order to compensate this drift, it is necessary to set the battery to defined conditions, which occur very seldom in a vehicle. In order to harmonize the conditions for the type approval procedure, it should be specified that the tests are to be started with fully charged battery. During the tests, the charge current should be monitored to ensure that the vehicle is not designed so that the battery is mainly discharged during the tests, which would falsify the test results. When evaluating the measurements, the charge current should be taken into consideration in the calculation of the CO2 emissions, an approach which is already adopted for hybrid vehicles which cannot be externally charged. Furthermore, the results of the measurements with low charge indicate the considerable impact of electrical ancillaries on carbon dioxide emissions and fuel consumption. Currently, this energy consumption is not taken into account during type approval testing. As a result, it is difficult to assess actual fuel consumption during vehicle use, as the manufacturer only states that the fuel consumption may be higher as a result of additional equipment installed. An additional test to assess the ancillaries would appear appropriate in order to provide customers with information on the actual fuel consumption of their vehicles and to promote the development of more efficient systems. In the USA, an additional test is already carried out to assess the energy efficiency of air conditioning systems. The proposals are summarized in Table 6.2.
DRAFT - formal adoption and publication of the final report by UBA is expected soon
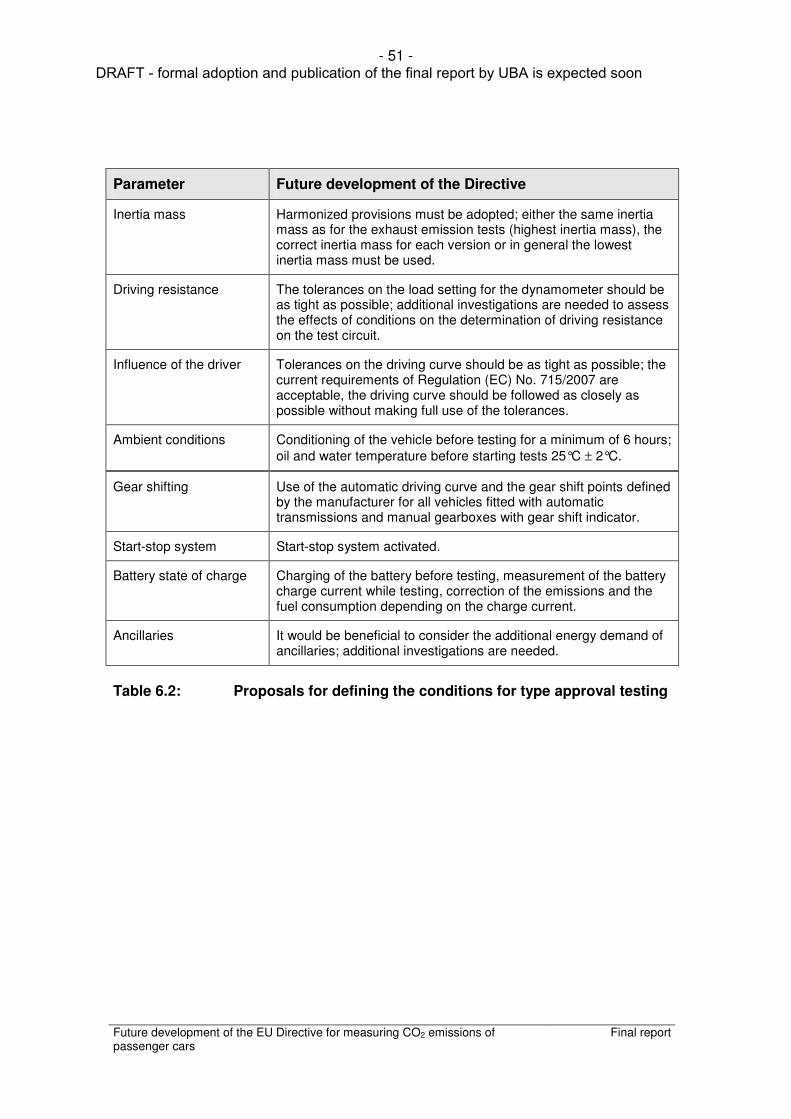
- 51 -
Future development of the EU Directive for measuring CO2 emissions of passenger cars
Final report
Parameter Future development of the Directive
Inertia mass Harmonized provisions must be adopted; either the same inertia mass as for the exhaust emission tests (highest inertia mass), the correct inertia mass for each version or in general the lowest inertia mass must be used.
Driving resistance The tolerances on the load setting for the dynamometer should be as tight as possible; additional investigations are needed to assess the effects of conditions on the determination of driving resistance on the test circuit.
Influence of the driver Tolerances on the driving curve should be as tight as possible; the current requirements of Regulation (EC) No. 715/2007 are acceptable, the driving curve should be followed as closely as possible without making full use of the tolerances.
Ambient conditions Conditioning of the vehicle before testing for a minimum of 6 hours; oil and water temperature before starting tests 25°C ± 2°C.
Gear shifting Use of the automatic driving curve and the gear shift points defined by the manufacturer for all vehicles fitted with automatic transmissions and manual gearboxes with gear shift indicator.
Start-stop system Start-stop system activated.
Battery state of charge Charging of the battery before testing, measurement of the battery charge current while testing, correction of the emissions and the fuel consumption depending on the charge current.
Ancillaries It would be beneficial to consider the additional energy demand of ancillaries; additional investigations are needed.
Table 6.2: Proposals for defining the conditions for type approval testing
DRAFT - formal adoption and publication of the final report by UBA is expected soon

- 52 -
Future development of the EU Directive for measuring CO2 emissions of passenger cars
Final report
7 Summary / Conclusion The carbon dioxide emissions measured during type approval testing are used as a basis for the taxation of motor vehicles and play a key role in car-buyers' purchasing decisions. It is therefore important to ensure that these measurements are comparable and realistic. In this research programme the CO2 emissions and fuel consumptions of six different passenger cars were determined on a dynamometer under type approval testing conditions in accordance with Directive 80/1268/EC and Regulation (EC) No. 715/2007. For the measurements, different parameters were varied to evaluate their influence on type approval test results. These results were compared with the results of basic tests under defined conditions (see Section 3.1 above). In some cases, different factors were considered for the individual test vehicles. In order to obtain statistically well-founded results, at least three measurements were made for each variant. The following parameters were investigated: • variation of the inertia mass • variation of the driving resistance on the dynamometer • influence of the driver, using the allowed tolerances on the driving curve • conditioning of the vehicle • optimized measurement • variation of gear shift points • automatic start-stop function • partially discharged starter battery ("low battery") The CO2 emissions of two of the test vehicles determined by the basic measurements carried out with the vehicles "as delivered" were within the permitted tolerances of 4% with reference to the manufacturers' declared values. For another of the test vehicles, the deviation of the measured CO2 emissions from the values declared by the manufacturer can be explained by the additional energy consumption of ancillaries which could not be deactivated for the tests. For another two vehicles the CO2 emissions determined by the basic measurement exceeded the manufacturers' declared values by more than 10%. Figures remotely approximating to those declared by the manufacturers could only be obtained by taking all the optimization measures considered during the programme. For a further vehicle, the CO2 emissions determined by the basic measurement were 14% above the values declared by the manufacturer. It was not possible to reach the declared values even by taking all the optimization measures allowed by the Directive for type approval testing. These results show that some vehicle manufacturer are already taking advantage of the leeway allowed by the Directive to declare optimized CO2 emissions and fuel consumption figures.
DRAFT - formal adoption and publication of the final report by UBA is expected soon
- 53 -
Future development of the EU Directive for measuring CO2 emissions of passenger cars
Final report
The results of this programme clearly show that optimized CO2 emissions and fuel consumption figures can be obtained in type approval testing if the vehicle is appropriately prepared and the conditions for measurement are appropriately selected. The variation of different parameters showed that CO2 reductions of the order of 20% can be reached by optimized type approval testing. In this context, parameters such as influences on the determination of driving resistance measurement on the test circuit, optimized gear shift points, and additional emissions caused by ancillaries have not even been taken into consideration. In view of the growing importance of the carbon dioxide emissions determined during type approval testing for vehicle taxation and purchasing decisions by vehicle owners, deviations of this magnitude are not acceptable. The main objective in the further development of type approval regulations must be to ensure that the measurement results are reproducible and realistic. The comparability of the type approval test results can be improved considerably, especially by adopting standard provisions on inertia mass, reducing the tolerances for load setting on the dynamometer and the driving curve, and introducing a requirement to set the oil and water temperature to 25°C ± 2°C before starting the test. In order to make the type approval test conditions approximate more closely to reality, the possibility of a free choice of gear shift points for vehicles with manual transmission must be discussed. A gear shift indicator on the vehicle dashboard could pave the way for this approach and allow the development of gear ratios which would ensure lower carbon dioxide emissions, not only during type approval testing. The state of charge of the starter battery at the start of the tests has considerable impact on the results of type approval testing. To standardize conditions for the type approval tests, a requirement for the tests to be started with fully charged battery should be introduced. The charge current should be taken into consideration in the calculation of the CO2 emissions, an approach which is already adopted for hybrid vehicles which cannot be externally charged. The effect of different parameters on driving resistance measurement on the test track is very important in this context. It was not possible to consider these factors during the investigation programme Further investigations would be necessary to assess the effects of parameters such as tyres (size and tread), tyre pressure, ambient conditions and the surface of the test circuit on the driving resistance measured. Electrical ancillaries may have considerable impact on carbon dioxide emissions and fuel consumption. Currently, this energy consumption is not taken into account during type approval testing. An additional test to assess the ancillaries would appear appropriate in order to provide customers with information on the actual fuel consumption of their vehicles and to promote the development of more efficient systems. Further investigations will be necessary to assess the impact of ancillaries on carbon dioxide emissions.
DRAFT - formal adoption and publication of the final report by UBA is expected soon

- 54 -
Future development of the EU Directive for measuring CO2 emissions of passenger cars
Final report
8 References /1/ White paper: European transport policy for 2010: time to decide; European
Commission, 2001
/2/ Official Journal of the European Union
Regulation (EC) No 443/2009 of the European Parliament and of the Council of 23 April 2009 setting emission performance standards for new passenger cars as part of the Community’s integrated approach to reduce CO2 emissions from light-duty vehicles
/3/ Federal Office for Motor Traffic (KBA)
Data of the year 2009 in an overview
/4/ Official Journal of the European Union
Directive 80/1268/EEC including all amendments up to 2004/3/EC
/5/ Official Journal of the European Union
Directive 70/220/EEC including all amendments up to 2006/96/EC
/6/ Official Journal of the European Union
Regulation (EC) No 715/2007 of the European Parliament and of the Council on type approval of motor vehicles with respect to emissions from light passenger and commercial vehicles (Euro 5 and Euro 6) and on access to vehicle repair and maintenance information
/7/ Federal Office for Motor Traffic (KBA)
Press release No. 1/2009; vehicle registrations in December 2008
/8/ Federal Office for Motor Traffic (KBA)
Press release No. 1/2010; vehicle registrations in December 2009
/9/ Federal Office for Motor Traffic (KBA)
Fuel Consumption and Emissions Type Approval Values for Motor Vehicles with a National or EC Whole Vehicle Type Approval, 20th Edition, State: 1st March 2010
/10/ Official Journal of the European Union
Directive 92/21/EWG including all amendments up to 95/48/EC
/11/ Economic Commission for Europe
Regulation No 83 of the Economic Commission for Europe of the United Nations (UNECE) — Uniform provisions concerning the approval of vehicles with regard to the emission of pollutants according to engine fuel requirements
/12/ Federal Office for Motor Traffic (KBA)
Registrations of new passenger cars 2009 by manufacturers, trade name, selected features and displacement classes
DRAFT - formal adoption and publication of the final report by UBA is expected soon