DRAFT ENVIRONMENTAL BASELINE STUDIES...
46
DRAFT ENVIRONMENTAL BASELINE STUDIES PROPOSED 2007 STUDY PLANS CHAPTER 5. GROUNDWATER HYDROLOGY DRAFT SEPTEMBER 2007
Transcript of DRAFT ENVIRONMENTAL BASELINE STUDIES...
DRAFT ENVIRONMENTAL BASELINE STUDIES PROPOSED 2007 STUDY PLANS
CHAPTER 5. GROUNDWATER HYDROLOGY
DDRRAAFFTT
SSEEPPTTEEMMBBEERR 22000077
DRAFT GROUNDWATER HYDROLOGY
TABLE OF CONTENTS
TABLE OF CONTENTS............................................................................................................................5-i
LIST OF TABLES.....................................................................................................................................5-ii
LIST OF FIGURES ...................................................................................................................................5-ii
ACRONYMS AND ABBREVIATIONS .................................................................................................5-iii
5. GROUNDWATER HYDROLOGY ...................................................................................................5-1
5.1 Mine Study Area........................................................................................................................5-1 5.1.1 Objectives of Study ......................................................................................................5-1 5.1.2 Study Area/Scope .........................................................................................................5-2 5.1.3 Methods/Approach to the Groundwater Study .............................................................5-3 5.1.4 Current Status of Study.................................................................................................5-3
5.1.4.1 Field Program Responsibilities...................................................................5-3 5.1.4.2 Geologic Overview.....................................................................................5-4 5.1.4.3 Well and Piezometer Installations ..............................................................5-4 5.1.4.4 Hydraulic Conductivity Testing .................................................................5-5 5.1.4.5 Monitoring ..................................................................................................5-6 5.1.4.6 Other Data Collection Programs.................................................................5-6 5.1.4.7 Calculations and Models.............................................................................5-6
5.1.5 Major Activities............................................................................................................5-7 5.1.5.1 Field Work..................................................................................................5-7 5.1.5.2 Input to Tasks by Others...........................................................................5-10 5.1.5.3 Data Review and Analysis........................................................................5-12 5.1.5.4 Site-wide Water Balance ..........................................................................5-13 5.1.5.5 Site-wide Groundwater Model .................................................................5-13 5.1.5.6 Groundwater Model for the Pit and Underground Mine Areas ................5-14 5.1.5.7 Groundwater Model for the Tailings Area ...............................................5-15 5.1.5.8 Assessment for Class V Injection Wells...................................................5-15 5.1.5.9 Meetings ...................................................................................................5-16
5.1.6 References ..................................................................................................................5-16 5.2 Transportation Corridor ...........................................................................................................5-16
SP Ch5 GW Hydro Rev4.doc 5-i Rev. 4, 8/6/07
DRAFT ENVIRONMENTAL BASELINE STUDIES, PROPOSED 2007 STUDY PLANS DRAFT
LIST OF TABLES (attached)
Table 5.1-1, Study Summary for Groundwater Hydrology, Mine Study Area, 2004-2007
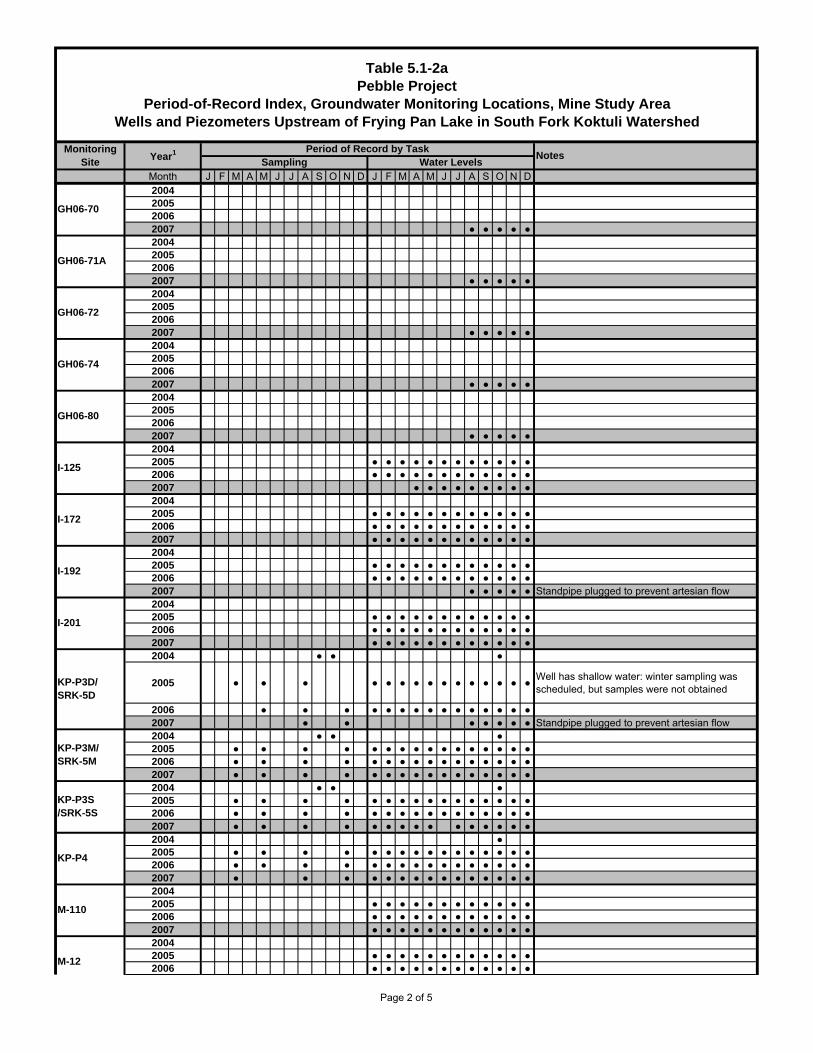
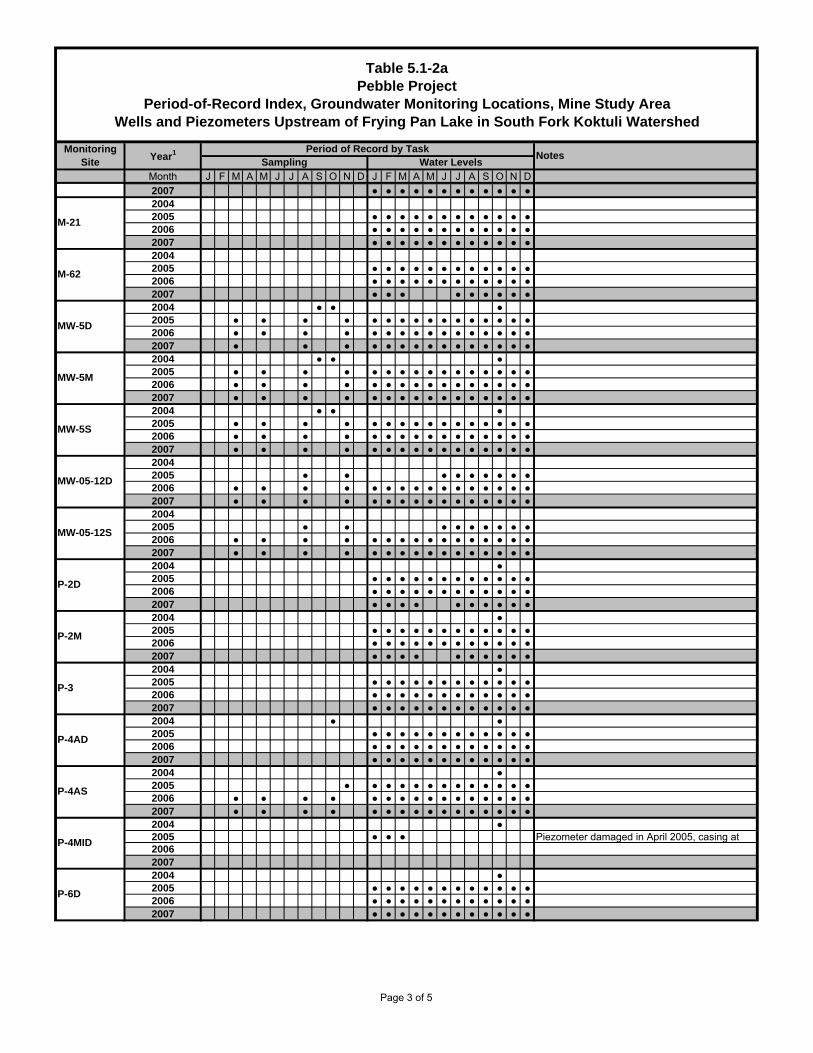
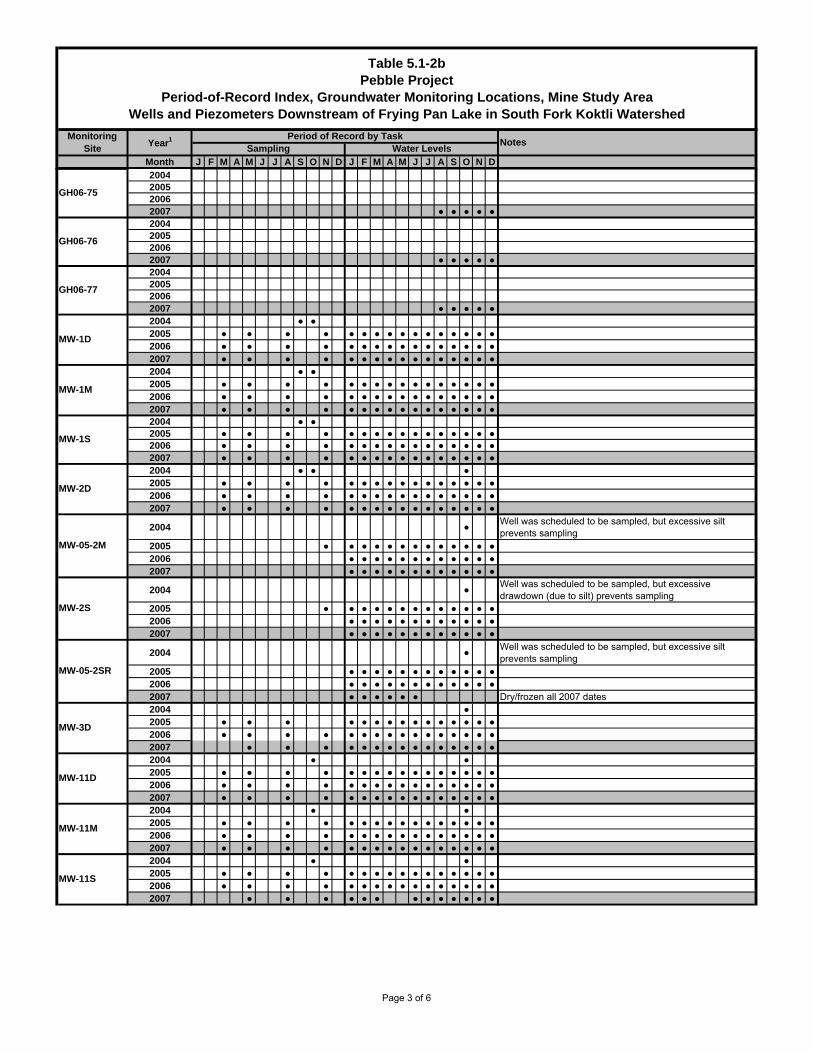
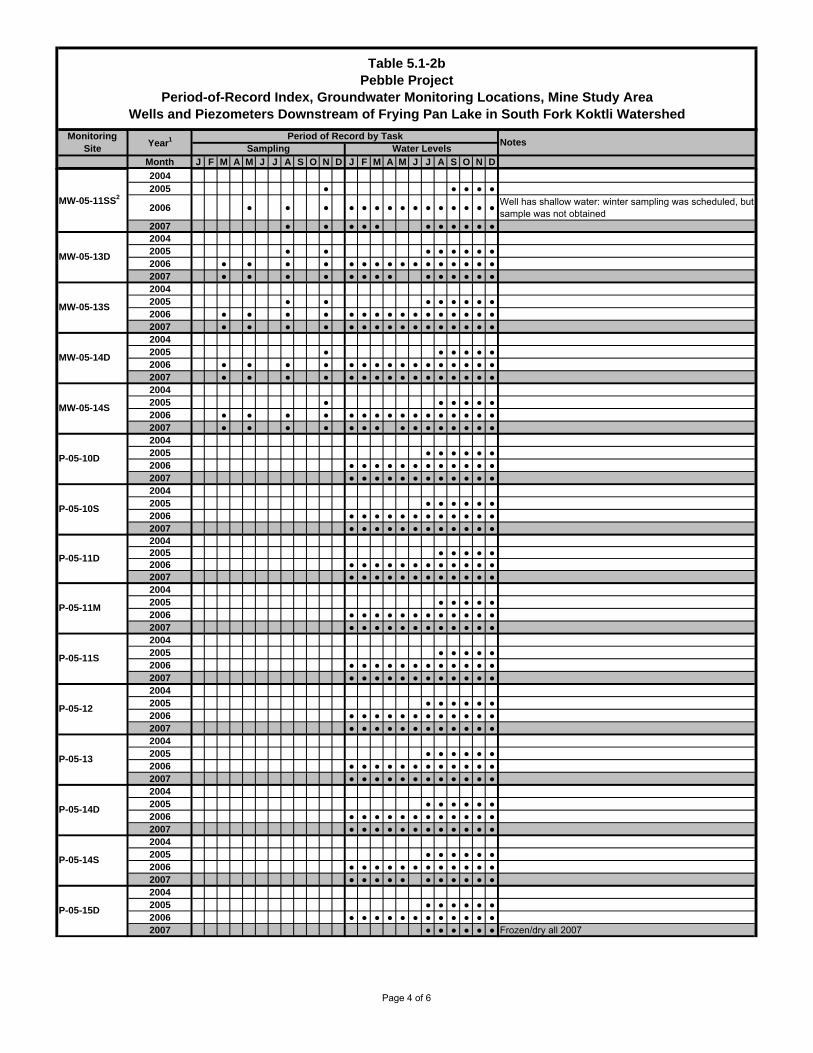
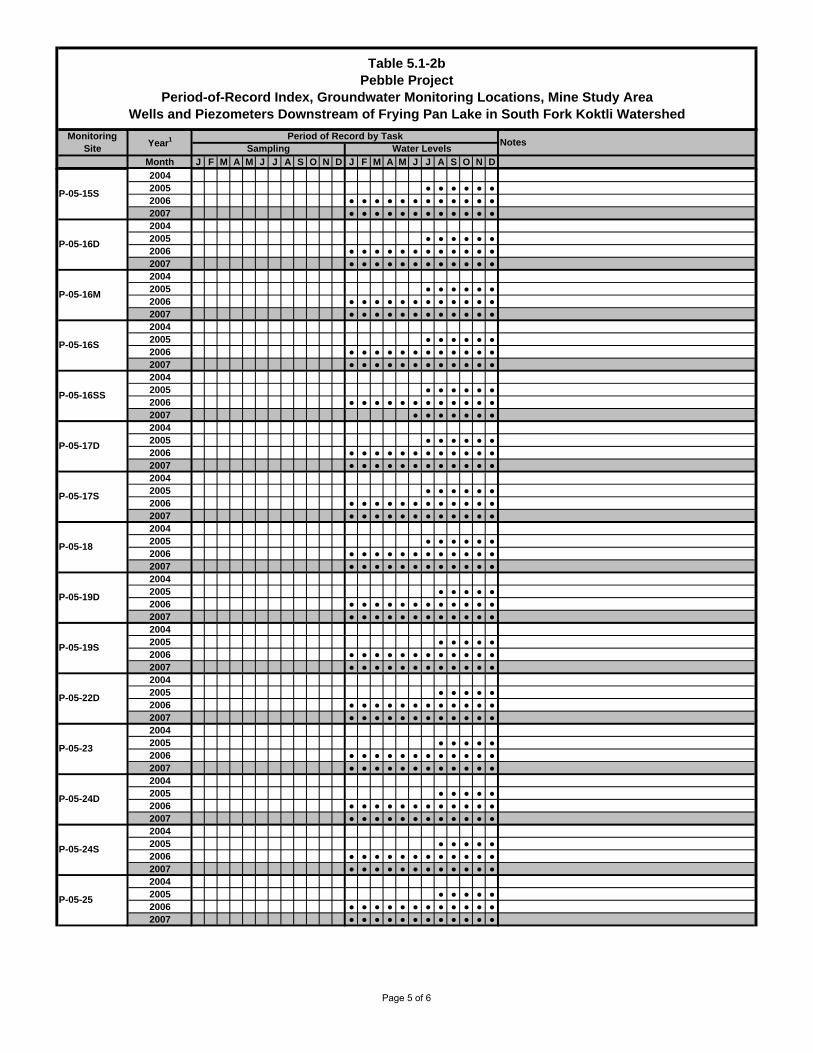
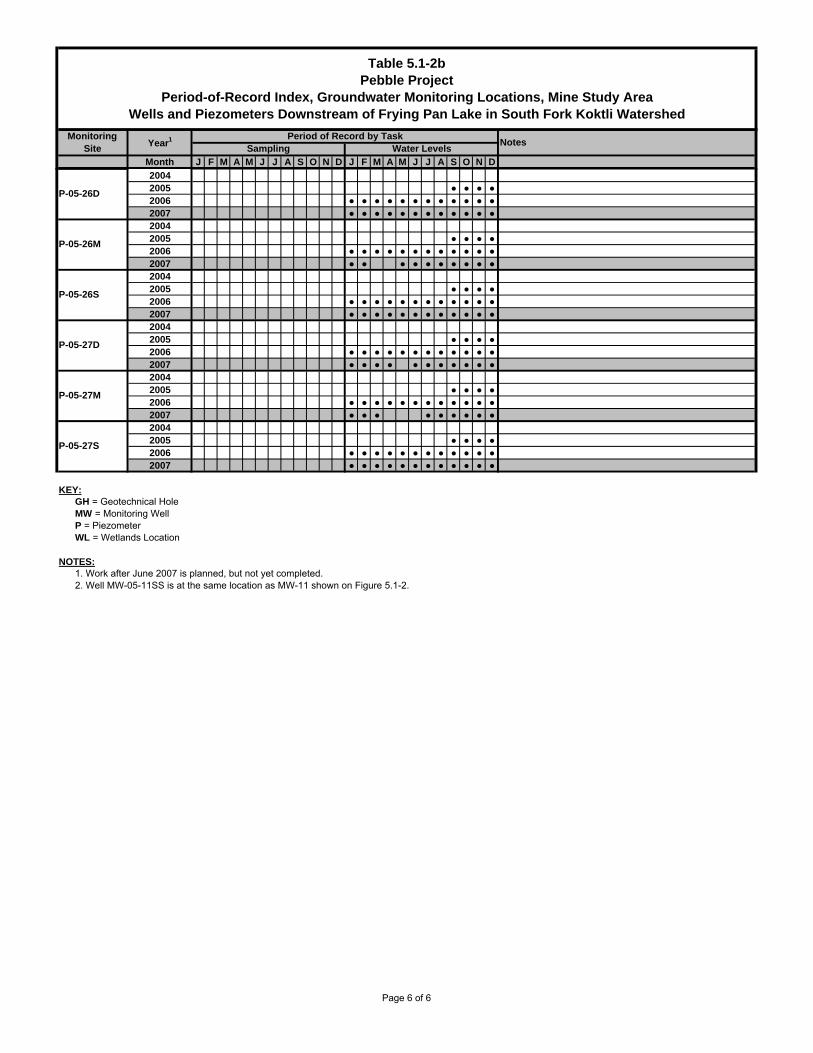
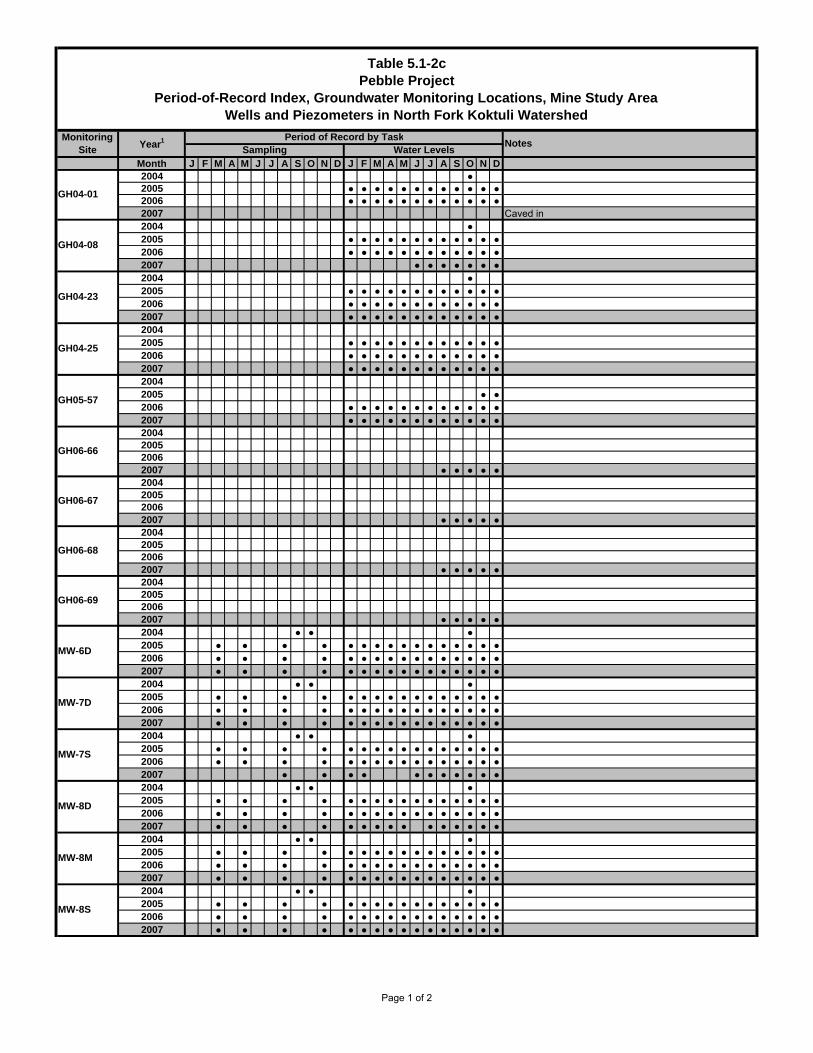
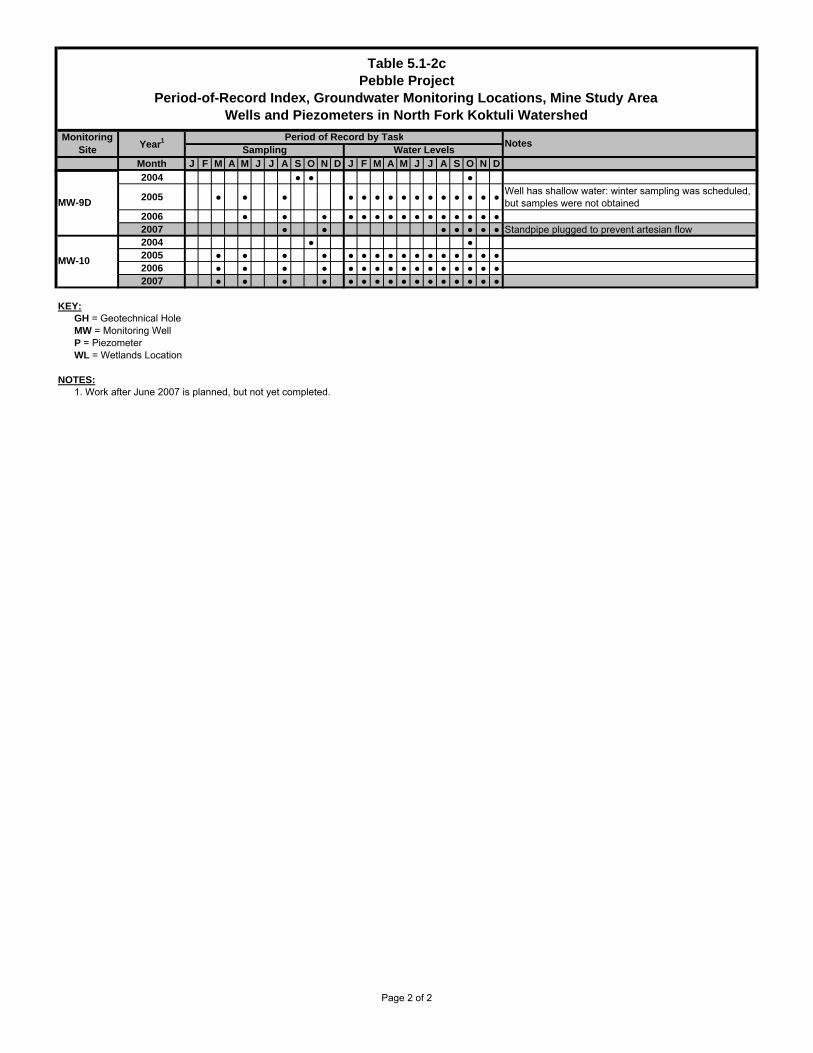
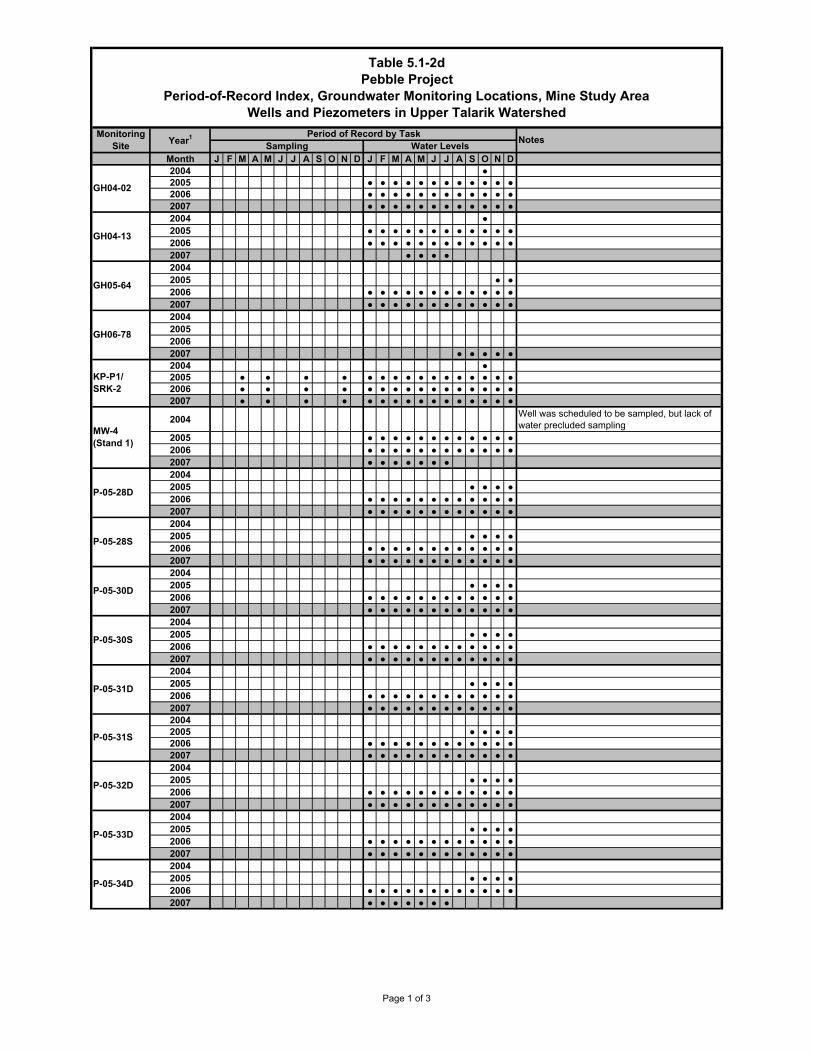
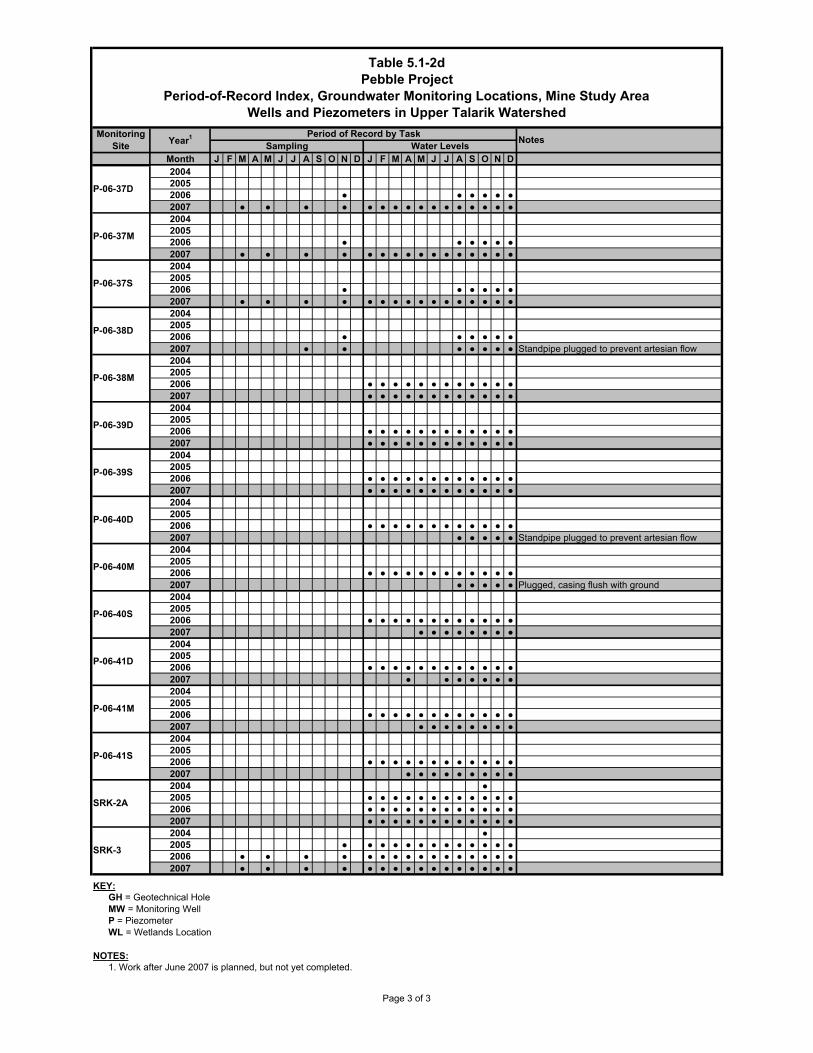
Table 5.1-2, Period-of-Record Index, Groundwater Monitoring Locations, Mine Study Area
Table 5.1-3, Summary of Monitoring Wells and Piezometers by Drainage
LIST OF FIGURES (attached)
Figure 5.1-1, 2007 Study Plan, Groundwater Studies, Mine Study Area
Figure 5.1-2, Existing Well and Piezometer Locations, 2007 Study Plan, Groundwater Studies, Mine Study Area
Figure 5.1-3, Proposed Well and Piezometer Locations, 2007 Study Plan, Groundwater Studies, Mine Study Area
SP Ch5 GW Hydro Rev4.doc 5-ii Rev. 4, 8/6/07
DRAFT GROUNDWATER HYDROLOGY
SP Ch5 GW Hydro Rev4.doc 5-iii Rev. 4, 8/6/07
ACRONYMS AND ABBREVIATIONS
KP Knight Piésold Ltd. NDM Northern Dynasty Mines Inc. NFK North Fork Koktuli River SFK South Fork Koktuli River SLR SLR Alaska UIC underground injection control USGS United States Geological Survey UT Upper Talarik Creek WMC Water Management Consultants
DRAFT GROUNDWATER HYDROLOGY
5. GROUNDWATER HYDROLOGY
Water Management Consultants (WMC) is the prime consultant for the groundwater hydrology (also referred to as hydrogeology) study in the mine study area, with support provided by SLR Alaska. Bristol Environmental and Engineering Services Corporation is conducting the hydrogeology study for the transportation corridor.
5.1 Mine Study Area
5.1.1 Objectives of Study
The objectives of the groundwater hydrology study for the mine study area are as follows:
• To characterize the existing groundwater flow regime within the study area and define how the local groundwater regime interacts with the regional groundwater system. This will require evaluation of the interaction between groundwater and surface water and of the presence of cross-basin transfer of groundwater, both of which appear to be important within the study area. The study will include an assessment of seasonal and year-to-year variations and of wet-year and dry-year conditions in the natural system. Conceptual and numerical models will be developed to characterize the background conditions and to provide input to the initial environmental evaluation.
• To provide input to the engineering team and to support ongoing design work.
• To identify the potential changes to the groundwater regime that may result from construction, operation, and closure of the mine. This aspect of the study is being conducted in cooperation with SRK International Engineering.
• To support the permitting process by identifying potential measures to mitigate conditions that could result from the interaction of the mining operations and closure with the groundwater environment and to provide an assessment of the effectiveness of mitigation.
• To define and recommend measures to reduce impacts on groundwater within and down-gradient from the mine area.
• To establish a long-term plan for monitoring the groundwater regime.
Achieving these objectives will require comprehensive collection of data, including information on surface and subsurface geology, hydrogeologic parameters such as piezometric levels and hydraulic conductivities, locations of groundwater recharge and discharge areas, and existing groundwater quality within areas of mineralized and barren rock as well as within the alluvial aquifers.
The work program will require working closely with regulators from the Alaska Department of Natural Resources, the Alaska Department of Environmental Conservation, the U.S. Environmental Protection Agency, and other agencies to meet their requirements and to gain approval of monitoring and mitigation plans and programs.
SP Ch5 GW Hydro Rev4.doc 5-1 Rev. 4, 8/6/07
DRAFT ENVIRONMENTAL BASELINE STUDIES, PROPOSED 2007 STUDY PLANS DRAFT
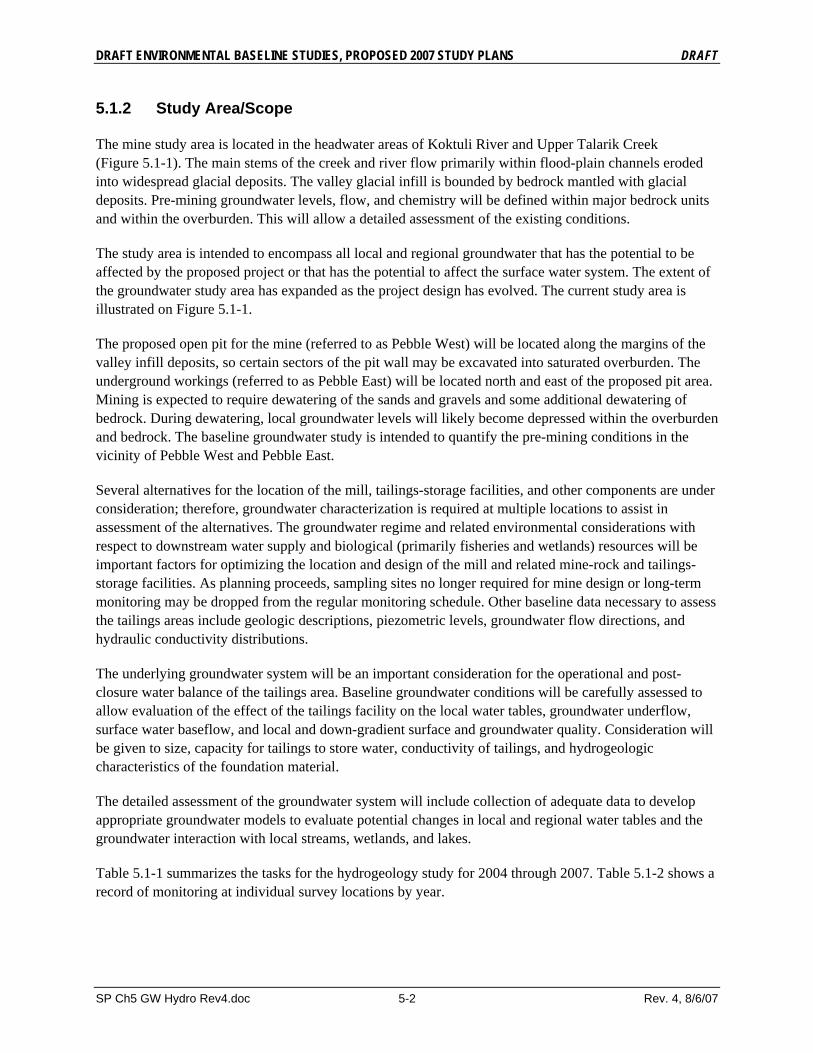
5.1.2 Study Area/Scope
The mine study area is located in the headwater areas of Koktuli River and Upper Talarik Creek (Figure 5.1-1). The main stems of the creek and river flow primarily within flood-plain channels eroded into widespread glacial deposits. The valley glacial infill is bounded by bedrock mantled with glacial deposits. Pre-mining groundwater levels, flow, and chemistry will be defined within major bedrock units and within the overburden. This will allow a detailed assessment of the existing conditions.
The study area is intended to encompass all local and regional groundwater that has the potential to be affected by the proposed project or that has the potential to affect the surface water system. The extent of the groundwater study area has expanded as the project design has evolved. The current study area is illustrated on Figure 5.1-1.
The proposed open pit for the mine (referred to as Pebble West) will be located along the margins of the valley infill deposits, so certain sectors of the pit wall may be excavated into saturated overburden. The underground workings (referred to as Pebble East) will be located north and east of the proposed pit area. Mining is expected to require dewatering of the sands and gravels and some additional dewatering of bedrock. During dewatering, local groundwater levels will likely become depressed within the overburden and bedrock. The baseline groundwater study is intended to quantify the pre-mining conditions in the vicinity of Pebble West and Pebble East.
Several alternatives for the location of the mill, tailings-storage facilities, and other components are under consideration; therefore, groundwater characterization is required at multiple locations to assist in assessment of the alternatives. The groundwater regime and related environmental considerations with respect to downstream water supply and biological (primarily fisheries and wetlands) resources will be important factors for optimizing the location and design of the mill and related mine-rock and tailings-storage facilities. As planning proceeds, sampling sites no longer required for mine design or long-term monitoring may be dropped from the regular monitoring schedule. Other baseline data necessary to assess the tailings areas include geologic descriptions, piezometric levels, groundwater flow directions, and hydraulic conductivity distributions.
The underlying groundwater system will be an important consideration for the operational and post-closure water balance of the tailings area. Baseline groundwater conditions will be carefully assessed to allow evaluation of the effect of the tailings facility on the local water tables, groundwater underflow, surface water baseflow, and local and down-gradient surface and groundwater quality. Consideration will be given to size, capacity for tailings to store water, conductivity of tailings, and hydrogeologic characteristics of the foundation material.
The detailed assessment of the groundwater system will include collection of adequate data to develop appropriate groundwater models to evaluate potential changes in local and regional water tables and the groundwater interaction with local streams, wetlands, and lakes.
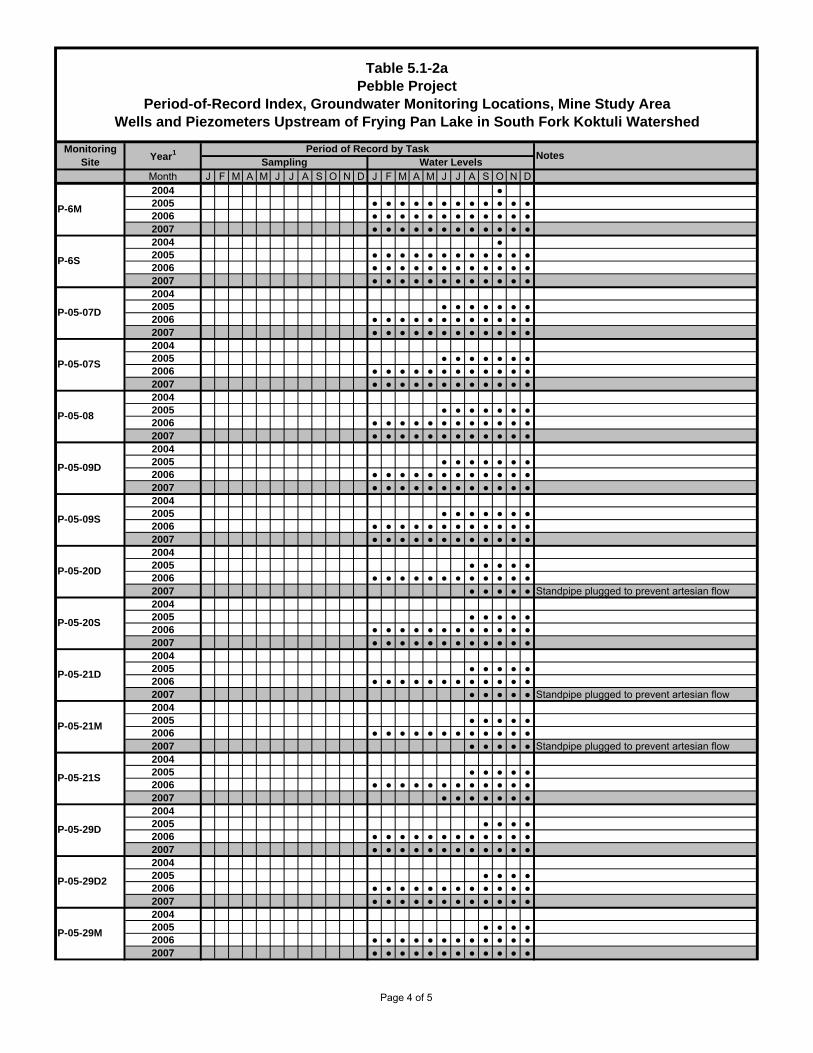
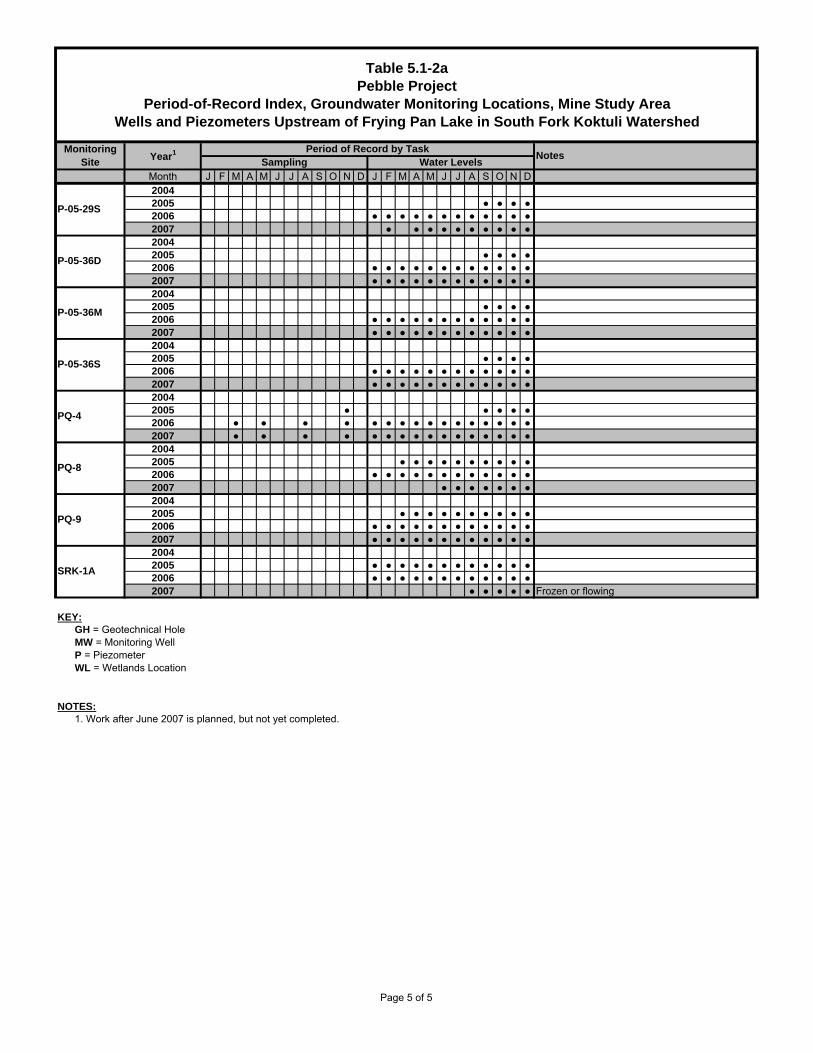
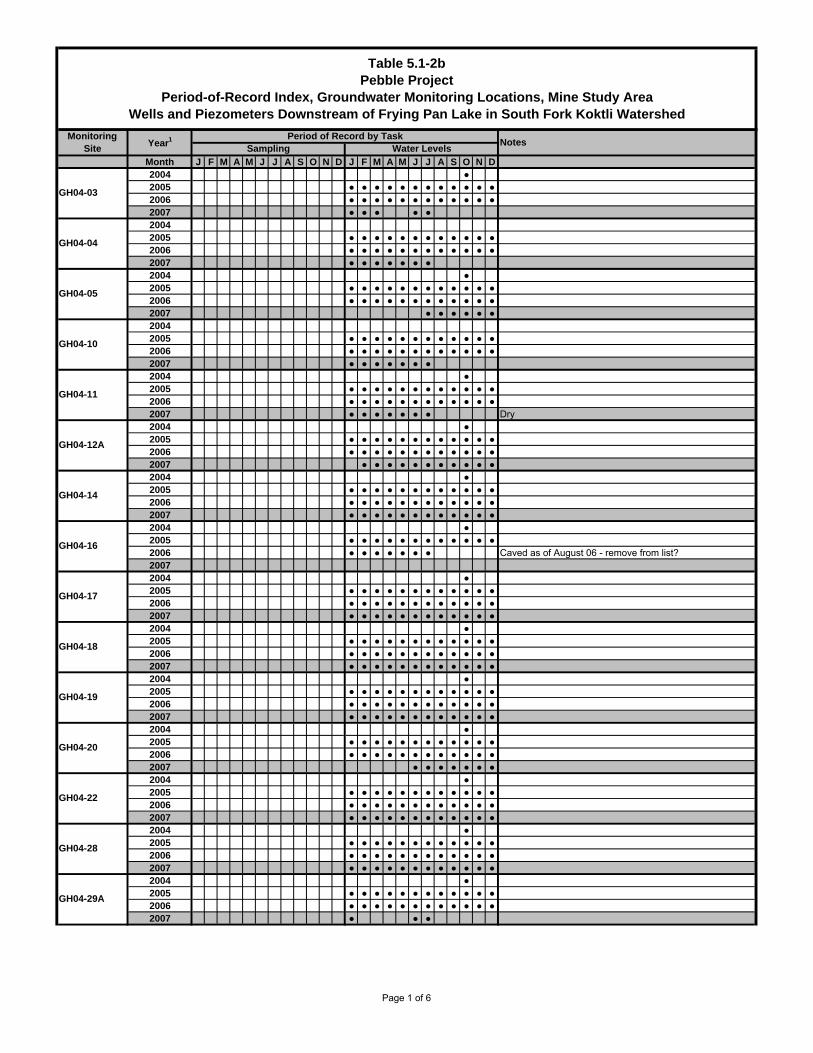
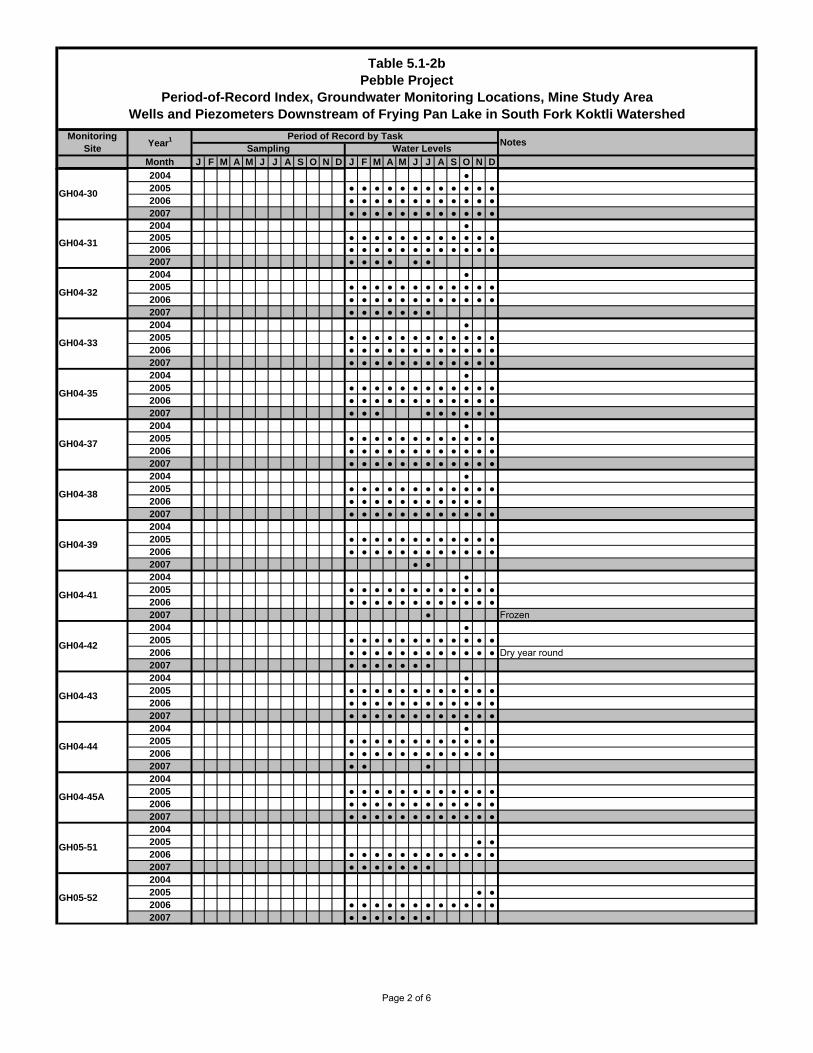
Table 5.1-1 summarizes the tasks for the hydrogeology study for 2004 through 2007. Table 5.1-2 shows a record of monitoring at individual survey locations by year.
SP Ch5 GW Hydro Rev4.doc 5-2 Rev. 4, 8/6/07
DRAFT GROUNDWATER HYDROLOGY
5.1.3 Methods/Approach to the Groundwater Study
The general approach used for the groundwater study is as follows:
• Collate and interpret existing data.
• Develop a detailed determination of additional monitoring requirements.
• Sample existing baseline monitoring wells.
• Install, test, and sample new baseline monitoring wells.
• Perform hydraulic testing of the key hydrogeologic units.
• Refine the site-wide conceptual groundwater model.
• Refine the detailed understanding of the hydrology in the area of the ore body.
• Develop a detailed understanding of the hydrology in the chosen tailings area, and use the data to help optimize the location and design of the tailings-management program.
• Develop design concepts for a Class V injection system.
• Identify the key groundwater issues which may influence the project, and develop potential mitigation options.
• Develop focused numerical models, as appropriate.
• Use all collected data and models to help develop optimized engineering solutions for pit dewatering, the mine water balance, potential groundwater discharge, tailings management, and mine closure.
• Attend meetings and share information.
The next sections describe the current status of the groundwater studies and the tasks that are planned to implement this approach.
5.1.4 Current Status of Study
5.1.4.1 Field Program Responsibilities
The field program in prior years has consisted of multiple components, including monitoring-well installation, groundwater sampling, piezometer installation, and hydraulic testing. A number of different groups have been involved with the program, as follows:
• CH2M Hill, Inc., led the hydrogeology and hydrology programs until mid-October of 2004.
• Bristol Environmental & Engineering Services Corporation collected the first complete round of groundwater samples in October 2004.
• SLR Alaska (SLR) assembled and prepared field data in January 2005 and carried out the field hydrogeology program throughout 2005 and 2006.
SP Ch5 GW Hydro Rev4.doc 5-3 Rev. 4, 8/6/07
DRAFT ENVIRONMENTAL BASELINE STUDIES, PROPOSED 2007 STUDY PLANS DRAFT
• WMC provided hydrogeological advice to CH2M Hill until mid-October 2004, completed the field program at the end of the 2004 season, provided lead hydrogeological input to the groundwater program in 2005 and 2006, and characterized the site hydrogeology.
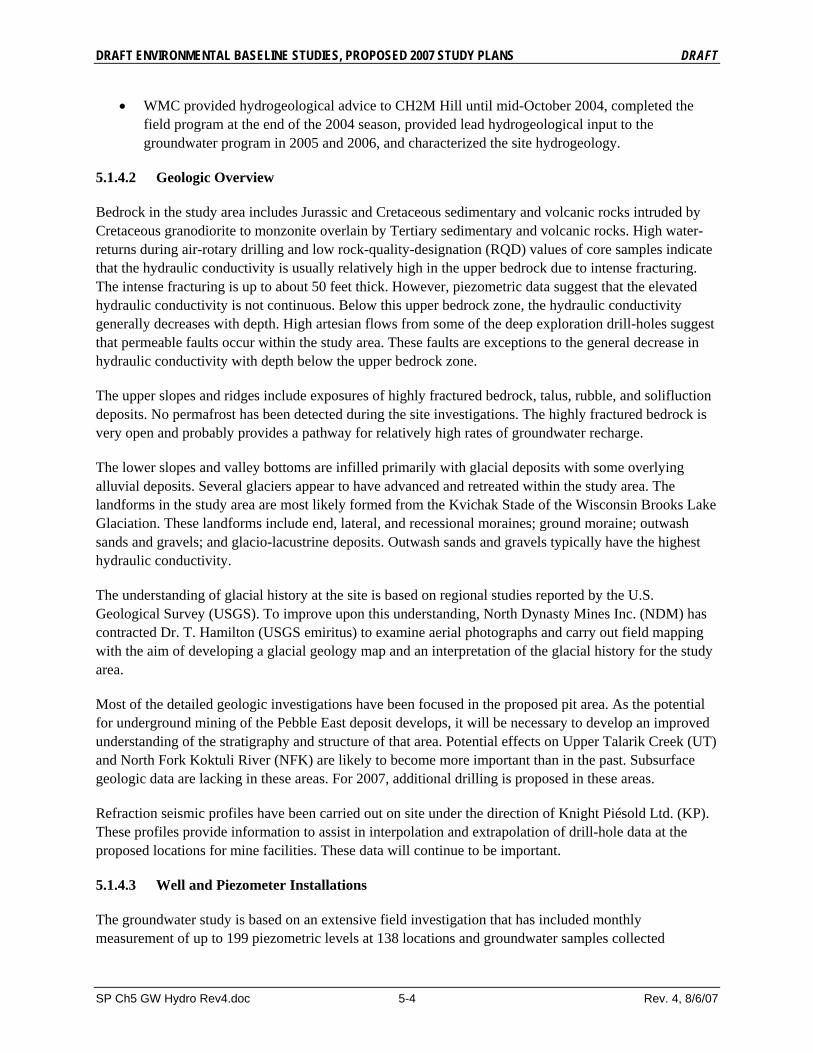
5.1.4.2 Geologic Overview
Bedrock in the study area includes Jurassic and Cretaceous sedimentary and volcanic rocks intruded by Cretaceous granodiorite to monzonite overlain by Tertiary sedimentary and volcanic rocks. High water-returns during air-rotary drilling and low rock-quality-designation (RQD) values of core samples indicate that the hydraulic conductivity is usually relatively high in the upper bedrock due to intense fracturing. The intense fracturing is up to about 50 feet thick. However, piezometric data suggest that the elevated hydraulic conductivity is not continuous. Below this upper bedrock zone, the hydraulic conductivity generally decreases with depth. High artesian flows from some of the deep exploration drill-holes suggest that permeable faults occur within the study area. These faults are exceptions to the general decrease in hydraulic conductivity with depth below the upper bedrock zone.
The upper slopes and ridges include exposures of highly fractured bedrock, talus, rubble, and solifluction deposits. No permafrost has been detected during the site investigations. The highly fractured bedrock is very open and probably provides a pathway for relatively high rates of groundwater recharge.
The lower slopes and valley bottoms are infilled primarily with glacial deposits with some overlying alluvial deposits. Several glaciers appear to have advanced and retreated within the study area. The landforms in the study area are most likely formed from the Kvichak Stade of the Wisconsin Brooks Lake Glaciation. These landforms include end, lateral, and recessional moraines; ground moraine; outwash sands and gravels; and glacio-lacustrine deposits. Outwash sands and gravels typically have the highest hydraulic conductivity.
The understanding of glacial history at the site is based on regional studies reported by the U.S. Geological Survey (USGS). To improve upon this understanding, North Dynasty Mines Inc. (NDM) has contracted Dr. T. Hamilton (USGS emiritus) to examine aerial photographs and carry out field mapping with the aim of developing a glacial geology map and an interpretation of the glacial history for the study area.
Most of the detailed geologic investigations have been focused in the proposed pit area. As the potential for underground mining of the Pebble East deposit develops, it will be necessary to develop an improved understanding of the stratigraphy and structure of that area. Potential effects on Upper Talarik Creek (UT) and North Fork Koktuli River (NFK) are likely to become more important than in the past. Subsurface geologic data are lacking in these areas. For 2007, additional drilling is proposed in these areas.
Refraction seismic profiles have been carried out on site under the direction of Knight Piésold Ltd. (KP). These profiles provide information to assist in interpolation and extrapolation of drill-hole data at the proposed locations for mine facilities. These data will continue to be important.
5.1.4.3 Well and Piezometer Installations
The groundwater study is based on an extensive field investigation that has included monthly measurement of up to 199 piezometric levels at 138 locations and groundwater samples collected
SP Ch5 GW Hydro Rev4.doc 5-4 Rev. 4, 8/6/07
DRAFT GROUNDWATER HYDROLOGY
quarterly at up to 38 clustered monitoring wells at 19 locations. A summary of existing monitoring wells and piezometers by drainage is presented in Table 5.1-3. The existing piezometers and monitoring wells are listed in Tables 5.1-2a through e, and locations are illustrated on Figure 5.1-2.
KP, as part of their collection of geotechnical information for design, installed and tested 77 of these piezometers.
A total of 42 piezometers and water-level gages were installed in selected wetland areas to define groundwater conditions specific to wetlands regulations (Table 5.1-2e). The piezometers were installed under the direction of SLR. Water levels are measured monthly in these piezometers.
In November 2006, exploration hole NDM-6349 (located near the proposed pit) was instrumented with 50 packers, 50 measurement ports, and 25 pumping ports (from Westbay Instruments) to a depth of 4,050 feet. The piezometric profile was measured at the time of installation and continues to be measured monthly.
Because the potential mine area has expanded to accommodate Pebble East, additional piezometers and monitoring wells are required to further characterize groundwater conditions in the UT and NFK drainages. Installations are planned in NFK, at the boundary between the NFK and UT catchments, within the UT catchment, in specific areas within the South Fork Koktuli (SFK) catchment, and at potential sites for injection of water in order to evaluate possible mitigation schemes. An additional Westbay installation also is planned to provide deep groundwater information for the Pebble East area.
5.1.4.4 Hydraulic Conductivity Testing
Groundwater monitoring wells and piezometers installed in the mine study area were response tested during 2004, 2005, and 2006. Most of the 2004 testing was completed by CH2M Hill. WMC and SLR conducted a few 2004 and all 2005 and 2006 tests. WMC has analyzed the data to determine the apparent hydraulic conductivity near each installation. Wells and piezometers are listed in Table 5.1-2 and illustrated on Figure 5.1-2. This activity will be continued with wells and piezometer installed in 2007.
While drilling geotechnical holes in the mine pit area, KP carried out hydraulic conductivity packer tests (also known as Lugeon tests) in both 2004 and 2005. KP also conducted rising and falling head tests in piezometers installed in the pit area. Additional packer tests are not planned in the Pebble West area for 2007, but will be considered for future years.
During 2004, KP also performed rising and falling head tests in GH-series piezometers installed outside of the area of the proposed pit. A sounding tape was used to monitor water levels, so many of the well responses could not be measured because they were too fast.
Pumping tests were completed at seven locations: PW-1, PW-3, PW-4, PW-5, PW-6, PW-7, and PW-8 (PW-2 has not been drilled). Wells PW-3, PW-4, PW-7 were completed in overburden, and wells PW-1, PW-5, PW-6, and PW-8 were completed in bedrock. The wells were then developed and tested by air lifting. Several piezometers were monitored during each pumping test. A minimum of two additional tests are planned in 2007 to supplement information for the UT and NFK watersheds.
Drill circulation losses and gains for resource drilling were monitored in late 2006 and will continue to be monitored in 2007 by SLR. In addition, SLR reviewed available information to identify any drill
SP Ch5 GW Hydro Rev4.doc 5-5 Rev. 4, 8/6/07
DRAFT ENVIRONMENTAL BASELINE STUDIES, PROPOSED 2007 STUDY PLANS DRAFT
circulation losses or gains in resource and geotechnical drilling from 2004 through 2006. This information can provide a qualitative assessment of the location of high permeability areas. In the coming years, this program can be continued, and as the mine plan develops, additional testing such as response to core pulling, air lift, and injection testing can be carried out. Full-scale pump tests will be considered when mobile equipment can be moved to the site.
5.1.4.5 Monitoring
Groundwater sampling of monitoring wells has been ongoing since 2004. Groundwater samples were collected in September and October 2004; March, May, August, and November 2005; and March, May, August, and November 2006.
Groundwater levels were measured immediately following well installation and during well development and testing throughout all phases of the field program. Each monitoring well and piezometer was monitored monthly in 2005 and 2006, and this program is ongoing. Selected monitoring wells and piezometers are equipped with dedicated transducers that record the water level each hour.
Groundwater samples were collected from 28 clustered wells at 15 locations and analyzed for tritium to provide an estimate of the groundwater age. The concentrations found indicated that all but one of the samples had probably recharged since 1972. One sample (MW5D) may have recharged prior to 1952. Additional sampling is proposed for 2007 to provide further data to assess groundwater travel times, with analysis of tritium and daughter products being conducted to improve the age-dating of the groundwater.
5.1.4.6 Other Data Collection Programs
Seeps and Surface Water
Some seep flows were measured during 2004, but the most comprehensive flow monitoring (conducted by HDR) started in 2005, continued in 2006, and will continue in 2007 (as described in Chapter 6, Section 6.1).
Relatively detailed streamflow surveys were completed by HDR during low-flow periods to determine which stream reaches were gaining and which were losing. These surveys were conducted in NFK, SFK, and UT in 2004, 2005, and 2006. This program is continuing in 2007, as described in Chapter 4.
Resource Drilling
The resource drilling program provides lithologic and structural information that gives the background for producing a conceptual groundwater model for the study area. In addition, observations of losses and gains of drilling circulation-fluid and evidence of groundwater flow on core provide additional indications of ground permeability.
5.1.4.7 Calculations and Models
Based on published geologic reports and the data collected as part of this program, conceptual geologic and hydrogeologic models were prepared. Based on these conceptual models, a monthly site-wide water balance was developed. This water balance was developed using Iliamna precipitation and temperature data, adjusted for elevation. The model included interaction of surface and groundwater using a linear
SP Ch5 GW Hydro Rev4.doc 5-6 Rev. 4, 8/6/07
DRAFT GROUNDWATER HYDROLOGY
reservoir method. The model was calibrated to discharge measured in creeks and rivers on site. Insufficient data were available to include the natural variability in precipitation and snowpack across the site. The next phase of model development will include these variations as the data become available.
A site-wide numerical groundwater model was prepared based on the conceptual groundwater model and the available groundwater information (groundwater levels, hydraulic conductivities, seep locations, low-flow measurements, etc.). The model included two layers to represent the bedrock and one layer to represent the overburden. Although the model calibration was reasonable, an improvement is planned to allow modeling of multiple aquifers within the overburden where they are known to be present. In addition, the existing model boundaries will be expanded so that potential mine development areas that may be part of future mine plans are within the modeled area.
More detailed modeling is expected to be required in mine waste-management areas and within the mine area. As mine planning progresses, WMC will provide estimates of groundwater conditions that may affect design decisions.
5.1.5 Major Activities
5.1.5.1 Field Work
WMC will support the field programs related to hydrogeology by providing guidance to the various consultants involved, including SLR and HDR. This guidance will include development of specifications for the work in consultation with NDM and the consultants involved. It will also include ongoing input during the field programs themselves and two site visits by WMC personnel. The program includes many activities that are necessary because of the addition of potential development of Pebble East. The subsurface investigations for Pebble East may represent about 80 percent of all subsurface investigations for Pebble Project. Monitoring activity will increase by about 25 percent as a result of the planned increases in monitoring points. The planned field investigations for 2007 are described below.
Drilling for Monitoring Wells and Piezometers
The hydrogeology field work will be conducted by SLR with oversight by WMC. WMC will provide recommendations to NDM for selection of the drilling contractor, will site the drill-holes, will provide input to SLR for the field protocols, and will analyze the data. SLR will develop field protocols together with WMC, will procure the necessary equipment, and will carry out the field work.
The wells will be used primarily to define stratigraphy, to test hydraulic conductivity, and to measure piezometric levels, with selected wells also used for collecting groundwater samples. Planned installations for 2007 are as follows:
• In the NFK catchment.
• Near the divide of the NFK and UT catchments.
• Near potential Class V injection-well sites within the UT catchment.
• Near potential Class V injection-well sites in the SFK catchments.
• Near mine waste-management areas as mine planning progresses.
SP Ch5 GW Hydro Rev4.doc 5-7 Rev. 4, 8/6/07
DRAFT ENVIRONMENTAL BASELINE STUDIES, PROPOSED 2007 STUDY PLANS DRAFT
Similar to previous years, expected installation depths range from 30 to 200 feet. Thirty-eight wells are planned, and their locations were selected in consultation with KP. The wells will be drilled using the ODEX drilling technique, which eliminates problems associated with the addition of drilling mud and also has the advantage of using a casing for well installation, so that the screen is completed in the appropriate geologic horizon. Planned locations of the ODEX holes (hydrogeology holes) are illustrated on Figure 5.1-3. Some locations are not shown on the figure; they will be determined in the field at the time of drilling.
In some locations, the overburden is deeper than 200 feet. At these locations, installation of monitoring wells with proper seals will likely not be possible, but collecting data on the geology will be worthwhile. An alternate drilling method will be used to penetrate all the way to bedrock and collect data on the overburden geology. Suitable drilling methods would include PQ coring or triconing with split-spoon sampling.
Slug testing in the completed monitoring wells or piezometers will provide data on hydraulic conductivity for the completion zone.
Pumping tests will be conducted at selected sites in the UT and NFK watersheds. The locations of the test wells will be determined during the field investigation depending on the types of material encountered. In general, the test wells will be completed in the geologic horizons that appear to produce the most groundwater. Each test site will include a pumping well and multiple piezometers for monitoring water levels. The pumping tests will typically last about 24 hours. The flow rate of the pumping well will be recorded regularly. The water levels in the pumping well and observation wells will be recorded frequently with transducers and with manual sounding tapes. Barometric pressure will be monitored during the test so that the necessary corrections can be applied to the water-level measurements. After the pump is turned off, the recovery of water levels also will be recorded.
Geotechnical Site Investigation
Subsurface exploration will be carried out under the direction of KP. The primary purpose of this drilling will be for geotechnical purposes, but as the drill-holes will be concentrated at proposed facilities, they will also provide important information for understanding the groundwater flow system. As a general practice, KP installs piezometers in all of the holes that they drill for geotechnical purposes. At this time KP has selected 46 locations for drilling in the 2007 program. These holes are the geotechnical holes depicted on Figure 5.1-3.
Seismic refraction will be specified by KP to assist with interpolation of drill-hole data in the areas of proposed structures.
Installation of a Deep-bedrock Multi-level Piezometer
One additional deep-bedrock multi-level piezometer (Westbay) installation is planned for 2007. This hole will provide additional design information and also will provide background water-quality data for deep environments. Installation will be in a drill-hole with a depth of about 4,200 feet. The hole will be drilled by an NDM contractor. Drilling fluid will be either water or a degradable drilling mud. WMC will select component locations. Installation will be completed by the drilling contractor with field supervision by SLR, with assistance from KP. Further description of the field installation is provided in the field
SP Ch5 GW Hydro Rev4.doc 5-8 Rev. 4, 8/6/07
DRAFT GROUNDWATER HYDROLOGY
sampling plan for groundwater studies (NDM, in press). This installation could serve as a multi-level piezometer for a deep aquifer test.
Deep-bedrock Well Testing and Sampling
Pressure profiles will be carried out at the same time as piezometric pressures are measured in two deep-bedrock drill-holes. A screening-level pulse-testing program will be carried out on each of the two installations. Well development activities and response testing will be carried out on selected monitoring zones (estimate 40 zones in two holes). Approximately 20 groundwater samples will be collected from the two holes in 2007. All of these activities will be carried out by SLR. WMC personnel will visit the site during testing to provide any required direct support.
One or more air-lift pumping tests are planned adjacent to multi-level deep-bedrock piezometers installed to depths of several thousand feet. These tests will give preliminary estimates of the hydraulic properties of the deep bedrock prior to a long-term pumping test. These pumping tests are scheduled for 2008.
Following air-lift pumping tests, a long-term pumping test will be designed. This test might consist of monitoring piezometric pressures during the development of the test shaft after 2007.
Wetland Piezometer Installations
Installation of additional wetland piezometers is planned for the 2007 field season. The locations will be specified by Three Parameters Plus Inc., and the piezometers will be installed by SLR, with oversight by WMC.
Specialized Groundwater Testing and Sampling
Tracer testing has been considered as a method to define groundwater flow directions, rates, and resident times under natural gradient conditions; however, tracer testing under natural gradient conditions is time consuming, can be difficult to complete, and may not provide definitive information. The isotope analysis described below is a natural tracer methodology that is more likely to provide the required information for the mine study area. Natural isotopes of chlorine, sulfur, carbon, hydrogen, and oxygen can be useful for characterizing sources of recharge, geochemical processes within groundwater systems, and travel times from recharge areas to discharge areas. A comparison of water quality in recharge areas to that in discharge areas can help to distinguish where the recharge water is discharging. Age-dating of the groundwater also helps to determine how long the groundwater has been resident in the groundwater system, which improves estimates of travel times from recharge areas to discharge areas. Samples will be collected for isotope analysis from an estimated six monitoring wells. This work will be carried out by SLR.
In addition, single well dilution tests will be carried out in monitoring wells to provide discrete velocity measurements for comparison and correlation with velocity values obtained from age-dating or calculated using gradient, hydraulic conductivity, and estimated porosity values. At this time, borehole dilution testing is expected be completed by SLR in 10 monitoring wells.
SP Ch5 GW Hydro Rev4.doc 5-9 Rev. 4, 8/6/07
DRAFT ENVIRONMENTAL BASELINE STUDIES, PROPOSED 2007 STUDY PLANS DRAFT
Drilling Circulation-fluid Monitoring
A program is in place to document and quantify losses and gains of drilling circulation-fluid in the resource drilling program. This program is focused on identifying zones of elevated permeability, then relating these zones to lithology or structures and identifying targets for future investigations.
Glacial Geology Mapping
Thomas D. Hamilton, Ph.D., will carry out site mapping with the assistance of SLR. Interactions with WMC will include meetings in Vancouver and a site visit during the field mapping. The mapping effort will provide maps of surficial materials and an interpretation of the glacial history of the study area, allowing interpolation and extrapolation of surface and drill-hole data.
Groundwater Sampling
The methods and protocols to be used for groundwater-quality sampling are described in Chapter 6, Water Quality and in the field sampling plan for groundwater studies (NMD, In press). In addition to the water-quality sampling, water levels will be measured in monitoring wells and piezometers monthly during the year, concurrent with stream water-quality sampling (also described in Chapter 6).
The goal of the groundwater-quality sampling is to quantify the water chemistry under seasonal hydrologic conditions at key locations in the study area. Four seasonal sampling events (March, May, August, and October) will be conducted for groundwater monitoring wells. Sampling events have been timed to include high groundwater levels in the spring and early fall, and low groundwater levels in summer and late winter.
SLR will continue these activities in 2007. New data points will be added with the 2007 drilling program. The additional drilling is related to both Pebble East and Pebble West. A review of the data-collection points will be carried out as soon as a mine plan develops. In the meantime, collection of data will continue.
5.1.5.2 Input to Tasks by Others
Some tasks under the direct supervision of other consultants have an impact on the hydrogeology study and WMC will provide input to these tasks. This input will probably take the form of occasional telephone calls, memos, and/or meetings. This task also will include discussions with the design team on issues relating to groundwater. These tasks by others and their association with the hydrogeology study are discussed below.
Seep Sampling
The seep sampling and flow-measurement program has recently been reviewed. Additional areas will be surveyed in 2007 and data-collection points will be added by HDR to provide additional coverage related to Pebble East. Existing data-collection points will continue to be monitored.
SP Ch5 GW Hydro Rev4.doc 5-10 Rev. 4, 8/6/07
DRAFT GROUNDWATER HYDROLOGY
Streamflow Data Collection
The streamflow data are highly relevant to the hydrogeological characterization because these data contribute significantly to understanding the interaction between surface water and groundwater.
Continuous and spot measurements of streamflows will be included in the 2007 study program by HDR. Also important to the hydrogeology study is a series of low-flow streamflow profiles. These profiles will consist of streamflow measurements along NFK, SFK, and UT. These streamflow profiles will be very useful for identifying areas where groundwater discharge to streams is more pronounced.
Selected streamflow monitoring stations will be visited, and the data will be reviewed as they are being collected. WMC will interact with HDR to verify that the data collection meets the needs of the groundwater hydrology program.
Meteorological Data Collection
WMC understands that the following meteorological data are being collected:
• Total precipitation (glycol mix with tipping bucket).
• Evaporation.
• Wind speed and direction.
• Temperature.
• Barometric pressure.
The data most relevant to the hydrogeological analysis are total precipitation and evaporation. The data will be reviewed as they are being collected. WMC will interact with other consultants to verify that climate-data collection meets the needs of the hydrogeology program.
Operations Water Balance
WMC understands that an operations water balance is being calculated by other team members. Input will be provided to the water balance, as required, so that it includes the findings from the hydrogeological characterization, including the groundwater recharge assessment. This input will include requirements for data processing, choice of catchment areas, and choice of water-balance model calibration points. WMC interacts with KP, which is responsible for the operations water balance.
Site-wide Mass Balance
WMC understands that a site-wide mass balance is being calculated by other team members. WMC will provide input as required to the mass balance so that it includes input from the hydrogeological characterization. This input will primarily be related to groundwater flow rates, groundwater chemistry, and the attenuation capacity of the aquifer solids. WMC will interact with SRK to ensure that SRK is aware of the groundwater aspects of the site-wide mass balance.
SP Ch5 GW Hydro Rev4.doc 5-11 Rev. 4, 8/6/07
DRAFT ENVIRONMENTAL BASELINE STUDIES, PROPOSED 2007 STUDY PLANS DRAFT
Pit Lake Study
The understood goal of this task is to develop an integrated plan to optimize the short- and long-term chemistry of the final pit lake. This task will include examining the effect of groundwater inflows to and discharge from the pit lake on the water balance, the influence of groundwater quality on pit lake water quality, and the groundwater residence times for groundwater leaving the pit area. The pit lake study will focus on options for optimizing the lake-water chemistry and on development of a management plan for potential discharge from the pit lake to the down-gradient hydrologic system. WMC will provide input on the groundwater aspects of the pit lake study so that the study is consistent with the current knowledge of the hydrogeology of the area.
Bench-scale Attenuation Testing
Bench-scale testing of aquifer materials from the mine study area will be conducted. The goal of this task is to estimate the natural attenuation properties of aquifer materials along the groundwater flow-paths down-gradient from key facilities such as the tailings impoundment and the open pit. The two primary attenuation mechanisms are expected to be acid neutralization—which will cause metal precipitation—and adsorption on aquifer minerals such as ferric hydroxide coatings and clay minerals. A mineralogical analysis is recommended to determine the types of mineral phases precipitated as a result of acid neutralization within the aquifer and to determine if naturally occurring metal hydroxides are present in the aquifer. The results of this testing will be incorporated in the groundwater impact assessment developed for the site. WMC is organizing the attenuation testing with guidance from SRK. SLR will be responsible for collecting representative aquifer materials.
Mine Design
WMC will interact with KP and SLR to keep the mine design team apprised of the current understanding of site groundwater conditions and to provide estimates of groundwater inflow for mine planning purposes. This interaction will also provide WMC with an ongoing understanding of the mine design as it proceeds, which may influence the design of the groundwater data-collection program.
5.1.5.3 Data Review and Analysis
This task involves detailed review and analysis of data relevant to the hydrogeological study. The task is conducted throughout the year so that current programs in the field are adapted to meet the up-to-date data analyses, interpretations, and requirements.
The data analyses will result in the following:
• Development of updated hydrogeologic cross-sections, piezometric time series, and snapshots of piezometric elevations.
• Estimates of hydraulic conductivity, storativity, and site meteorological conditions.
• Interpretations of the relationships between groundwater, surface water, and seeps.
This information will lead to refinement of the conceptual groundwater model.
SP Ch5 GW Hydro Rev4.doc 5-12 Rev. 4, 8/6/07
DRAFT GROUNDWATER HYDROLOGY
The review and analysis of hydrogeology data include the following:
• Quality assurance/quality control for data-collection activities.
• Review of drill-hole logs to select monitoring zones and interpret the overall geologic environment as it relates to the most important hydrogeologic issues at the site.
• Interpretation of three-dimensional groundwater-flow directions from water-level and geologic data.
• Interpretation of groundwater- and surface water-chemistry data to help with the interpretation of the groundwater/surface water interaction.
• Geologic characterization of the mineralized area, so that current groundwater conditions are understood and so that reasonable estimates of inflows to potential mine layouts are possible.
• Update and refinement of geologic cross-sections based on ongoing drilling programs and the surficial geology mapping program.
• Establish groundwater piezometric distributions and time histories.
• Analyses of well and piezometer tests (for 2006 and ongoing 2007 work).
• Develop meteorological correlations to groundwater conditions (to refine site characterization based on additional data).
• Correlate surface water and seepage flow to groundwater conditions.
5.1.5.4 Site-wide Water Balance
The site-wide water balance incorporates surface water and groundwater flows into an integrated model that accounts for precipitation, runoff, evapotranspiration, sublimation, spring runoff, groundwater recharge, groundwater discharge, and interbasin transfer of groundwater. During 2007, the analysis will be updated with the latest available data on snowpack, climate, streamflow, and groundwater levels to improve current estimates of groundwater/surface water interaction. As in the past, the output from this monthly water balance will be available for preliminary evaluation of downstream flow reduction as a result of potential mining activities. Update activities are scheduled for March and August.
This analysis also will be useful in pit-dewatering design and groundwater calculations. Some iteration between this analysis and the groundwater models will be needed to develop a consistent interpretation (i.e., the result of the analysis and of the models will be fed into each other until mutually consistent results are produced).
5.1.5.5 Site-wide Groundwater Model
During 2006, a three-dimensional, transient, numerical groundwater model was developed for assessing groundwater flow rates, flow directions, and travel times. The USGS computer code MODFLOW was used for assessing flow rates and the particle-tracking code MODPATH was used for assessing flow directions and travel times. This model was developed in a very simple form to help define the most important hydrogeologic issues at the site and to help guide the field program. The inputs to the site-wide groundwater model were based on a hydrogeologic interpretation of the site and estimates of groundwater
SP Ch5 GW Hydro Rev4.doc 5-13 Rev. 4, 8/6/07
DRAFT ENVIRONMENTAL BASELINE STUDIES, PROPOSED 2007 STUDY PLANS DRAFT
recharge. The model was calibrated to groundwater flow estimates from the site-wide water balance, streamflow measurements from the field, and groundwater elevation measurements from the field.
During 2007, the inputs to the site-wide groundwater model will be refined, as follows:
• The overburden will be represented with multiple layers.
• Multiple zones of hydraulic conductivity will be assigned to each overburden layer.
• The model boundaries will be expanded to accommodate the proposed underground workings (Pebble East) and to allow adequate baseline characterization of proposed Tailings Area “G.”
• Zones of high hydraulic conductivity may be added if faults are identified.
• The recharge rates will be adjusted, as required, depending on the results from the site-wide water balance.
Following refinement of the inputs, the model will be recalibrated to the new estimates of groundwater flow from the updated site-wide water-balance model and to the latest measurements of low-flow streamflow and groundwater elevation. The model also will be calibrated to the results of aquifer tests that have been conducted on site. The detailed objectives and scope of numerical modeling for the groundwater system will be progressively refined as the project evolves.
5.1.5.6 Groundwater Model for the Pit and Underground Mine Areas
This task will include preliminary estimates of inflows to the pit and underground workings to be used in preliminary mine planning. A baseline groundwater model will be developed for the proposed pit and underground mine areas based on available data. The model will be refined in future years as more data become available. The model will draw inputs from the site-wide model and will simulate groundwater flow directions and surface water/groundwater interaction.
This task also will include limited ongoing contributions to the design team as the mine plan is developed.
Although a final analysis will not be completed during 2007, the baseline model that is being developed under this task will consider that the following issues will have to be addressed in the future:
• Planned number, location, and pumping rates of alluvial and bedrock dewatering wells.
• Planned pumping rates of working-level sumps in the pit floor.
• Prediction of required bedrock and alluvial dewatering rates for the life of the project.
• Consideration of passive options to reduce the amount of alluvial groundwater to be managed during operations.
• Design of measures to allow wall-rock depressurization in any low permeability sectors of the pit slopes.
• Consideration of measures to reduce water inflows from faults and fracture systems.
• Prediction of the pumped-water chemistry from the bedrock and alluvium during the life of the mine.
SP Ch5 GW Hydro Rev4.doc 5-14 Rev. 4, 8/6/07
DRAFT GROUNDWATER HYDROLOGY
• Prediction of the effect of dewatering on nearby habitats.
• Water rights support.
Work completed during this task will provide a useful tool for input to the pit lake study. WMC will work with the engineers who will design the open-pit dewatering system and will provide input to the environmental impact assessment regarding the expected response of the pit dewatering. This will include consideration of the site-wide water balance and the water-quality studies.
5.1.5.7 Groundwater Model for the Tailings Area
A baseline groundwater model will also be developed for the proposed tailings area. The inputs to this model will be based on the site-wide groundwater model. This task will deal with any tailings-area design elements related to hydrogeological issues. Considerations to be included in the task are as follows:
• Leakage rates from the tailings area.
• Changes in groundwater levels expected from operation and closure of the tailings facility.
• Potential down-gradient flow and chemistry changes to the surface-water and groundwater regimes.
• Seepage recovery design.
Special emphasis will be placed on evaluating changes to the surface water/groundwater interaction. Pre-mining, operational, and post-closure conditions will be simulated to allow comparison of pre-mining baseline conditions with the predicted operational and post-closure mass-loading. Mitigation measures also probably will be planned and designed using the mass-loading model.
5.1.5.8 Assessment for Class V Injection Wells
Most Class V injection wells in the Pacific Northwest and Alaska are relatively simple devices used to emplace fluids into the shallow subsurface under the force of gravity. Examples include sumps, drywells, and drainfields.
Class V injection wells are currently regulated by the Underground Injection Control (UIC) Program, under the authority of the Safe Drinking Water Act. Under the existing federal regulations, Class V injection wells are “authorized by rule” (40 CFR 144). This means that Class V injection wells do not require a permit if they do not endanger underground sources of drinking water and if they comply with other UIC Program requirements. These requirements include: 1) submitting basic information about Class V injection wells to the U.S. Environmental Protection Agency or the state primacy agency and 2) constructing, operating, and closing Class V injection wells in a manner that protects underground sources of drinking water. The Environmental Protection Agency or a state primacy agency may ask for additional information or require a permit in order to ensure that groundwater quality is adequately protected. Further, many state UIC programs have additional prohibitions or permitting requirements for certain types of Class V injection wells.
A shallow groundwater-recharge system at the Pebble site may help to meet two goals:
• Discharge of water from the site in excess of mine operating requirements.
SP Ch5 GW Hydro Rev4.doc 5-15 Rev. 4, 8/6/07
DRAFT ENVIRONMENTAL BASELINE STUDIES, PROPOSED 2007 STUDY PLANS DRAFT
SP Ch5 GW Hydro Rev4.doc 5-16 Rev. 4, 8/6/07
• Aquifer recharge downstream of the mine to mitigate losses that result from mine operations.
This task will therefore include:
• Preparation of a plan for excess water discharge, as required, and possible use of groundwater discharge to minimize potential stream impacts.
• Baseline groundwater characterization for any areas considered for groundwater discharge.
• Soils infiltration and leaching potential characterization for any areas considered for groundwater recharge.
The purpose of this task in 2007 is to provide input to mine design. The effects of aquifer recharge will be addressed following mine design.
5.1.5.9 Meetings
Meetings are required from time to time during this project and are expected in 2007 with NDM, regulators, and other consultants involved in the project.
5.1.6 References
Northern Dynasty Mines Inc. (NDM). In press. Draft Environmental Baseline Studies, 2007 Field Sampling Plans, Groundwater Studies, Mine Study Area.
5.2 Transportation Corridor No data on groundwater hydrology are being collected in the transportation corridor in 2007.

DRAFT GROUNDWATER HYDROLOGY
TABLES
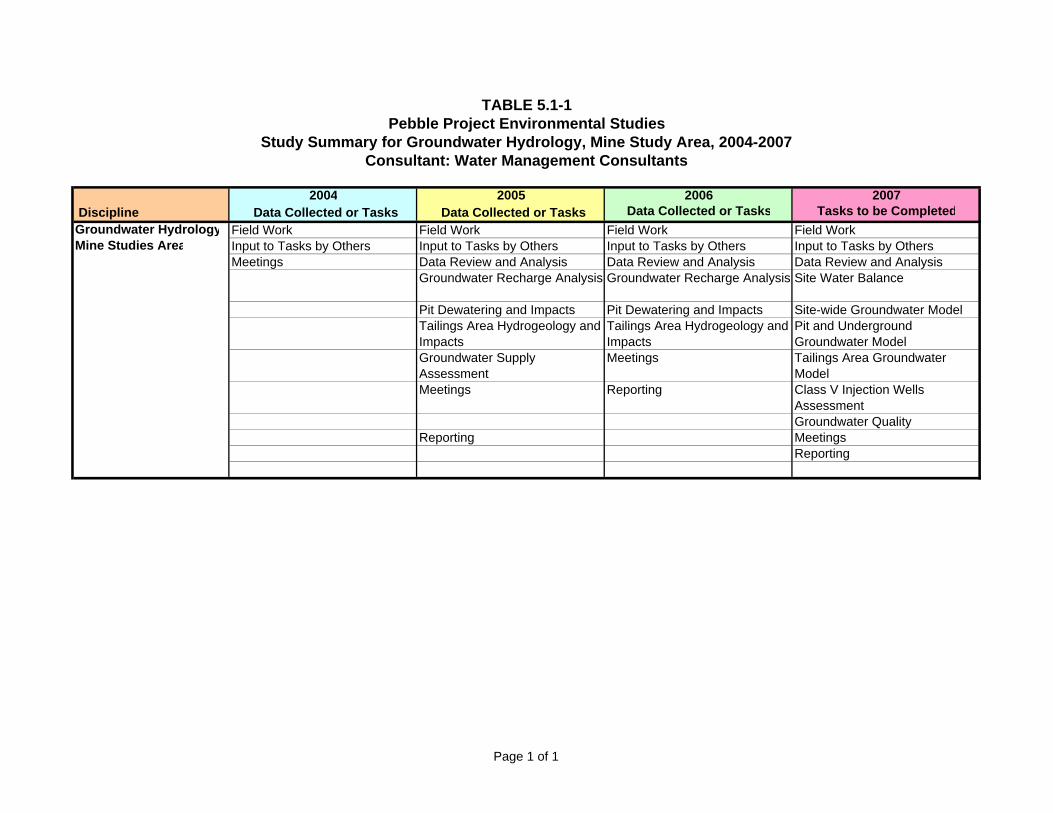
TABLE 5.1-1Pebble Project Environmental Studies
Study Summary for Groundwater Hydrology, Mine Study Area, 2004-2007Consultant: Water Management Consultants
2004 2005 2006 2007 Discipline Data Collected or Tasks Data Collected or Tasks Data Collected or Tasks Tasks to be CompletedGroundwater Hydrology Field Work Field Work Field Work Field WorkMine Studies Area Input to Tasks by Others Input to Tasks by Others Input to Tasks by Others Input to Tasks by Others
Meetings Data Review and Analysis Data Review and Analysis Data Review and AnalysisGroundwater Recharge Analysis Groundwater Recharge Analysis Site Water Balance
Pit Dewatering and Impacts Pit Dewatering and Impacts Site-wide Groundwater ModelTailings Area Hydrogeology and Impacts
Tailings Area Hydrogeology and Impacts
Pit and Underground Groundwater Model
Groundwater Supply Assessment
Meetings Tailings Area Groundwater Model
Meetings Reporting Class V Injection Wells AssessmentGroundwater Quality
Reporting MeetingsReporting
Page 1 of 1
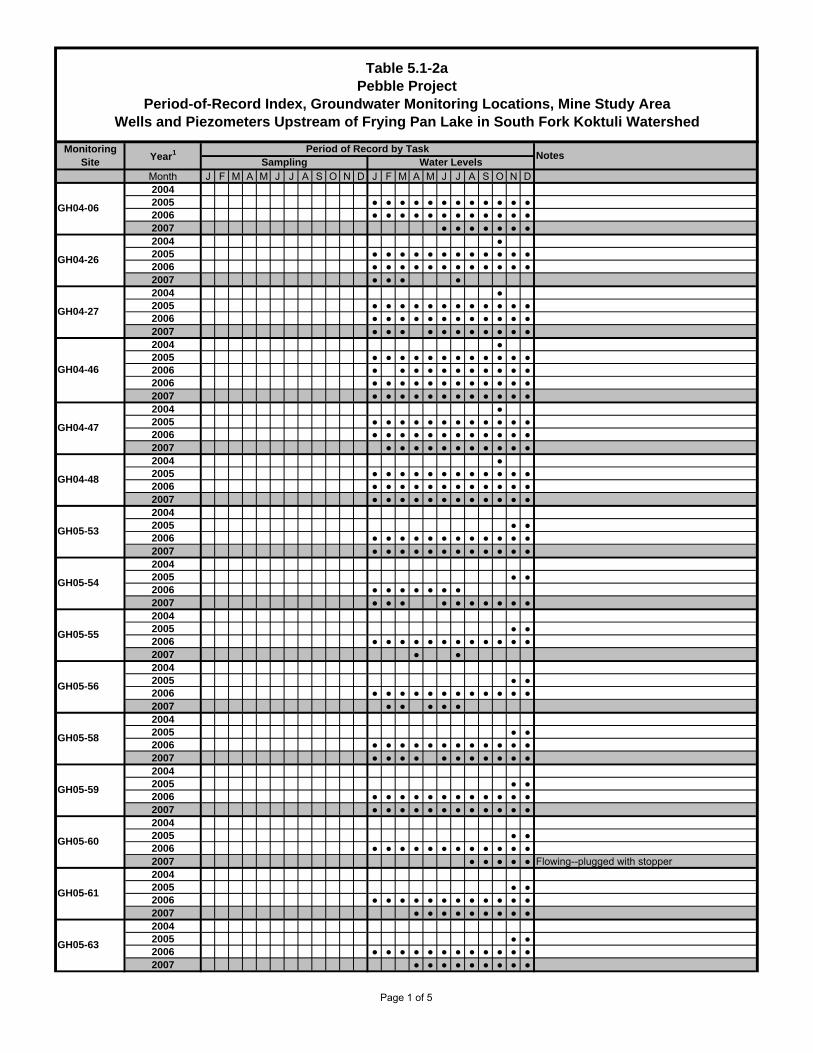
Month J F M A M J J A S O N D J F M A M J J A S O N D20042005 ● ● ● ● ● ● ● ● ● ● ● ●2006 ● ● ● ● ● ● ● ● ● ● ● ●2007 ● ● ● ● ● ● ●2004 ●2005 ● ● ● ● ● ● ● ● ● ● ● ●2006 ● ● ● ● ● ● ● ● ● ● ● ●2007 ● ● ● ●2004 ●2005 ● ● ● ● ● ● ● ● ● ● ● ●2006 ● ● ● ● ● ● ● ● ● ● ● ●2007 ● ● ● ● ● ● ● ● ● ● ●2004 ●2005 ● ● ● ● ● ● ● ● ● ● ● ●2006 ● ● ● ● ● ● ● ● ● ● ●2006 ● ● ● ● ● ● ● ● ● ● ● ●2007 ● ● ● ● ● ● ● ● ● ● ● ●2004 ●2005 ● ● ● ● ● ● ● ● ● ● ● ●2006 ● ● ● ● ● ● ● ● ● ● ● ●2007 ● ● ● ● ● ● ● ● ● ● ●2004 ●2005 ● ● ● ● ● ● ● ● ● ● ● ●2006 ● ● ● ● ● ● ● ● ● ● ● ●2007 ● ● ● ● ● ● ● ● ● ● ● ●20042005 ● ●2006 ● ● ● ● ● ● ● ● ● ● ● ●2007 ● ● ● ● ● ● ● ● ● ● ● ●20042005 ● ●2006 ● ● ● ● ● ● ●2007 ● ● ● ● ● ● ● ● ● ●20042005 ● ●2006 ● ● ● ● ● ● ● ● ● ● ● ●2007 ● ●20042005 ● ●2006 ● ● ● ● ● ● ● ● ● ● ● ●2007 ● ● ● ● ●20042005 ● ●2006 ● ● ● ● ● ● ● ● ● ● ● ●2007 ● ● ● ● ● ● ● ● ● ● ●20042005 ● ●2006 ● ● ● ● ● ● ● ● ● ● ● ●2007 ● ● ● ● ● ● ● ● ● ● ● ●20042005 ● ●2006 ● ● ● ● ● ● ● ● ● ● ● ●2007 ● ● ● ● ● Flowing--plugged with stopper20042005 ● ●2006 ● ● ● ● ● ● ● ● ● ● ● ●2007 ● ● ● ● ● ● ● ● ●20042005 ● ●2006 ● ● ● ● ● ● ● ● ● ● ● ●2007 ● ● ● ● ● ● ● ● ●
GH05-54
GH04-06
GH05-55
GH05-56
GH04-26
GH04-27
GH04-46
GH04-47
GH04-48
GH05-53
GH05-58
GH05-59
GH05-60
GH05-61
GH05-63
Period of Record by Task Notes
Table 5.1-2a Pebble Project
Period-of-Record Index, Groundwater Monitoring Locations, Mine Study AreaWells and Piezometers Upstream of Frying Pan Lake in South Fork Koktuli Watershed
Monitoring Site Year1
Sampling Water Levels
Page 1 of 5
Month J F M A M J J A S O N D J F M A M J J A S O N D
Period of Record by Task Notes
Table 5.1-2a Pebble Project
Period-of-Record Index, Groundwater Monitoring Locations, Mine Study AreaWells and Piezometers Upstream of Frying Pan Lake in South Fork Koktuli Watershed
Monitoring Site Year1
Sampling Water Levels
2004200520062007 ● ● ● ● ●2004200520062007 ● ● ● ● ●2004200520062007 ● ● ● ● ●2004200520062007 ● ● ● ● ●2004200520062007 ● ● ● ● ●20042005 ● ● ● ● ● ● ● ● ● ● ● ●2006 ● ● ● ● ● ● ● ● ● ● ● ●2007 ● ● ● ● ● ● ● ● ●20042005 ● ● ● ● ● ● ● ● ● ● ● ●2006 ● ● ● ● ● ● ● ● ● ● ● ●2007 ● ● ● ● ● ● ● ● ● ● ● ●20042005 ● ● ● ● ● ● ● ● ● ● ● ●2006 ● ● ● ● ● ● ● ● ● ● ● ●2007 ● ● ● ● ● Standpipe plugged to prevent artesian flow20042005 ● ● ● ● ● ● ● ● ● ● ● ●2006 ● ● ● ● ● ● ● ● ● ● ● ●2007 ● ● ● ● ● ● ● ● ● ● ● ●2004 ● ● ●
2005 ● ● ● ● ● ● ● ● ● ● ● ● ● ● ● Well has shallow water: winter sampling was scheduled, but samples were not obtained
2006 ● ● ● ● ● ● ● ● ● ● ● ● ● ● ●2007 ● ● ● ● ● ● ● Standpipe plugged to prevent artesian flow2004 ● ● ●2005 ● ● ● ● ● ● ● ● ● ● ● ● ● ● ● ●2006 ● ● ● ● ● ● ● ● ● ● ● ● ● ● ● ●2007 ● ● ● ● ● ● ● ● ● ● ● ● ● ● ● ●2004 ● ● ●2005 ● ● ● ● ● ● ● ● ● ● ● ● ● ● ● ●2006 ● ● ● ● ● ● ● ● ● ● ● ● ● ● ● ●2007 ● ● ● ● ● ● ● ● ● ● ● ● ● ● ●2004 ●2005 ● ● ● ● ● ● ● ● ● ● ● ● ● ● ● ●2006 ● ● ● ● ● ● ● ● ● ● ● ● ● ● ● ●2007 ● ● ● ● ● ● ● ● ● ● ● ● ● ● ●20042005 ● ● ● ● ● ● ● ● ● ● ● ●2006 ● ● ● ● ● ● ● ● ● ● ● ●2007 ● ● ● ● ● ● ● ● ● ● ● ●20042005 ● ● ● ● ● ● ● ● ● ● ● ●2006 ● ● ● ● ● ● ● ● ● ● ● ●
KP-P3S/SRK-5S
KP-P4
M-110
M-12
I-172
KP-P3D/SRK-5D
KP-P3M/SRK-5M
I-192
I-201
GH06-80
I-125
GH06-70
GH06-71A
GH06-72
GH06-74
Page 2 of 5
Month J F M A M J J A S O N D J F M A M J J A S O N D
Period of Record by Task Notes
Table 5.1-2a Pebble Project
Period-of-Record Index, Groundwater Monitoring Locations, Mine Study AreaWells and Piezometers Upstream of Frying Pan Lake in South Fork Koktuli Watershed
Monitoring Site Year1
Sampling Water Levels
2007 ● ● ● ● ● ● ● ● ● ● ● ●20042005 ● ● ● ● ● ● ● ● ● ● ● ●2006 ● ● ● ● ● ● ● ● ● ● ● ●2007 ● ● ● ● ● ● ● ● ● ● ● ●20042005 ● ● ● ● ● ● ● ● ● ● ● ●2006 ● ● ● ● ● ● ● ● ● ● ● ●2007 ● ● ● ● ● ● ● ● ●2004 ● ● ●2005 ● ● ● ● ● ● ● ● ● ● ● ● ● ● ● ●2006 ● ● ● ● ● ● ● ● ● ● ● ● ● ● ● ●2007 ● ● ● ● ● ● ● ● ● ● ● ● ● ● ●2004 ● ● ●2005 ● ● ● ● ● ● ● ● ● ● ● ● ● ● ● ●2006 ● ● ● ● ● ● ● ● ● ● ● ● ● ● ● ●2007 ● ● ● ● ● ● ● ● ● ● ● ● ● ● ● ●2004 ● ● ●2005 ● ● ● ● ● ● ● ● ● ● ● ● ● ● ● ●2006 ● ● ● ● ● ● ● ● ● ● ● ● ● ● ● ●2007 ● ● ● ● ● ● ● ● ● ● ● ● ● ● ● ●20042005 ● ● ● ● ● ● ● ● ●2006 ● ● ● ● ● ● ● ● ● ● ● ● ● ● ● ●2007 ● ● ● ● ● ● ● ● ● ● ● ● ● ● ● ●20042005 ● ● ● ● ● ● ● ● ●2006 ● ● ● ● ● ● ● ● ● ● ● ● ● ● ● ●2007 ● ● ● ● ● ● ● ● ● ● ● ● ● ● ● ●2004 ●2005 ● ● ● ● ● ● ● ● ● ● ● ●2006 ● ● ● ● ● ● ● ● ● ● ● ●2007 ● ● ● ● ● ● ● ● ● ●2004 ●2005 ● ● ● ● ● ● ● ● ● ● ● ●2006 ● ● ● ● ● ● ● ● ● ● ● ●2007 ● ● ● ● ● ● ● ● ● ●2004 ●2005 ● ● ● ● ● ● ● ● ● ● ● ●2006 ● ● ● ● ● ● ● ● ● ● ● ●2007 ● ● ● ● ● ● ● ● ● ● ● ●2004 ● ●2005 ● ● ● ● ● ● ● ● ● ● ● ●2006 ● ● ● ● ● ● ● ● ● ● ● ●2007 ● ● ● ● ● ● ● ● ● ● ● ●2004 ●2005 ● ● ● ● ● ● ● ● ● ● ● ● ●2006 ● ● ● ● ● ● ● ● ● ● ● ● ● ● ● ●2007 ● ● ● ● ● ● ● ● ● ● ● ● ● ● ● ●2004 ●2005 ● ● ● Piezometer damaged in April 2005, casing at 200620072004 ●2005 ● ● ● ● ● ● ● ● ● ● ● ●2006 ● ● ● ● ● ● ● ● ● ● ● ●2007 ● ● ● ● ● ● ● ● ● ● ● ●
P-6D
P-4MID
P-2M
P-3
P-4AD
P-4AS
MW-5S
MW-05-12D
MW-05-12S
P-2D
M-21
M-62
MW-5D
MW-5M
Page 3 of 5
Month J F M A M J J A S O N D J F M A M J J A S O N D
Period of Record by Task Notes
Table 5.1-2a Pebble Project
Period-of-Record Index, Groundwater Monitoring Locations, Mine Study AreaWells and Piezometers Upstream of Frying Pan Lake in South Fork Koktuli Watershed
Monitoring Site Year1
Sampling Water Levels
2004 ●2005 ● ● ● ● ● ● ● ● ● ● ● ●2006 ● ● ● ● ● ● ● ● ● ● ● ●2007 ● ● ● ● ● ● ● ● ● ● ● ●2004 ●2005 ● ● ● ● ● ● ● ● ● ● ● ●2006 ● ● ● ● ● ● ● ● ● ● ● ●2007 ● ● ● ● ● ● ● ● ● ● ● ●20042005 ● ● ● ● ● ● ●2006 ● ● ● ● ● ● ● ● ● ● ● ●2007 ● ● ● ● ● ● ● ● ● ● ● ●20042005 ● ● ● ● ● ● ●2006 ● ● ● ● ● ● ● ● ● ● ● ●2007 ● ● ● ● ● ● ● ● ● ● ● ●20042005 ● ● ● ● ● ● ●2006 ● ● ● ● ● ● ● ● ● ● ● ●2007 ● ● ● ● ● ● ● ● ● ● ● ●20042005 ● ● ● ● ● ● ●2006 ● ● ● ● ● ● ● ● ● ● ● ●2007 ● ● ● ● ● ● ● ● ● ● ● ●20042005 ● ● ● ● ● ● ●2006 ● ● ● ● ● ● ● ● ● ● ● ●2007 ● ● ● ● ● ● ● ● ● ● ● ●20042005 ● ● ● ● ●2006 ● ● ● ● ● ● ● ● ● ● ● ●2007 ● ● ● ● ● Standpipe plugged to prevent artesian flow20042005 ● ● ● ● ●2006 ● ● ● ● ● ● ● ● ● ● ● ●2007 ● ● ● ● ● ● ● ● ● ● ● ●20042005 ● ● ● ● ●2006 ● ● ● ● ● ● ● ● ● ● ● ●2007 ● ● ● ● ● Standpipe plugged to prevent artesian flow20042005 ● ● ● ● ●2006 ● ● ● ● ● ● ● ● ● ● ● ●2007 ● ● ● ● ● Standpipe plugged to prevent artesian flow20042005 ● ● ● ● ●2006 ● ● ● ● ● ● ● ● ● ● ● ●2007 ● ● ● ● ● ● ●20042005 ● ● ● ●2006 ● ● ● ● ● ● ● ● ● ● ● ●2007 ● ● ● ● ● ● ● ● ● ● ● ●20042005 ● ● ● ●2006 ● ● ● ● ● ● ● ● ● ● ● ●2007 ● ● ● ● ● ● ● ● ● ● ● ●20042005 ● ● ● ●2006 ● ● ● ● ● ● ● ● ● ● ● ●2007 ● ● ● ● ● ● ● ● ● ● ● ●
P-05-21M
P-05-21S
P-05-29D
P-05-29D2
P-05-29M
P-05-09S
P-05-20D
P-05-20S
P-05-21D
P-05-07D
P-05-07S
P-05-08
P-05-09D
P-6M
P-6S
Page 4 of 5
Month J F M A M J J A S O N D J F M A M J J A S O N D
Period of Record by Task Notes
Table 5.1-2a Pebble Project
Period-of-Record Index, Groundwater Monitoring Locations, Mine Study AreaWells and Piezometers Upstream of Frying Pan Lake in South Fork Koktuli Watershed
Monitoring Site Year1
Sampling Water Levels
20042005 ● ● ● ●2006 ● ● ● ● ● ● ● ● ● ● ● ●2007 ● ● ● ● ● ● ● ● ● ●20042005 ● ● ● ●2006 ● ● ● ● ● ● ● ● ● ● ● ●2007 ● ● ● ● ● ● ● ● ● ● ● ●20042005 ● ● ● ●2006 ● ● ● ● ● ● ● ● ● ● ● ●2007 ● ● ● ● ● ● ● ● ● ● ● ●20042005 ● ● ● ●2006 ● ● ● ● ● ● ● ● ● ● ● ●2007 ● ● ● ● ● ● ● ● ● ● ● ●20042005 ● ● ● ● ●2006 ● ● ● ● ● ● ● ● ● ● ● ● ● ● ● ●2007 ● ● ● ● ● ● ● ● ● ● ● ● ● ● ● ●20042005 ● ● ● ● ● ● ● ● ● ●2006 ● ● ● ● ● ● ● ● ● ● ● ●2007 ● ● ● ● ● ● ●20042005 ● ● ● ● ● ● ● ● ● ●2006 ● ● ● ● ● ● ● ● ● ● ● ●2007 ● ● ● ● ● ● ● ● ● ● ● ●20042005 ● ● ● ● ● ● ● ● ● ● ● ●2006 ● ● ● ● ● ● ● ● ● ● ● ●2007 ● ● ● ● ● Frozen or flowing
KEY:GH = Geotechnical HoleMW = Monitoring WellP = PiezometerWL = Wetlands Location
NOTES:1. Work after June 2007 is planned, but not yet completed.
P-05-36M
P-05-36S
PQ-4
SRK-1A
PQ-8
PQ-9
P-05-29S
P-05-36D
Page 5 of 5
Month J F M A M J J A S O N D J F M A M J J A S O N D2004 ●2005 ● ● ● ● ● ● ● ● ● ● ● ●2006 ● ● ● ● ● ● ● ● ● ● ● ●2007 ● ● ● ● ●20042005 ● ● ● ● ● ● ● ● ● ● ● ●2006 ● ● ● ● ● ● ● ● ● ● ● ●2007 ● ● ● ● ● ● ●2004 ●2005 ● ● ● ● ● ● ● ● ● ● ● ●2006 ● ● ● ● ● ● ● ● ● ● ● ●2007 ● ● ● ● ● ●20042005 ● ● ● ● ● ● ● ● ● ● ● ●2006 ● ● ● ● ● ● ● ● ● ● ● ●2007 ● ● ● ● ● ● ●2004 ●2005 ● ● ● ● ● ● ● ● ● ● ● ●2006 ● ● ● ● ● ● ● ● ● ● ● ●2007 ● ● ● ● ● ● ● Dry2004 ●2005 ● ● ● ● ● ● ● ● ● ● ● ●2006 ● ● ● ● ● ● ● ● ● ● ● ●2007 ● ● ● ● ● ● ● ● ● ● ●2004 ●2005 ● ● ● ● ● ● ● ● ● ● ● ●2006 ● ● ● ● ● ● ● ● ● ● ● ●2007 ● ● ● ● ● ● ● ● ● ● ● ●2004 ●2005 ● ● ● ● ● ● ● ● ● ● ● ●2006 ● ● ● ● ● ● ● Caved as of August 06 - remove from list?20072004 ●2005 ● ● ● ● ● ● ● ● ● ● ● ●2006 ● ● ● ● ● ● ● ● ● ● ● ●2007 ● ● ● ● ● ● ● ● ● ● ● ●2004 ●2005 ● ● ● ● ● ● ● ● ● ● ● ●2006 ● ● ● ● ● ● ● ● ● ● ● ●2007 ● ● ● ● ● ● ● ● ● ● ● ●2004 ●2005 ● ● ● ● ● ● ● ● ● ● ● ●2006 ● ● ● ● ● ● ● ● ● ● ● ●2007 ● ● ● ● ● ● ● ● ● ● ● ●2004 ●2005 ● ● ● ● ● ● ● ● ● ● ● ●2006 ● ● ● ● ● ● ● ● ● ● ● ●2007 ● ● ● ● ● ● ●2004 ●2005 ● ● ● ● ● ● ● ● ● ● ● ●2006 ● ● ● ● ● ● ● ● ● ● ● ●2007 ● ● ● ● ● ● ● ● ● ● ● ●2004 ●2005 ● ● ● ● ● ● ● ● ● ● ● ●2006 ● ● ● ● ● ● ● ● ● ● ● ●2007 ● ● ● ● ● ● ● ● ● ● ● ●2004 ●2005 ● ● ● ● ● ● ● ● ● ● ● ●2006 ● ● ● ● ● ● ● ● ● ● ● ●2007 ● ● ●
GH04-03
GH04-05
GH04-04
GH04-14
GH04-16
GH04-17
GH04-10
GH04-11
GH04-12A
GH04-18
GH04-19
GH04-20
GH04-22
GH04-28
GH04-29A
Period of Record by Task Notes
Table 5.1-2b Pebble Project
Period-of-Record Index, Groundwater Monitoring Locations, Mine Study AreaWells and Piezometers Downstream of Frying Pan Lake in South Fork Koktli Watershed
Monitoring Site Year1
Sampling Water Levels
Page 1 of 6
Month J F M A M J J A S O N D J F M A M J J A S O N D
Period of Record by Task Notes
Table 5.1-2b Pebble Project
Period-of-Record Index, Groundwater Monitoring Locations, Mine Study AreaWells and Piezometers Downstream of Frying Pan Lake in South Fork Koktli Watershed
Monitoring Site Year1
Sampling Water Levels
2004 ●2005 ● ● ● ● ● ● ● ● ● ● ● ●2006 ● ● ● ● ● ● ● ● ● ● ● ●2007 ● ● ● ● ● ● ● ● ● ● ● ●2004 ●2005 ● ● ● ● ● ● ● ● ● ● ● ●2006 ● ● ● ● ● ● ● ● ● ● ● ●2007 ● ● ● ● ● ●2004 ●2005 ● ● ● ● ● ● ● ● ● ● ● ●2006 ● ● ● ● ● ● ● ● ● ● ● ●2007 ● ● ● ● ● ● ●2004 ●2005 ● ● ● ● ● ● ● ● ● ● ● ●2006 ● ● ● ● ● ● ● ● ● ● ● ●2007 ● ● ● ● ● ● ● ● ● ● ● ●2004 ●2005 ● ● ● ● ● ● ● ● ● ● ● ●2006 ● ● ● ● ● ● ● ● ● ● ● ●2007 ● ● ● ● ● ● ● ● ●2004 ●2005 ● ● ● ● ● ● ● ● ● ● ● ●2006 ● ● ● ● ● ● ● ● ● ● ● ●2007 ● ● ● ● ● ● ● ● ● ● ● ●2004 ●2005 ● ● ● ● ● ● ● ● ● ● ● ●2006 ● ● ● ● ● ● ● ● ● ● ●2007 ● ● ● ● ● ● ● ● ● ● ● ●20042005 ● ● ● ● ● ● ● ● ● ● ● ●2006 ● ● ● ● ● ● ● ● ● ● ● ●2007 ● ●2004 ●2005 ● ● ● ● ● ● ● ● ● ● ● ●2006 ● ● ● ● ● ● ● ● ● ● ● ●2007 ● Frozen2004 ●2005 ● ● ● ● ● ● ● ● ● ● ● ●2006 ● ● ● ● ● ● ● ● ● ● ● ● Dry year round2007 ● ● ● ● ● ● ●2004 ●2005 ● ● ● ● ● ● ● ● ● ● ● ●2006 ● ● ● ● ● ● ● ● ● ● ● ●2007 ● ● ● ● ● ● ● ● ● ● ● ●2004 ●2005 ● ● ● ● ● ● ● ● ● ● ● ●2006 ● ● ● ● ● ● ● ● ● ● ● ●2007 ● ● ●20042005 ● ● ● ● ● ● ● ● ● ● ● ●2006 ● ● ● ● ● ● ● ● ● ● ● ●2007 ● ● ● ● ● ● ● ● ● ● ● ●20042005 ● ●2006 ● ● ● ● ● ● ● ● ● ● ● ●2007 ● ● ● ● ● ● ●20042005 ● ●2006 ● ● ● ● ● ● ● ● ● ● ● ●2007 ● ● ● ● ● ● ●
GH04-30
GH04-32
GH04-31
GH04-33
GH04-35
GH04-37
GH04-38
GH04-44
GH04-39
GH04-41
GH04-42
GH04-43
GH05-52
GH04-45A
GH05-51
Page 2 of 6
Month J F M A M J J A S O N D J F M A M J J A S O N D
Period of Record by Task Notes
Table 5.1-2b Pebble Project
Period-of-Record Index, Groundwater Monitoring Locations, Mine Study AreaWells and Piezometers Downstream of Frying Pan Lake in South Fork Koktli Watershed
Monitoring Site Year1
Sampling Water Levels
2004200520062007 ● ● ● ● ●2004200520062007 ● ● ● ● ●2004200520062007 ● ● ● ● ●2004 ● ●2005 ● ● ● ● ● ● ● ● ● ● ● ● ● ● ● ●2006 ● ● ● ● ● ● ● ● ● ● ● ● ● ● ● ●2007 ● ● ● ● ● ● ● ● ● ● ● ● ● ● ● ●2004 ● ●2005 ● ● ● ● ● ● ● ● ● ● ● ● ● ● ● ●2006 ● ● ● ● ● ● ● ● ● ● ● ● ● ● ● ●2007 ● ● ● ● ● ● ● ● ● ● ● ● ● ● ● ●2004 ● ●2005 ● ● ● ● ● ● ● ● ● ● ● ● ● ● ● ●2006 ● ● ● ● ● ● ● ● ● ● ● ● ● ● ● ●2007 ● ● ● ● ● ● ● ● ● ● ● ● ● ● ● ●2004 ● ● ●2005 ● ● ● ● ● ● ● ● ● ● ● ● ● ● ● ●2006 ● ● ● ● ● ● ● ● ● ● ● ● ● ● ● ●2007 ● ● ● ● ● ● ● ● ● ● ● ● ● ● ● ●
2004 ● Well was scheduled to be sampled, but excessive silt prevents sampling
2005 ● ● ● ● ● ● ● ● ● ● ● ● ●2006 ● ● ● ● ● ● ● ● ● ● ● ●2007 ● ● ● ● ● ● ● ● ● ● ● ●
2004 ● Well was scheduled to be sampled, but excessive drawdown (due to silt) prevents sampling
2005 ● ● ● ● ● ● ● ● ● ● ● ● ●2006 ● ● ● ● ● ● ● ● ● ● ● ●2007 ● ● ● ● ● ● ● ● ● ● ● ●
2004 ● Well was scheduled to be sampled, but excessive silt prevents sampling
2005 ● ● ● ● ● ● ● ● ● ● ● ●2006 ● ● ● ● ● ● ● ● ● ● ● ●2007 ● ● ● ● ● ● Dry/frozen all 2007 dates2004 ●2005 ● ● ● ● ● ● ● ● ● ● ● ● ● ● ●2006 ● ● ● ● ● ● ● ● ● ● ● ● ● ● ● ●2007 ● ● ● ● ● ● ● ● ● ● ● ● ● ● ●2004 ● ●2005 ● ● ● ● ● ● ● ● ● ● ● ● ● ● ● ●2006 ● ● ● ● ● ● ● ● ● ● ● ● ● ● ● ●2007 ● ● ● ● ● ● ● ● ● ● ● ● ● ● ● ●2004 ● ●2005 ● ● ● ● ● ● ● ● ● ● ● ● ● ● ● ●2006 ● ● ● ● ● ● ● ● ● ● ● ● ● ● ● ●2007 ● ● ● ● ● ● ● ● ● ● ● ● ● ● ● ●2004 ● ●2005 ● ● ● ● ● ● ● ● ● ● ● ● ● ● ● ●2006 ● ● ● ● ● ● ● ● ● ● ● ● ● ● ● ●2007 ● ● ● ● ● ● ● ● ● ● ● ● ●
MW-11M
MW-11S
MW-1D
MW-1M
MW-1S
MW-2D
MW-05-2M
MW-2S
MW-05-2SR
MW-3D
MW-11D
GH06-77
GH06-76
GH06-75
Page 3 of 6
Month J F M A M J J A S O N D J F M A M J J A S O N D
Period of Record by Task Notes
Table 5.1-2b Pebble Project
Period-of-Record Index, Groundwater Monitoring Locations, Mine Study AreaWells and Piezometers Downstream of Frying Pan Lake in South Fork Koktli Watershed
Monitoring Site Year1
Sampling Water Levels
20042005 ● ● ● ● ●
2006 ● ● ● ● ● ● ● ● ● ● ● ● ● ● ● Well has shallow water: winter sampling was scheduled, but sample was not obtained
2007 ● ● ● ● ● ● ● ● ● ● ●20042005 ● ● ● ● ● ● ● ●2006 ● ● ● ● ● ● ● ● ● ● ● ● ● ● ● ●2007 ● ● ● ● ● ● ● ● ● ● ● ● ● ●20042005 ● ● ● ● ● ● ● ●2006 ● ● ● ● ● ● ● ● ● ● ● ● ● ● ● ●2007 ● ● ● ● ● ● ● ● ● ● ● ● ● ● ● ●20042005 ● ● ● ● ● ●2006 ● ● ● ● ● ● ● ● ● ● ● ● ● ● ● ●2007 ● ● ● ● ● ● ● ● ● ● ● ● ● ● ● ●20042005 ● ● ● ● ● ●2006 ● ● ● ● ● ● ● ● ● ● ● ● ● ● ● ●2007 ● ● ● ● ● ● ● ● ● ● ● ● ● ● ●20042005 ● ● ● ● ● ●2006 ● ● ● ● ● ● ● ● ● ● ● ●2007 ● ● ● ● ● ● ● ● ● ● ● ●20042005 ● ● ● ● ● ●2006 ● ● ● ● ● ● ● ● ● ● ● ●2007 ● ● ● ● ● ● ● ● ● ● ● ●20042005 ● ● ● ● ●2006 ● ● ● ● ● ● ● ● ● ● ● ●2007 ● ● ● ● ● ● ● ● ● ● ● ●20042005 ● ● ● ● ●2006 ● ● ● ● ● ● ● ● ● ● ● ●2007 ● ● ● ● ● ● ● ● ● ● ● ●20042005 ● ● ● ● ●2006 ● ● ● ● ● ● ● ● ● ● ● ●2007 ● ● ● ● ● ● ● ● ● ● ● ●20042005 ● ● ● ● ● ●2006 ● ● ● ● ● ● ● ● ● ● ● ●2007 ● ● ● ● ● ● ● ● ● ● ● ●20042005 ● ● ● ● ● ●2006 ● ● ● ● ● ● ● ● ● ● ● ●2007 ● ● ● ● ● ● ● ● ● ● ● ●20042005 ● ● ● ● ● ●2006 ● ● ● ● ● ● ● ● ● ● ● ●2007 ● ● ● ● ● ● ● ● ● ● ● ●20042005 ● ● ● ● ● ●2006 ● ● ● ● ● ● ● ● ● ● ● ●2007 ● ● ● ● ● ● ● ● ● ● ●20042005 ● ● ● ● ● ●2006 ● ● ● ● ● ● ● ● ● ● ● ●2007 ● ● ● ● ● ● Frozen/dry all 2007
P-05-14D
P-05-14S
P-05-15D
P-05-11M
P-05-11S
P-05-12
P-05-13
MW-05-14S
P-05-10D
P-05-10S
P-05-11D
MW-05-11SS2
MW-05-13D
MW-05-13S
MW-05-14D
Page 4 of 6
Month J F M A M J J A S O N D J F M A M J J A S O N D
Period of Record by Task Notes
Table 5.1-2b Pebble Project
Period-of-Record Index, Groundwater Monitoring Locations, Mine Study AreaWells and Piezometers Downstream of Frying Pan Lake in South Fork Koktli Watershed
Monitoring Site Year1
Sampling Water Levels
20042005 ● ● ● ● ● ●2006 ● ● ● ● ● ● ● ● ● ● ● ●2007 ● ● ● ● ● ● ● ● ● ● ● ●20042005 ● ● ● ● ● ●2006 ● ● ● ● ● ● ● ● ● ● ● ●2007 ● ● ● ● ● ● ● ● ● ● ● ●20042005 ● ● ● ● ● ●2006 ● ● ● ● ● ● ● ● ● ● ● ●2007 ● ● ● ● ● ● ● ● ● ● ● ●20042005 ● ● ● ● ● ●2006 ● ● ● ● ● ● ● ● ● ● ● ●2007 ● ● ● ● ● ● ● ● ● ● ● ●20042005 ● ● ● ● ● ●2006 ● ● ● ● ● ● ● ● ● ● ● ●2007 ● ● ● ● ● ● ●20042005 ● ● ● ● ● ●2006 ● ● ● ● ● ● ● ● ● ● ● ●2007 ● ● ● ● ● ● ● ● ● ● ● ●20042005 ● ● ● ● ● ●2006 ● ● ● ● ● ● ● ● ● ● ● ●2007 ● ● ● ● ● ● ● ● ● ● ● ●20042005 ● ● ● ● ● ●2006 ● ● ● ● ● ● ● ● ● ● ● ●2007 ● ● ● ● ● ● ● ● ● ● ● ●20042005 ● ● ● ● ●2006 ● ● ● ● ● ● ● ● ● ● ● ●2007 ● ● ● ● ● ● ● ● ● ● ● ●20042005 ● ● ● ● ●2006 ● ● ● ● ● ● ● ● ● ● ● ●2007 ● ● ● ● ● ● ● ● ● ● ● ●20042005 ● ● ● ● ●2006 ● ● ● ● ● ● ● ● ● ● ● ●2007 ● ● ● ● ● ● ● ● ● ● ● ●20042005 ● ● ● ● ●2006 ● ● ● ● ● ● ● ● ● ● ● ●2007 ● ● ● ● ● ● ● ● ● ● ● ●20042005 ● ● ● ● ●2006 ● ● ● ● ● ● ● ● ● ● ● ●2007 ● ● ● ● ● ● ● ● ● ● ● ●20042005 ● ● ● ● ●2006 ● ● ● ● ● ● ● ● ● ● ● ●2007 ● ● ● ● ● ● ● ● ● ● ● ●20042005 ● ● ● ● ●2006 ● ● ● ● ● ● ● ● ● ● ● ●2007 ● ● ● ● ● ● ● ● ● ● ● ●
P-05-25
P-05-22D
P-05-23
P-05-24D
P-05-24S
P-05-17D
P-05-17S
P-05-19D
P-05-19S
P-05-18
P-05-16D
P-05-16M
P-05-16S
P-05-16SS
P-05-15S
Page 5 of 6
Month J F M A M J J A S O N D J F M A M J J A S O N D
Period of Record by Task Notes
Table 5.1-2b Pebble Project
Period-of-Record Index, Groundwater Monitoring Locations, Mine Study AreaWells and Piezometers Downstream of Frying Pan Lake in South Fork Koktli Watershed
Monitoring Site Year1
Sampling Water Levels
20042005 ● ● ● ●2006 ● ● ● ● ● ● ● ● ● ● ● ●2007 ● ● ● ● ● ● ● ● ● ● ● ●20042005 ● ● ● ●2006 ● ● ● ● ● ● ● ● ● ● ● ●2007 ● ● ● ● ● ● ● ● ● ●20042005 ● ● ● ●2006 ● ● ● ● ● ● ● ● ● ● ● ●2007 ● ● ● ● ● ● ● ● ● ● ● ●20042005 ● ● ● ●2006 ● ● ● ● ● ● ● ● ● ● ● ●2007 ● ● ● ● ● ● ● ● ● ● ●20042005 ● ● ● ●2006 ● ● ● ● ● ● ● ● ● ● ● ●2007 ● ● ● ● ● ● ● ● ●20042005 ● ● ● ●2006 ● ● ● ● ● ● ● ● ● ● ● ●2007 ● ● ● ● ● ● ● ● ● ● ● ●
KEY:GH = Geotechnical HoleMW = Monitoring WellP = PiezometerWL = Wetlands Location
NOTES:1. Work after June 2007 is planned, but not yet completed.2. Well MW-05-11SS is at the same location as MW-11 shown on Figure 5.1-2.
P-05-27D
P-05-27M
P-05-27S
P-05-26D
P-05-26M
P-05-26S
Page 6 of 6
Month J F M A M J J A S O N D J F M A M J J A S O N D2004 ●2005 ● ● ● ● ● ● ● ● ● ● ● ●2006 ● ● ● ● ● ● ● ● ● ● ● ●2007 Caved in2004 ●2005 ● ● ● ● ● ● ● ● ● ● ● ●2006 ● ● ● ● ● ● ● ● ● ● ● ●2007 ● ● ● ● ● ● ●2004 ●2005 ● ● ● ● ● ● ● ● ● ● ● ●2006 ● ● ● ● ● ● ● ● ● ● ● ●2007 ● ● ● ● ● ● ● ● ● ● ● ●20042005 ● ● ● ● ● ● ● ● ● ● ● ●2006 ● ● ● ● ● ● ● ● ● ● ● ●2007 ● ● ● ● ● ● ● ● ● ● ● ●20042005 ● ●2006 ● ● ● ● ● ● ● ● ● ● ● ●2007 ● ● ● ● ● ● ● ● ● ● ● ●2004200520062007 ● ● ● ● ●2004200520062007 ● ● ● ● ●2004200520062007 ● ● ● ● ●2004200520062007 ● ● ● ● ●2004 ● ● ●2005 ● ● ● ● ● ● ● ● ● ● ● ● ● ● ● ●2006 ● ● ● ● ● ● ● ● ● ● ● ● ● ● ● ●2007 ● ● ● ● ● ● ● ● ● ● ● ● ● ● ● ●2004 ● ● ●2005 ● ● ● ● ● ● ● ● ● ● ● ● ● ● ● ●2006 ● ● ● ● ● ● ● ● ● ● ● ● ● ● ● ●2007 ● ● ● ● ● ● ● ● ● ● ● ● ● ● ● ●2004 ● ● ●2005 ● ● ● ● ● ● ● ● ● ● ● ● ● ● ● ●2006 ● ● ● ● ● ● ● ● ● ● ● ● ● ● ● ●2007 ● ● ● ● ● ● ● ● ● ● ●2004 ● ● ●2005 ● ● ● ● ● ● ● ● ● ● ● ● ● ● ● ●2006 ● ● ● ● ● ● ● ● ● ● ● ● ● ● ● ●2007 ● ● ● ● ● ● ● ● ● ● ● ● ● ● ●2004 ● ● ●2005 ● ● ● ● ● ● ● ● ● ● ● ● ● ● ● ●2006 ● ● ● ● ● ● ● ● ● ● ● ● ● ● ● ●2007 ● ● ● ● ● ● ● ● ● ● ● ● ● ● ● ●2004 ● ● ●2005 ● ● ● ● ● ● ● ● ● ● ● ● ● ● ● ●2006 ● ● ● ● ● ● ● ● ● ● ● ● ● ● ● ●2007 ● ● ● ● ● ● ● ● ● ● ● ● ● ● ● ●
Period of Record by Task Notes
Table 5.1-2c Pebble Project
Period-of-Record Index, Groundwater Monitoring Locations, Mine Study AreaWells and Piezometers in North Fork Koktuli Watershed
Monitoring Site Year1
GH06-69
GH06-68
GH06-67
GH06-66
GH04-01
Sampling Water Levels
GH05-57
GH04-23
GH04-25
GH04-08
MW-6D
MW-7D
MW-7S
MW-8D
MW-8M
MW-8S
Page 1 of 2
Month J F M A M J J A S O N D J F M A M J J A S O N D
Period of Record by Task Notes
Table 5.1-2c Pebble Project
Period-of-Record Index, Groundwater Monitoring Locations, Mine Study AreaWells and Piezometers in North Fork Koktuli Watershed
Monitoring Site Year1
Sampling Water Levels
2004 ● ● ●
2005 ● ● ● ● ● ● ● ● ● ● ● ● ● ● ● Well has shallow water: winter sampling was scheduled, but samples were not obtained
2006 ● ● ● ● ● ● ● ● ● ● ● ● ● ● ●2007 ● ● ● ● ● ● ● Standpipe plugged to prevent artesian flow2004 ● ●2005 ● ● ● ● ● ● ● ● ● ● ● ● ● ● ● ●2006 ● ● ● ● ● ● ● ● ● ● ● ● ● ● ● ●2007 ● ● ● ● ● ● ● ● ● ● ● ● ● ● ● ●
KEY:GH = Geotechnical HoleMW = Monitoring WellP = PiezometerWL = Wetlands Location
NOTES:1. Work after June 2007 is planned, but not yet completed.
MW-9D
MW-10
Page 2 of 2
Month J F M A M J J A S O N D J F M A M J J A S O N D2004 ●2005 ● ● ● ● ● ● ● ● ● ● ● ●2006 ● ● ● ● ● ● ● ● ● ● ● ●2007 ● ● ● ● ● ● ● ● ● ● ● ●2004 ●2005 ● ● ● ● ● ● ● ● ● ● ● ●2006 ● ● ● ● ● ● ● ● ● ● ● ●2007 ● ● ● ●20042005 ● ●2006 ● ● ● ● ● ● ● ● ● ● ● ●2007 ● ● ● ● ● ● ● ● ● ● ● ●2004200520062007 ● ● ● ● ●2004 ●2005 ● ● ● ● ● ● ● ● ● ● ● ● ● ● ● ●2006 ● ● ● ● ● ● ● ● ● ● ● ● ● ● ● ●2007 ● ● ● ● ● ● ● ● ● ● ● ● ● ● ● ●
2004 Well was scheduled to be sampled, but lack of water precluded sampling
2005 ● ● ● ● ● ● ● ● ● ● ● ●2006 ● ● ● ● ● ● ● ● ● ● ● ●2007 ● ● ● ● ● ● ●20042005 ● ● ● ●2006 ● ● ● ● ● ● ● ● ● ● ● ●2007 ● ● ● ● ● ● ● ● ● ● ● ●20042005 ● ● ● ●2006 ● ● ● ● ● ● ● ● ● ● ● ●2007 ● ● ● ● ● ● ● ● ● ● ● ●20042005 ● ● ● ●2006 ● ● ● ● ● ● ● ● ● ● ● ●2007 ● ● ● ● ● ● ● ● ● ● ● ●20042005 ● ● ● ●2006 ● ● ● ● ● ● ● ● ● ● ● ●2007 ● ● ● ● ● ● ● ● ● ● ● ●20042005 ● ● ● ●2006 ● ● ● ● ● ● ● ● ● ● ● ●2007 ● ● ● ● ● ● ● ● ● ● ● ●20042005 ● ● ● ●2006 ● ● ● ● ● ● ● ● ● ● ● ●2007 ● ● ● ● ● ● ● ● ● ● ● ●20042005 ● ● ● ●2006 ● ● ● ● ● ● ● ● ● ● ● ●2007 ● ● ● ● ● ● ● ● ● ● ● ●20042005 ● ● ● ●2006 ● ● ● ● ● ● ● ● ● ● ● ●2007 ● ● ● ● ● ● ● ● ● ● ● ●20042005 ● ● ● ●2006 ● ● ● ● ● ● ● ● ● ● ● ●2007 ● ● ● ● ● ● ●
Period of Record by Task Notes
Table 5.1-2d Pebble Project
Period-of-Record Index, Groundwater Monitoring Locations, Mine Study AreaWells and Piezometers in Upper Talarik Watershed
Monitoring Site Year1
Sampling Water Levels
P-05-28S
P-05-33D
P-05-34D
P-05-30D
P-05-30S
P-05-31D
GH04-02
GH06-78
MW-4 (Stand 1)
P-05-28D
GH05-64
KP-P1/SRK-2
GH04-13
P-05-31S
P-05-32D
Page 1 of 3

Month J F M A M J J A S O N D J F M A M J J A S O N D
Period of Record by Task Notes
Table 5.1-2d Pebble Project
Period-of-Record Index, Groundwater Monitoring Locations, Mine Study AreaWells and Piezometers in Upper Talarik Watershed
Monitoring Site Year1
Sampling Water Levels
20042005 ● ● ● ●2006 ● ● ● ● ● ● ● ● ● ● ● ●2007 ● ● ● ● ● ● ● ● ● ● ● ●
P-05-35D
Page 2 of 3
Month J F M A M J J A S O N D J F M A M J J A S O N D
Period of Record by Task Notes
Table 5.1-2d Pebble Project
Period-of-Record Index, Groundwater Monitoring Locations, Mine Study AreaWells and Piezometers in Upper Talarik Watershed
Monitoring Site Year1
Sampling Water Levels
200420052006 ● ● ● ● ● ●2007 ● ● ● ● ● ● ● ● ● ● ● ● ● ● ● ●200420052006 ● ● ● ● ● ●2007 ● ● ● ● ● ● ● ● ● ● ● ● ● ● ● ●200420052006 ● ● ● ● ● ●2007 ● ● ● ● ● ● ● ● ● ● ● ● ● ● ● ●200420052006 ● ● ● ● ● ●2007 ● ● ● ● ● ● ● Standpipe plugged to prevent artesian flow200420052006 ● ● ● ● ● ● ● ● ● ● ● ●2007 ● ● ● ● ● ● ● ● ● ● ● ●200420052006 ● ● ● ● ● ● ● ● ● ● ● ●2007 ● ● ● ● ● ● ● ● ● ● ● ●200420052006 ● ● ● ● ● ● ● ● ● ● ● ●2007 ● ● ● ● ● ● ● ● ● ● ● ●200420052006 ● ● ● ● ● ● ● ● ● ● ● ●2007 ● ● ● ● ● Standpipe plugged to prevent artesian flow200420052006 ● ● ● ● ● ● ● ● ● ● ● ●2007 ● ● ● ● ● Plugged, casing flush with ground200420052006 ● ● ● ● ● ● ● ● ● ● ● ●2007 ● ● ● ● ● ● ● ●200420052006 ● ● ● ● ● ● ● ● ● ● ● ●2007 ● ● ● ● ● ● ●200420052006 ● ● ● ● ● ● ● ● ● ● ● ●2007 ● ● ● ● ● ● ● ●200420052006 ● ● ● ● ● ● ● ● ● ● ● ●2007 ● ● ● ● ● ● ● ● ●2004 ●2005 ● ● ● ● ● ● ● ● ● ● ● ●2006 ● ● ● ● ● ● ● ● ● ● ● ●2007 ● ● ● ● ● ● ● ● ● ● ● ●2004 ●2005 ● ● ● ● ● ● ● ● ● ● ● ● ●2006 ● ● ● ● ● ● ● ● ● ● ● ● ● ● ● ●2007 ● ● ● ● ● ● ● ● ● ● ● ● ● ● ● ●
KEY:GH = Geotechnical HoleMW = Monitoring WellP = PiezometerWL = Wetlands Location
NOTES:1. Work after June 2007 is planned, but not yet completed.
P-06-39S
P-06-39D
P-06-38M
P-06-38D
P-06-41D
P-06-40S
P-06-40M
P-06-40D
SRK-3
SRK-2A
P-06-41S
P-06-37S
P-06-37M
P-06-37D
P-06-41M
Page 3 of 3
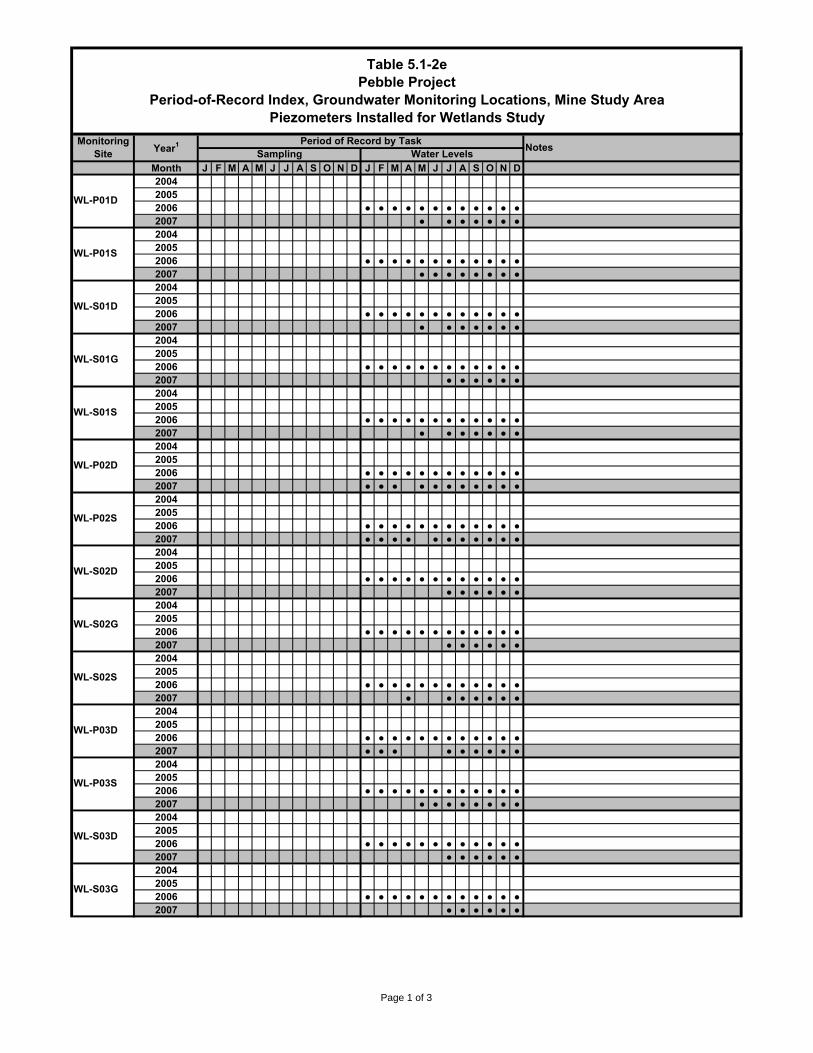
Month J F M A M J J A S O N D J F M A M J J A S O N D200420052006 ● ● ● ● ● ● ● ● ● ● ● ●2007 ● ● ● ● ● ● ●200420052006 ● ● ● ● ● ● ● ● ● ● ● ●2007 ● ● ● ● ● ● ● ●200420052006 ● ● ● ● ● ● ● ● ● ● ● ●2007 ● ● ● ● ● ● ●200420052006 ● ● ● ● ● ● ● ● ● ● ● ●2007 ● ● ● ● ● ●200420052006 ● ● ● ● ● ● ● ● ● ● ● ●2007 ● ● ● ● ● ● ●200420052006 ● ● ● ● ● ● ● ● ● ● ● ●2007 ● ● ● ● ● ● ● ● ● ● ●200420052006 ● ● ● ● ● ● ● ● ● ● ● ●2007 ● ● ● ● ● ● ● ● ● ● ●200420052006 ● ● ● ● ● ● ● ● ● ● ● ●2007 ● ● ● ● ● ●200420052006 ● ● ● ● ● ● ● ● ● ● ● ●2007 ● ● ● ● ● ●200420052006 ● ● ● ● ● ● ● ● ● ● ● ●2007 ● ● ● ● ● ● ●200420052006 ● ● ● ● ● ● ● ● ● ● ● ●2007 ● ● ● ● ● ● ● ● ●200420052006 ● ● ● ● ● ● ● ● ● ● ● ●2007 ● ● ● ● ● ● ● ●200420052006 ● ● ● ● ● ● ● ● ● ● ● ●2007 ● ● ● ● ● ●200420052006 ● ● ● ● ● ● ● ● ● ● ● ●2007 ● ● ● ● ● ●
Period of Record by Task Notes
Table 5.1-2ePebble Project
Period-of-Record Index, Groundwater Monitoring Locations, Mine Study AreaPiezometers Installed for Wetlands Study
Monitoring Site Year1
Sampling Water Levels
WL-P01S
WL-P02S
WL-S03D
WL-S03G
WL-S02D
WL-S02G
WL-S02S
WL-S01D
WL-P03D
WL-P03S
WL-P01D
WL-S01G
WL-S01S
WL-P02D
Page 1 of 3
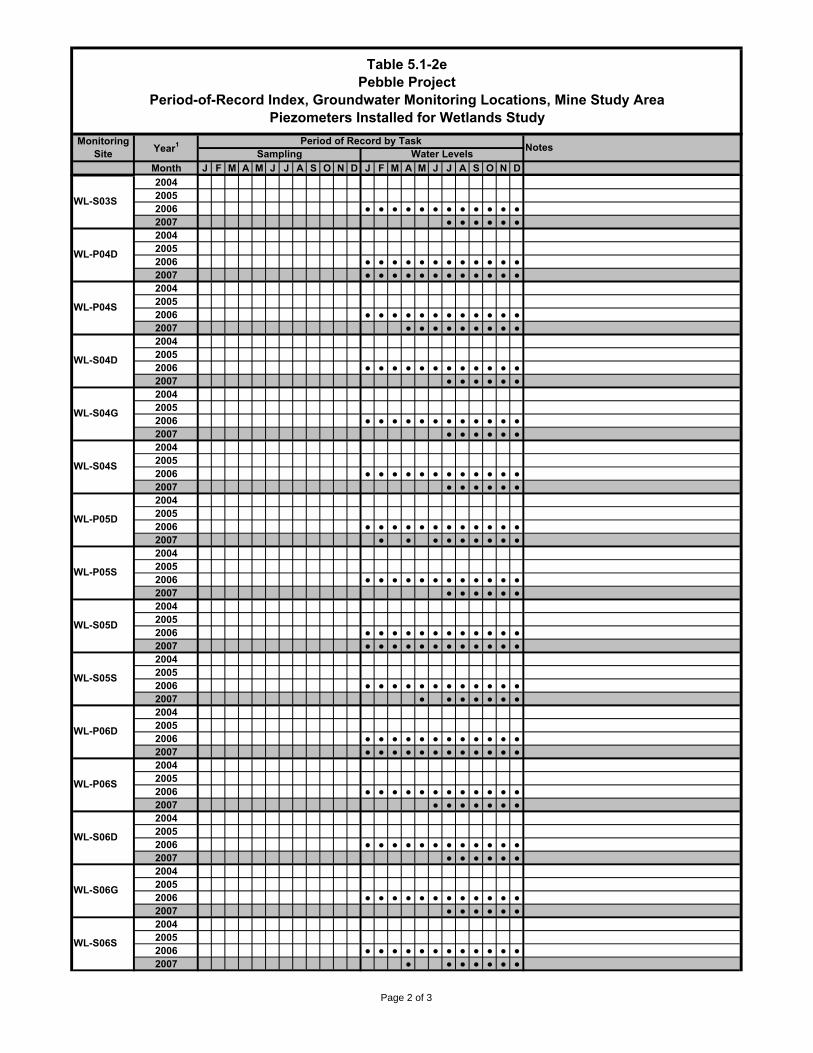
Month J F M A M J J A S O N D J F M A M J J A S O N D
Period of Record by Task Notes
Table 5.1-2ePebble Project
Period-of-Record Index, Groundwater Monitoring Locations, Mine Study AreaPiezometers Installed for Wetlands Study
Monitoring Site Year1
Sampling Water Levels
200420052006 ● ● ● ● ● ● ● ● ● ● ● ●2007 ● ● ● ● ● ●200420052006 ● ● ● ● ● ● ● ● ● ● ● ●2007 ● ● ● ● ● ● ● ● ● ● ● ●200420052006 ● ● ● ● ● ● ● ● ● ● ● ●2007 ● ● ● ● ● ● ● ● ●200420052006 ● ● ● ● ● ● ● ● ● ● ● ●2007 ● ● ● ● ● ●200420052006 ● ● ● ● ● ● ● ● ● ● ● ●2007 ● ● ● ● ● ●200420052006 ● ● ● ● ● ● ● ● ● ● ● ●2007 ● ● ● ● ● ●200420052006 ● ● ● ● ● ● ● ● ● ● ● ●2007 ● ● ● ● ● ● ● ● ●200420052006 ● ● ● ● ● ● ● ● ● ● ● ●2007 ● ● ● ● ● ●200420052006 ● ● ● ● ● ● ● ● ● ● ● ●2007 ● ● ● ● ● ● ● ● ● ● ● ●200420052006 ● ● ● ● ● ● ● ● ● ● ● ●2007 ● ● ● ● ● ● ●200420052006 ● ● ● ● ● ● ● ● ● ● ● ●2007 ● ● ● ● ● ● ● ● ● ● ● ●200420052006 ● ● ● ● ● ● ● ● ● ● ● ●2007 ● ● ● ● ● ● ●200420052006 ● ● ● ● ● ● ● ● ● ● ● ●2007 ● ● ● ● ● ●200420052006 ● ● ● ● ● ● ● ● ● ● ● ●2007 ● ● ● ● ● ●200420052006 ● ● ● ● ● ● ● ● ● ● ● ●2007 ● ● ● ● ● ● ●
WL-S03S
WL-S06D
WL-P06S
WL-P06D
WL-S05S
WL-S05D
WL-P05S
WL-P05D
WL-S04S
WL-S04G
WL-S06G
WL-S04D
WL-P04S
WL-P04D
WL-S06S
Page 2 of 3
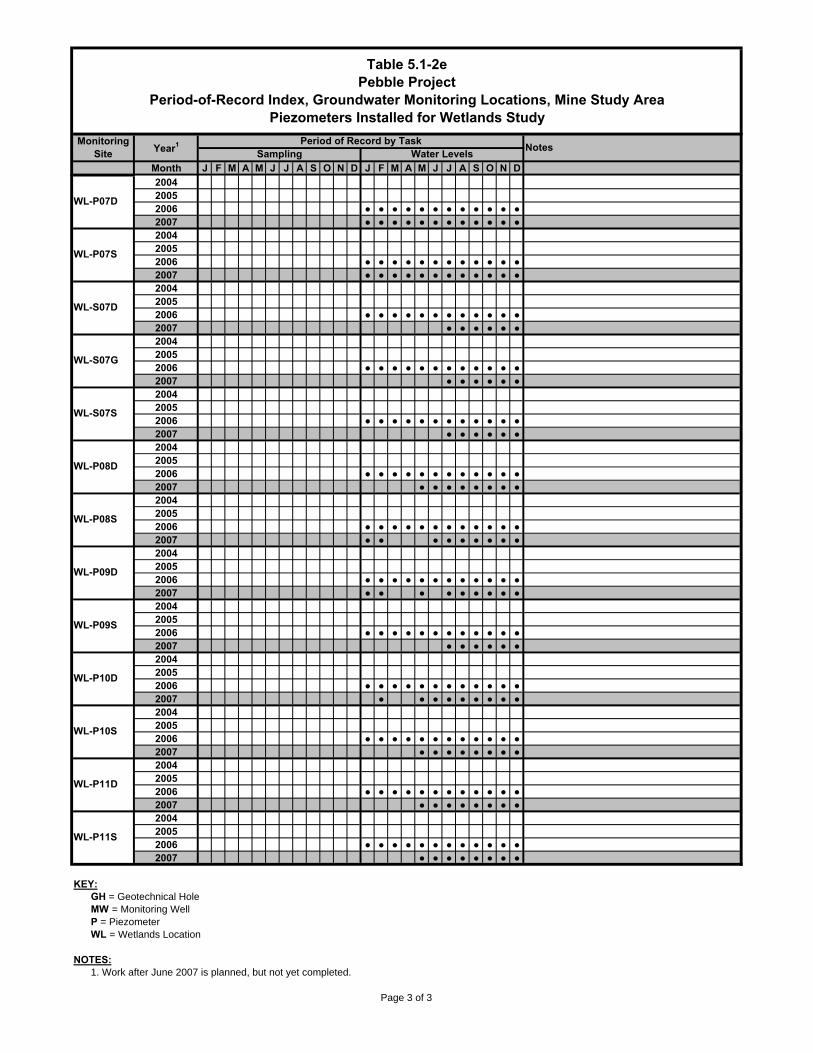
Month J F M A M J J A S O N D J F M A M J J A S O N D
Period of Record by Task Notes
Table 5.1-2ePebble Project
Period-of-Record Index, Groundwater Monitoring Locations, Mine Study AreaPiezometers Installed for Wetlands Study
Monitoring Site Year1
Sampling Water Levels
200420052006 ● ● ● ● ● ● ● ● ● ● ● ●2007 ● ● ● ● ● ● ● ● ● ● ● ●200420052006 ● ● ● ● ● ● ● ● ● ● ● ●2007 ● ● ● ● ● ● ● ● ● ● ● ●200420052006 ● ● ● ● ● ● ● ● ● ● ● ●2007 ● ● ● ● ● ●200420052006 ● ● ● ● ● ● ● ● ● ● ● ●2007 ● ● ● ● ● ●200420052006 ● ● ● ● ● ● ● ● ● ● ● ●2007 ● ● ● ● ● ●200420052006 ● ● ● ● ● ● ● ● ● ● ● ●2007 ● ● ● ● ● ● ● ●200420052006 ● ● ● ● ● ● ● ● ● ● ● ●2007 ● ● ● ● ● ● ● ● ●200420052006 ● ● ● ● ● ● ● ● ● ● ● ●2007 ● ● ● ● ● ● ● ● ●200420052006 ● ● ● ● ● ● ● ● ● ● ● ●2007 ● ● ● ● ● ●200420052006 ● ● ● ● ● ● ● ● ● ● ● ●2007 ● ● ● ● ● ● ● ● ●200420052006 ● ● ● ● ● ● ● ● ● ● ● ●2007 ● ● ● ● ● ● ● ●200420052006 ● ● ● ● ● ● ● ● ● ● ● ●2007 ● ● ● ● ● ● ● ●200420052006 ● ● ● ● ● ● ● ● ● ● ● ●2007 ● ● ● ● ● ● ● ●
KEY:GH = Geotechnical HoleMW = Monitoring WellP = PiezometerWL = Wetlands Location
NOTES:1. Work after June 2007 is planned, but not yet completed.
WL-P07D
WL-P07S
WL-S07D
WL-S07G
WL-S07S
WL-P08D
WL-P08S
WL-P11D
WL-P11S
WL-P09D
WL-P09S
WL-P10D
WL-P10S
Page 3 of 3
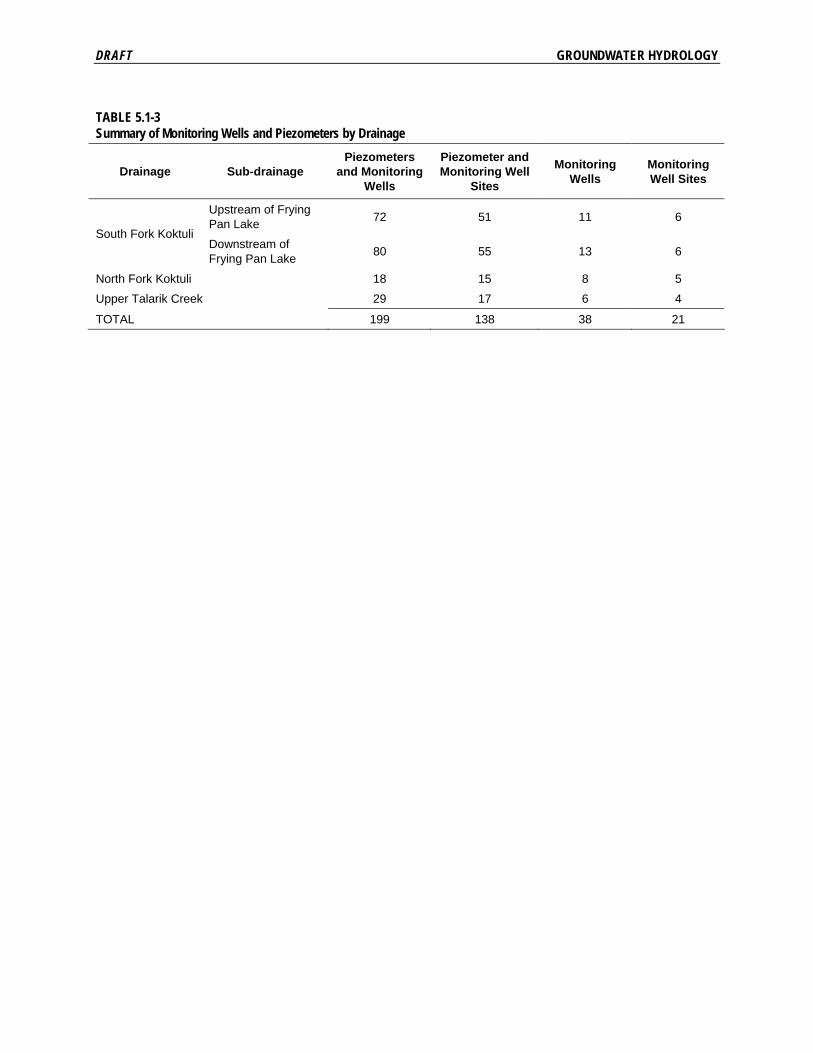
DRAFT GROUNDWATER HYDROLOGY
TABLE 5.1-3 Summary of Monitoring Wells and Piezometers by Drainage
Drainage Sub-drainage Piezometers
and Monitoring Wells
Piezometer and Monitoring Well
Sites
Monitoring Wells
Monitoring Well Sites
Upstream of Frying Pan Lake 72 51 11 6
South Fork Koktuli Downstream of Frying Pan Lake 80 55 13 6
North Fork Koktuli 18 15 8 5
Upper Talarik Creek 29 17 6 4
TOTAL 199 138 38 21

DRAFT GROUNDWATER HYDROLOGY
FIGURES
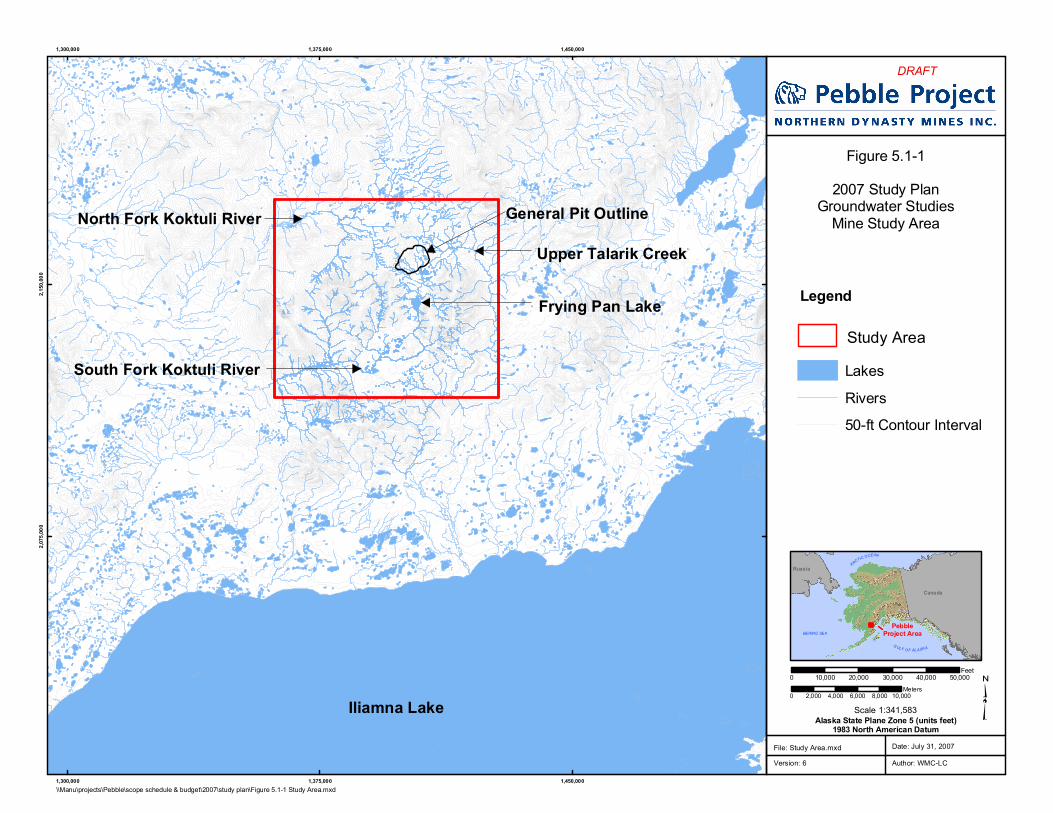
Canada
ARCTIC OCEAN
PebbleProject Area
G ULF O F AL ASKA
Russia
BERING SEA
1,300,000
1,300,000
1,375,000
1,375,000
1,450,000
1,450,000
2,075
,000
2,150
,000
Legend
0 2,000 4,000 6,000 8,000 10,000Meters
0 10,000 20,000 30,000 40,000 50,000Feet
Alaska State Plane Zone 5 (units feet)1983 North American Datum
Date: July 31, 2007Author: WMC-LC
1:341,583Scale
Figure 5.1-12007 Study Plan
Groundwater StudiesMine Study Area
File: Study Area.mxdVersion: 6
DRAFT
Iliamna Lake
LakesRivers50-ft Contour Interval
Study AreaSouth Fork Koktuli River
Upper Talarik Creek
Frying Pan Lake
North Fork Koktuli River General Pit Outline
\\Manu\projects\Pebble\scope schedule & budget\2007\study plan\Figure 5.1-1 Study Area.mxd
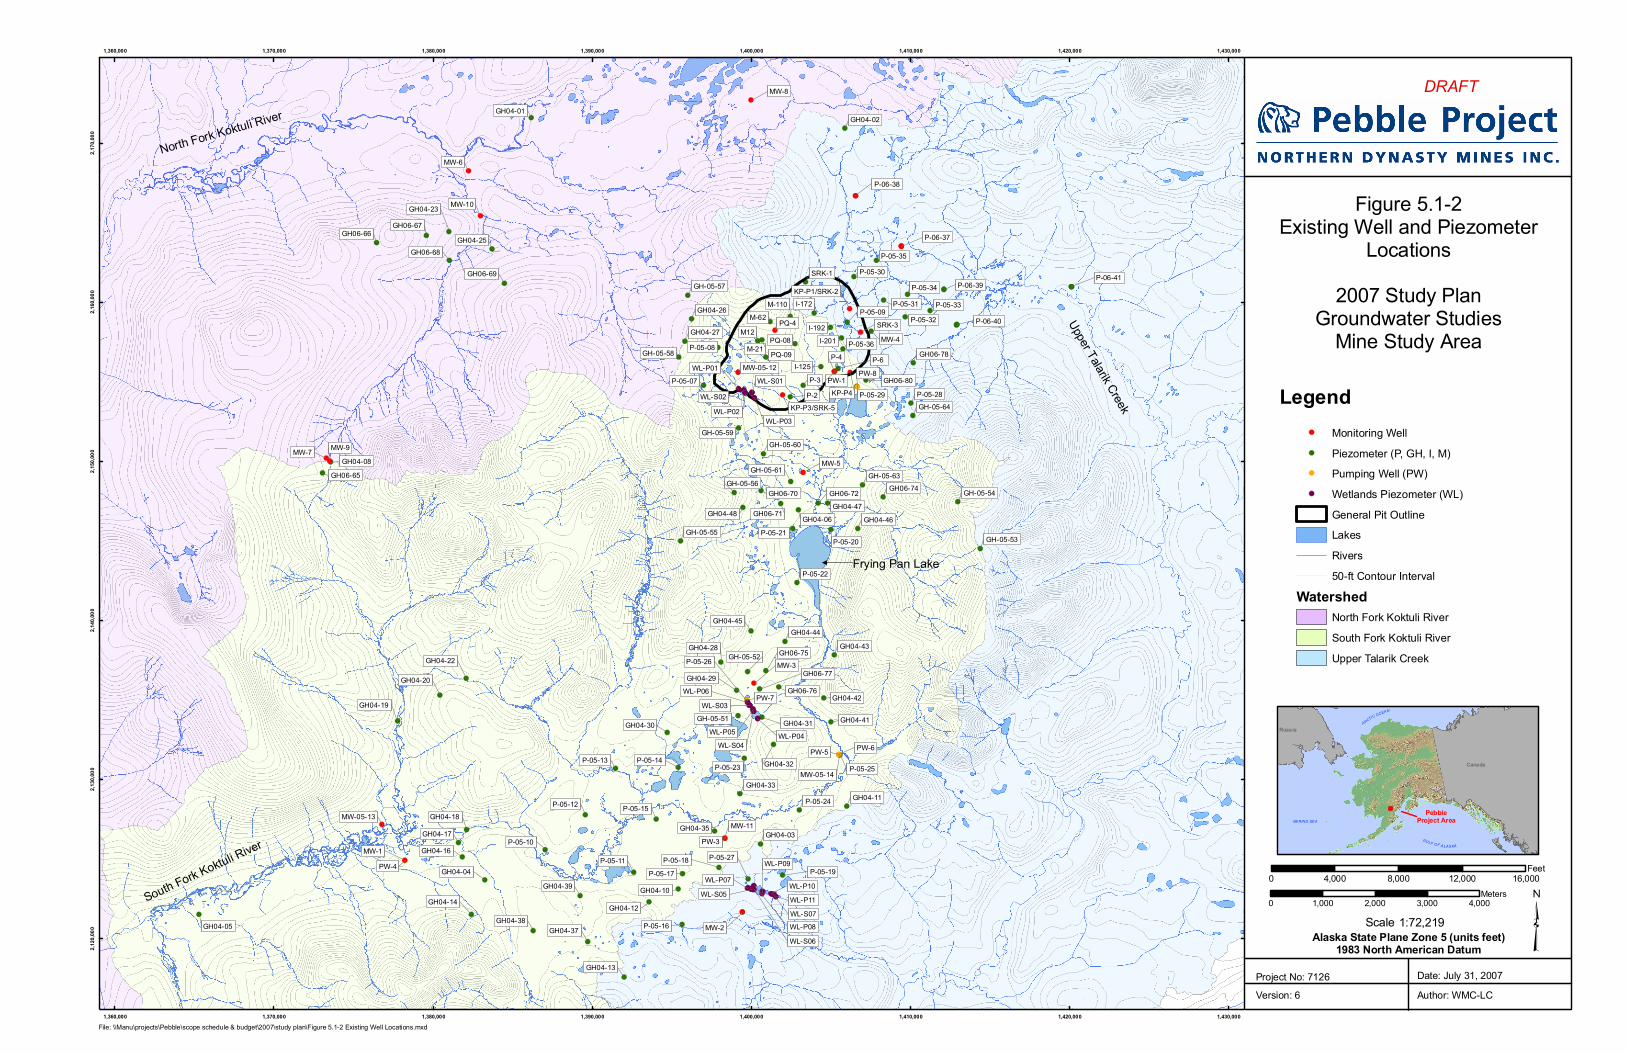
Frying Pan Lake
North Fork Koktuli River
Upper Talarik Creek
South Fork Koktuli River
WL-S06
WL-S05
WL-S03
WL-S02
WL-P01
WL-S04
WL-S01
WL-P03WL-P02
WL-P04WL-P05
WL-P06
WL-P08
WL-P07WL-P09
WL-S07
WL-P10WL-P11
M12M-62
M-21
I-192I-201
I-125
I-172M-110
GH06-80
GH06-78
GH06-74GH06-72GH06-70
GH06-69
GH06-68
GH06-67GH06-66
GH06-65
GH06-71
GH06-77GH06-76
GH06-75
MW-9
MW-4
MW-6
PQ-08
MW-10
KP-P4
SRK-1
PQ-09
GH04-01GH04-02
GH04-04
GH04-05
GH04-06
GH04-10
GH04-11
GH04-13
GH04-14
GH04-16GH04-17
GH04-18
GH04-19
GH04-20
GH04-22
GH04-25
GH04-26
GH04-27
GH04-28
GH04-30
GH04-32
GH04-33
GH04-35
GH04-37GH04-38
GH04-39
GH04-41
GH04-42
GH04-43GH04-44
GH04-46GH04-48
GH04-12
GH04-45
MW-7
KP-P1/SRK-2
MW-1
MW-5
MW-8
MW-11
P-3
MW-3
PQ-4 SRK-3
GH04-03
GH04-08
GH04-23
GH04-31
GH04-47
P-2
GH04-29
MW-2
P-4 P-6
KP-P3/SRK-5
PW-4
PW-1
PW-3
PW-8
PW-6PW-5
P-05-36
P-05-35
P-05-34P-05-33
P-05-32
P-05-30
P-05-28
P-05-25
P-05-24
P-05-23
P-05-22
P-05-21P-05-20
P-05-17
P-05-16
P-05-15
P-05-14P-05-13
P-05-12
P-05-11
P-05-10
P-05-08
MW-05-14
MW-05-13
GH-05-64
GH-05-63
GH-05-60GH-05-59
GH-05-58
GH-05-57
GH-05-56
GH-05-55
GH-05-54
GH-05-53
PW-7
P-05-31
P-05-29
P-05-27
P-05-26
P-05-19P-05-18
P-05-09
P-05-07MW-05-12
GH-05-61
GH-05-52
GH-05-51
P-06-40
P-06-41P-06-39
P-06-38
P-06-37
1,360,000
1,360,000
1,370,000
1,370,000
1,380,000
1,380,000
1,390,000
1,390,000
1,400,000
1,400,000
1,410,000
1,410,000
1,420,000
1,420,000
1,430,000
1,430,000
2,120
,000
2,130
,000
2,140
,000
2,150
,000
2,160
,000
2,170
,000
File: \\Manu\projects\Pebble\scope schedule & budget\2007\study plan\Figure 5.1-2 Existing Well Locations.mxd
Legend
Canada
ARCTIC OCEAN
PebbleProject Area
GULF OF A LASKA
Russia
BERING SEA
0 1,000 2,000 3,000 4,000Meters
0 4,000 8,000 12,000 16,000Feet
Alaska State Plane Zone 5 (units feet)1983 North American Datum
Date: July 31, 2007Author: WMC-LC
1:72,219Scale
Figure 5.1-2Existing Well and Piezometer
Locations2007 Study Plan
Groundwater StudiesMine Study Area
Project No: 7126Version: 6
DRAFT
Monitoring WellPiezometer (P, GH, I, M)Pumping Well (PW)Wetlands Piezometer (WL)General Pit OutlineLakesRivers50-ft Contour Interval
WatershedNorth Fork Koktuli RiverSouth Fork Koktuli RiverUpper Talarik Creek
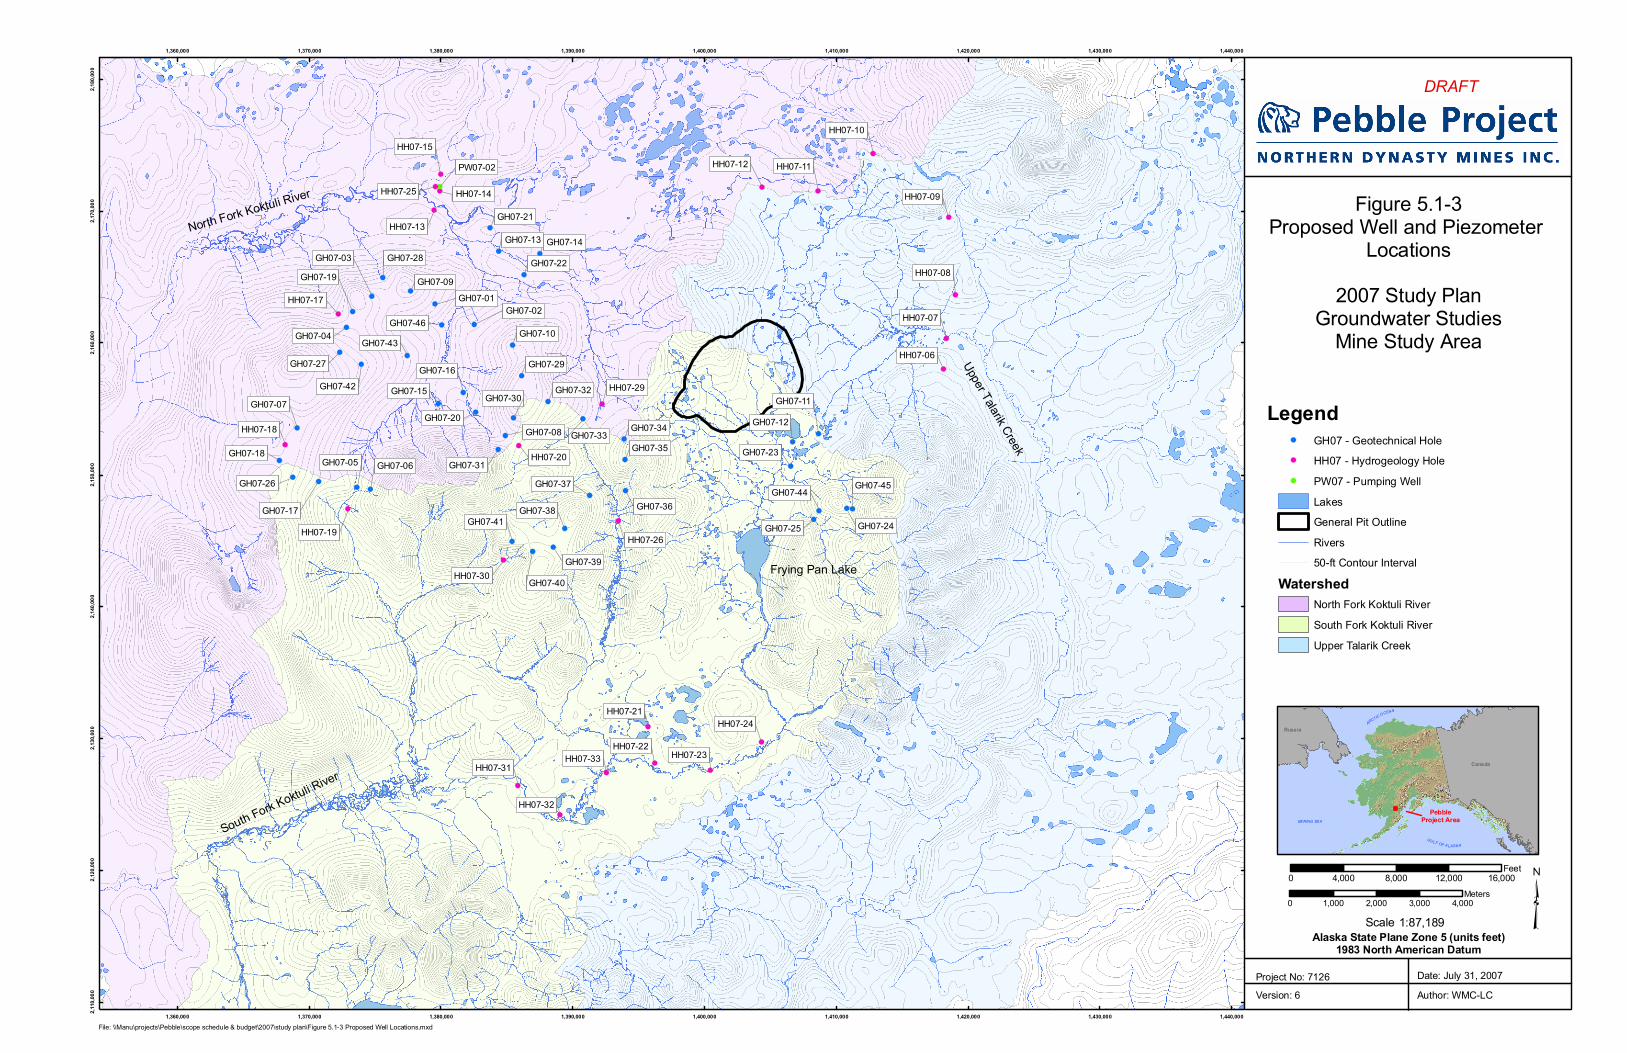
North Fork Koktuli River
South Fork Koktuli River
Upper Talarik Creek
Frying Pan Lake
HH07-33
HH07-32
HH07-31
HH07-30
HH07-29
HH07-26
HH07-25
PW07-02
HH07-24
HH07-23HH07-22
HH07-21
HH07-20
HH07-19
HH07-18
HH07-17
HH07-14
HH07-13
HH07-12 HH07-11
HH07-10
HH07-09
HH07-08
HH07-07
HH07-06
GH07-46
GH07-45GH07-44
GH07-43
GH07-42
GH07-41
GH07-39
GH07-38
GH07-37
GH07-36
GH07-35GH07-34GH07-33
GH07-32
GH07-31
GH07-30
GH07-29
GH07-28
GH07-27
GH07-26
GH07-25 GH07-24
GH07-23
GH07-22
GH07-21
GH07-20
GH07-19
GH07-18
GH07-17
GH07-16GH07-15
GH07-14GH07-13
GH07-12
GH07-10
GH07-09
GH07-07
GH07-06
GH07-04
GH07-03
GH07-02GH07-01
HH07-15
GH07-40
GH07-11
GH07-08
GH07-05
1,360,000
1,360,000
1,370,000
1,370,000
1,380,000
1,380,000
1,390,000
1,390,000
1,400,000
1,400,000
1,410,000
1,410,000
1,420,000
1,420,000
1,430,000
1,430,000
1,440,000
1,440,0002,110
,000
2,120
,000
2,130
,000
2,140
,000
2,150
,000
2,160
,000
2,170
,000
2,180
,000
File: \\Manu\projects\Pebble\scope schedule & budget\2007\study plan\Figure 5.1-3 Proposed Well Locations.mxd
Legend
Canada
ARCTIC OCEAN
PebbleProject Area
GUL F OF A LASKA
Russia
BERING SEA
0 1,000 2,000 3,000 4,000Meters
0 4,000 8,000 12,000 16,000Feet
Alaska State Plane Zone 5 (units feet)1983 North American Datum
Date: July 31, 2007Author: WMC-LC
1:87,189Scale
Figure 5.1-3Proposed Well and Piezometer
Locations2007 Study Plan
Groundwater StudiesMine Study Area
Project No: 7126Version: 6
DRAFT
GH07 - Geotechnical HoleHH07 - Hydrogeology HolePW07 - Pumping WellLakesGeneral Pit OutlineRivers50-ft Contour Interval
WatershedNorth Fork Koktuli RiverSouth Fork Koktuli RiverUpper Talarik Creek