DRAFT ENVIRONMENTAL BASELINE STUDIES 2006 STUDY...
15
DRAFT ENVIRONMENTAL BASELINE STUDIES 2006 STUDY PLANS CHAPTER 4. SURFACE HYDROLOGY JULY 2006
Transcript of DRAFT ENVIRONMENTAL BASELINE STUDIES 2006 STUDY...
DRAFT ENVIRONMENTAL BASELINE STUDIES 2006 STUDY PLANS
CHAPTER 4. SURFACE HYDROLOGY
JJUULLYY 22000066
DRAFT SURFACE HYDROLOGY
TABLE OF CONTENTS
TABLE OF CONTENTS............................................................................................................................4-i
LIST OF TABLES (attached) ....................................................................................................................4-ii
LIST OF FIGURES (attached) ..................................................................................................................4-ii
4. SURFACE HYDROLOGY.................................................................................................................4-1
4.1 Mine Studies ..............................................................................................................................4-1 Objectives/Study Area/Methods and Approach ........................................................................4-1 2006 Hydrology Task Summary................................................................................................4-1
Task 1: Baseline Data Collection ................................................................................4-1 Task 2: Baseflow Measurements .................................................................................4-2
Snow Surveys and Snow-distribution Mapping ........................................................................4-2 Baseline Studies............................................................................................................4-2 Long-term Monitoring..................................................................................................4-3
4.2 Transportation Corridor Studies ................................................................................................4-3
Surface Hydrology Final Draft.doc 4-i 5/31/06

DRAFT ENVIRONMENTAL BASELINE STUDIES, PROPOSED 2006 STUDY PLAN DRAFT
LIST OF TABLES (attached)
Table 4.1-1, Summary of Surface Hydrology Studies for Mine Study Area, 2004-2006
Table 4.1-2, Sample Site Period-of-Record Index, Surface Water Hydrology, Mine Studies
Table 4.1-3, Study Summary for Snow Surveys, Mine Study Area, 2004-2006
Table 4.1-4, Sample Site Period-of-Record Index, Snow Surveys
Table 4.2-1, Study Summary for Surface Hydrology, Transportation Corridor, 2004-2006
Table 4.2-2, Sample Site Period-of-Record Index, Surface Water Hydrology, Transportation Corridor
LIST OF FIGURES (attached)
Figure 4.1-1, Hydrology, Surface Water, and Aquatic Resources Study Area, Mine Studies
Figure 4.1-2, 2004, 2005, and 2006 Snow Survey Station Locations in the Mine Study Area
Figure 4.2-1, Surface Water Hydrology, Transportation Corridor, 2004 and 2005 Sampling Locations
Surface Hydrology Final Draft.doc 4-ii 5/31/06

DRAFT SURFACE HYDROLOGY
4. SURFACE HYDROLOGY The characterization of site hydrology includes both the surface hydrology and the snow-course survey program. HDR Alaska, Inc. will lead the surface hydrology work on the mine site and Bristol Environmental & Engineering Services Corporation will complete the surface hydrology work for the transportation corridor. ABR, Inc. will lead the snow-course survey program.
4.1 Mine Studies Objectives/Study Area/Methods and Approach
The 2006 surface hydrology program for the mine studies has predominantly the same objectives (Section 4.1.1), study area (Section 4.1.2.1), and methods and approach (Section 4.1.2.2) as stated in the 2005 study plan. Exceptions are described below.
Surface hydrology study tasks for 2006 include:
• Baseline Data Collection
• Baseflow Measurements
Table 4.1-1 provides a general summary of the primary tasks completed from 2004 through 2005 and lists tasks planned for 2006. Table 4.1-2 and Figure 4.1-1 detail the schedule and locations, respectively, for these tasks.
2006 Hydrology Task Summary
Task 1: Baseline Data Collection
Baseline data collection for the 2006 surface hydrology program is primarily designed to increase the period of record and the reliability of the database. Data collection at the 16 continuously gaged stations (Table 4.1-2 and Figure 4.1-1) will continue through 2006 in a manner similar to the past two years.
Data collection at the 16 ungaged stations provides the water quality program with discharge data for mass-flow calculations. Instantaneous discharge measurements are expected to be collected at these stations according to the schedule provided in Table 4.1-2.
A proposed change to the 2006 surface hydrology methodology is the addition of a salt-dilution method that will complement the existing discharge measurement technique (velocity-area method). The field hydrologist will use professional judgment based on site-specific conditions to determine when to apply each of these methods.
Although the current-meter method is often a preferred method of measuring stream discharge, it can be difficult to obtain good velocity readings in small steep streams with turbulent flow. The mine study area also presents additional difficulties in obtaining good discharge measurements at each of the over 30 remote stations. The logistics of measuring very low flows under ice-covered streams in winter and during bank-full conditions during breakup necessitate that alternative methods such as tracer (e.g., salt) dilution be integrated into the program to improve data collection.
Surface Hydrology Final Draft.doc 4-1 5/31/06

DRAFT ENVIRONMENTAL BASELINE STUDIES, PROPOSED 2006 STUDY PLAN DRAFT
Tracer dilution is a standard U.S. Geological Survey method used to measure stream discharge. The basic premise is to introduce a known amount of salt at one point in the stream and measure the concentration wave as it passes a point downstream where it is completely mixed in the flow. Streamflow is calculated from the area under the resulting conductivity curve. The salt dilution method uses common table salt (NaCl) as a tracer to measure discharge without the use of a current meter. Salt is preferred as a tracer over other known tracers because it is non-toxic to aquatic organisms at the concentrations and exposure times associated with the measurements. It is also inexpensive, easily obtained, and convenient to work with. Field measurements will be made with a conductivity meter read by a datalogger. Detailed methodology for the salt-dilution method will be provided in the 2006 field sampling plan.
Task 2: Baseflow Measurements
The objectives of baseflow measurements are to measure critical low-flow surface-water conditions and to better understand the interaction of groundwater and surface water in gaining and losing sections of the study area drainages. To measure baseflow conditions, a series of low-flow streamflow profiles will be completed twice during 2006. These profiles will consist of approximately ten instantaneous discharge measurements along each of the North Fork of Koktuli River, South Fork of Koktuli River, and Upper Talarik Creek for an estimated 30 measurements. The measurements will be collected during the low-flow periods in March or April and following spring runoff (planned for late June or early July).
Measurements will be collected according to the same field methods, including the salt-dilution method, used during the monthly instantaneous discharge measurements.
Snow Surveys and Snow-distribution Mapping
Baseline Studies
Spring snow surveys were conducted in 2006 to provide data for snow-distribution models and ablation-rate calculations in the mine study area. Snow surveys have been performed since 2004 in the mine study area. Most sample locations have remained the same in all years, but adjustments have been made to accommodate changes in the mine development plan. Snow-survey station locations are illustrated in Figure 4.1-2. At each location, snow depth and density are measured using standardized snow survey methods and equipment. Details concerning sampling methods are as presented in Chapter 4, Surface Water Hydrology, in the 2005 study plan.
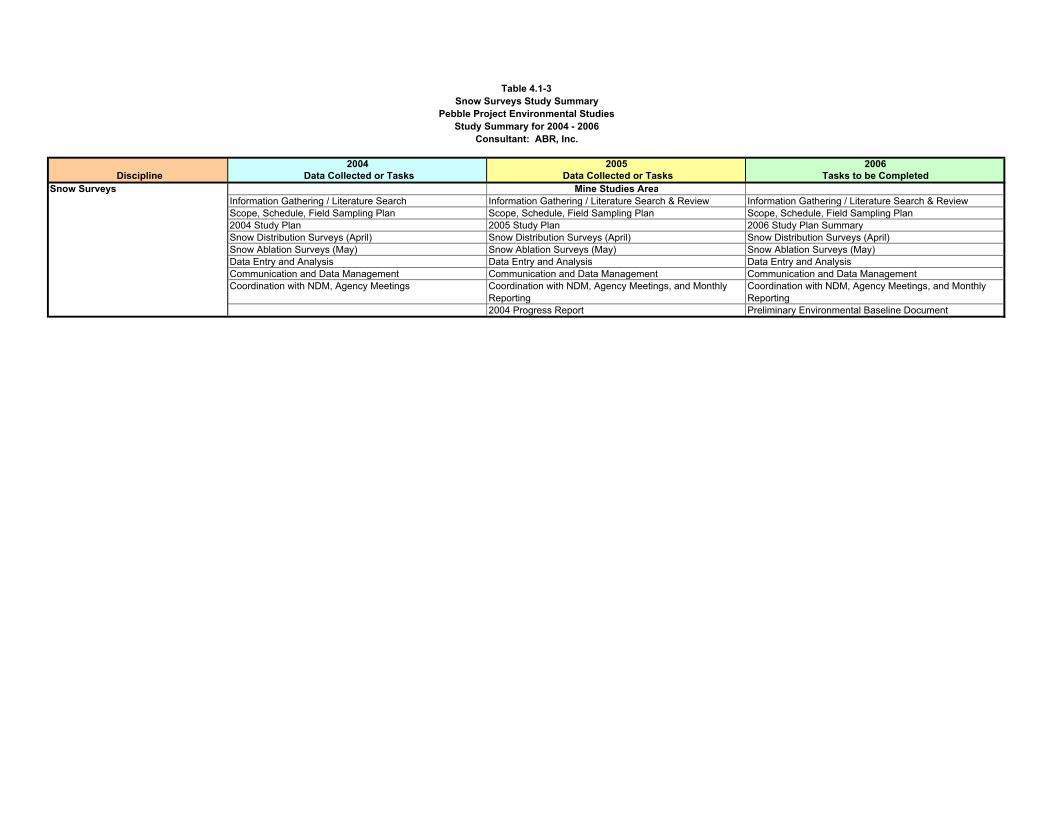
Table 4.1-3 summarizes activities relating to snow surveys from 2004 through 2006.
The study plan for the 2006 snow surveys includes the following components:
• Continue to refine the distribution map by integrating real-time meteorological data and plant-canopy maps when they become available.
• Perform spring snow surveys (April 15-24, 2006) and snow ablation surveys (May 12-13 and 19-21, 2006) in order to obtain concurrent meteorological and ground truth data (Table 4.1-4).
• Refine the approach to estimating ablation rates through the combination of periodic spring field surveys, analysis of MODIS satellite imagery, and stream discharge measurements (data currently collected by HDR).
Surface Hydrology Final Draft.doc 4-2 5/31/06

DRAFT SURFACE HYDROLOGY
• Compile the three years of survey data (2004, 2005, and 2006) to produce a normalized snow distribution map of the mine site.
• Summarize the snow survey information in the environmental baseline document.
Long-term Monitoring
Since snow accumulation has high inter-annual variability, spring field surveys in the mine study area will be continued. In 2004, two snow courses (high and low altitude) were established that were used both as locations within the local (mine study area) distribution survey network and as repeated-measurement sites to compare with measurements from existing National Resource Conservation Service (NRCS) snow survey sites in the Bristol Bay water-resource area. At this time, there is no suitable long-term snowfall-data record applicable to the mine area (such as NRCS snow courses and SNOWTEL sites). The existing sites are too distant to be used as proxy data for determining the maximum probable spring snow amounts. Additional years of monitoring in the mine study area will improve confidence in the relative snow-distribution map and allow for a more accurate prediction of maximum potential spring snow loads.
4.2 Transportation Corridor Studies Baseline data on surface water hydrology were collected for the transportation corridor in 2004 and 2005 as described in the study plans for those years. A summary of the tasks performed during the surface hydrology study for the transportation corridor is presented in Table 4.2-1. A summary of sampling conducted is presented in Table 4.2-2, and sampling locations are depicted on Figure 4.2-1. No additional data are being collected in 2006, with the following exception.
Roadhouse Creek is fed from small runoff streams that drain the west side of Roadhouse Mountain and empty Iliamna Lake near the Iliamna village townsite. Roadhouse Creek is an anadromous fish stream that meanders through the tundra and has well-vegetated banks.
A continuous-recording stream gage was originally installed in 1973 by the United States Geological Survey (USGS). The gage recorded data for 10 years, until 1983, when the USGS disengaged the station. The Roadhouse Creek gage (USGS No. 15300200) was reinstalled in May 2005 by the USGS to support the baseline surface-hydrology data collection for the Pebble Project transportation-corridor studies. The gage is located at Latitude 59° 45’ 26” NAD 27, Longitude 154° 60’ 59” NAD 27.
At the time of the USGS gage reinstallation, Roadhouse Creek was approximately 21 to 25 feet wide and 1.2 feet deep at the deepest section. A state-owned paved road passes over the creek just south of the gage. Two 10-foot-wide by 42-foot-long culverts are installed in the road’s embankment to allow drainage for the creek.
The Roadhouse Creek gage is currently operated and maintained by the USGS, and satellite data collection from the gage is processed automatically. Peak streamflow, real-time data, and historical data for this gage are available on the USGS website, http://waterdata.usgs.gov/ak/nwis/uv?site_no=15300200.
The baseline data on surface hydrology along the transportation corridor will be presented in the environmental baseline document prior to filing of permit applications.
Surface Hydrology Final Draft.doc 4-3 5/31/06

Field studies2004
Study Tasks2005
Study Tasks 2006
Study Tasks Surface Hydrology
Baseline Surface-hydrology Data Collection (7 Events)
Baseline Surface-hydrology Data Collection (8 Events)
Baseline Surface-hydrology Data Collection (8 Events)
Baseflow Measurements (1 Event) Baseflow Measurements (2 Events)Upper Hyporheic Temperature MonitoringFlow-exchange Measurements During Low Aerial Survey of Hydrography for Potential Temporary Road Corridor
Table 4.1-1Surface Water Hydrology Study Summary
Pebble Project Environmental StudiesStudy Summary for 2004 - 2006
Consultant: HDR Alaska
Mine Study Area

Month J F M A M J J A S O N D J F M A M J J A S O N D J F M A M J J A S O N D J F M A M J J A S O N D J F M A M J J A S O N D2004 I I I C C C Q Q Q Q Q Q Q W D D F F2005 I I C C C C C C C Q Q Q Q Q Q Q Q W F F2006 I I C C C C C C C Q Q Q2004 I I I I I I Q Q Q Q Q Q Q D D F2005 I I I I I I Q Q Q Q Q Q2006 I I I Q Q Q2004 I I C C C Q Q Q Q Q Q Q W D D F F2005 I I C C C C C C C Q Q Q Q Q Q Q Q W S F F2006 I I C C C C C C C Q Q Q Q Q Q Q Q F2004 I Q Q W D D2005 W20062004 I I I Q Q Q2005 I I I I I I I I Q Q Q Q Q Q Q Q F F F2006 I I I I I I I I Q Q Q Q Q Q Q Q F2004 I I I C C C Q Q Q Q Q Q Q W D D F F2005 I I C C C C C C Q Q Q Q Q Q Q Q W S F F F2006 I I C C C C C C C Q Q Q Q Q Q Q Q F2004 I I I C C C Q Q Q Q Q Q Q W D D2005 I I C C C C C C Q Q Q Q Q Q Q Q W2006 I I C C C C C C C Q Q Q Q Q Q Q Q2004 I I I I I I I Q Q Q Q Q Q Q F F2005 I I I I I I I I Q Q Q Q Q Q Q Q F F2006 I I I Q Q Q2004 I I I C C C Q Q Q Q Q Q Q W D D F2005 I I C C C C C C C Q Q Q Q Q Q Q Q W F F2006 I I C C C C C C C Q Q Q Q Q Q Q Q F2004 I I I C C C Q Q Q Q Q Q Q W D D F F2005 I I C C C C C C C Q Q Q Q Q Q Q Q W S F F2006 I I C C C C C C C Q Q Q Q Q Q Q Q F20042005 I I C C Q Q2006 C C C C C C C C C C C C Q Q Q Q Q Q Q Q20042005 I I I I I I Q Q Q Q Q2006 I I I I I I I I Q Q Q Q Q Q Q Q2004 I I C C C Q Q Q Q Q W D D F F2005 I I C C C C C C Q Q Q Q Q Q W F F2006 I I C C C C C C C Q Q Q Q Q Q Q Q F2004 I I I I I Q Q Q Q Q Q Q F2005 I I I I I I I I Q Q Q Q Q Q Q Q2006 I I I I I I I I Q Q Q Q Q Q Q Q2004 I I I C C C Q Q Q Q Q Q W D D F F2005 I I C C C C C C Q Q Q Q Q Q Q Q W F2006 I I C C C C C C C Q Q Q2004 I I I I C C C Q Q Q Q Q Q Q W D D F F F2005 I I C C C C C C C Q Q Q Q Q Q Q Q W F F2006 I I C C C C C C C Q Q Q2004 I I I I C C C Q Q Q Q Q Q Q W D D F F2005 I I C C C C C C C Q Q Q Q Q Q Q Q W F2006 I I C C C C C C C Q Q Q Q Q Q Q Q F20042005 I I C C C C C C Q Q Q Q Q Q Q Q2006 I I C C C C C C C Q Q Q Q Q Q Q Q2004 I I I I I I I Q Q Q Q Q Q Q F F2005 I I I I I I I I Q Q Q Q Q Q Q Q2006 I I I Q Q Q2004 I I I I I I I Q Q Q Q Q Q Q2005 I I I I I I I Q Q Q Q Q Q2006 I I I Q Q Q2004 I I I I I I I Q Q Q Q Q Q Q2005 I I I I I I I I Q Q Q Q Q Q Q Q2006 I I I Q Q Q2004 I I I I I I I Q Q Q Q Q Q Q2005 I I I I I I I I Q Q Q Q Q Q Q Q2006 I I I Q Q Q2004 I I I I I I I Q Q Q Q Q Q Q2005 I I I I I I I I Q Q Q Q Q Q Q Q2006 I I I Q Q Q2004 I I I I Q Q Q Q Q F2005 I I I I I I I I Q Q Q Q Q Q Q2006 I I I Q Q Q F2004 I I I C C C Q Q Q Q Q Q Q W D D F F F2005 I I C C C C C C C Q Q Q Q Q Q Q Q W S F F F2006 I I C C C C C C C Q Q Q Q Q Q Q Q F2004 I I Q Q W D D F2005 W20062004 I I I I C C C Q Q Q Q Q Q Q W D D F F2005 I I C C C C C C Q Q Q Q Q Q Q Q W S F F F2006 I I C C C C C C C Q Q Q Q Q Q Q Q F2004 I I I I C C C Q Q Q Q Q Q Q W D D F F2005 I I C C C C C C C Q Q Q Q Q Q Q Q W F2006 I I C C C C C C C Q Q Q Q Q Q Q Q F2004 I I I I C C C Q Q Q Q Q Q Q W F F2005 I I C C C C C C C Q Q Q Q Q Q Q Q W F2006 I I C C C C C C C Q Q Q Q Q Q Q Q F2004 I I I I I I I Q Q Q Q Q Q Q2005 I I I I I I I I Q Q Q Q Q Q Q Q F2006 I I I I I I I I Q Q Q Q Q Q Q Q2004 I I I I I I I Q Q Q Q Q Q Q2005 I I I I I I I I Q Q Q Q Q Q Q Q2006 I I I Q Q Q2004 I I I I I I I Q Q Q Q Q Q Q W D D F F2005 I I I I I I I I Q Q Q Q Q Q Q Q W S2006 I I I Q Q Q2004 I I I I I I I Q Q Q Q Q Q Q F F2005 I I I I I I I Q Q Q Q Q Q Q F2006 I I I I I I I I Q Q Q Q Q Q Q Q F2004 I I I I I I I Q Q Q Q Q Q Q F F2005 I I I I I I I I Q Q Q Q Q Q Q Q2006 I I I Q Q Q20042005 T F2006 T P2004 T M2005 T M F2006 P2004 T M2005 T M F2006 Q P20042005 F2006 P20042005 T F2006 T20042005 F20062004 X X2005 X X 7 52006 X X X X X
KEY:C Continuous-stage/discharge hydrometric data collected in streams (gaged stations with dataloggers).D Macroinvertebrate sites were sampled with drift nets AND ASCI methods; periphyton was collected with RBP and diatoms were assessed.F Sediment samples collected. Seep sediment samples show number of seeps sampled in 2005. Sediment symbol not shown on associated map.I Instantaneous stream discharge measurements taken each month coincident with water quality (ungaged stations without dataloggers).M Macroinvertebrate samples from lakes were collected with a modified ASCI approach.P Plankton tows .Q Surface-water-quality samples collected for field and laboratory analyses.S Macroinvertebrate sites were sampled with Surber Sampler AND ASCI methods; periphyton was collected with DNR methods and chlorophyll a was assessed.T Fish-tissue sample consisted of discrete muscle and liver samples from adult northern pike.W Fish-tissue sample consisted of discrete whole body juvenile fish .X Seep measurements/samples collected as described in notes.
NOTES:1 Work for 2006 is shown as planned, but not yet completed.2 At stations where continuous hydrometric data is collected, continuous hydrographs will be estimated throughout winter months using standard hydrometric methods.
KC100A
Hydrology2 FisheriesWater QualityYear1
Sample Location
KR100A
NK100A(USGS)
NK100B
NK100C
NK100B(Orig. Location)
NK119A
NK119B
SK100A
SK100B(USGS)
SK100B1
SK100B2
SK100C
SK100D
SK100F
SK100G
SK119A
SK124A
SK131A
SK133A
SK134A
SK136A
SK136B
UT100A
UT100B(USGS)
UT100D
UT100C
Black Lake
UT100E
UT119A
UT119B
UT135A
Table 4.1-2Surface Water Hydrology - Mine Studies
Pebble ProjectSample Site Period-of-Record Index
Seeps
Mud Lake(Near Lily Lake)
Frying Pan Lake
Chiquita Lake
Lake No. 2
Big Wiggly
UT138A
UT141A
UT146A
Stream gages are reinstalled each spring as early as breakup conditions allow.
Sediment
Period of Record by Discipline
Macroinvertebrates
2004 2005 2006 Discipline Data Collected or Tasks Data Collected or Tasks Tasks to be Completed
Snow Surveys Mine Studies AreaInformation Gathering / Literature Search Information Gathering / Literature Search & Review Information Gathering / Literature Search & ReviewScope, Schedule, Field Sampling Plan Scope, Schedule, Field Sampling Plan Scope, Schedule, Field Sampling Plan2004 Study Plan 2005 Study Plan 2006 Study Plan SummarySnow Distribution Surveys (April) Snow Distribution Surveys (April) Snow Distribution Surveys (April)Snow Ablation Surveys (May) Snow Ablation Surveys (May) Snow Ablation Surveys (May)Data Entry and Analysis Data Entry and Analysis Data Entry and AnalysisCommunication and Data Management Communication and Data Management Communication and Data Management Coordination with NDM, Agency Meetings Coordination with NDM, Agency Meetings, and Monthly
Reporting Coordination with NDM, Agency Meetings, and Monthly Reporting
2004 Progress Report Preliminary Environmental Baseline Document
Table 4.1-3Snow Surveys Study Summary
Pebble Project Environmental StudiesStudy Summary for 2004 - 2006
Consultant: ABR, Inc.

Transect Stations Year Distribution Ablation2004 × ×
1 13 2005 × ×2006 × ×2004 × ×
2 10 2005 × ×2006 × ×2004 ×
3 5 200520062004 ×
4 7 200520062004 ×
5 7 20052006 ×2004 ×
6 9 2005 ×2006 ×2004 ×
8 8 2005 ×2006 ×2004 ×
9 7 200520062004 ×
10 5 200520062004 ×
11 7 2005 ×2006 ×2004 ×
12 8 2005 ×2006 ×2004 ×
13 6 200520062004 ×
14 9 2005 ×2006 ×2004
20 10 2005 ×2006 ×2004
21 8 2005 ×2006 ×2004
22 8 2005 ×2006 ×2004
23 8 2005 ×2006 ×2004
24 7 2005 ×2006 ×2004
25 9 2005 ×2006 ×2004
26 7 2005 ×2006 ×2004
27 7 2005 × ×2006 × ×
Table 4.1-4Pebble Project
Sample Site Period-of-Record Index, Snow-Course SurveysConsultant: ABR

Table 4.2-1Pebble Project Environmental Studies
Study Summary for Surface Hydrology, Transportation Corridor, 2004 - 2006Consultant: BEESC
2004 2005 2006 Discipline Data Collected or Tasks Data Collected or Tasks Tasks to be Completed
Surface Hydrology Transportation CorridorInformation Gathering Information Gathering Data Compilation and AnalysisPreparation of Scope, Schedule, Field Sampling Plan
Preparation of Scope, Schedule, Field Sampling Plan
Prepare preliminary environmental baseline document
Field Flow Measurements Field Flow MeasurementsCommunication and Data Management Coordination with NDMCoordination with NDM Coordination with local communities for
observersCoordination with local communities for observers
Data Compilation and Analysis
Preparation of Presentation Preparation of 2004 Progress Report Report Writing

Month J F M A M J J A S O N D J F M A M J J A S O N D J F M A M J J A S O N D2004 Q Q Q Q2005 Q Q Q Q Q Q Q Q20062004 I I I I Q Q Q Q2005 I I Q Q Q Q Q Q20062004 I I I I Q Q Q Q2005 I I Q Q20062004 I I I Q Q Q Q2005 I I Q Q20062004 I I I I Q Q Q Q2005 I I I I I I I I Q Q Q Q Q Q Q Q20062004 I I I I Q Q Q Q2005 I I Q Q20062004 I I I I Q Q Q Q2005 I I I I I I I Q Q Q Q Q Q Q Q20062004 I I I I Q Q Q Q2005 I I Q Q20062004 I I I I Q Q Q Q2005 I I I I I I I I Q Q Q Q Q Q Q Q20062004 I I I I Q Q Q Q2005 I I I I I I I Q Q Q Q Q Q Q Q20062004 I Q200520062004 I I I I Q Q Q Q2005 I I Q Q20062004 I I I I Q Q Q Q2005 I I I I I I Q Q Q Q Q Q Q Q20062004 I I Q Q2005 Q Q20062004 I I Q Q Q2005 I Q Q Q Q Q Q Q Q20062004 I I I I Q Q Q Q200520062004 I I I I2005 Q Q Q Q20062004 I I I Q Q Q2005 I I I I I I I I Q Q Q Q Q Q Q Q200620042005 Q200620042005 Q20062004 Q Q2005 Q Q Q2006 2004 Q Q2005 Q Q Q2006 2004 Q Q2005 Q Q Q2006 2004 Q Q2005 Q Q Q2006
KEY:I Instantaneous stream discharge measurements taken each month coincident with water quality (ungaged stations without dataloggers).Q Water quality samples collected for field and laboratory analyses.
PSD
Table 4.2-2Surface Water Hydrology, Transportation Corridor
Pebble ProjectSample Site Period-of-Record Index
NEWH2
NONDA
GS23
GS22
GS21
PSC
GS6A
GS4A
GS4B
GS3A
GS12A
GS11A
GS8A
GS7A
Surface Water QualityYear
Period Of Record By DisciplineGroundwater QualitySurface HydrologySample
Location
ILIWI
PEDRO
NHRIV
GS20
GS20A
GS17A
GS14A
GS18A
GS14B

Upper T
alarik Creek
Sou th Fork K o ktuli River
North Fork Ko k t u l i
R
i ver
Kaskan a k R
iver
SK100A
NK100A(USGS Station)
Chiquita Lake
UT100C
SK124A
UT146A
UT141A
UT135A
UT119BUT119A
UT100EUT100D
SK136BSK136A
SK134A
SK133A
SK131A
SK119ASK100FSK100D
SK100C
NK119B
NK119A
NK100C
NK100B(original site)
SK100B1
SK100B2
CR199A
Frying Pan Lake
UT100B(USGS Station)
SK100B(USGS Station)
SK100G
UT138A
NK100B(current site)
Big Wiggly Lake
Chiquita Lake
UT100A
KR100A
KC100A
Lake #2
Black Lake
Pebble Claim Boundary
1,300,000
1,300,000
1,350,000
1,350,000
1,400,000
1,400,000
1,450,000
1,450,000
2,10
0,00
02,
150,
000
2,20
0,00
0
0 2.5 5 7.5 10Kilometers
0 2 4 6 8Miles
1:167,981ScaleAlaska State Plane Zone 5 (units feet)
1983 North American Datum
Date: June 02, 2006
Author: HDR-CEB, DW
File: Figure 4.1-1.mxd
Version: 2
Figure 4.1-1Hydrology, Surface Water, andAquatic Resources Study Area
(2004-2006 Mine Studies)
ASP 5 NAD 83
LegendMine Development Concept Plan
Ore Body
Claim Boundary
Sampling Location
Type of Sample SiteHydrology & Water Quality sample site with data logger
Hydrology & Water Quality sample site without data logger
Fish tissue sample site
Macroinvertebrate & Periphyton sample site
Seep water quality sample site
Z:\2
0084
7 N
orth
ern
Dyn
asty
Min
eral
s\A
ll D
isci
plin
es\G
IS\R
DIS
ourc
e\H
DR
\All
Dis
cipl
ines
\DE
LIV
ER
AB
LES
\200
6 S
tudy
Pla
nV_2
AllD
isc\
MX
D\2
006s
tudy
plan
_fig
4.1-
1v2
DRAFT

1
26
12
14
8
27
22
2411
26
23
25
21
5
20
10
9
4
3
13
1,360,000
1,360,000
1,380,000
1,380,000
1,400,000
1,400,000
1,420,000
1,420,000
2,12
0,00
02,
140,
000
2,16
0,00
02,
180,
000
Figure 4.1-2.2004, 2005 and 2006
Snow Survey Station Locationsin the Mine Study Area
Snow Survey Station Locations
2004 Snow Survey Location
2005 Snow Survey Location
2006 Snow Survey Location
Local Watershed
2005 Pit Outline
Proposed Road Alignment
! ! Proposed Transmission Line
Canada
ARCTIC OCEAN
Map LocationGULF O F ALASKA
0 1 2 3 4 5Kilometers ³0 1 2 3
Miles
Alaska State Plane Zone 5 (units feet)1983 North American Datum
Date: June 9, 2006
Author: ABR-AZC
1:140,000Scale
File: Snow_Survey_StudyPlan06_06-170-1.mxd
Version: 1
DRAFT

Canada
A R CT IC OC EAN
PebbleProject AreaG UL F O F A L AS KA
Russia
BERIN G S EA
!.
!.
!.
!.
!.
!.
!(
!(
!(!(
!(
!(!(!(
!(!(!(
!(
!(
!(
!(
!(
!(
ILIAMNA C-6 ILIAMNA C-5 ILIAMNA C-4 ILIAMNA C-3 ILIAMNA C-2
ILIAMNA B-6 ILIAMNA B-5 ILIAMNA B-4 ILIAMNA B-3 ILIAMNA B-2
ILIAMNA C-7
ILIAMNA B-7
ILIAMNA D-6 ILIAMNA D-5 ILIAMNA D-4 ILIAMNA D-2ILIAMNA D-3
LAKE CLARK A-3LAKE CLARK A-4 LAKE CLARK A-2LAKE CLARK A-5LAKE CLARK A-6
ILIAMNA D-7
LAKE CLARK A-7
ILIAMNA D-1
ILIAMNA C-1
ILIAMNA
KAKHONAK
NEWHALEN
NONDALTON
PEDRO BAY
GS-22
GS-23
GS-4b
GS-3a
GS-21
GS-4a
GS-20
GS-8a
GS-7aGS-6a
GS-12a
GS-20a GS-18aGS-17a
GS-14a
GS-14b GS-11a
1,400,000
1,400,000
1,450,000
1,450,000
1,500,000
1,500,000
1,550,000
1,550,000
1,600,000
1,600,000
1,650,000
1,650,000
1,700,000
1,700,000
1,750,000
1,750,000
2,000
,000
2,050
,000
2,100
,000
2,150
,000
2,200
,000
2,250
,000
Alaska State Plane Zone 5 (units feet)1983 North American Datum
Date: June 7, 2006Author: BEESC-ME
File: 2006StyPlan_1_V04.mxdVersion: 4
Figure 4.2-1Surface Water HydrologyTransportation Corridor
2004 and 2005 Sampling Locations
0 4 8 12 16Miles
1:363,852Scale0 4 8 12 16
Kilometers
³
Legend
!. TownsProposed Transportation Corridor
!(Surface Hydrology StationsSampled in 2004 and 2005
!(Surface Hydrology StationsSampled only in 2005
DRAFT