DRAFT DESIGN REPORT / ENVIRONMENTAL …...DRAFT DESIGN REPORT / ENVIRONMENTAL ASSESSMENT APPENDIX J...
38
DRAFT DESIGN REPORT / ENVIRONMENTAL ASSESSMENT APPENDIX J SURFACE WATER QUALITY June 2012 U.S. Department of Transportation Federal Highway Administration NEW YORK STATE DEPARTMENT OF TRANSPORTATION ANDREW M. CUOMO, Governor JOAN MCDONALD, Commissioner Highway Project P.I.N. 4390.13 NYS Route 390/I-490/NYS Route 31 Interchange Improvements Monroe County Town of Gates, Town of Greece and City of Rochester
Transcript of DRAFT DESIGN REPORT / ENVIRONMENTAL …...DRAFT DESIGN REPORT / ENVIRONMENTAL ASSESSMENT APPENDIX J...

DRAFT DESIGN REPORT / ENVIRONMENTAL ASSESSMENT
APPENDIX J
SURFACE WATER QUALITY June 2012
U.S. Department of Transportation Federal Highway Administration
NEW YORK STATE DEPARTMENT OF TRANSPORTATION ANDREW M. CUOMO, Governor JOAN MCDONALD, Commissioner
Highway Project P.I.N. 4390.13
NYS Route 390/I-490/NYS Route 31 Interchange Improvements
Monroe County Town of Gates, Town of Greece and
City of Rochester

Page 1 of 3
To: NYSDOT Region 4 1530 Jefferson Road Rochester, NY 14623
Date: June 11, 2012 From: Mark J. McAnany, PE Project Manager
cc: Kenneth Avery, PE, CFM, D. WRE (Bergmann) James Boggs (Bergmann)
Re: Surface Water Quality
NY 390 /I-490 / NYS 31 Interchange Improvements PIN 4390.13
DRAINAGE BASINS
There are four watershed areas identified within the project area: New York State Canal (Canal), #1 Unnamed Tributary to the Erie Canal (T1), Unnamed Tributary to T1 (T1A), and #2 Unnamed Tributary to the Erie Canal (T2). Approximately 8.91 acres of post-construction disturbed impervious area will drain into the Canal, approximately 15.8 acres of post-construction disturbed impervious area will drain into T1 / T1A, and approximately 1.3 acres of post-construction disturbed impervious area will drain into T2. SOIL EROSION AND SEDIMENT CONTROL The U.S. Department of Agriculture Soil Conservation Service, Soil Survey Maps for Monroe County were reviewed to determine the types and characteristics of the different soils found in the project area. The soil maps indicate that the project corridor is built on a multitude of soil types, and this includes: Canandaigua, Claverack, Hilton, Lima, Ovid, Riga, and Sun. These soils mostly consist of nearly level to gently sloping, deep, and poorly-drained to moderately well drained soils. Some of these soils are expected to be susceptible to erosion because of the slope and fine grain characteristics. An erosion control plan will be prepared during the final design phase to reduce erosion potential and reduce the rate of runoff during construction. The focus of the plan will be to minimize erosion and insure that the quality and quantity of runoff that reaches downstream surface waters is not substantially altered from existing conditions. All design and mitigation measures would incorporate the requirements of the NYS Department of Transportation Standard Specification for Temporary Soil Erosion and Water Pollution Control and the New York State Standards and Specifications for Erosion and Sediment Control. Adherence to design standards, inspection and quality control during construction, and periodic cleaning of erosion control features would minimize and mitigate the potential for erosion and sedimentation. During construction, every reasonable attempt would be made to minimize impacts on the environment. Impacts to water quality during construction would be controlled by temporary soil erosion and water pollution control measures. Practical temporary measures as listed (but not limited to) below will be considered for this project.
• Erosion control methods will be installed prior to construction activities, including access roads. Methods will include but not be limited to silt fences, seeding, rock protection and rolled erosion control products.
• Access roads will be constructed in such a manner as to minimize clearing and grubbing. • Use of a staged soil erosion control plan. • Excavated materials will be disposed of in an approved disposal area outside the 100-year floodplain. • Sediment laden water will be pumped to a de-watering basin and water released downstream will be clear
or clearer than the receiving waters.
our people and our passion in every pro ject

Page 2 of 3
Permanent measures that would be considered to minimize/control soil erosion and sedimentation include: • Seeding / vegetative cover • Rock / stone lining at outlets • Stormwater Ponds • Dry / Wet Swales STORMWATER ANALYSIS Site disturbance for this redevelopment project would be greater than 1 acre; therefore, a full Stormwater Pollution Prevention Plan (SWPPP) would be required for compliance with the NYSDEC State Pollutant Discharge Elimination System General Permit for Stormwater Discharges from Construction Activity (Permit No. GP-0-10-001). Contained in the project SWPPP document will be the following: erosion and sediment control designs (E&SC); review of stormwater management practices to provide for pollutant removal (water quality controls); review of the reduction in stream channel erosion; application of runoff reduction via green infrastructure techniques; prevention of overbank flooding, and control of extreme flood events (water quantity controls). The project construction phasing and sequencing has not yet been determined, and as a result, the amount of disturbed area open at one time during construction has not been established. The NYS DEC has set regulations for Effluent Limitations for all SPDES permits issued based on Permit No. GP-0-10-001 in New York State. These requirements are provided in Attachment 1. Components of a SWPPP have been generated that include the water quality and quantity requirements in accordance with the NYSDEC Permit No. GP-0-10-001. This report will be provided in full during final design.
For this project, the preliminary E&SC methods include silt fence, drainage inlet protection, pipe inlet/outlet protection, stone protection, and seeding/soil stabilization operations. The water quantity control (Channel Protection Volume (Cpv), Overbank Flood (Qp), and Extreme Storm (Qf)) for the portion of the project that discharges into the Canal will be waived because the Canal is a 5th-Order stream. The water quantity control for the portion of the project that discharges stormwater into the unnamed tributaries to the Erie Canal has also been reviewed in accordance with the NYS Stormwater Design Manual (SMDM). It has been determined that the Cpv is not required for the unnamed tributaries because the 1-year, 24-hour post-construction discharge rates and stream velocities will be less than or equal to pre-construction discharge rates through the use of Water Quality Management Area 7 at a minimum. If it is determined during final design that WQMA 7 cannot be constructed, then another WQMA or a combination of WQMA’s must be constructed with outlet controls that limit peak discharge rates along the unnamed tributaries at or below pre-construction conditions. Otherwise, the Cpv storage volume (2.526 ac-ft) will be required within a management area and released over a 24 hour period. In addition, a downstream analysis of 10-year and 100-year events has revealed that post-construction peak flow rates will be less than a 5% increase over existing conditions, and there are no downstream structures or buildings that are impacted as a result of the project; therefore, both of the Qp and Qf requirements are waived. For water quality control, this analysis uses the disturbed project area to determine the water quality volume calculation, and this includes the assumption of full depth reconstruction along the existing I-390 mainline (both NB and SB directions) from Chili Avenue to Trolley Boulevard north of the Canal, associated interchange ramps, and along Lyell Avenue (NYS Route 31). The re-development standard has been assigned to this project in accordance with Chapter 9 of the SMDM, and a preliminary review of the project shows that there are physical constraints pertaining to soils and the available head to drain stormwater. Treatment objectives may be achieved

Page 3 of 3
under the option where the water quality volume calculation uses 100% of new impervious areas within the project limits, and 25% of replaced impervious areas within the project limits. See Attachment 2, Appendix B for water quality volume calculations. Based on these calculations, the water quality volume treatment (and any potential additional treatment) can be accomplished within an approximate 10.7 acres of available surface area using “NYSDEC – standard” stormwater management practices throughout the project limits. These are identified as WQMA #1 through WQMA #28 in Attachment 2, Appendix A. The water quality management areas are limited to dry swales, stormwater ponds and wet swales in the areas shown on Figures P-1 through P-3. It is assumed these areas can be constructed without limitations due to groundwater and soils. An analysis has been performed on the assumed management practice types and the potential Water Quality volume that can be achieved from these practices. See calculations and figures in Attachment 2, Appendix B. It is recommended that groundwater levels/constraints be addressed by taking borings and well monitoring at the proposed WQMA locations. In addition, coordination between the project drainage system designer and the water quality designer is necessary to formulate the best practicable design strategy of maximizing project impervious stormwater drainage to the WQMA’s.
The proposed project drainage for I-390 and associated road reconstruction will utilize the existing drainage patterns, allowing for treatment of the impervious surfaces within the construction limits. Approximately 1.4 acres of impervious area can be directed to WQMA #1 - #3; 3.3 acres of impervious area can be directed towards WQMA #4 - #6; 12.7 acres of impervious area will drain towards WQMA’s #7 - #24; and approximately 2.9 acres of impervious area will drain towards WQMA’s #25 - #28.

ATTACHMENT 1 – NYSDEC Effluent Limitation Guidelines (ELGs)
our people and our passion i n ev ery p ro ject
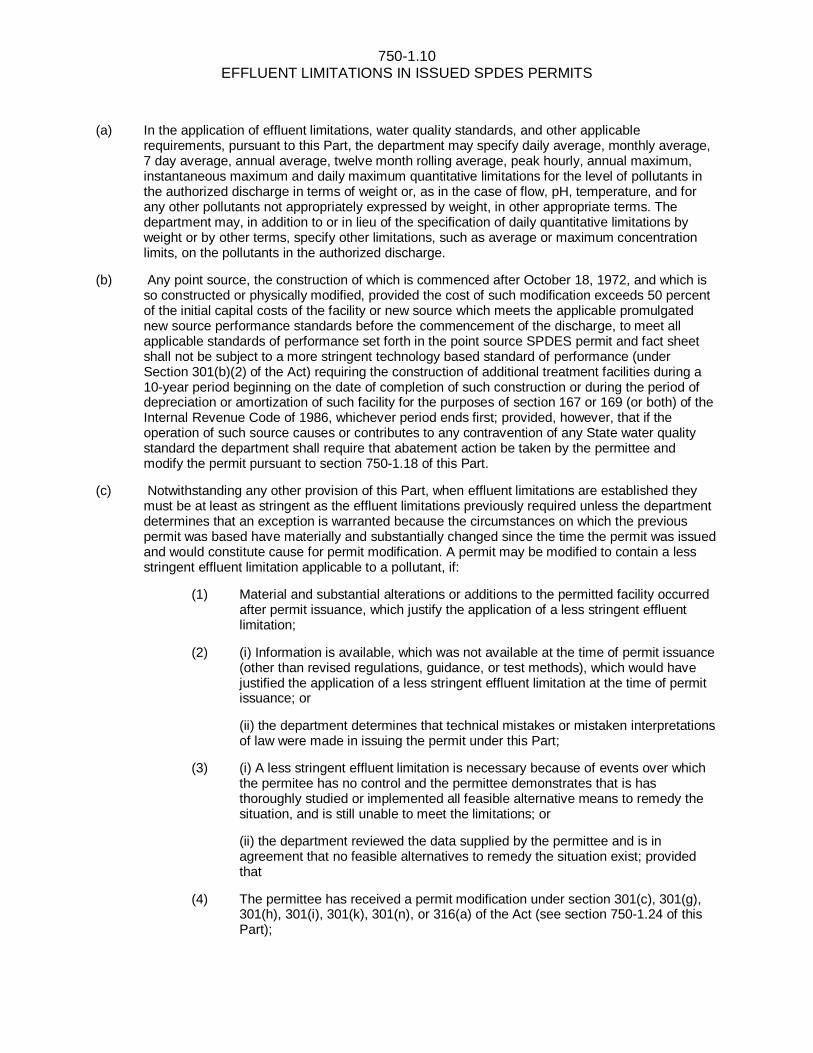
750-1.10 EFFLUENT LIMITATIONS IN ISSUED SPDES PERMITS
(a) In the application of effluent limitations, water quality standards, and other applicable requirements, pursuant to this Part, the department may specify daily average, monthly average, 7 day average, annual average, twelve month rolling average, peak hourly, annual maximum, instantaneous maximum and daily maximum quantitative limitations for the level of pollutants in the authorized discharge in terms of weight or, as in the case of flow, pH, temperature, and for any other pollutants not appropriately expressed by weight, in other appropriate terms. The department may, in addition to or in lieu of the specification of daily quantitative limitations by weight or by other terms, specify other limitations, such as average or maximum concentration limits, on the pollutants in the authorized discharge.
(b) Any point source, the construction of which is commenced after October 18, 1972, and which is so constructed or physically modified, provided the cost of such modification exceeds 50 percent of the initial capital costs of the facility or new source which meets the applicable promulgated new source performance standards before the commencement of the discharge, to meet all applicable standards of performance set forth in the point source SPDES permit and fact sheet shall not be subject to a more stringent technology based standard of performance (under Section 301(b)(2) of the Act) requiring the construction of additional treatment facilities during a 10-year period beginning on the date of completion of such construction or during the period of depreciation or amortization of such facility for the purposes of section 167 or 169 (or both) of the Internal Revenue Code of 1986, whichever period ends first; provided, however, that if the operation of such source causes or contributes to any contravention of any State water quality standard the department shall require that abatement action be taken by the permittee and modify the permit pursuant to section 750-1.18 of this Part.
(c) Notwithstanding any other provision of this Part, when effluent limitations are established they must be at least as stringent as the effluent limitations previously required unless the department determines that an exception is warranted because the circumstances on which the previous permit was based have materially and substantially changed since the time the permit was issued and would constitute cause for permit modification. A permit may be modified to contain a less stringent effluent limitation applicable to a pollutant, if:
(1) Material and substantial alterations or additions to the permitted facility occurred after permit issuance, which justify the application of a less stringent effluent limitation;
(2) (i) Information is available, which was not available at the time of permit issuance (other than revised regulations, guidance, or test methods), which would have justified the application of a less stringent effluent limitation at the time of permit issuance; or
(ii) the department determines that technical mistakes or mistaken interpretations of law were made in issuing the permit under this Part;
(3) (i) A less stringent effluent limitation is necessary because of events over which the permitee has no control and the permittee demonstrates that is has thoroughly studied or implemented all feasible alternative means to remedy the situation, and is still unable to meet the limitations; or
(ii) the department reviewed the data supplied by the permittee and is in agreement that no feasible alternatives to remedy the situation exist; provided that
(4) The permittee has received a permit modification under section 301(c), 301(g), 301(h), 301(i), 301(k), 301(n), or 316(a) of the Act (see section 750-1.24 of this Part);

750-1.10 EFFLUENT LIMITATIONS IN ISSUED SPDES PERMITS
(5) The permittee has installed the treatment facilities required to meet the effluent limitations in the previous permit and has properly operated and maintained the facilities but has nevertheless been unable to achieve the previous effluent limitations, in which case the limitations in the reviewed, reissued, or modified permit may reflect the level of pollutant control actually achieved (but shall not be less stringent than required by effluent guidelines in effect at the time of permit modification);
(6) The discharge is to non-attainment waters for the limited pollutant and the limit is based on a final or interim TMDL or other wasteload allocation method and the TMDL is set to assure attainment of the water quality standard; or
(7) The limit is for attainment waters for the limited pollutant and based on a final or interim TMDL or other wasteload allocation method and the TMDL is set to assure attainment of the water quality standard and the limit has been subjected to an antidegradation review in accordance with the department's antidegradation policy.
(8) the modifications allowed in paragraphs (6) & (7) of this subdivision shall not apply to any revised waste load allocations or any alternative where the cumulative effect of such revised allocations results in a decrease in the amount of pollutants discharged into the concerned waters, and such revised allocations are not the result of a discharger eliminating or substantially reducing its discharge of pollutants due to complying with the requirements of this chapter or for reasons otherwise unrelated to water quality.
(d) In no event may a permit be modified in accordance with subsection (c) of this section to contain an effluent limitation that is less stringent than required by effluent guidelines, including variances thereto, in effect at the time the permit is modified. In no event may such a permit to discharge into waters be modified in accordance with subsection (c) of this section to contain a less stringent effluent limitation if the implementation of such limitation would result in a violation of a water quality standard or guidance value applicable to such waters as set forth in parts 700-706 et seq.

ATTACHMENT 2 – PROJECT SWPPP COMPONENTS

NY 390/I-490/NYS 31 Interchange Improvements Town of Gates, Monroe County
PIN 4390.13
Draft SWPPP Approach Document June 14, 2012 1
PROJECT WATERSHED INFORMATION
There are four watershed areas identified within the project area: New York State Canal (Canal), #1 Unnamed Tributary to the Erie Canal (T1), Unnamed Tributary to T1 (T1A), and #2 Unnamed Tributary to the Erie Canal (T2). Approximately 12.5 acres of post-construction disturbed impervious area will drain into the Canal, approximately 15.8 acres of post-construction disturbed impervious area will drain into T1 / T1A, and approximately 1.3 acres of post-construction disturbed impervious area will drain into T2.

NY 390/I-490/NYS 31 Interchange Improvements Town of Gates, Monroe County
PIN 4390.13
Draft SWPPP Approach Document June 14, 2012 2
POST CONSTRUCTION STORMWATER MANAGEMENT
A. Water Quantity Management The water quantity control for the portion of the project that discharges into the Canal will be waived because the Canal is a 5th-Order stream. Section 4.7 of the New York State Stormwater Management Design Manual (SMDM) provides the method of examining stream order identification, and the Canal has been determined to be at least a fifth order stream due to its influence with the Genesee River at the point at which it receives the project stormwater.
The water quantity control for the portion of the project that discharges stormwater into the unnamed tributaries to the Erie Canal has been reviewed in accordance with the SMDM. Channel Protection Volume (Cpv) Cpv is not required for stormwater discharges to T1, T1A, or T2 because this is a re-development project, and the final stormwater designs will result in no changes to the hydrology that increase discharge rate. Even though the project area will include a 6.65-acre impervious area increase in the T1 / T1A drainage area, and a 0.13 acre impervious area increase in the T2 drainage area, the total runoff volume generated from the increased impervious areas during the 1-year 24-hour storm will be captured and throttled down and/or infiltrated in water quality management areas. Water Quality Management Area 7 has been analyzed as a pond with a storage capacity of 2.12 ac-ft, and consists of a drainage area that has 2.06 acres of impervious surface. The outlet structure for the proposed pond is required to be designed with a peak discharge at or below 0.43 cfs. By achieving a 0.43 cfs outlet peak discharge, there will be a net reduction of approximately 0.5 cfs in the post-construction peak discharge, which matches the existing hydrology. See Appendix B for water quantity calculations. It is understood that some of the potential WQMA’s may not be built during final design. Therefore, if WQMA 7 is not constructed as a pond, another WQMA must be constructed to hold and slowly release over 24 hours the channel protection volume of 2.5 ac-ft or be constructed such that the post-construction discharge rates and stream velocities of T1 / T1A and T2 will be less than or equal to pre-construction discharge rates. Overbank Flood (Qp) and Extreme Storm (Qf) Events The Qp and Qf requirements for this project are waived as the result of a downstream analysis. The exemption is approved if both of the following criteria are met: 1) Post-construction peak flow rates increase by less than 5% of the pre-developed
condition for the design storm (e.g., 10-year, 100-year). 2) No downstream structures or buildings are impacted. The peak discharges for Overbank flood and Extreme flood events can be found in attachment 2, Appendix B – Water Quantity / Quality Analysis Data.
The second criteria is met since there are no structures or buildings that can be impacted between the analysis point of the T1 / T1A streams and the confluence with

NY 390/I-490/NYS 31 Interchange Improvements Town of Gates, Monroe County
PIN 4390.13
Draft SWPPP Approach Document June 14, 2012 3
the Canal, or between the analysis point of the T2 stream and the confluence with the Canal.
B. Water Quality Management
For water quality control, this analysis uses the project disturbed area to approximate the water quality volume calculation, which includes the assumption of full depth reconstruction along portions of the existing I-390 mainline (both NB and SB directions), Lyell Avenue and associated ramps as depicted in the project limits on plan sheets included in Attachment 2. Water Quality volume is based on the percent of impervious cover and the 90% rainfall values for a given area. Water Quality treatment is based on 100% of new impervious areas within the project limits. See Appendix B for water quality volume calculations. Based on a review of these calculations, the required water quality volume treatment can be achieved through multiple water quality management areas throughout the project limits (see Appendix A). The total approximate surface area available for stormwater treatment is 10.7 acres, all of which can be constructed within the highway right-of-way. The water quality management areas are limited to dry swales, stormwater ponds and wet swales in the areas shown on the figures P-1 through P-3. It is assumed these areas can be constructed without limitations due to groundwater and soils. An analysis has been performed on the assumed management practice types and the potential Water Quality volume that can be achieved from these practices. See calculations and figures in Appendix B.
A summary of the project area stormwater within each watershed as it pertains to water quality controls is provided in Table B-1.
Table B-1 – Water Quality Summary
Watershed Existing
Impervious (acres)
Proposed Impervious
Area (acres)
Required Water Quality Volume
(acre-feet)
Potential Water Quality Volume
Treatment (acre-feet)
T1 / T1A 5.84 15.76 0.806 6.160 T2 1.13 1.26 0.028 0.228
CANAL 8.67 12.54 0.418 0.859 Total 15.64 29.56 1.252 7.247
C. Post Construction Stormwater Management Summary
The following tables provide a summary of the Stormwater Management Plan for each watershed within the project.
Table C-1 – Post Construction Stormwater Management Summary – T1 / T1A Area Disturbance 31.53 acres
Water Quality Target Volume 0.806 acre-feet
Channel Protection Volume Waived due to no increase in peak discharge (2.526af)
Overbank Flood Control Waived due to downstream analysis Extreme Flood Control Waived due to downstream analysis

NY 390/I-490/NYS 31 Interchange Improvements Town of Gates, Monroe County
PIN 4390.13
Draft SWPPP Approach Document June 14, 2012 4
Table C-2 – Post Construction Stormwater Management Summary – T2 Area Disturbance 1.78 acres
Water Quality Target Volume 0.028 acre-feet
Channel Protection Volume Waived due to no increase in peak discharge
Overbank Flood Control Waived due to downstream analysis Extreme Flood Control Waived due to downstream analysis
Table C-3 – Post Construction Stormwater Management Summary – Canal
Area Disturbance 19.65 acres Water Quality Target
Volume 0.418 acre-feet
Channel Bank Volume Waived due to 5th Order Overbank Flood Control Waived due to 5th OrderExtreme Flood Control Waived due to 5th Order

I-390/I-490 Interchange Buffalo Rd to Trolley Blvd Town of Gates and City of Rochester, Monroe County
PIN 4390.13
Draft SWPPP Components April 17, 2012
APPENDICES

I-390/I-490 Interchange Buffalo Rd to Trolley Blvd Town of Gates and City of Rochester, Monroe County
PIN 4390.13
Draft SWPPP Components April 17, 2012
APPENDIX A SWPPP WATER QUALITY MANAGEMENT FIGURES
FUTURE CONTRACT PLANS (provide during final design)

JVankerkhove
Rectangle
aadekoya
Text Box
Impervious Area Draining to WQMA: 1) WQMA #'s 1-3 = 1.40 Acres 2) WQMA #'s 4-6 = 3.34 Acres 3) WQMA #7 = 2.06 Acres

aadekoya
Text Box
Impervious Area Draining to WQMA: 1) WQMA #'s 8-24 = 10.68 Acres 2) WQMA #25 = 1.31 Acres

aadekoya
Text Box
Impervious Area Draining to WQMA: 1) WQMA #'s 26-28 = 1.64 Acres
I-390/I-490 Interchange Buffalo Rd to Trolley Blvd Town of Gates and City of Rochester, Monroe County
PIN 4390.13
Draft SWPPP Components April 17, 2012
APPENDIX B
WATER QUANTITY / WATER QUALITY ANALYSIS DATA
(update during final design)

aadekoya
Typewriter
Overall Drainage Area = 0.76 Square Miles = 488 Acres
aadekoya
Typewriter
Drainage Area T2
aadekoya
Polygon
JVankerkhove
Typewriter
Draiange area to Project Discharge
JVankerkhove
Typewriter
Remaining area to drains to Quarry

aadekoya
Stamp
aadekoya
Typewriter
Overall Drainage Area = 1.33 Square Miles = 851.2 Acres
aadekoya
Typewriter
Drainage Area T1 / T1A

Hydrology for I-390/I-490 Interchange Reconstruction ProjectPeak Discharge - TR-55 Graphical Method
SCS Curve numbers were estimated based on land use of 1/4 acre to 1/8 acre lots, for residential and open space in good condition for other greenspace.
Existing - DA-T2.1 Drains to Unnamed Tributary T2 1-Year 10-Year 100-Year Proposed - Drains to Unnamed Tributary T2 1-Year 10-Year 100-Year
% ImperviousCover Area (Ac) Product
WeightedCN
%Impervious
Cover Area Product
WeightedCN
Project Disturbed Area 63.3% 1.8 1.13 70.5% 1.8 1.26Remaining Watershed 30.0% 486.2 145.87 30.0% 486.2 145.87Total 30.1% 488.0 146.99 73.053 48.72 162.94 293.03 30.1% 488.0 147.12 73.057 48.73 162.95 293.04
Existing - DA-T1 & DA-T1A Drains to Tributary T1 1-Year 10-Year 100-Year Proposed - DA-T1 & T1A Drains to Tributary T1 1-Year 10-Year 100-Year
% ImperviousCover Area (Ac) Product
WeightedCN
%Impervious
Cover Area Product
WeightedCN
Project Disturbed Area 28.9% 31.5 9.12 49.1% 31.5 15.48Remaining Watershed 30.0% 819.7 245.90 30.0% 819.7 245.90Total 30.0% 851.2 255.02 76.026 116.31 345.93 585.11 30.7% 851.2 261.38 76.205 116.73 346.89 585.9
Results Pre PostDifference
(cfs)T2 (1-Year, CPv) 48.72 48.73 0.01T2 (10-Year) 162.94 162.95 0.01T2 (100-Year) 293.03 293.04 0.01T1/T1A (1-Year, CPv) 116.31 116.73 0.42T1/T1A (10-Year) 345.93 346.89 0.96T1/T1A (100-Year) 585.11 585.9 0.79
Conclusion:The Input parameters to determine Peak Discharge by the TR-55 method shows a negligible increase in the amount of runoff draining to Tributaries T-1 & T-2The proposed design shall account for storage of the increase of 6.65 Acres of Impervious in WQMA's 7, 8, 9, 15, 17, 20, 21, 23, 24 for Water Quality.Values shown above are based on the 1, 10 & 100 year rainfall for Monroe County in New York State.
0.28%0.14%
% Difference
0.36%
0.01%0.00%
0.02%

BY DATE PROJ. NO. SHT OF
CKD DATE PROJ. NAME
TITLE:
For the disturbed area draining to T1 / T1A
Formula for calculating the Intial Water Quality Storage Volume (WQv(initial)) = (P) (Rv) (A)
P = 90% Rainfall Event =
A = total disturbed area in acres = acres
NA = New impervious area in acres = acres
RA = Replaced impervious area in acres = acres
I = ((NA+RA)/A)*100 =
Rv = 0.05 + 0.009(I) =
WQv(initial) = acre-feet
Formula for calculating the Target Water Quality Storage Volume (WQv(targetl)) = (N)(WQv(initial)) + (0.25)(R)(WQv(initial))
1
JAV 03/19/12 390/490 Reconstruction Project
5.84
AAA 03/15/12 P.I.N. 4390.13 / BA (4353.00) 1
REQUIRED WATER QUALITY VOLUME CALCULATION
12
0.85
31.53
9.92
50
0.50
1.116
WQv(initial) = acre-feet
Total Impervious Area = (NA + RA) = acres
N = (New Impervious Area/Total Impervious Area) =
R = (Replaced Impervious Area/Total Impervious Area) =
WQv(target) = acre-feet
WQv(target) = cubic-feet
0.37
0.806
35,114
1.116
15.76
0.63

BY DATE PROJ. NO. SHT OF
CKD DATE PROJ. NAME
TITLE:
For the disturbed area draining to T2
Formula for calculating the Intial Water Quality Storage Volume (WQv(initial)) = (P) (Rv) (A)
P = 90% Rainfall Event =
A = total disturbed area in acres = acres
NA = New impervious area in acres = acres
RA = Replaced impervious area in acres = acres
I = ((NA+RA)/A)*100 =
Rv = 0.05 + 0.009(I) =
WQv(initial) = acre-feet
Formula for calculating the Target Water Quality Storage Volume (WQv(targetl)) = (N)(WQv(initial)) + (0.25)(R)(WQv(initial))
1
JAV 03/19/12 390/490 Reconstruction Project
AAA 03/15/12
71
1
REQUIRED WATER QUALITY VOLUME CALCULATION
1.78
0.69
P.I.N. 4390.13 / BA (4353.00)
12
0.85
1.13
0.13
0.087
WQv(initial) = acre-feet
Total Impervious Area = (NA + RA) = acres
N = (New Impervious Area/Total Impervious Area) =
R = (Replaced Impervious Area/Total Impervious Area) =
WQv(target) = acre-feet
WQv(target) = cubic-feet
0.90
0.028
1,235
0.087
1.26
0.10

BY DATE PROJ. NO. SHT OF
CKD DATE PROJ. NAME
TITLE:
For the disturbed area draining to T1 / T1A
Formula for calculating the Intial Water Quality Storage Volume (WQv(initial)) = (P) (Rv) (A)
P = 90% Rainfall Event =
A = total disturbed area in acres = acres
NA = New impervious area in acres = acres
RA = Replaced impervious area in acres = acres
I = ((NA+RA)/A)*100 =
Rv = 0.05 + 0.009(I) =
WQv(initial) = acre-feet
Formula for calculating the Target Water Quality Storage Volume (WQv(targetl)) = (N)(WQv(initial)) + (0.25)(R)(WQv(initial))
1
JAV 03/19/12 390/490 Reconstruction Project
8.67
AAA 03/15/12 P.I.N. 4390.13 / BA (4353.00) 1
REQUIRED WATER QUALITY VOLUME CALCULATION
12
0.85
19.65
3.87
64
0.62
0.869
WQv(initial) = acre-feet
Total Impervious Area = (NA + RA) = acres
N = (New Impervious Area/Total Impervious Area) =
R = (Replaced Impervious Area/Total Impervious Area) =
WQv(target) = acre-feet
WQv(target) = cubic-feet
0.69
0.418
18,225
0.869
12.54
0.31

Project: 390/490 Interchange Project No. 4390.13Date: 4/17/2012By: AAAChecked: JAVSheet: of
NYS RTE 390/490/NYS RTE 31 Interchange - Water Quality Management Areas
Watershed WQMA*Length ofTreatment (SQFT) (Acres)
ImperviousCatchment
(Acres)
PotentialWater Quality
Treatment(Acre-ft)
1 - DRY 472 7,689 0.18 0.282 - DRY 410 6,100 0.14 0.563 - DRY 400 5,193 0.12 0.564 - DRY 1,048 15,561 0.36 1.275 - DRY 1,018 18,765 0.43 1.146 - DRY 723 9,218 0.21 0.93
7 - POND 11,910 61,537 1.41 2.068 - POND 6,377 32,946 0.76 0.729 - DRY 1,105 11,651 0.27 0.62
10 - WET 2,376 18,412 0.42 0.2411 - DRY 843 28,302 0.65 0.7512 - DRY 528 7,505 0.17 0.3313 - DRY 347 6,647 0.15 0.3314 - DRY 409 8,567 0.20 0.3815 - DRY 506 15,093 0.35 0.3716 - DRY 996 23,240 0.53 1.6017 - DRY 587 15,846 0.36 0.5218 - DRY 269 6,220 0.14 0.3019 - DRY 996 17,306 0.40 0.3920 - DRY 640 18,059 0.41 0.6621 - DRY 977 33,004 0.76 0.9122 - DRY 553 25,542 0.59 0.49
23 - POND 4,274 22,081 0.51 0.7924 - DRY 933 12,442 0.29 1.2825 - DRY 754 10,983 0.25 1.3126 - DRY 761 11,545 0.27 0.8227 - DRY 111 5,045 0.12 0.4428 - DRY 413 10,200 0.23 0.38TOTAL 40,736 464,699 10.7 20.4 7.247
*Ponds and wet swales have conservatively been reduced by a factor of 4 in casethe full size of the pond as designated on the WQMA figures cannot be built
CANAL
T1 / T1A 6.160
0.363
WQMA Characteristics
T2 0.228
2.615

Project: 390/490 Interchange Project No.Date:By:Checked:Sheet: of
TITLE:
DESCRIPTION:Estimated WQMA Treatment
Requirements for Dry Swale Facilities per NYS Stormwater Management Design ManualAssume 4' wide bottom width w/ 3:1 side slopes, 0.5' ponding depth and 2.5' deep filter bed
Requirements for Wet Swale Facilities per NYS Stormwater Management Design ManualAssume a 2' ponding depth and half of the measured area is used for each pond
Requirements for Wet Pond Facilities per NYS Stormwater Management Design ManualAssume a 3' ponding depth and half of the measured area is used for each pond
Dry Swales, Wet Swales and Wet Ponds are possible water quality manage,emt areas that can be used to treatthe required water quality volume for the site.
Dry Swale Typical Section
4390.134/17/2012
AAAJAV
Water Quality Treatment
7'10'
2.5'
Volume of Ponding Area:
7.75 cf / LFVolume of Voids:
V = x = 5sf2.5'4' x 0.5'
13 TYP.
4'
7'
Dry Swale ProvidesV = (7+4)2 x 0.5' = 2.75sf

390/490 Interchange a T1 / T1A Channel ProtectionType II 24-hr 1-Year CPv Rainfall=2.20"390-490 Interchange CPv
Printed 4/18/2012Prepared by VRTHORPage 1HydroCAD® 10.00 s/n 03498 © 2011 HydroCAD Software Solutions LLC
Summary for Subcatchment 2S: T1/T1A Proposed
Runoff = 20.22 cfs @ 12.50 hrs, Volume= 2.526 af, Depth> 0.96"
Runoff by SCS TR-20 method, UH=SCS, Time Span= 0.00-20.00 hrs, dt= 0.05 hrsType II 24-hr 1-Year CPv Rainfall=2.20"
Area (ac) CN Description* 15.770 76 50-75% Grass cover, Fair, HSG B* 15.760 98 Impervious
31.530 87 Weighted Average15.770 50.02% Pervious Area15.760 49.98% Impervious Area
Tc Length Slope Velocity Capacity Description(min) (feet) (ft/ft) (ft/sec) (cfs)50.0 Direct Entry,
Subcatchment 2S: T1/T1A Proposed
Runoff
Hydrograph
Time (hours)20191817161514131211109876543210
Flow
(cf
s)
22212019181716151413121110
9876543210
Type II 24-hr1-Year CPv Rainfall=2.20"Runoff Area=31.530 acRunoff Volume=2.526 afRunoff Depth>0.96"Tc=50.0 minCN=87
20.22 cfs


I-390/I-490 Interchange Buffalo Rd to Trolley Blvd Town of Gates and City of Rochester, Monroe County
PIN 4390.13
Draft SWPPP Components April 17, 2012
APPENDIX C
NRCS SOIL MAPS

Buffalo Rd
Lyell Ave
How
ard
Rd
Trolley BlvdEmerson St
Cairn
St
Col
fax
St
Lyell Rd
Dre
xel D
r
Miramar Rd
Ferrano St
Deb
by L
n
Chili Ave
McK
ee R
d
Mat
ilda
St
Jordan Ave
Mercer Ave
Auburn AveB
ru M
ar D
r
Gatewood Ave
Colwick Rd
Varia
n Ln
Eve
lyn
St
Dod
ge S
t
Eug
ene
St
Spencerport Rd Ros
smor
e S
t
Cor
nelia
Dr
Tarw
ood
Dr
Dea
rcop
Dr
Bel
knap
St
Kencrest Dr
Lee
Rd
Elv
ira S
t
Pilot St
Normandale Dr
Land
au D
r
Pol
aris
St
Avan
ti D
r
Nova Ln
Ard
ella
St
Ste
nson
St
Elder StIn
gram
Dr
Ren
ouf D
r
Jay St
Daw
nhav
en D
r
Pla
net S
t
Cre
stw
ood
Blv
d
Adi
rond
ack
St
Tim
pat D
r
Alvanar R
d
Le M
anz
Dr
Bee
chw
ood
Dr
Mor
ncre
st D
r
Mer
ryda
le D
r
Dolman Dr
Bickford St
West Ave
Lisa Ann Dr
Ste
el S
t
W S
t
Fox
Run
Letti
ngto
n A
ve
Dan
iel D
r
Lom
bard
St
Jew
ett S
t
Ham
let Ct
Hed
ge S
t
Har
cour
t Rd
Foxs
hire
Ln
Cheshire Ln
Gat
es S
t
Rad
aric
k D
r
Jennie Ln
Gem
ini C
ir
Person Pl
Che
sire
Ln
Trol
ley
Cir
Castlewood Dr
Vang
uard
Pkw
y
Beec
hcra
ft D
r
Lee
Roa
d E
xt
Lansing Cir
Northmore Ave
Albert St
Westerleigh RdG
lost
er R
d
Col
umbu
s C
ir
Lansing Cir
Albert St
Ca
Ow
LoB
CkB
Mb
LoB
HlB
St
HlB
Ca
CkB
Ud
Ca
Mb
RgB
HlB
Ow
Mb
Mb
St
W
Mb
Ms
HlB
280500
280500
281000
281000
281500
281500
282000
282000
282500
282500
283000
283000
283500
283500
4780
000
4780
000
4780
500
4780
500
4781
000
4781
000
4781
500
4781
500
4782
000
4782
000
4782
500
4782
500
4783
000
4783
000
4783
500
4783
500
4784
000
4784
000
0 1,000 2,000 3,000500Feet
0 300 600 900150Meters
±
43° 10' 41''
77°
39' 4
3''
43° 8' 22''
77°
39' 3
7''
43° 8' 19''
43° 10' 38''77
° 41
' 57'
'77
° 42
' 3''
Map Scale: 1:20,400 if printed on A size (8.5" x 11") sheet.
Soil Map—Monroe County, New York(390/490)
Natural ResourcesNatural ResourcesNatural ResourcesNatural ResourcesConservation ServiceConservation ServiceConservation ServiceConservation Service
Web Soil SurveyNational Cooperative Soil Survey
2/27/2012Page 1 of 3

MAP LEGEND MAP INFORMATION
Area of Interest (AOI)Area of Interest (AOI)
SoilsSoil Map Units
Special Point FeaturesBlowout
Borrow Pit
Clay Spot
Closed Depression
Gravel Pit
Gravelly Spot
Landfill
Lava Flow
Marsh or swamp
Mine or Quarry
Miscellaneous Water
Perennial Water
Rock Outcrop
Saline Spot
Sandy Spot
Severely Eroded Spot
Sinkhole
Slide or Slip
Sodic Spot
Spoil Area
Stony Spot
Very Stony Spot
Wet Spot
Other
Special Line FeaturesGully
Short Steep Slope
Other
Political FeaturesCities
Water FeaturesStreams and Canals
TransportationRails
Interstate Highways
US Routes
Major Roads
Local Roads
Map Scale: 1:20,400 if printed on A size (8.5" × 11") sheet.
The soil surveys that comprise your AOI were mapped at 1:15,840.
Please rely on the bar scale on each map sheet for accurate mapmeasurements.
Source of Map: Natural Resources Conservation ServiceWeb Soil Survey URL: http://websoilsurvey.nrcs.usda.govCoordinate System: UTM Zone 18N NAD83
This product is generated from the USDA-NRCS certified data as ofthe version date(s) listed below.
Soil Survey Area: Monroe County, New YorkSurvey Area Data: Version 9, Dec 20, 2011
Date(s) aerial images were photographed: 6/16/2006; 7/7/2006
The orthophoto or other base map on which the soil lines werecompiled and digitized probably differs from the backgroundimagery displayed on these maps. As a result, some minor shiftingof map unit boundaries may be evident.
Soil Map–Monroe County, New York(390/490)
Natural ResourcesConservation Service
Web Soil SurveyNational Cooperative Soil Survey
2/27/2012Page 2 of 3

Map Unit Legend
Monroe County, New York (NY055)
Map Unit Symbol Map Unit Name Acres in AOI Percent of AOI
Ca Canandaigua silt loam 48.1 21.0%
CkB Claverack loamy fine sand, 2 to 6 percent slopes 36.0 15.7%
HlB Hilton loam, 3 to 8 percent slopes 24.9 10.8%
LoB Lima and Cazenovia silt loams, limestonesubstratum, 0 to 6 percent slopes
41.1 18.0%
Mb Made land 19.5 8.5%
Ms Muck, shallow 0.6 0.3%
Ow Ovid and Appleton silt loams, limestonesubstratum
40.6 17.7%
RgB Riga silt loam, 2 to 8 percent slopes 4.0 1.8%
St Sun loam, moderately shallow variant 8.2 3.6%
Ud Udorthent, refuse substratum 4.9 2.1%
W Water 1.3 0.6%
Totals for Area of Interest 229.2 100.0%
Soil Map–Monroe County, New York 390/490
Natural ResourcesConservation Service
Web Soil SurveyNational Cooperative Soil Survey
2/27/2012Page 3 of 3

Buffalo Rd
Lyell Rd
How
ard
Rd
Lyell Ave
Weg
man
Rd
Lori Ln
Dre
xel D
r
Miramar Rd
Deb
by L
n
Lee
Rd
Bru
Mar
Dr
Gatewood Ave
Colwick Rd
Ezi
o D
r
Rel
lim B
lvd
Spencerport Rd
Varia
n Ln
Bar
ney
Ln
Tarw
ood
Dr
Dea
rcop
Dr
Glen Oaks Dr
Mat
ilda
St
Kencrest D
r
Eve
lyn
St
Elv
ira S
t
Normandale Dr
Sno
wbe
rry
Cre
s
Land
au D
r
App
ian
Dr
Cor
nelia
Dr
Gar
den
Dr
Noe
l Dr
Avan
ti D
r
Eug
ene
St
Nova Ln
Ard
ella
St
Elder St
Ros
smor
e S
t
Daw
nhav
en D
r
And
y Ln
Mar
way
Cir
Bur
ning
Bru
sh D
r
Cre
stw
ood
Blv
d
Mar
kie
Dr
Alvanar R
d
Le M
anz
Dr
Long
Pon
d R
d
Pix
ley
Rd
Pas
aden
a D
r
Lisa Ann Dr
Haz
el B
ark
Run
Gre
en A
cre
Ln
Lech
ase
DrC
rest
Dr
Fox
Run
Abb
y Ln
Bramblewood Ln
Cresthill Dr
Bee
chw
ood
Dr
Tandoi Dr
Rahway Ln
Juliane Dr
Sha
dyw
ood
Dr
Dan
iel D
r
Bai
er D
r
Jane
t Ln
Hed
ge S
t
Ber
mar
Par
k
Har
cour
t Rd
Foxs
hire
Ln
Ger
aldi
ne P
kwy
Silv
er B
irch
Dr
Add
ison
St
Rad
aric
k D
r
Cen
ter L
n Dawson St
Jenn
ie L
n
Gem
ini C
ir
Fareson Rd
Castlewood DrK
aye
Par
k Te
r
Jack
rist C
ir
Beec
hcra
ft D
r
Gre
nvill
e R
d
Col
umbu
s C
ir
Ow
LoB
HlB
Ow
Ca
LoB
CkBCa
CkB
LoB
WfAWfA
HlB
HlB
LoB
Ow
Ud
ApA
Mb
BcB
Mb
ApA
W
278800
278800
279200
279200
279600
279600
280000
280000
280400
280400
280800
280800
281200
281200
281600
281600
282000
282000
282400
282400
282800
282800
4780
800
4780
800
4781
200
4781
200
4781
600
4781
600
4782
000
4782
000
4782
400
4782
400
4782
800
4782
800
0 2,000 4,000 6,0001,000Feet
0 500 1,000 1,500250Meters
±
43° 10' 11''
77°
40' 1
6''
43° 8' 43''
77°
40' 1
2''
43° 8' 39''
43° 10' 7''77
° 43
' 14'
'77
° 43
' 18'
'
Map Scale: 1:19,600 if printed on A size (8.5" x 11") sheet.
Soil Map—Monroe County, New York(390/490 Reconstruction DA-T1)
Natural ResourcesNatural ResourcesNatural ResourcesNatural ResourcesConservation ServiceConservation ServiceConservation ServiceConservation Service
Web Soil SurveyNational Cooperative Soil Survey
3/20/2012Page 1 of 3

MAP LEGEND MAP INFORMATION
Area of Interest (AOI)Area of Interest (AOI)
SoilsSoil Map Units
Special Point FeaturesBlowout
Borrow Pit
Clay Spot
Closed Depression
Gravel Pit
Gravelly Spot
Landfill
Lava Flow
Marsh or swamp
Mine or Quarry
Miscellaneous Water
Perennial Water
Rock Outcrop
Saline Spot
Sandy Spot
Severely Eroded Spot
Sinkhole
Slide or Slip
Sodic Spot
Spoil Area
Stony Spot
Very Stony Spot
Wet Spot
Other
Special Line FeaturesGully
Short Steep Slope
Other
Political FeaturesCities
Water FeaturesStreams and Canals
TransportationRails
Interstate Highways
US Routes
Major Roads
Local Roads
Map Scale: 1:19,600 if printed on A size (8.5" × 11") sheet.
The soil surveys that comprise your AOI were mapped at 1:15,840.
Please rely on the bar scale on each map sheet for accurate mapmeasurements.
Source of Map: Natural Resources Conservation ServiceWeb Soil Survey URL: http://websoilsurvey.nrcs.usda.govCoordinate System: UTM Zone 18N NAD83
This product is generated from the USDA-NRCS certified data as ofthe version date(s) listed below.
Soil Survey Area: Monroe County, New YorkSurvey Area Data: Version 9, Dec 20, 2011
Date(s) aerial images were photographed: 6/16/2006; 7/7/2006
The orthophoto or other base map on which the soil lines werecompiled and digitized probably differs from the backgroundimagery displayed on these maps. As a result, some minor shiftingof map unit boundaries may be evident.
Soil Map–Monroe County, New York(390/490 Reconstruction DA-T1)
Natural ResourcesConservation Service
Web Soil SurveyNational Cooperative Soil Survey
3/20/2012Page 2 of 3

Map Unit Legend
Monroe County, New York (NY055)
Map Unit Symbol Map Unit Name Acres in AOI Percent of AOI
ApA Appleton loam, 0 to 3 percent slopes 2.8 0.3%
BcB Benson channery loam, 0 to 8 percent slopes 3.0 0.3%
Ca Canandaigua silt loam 109.3 12.6%
CkB Claverack loamy fine sand, 2 to 6 percent slopes 107.7 12.4%
HlB Hilton loam, 3 to 8 percent slopes 128.9 14.8%
LoB Lima and Cazenovia silt loams, limestonesubstratum, 0 to 6 percent slopes
248.5 28.5%
Mb Made land 10.2 1.2%
Ow Ovid and Appleton silt loams, limestonesubstratum
207.4 23.8%
Ud Udorthent, refuse substratum 3.7 0.4%
W Water 0.0 0.0%
WfA Wassaic fine sandy loam, 0 to 4 percent slopes 49.1 5.6%
Totals for Area of Interest 870.6 100.0%
Soil Map–Monroe County, New York 390/490 Reconstruction DA-T1
Natural ResourcesConservation Service
Web Soil SurveyNational Cooperative Soil Survey
3/20/2012Page 3 of 3

$
Brooks Ave
Hinchey Rd
How
ard
Rd
Cairn
St
Bue
ll R
d
Chili Ave
Ren
ouf D
r
Westfield S
t
Letti
ngto
n A
ve
Loderdale RdBrooklea Dr
Ingr
am D
r
Old
Bea
han
Rd
Tim
pat D
r
Meadowdale DrM
arilo
u D
r
Sta
nton
St
Airport Rd
Mer
ryda
le D
r
Mor
ncre
st D
r
Ham
let C
t
Dolman Dr
Greenbriar Dr
Arnett Blvd
Lyndale Dr
Beahan Rd
Arrowhead Dr
Ajax Rd
Spr
ucew
ood
LnRoyal Oak Dr
Wal
bert
Dr
Cheshire Ln
Farragut St
Firestone Dr
Elli
s D
r
Wes
thav
en D
r
Inglewood DrRoxborough Rd
Gen
esee
Par
k B
lvd
Ches
ire L
n
Ranch Village Ln
Mareeta Rd
Ste
war
t Dr
Dor
ston
e R
d
Car
olin
e D
r
Airport WayFr
eder
ick
Dr
Jasm
ine
Rd
Elh
am R
d
Airport Rd
CkB
ArB
OnB
HfB
HlB
Mb
Ca
LoB
Mb
Cw
StCoB
CkB
Cw
GaB
SeB
Cu
Pu
CoB
CkB
ArD
LoB
OnC
ApA
St
CkB
Lm
W
280500
280500
280800
280800
281100
281100
281400
281400
281700
281700
282000
282000
282300
282300
282600
282600
282900
282900
283200
283200
283500
283500
283800
283800
4778
700
4778
700
4779
000
4779
000
4779
300
4779
300
4779
600
4779
600
4779
900
4779
900
4780
200
4780
200
4780
500
4780
500
4780
800
4780
800
0 1,000 2,000 3,000500Feet
0 400 800 1,200200Meters
±
43° 8' 58''
77°
39' 3
0''
43° 7' 46''
77°
39' 2
7''
43° 7' 43''
43° 8' 55''77
° 41
' 54'
'77
° 41
' 57'
'
Map Scale: 1:15,900 if printed on A size (8.5" x 11") sheet.
Soil Map—Monroe County, New York(390/490 Reconstruction DA-T2)
Natural ResourcesNatural ResourcesNatural ResourcesNatural ResourcesConservation ServiceConservation ServiceConservation ServiceConservation Service
Web Soil SurveyNational Cooperative Soil Survey
3/20/2012Page 1 of 3

MAP LEGEND MAP INFORMATION
Area of Interest (AOI)Area of Interest (AOI)
SoilsSoil Map Units
Special Point FeaturesBlowout
Borrow Pit
Clay Spot
Closed Depression
Gravel Pit
Gravelly Spot
Landfill
Lava Flow
Marsh or swamp
Mine or Quarry
Miscellaneous Water
Perennial Water
Rock Outcrop
Saline Spot
Sandy Spot
Severely Eroded Spot
Sinkhole
Slide or Slip
Sodic Spot
Spoil Area
Stony Spot
Very Stony Spot
Wet Spot
Other
Special Line FeaturesGully
Short Steep Slope
Other
Political FeaturesCities
Water FeaturesStreams and Canals
TransportationRails
Interstate Highways
US Routes
Major Roads
Local Roads
Map Scale: 1:15,900 if printed on A size (8.5" × 11") sheet.
The soil surveys that comprise your AOI were mapped at 1:15,840.
Please rely on the bar scale on each map sheet for accurate mapmeasurements.
Source of Map: Natural Resources Conservation ServiceWeb Soil Survey URL: http://websoilsurvey.nrcs.usda.govCoordinate System: UTM Zone 18N NAD83
This product is generated from the USDA-NRCS certified data as ofthe version date(s) listed below.
Soil Survey Area: Monroe County, New YorkSurvey Area Data: Version 9, Dec 20, 2011
Date(s) aerial images were photographed: 6/16/2006; 7/7/2006
The orthophoto or other base map on which the soil lines werecompiled and digitized probably differs from the backgroundimagery displayed on these maps. As a result, some minor shiftingof map unit boundaries may be evident.
Soil Map–Monroe County, New York(390/490 Reconstruction DA-T2)
Natural ResourcesConservation Service
Web Soil SurveyNational Cooperative Soil Survey
3/20/2012Page 2 of 3

Map Unit Legend
Monroe County, New York (NY055)
Map Unit Symbol Map Unit Name Acres in AOI Percent of AOI
ApA Appleton loam, 0 to 3 percent slopes 3.8 0.7%
ArB Arkport very fine sandy loam, 0 to 6 percentslopes
83.8 14.8%
ArD Arkport very fine sandy loam, 12 to 20 percentslopes
2.8 0.5%
Ca Canandaigua silt loam 26.4 4.7%
CkB Claverack loamy fine sand, 2 to 6 percent slopes 156.0 27.6%
CoB Colonie loamy fine sand, 0 to 6 percent slopes 22.2 3.9%
Cu Cosad loamy fine sand 5.1 0.9%
Cw Cut and fill land 26.3 4.7%
GaB Galen very fine sandy loam, 2 to 6 percent slopes 11.1 2.0%
HfB Hilton fine sandy loam, 3 to 8 percent slopes 39.5 7.0%
HlB Hilton loam, 3 to 8 percent slopes 35.5 6.3%
Lm Lamson very fine sandy loam 0.4 0.1%
LoB Lima and Cazenovia silt loams, limestonesubstratum, 0 to 6 percent slopes
31.5 5.6%
Mb Made land 46.2 8.2%
OnB Ontario loam, 3 to 8 percent slopes 46.5 8.2%
OnC Ontario loam, 8 to 15 percent slopes 4.3 0.8%
Pu Pits and quarries 4.5 0.8%
SeB Schoharie silt loam, 2 to 6 percent slopes 8.3 1.5%
St Sun loam, moderately shallow variant 10.9 1.9%
W Water 0.0 0.0%
Totals for Area of Interest 565.3 100.0%
Soil Map–Monroe County, New York 390/490 Reconstruction DA-T2
Natural ResourcesConservation Service
Web Soil SurveyNational Cooperative Soil Survey
3/20/2012Page 3 of 3