Cwa2a Draft E Invoicing Compliance Guidelines Commentary V090

Draft Compliance Monitoring and Evaluation Plan In compliance with the “Management Agency Agreement between the Central Valley Regional Water Quality Control Board and the Bureau of Reclamation” executed on December 22, 2008.
July 1, 2009
U.S. Department of the Interior Bureau of Reclamation Mid-Pacific Region

Reclamation Draft Compliance Monitoring and Evaluation Plan
i
Contents Abbreviations and Acronyms ................................................................................. ii Purpose.....................................................................................................................1 Organization of Plan ................................................................................................2 A. Flow Actions....................................................................................................3
1. New Melones Reservoir Operations – Provision of Dilution Water ..............3 2. Water Acquisitions – Water Acquisitions Program........................................6 3. Water Acquisitions – Environmental Water Account ....................................9 4. DMC Recirculation Pilot Study – Provision of Dilution Water .....................9
B. Salt Load Reduction Actions .........................................................................11 1. Grassland Bypass Project..............................................................................11 2. Westside Regional Drainage Plan.................................................................11 3. Conservation Efforts .....................................................................................17
C. Mitigation Actions .........................................................................................19 1. Real Time Management Program – Development of Stakeholder-Driven
Program.........................................................................................................19 2. Real Time Management Program – Technical Support................................20 3. Wetlands Best Management Practices Plan..................................................22
D. Central Valley Project Deliveries Load Calculation......................................24 E. Future Actions................................................................................................36 F. Vernalis Water Quality ..................................................................................36 G. Reporting Requirements ................................................................................38 H. Funding Reporting .........................................................................................38 I. Monitoring Program.......................................................................................39 J. Offset Program...............................................................................................41 K. Stakeholder Process Proposal ........................................................................43 Appendix A: Sonde Multiprobe (Yellow Springs Instruments) – Operation and Calibration........................................................................................................... A-1 Appendix B: 2008 CVO Water Delivery Tables 24, 25, and 26 .........................B-1 Appendix C: Sample Quarterly Report (4th Quarter 2008)..................................C-1

Reclamation Draft Compliance Monitoring and Evaluation Plan
ii
Abbreviations and Acronyms Action Plan Actions to Address the Salinity and Boron TMDL Issues
for the Lower San Joaquin River AF acre-foot or acre-feet Basin Plan Water Quality Control Plan for the Sacramento and San
Joaquin River Basins, 4th Edition BMP Best Management Practices CALFED CALFED Bay-Delta Program CDEC California Data Exchange Center CDFG California Department of Fish and Game CVO Central Valley Operations CVP Central Valley Project CVPIA Central Valley Project Improvement Act DMC Delta-Mendota Canal DWR California Department of Water Resources Draft Plan Draft Compliance and Monitoring Plan (this document) EC electrical conductivity EWA Environmental Water Account GBP Grassland Bypass Project ID irrigation district Interior U.S. Department of the Interior LSJR Lower San Joaquin River MAA Management Agency Agreement μS/cm micro Siemens per centimeter QA Quality Assurance QC Quality Control Reclamation Bureau of Reclamation Regional Water Board Central Valley Regional Water Quality Control Board RTMP Real Time Management Program Service U.S. Fish and Wildlife Service SFEI San Francisco Estuary Institute SLDMWA San Luis and Delta-Mendota Water Authority TAF thousand acre-feet USGS United States Geological Survey VAMP Vernalis Adaptive Management Plan WAP Water Acquisition Program WQO water quality objective WRDP Westside Regional Drainage Plan

Reclamation Draft Compliance Monitoring and Evaluation Plan
1
Purpose The purpose of the “Draft Compliance Monitoring and Evaluation Plan” (Draft Plan) is to meet one commitment of the initial monitoring, reporting, and assessment program agreed to in the “Management Agency Agreement between the Central Valley Regional Water Quality Control Board and the United States Bureau of Reclamation” (MAA) executed on December 22, 2008. The MAA describes the cooperative actions Reclamation will take under the Salt and Boron Total Maximum Daily Load for the lower San Joaquin River (Basin Plan Amendment1) as described in the Water Quality Control Plan for the Sacramento and San Joaquin River Basins, 4th Edition (Basin Plan). The MAA states:
[The United States Bureau of] Reclamation will submit a Draft Compliance Monitoring and Evaluation Plan to the Regional Water Board. Where appropriate, the draft plan will propose the data and quantification methods used to evaluate the salt loads from Delta-Mendota Canal (DMC) operations and salinity offset credits to be applied to the various elements of Reclamation’s Action Plan.
Data will include monitoring locations, parameters monitored, data collection methods, and data quality control. Included with the proposed quantification methods for salt load offset credits for each element of Reclamation’s Action Plan will be a description of the salt mitigation benefit of each element and a clear explanation of how the proposed quantification method accurately quantifies the salt load effect.
The MAA refers to Reclamation’s Salinity Management Plan of Actions to Address the Salinity and Boron Total Maximum Daily Load Issues for the Lower San Joaquin River (Action Plan), which can be downloaded at
http://www.waterboards.ca.gov/centralvalley/water_issues/tmdl/central_valley_projects/ vernalis_salt_boron/draft_maa_plan.pdf
The MAA can be downloaded at
http://www.waterboards.ca.gov/centralvalley/water_issues/ tmdl/central_valley_projects/vernalis_salt_boron/signed_maa_22dec08.pdf.
1 A TMDL specifies the maximum amount of a pollutant that a waterbody can receive and still meet water quality standards and allocates pollutant loadings among point and nonpoint pollutant sources. A TMDL is the sum of the individual wasteload allocations (WLAs) for point sources and load allocations (LAs) for nonpoint sources and natural background (40 CFR 130.2) with a margin of safety (CWA section 303(d)(1)(c)). (US EPA TMDL Guidance, 2005)

Reclamation Draft Compliance Monitoring and Evaluation Plan
2
Organization of Plan Regional Water Board staff proposed a phased approach to developing the Compliance Monitoring and Evaluation Plan. The first phase lasts two-years, and has specific tasks designed to obtain the necessary information, develop quantification methods, and develop a draft report evaluating the performance of the Action Plan elements. The second phase would be prescribed in a revised Management Agency Agreement. The Action Plan describes all of the actions contemplated by Reclamation to implement the MAA. Within the Action Plan, actions are divided into three major categories: Flow, Salt Load Reduction, and Mitigation. The Action Plan also described potential future actions. For each implementation action and for salinity imported through the DMC this plan includes a brief description and status, quantification methodology and example, data sources, and current schedule. The quantification methodology and data sources for the compliance point are also described. An overall accounting methodology is described in order to summarize the amount of DMC excess salinity loads that are offset by the individual Action Plan actions. The status of potential future actions and estimated benefits will be described as they become relevant to the Action Plan. Quarterly reports will follow the described format and methodology.
Every effort has been made to use publicly available data, as requested by the Regional Water Board. Where public data is not currently available, but internal data is available and will eventually become publicly accessible, data sources are described and compared.

Reclamation Draft Compliance Monitoring and Evaluation Plan
3
A. Flow Actions Under Water Rights Decision 1641, Reclamation is to provide temporary mitigation and dilution flows to meet the Vernalis salinity and boron objectives. Reclamation has provided dilution flows from the New Melones Project and through purchases for the Vernalis Adaptive Management Program (VAMP). Flow actions include: dilution flows from New Melones Reservoir and water acquisitions.
1. New Melones Reservoir Operations – Provision of Dilution Water
Description: Congress authorized the construction and operation of New Melones Reservoir as a multi-purpose facility, which includes water quality. Non-consumptive water released from New Melones Reservoir is of high quality and provides large dilution flows for salinity in the San Joaquin River. Releases are made for in-stream fishery benefits based on schedules requested by the California Department of Fish and Game (CDFG), as well as the FWS. Releases may also be made to maintain the dissolved oxygen level in the Stanislaus River at Ripon. If these releases are not sufficient to fully meet the salinity standard at Vernalis, then additional releases will be made from New Melones Reservoir until the salinity standard is satisfied. It is the total of the non-consumptive use release which provides the assimilative capacity at Vernalis and mitigates for increased salinity in the middle reaches of the San Joaquin River.
The New Melones Reservoir Interim Plan of Operation was developed as a joint effort between Reclamation and the Fish and Wildlife Service (Service) in conjunction with the Stanislaus River Basin stakeholders. This process began in 1995 with a goal to develop a management plan with clear operating criteria for available water supplies in the Stanislaus Basin on a long-term basis. That effort was continued with a group of Stanislaus stakeholders in 1996; however, the focus shifted to an interim plan for 1997 and 1998 operations. During a stakeholder’s meeting on January 29, 1997, a final interim plan of operation for the New Melones Reservoir was agreed upon in concept.
Status: New Melones Reservoir currently provides dilution flows to meet the Vernalis water quality objectives (WQOs) and to offset salinity loads imported through the DMC. The combination of land retirement, increased level IV refuge water supply, and reduced salt loading from the Grasslands Bypass Project has altered the hydrology of the Basin and has improved the water quality of the San Joaquin River over the past ten years. New Melones Reservoir dilution flows currently provide the final action to ensure the water quality standard will be met. Through Public Law 108-361, Reclamation is directed to develop and implement the Program to Meet Standards, in part to reduce the reliance on New Melones Reservoir to provide flows to meet water quality and fish objectives. Included in the Program to Meet Standards is the purchase of water from willing sellers and

Reclamation Draft Compliance Monitoring and Evaluation Plan
4
an update to the plan of operation for the New Melones Reservoir. The status of these efforts will be updated in quarterly and annual reports.
Quantification Methodology: The Basin Plan Amendment specifies that entities providing dilution flows obtain an allocation equal to the salt load assimilative capacity provided by this flow. For the quantification of dilution flow allocations, the Basin Plan Amendment uses the following equation2 to calculate assimilative capacity. However, this equation only applies if the dilution flow being quantified provides true dilution all the way to Vernalis on the San Joaquin River. In other words, dilution flows are those flows that enter the San Joaquin River and create assimilative capacity without interfering with the origin (Stanislaus River) subarea’s ability to comply with its salinity load allocation under the Basin Plan. To calculate the assimilative capacity created by Reclamation operations on the Stanislaus River, both the actual load in the river and the load allocation for the river are calculated. The actual load is subtracted from the allocation to determine if assimilative capacity is available. Calculation of the actual load on a monthly basis is based on Appendix A to the Basin Plan Amendment, which uses a site-specific EC to TDS ratio:
Lactual = Qactual * Cactual * 0.69 * 0.0013599
Where: Lactual = actual load in tons of salt per month Qactual = actual monthly flow volume in acre-feet (AF) Cactual = average monthly electrical conductivity in µS/cm 0.69 = TDS:EC ratio specific to Stanislaus River (Appendix A to
Basin Plan Amendment) 0.0013599 = Salinity unit conversion, to convert Total Dissolved Solids
(TDS) to tons
The load allocated to the Stanislaus River subarea is a summation of its Load Allocation and its Consumptive Use Allowance. The Load Allocation is prescribed in Table 4-15 of Appendix 1 to the Technical TMDL Report for Salt and Boron in the Lower San Joaquin River (September 2003). The Consumptive Use Allowance is the product of the actual monthly flow volume and a trigger salinity value of 192 mg/L TDS. Figure 1 is an illustration of the available assimilative capacity for the subarea.
2 Water Quality Control Plan for the Sacramento and San Joaquin River Basins, 4th Edition; Page IV-32.07, Table IV-4.4 Summary of Allocations and Credits.

Reclamation Draft Compliance Monitoring and Evaluation Plan
5
Figure 1: Assimilative Capacity Calculation for the Stanislaus River Subarea
Data Collection and Quality Assurance/Quality Control (QA/QC): The United States Geological Survey’s (USGS) maintains a stream gauging station at Ripon on the Stanislaus River, the closest station to its confluence with the San Joaquin River. The station is number 11303000 and is located at Latitude 37.7300°N, Longitude 121.1090°W. The publicly-available USGS flow data (Qactual) is summarized monthly to calculate actual loads and Consumptive Use Allowances. Electrical conductivity (Cactual) is the monthly average of available daily measured EC (in µS/cm) at the Reclamation water quality station at Ripon on the Stanislaus River, available on the California Data Exchange Center (CDEC) database at http://www.cdec.water.ca.gov (RPN sensor number 100). EC is measured continuously (every 15 minutes) by a Hydrolab MS5 sonde. Reclamation’s Standard Operating Procedure for the sonde is attached as Appendix A. The station is calibrated every month for the range of EC from 0 to 2000 µS/cm.
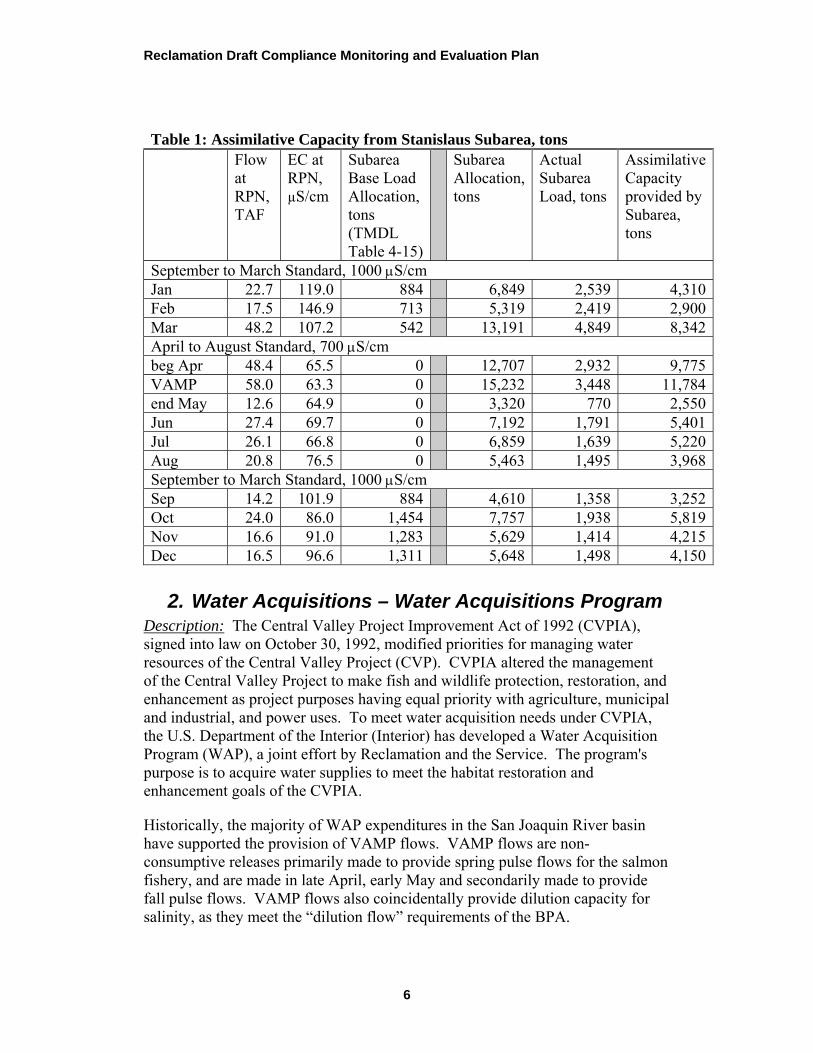
Example: As an example, Table 1 lists data and monthly calculations for 2008. Data for flow and salinity at Ripon, along with Base Load Allocations for the Stanislaus subarea are used to calculate actual loads and load allocations for the subarea. The difference between actual load and load allocation represents the assimilative capacity provided by Reclamation dilution flows, demonstrated in Table 1.
Consumptive Use Allowance:
Actual flow * trigger value
Subarea Base Load Allocation: Table 4-15
Actual Load: Actual flow *
actual EC
Assimilative Capacity from Subarea:
Allocation – Actual Load
Subarea Allocation
Subarea Load
Reclamation Draft Compliance Monitoring and Evaluation Plan
6
Table 1: Assimilative Capacity from Stanislaus Subarea, tons Flow
at RPN, TAF
EC at RPN, µS/cm
Subarea Base Load Allocation, tons (TMDL Table 4-15)
Subarea Allocation, tons
Actual Subarea Load, tons
Assimilative Capacity provided by Subarea, tons
September to March Standard, 1000 μS/cm Jan 22.7 119.0 884 6,849 2,539 4,310Feb 17.5 146.9 713 5,319 2,419 2,900Mar 48.2 107.2 542 13,191 4,849 8,342April to August Standard, 700 μS/cm beg Apr 48.4 65.5 0 12,707 2,932 9,775VAMP 58.0 63.3 0 15,232 3,448 11,784end May 12.6 64.9 0 3,320 770 2,550Jun 27.4 69.7 0 7,192 1,791 5,401Jul 26.1 66.8 0 6,859 1,639 5,220Aug 20.8 76.5 0 5,463 1,495 3,968September to March Standard, 1000 μS/cm Sep 14.2 101.9 884 4,610 1,358 3,252Oct 24.0 86.0 1,454 7,757 1,938 5,819Nov 16.6 91.0 1,283 5,629 1,414 4,215Dec 16.5 96.6 1,311 5,648 1,498 4,150
2. Water Acquisitions – Water Acquisitions Program Description: The Central Valley Project Improvement Act of 1992 (CVPIA), signed into law on October 30, 1992, modified priorities for managing water resources of the Central Valley Project (CVP). CVPIA altered the management of the Central Valley Project to make fish and wildlife protection, restoration, and enhancement as project purposes having equal priority with agriculture, municipal and industrial, and power uses. To meet water acquisition needs under CVPIA, the U.S. Department of the Interior (Interior) has developed a Water Acquisition Program (WAP), a joint effort by Reclamation and the Service. The program's purpose is to acquire water supplies to meet the habitat restoration and enhancement goals of the CVPIA.
Historically, the majority of WAP expenditures in the San Joaquin River basin have supported the provision of VAMP flows. VAMP flows are non-consumptive releases primarily made to provide spring pulse flows for the salmon fishery, and are made in late April, early May and secondarily made to provide fall pulse flows. VAMP flows also coincidentally provide dilution capacity for salinity, as they meet the “dilution flow” requirements of the BPA.

Reclamation Draft Compliance Monitoring and Evaluation Plan
7
Status: The WAP is an ongoing program authorized through the CVPIA. The VAMP Agreement is in the process of being extended to 2011. The State Water Resources Control Board is re-evaluating flow requirements for fishery protection on the San Joaquin River, which will establish the direction of post-VAMP fish flow obligations.
Quantification Methodology: The Basin Plan Amendment specifies that entities providing dilution flows obtain an allocation equal to the salt load assimilative capacity provided by this flow, calculated3 as follows:
Adil = Qdil * (Cdil - WQO) * EC:TDS * 0.0013599
Where: Adil = dilution flow allocation in tons of salt per month Qdil = dilution flow volume in acre-feet per month Cdil = dilution flow electrical conductivity in µS/cm WQO = salinity water quality objective for the LSJR at Airport
Way Bridge near Vernalis in μS/cm EC:TDS = TDS:EC ratio specific to River (Table A- 3 in Appendix A
to Basin Plan Amendment) or 0.66 for the Merced River and 0.67 for the Tuolumne River
0.0013599 = Salinity unit conversion, to convert TDS to tons
As discussed in Section A.1, Reclamation also examined the time periods when dilution flows through the WAP purchases occur to determine that these dilution flows are actually providing assimilative capacity to the San Joaquin River, and not merely providing assimilative capacity that is used by their subarea of origin. Allocations were determined for the subareas where dilution flows originated, based on the actual flows measured closest to tributary confluences with the main stem of the river and the base load allocations specified in Table 4-15 of Appendix 1 to the Technical TMDL Report for Salt and Boron in the Lower San Joaquin River (September 2003).
Data Collection and QA/QC: WAP purchases and releases are tracked by Reclamation’s Water Acquisitions Group (MP-400) and will be reported as monthly volumes along with the location from where the water is released. WAP purchases are primarily made to support the VAMP program, and the release schedules, locations and volumes can be found in annual reports on the VAMP program at the San Joaquin River Group Authority’s website: www.sjrg.org/technicalreport/ default.htm. Dilution flow salinity will be obtained from the Reclamation or CDEC-available EC monitoring station closest to the location of the WAP release point (or most downstream site). Appropriate station and QA/QC information for the station will be provided in subsequent data reports. Stanislaus River releases are not counted, as they are incorporated into the non-consumptive releases quantified from New Melones Reservoir, and San
3 ibid

Reclamation Draft Compliance Monitoring and Evaluation Plan
8
Joaquin River Exchange Contractor releases are not counted, as they are released from the DMC and are included in the imported supply load calculations.
Subarea salt load allocation calculations are based on the Base Load Allocations and the Consumptive Use Allowance calculations for the Merced River and Tuolumne River subareas. Flow data was obtained from USGS stream gauging stations at Modesto for the Tuolumne River (11290000) and near Stevinson for the Merced River (11272500). Occasionally Merced River data is supplemented by the Department of Water Resources station near Stevinson (B05125, MST). Salinity data from the Merced River at Stevinson (MST) and the Tuolumne River at Modesto (MOD) is used, where hourly EC data is available on CDEC from monitoring stations maintained by the California Department of Water Resources.
Example: The 2008 VAMP spring pulse flow period occurred from April 22 to May 22 and the fall pulse occurred in October. Water releases were made from the Merced River, the Tuolumne River, and through the DMC by the San Joaquin River Group Authority. Releases are timed to account for the lag time between tributary releases and arrival at Vernalis. Table 2 demonstrates the assimilative capacity provided from these releases, to the extent that it exceeds the assimilative capacity needed by the region to meet monthly load allocations for 2008.
Table 2: Assimilative Capacity from Water Acquisition Program flows, tons Merced River Tuolumne River
VAMP October VAMP October
Volume, TAF 38.1 12.5 15.28 0Salinity (EC), μS/cm 80.3 87 59.0 136.6Dilution Capacity, tons 21,212 10,243 8,925 0
Base Allocation, tons 0 2,627 0 1,505Subarea Flow, TAF 56.6 17.2 65.9 15.2Consumptive Use Allowance, tons 14,862 4,503 17,303 3,978Subarea Allocation, tons 14,862 7,130 17,303 5,483
Subarea Flow, TAF 56.6 17.2 65.9 15.2Salinity (EC), μS/cm 80.3 87 59.0 136.6Actual Subarea Load, tons 4,083 1,360 3,513 1,886
Assimilative Capacity from Subarea, tons 10,779 5,770 13,790 3,597Assimilative Capacity from WAP, tons 10,779 5,770 8,925 0

Reclamation Draft Compliance Monitoring and Evaluation Plan
9
3. Water Acquisitions – Environmental Water Account
Description: The Environmental Water Account (EWA) was a program element being implemented under the CALFED Bay-Delta Program’s water supply reliability and ecosystem restoration objectives. Although this action is included in the Action Plan, no EWA purchases were made in 2008 and none are expected in the future. This action is no longer being pursued by Reclamation; however an alternative program may replace EWA in the future. Reclamation will provide status updates of the new program at that time.
4. DMC Recirculation – Provision of Dilution Water Description: The DMC Recirculation Project is one project Reclamation is studying that could provide dilution water for salinity management. As part of the project studies, Reclamation conducted three pilot recirculation studies, in 2004, 2007, and 2008. The pilot studies pump water from the Delta at Tracy and convey it through the DMC to the Newman Wasteway, where it is then conveyed to the lower San Joaquin River.
Status: In the months of July, August, and September of 2008, water was conveyed to the San Joaquin River to pilot the DMC recirculation project and evaluate water quality.
Quantification Methodology: For the quantification of dilution flow allocations, the Basin Plan prescribes the following equation4 to calculate assimilative capacity. The Basin Plan specifies that entities providing dilution flows obtain an allocation equal to the salt load assimilative capacity provided by this flow, calculated as follows:
Adil = Qdil * (Cdil - WQO) * 0.8293
Where: Adil = dilution flow allocation in tons of salt per month Qdil = dilution flow volume in thousand acre-feet per month Cdil = dilution flow electrical conductivity in µS/cm WQO = salinity water quality objective for the LSJR at Airport
Way Bridge near Vernalis in μS/cm 0.8293 = Salinity unit conversion, to convert TDS to tons (using the
same EC:TDS as is used for the DMC)
Data Collection and QA/QC: Recirculation flows are tracked by Reclamation’s Central Valley Operations office and are reported as monthly volumes in the tables described in Section D of the Draft Plan (CVO Table 25). Recirculation flows were monitored for a number of water quality constituents in the Newman 4 ibid

Reclamation Draft Compliance Monitoring and Evaluation Plan
10
Wasteway as part of the pilot study. EC was measured continuously (every 15 minutes) using YSI 600 XL sondes in several locations following the same QA/QC protocols as the existing Reclamation sampling program for the DMC, with an accelerated calibration schedule (every 2 weeks).
Example: In the 2008 pilot Recirculation study, flows were discharged from the Newman Wasteway into the San Joaquin River from July 28 through September 15. Technical difficulties in probe replacement resulted in less than full days of data during some of the study period. Available data at milepost 8.16 in the Wasteway was averaged over the days within each month that the study was in progress. Resulting load calculations for the 2008 pilot period is provided in Table 3.
Table 3: Dilution Flow Allocation of DMC Recirculation Pilot flows, tons Jul Aug Sep
Volume, TAF 1.0 13.4 7.1 Salinity at Newman Wasteway, EC, μS/cm 795 450 530 Dilution Capacity, tons 0 -3,901 -2,763

Reclamation Draft Compliance Monitoring and Evaluation Plan
11
B. Salt Load Reduction Actions The Grassland subarea is listed as a high priority for implementing load allocations (Table IV-6 of the BPA) due to the high unit area loading of salt to the LSJR. Much of the salt load in this area is due to the high salt loads brought into the Subarea through the DMC (quantified in Section D). The Grassland and Northwest subareas also provide the physical link between the majority of the DMC load and the lower San Joaquin River, as much of the load flows through this area (and some is concentrated through the use of the water) to reach the river. Reclamation has a long history of involvement with salinity and drainage in this area. Reclamation is under a court order to provide drainage to its San Luis Unit, on the Westside of the lower San Joaquin River (including the Grassland Subarea and the Westland Water District south of the Subarea). As part of its efforts to provide drainage (the San Luis Drainage Feature Re-evaluation, http://www.usbr.gov/mp/sccao/sld/index.html), Reclamation has historically financially supported the Westside Regional Drainage Program (WRDP) activities that support implementation of the San Luis Drainage Feature Re-evaluation preferred alternative.
Within the Action Plan, Reclamation identified Salt Load Reduction Actions that include Grassland Bypass Project, a component of the WRDP, and conservation programs (Water Use Efficiency Grant Programs, Water Conservation Field Services Program (WCFSP), Water 2025 Grants Program, and the CALFED Water Use Efficiency Program).
1. Grassland Bypass Project The Grassland Bypass Project (GBP) has significantly reduced contamination of the Grasslands subarea and lower San Joaquin River. The focus of the GBP has been to control selenium loading, but the project has also reduced salt loading through the control of agricultural drainage. The next phase of the GBP will include the construction of treatment facilities to remove all drainage from the GDA by 2015. Reclamation currently submits quarterly and annual reports to the Regional Water Board in compliance with its Waste Discharge Requirements. For the purposes of calculating salinity loading and credits, the GBP is considered a part of the Westside Regional Drainage Plan, and is not separately characterized. Since 1997 (the end of the historic period upon which the Basin Plan is based), the GBP has reduced its salt load to the lower San Joaquin River by 72 percent.
2. Westside Regional Drainage Plan Description: The Grassland Area Farmers formed a regional drainage entity in March 1996 under the umbrella of the San Luis and Delta-Mendota Water Authority (SLDMWA) to implement the Grassland Bypass Project (http://www.usbr.gov/mp/grassland/). The Project consolidates subsurface drainage flows on a regional basis and utilizes a portion of the federal San Luis Drain to convey drainage flows around habitat areas, in order to reduce the high

Reclamation Draft Compliance Monitoring and Evaluation Plan
12
selenium concentrations due to the historic transport of subsurface drainage flows through the same channels as habitat supply water. Participants include the Broadview Water District, Charleston Drainage District, Firebaugh Canal Water District, Pacheco Water District, Panoche Drainage District, Widren Water District and the Camp 13 Drainage District (located in part of Central California Irrigation District). This entity includes approximately 97,000 acres of irrigated farmland, an area referred to as the Grassland Drainage Area. The Grassland Area Farmers, with state and federal funding support, have implemented several activities aimed at reducing discharge of subsurface agricultural drainage waters to the San Joaquin River. These activities have included the GBP (to remove agricultural drainage waters from wetland channels) and the San Joaquin River Improvement Project (SJRIP, the purchase and planting of an area land for the reuse and concentration of agricultural drainage water on increasingly salt tolerant crops). These efforts collectively have evolved into the Grassland Drainage Area’s portion of the Westside Regional Drainage Plan.
The Westside Regional Drainage Plan (WRDP) was developed by stakeholders to address the immediate actions that could be taken to assist Reclamation in meeting the goals of the San Luis Drainage Feature Reevaluation Program with an in-valley solution. The WRDP focuses on regional drainage projects that can be implemented on a short timeline. The chief components include land retirement, groundwater management, source control, regional re-use, treatment, and salt disposal. Reclamation has been providing consistent funding, with a 50 percent cost share requirement, since 2006; as well as varying degrees of funding since 1996.
Status: The Grassland Bypass Project is in the 14th year of its implementation. Reclamation provided $3.5 million in grant funding in 2008 and expects to provide up more than $7.5 million5 in funding in 2009 to implement the GBP. The GBP is also incorporated into the San Luis Delta-Mendota Water Authority’s Integrated Regional Water Management Plan, and has been awarded implementation funds through California Proposition 50 in 2007. These funds are being used to implement components of the Westside Regional Drainage Plan by expanding and developing the drainage reuse area, implementing groundwater pumping programs, and investigating salt disposal technologies. Specific funded activities and cost-shares will be reported through the Draft and Final Reports Reclamation submits to the Regional Water Board in compliance with this Draft Plan. The current San Luis Drain Use Agreement expires in December, 2009 and an Environmental Impact Report/Statement (EIR/EIS) has been released to cover a renewal of the Use Agreement.
Quantification Methodology: Reclamation calculates salinity loads from the Grassland Bypass Project using a simple load equation with a site-specific EC to TDS ratio. The EC to TDS ratio was developed using locally collected data. The load equation is:
5 Includes grants and assistance agreements with the Service, USGS, and CDFG.

Reclamation Draft Compliance Monitoring and Evaluation Plan
13
L = Q * C * 0.74 * 0.0013599 Where:
L = Daily load of salts from Grassland Bypass Project, tons Q = Daily flow from Grassland Bypass Project through San Luis
Drain, acre feet C = Daily electrical conductivity in San Luis Drain at Station B,
μS/cm 0.74 = Site-specific EC to TDS ratio6 0.0013599 = Conversion Factor from Basin Plan
Daily loads are calculated because monthly averaging can result in significant over or underestimation of loads, due to the high variability in daily flows as measured at the compliance monitoring station. The daily salt loads are then summed to determine monthly loads.
The goal of the Grassland Bypass Project is to reduce the selenium load discharged to the San Joaquin River, but a secondary benefit of the project is to reduce salinity load discharged to the San Joaquin River. Calculating the salt loads discharged by the Project is not enough to understand how salinity delivered into the region is transported through the region to the San Joaquin River. To capture the reduced salt load, the subarea scale is again examined. The Basin Plan describes the regulated Load Allocation for the Grassland Subarea as a summation of a Consumptive Use Allowance, a DMC Supply Water Allowance and a prescribed Base Load Allocation. The Consumptive Use Allowance is based on real time flow data, while the Base Load Allocation and DMC Supply Water Allowance are based on prescribed numbers based on the design flow criteria. The DMC Supply Water Allowance is granted in the Basin Plan because it is expected to be offset by the load allocation imposed on the DMC.
USGS flow and salinity data collected at Mud Slough near Gustine (station 11262900) and at Salt Slough at Highway 165 near Stevinson (station 11261100) are used to calculate Mud Slough and Salt Slough salt loads, using site-specific EC:TDS conversion ratios, which are then combined to calculate actual subarea loads. This calculation includes groundwater accretions to Mud Slough and Salt Slough. In the development of the Basin Plan, groundwater accretions were estimated and removed from subarea loads and instead considered a portion of the base loads at Vernalis. So, in accordance with the schedule in Table 4-4 of Appendix 1 to the Technical TMDL Report for Salt and Boron in the Lower San Joaquin River (September 2003), prescribed groundwater accretions were scaled to represent only Mud and Salt Slough contributions, and then subtracted from the actual subarea load calculations.
6 California Regional Water Quality Control Board, Central Valley Region, February 1998. Loads of Salt, Boron, and Selenium in the Grassland Watershed and Lower San Joaquin River: October 1985 to September 1995. Volume 1: Load Calculations. Page 15.

Reclamation Draft Compliance Monitoring and Evaluation Plan
14
Reclamation then calculated when actual loads in the subarea were less than the subarea’s load allocation. Reclamation considers the reduced loads that are equivalent to the DMC supply water allowance should be first applied to offset DMC excess loads, since these loads are no longer reaching the lower San Joaquin River. Table 4 walks through these calculations and presents other relevant information.7 Figure 2 illustrates the calculations.
Data Collection and QA/QC: Monitoring flow and water quality of the Grassland Bypass Project is a collective effort by Reclamation, the Regional Water Board, Service, CDFG, SLDMWA, U.S. Environmental Protection Agency, and the USGS. The San Francisco Estuary Institute (SFEI) maintains a website and posts monthly and annual monitoring reports at http://www.sfei.org/grassland/reports/ gbppdfs.htm. There is also a map of monitoring site locations in the monthly reports.
Daily GBP salinity loads are calculated using mean daily flow and salinity measurements made at the San Luis Drain terminus (Site B2). Information on probe types and QA/QC methodology is publicly available in the GBP annual reports and the QAPP associated with the project. Because of the lag in report posting to the website, Reclamation will obtain the data directly from the SLDMWA.
Figure 2: Assimilative Capacity Calculation for the Grassland Subarea
7 All calculations assume the 2009 Water Year is dry for the San Joaquin River (for October, November, and December).
Consumptive Use Allowance:
Actual flow * trigger value
Subarea Base Load Allocation: Table 4-15
Actual Load: Actual flow * actual EC – Groundwater Accretions
(Table 4-4)
Assimilative Capacity from Subarea:
Allocation – Actual Load
Subarea Allocation
Subarea Load
DMC Supply Water Credit:
Table 4-19
Portion that offsets DMC Supply Water Load

Reclamation Draft Compliance Monitoring and Evaluation Plan
15
Flow and salinity are measured by the USGS at four other sites in the Grasslands Subarea. The real-time data are posted on the California Data Exchange Center and preliminary data are reported by USGS each month. Mud and Salt Slough flow and salinity data are collected by USGS at stations 11262900 and 11261100, respectively. Data from these two stations were used to estimate actual loads and Consumptive Use Allowances for the Grassland subarea.
Example: Table 2a of the SFEI monthly data reports contain the data for Q and C. Table 4 shows the monthly salt loads based on the computation and summation of daily salt loads using the equation above, for the year 2008. Monthly flows and monthly salinity averages are not included because daily loads were computed and summed to obtain the monthly tons. Daily flow and salinity data are available in the monthly data reports that are publicly available through October 2008. November and December data were obtained directly from the Grassland Drainage Authority. USGS data was used to calculate 2008 subarea loads and allocations.

Reclamation Draft Compliance Monitoring and Evaluation Plan
16
Table 4: Offset Potential from Grassland Subarea, tons of salt (Total Offset Potentials for DMC Load are in Bold)
GB
P di
scha
rge,
tons
Flow
in M
ud S
l, TA
F
EC in
Mud
Sl,
µS/c
m
Flow
in S
alt S
l, TA
F
EC in
Sal
t Sl,
µS/c
m
Bas
e Lo
ad A
lloca
tion,
to
ns (T
able
4-1
5)
CV
P Im
port
Supp
ly
Wat
er C
redi
t (Ta
ble
4-19
) Su
bare
a G
roun
d-w
ater
A
ccre
tions
, ton
s (T
able
4-4
, sca
led
to
suba
rea)
Suba
rea
Allo
catio
n,
tons
Act
ual S
ubar
ea L
oad,
to
ns
Ass
imila
tive
Cap
acity
pr
ovid
ed b
y Su
bare
a,
tons
September to March Standard, 1000 μS/cm Jan 7,432 1.1 3,808 6.3 1,223 7,022 3,300 6,000 15,801 5,038 10,763Feb 8,344 0.9 3,664 4.4 1,217 5,663 8,900 6,000 19,629 2,048 17,582Mar 6,964 1.1 2,521 2.7 1,380 4,304 17,200 12,000 27,204 -5,942 33,146April to August Standard, 700 μS/cm beg Apr 4,429 6.3 1,616 3.0 1,673 0 15,847 8,960 18,260 5,243 13,017VAMP 7,633 4.9 2,252 6.1 1,574 0 24,507 14,060 27,177 5,070 22,107end May 2,747 5.8 2,398 3.1 1,968 0 7,246 4,180 8,066 14,590 0Jun 5,661 5.7 2,678 2.7 2,157 0 33,300 21,200 35,424 -1,651 37,075Jul 4,136 6.9 2,603 7.7 1,618 0 32,500 18,400 34,443 9,815 24,628Aug 2,856 0.9 3,664 4.4 1,217 0 31,800 10,800 33,197 -2,752 35,949September to March Standard, 1000 μS/cm Sep 2,631 1.1 2,521 2.7 1,380 7,022 27,500 6,400 35,518 -342 35,860Oct 3,595 6.3 1,616 3.0 1,673 11,552 23,700 5,200 37,695 9,003 28,692Nov 4,523 4.9 2,252 6.1 1,574 10,193 13,000 5,600 26,067 13,528 12,539Dec 5,384 5.8 2,398 3.1 1,968 10,419 5,300 6,000 18,065 12,773 5,292

Reclamation Draft Compliance Monitoring and Evaluation Plan
17
3. Conservation Efforts Description: A water conservation measure is a practice, technique, or technology that improves the efficient use of water and thus reduces water loss or waste. Although conservation is usually seen as a water management tool to increase supplies, conservation measures also enhance water quality through reducing irrecoverable flows to saline groundwater sinks, decreasing non–beneficial evapotranspiration, eliminating or significantly decreasing water runoff, decreasing leaching, and improving water quality through reduced fertilizer and pesticide application. When water conservation measures are developed and tailored to meet the needs of local conditions, water conservation enables water users to meet environmental obligations or regulations. A recent Agricultural Water Management Council report (AWMC 2006a) notes that irrigation system improvements also reduce drainage water runoff thereby reducing the regulatory burden on farmers and providing downstream environmental and public health benefits.
Reclamation’s water use efficiency (WUE) program includes several grant programs (Water 2025, CALFED, and WCFSP) that fund actions to assure efficient use of existing water supplies. In addition to these grant programs, Reclamation also requires that all water contractors maintain current Water Management Plans which include Best Management Practices, all of which pertain to water use efficiency and conservation.
Status: The Water Conservation Program is an ongoing program mandated through the Reclamation Reform Act of 1982 (RRA) and the Central Valley Project Improvement Act of 1992 (CVPIA).
Quantification Methodology, Data Collection and QA/QC: Currently there is a lack of information regarding the baseline condition (i.e. irrecoverable flows, water runoff, water quality, etc.) of many of the project implementation areas. Without sufficient baseline data, it is challenging to quantify actual changes to water use in a project area. In addition, efforts to assess and project water use efficiency potential on farm are limited by the lack of reliable water use measurement data for agriculture.
Each grant application submitted to Reclamation must include requirements for performance and accountability; however, the recipients expected benefits of the proposed actions have generally been qualitative in nature. In addition, projects generally take 24 months to complete, and true impacts of a project can only be accurately assessed over a minimum period of five years to account for yearly temporal differences, variable cropping patterns, etc. The nature of the grant program makes it difficult for the recipient to implement a proper monitoring program due to cost and time limitations. Until a mechanism is developed to effectively capture this information and place the information in a centralized data repository, it will be difficult to quantify the contribution the WUE program on reduction to salinity impacts to the river.
Reclamation Draft Compliance Monitoring and Evaluation Plan
18
Example: Although Reclamation is unable to quantify the benefits of the various funded projects as related to salinity reduction, the following information is provided to depict the agency’s water conservation efforts in the basin. Through Water 2025, CALFED, and the WCFSP, Reclamation has awarded 36 projects in the San Joaquin Valley that require performance measures since 2006. As information is collected from these projects, quantifiable benefits may be determined in the future.

Reclamation Draft Compliance Monitoring and Evaluation Plan
19
C. Mitigation Actions In the Action Plan, Reclamation identifies two mitigation actions to mitigate salinity loads: a real time management program (RTMP) to maximize the removal of salt using assimilative capacity in the San Joaquin River, and a wetlands Best Management Practices (BMP) plan to research and potentially develop practices to reduce or better manage salinity loading from managed wetlands. Reclamation has actively supported the development of a real time monitoring and forecasting program in the River and in managed wetlands.
1. Real Time Management Program – Development of Stakeholder-Driven Program
Description: The Real Time Management Program is described in the Basin Plan as a stakeholder driven effort to use “real-time” water quality and flow monitoring data to support water management operations in order to maximize the use of assimilative capacity in the San Joaquin River. The Regional Board describes this assimilative capacity as up to 85 percent of the load determined by Vernalis salinity objective minus the actual load in the river and uses this adaptive approach as a means to encourage the maximum export of load from the basin while still meeting the stated objective.
The salinity issues in the San Joaquin River are complex and diverse, involving many interested stakeholders. The process of developing and implementing a successful program must have broad support and consensus from all parties. This effort will include engaging stakeholders in developing a plan, addressing obstacles identified by stakeholders, and designing implementable strategies for the program, including the identification and implementation of physical infrastructure to facilitate real-time management. A neutral third party coordinator is necessary to manage the group’s efforts and keep the focus on developing a viable program without bias through a collaborative process.
Status: Reclamation has contracted with a facilitation firm to support the development of a stakeholder-driven program. Currently, Reclamation is funding efforts, but anticipates that the program will explore cost-sharing arrangements. To date, a work plan has been developed which includes a stakeholder survey, scoping meetings, three workshops, work elements meetings, and technical group meetings. The program schedule, meeting notes, related documents, and additional information regarding the program are available at http://www.sanjoaquinriverrtmp.com/.
Quantification Methodology: Quarterly reports will include the status and quarterly accomplishments of the following Program tasks:
• Solicit stakeholder comments and feedback on RTMP • Form working groups to develop program components • Engage stakeholders in related basin activities

Reclamation Draft Compliance Monitoring and Evaluation Plan
20
• Conduct periodic stakeholder workshops • Develop an implementable program
Data Collection and QA/QC: Technical memorandums and work group products will be vetted through the stakeholder process and made available to all interested parties.
Example: Actions undertaken in 2008 include: • Executed a contract to procure the service of a consultant to facilitate
stakeholder involvement in developing a RTMP. • Directed a consultant to develop and conduct a stakeholder survey to
solicit feedback on the RTMP process and garner suggestions on salinity management in the basin.
• Conducted several coordinating and planning meetings to develop and prepare for the first stakeholder workshop held on January 8, 2009.
2. Real Time Management Program – Technical Support
Description: A successful RTMP will require a real time monitoring network on the San Joaquin River and a model capable of reasonably accurate forecasting of assimilative capacity. The RTMP may also require the construction of new physical infrastructure to optimize the program. Reclamation is committed to participating in the process, supporting the development of data and analytical tools, and the study of the system capacity and physical infrastructure needs. Reclamation staff has valuable experience in all of these areas. The stakeholder process will direct the technical support of this program.
Status: Reclamation is already involved in the development of various tool and analytical models and will be an active participant in the various technical working groups. Reclamation has made personnel available to serve as technical resources to support the various working groups, and has retained some initial engineering support for other technical needs. Reclamation and DWR share a common interest in collection of flows and water quality data on the San Joaquin and are working collaboratively to adapt the existing monitoring networks to support the RTMP.
Quantification Methodology: Quarterly reports will include the status and quarterly accomplishments of the following Program tasks:
• Survey of existing tools/monitoring points • Identify data/analysis gaps • Stakeholder subgroup to scope and manage technical support efforts
Data Collection and QA/QC: Technical memorandums and work group products will be vetted through the stakeholder process and made available to all interested parties.

Reclamation Draft Compliance Monitoring and Evaluation Plan
21
Example: In order to illustrate the potential use of assimilative capacity, Reclamation calculated the available daily capacity in 2008. In 2008, assimilative or dilution capacity was available for 246 days of the year in the San Joaquin River (times at which the river was less than 85 percent of the Water Quality Objective) for a total of approximately 115,000 tons of salt (when calculated on a daily basis). On the other hand, the assimilative capacity of the river was exceeded for 119 days. The concept behind the RTMP is to enable the use of this available assimilative capacity to export salt loads from the basin or to better time the release of salinity loads into the river to times when there is greater dilution capacity, which should also reduce the times where river capacity is exceeded (to the extent that exceedances are caused by discharges and not by background or allowed loads). Development of an accurate forecast model will to serve as a decision making tool to help manage salinity loads in the river without violating water quality standards.
Using the same data as was used to calculate Vernalis salinity (section F, Table 12), Figure 3 and Table 5 were generated. Figure 3 illustrates the timing and magnitude of potential dilution capacity in tons for 2008, by calculating actual 2008 salinity loads at Vernalis and the Basin Plan load goals of meeting 85 percent of the Water Quality Objective. Table 5 illustrates assimilative capacity at Vernalis (allowed loads based on existing WQO and a margin of safety minus actual loads) in monthly loads (note that negative numbers indicate available assimilative capacity).
Figure 3: 2008 Vernalis Load and Assimilative Capacity, on a Daily Scale
0
1,000
2,000
3,000
4,000
5,000
6,000
J F M A M J J A S O N D
Month
Load
s (to
ns)
Available AssimilativeCapacityVernalis Load

Reclamation Draft Compliance Monitoring and Evaluation Plan
22
Table 5: Monthly “Real-Time” Assimilative Capacity at Vernalis, tons
Ver
nalis
Fl
ow, T
AF
Ver
nalis
EC
, μS
/cm
Ver
nalis
ac
tual
load
, to
ns
Ver
nalis
max
lo
ad, t
ons
Ass
imila
tive
Cap
acity
, to
ns
September to March Standard, 1000 μS/cm Jan 136 681 78,011 97,384 19,373 Feb 133 750 84,096 95,339 11,243 Mar 133 847 94,881 95,215 334 April to August Standard, 700 μS/cm beg Apr 86 550 39,925 43,192 3,267 VAMP 190 308 49,498 95,765 46,268 end May 32 559 13,957 16,299 2,343 Jun 68 669 38,422 34,177 -4,245 Jul 55 611 28,325 27,519 -734 Aug 53 600 26,846 26,641 -204 September to March Standard, 1000 μS/cm Sep 48 687 27,530 34,084 6,554 Oct 62 600 31,240 44,236 12,996 Nov 65 763 41,566 46,293 4,727 Dec 73 870 53,670 52,438 -1,233
3. Wetlands Best Management Practices Plan Description: Managed wetlands compose a majority of the acreage within the Grassland Subarea. Although wetlands do not increase salinity to the degree that agriculture does, there is a significant volume of DMC water supply that flows through the systems. The Program to Meet Standards and the Action Plan describe the development of a strategic plan for identifying, studying and implementing Best Management Practices in managed wetlands. The goal of this concept is to reduce salinity in discharges or to manage the timing of discharges while optimizing the ecological benefits of managed wetlands.
Status: Reclamation has been working with the Service, CDFG, and the Grassland Water District to develop a Strategic Wetlands BMP Plan. Reclamation also provides resources to support the development of a real-time monitoring network (over 28 stations) and other potential BMP analysis tools within federal, state, and private managed wetlands. At present, the Plan has not been completed and released to the public. In 2009, Reclamation will work with the Service to facilitate the sharing of information on these tools between investigators, with the goal of finalizing a strategic plan for moving forward. Wetland water and salinity balances will also likely be explored through the RTMP.

Reclamation Draft Compliance Monitoring and Evaluation Plan
23
Quantification Methodology: These efforts are not at a stage where they can be quantified. Reporting will focus on the status of Plan development and on study results.
Data Collection and QA/QC: See above.
Example: See status.

Reclamation Draft Compliance Monitoring and Evaluation Plan
24
D. Central Valley Project Deliveries Load Calculation Description: The Central Valley Project (CVP) delivers water to both the Grassland and Northwest subareas (as described in the Basin Plan) through the Delta-Mendota Canal (DMC). The DMC starts at the pumping headworks in the Delta, the C.W. Jones (Jones) Pumping Plant at Tracy, California. Water is conveyed south to the San Luis Reservoir, where water is mixed with the State Water Project in O’Neill Forebay and then either pumped into San Luis Reservoir for later delivery, or conveyed further south through the DMC to the Mendota Pool. Turnouts and groundwater pump-ins occur at several locations along the DMC. “Reach 1” of the DMC includes turnouts between the Jones Pumping Plant and the San Luis Reservoir. Deliveries for Reach 1 are made through the San Luis Canal and the Cross Valley Canal, as well as directly out of the DMC. “Reach 2” of the DMC includes turnouts between the O’Neill Forebay and the Mendota Pool. “Reach 3” covers deliveries made out of the Mendota Pool. Some simplification of this system has been made for accounting purposes, as some districts take portions of their deliveries through several turnouts.
Figure 4 is a map of the DMC water quality monitoring locations. Figure 5 is a map of the agencies served by the DMC.
Quantification Methodology: The Basin Plan allocates a load to Reclamation for water delivered to the Grassland and Northwest side Subareas. This load allocation is calculated according to Table IV-8 Summary of Allocations and Credits:
LADMC = QDMC * 52 mg/L * 0.0013599
Where: LADMC = Load Allocation of salts, in tons QDMC = monthly amount of water delivered to Grassland and
Northwest side subareas, in acre feet 52 = “background” TDS of water in the San Joaquin River at
Friant per the Basin Plan 0.0013599 = factor for converting units into tons

6
S an Joaqui n R
ive r
proposed 180
Sa n J o aquin R iv e r
Delta-Mendota Canal
LOS BANOSLOS BANOS
CHOWCHILLACHOWCHILLA
MERCEDMERCED
STOCKTON
TRACYTRACY
COULTERVILLECOULTERVILLE
MODESTOMODESTO
TURLOCKTURLOCK
SONORA
FIREBAUGHFIREBAUGH
MENDOTAMENDOTA
HOLLISTERHOLLISTER
DMC Check 13(MP 70.01)
Six Closed Drain Sumps
Mendota Pool DMC Check 21 (MP 116.46)CCID Main Canal at Bass Ave
DMC Headworks (MP 3.50)
San Joaquin River Mer
ced River
5
5
DMC McCabe Rd(MP 68.03)
DMC Russell Ave.(MP 97.68)
DMC Washoe Ave.(MP 110.12)
580
99
140
152
132
120
152
Figure 4. Delta Mendota Canal
Water Quality Monitoring Sites
6/6/030 8 16 24 324
Milesk:\ceacock\projects\dmc\water_qual.mxdt

0 5 10 15 202.5 Miles
Figure 5. CVP Contractors in the Grasslands and Northwest SubareasGrasslands subareaNorthwest subareaCVP Delta Division ContractorsCVP San Luis Unit ContractorsSJR Exchange ContractorsState and Federal Wildlife RefugesCVP Contractors outside Northwest subarea

Reclamation Draft Compliance Monitoring and Evaluation Plan
27
Anything above this load allocation is an excess salt load which must be offset. Reclamation is proposing to offset this excess salt load through the actions described in the Action Plan. Excess salt loads are calculated by the following equation:
ELDMC = QDMC * (CDMC – 52 mg/L)* 0.0013599
Where: ELDMC = excess salt load above the Load Allocation (LADMC), in tons QDMC = monthly amount of water delivered to Grassland and
Northwest side subareas, in acre feet CDMC = monthly average (arithmetic mean) of salinity of the water
delivered to Grassland and Northwest Subareas, in mg/L 52 = “background” salinity of water in the San Joaquin River at
Friant per Basin Plan 0.0013599 = factor for converting units into tons
Each delivery reach’s QDMC is calculated and then paired with the associated monthly average EC for that reach, so the equation essentially becomes:
ELDMC = 0.0013599 * Σ(QDMC * (CDMC – 52 mg/L))Reach 1-3
This equation is then broken into two calculations, one for each subarea.
Data and QA/QC: Water delivery data is assembled by the San Luis Delta Mendota Water Authority’s (SLDMWA) water master and submitted to Reclamation and SLDMWA members. Reclamation checks submitted numbers against contract schedules and measured pumping volumes at the Bill Jones Pumping Plant in Tracy and at O’Neill Forebay. CVO compiles and publishes this data on-line at: http://www.usbr.gov/mp/cvo/CVO_Rpts.html.
Data are publicly available shortly after the end of each month, and the pertinent reports are the San Joaquin and Mendota Pool (Table 24), Delta-Mendota Canal (Table 25), and San Luis and Cross Valley Canals (Table 26).
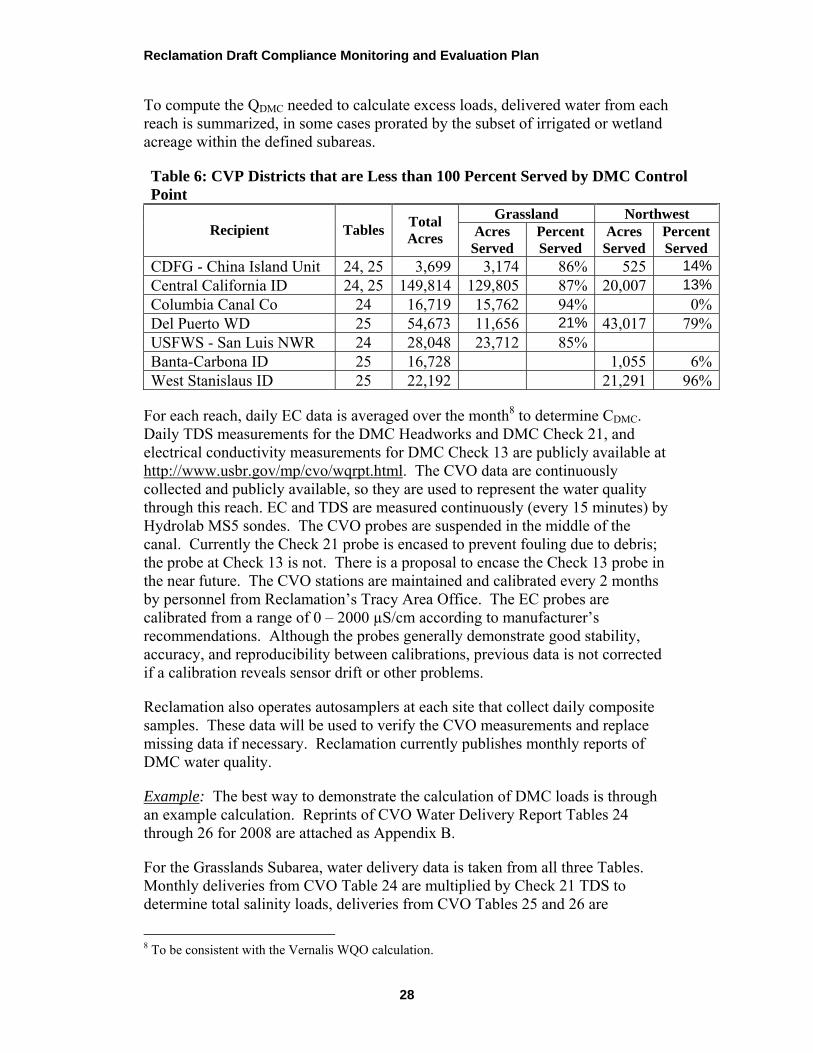
The delivered water is applied within contractors’ service areas. Some service areas lie partially within the Grassland and/or Northwest subareas (defined in the Basin Plan). Since the subareas are given their own load allocations with a supply water credit, it is important to differentiate how much imported water is delivered to each subarea. Using the boundary description of subareas in the Basin Plan (Appendix 1, Item 41), Reclamation applied GIS tools to determine the proportion of acres for each service area that lies only partially within one or both subareas (less than 100 percent of the DMC supply water is used within the subarea). There are seven parties that apply less than 100 percent of their Delta water supplies within a subarea, and the percent of area that lies within each subarea are quantified in Table 6.
Reclamation Draft Compliance Monitoring and Evaluation Plan
28
To compute the QDMC needed to calculate excess loads, delivered water from each reach is summarized, in some cases prorated by the subset of irrigated or wetland acreage within the defined subareas.
Table 6: CVP Districts that are Less than 100 Percent Served by DMC Control Point
Grassland Northwest Recipient Tables Total
Acres Acres Served
Percent Served
Acres Served
Percent Served
CDFG - China Island Unit 24, 25 3,699 3,174 86% 525 14%Central California ID 24, 25 149,814 129,805 87% 20,007 13%Columbia Canal Co 24 16,719 15,762 94% 0%Del Puerto WD 25 54,673 11,656 21% 43,017 79%USFWS - San Luis NWR 24 28,048 23,712 85% Banta-Carbona ID 25 16,728 1,055 6%West Stanislaus ID 25 22,192 21,291 96%
For each reach, daily EC data is averaged over the month8 to determine CDMC. Daily TDS measurements for the DMC Headworks and DMC Check 21, and electrical conductivity measurements for DMC Check 13 are publicly available at http://www.usbr.gov/mp/cvo/wqrpt.html. The CVO data are continuously collected and publicly available, so they are used to represent the water quality through this reach. EC and TDS are measured continuously (every 15 minutes) by Hydrolab MS5 sondes. The CVO probes are suspended in the middle of the canal. Currently the Check 21 probe is encased to prevent fouling due to debris; the probe at Check 13 is not. There is a proposal to encase the Check 13 probe in the near future. The CVO stations are maintained and calibrated every 2 months by personnel from Reclamation’s Tracy Area Office. The EC probes are calibrated from a range of 0 – 2000 µS/cm according to manufacturer’s recommendations. Although the probes generally demonstrate good stability, accuracy, and reproducibility between calibrations, previous data is not corrected if a calibration reveals sensor drift or other problems.
Reclamation also operates autosamplers at each site that collect daily composite samples. These data will be used to verify the CVO measurements and replace missing data if necessary. Reclamation currently publishes monthly reports of DMC water quality.
Example: The best way to demonstrate the calculation of DMC loads is through an example calculation. Reprints of CVO Water Delivery Report Tables 24 through 26 for 2008 are attached as Appendix B.
For the Grasslands Subarea, water delivery data is taken from all three Tables. Monthly deliveries from CVO Table 24 are multiplied by Check 21 TDS to determine total salinity loads, deliveries from CVO Tables 25 and 26 are
8 To be consistent with the Vernalis WQO calculation.

Reclamation Draft Compliance Monitoring and Evaluation Plan
29
multiplied by Check 13 EC and an EC:TDS conversion factor of 0.62 to determine total salinity loads. Where appropriate, deliveries are prorated to reflect the proportion of service area within the Grasslands Subarea that receives CVP water (when less than 100 percent). Total salinity loads from the DMC and Mendota Pool are then summed for the subarea. Excess loads are calculated by subtracting a background allowance (the delivery flows multiplied by a CBG of 85 μS/cm) from the calculated total loads. Excess load calculations are demonstrated in Tables 7 through 9.
For the Northwest Subarea, water delivery data is taken from CVO Tables 24 and 25. Monthly deliveries from CVO Table 24 are multiplied by Check 21 tds to determine total salinity loads, deliveries from CVO Table 25 are multiplied by DMC Headworks TDS to determine total salinity loads. Where appropriate, deliveries are prorated to reflect the proportion of service area within the Northwest Subarea (when less than 100 percent). Total salinity loads from the DMC and Mendota Pool are then summed for the subarea. Excess loads in CVP water delivered to the Northwest Subarea are calculated by subtracting a background allowance (the delivery flows multiplied by a CBG of 52 MG/l) from the calculated total loads. Excess load calculations are demonstrated in Table 10.
Excess CVP salinity loads from deliveries to both subareas are summarized in Table 11.

Reclamation Draft Compliance Monitoring and Evaluation Plan
30
Table 7: 2008 San Joaquin River and Mendota Pool Deliveries from CVP (Grassland Subarea) La
guna
WD
(via
CC
ID),T
AF
San
Luis
WD
(via
CC
ID),
TAF
Cen
tral C
alifo
rnia
ID (C
CID
), TA
F
Col
umbi
a C
anal
Co,
TA
F
Fire
baug
h C
anal
WD
, TA
F
San
Luis
Can
al C
o (S
LCC
), TA
F
Gra
ssla
nd W
D (v
ia C
CID
&
SLC
C),
TAF
Kes
ters
on (U
SFW
S) (v
ia
CC
ID),
TAF
Los B
anos
WM
A (C
DFG
) (v
ia C
CID
), TA
F
San
Luis
NW
R (U
SFW
S) (v
ia
SLC
C),
TAF
Chi
na Is
land
Uni
t (C
DFG
), TA
F
Salt
Slou
gh U
nit (
CD
FG),
TAF
Frei
tas U
nit (
USF
WS)
(via
C
CID
), TA
F
Tota
l Del
iver
ies,
TAF
Ave
rage
TD
S at
Che
ck 2
1,
mg/
L
Mon
thly
Sal
t Loa
d, th
ousa
nd
tons
Multiplier 1.00 1.00 0.87 0.94 1.00 1.00 1.00 0.85 1.00 0.85 0.86 1.00 0.85 NA NA NA September to March Standard, 1000 μS/cm Jan 0 0 0 0 0.4 0 4.9 0 1.8 3.2 0.6 0.8 1.1 12.7 451 7.8 Feb 0 0.08 15.2 1.5 4.0 3.9 4.3 0.6 0.9 7.9 0.7 0.6 0.3 40.8 384 21.3 Mar 0 0.02 38.8 4.7 3.9 11.4 0.5 0.2 0.3 1.5 0.1 0.2 0.1 61.9 415 34.9 April to August Standard, 700 μS/cm Beg Apr 0 0 16.8 3.5 3.9 10.1 0.2 0.1 0.2 0 0.1 0.1 0.2 35.1 361 17.2 VAMP 0 0.02 40.7 6.0 5.4 14.3 2.5 0.1 0.3 1.7 0.1 0.2 0.1 71.5 359 34.9 End May 0 0.03 13.7 1.8 1.5 4.1 1.0 0 0.1 0.7 0 0.1 0.1 23.1 335 10.5 Jun 0 0.04 42.6 7.5 6.2 24.9 0.9 0 0.1 0 0.1 0.1 0 82.5 362 40.5 Jul 0 0.05 52.6 8.2 5.4 27.5 0.1 0 0.1 0 0.2 0.1 0 97.9 271 36.1 Aug 0 0.04 44.7 8.3 5.5 24.2 0.4 0 0.5 0 0.1 0.2 1.0 84.0 336 38.4 September to March Standard, 1000 μS/cm Sep 0 0 25.8 6.0 3.3 6.1 19.8 0 3.2 4.9 0.9 1.4 1.9 72.3 393 38.7 Oct 0 0 26.0 3.3 2.1 2.0 9.6 0 4.6 3.5 0.8 1.6 1.4 55.4 330 24.9 Nov 0 0 1.6 0 1.7 2.8 10.2 1.0 2.4 2.5 0.9 1.2 0 25.7 320 11.2 Dec 0 0 0 0 0.9 0 0 0 0 0 0 0 0.8 0.9 504 0.6

Reclamation Draft Compliance Monitoring and Evaluation Plan
31
Table 8: 2008 Delta- Mendota Canal Deliveries from CVP (Grassland Subarea)
Del
Pue
rto W
D,T
AF
Eagl
e Fi
eld
WD
, TA
F
Mer
cy S
prin
gs W
D, T
AF
Oro
Lom
a W
D, T
AF
Pano
che
WD
- A
g, T
AF
Pano
che
WD
- M
&I,
TAF
San
Luis
WD
- A
g, T
AF
San
Luis
WD
- M
&I,
TAF
Cen
tral C
alifo
rnia
ID (A
bv C
, TA
F
Cen
tral C
alifo
rnia
ID (B
lw C
, TA
F
Fire
baug
h C
anal
WD
, TA
F
Tota
l Del
iver
ies,
TAF
Ave
rage
EC
at C
heck
13,
μS
/cm
Mon
thly
Sal
t Loa
d, th
ousa
nd
tons
Multiplier 0.21 1.00 1.00 1.00 1.00 1.00 1.00 1.00 0.87 0.87 1.00 NA NA NA September to March Standard, 1000 μS/cm Jan 0 0 0 0 0.1 0 0 0 0 0.4 0.1 0.6 673 0.3 Feb 0 0 0 0.1 0.1 0 0.2 0 0 0.8 0.2 1.6 557 0.7 Mar 1.0 0 0.1 0 1.0 0 0.7 0 1.0 7.6 0.4 11.8 557 5.5 April to August Standard, 700 μS/cm Beg Apr 1.3 0 0.1 0 0.5 0 0.4 0 1.0 4.3 0.3 7.8 451 3.0 VAMP 2.0 0 0.2 0 0.8 0 0.6 0 1.9 9.4 1.5 16.3 534 7.3 End May 0.6 0 0.1 0 0.2 0 0.2 0 0.6 3.1 0.6 5.3 501 2.2 Jun 1.8 0 0.1 0 0.9 0 0.9 0 1.8 17.3 2.5 25.3 523 11.2 Jul 1.9 0 0.2 0 0.8 0 1.3 0 1.6 23.5 3.9 33.1 376 10.5 Aug 2.0 0.1 0.1 0 0.7 0 0.7 0 1.9 23.1 2.0 30.5 468 12.0 September to March Standard, 1000 μS/cm Sep 1.1 0 0.2 0 0.2 0 0.4 0 1.4 0.4 0.1 3.7 566 1.8 Oct 0.6 0 0.2 0 0.1 0 0.2 0 0.8 0.2 0 2.1 508 0.9 Nov 0.2 0 0 0 0.2 0 0 0 0.3 0.1 0.1 0.9 612 0.4 Dec 0.1 0 0 0 0.1 0 0.1 0 0.7 0 0 0.9 753 0.6

Reclamation Draft Compliance Monitoring and Evaluation Plan
32
Table 8 (Continued): 2008 Delta- Mendota Canal Deliveries from CVP (Grassland Subarea) C
hina
Isla
nd U
nit (
CD
FG)
(76,
TAF
Frie
tas U
nit (
USF
WS)
(7
6.05
L), T
AF
Salt
Slou
gh U
nit (
CD
FG) (
76,
TAF
Los B
anos
WM
A (C
DFG
) (7
6.05
), TA
F
Vol
ta W
MA
(CD
FG),
TAF
Gra
ssla
nd W
D (7
6.05
L &
C
CID
), TA
F
Gra
ssla
nd W
D (V
olta
W
aste
way
), TA
F
Kes
ters
on U
nit (
USF
WS)
(V
olta
Was
tew
ay),
TAF
Kes
ters
on U
nit (
USF
WS)
(7
6.0)
, TA
F
Tota
l Del
iver
ies,
TAF
Ave
rage
EC
at C
heck
13,
μS
/cm
Mon
thly
Sal
t Loa
d, th
ousa
nd
tons
Multiplier 0.86 1.00 1.00 1.00 1.00 1.00 1.00 1.00 1.00 NA NA NA September to March Standard, 1000 μS/cm Jan 0 0 0 0 0.2 1.1 0 0.6 0 1.8 673 1.0 Feb 0 0 0 0 0.4 6.0 0.7 0 0 7.2 557 3.4 Mar 0.4 0.8 0.5 0.5 0 1.5 0 0 0.6 4.2 557 2.0 April to August Standard, 700 μS/cm Beg Apr 0.2 0.4 0.3 0.5 0 0.6 0.3 0 0.2 2.5 451 1.0 VAMP 0.3 0.5 0.6 0.8 0.3 6.6 2.8 0 0.3 12.1 534 5.5 End May 0.1 0.2 0.2 0.2 0.1 2.6 1.1 0 0.1 4.5 501 1.9 Jun 0.2 0.3 0.4 0.3 0.3 2.7 1.0 0 0.1 5.1 523 2.3 Jul 0.5 0 0.4 0.4 0 0.4 0 0 0 1.8 376 0.6 Aug 0.4 0 0.5 0.7 1.9 1.2 0.3 0 0 5.0 468 2.0 September to March Standard, 1000 μS/cm Sep 0 0 0 0 2.6 21.6 17.0 0.9 0 42.1 566 20.1 Oct 0 0 0 0 2.8 12.7 11.8 1.5 0 28.8 508 12.3 Nov 0 0 0 0 1.5 7.6 1.0 0 0 10.1 612 5.2 Dec 1.0 0.9 0.9 0.8 0.2 0.5 0.3 0 0.8 5.5 753 3.5

Reclamation Draft Compliance Monitoring and Evaluation Plan
33
Table 9: 2008 San Luis and Cross Valley Canal Deliveries from CVP (Grassland Subarea) C
DFG
- O
'Nei
ll Fo
reba
y W
MA
, TA
F
City
of D
os P
alos
, TA
F
Pach
eco
WD
, TA
F
Pach
eco
CC
ID N
on-p
roje
ct
(Ham
burg
), TA
F
Pano
che
WD
, TA
F
San
Luis
WD
, TA
F
San
Luis
WD
- A
g (v
ia
O'N
eill
Fore
bay)
, TA
F
San
Luis
WD
- M
&I
(via
O
'Nei
ll Fo
reba
y), T
AF
VA
Cem
eter
y, T
AF
Tota
l Del
iver
ies,
TAF
Ave
rage
EC
at C
heck
13,
μS
/cm
Mon
thly
Sal
t Loa
d, th
ousa
nd
tons
Multiplier 1.00 1.00 1.00 1.00 1.00 1.00 1.00 1.00 1.00 NA NA NA September to March Standard, 1000 μS/cm Jan 0.1 0.1 0 0.1 0.1 0.6 0 0 0 1.1 673 0.6 Feb 0 0.1 0 0.8 1.2 3.5 0.3 0 0 5.9 557 2.8 Mar 0 0.1 0.2 1.1 3.3 5.5 0.7 0.1 0 11.0 557 5.2 April to August Standard, 700 μS/cm Beg Apr 0 0.1 0 1.0 3.4 5.0 0.5 0.1 0 10.1 451 3.8 VAMP 0.2 0 0.1 0 0 0 0 0 0 0.4 534 0.2 End May 0 0 0 0.4 1.5 2.6 0.2 0 0 4.8 501 2.0 Jun 0.1 0.2 0.8 0.8 4.9 8.9 0.8 0.2 0 16.7 523 7.3 Jul 0.1 0.2 1.0 0 4.9 10.5 1.2 0.1 0 18.0 376 5.7 Aug 0.1 0.2 0.7 0 2.1 6.8 0.7 0.1 0 10.7 468 4.2 September to March Standard, 1000 μS/cm Sep 0.1 0.1 0.3 0 1.2 3.8 0.4 0.1 0 6.1 566 2.9 Oct 0.1 0.1 0 0.1 0.9 4.7 0.3 0.1 0 6.4 508 2.8 Nov 0.1 0.1 0 0.1 0.3 2.7 0.2 0.1 0 3.6 612 1.8 Dec 0.1 0 0.1 0 0.3 0 0.1 0 0 0.7 753 0.4

Reclamation Draft Compliance Monitoring and Evaluation Plan
34
Table 10: 2008 Deliveries from CVP to Northwest Subarea) San Joaquin River and Mendota
Pool Deliveries from CVP Delta- Mendota Canal Deliveries from CVP
Chi
na Is
land
Uni
t (C
DFG
), TA
F
Cen
tral C
alifo
rnia
ID
(CC
ID),
TAF
Tota
l Del
iver
ies,
TAF
Ave
rage
TD
S at
C
heck
21,
mg/
L
Mon
thly
Sal
t Loa
d,
thou
sand
tons
Ban
ta-C
arbo
na ID
, TA
F
Del
Pue
rto W
D, T
AF
Patte
rson
WD
, TA
F
Wes
t Sta
nisl
aus I
D,
TAF
Cen
tral C
alifo
rnia
ID
(Abv
Ck1
3), T
AF
Cen
tral C
alifo
rnia
ID
(Blw
Ck
13),
TAF
Chi
na Is
land
Uni
t (C
DFG
) (76
), TA
F
Tota
l Del
iver
ies,
TAF
Ave
rage
TD
S at
H
eadw
orks
, mg/
L
Mon
thly
Sal
t Loa
d,
thou
sand
tons
Multiplier 0.14 0.13 NA NA NA 0.06 0.79 1.00 0.96 0.13 0.13 0.14 NA NA NA September to March Standard, 1000 μS/cm Jan 0.1 0 0.1 451 0.1 0 0 0 0 0 0.1 0 0 416 0 Feb 0.1 2.3 2.4 384 1.3 0 0.2 0.4 0 0 0.1 0 0.6 358 0.3 Mar 0 6.0 6.0 415 3.4 0 3.5 0 0.7 0.2 1.2 0.1 3.6 427 2.1 April to August Standard, 700 μS/cm Beg Apr 0 2.6 2.6 361 1.3 0 4.7 0.1 1.9 0.2 0.7 0 4.9 347 2.3 VAMP 0 6.2 6.3 359 3.1 0 7.3 0.5 2.2 0.3 1.4 0 7.8 275 2.9 End May 0 2.1 2.1 335 1.0 0 2.2 0.2 0.6 0.1 0.5 0 2.3 325 1.0 Jun 0 6.5 6.5 362 3.2 0 6.7 0.9 2.8 0.3 2.7 0 7.6 340 3.5 Jul 0 8.6 8.6 271 3.2 0 7.0 1.0 3.4 0.2 3.6 0.1 8.0 240 2.6 Aug 0 6.9 6.9 336 3.1 0 7.3 1.0 3.8 0.3 3.6 0.1 8.3 315 3.6 September to March Standard, 1000 μS/cm Sep 0.1 4.0 4.1 393 2.2 0 4.2 1.5 1.5 0.2 0.1 0 5.7 355 2.7 Oct 0.1 4.0 4.1 330 1.9 0 2.3 0.6 0 0.1 0 0 2.9 225 0.9 Nov 0.1 0.2 0.4 320 0.2 0 0.8 0.1 0 0 0 0 0.9 179 0.2 Dec 0 0 0 504 0 0 0.2 0 0 0.1 0 0.2 0.2 483 0.2

Reclamation Draft Compliance Monitoring and Evaluation Plan
35
Table 11: Example Calculation of 2008 CVP “Excess” Loads Grassland Subarea Northwest Subarea Total
San
Joaq
uin
Riv
er a
nd
Men
dota
Poo
l Del
iver
ies
from
CV
P, lo
ad in
tons
Del
ta- M
endo
ta C
anal
D
eliv
erie
s fro
m C
VP,
load
in
tons
San
Luis
and
Cro
ss V
alle
y C
anal
Del
iver
ies f
rom
CV
P,
load
in to
ns
Tota
l Flo
w, T
AF
Bac
kgro
und
Allo
wan
ce L
oad,
to
ns
Exce
ss L
oad,
tons
San
Joaq
uin
Riv
er a
nd
Men
dota
Poo
l Del
iver
ies
from
CV
P, lo
ad in
tons
Del
ta- M
endo
ta C
anal
D
eliv
erie
s fro
m C
VP,
load
in
tons
Tota
l Flo
w, T
AF
Bac
kgro
und
Allo
wan
ce L
oad,
to
ns
Exce
ss L
oad,
tons
Tota
l Exc
ess L
oad
from
CV
P D
eliv
erie
s, to
ns
September to March Standard, 1000 μS/cm Jan 7,788 1,369 645 16.2 1,148 8,654 56 26 0.1 10 72 8,727 Feb 21,264 4,079 2,780 55.4 3,912 24,212 1,274 271 3.0 212 1,333 25,544 Mar 34,925 7,075 5,179 88.0 6,215 40,963 3,377 2,069 9.5 675 4,772 45,735 April to August Standard, 700 μS/cm Beg Apr 17,216 3,469 3,838 54.3 3,836 20,686 1,273 2,289 7.4 526 3,036 23,722 VAMP 34,851 11,921 169 98.3 6,946 39,995 3,055 2,913 14.1 993 4,975 44,969 End May 10,525 3,895 2,035 37.1 2,624 13,831 961 1,034 4.4 314 1,681 15,512 Jun 40,534 12,611 7,349 127.7 9,024 51,470 3,218 3,521 14.2 1,000 5,739 57,209 Jul 36,140 10,483 5,703 148.9 10,523 41,803 3,193 2,622 16.7 1,180 4,635 46,439 Aug 38,398 13,224 4,236 128.3 9,065 46,793 3,150 3,555 15.2 1,074 5,631 52,425 September to March Standard, 1000 μS/cm Sep 38,667 21,317 2,922 123.1 8,702 54,204 2,194 2,748 9.8 693 4,249 58,453 Oct 24,866 12,953 2,753 92.1 6,506 34,067 1,852 874 7.0 493 2,233 36,299 Nov 11,178 5,568 1,833 40.0 2,826 15,753 167 215 1.3 89 293 16,046 Dec 628 3,998 433 7.9 558 4,501 0 158 0.2 17 141 4,642

Reclamation Draft Compliance Monitoring and Evaluation Plan
36
E. Future Actions Reclamation is currently involved in several planning studies and long-term projects that would have potential benefits in improving the water quality of the San Joaquin River Basin. Although the studies are underway, the potential outcome of these studies and projects may not be known for some time. Projects include, but are not limited to, the following:
• Delta-Mendota Canal Recirculation • New Melones Revised Plan of Operations • Flow and Water Quality Data Collection • San Luis Unit Drainage Features Re-Evaluation • South Delta Improvements Project (SDIP) • Franks Tract Project (formerly the Flooded Islands Study) • Delta Habitat Conservation and Conveyance Program • San Joaquin River Restoration Program • Upper San Joaquin River Basin Storage Studies
Both Reclamation and the Board have agreed to revise the MAA when any of the above actions are implemented. For example, federal legislation authorizing the San Joaquin River Restoration Settlement Act was recently enacted and should result in spring and fall water releases from Millerton Dam beginning in the fall. It is unknown at this time what amount of that water will be conveyed to the lower San Joaquin River. Reclamation will document the methodology of any new quantification, such as dilution flows for salinity, when enough information becomes available. Reclamation will report on potential and expected salinity benefits from these projects. Otherwise, Reclamation will report on document availability.
F. Vernalis Water Quality Description: The Water Quality Objective (WQO) that the Basin Plan Amendment addresses is Salinity and Boron at Vernalis, in the lower San Joaquin River. The boron objectives are considered met if the salinity objectives are met. The WQOs are split into two separate seasonal objectives: 1000 μS/cm EC from September 1 to March 31 and 700 μS/cm EC from April 1 to August 31.
Quantification Methodology: Because the goal of the Basin Plan is to achieve these objectives, each quarterly report will include a section with tabular and graphical representations of this outcome. Vernalis water quality will be downloaded from the CDEC water data base at http://cdec.water.ca.gov for both VER (a Reclamation monitoring station) and SJR (a new Department of Water Resources (DWR) monitoring station). Two years ago, Reclamation moved its Vernalis sampling station to a location within 15 feet of the new DWR monitoring station. Data will be downloaded from CDEC as daily values, and a thirty day average will be calculated beginning with the 29 days prior to the start of the reporting period.

Reclamation Draft Compliance Monitoring and Evaluation Plan
37
Data and QA/QC: Reclamation data will be used in preference to calculate mean monthly averages and a running thirty day average over the reporting period. Reclamation’s water quality monitoring device is placed directly in the San Joaquin River, while DWR’s sampling station withdraws water from the River into its sampling station. Reclamation maintains the Hydrolab MS5 sonde every two months according to the procedure outlined in Appendix A, calibrating from 0- 2000 according to manufacture's procedure.
Example: The running thirty-day average salinity for 2008 was calculated using this methodology and is presented in Figure 49. The monthly mean EC10 for 2008 is presented in Table 12. Both 2007 and 2008 were classified as critical years for the San Joaquin River.
Table 12: 2008 Monthly mean EC at Vernalis, μS/cm Reclamation Station DWR Station September to March Standard, 1000 μS/cm Jan 686Feb 750Mar 847 856April to August Standard, 700 μS/cm beg Apr 550 548VAMP 308 313end May 509 551Jun 669 710Jul 611 630Aug 600 617September to March Standard, 1000 μS/cm Sep 687 713Oct 600 617Nov 763 755Dec 870 887
9 Footnote 2 to Table 2 of Water Rights Decision 1641 (revised) states “Determination of compliance with an objective expressed as a running average begins on the last day of the averaging period. The averaging period commences with the first day of the time period for the applicable objective. If the objective is not met on the last day of the averaging period, all days in the averaging period are considered out of compliance.” 10 Note, the monthly mean EC is mathematically closest to the last day of the running 30 day average EC.

Reclamation Draft Compliance Monitoring and Evaluation Plan
38
Figure 6: 2008 Vernalis Water Quality
0
200
400
600
800
1000
1200
N D J F M A M J J J A S O N D J F M
Month
EC, μ
S/cm
30-day Average VER30-day Average SJRVernalis WQO
Recirculation Pilot July - Sept
G. Reporting Requirements In the MAA, Reclamation agreed to provide quarterly reports to the Regional Board. The first quarter 2009 report is attached as Appendix C. Reclamation will consult with the Regional Board before proposing any changes to the sample report format. Quarterly reports are due 45 days after the end of the calendar quarter:
Table 13: Reporting Milestones End of calendar quarter Due date of Quarterly report
December 31, 2008 February 13, 2009 March 31, 2009 May 15, 2009 June 30, 2009 August 14, 2009 September 30, 2009 November 13, 2010 December 31, 2009 February 12, 2010 March 31, 2010 May 14, 2010 June 30, 2010 August 13, 2010 September 30, 2010 November 12, 2010 December 31, 2010 February 14, 2011
Reclamation also agreed to prepare an annual report on compliance, due by July 1, 2010. The annual report will follow the same format as used in the Draft Plan.
H. Funding Reporting In the MAA, Reclamation agreed to seek additional funding, including grant funding, to support salinity control efforts. Reclamation is operated on a three year budget cycle. Budget is requested two years in advance, and not all annual

Reclamation Draft Compliance Monitoring and Evaluation Plan
39
budgets are spent within a year but rather obligated to a specific contract or grant. Reclamation will report its funding based on the official report provided from the Office of Management and Budget. Activities for which Reclamation has requested funding will also be reported. Fiscal years run from October 1 to September 30 (similar to the water year). In its quarterly reports, Reclamation will report on other efforts to support the securing of additional funding.
I. Monitoring Program To support the actions described in this Draft Plan and to support evaluation of salinity loads, Reclamation will work with the Regional Board to develop a monitoring program. As a first step, Reclamation has identified existing monitoring data to support its evaluations of baseline, reductions, and offsets. Table 14 lists the existing monitoring sites used in the Draft Plan.

Reclamation Draft Compliance Monitoring and Evaluation Plan
40
Table 14: Monitoring Locations used in Draft Plan Symbol (Sensor) Description Parameter Operator Frequency Website Reservoir Operations Reports (Goodwin)
River Spills from Goodwin Reservoir
Flow, cfs Reclamation Daily http://www.usbr.gov/mp/cvo/reports.html
Supplemental Water Contributions
Flows provided under the VAMP Agreement from Merced and Tuolumne Rivers
Flow, cfs San Joaquin River Group
Daily www.sjrg.org/technicalreport
Newman Wasteway Recirculation
Recirculation Flows (Newman Wasteway MP 6.88)
Deliveries, AF SLDMWA Water Master and Reclamation CVO
Monthly (based on daily)
http://www.usbr.gov/mp/cvo/deliv.html
Monthly Water Deliveries
DMC, Cross Valley Canal, San Luis Canal, Delta- Mendota Pool, and San Joaquin River
Deliveries, AF SLDMWA Water Master and Reclamation CVO
Monthly http://www.usbr.gov/mp/cvo/deliv.html
VNS San Joaquin River at Vernalis Flow, cfs USGS and DWR Hourly/Daily http://cdec.water.ca.gov/ USGS 11290000 Tuolumne River at Modesto Discharge, cfs USGS Continuous http://waterdata.usgs.gov/nwis USGS 11303000 Stanislaus River Near Ripon Discharge, cfs USGS Continuous http://waterdata.usgs.gov/nwis USGS 11262900 Mud Slough (N) near Gustine Discharge, cfs USGS Continuous http://waterdata.usgs.gov/nwis USGS 11261100 Salt Slough at Hwy 165 near
Stevinson Discharge, cfs USGS Continuous http://waterdata.usgs.gov/nwis
USGS 11272500 Merced River near Stevinson Discharge, cfs USGS Continuous http://waterdata.usgs.gov/nwis DWR B05125 (MST) Merced River near Stevinson Discharge, cfs DWR Continuous http://waterdata.usgs.gov/nwis USGS 11303500 SJR at Vernalis Discharge, cfs USGS Continuous http://waterdata.usgs.gov/nwis RPN (100) Stanislaus River at Ripon ΕC, μS/cm Reclamation Hourly/Event http://cdec.water.ca.gov/ MST (100) Merced River at Stevinson ΕC, μS/cm DWR Hourly http://cdec.water.ca.gov/ MOD (100) Tuolumne River at Modesto ΕC, μS/cm DWR Hourly http://cdec.water.ca.gov/ NWDS Newman Wasteway MP 8.16 ΕC, μS/cm Reclamation Continuous
during study http://www.usbr.gov/mp/dmcrecirc/index.html Not yet released to public.
Grassland Bypass Project Station B2
Terminus of the San Luis Drain Flow, cfs ΕC, μS/cm
SLDMWA Daily (EC also continuous)
http://www.sfei.org/grassland/reports/index.htm
DMC Check 13 In DMC, immediately downstream of O’Neill Forebay
EC, μS/cm Reclamation Continuous http://www.usbr.gov/mp/cvo/wqrpt.html
DMC Check 21 Entrance to Mendota Pool EC, μS/cm Reclamation Continuous http://www.usbr.gov/mp/cvo/wqrpt.html VER San Joaquin River at Vernalis EC, μS/cm Reclamation Continuous http://cdec.water.ca.gov/ SJR San Joaquin River at Vernalis EC, μS/cm DWR Continuous http://cdec.water.ca.gov/

Reclamation Draft Compliance Monitoring and Evaluation Plan
41
J. Offset Program Reclamation proposes to continue to work with the Regional Water Board and stakeholders to develop representative and acceptable accounting of excess loads, offsets, credits, and trading of loads. Section K of the Draft Plan is an initial proposal for additional stakeholder meetings. Sections A through C of the Draft Plan quantified, where possible, the potential sources of offsets or credits. Table 15 combines these individual calculations with the DMC load calculations and Vernalis salinity.
Table 15: Calculated Loads and Assimilative Capacity of Individual Draft Plan Elements, tons of salt DMC
Excess Load
A-1: New Melones
A-2: WAP
A-4: Recirc-ulation
B-3: WRDP
C-2: RTMP Capacity
Vernalis average Salinity, μS/cm
September to March Standard, 1000 μS/cm Jan 8,727 4,310 0 3,300 19,373 686Feb 25,544 2,900 0 8,900 11,243 750Mar 45,735 8,342 0 17,200 334 847April to August Standard, 700 μS/cm Beg Apr 23,722 9,775 13,017 3,267 550VAMP 44,969 11,784 19,704 22,107 46,268 308End May 15,512 2,550 0 2,343 509Jun 57,209 5,401 0 33,300 -4,245 669Jul 46,439 5,220 0 24,628 -734 611Aug 52,425 3,968 0 3,901 31,800 -204 600September to March Standard, 1000 μS/cm Sep 58,453 3,252 0 2,763 27,500 6,554 687Oct 36,299 5,819 5,770 23,700 12,996 600Nov 16,046 4,215 0 12,539 4,727 763Dec 4,642 4,150 0 5,292 -1,233 870
In the course of developing this information, Reclamation has identified three issues warranting further exploration as the implementation of the Basin Plan proceeds:
1. There is a time lag between delivery of DMC supplies to the Northwest and Grassland subareas and discharges to the San Joaquin River. This time lag varies by the activity using the water supply and the interaction with groundwater (groundwater is not dynamically addressed in the Basin Plan). In this Draft Plan, the time lag is not addressed but it could be important in the way in which Reclamation meets this regulation versus the D1641 requirement to provide flow to meet the Vernalis salinity objective.

Reclamation Draft Compliance Monitoring and Evaluation Plan
42
2. In order to determine benefits from the WRDP, an accounting method is needed to determine the avoided discharge loads.
3. In consideration of the future implementation of the Basin Plan, Reclamation believes it is important that any offsets or credits generated by Reclamation activities not harm the ability of a subarea to meet its TMDL obligations. Also, in these calculations, some dilution flows provided by Reclamation are currently being used by subareas to provide assimilative capacity.
Within the MAA is a goal for Reclamation to offset or reduce DMC excess loads by 25 percent by July 2010. Table16 presents the information from Table 15 in the form of percentages that potential offsets offset excess loads from the DMC. Figure 7 displays this information graphically.
Table 16: Percent Plan Actions Offset CVP Supply Imports, tons A-1:
New Melones
A-2: WAP
A-4: Recirc-ulation
B-3: WRDP
C-2: RTMP Capacity
Sum of Plan Actions
Salinity at Vernalis μS/cm
September to March Standard, 1000 μS/cm Jan 49% 38% >100% 87% 681Feb 11% 35% 44% 46% 750Mar 18% 38% 1% 56% 847April to August Standard, 700 μS/cm beg Apr 41% 67% 14% >100% 550VAMP 26% 44% 54% >100% >100% 308end May 16% 0% 15% 16% 509Jun 9% 58% 0% 68% 669Jul 11% 70% 0% 81% 611Aug 8% 7% 61% 0% 76% 600September to March Standard, 1000 μS/cm Sep 6% 5% 47% 11% 57% 687Oct 16% 16% 65% 36% 97% 600Nov 26% 81% 29% >100% 763Dec 89% >100% 0% >100% 870
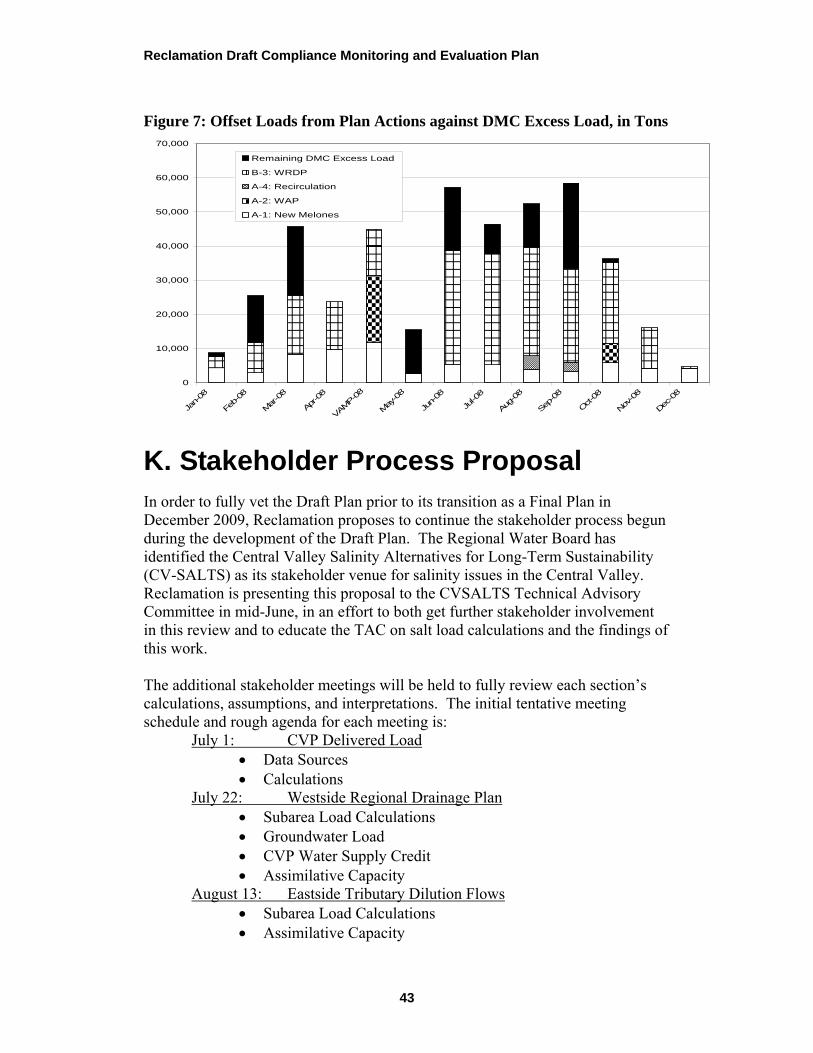
Reclamation Draft Compliance Monitoring and Evaluation Plan
43
Figure 7: Offset Loads from Plan Actions against DMC Excess Load, in Tons
0
10,000
20,000
30,000
40,000
50,000
60,000
70,000
Jan-08
Feb-08
Mar-08
Apr-0
8
VAMP-
08
May
-08
Jun-08
Jul-0
8
Aug-08
Sep-08
Oct-08
Nov-08
Dec-08
Remaining DMC Excess Load
B-3: WRDP
A-4: Recirculation
A-2: WAP
A-1: New Melones
K. Stakeholder Process Proposal In order to fully vet the Draft Plan prior to its transition as a Final Plan in December 2009, Reclamation proposes to continue the stakeholder process begun during the development of the Draft Plan. The Regional Water Board has identified the Central Valley Salinity Alternatives for Long-Term Sustainability (CV-SALTS) as its stakeholder venue for salinity issues in the Central Valley. Reclamation is presenting this proposal to the CVSALTS Technical Advisory Committee in mid-June, in an effort to both get further stakeholder involvement in this review and to educate the TAC on salt load calculations and the findings of this work. The additional stakeholder meetings will be held to fully review each section’s calculations, assumptions, and interpretations. The initial tentative meeting schedule and rough agenda for each meeting is: July 1: CVP Delivered Load
• Data Sources • Calculations
July 22: Westside Regional Drainage Plan • Subarea Load Calculations • Groundwater Load • CVP Water Supply Credit • Assimilative Capacity
August 13: Eastside Tributary Dilution Flows • Subarea Load Calculations • Assimilative Capacity

Reclamation Draft Compliance Monitoring and Evaluation Plan
44
September 2: Unquantified Subareas • Data Availability • Subarea load quantification
September 23: Real-Time Management Program • Status of Efforts • Assimilative Capacity • Potential Uses
October 21: Offsets, Credits, Tradings • Application of Potential Offsets, Credits to CVP-Delivered
Loads
Each of the stakeholder meetings will focus on desired outcomes, such as verification of the interpretation of the TMDL by Reclamation and reaching consensus on defining assimilative capacity. Results of these meetings will be reported in the Quarterly Reports and reflected in the Final Compliance Evaluation and Monitoring Plan. To the extent possible, meetings will be coordinate with the CVSALTS TAC. If permitted, Reclamation will use the CV Salinity Coalition website to advertise stakeholder meetings and post pre- and post-meeting material.

Reclamation Draft Compliance Monitoring and Evaluation Plan Appendix A
A-1
Appendix A: Sonde Multiprobe (Yellow Springs Instruments) – Operation and Calibration USBR, Branch of Environmental Monitoring (MP-157) SOP #_____
SUMMARY This SOP describes operation and calibration procedures for the Yellow Springs Instruments (YSI) 600XL and 6600 Sonde multiprobes.
REAGENTS 1. Electrical conductivity standard solution – 1,000 µS/cm 2. pH standard solution – 7.0 (yellow) 3. pH standard solution – 10.0 (blue) 4. Turbidity standard solution – 0.0 NTU 5. Turbidity standard solution – 123 NTU or 11.2 NTU 6. Deionized (DI) water
EQUIPMENT 1. Sonde multiprobe 2. Field cable 3. MDS 650 display/data logger 4. Four Size “C” alkaline batteries
(6600 Sonde only)
PROCEDURE - OPERATION 1. Before operating the instrument, calibrate it as described below. 2. If needed, attach the Sonde to the data display unit with the field cable. 3. Cover the probes with the perforated probe guard and submerge the probe end of the unit
about a foot under the surface of the water to be measured. Alternately, attach the clear plastic calibration cup (cal cup) and pour environmental water into the cup until the
6600 Sonde
Sonde Probes (clockwise) DO Turbidity pH EC and Temperature Chlorophyll

Reclamation Draft Compliance Monitoring and Evaluation Plan Appendix A
A-2
probes are completely covered. Discard this water and repeat twice more before filling a final time.
4. To turn the on the display unit, press the green button (upper left). Use the up/down arrow key to select “Run” from the file menu. When selected, press “Enter” (←).
5. Wait for readings to stabilize: this should take less than a minute. If readings don’t settle (and you are not taking measurements directly from the source), try holding the Sonde around the cal cup – this should stabilize the temperature and EC readings.
6. Record physical measurements in the Field Log Book (SOP#____) and on the Field Sheet (SOP #____).
7. When finished, turn the unit off by pressing the green button. 8. If making measurements over an extended time period, verify the instrument calibration
every 8 hours. If measuring less than 8 hours, verification is not needed. Document the instrument verification on the Instrument Calibration Sheet.
GENERAL PROCEDURE – CALIBRATION AND CALIBRATION VERIFICATION 1. Before sampling, verify the instrument calibration for each physical constituent to be
measured. If the calibration cannot be verified, the instrument must be recalibrated for that measurement. Since some calibrations are interdependent, perform verifications and calibrations in the following order:
Specific conductance (EC) pH Dissolved oxygen (DO) Turbidity Depth Oxidation/reduction potential (ORP)
2. Attempt to verify the calibration. 3. If the calibration cannot be verified, calibrate as described for each measurement (below). 4. Document the verification and/or calibration on an “Instrument Calibration Sheet” (see
SOP#____).
Conductivity (EC) 1. EC calibration is easy to do, so recalibrate even if the old calibration can be verified. 2. Pre-rinse the cal cup and sensors with a small amount of the 1.0 mS/cm (1,000 µS/cm)
calibration standard and discard. Repeat. If 1,000 µS/cm standard is not available, it is OK to calibrate with standard ≥1.0 mS/cm.
3. Fill the cal cup with standard ensuring that the conductivity probe is completely submerged. The hole in the side of the probe must be under the surface of the solution and not have any trapped bubbles in the side opening.
4. Scroll to “Sonde Menu” and press “Enter” 5. Scroll to “Calibrate” press “Enter” 6. Scroll to “Spec. Cond” and press “Enter” 7. Type in “1” (if using 1,000 µS/cm standard) and press “Enter”. The sonde requires the
input in milli-siemens. 8. If the sonde should report “Out Of Range”, investigate the cause. Never override a
calibration error message. This error message can result from: 1) low fluid level, 2) air bubbles in the probe cell, and/or 3) an incorrect entry. For example, entering 1000 (for microsiemens) instead of 1.0 (for millisiemens) will result in an Out of Range error.
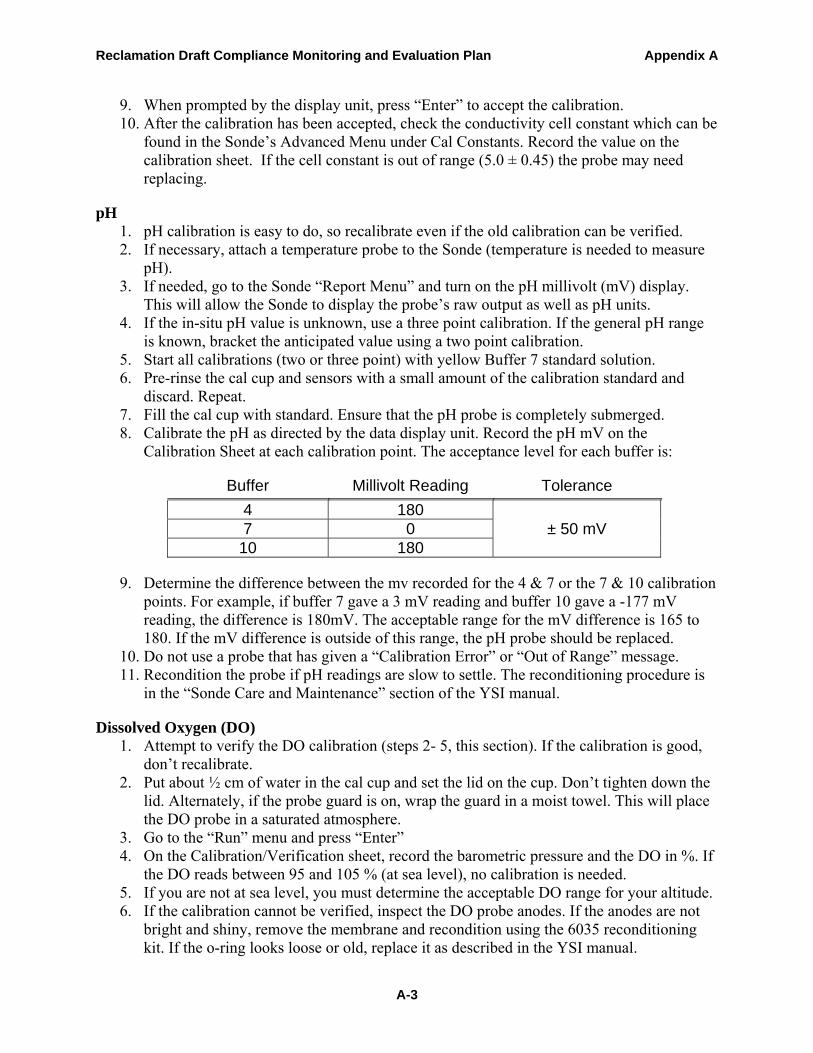
Reclamation Draft Compliance Monitoring and Evaluation Plan Appendix A
A-3
9. When prompted by the display unit, press “Enter” to accept the calibration. 10. After the calibration has been accepted, check the conductivity cell constant which can be
found in the Sonde’s Advanced Menu under Cal Constants. Record the value on the calibration sheet. If the cell constant is out of range (5.0 ± 0.45) the probe may need replacing.
pH 1. pH calibration is easy to do, so recalibrate even if the old calibration can be verified. 2. If necessary, attach a temperature probe to the Sonde (temperature is needed to measure
pH). 3. If needed, go to the Sonde “Report Menu” and turn on the pH millivolt (mV) display.
This will allow the Sonde to display the probe’s raw output as well as pH units. 4. If the in-situ pH value is unknown, use a three point calibration. If the general pH range
is known, bracket the anticipated value using a two point calibration. 5. Start all calibrations (two or three point) with yellow Buffer 7 standard solution. 6. Pre-rinse the cal cup and sensors with a small amount of the calibration standard and
discard. Repeat. 7. Fill the cal cup with standard. Ensure that the pH probe is completely submerged. 8. Calibrate the pH as directed by the data display unit. Record the pH mV on the
Calibration Sheet at each calibration point. The acceptance level for each buffer is:
Buffer Millivolt Reading Tolerance 4 180 7 0 ± 50 mV 10 180
9. Determine the difference between the mv recorded for the 4 & 7 or the 7 & 10 calibration points. For example, if buffer 7 gave a 3 mV reading and buffer 10 gave a -177 mV reading, the difference is 180mV. The acceptable range for the mV difference is 165 to 180. If the mV difference is outside of this range, the pH probe should be replaced.
10. Do not use a probe that has given a “Calibration Error” or “Out of Range” message. 11. Recondition the probe if pH readings are slow to settle. The reconditioning procedure is
in the “Sonde Care and Maintenance” section of the YSI manual.
Dissolved Oxygen (DO) 1. Attempt to verify the DO calibration (steps 2- 5, this section). If the calibration is good,
don’t recalibrate. 2. Put about ½ cm of water in the cal cup and set the lid on the cup. Don’t tighten down the
lid. Alternately, if the probe guard is on, wrap the guard in a moist towel. This will place the DO probe in a saturated atmosphere.
3. Go to the “Run” menu and press “Enter” 4. On the Calibration/Verification sheet, record the barometric pressure and the DO in %. If
the DO reads between 95 and 105 % (at sea level), no calibration is needed. 5. If you are not at sea level, you must determine the acceptable DO range for your altitude. 6. If the calibration cannot be verified, inspect the DO probe anodes. If the anodes are not
bright and shiny, remove the membrane and recondition using the 6035 reconditioning kit. If the o-ring looks loose or old, replace it as described in the YSI manual.

Reclamation Draft Compliance Monitoring and Evaluation Plan Appendix A
A-4
7. After replacing the membrane, allow the Sonde to run for 10 minutes. Check the DO Charge after about 5 minutes, it should read between 25 and 75.
8. After the 10 minute “burn-in”, go to the Advanced Menu and confirm that the RS-232 auto sleep function is enabled. If the Sonde is to be connected to an SDI-12 data logger then the SDI-12 auto sleep must be enabled as well. After turning on auto sleep, wait one minute before proceeding.
9. Start the probe in the Discrete Run mode at a 4 second rate and record the first 10 DO% numbers on paper, the numbers must start at a high number and drop with each four second sample, example: 110, 105, 102, 101.5, 101.1, 101.0, 100.8, 100.4, 100.3, 100.1. It does not matter if the numbers do not reach 100%, it is only important that they have the same high to low trend. If you have a probe that starts at a low number and steadily climbs upward then the sensor has a problem and it must not be used. Note: Initial power up can make the first two DO% samples read low, the first two samples can be disregarded.
10. A new membrane will be slightly unstable for 3 to 6 hours after replacement so wait a few hours and then try again to verify your calibration.
11. If you still can’t verify the calibration, calibrate by setting “auto sleep” ON for unattended studies and OFF for discreet sampling.
12. Fill the calibration cup as in Step 2. Let the DO probe sit idle, not in “Run” mode, in this saturated environment for at least 10 minutes before beginning the DO calibration.
13. Calibrate the Sonde in DO%. 14. Enter the local barometric pressure in mm/hg. In Unattended mode (RS-232 Auto-Sleep
ON) the DO probe will be calibrated automatically once the barometric pressure is entered and the warm-up time counter counts down to zero.
15. For “Discrete” or “Sampling” modes, press the Enter Key when the DO readings are stable. Wait at least three minutes and press the enter key again to calibrate.
16. When the calibration is complete, go to the “Advanced” menu and then to “Cal Constants”. Record the DO gain on the Calibration Sheet. The gain should be between -0.7 and +1.4.
Turbidity (6600 only) Notes: The calibration of all YSI turbidity sensors must be done with either YSI distributed standards, Hach StablCal, Diluted Hach 4000 NTU formazin or standards that have been prepared according to instructions in Standard Methods (Section 2130B). Standards from other vendors are NOT approved, and their use will likely result in a bad calibration and incorrect field readings. Please refer to the turbidity calibration section of your manual for more information.
Calibrating turbidity is best done in a lab. It is better to post-calibrate an optical probe back in the lab than to attempt a field calibration, especially if you are working out of a small boat or in less than clean conditions.
Never override a calibration error message without fully understanding the cause of the problem. Calibration errors messages usually indicate that problems exist that will result in incorrect field readings.
1. Before calibrating or verifying calibration, confirm that 1) the wiper on the turbidity probe is parking approximately 180 degrees opposite of the optics, 2) the wiper reverses

Reclamation Draft Compliance Monitoring and Evaluation Plan Appendix A
A-5
direction during the wipe cycle, 3) the probe output increases when a finger is placed in front of the optics, 4) all submerged parts of the sonde and wipers are clean and 5) the optics are clean and clear of fingerprints.
2. Remove the EDS wiper and replace it with a clean standard (no brush) wiper. 3. Start with the zero (0) NTU standard. Pour the 0 NTU standard into the calibration cup –
pour down the side to avoid aerating the sample. Set the Sonde on top of the calibration cup, do not engage the threads. Verify that there are no air bubbles on the probe face.
4. Run the wiper at least once before accepting the first point. To accept the point, press “Enter”.
5. Calibrate the second point with 123 NTU standard (for the 6136 sensor). Wipe the probe at least once, then press “Enter”.
Depth Note: To calibrate, the depth sensor module must be in air and the sensor channel must be free of dirt. If the channel needs cleaning, use a syringe to flush water through it.
1. From the Calibration menu, select Pressure-Abs or Pressure-Gage (depending if you have a vented level sensor).
2. Input 0.00 or some known offset in feet. Press Enter and monitor the stabilization of the depth readings with time.
3. When no significant change occurs for approximately 30 seconds, press Enter to confirm calibration. This zeros the sensor with regard to current barometric pressure. Then press Enter again to return to the Calibration menu.
4. Go to the “Advanced” menu and then to “Cal Constants” and record the pressure offset on the Calibration Sheet.
CALIBRATION CHART
Temperature Celsius Zobell Solution Value, mV -5 270.0 0 263.5 5 257.0 10 250.5 15 244.0 20 237.5 25 231.0 30 224.5 35 218.0 40 211.5 45 205.0 50 198.5
EMPLOYEE SAFETY 1. Handle standards with care; do not ingest.
POLLUTION PREVENTION AND WASTE MANAGEMENT 1. Place used batteries in recycle bin at the 112 lab. Tape battery ends before binning them.

Reclamation Draft Compliance Monitoring and Evaluation Plan Appendix B
B-1
Appendix B: 2008 CVO Water Delivery Tables 24, 25, and 26 The following are the water delivery tables from calendar year 2008. Names highlighted in red are used in the Grassland SubArea calculations. Names highlighted in blue are used in the Northwest SubArea calculations. Names highlighted in purple are used in both SubArea calculations.

Reclamation Draft Compliance Monitoring and Evaluation Plan Appendix B
B-2
Table 24 U.S. Department of Interior - Bureau of Reclamation Central Valley Operations Office San Joaquin and Mendota Pool Monthly Deliveries in AF 2008 Water User Jan Feb Mar Apr May Jun Jul Aug Sep Oct Nov Dec Total Fresno Slough WD 0 18 80 97 437 156 276 54 0 0 0 0 1118 Tranquility Public Utilitie 0 0 13 0 0 27 33 29 0 0 0 0 102 James ID 28 4515 487 612 2459 5418 3747 1945 936 224 84 0 20455 Meyers (SLWD) 619 1216 1242 583 147 113 256 825 987 61 226 0 6275 Dudley & Indart (formerly C 15 159 117 176 165 220 217 225 39 63 1 0 1397 Mid-Valley WD (no contract) 0 0 0 0 0 0 0 0 0 0 0 0 0 Reclamation District #1606 0 14 51 52 118 134 73 11 0 0 0 0 453 Terra Linda Farms (Coelho F 284 585 746 758 1066 1473 1533 1053 470 245 55 0 8268 Tranquility ID 0 2197 2631 2565 4585 6372 6372 2943 1082 365 500 0 29612 Westlands WD (Lateral 6 & 7 0 0 0 0 0 84 316 84 363 0 0 0 847 Wilson, JW (no contract) 0 82 107 0 0 208 233 272 76 0 0 0 978 Laguna WD (via CCID) 0 0 0 0 0 0 0 0 0 0 0 0 0 San Luis WD (via CCID) 0 82 20 0 50 40 45 37 0 0 0 0 274 Total 946 8868 5494 4843 9027 14245 13101 7478 3953 958 866 0 69779 Exchange Contractors Central California ID (CCID 0 17424 44627 27615 54252 48941 64554 51418 29618 29935 1801 0 370185 Columbia Canal Co 0 1628 4975 5278 6701 7940 8735 8799 6420 3500 46 0 54022 Firebaugh Canal WD 426 3979 3902 5629 5221 6150 5431 5541 3259 2071 1665 916 44190 San Luis Canal Co (SLCC) 0 3913 11387 14426 14064 24935 27450 24210 6102 2000 2750 0 131237 Total 426 26944 64891 52948 80238 87966 106170 89968 45399 37506 6262 916 599634 Refuges Grasslands WD (via CCID & S 4892 4280 500 303 3410 897 146 400 19765 9649 10173 0 54415 China Island Unit (CDFG) (v 647 803 151 119 101 70 195 174 1046 884 1008 0 5198 Los Banos WMA (CDFG) (via C 1759 944 341 233 272 99 144 518 3218 4590 2447 0 14565 Mendota Wildlife Area (CDFG 556 1149 1479 1317 1776 1864 2817 1338 5259 5863 2678 693 26789 Salt Slough Unit (CDFG) (vi 835 605 173 144 220 122 134 151 1381 1577 1208 0 6550 Freitas Unit (USFWS) (via C 1069 1106 256 181 173 89 0 0 968 1865 1396 0 7103 Kesterson (USFWS) (via CCID 0 662 197 108 108 22 0 0 0 0 1164 0 2261 San Luis NWR (USFWS) (via S 3708 9295 1749 0 2840 0 0 0 5822 4136 2994 0 30544 0 Total 13466 18844 4846 2405 8900 3163 3436 2581 37459 28564 23068 693 147425 Total Deliveries 14838 54656 75231 60196 98165 105374 122707 100027 86811 67028 30196 1609 816838 * Delivery data is based on District turn-out readings and may include water in addition to water service contract deliveries.

Reclamation Draft Compliance Monitoring and Evaluation Plan Appendix B
B-3
Table 25 U. S. Department of Interior - Bureau of Reclamation Central Valley Operations Office Delta-Mendota Canal Monthly Deliveries in AF 2008 Water User Jan Feb Mar Apr May Jun Jul Aug Sep Oct Nov Dec Total Tracy, City of 277 0 0 415 736 942 1,045 1,003 903 849 472 349 6,991 Byron Bethany ID (formerly P 13 9 52 455 621 564 510 423 350 241 46 21 3,305 West Side ID 0 0 0 402 263 255 371 43 0 0 0 0 1,334 Banta Carbona ID 0 0 0 431 222 133 727 473 0 1 0 0 1,987 West Stanislaus ID 0 41 766 2,884 2,028 2,934 3,584 3,917 1,610 0 0 0 17,764 Patterson WD 11 400 35 210 602 910 1,000 1,010 1,458 567 72 0 6,275 Del Puerto WD 44 199 4,484 8,506 9,448 8,503 8,893 9,228 5,389 2,907 1,030 305 58,936 San Luis WD - Ag 0 238 717 597 566 863 1,273 747 359 172 30 60 5,622 San Luis WD - M&I 1 1 2 16 19 23 19 1 33 14 6 1 136 Panoche WD - Ag 65 112 956 655 845 869 768 663 209 107 181 62 5,492 Panoche WD - M&I 2 2 2 2 2 2 2 2 2 2 2 2 24 Eagle Field WD 31 0 0 0 1 0 13 72 1 1 0 0 119 Oro Loma WD 0 56 0 0 10 22 17 28 0 0 0 0 133 Mercy Springs WD 0 0 92 108 194 95 162 71 155 207 1 18 1,103 Newman Wasteway Recirculatio 0 0 0 0 0 0 1,065 13,439 7,089 0 0 0 21,593 DWR Intertie @MP7.70-R 0 0 0 0 0 0 0 0 0 0 0 0 0 Total 444 1,058 7,106 14,681 15,557 16,115 19,449 31,120 17,558 5,068 1,840 818 130,814 Exchange Contractors Central California ID (Abv C 0 32 1,209 1,642 2,358 2,121 1,855 2,156 1,577 949 321 781 15,001 Central California ID (Blw C 407 971 8,821 7,146 12,240 19,949 27,083 26,621 456 183 100 0 103,977 Firebaugh Canal Co 129 248 353 405 1,955 2,483 3,916 1,992 62 0 61 6 11,610 Total 536 1,251 10,383 9,193 16,553 24,553 32,854 30,769 2,095 1,132 482 787 130,588 Refuges China Island Unit (CDFG) (76 0 0 452 357 302 212 585 524 0 0 0 1,176 3,608 Los Banos WMA (CDFG) (76.05 0 0 485 698 818 296 432 720 0 0 0 837 4,286 Salt Slough Unit (CDFG) (76. 0 0 519 432 659 366 401 453 0 0 0 915 3,745 Volta WMA (CDFG) (Volta Wast 156 421 0 62 370 260 25 1,911 2,588 2,756 1,516 183 10,248 Grasslands WD (76.05 & CCID) 1,051 5,990 1,500 910 8,857 2,691 438 1,199 21,551 12,744 7,617 500 65,048 Grasslands WD (Volta Wastewa 10 748 0 360 3,740 980 0 283 17,003 11,759 1,014 312 36,209 Kesterson Unit (USFWS) (76.0 0 0 591 324 324 66 0 0 0 0 0 828 2,133 Kesterson Unit (USFWS) (Volt 616 0 0 0 0 0 0 0 942 1,523 0 0 3,081 Frietas Unit (USFWS) (76.05 0 0 767 542 518 267 0 0 0 0 0 886 2,980 Total 1,833 7,159 4,314 3,685 15,588 5,138 1,881 5,090 42,084 28,782 10,147 5,637 131,338

Reclamation Draft Compliance Monitoring and Evaluation Plan Appendix B
B-4
Table 26 U. S. Department of Interior - Bureau of Reclamation Central Valley Operations Office San Luis and Cross Valley Canals 2008 Monthly Deliveries in AF Water User Jan Feb Mar Apr May Jun Jul Aug Sep Oct Nov Dec Total SAN LUIS CANAL City of Avenal 194 191 213 202 193 169 169 171 133 252 202 173 2262 City of Coalinga 324 310 369 537 626 671 796 715 672 648 381 432 6481 City of Dos Palos 130 107 109 123 149 172 182 174 143 115 75 36 1515 City of Huron 66 61 90 125 114 116 127 127 110 106 88 56 1186 Pacheco WD 1 1 237 1 1 765 1003 652 318 1 22 53 3055 Pacheco CCID Non-project (Hamburg) 96 772 1109 1494 1346 806 0 0 0 142 116 0 5881 Panoche WD 106 1224 3318 4872 5054 4883 4887 2106 1175 874 343 327 29169 San Luis WD 586 3467 5472 7150 9017 8930 10490 6827 3812 4712 2703 28 63194 Westlands WD 5588 23834 60024 76747 97166 81129 83558 61458 35231 25309 10161 5754 565959 Mendota WMA (CDFG) (via WWD Lateral 0 0 0 28 0 1 31 1 1 0 0 0 62 Mendota WMA (CDFG) (via WWD Lateral 0 0 0 0 0 0 0 0 0 0 0 0 0 Kern National Wildlife Refuge (USFW 489 2266 0 0 276 0 0 1562 3949 3640 4857 4154 21193 0 Total 7580 32233 70941 91279 113942 97642 101243 73793 45544 35799 18948 11013 699957 O'NEILL FOREBAY DELIVERIES Oneill Forebay Wildlife 138 31 0 0 14 147 79 108 140 148 84 100 989 San Luis WD Ag 38 274 675 666 834 759 1225 734 404 346 151 100 6206 San Luis M&I 41 42 92 93 153 168 81 113 107 81 53 33 1057 VA Cemetary 1 1 14 20 37 30 30 25 24 13 5 5 205 Total 218 348 781 779 1038 1104 1415 980 675 588 293 238 8457 CROSS VALLEY CANAL (See Note 1 below) County of Fresno 0 0 0 0 0 0 152 272 776 0 0 0 1200 County of Tulare 0 0 0 0 0 0 123 0 1072 928 0 0 2123 Lower Tule River ID 0 0 0 0 0 0 2026 3212 1998 1083 307 96 8722 Pixley ID 0 0 0 0 0 0 2027 3212 1997 1083 307 96 8722 Kern-Tulare WD 0 0 0 0 0 0 0 3541 12459 0 0 0 16000 Rag Gulch WD 0 0 0 0 0 0 0 249 5071 0 0 0 5320 Hills-Valey ID 0 0 0 0 0 0 169 309 860 0 0 0 1338 Tri-Valley ID 0 0 0 0 0 0 58 107 292 0 0 0 457 Total 0 0 0 0 0 0 4555 10902 24525 3094 614 192 43882 * Delivery data is based on District turn-out readings and may include water in addition to water service contract deliveries. Note 1: Cross Valley Canal section represents deliveries on behalf of the contractors listed, not necessarily what flows went into the Cross Valley Canal.

Reclamation Draft Compliance Monitoring and Evaluation Plan Appendix C
C-1
Appendix C: Sample Quarterly Report (4th Quarter 2008)

Reclamation Draft Compliance Monitoring and Evaluation Plan Appendix C
C-2
Quarterly Activity Report October 1 – December 31, 2008
In compliance with the “Management Agency Agreement between the Central Valley Regional Water Quality Control Board and the United States
Bureau of Reclamation” executed on December 22, 2008
February 15, 2009

Reclamation Draft Compliance Monitoring and Evaluation Plan Appendix C
C-3
Abbreviations and Acronyms Action Plan Actions to Address the Salinity and Boron
TMDL Issues for the Lower San Joaquin River
AF acre-foot or acre-feet Authority San Luis & Delta-Mendota Water
Authority Basin Plan Water Quality Control Plan for the
Sacramento and San Joaquin River Basins, 4th Edition
BMP Best Management Practices CALFED CALFED Bay-Delta Program CDEC California Data Exchange Center CDFG California Department of Fish and Game cfs cubic feet per second Corps U.S. Army Corps of Engineers CVO Central Valley Operations CVP Central Valley Project CVPIA Central Valley Project Improvement Act CVRWQCB Central Valley Regional Water Quality
Control Board CV-SALTS Central Valley Salinity Alternatives for
Long Term Sustainability DCRT Data Collection and Review Team DMC Delta-Mendota Canal DWR California Department of Water Resources EC electrical conductivity EIR Environmental Impact Report EIS Environmental Impact Statement Exchange Contractors San Joaquin River Exchange Contractors
Water Authority GBP Grassland Bypass Project GDA Grassland Drainage Area GRCD Grassland Resource Conservation District GUI graphical user interface ID irrigation district Interior U.S. Department of the Interior IPO Interim Plan of Operations

Reclamation Draft Compliance Monitoring and Evaluation Plan Appendix C
C-4
MAA Management Agency Agreement μS/cm micro Siemens per centimeter μg/L microgram(s) per liter mg/L milligram(s) per liter NPDES National Pollutant Discharge Elimination
System QA Quality Assurance QAPP Quality Assurance Project Plan QC Quality Control Reclamation Bureau of Reclamation RTMP Real Time Management Program Secretary Secretary of the Interior Service U.S. Fish and Wildlife Service SJR San Joaquin River SJRIP San Joaquin River Improvement Project SJRWQMG San Joaquin River Water Quality
Management Group SLDMWA San Luis and Delta Mendota Water
Authority SWP State Water Project SWRCB State Water Resources Control Board TAF thousand acre-feet TDS total dissolved solids TMDL total maximum daily load TPRT Technical Policy and Review Team VAMP Vernalis Adaptive Management Plan WAP Water Acquisition Program WCFSP Water Conservation Field Service
Program WDR Waste Discharge Requirement WQO water quality objective WRDP Westside Regional Drainage Plan YSI Yellow Spring Instrument

Reclamation Draft Compliance Evaluation and Monitoring Plan Appendix C
C-5
Purpose The Central Valley Regional Water Quality Control Board’s Salt and Boron Total Maximum Daily Load (TMDL) was approved and placed into effect on July 28, 2006. In response to the Salinity and Boron TMDL, the United States Bureau of Reclamation (Reclamation) developed a salinity control plan, Actions to Address the Salinity and Boron TMDL Issues for the Lower San Joaquin River (Action Plan) and entered into a Management Agency Agreement (MAA) with the Central Valley Regional Water Quality Control Board on December 22, 2009. The MAA describe the actions Reclamation will take to meet the obligations allocated to it by the Salinity and Boron TMDL for the lower San Joaquin River. The MAA states:
Reclamation will submit quarterly reports to the Regional Water Board by 45 days after the end of the calendar quarter. The quarterly reports will include a summary of activities conducted by Reclamation during the quarter in conjunction with each element included in their Action Plan, including activities related to developing a Real Time Management Program. In addition Reclamation will include data collected relevant to DMC load evaluation.
The “Quarterly Activity and Monitoring Report” summarizes the activities conducted by the Reclamation in conjunction with each element outlined in its salinity control plan for the lower San Joaquin River. The Action Plan describes Reclamation’s past, current and planned practices and procedures to mitigate and manage adverse impacts of salt and boron imported into the San Joaquin basin via the Delta Mendota Canal (DMC) in order to help achieve compliance with the objectives contained in the Regional Water Board’s Water Quality Control Plan for the Sacramento River and the San Joaquin River Basins – 4th Edition (Basin Plan). Organization of Quarterly Report The quarterly report will provide a synopsis of the various activities associated with each element identified in the Action Plan. The Action Plan describes all of the actions contemplated by the MAA. Within the Action Plan, actions are divided into three major categories: Flow, Salt Load Reduction, and Mitigation. For each action a brief description and list of activities are identified. The quarterly report will include calculations of salt loads based on DMC deliveries and calculations of assimilative capacity provided through dilution flows. The calculation methods used in this report are provisional and some elements in this report (such as the Westside Regional Drainage Plan) does not include estimations of benefits at this time. Reclamation is in the process of developing the Compliance Monitoring and Evaluation Plan which will outline the criteria and methodology for determining DMC loads and credits. A. Flow Actions Reclamation has agreed to provide mitigation and dilution flows to meet the Vernalis salinity and boron objectives. Historically, Reclamation has provided dilution flows from the New Melones Project and through purchases for the Vernalis Adaptive Management Plan. Flow actions include: dilution flows from New Melones and water acquisitions. 1. New Melones flows

Reclamation Draft Compliance Evaluation and Monitoring Plan Appendix C
C-6
Brief Description: In the Flood Control Act of October, 1962, the Congress reauthorized and expanded the New Melones project (P.L. 87-874) to a multipurpose unit to be built by the U.S. Army Corps of Engineers (Corps) and operated by the Secretary of Interior as part of the Central Valley Project (CVP), thus creating the New Melones Unit. The multipurpose objectives of the unit include flood control, irrigation, municipal and industrial water supply, power generation, fishery enhancement, water quality improvement, and recreation. New Melones Reservoir is currently operating under an "Interim Operating Agreement." This agreement was completed in 1996 with significant input from stakeholder interests.
Activity: • Working to develop a process to efficiently obtain the operations data on a
routine basis for future reports.
Month Volume of Releases (cfs) 11
Volume of Releases
(AF/month)
Volume of Releases
(TAF/month)
Monthly Average EC
(μS/cm)12
Assimilative Capacity (tons/month)
Oct-08 12453 24657 25 86 18690Nov-08 7573 14995 15 91 11304Dec-08 7454 14759 15 97 11057
Quarterly Total 27480 54410 54 41050 For the quantification of dilution flow allocations, the Basin Plan prescribes the following equation 13 to calculate assimilative capacity. The TMDL specifies that entities providing dilution flows obtain an allocation equal to the salt load assimilative capacity provided by this flow, calculated as follows:
Adil = Qdil*(Cdil--WQO)*0.8293 Where:
Adil = dilution flow allocation in thousand tons of salt per month Qdil = dilution flow volume in thousand acre-feet per month Cdil = dilution flow electrical conductivity in µS/cm WQO = salinity water quality objective for the LSJR at Airport Way Bridge near Vernalis in μS/cm
2. Water Acquisitions Brief Description: The Central Valley Project Improvement Act (CVPIA), signed into law on October 30, 1992, modified priorities for managing water resources of the Central Valley Project. CVPIA altered the management of the Central Valley Project to make
11 Flow data obtained from CVO Office; non-consumptive releases from Goodwin Dam 12 Water quality data obtained from California date Exchange Center (CDEC); Ripon (RPN) monitoring station. 13 Water Quality Control Plan for the Sacramento and San Joaquin River Basins, 4th Edition; Page IV-32.07, Table IV-4.4 Summary of Allocations and Credits

Reclamation Draft Compliance Evaluation and Monitoring Plan Appendix C
C-7
fish and wildlife protection, restoration, and enhancement as project purposes having equal priority with agriculture, municipal and industrial, and power uses. To meet water acquisition needs under CVPIA, the U.S. Department of the Interior (Interior) has developed a Water Acquisition Program (WAP), a joint effort by the Reclamation and the U.S. Fish and Wildlife Service (Service). The program's purpose is to acquire water supplies to meet the habitat restoration and enhancement goals of the CVPIA and to improve the Interior's ability to meet regulatory water quality requirements.
Activity: • Provided fall pulse flow releases in October 2008. • Working to develop a process to efficiently obtain the water acquisitions
information on a routine basis for future reports.
Month Volume
Acquired14 Source Volume of
Releases (TAF/month)
Monthly Average EC
(μS/cm)15
Assimilative Capacity16 (thousand tons/month)
Oct-08 12500 Merced R. 17 12.5 87 18 9460 Nov-08 0 - - - - Dec-08 0 - - - -
Quarterly Total 12500 9460 B. Salt Load Reduction Actions Reclamation is under a court order to provide drainage to its San Luis Unit, on the Westside of the lower San Joaquin River. As part of its efforts to provide drainage, Reclamation has historically supported the Westside Regional Drainage Plan (WRDP) through monetary grants and in-kind services. Reclamation recognizes there is still much to be done to implement the Westside Regional Drainage Plan. Salt Load Reduction Actions include the Grasslands Bypass Project, the Westside Regional Drainage Plan, and conservation programs (Water Conservation Field Services Program, Water 2025 Grants Program, and the CALFED Water Use Efficiency Program). 1. Grasslands Bypass Project (GBP) Brief Description: The Grassland Bypass Project is a multi-agency stakeholder project based upon an agreement between the Reclamation and the Authority to use a 28-mile
14 Water acquisition data obtained from MP-400, Water Acquisitions Group 15 Average electrical conductivity data obtained from CDEC; monitoring station dependent upon location of acquired water. 16 Same formula used as cited on page 2 of this report. Formula taken from Water Quality Control Plan for the Sacramento and San Joaquin River Basins, 4th Edition; Page IV-32.07, Table IV-4.4 Summary of Allocations and Credits 17 12500 AF was acquired from the San Joaquin River Group Authority from October 1-24. 18 Average electrical conductivity data obtained from CDEC; Merced River at Stevinson (MST) monitoring station.

Reclamation Draft Compliance Evaluation and Monitoring Plan Appendix C
C-8
segment of the San Luis Drain. The San Luis Drain is used to convey agricultural subsurface drainage water from the Grassland Area farmers to Mud Slough, a tributary of the San Joaquin River. The purpose of the project is to separate unusable agricultural drainage water from wetland water supply conveyance channels, facilitate drainage management that maintains the viability of agriculture in the area, and promote continuous improvement in water quality in the San Joaquin River.
Activity: • Reclamation continues to support portions of sediment and water monitoring
effort necessary for the project. These include weekly, quarterly and annual monitoring of locations in the San Luis and Kesterson National Wildlife Refuges, Mud Slough, Salt Slough, DMC, Mendota Pool, and the San Luis Drain. Activities include collection of samples, incorporation of samples into a prescribed QA/QC program, funding analytical analyses, validation of analytical data, periodic updating of the Quality Assurance Project Plan, and routine QA audits of all analytical laboratories performing work on the project.
• Reclamation is actively involved with project partners to pursue a third use agreement to fully develop the project. The administrative draft EIS/EIR for the continuation of the Grassland Bypass Project went out for public review in December 2008. This document will be used to support an amendment to the Basin Plan
• Reclamation continues to be a member of the Technical Policy Review Team (TPRT) and the Data Collection and Reporting Team (DCRT). The DCRT produces the Annual Report and help revise the Quality Assurance Project Plan. The TPRT is responsible for tracking the monitoring program carried out by the various agencies.
2. Westside Regional Drainage Plan (WRDP)
Brief Description: The Westside Regional Drainage Plan is a local stakeholder program developed by integrating all consistent elements of drainage management developed by government and local agencies and private partnerships. The original efforts of the WRDP focused on reducing selenium discharges to the San Joaquin River. Success of the original effort prompted a proposal to expand the WRDP to go beyond regulatory requirements and eliminate selenium, boron, and salt discharges to the San Joaquin River, while maintaining productivity of agriculture lands in the solution area and enhancing water supplies for the region. While Reclamation lacks control of many of the resources needed to be an active participant in the WRDP, Reclamation provides annual funding to support and sustain the WRDP.
Activity: • In 2008, Reclamation provided $4 million in funding to the WRDP. Combined
with state Proposition 50 funding and local cost sharing, the funds have been

Reclamation Draft Compliance Evaluation and Monitoring Plan Appendix C
C-9
used to develop more than 6,000 acres of reuse lands. Funds were used to install facilities to collect and distribute drain water across the reuse area, remove and replace open drain ditches that were hazardous to waterfowl, and line earth canals with concrete to reduce seepage losses. Funds were also used for the EIS/EIR required for the continuation of the Grassland Bypass Project, a critical part of the WRDP, after 2010.
3. Conservation Efforts
Brief Description: The water use efficiency program element includes several grant programs which fund actions to assure efficient use of existing and any new water supplies. Efficiency actions can alter the pattern of water diversions and reduce the magnitude of diversions, providing additional benefits. Efficiency actions can also result in reduced discharge of effluent or drainage and improved water quality. Although Reclamation is unable to quantify the benefits of the various funded projects as related to salinity reduction, the following information is provided to depict the agency’s water conservation efforts in the basin. Through Water 2025, CALFED, and the WCFSP, Reclamation has awarded 36 projects in the San Joaquin Valley that require performance measures since 2006. As information is collected from these projects quantifiable benefits may be determined in the future.
Activity: • In 2008, the Water Conservation Field Service Program and the CALFED Water
Use Efficiency Program received 44 proposals and funded 21 proposals. Of the 21 proposals granted funding, 7 were in the San Joaquin Basin totaling approximately $275,000.
• In 2008, the Water 2025 Grant Program received 68 proposals and provided Federal cost share funding to 3 proposals. Of the 3 proposals that received funding, 2 were in the San Joaquin Basin totaling $600,000.
• Reclamation extended a $433,000 contract to 2011 with the Agricultural Water Management Council to promote and advance effective water management practices to meet the water conservation goals and best management practices.
C. Mitigation Actions Reclamation’s Action Plan identifies two mitigation actions to reduce salinity loads: a real time management program to maximize the removal of salt using assimilative capacity in the San Joaquin River, and a wetlands BMP plan to research and potentially develop practices to reduce salinity loading from managed wetlands. Reclamation has actively supported the development of a real time monitoring and forecasting program in the River and in managed wetlands. 1. Real Time Management Program – Development of Stakeholder-Driven Program

Reclamation Draft Compliance Evaluation and Monitoring Plan Appendix C
C-10
Brief Description: The Real Time Management Program is described in the TMDL as a stakeholder driven effort to use “real-time” water quality and flow monitoring data to support water management operations in order to maximize the use of assimilative capacity in the San Joaquin River. The Regional Board describes this assimilative capacity as up to 80% of the load determined by Vernalis salinity objective. Reclamation has contracted with a facilitation firm to support the development of a stakeholder-driven program.
Activity: • Executed a contract to procure the service of a consultant to facilitate stakeholder
involvement in developing a Real Time Management Program (RTMP) • Directed a consultant to develop and conduct a stakeholder survey to solicit
feedback on the RTMP process and garner suggestions on salinity management in the basin.
• Conducted several coordinating and planning meetings to develop and prepare for the first stakeholder workshop held on January 8, 2009.
2. Real Time Management Program – Technical Support
Brief Description: A successful RTMP will require a real time monitoring network and a model capable of reasonably accurate forecasting of assimilative capacity. Reclamation is committed to participation in and support of the development of these tools. Reclamation staff has valuable experience in both of these areas. The technical support of this program will follow the stakeholder process.
Activity: • Executed a contract to procure the service of a consultant to develop a graphical
user interface (GUI) and water quality data management tool. • Executed a contract to purchase three YSI multi-parameter environmental
monitoring probes to be used with the existing monitoring network on the lower San Joaquin River.
• Executed a contract to purchase a software package that will be used to evaluate and perform quality control and quality assurance validation on time series data collected on the San Joaquin River.
3. Wetlands BMP Plan
Brief Description: The Service, CDFG, and the Grassland Resource Conservation District (GRCD) in coordination with Reclamation are developing BMP plans to reduce the impact of discharges from managed wetlands into the San Joaquin River. Currently, the developed draft BMP plan is awaiting the Service’s approval.
Activity:

Reclamation Draft Compliance Evaluation and Monitoring Plan Appendix C
C-11
• Reclamation is sponsoring a project entitled “Water Quality Monitoring in the Grassland Resource Conservation District”. Through this project a contract was executed to retrofit six monitoring stations located in the Grassland Water District and California State Fish and Game wetlands and an agreement is in place to maintain 28 real time monitoring sites associated with a pilot study in the Grassland Resource Conservation District.
• Reclamation is working with the Service, CDFG, and local wetlands managers to finalizing the BMP Plan.
• Reclamation is working on a contract to purchase additional monitoring equipment to develop a real time monitoring network on managed wetlands.
4. Involvement in CV-SALTS program
Brief Description: The Central Valley Water Board and State Water Board have initiated a comprehensive effort to address salinity problems in California’s Central Valley and adopt long-term solutions that will lead to enhanced water quality and economic sustainability. The Central Valley Salinity Alternatives for Long-Term Sustainability (CV-SALTS) is a collaborative basin planning effort aimed at developing and implementing a comprehensive salinity management program. The goal of CV-SALTS is to maintain a healthy environment and a good quality of life for all Californians by protecting the state’s most essential and vulnerable resource: water.
Activity: • Reclamation is involved in the various sub-committees in the program – Leader
Group, Technical Advisory Committee, Economics, Education and Outreach. D. DMC Load Evaluation The calculated DMC load is determining by the volume of deliveries made to the Northwest and Grassland subareas and the corresponding TDS. The summary data tables below are taken from the monthly report titled Delta-Mendota Canal Water Quality Monitoring Program. Loads of salt delivered to the Grasslands Subareas through CVP water 19 October November December Quarterly Total EC 20 (μS/cm) 502 460 745 TDS 21 (mg/L) 326 299 484 Cal. Salt Load 22 (tons) 40810 16250 5070 62130Supply Allocation 23 6487 2818 542 9847
19 Table 9b, Delta Mendota Canal Water Quality Monitoring Program for Selenium, Salinity and Boron, Reclamation 20 Flow weighed EC calculated as follows: (Sum of (daily flow * specific conductance of daily sample))/(Sum of daily flows when samples collected) 21 The TDS value is flow weighed and calculated as follows: (Sum of (daily flow * TDS of daily sample))/(Sum of daily flows when samples collected) 22 Salt load (tons) =Total Flow (acre-feet) * total dissolved solids (mg/L) * 0.00136

Reclamation Draft Compliance Evaluation and Monitoring Plan Appendix C
C-12
(tons) Excess Load (tons) 34323 13432 4528 52283 Loads of salt delivered to the Northwest Subareas through CVP water 24 October November December Quarterly Total EC 10 (μS/cm) 509 525 743 TDS 11 (mg/L) 331 341 483 Cal. Salt Load 12 (tons) 3130 580 320 4030Supply Allocation 13
(tons) 490 89 35 614
Excess Load (tons) 2640 491 285 3416 E. Reporting Requirements In the MAA, Reclamation agreed to provide quarterly reports to the Regional Board. Reclamation will consult with the Regional Board before proposing any changes to the sample report format. Quarterly reports are due 45 days after the end of the calendar quarter:
End of calendar quarter Due date of Quarterly report Dec 31, 2008 Feb 15, 2009 March 31, 2009 May 15, 2009 June 30, 2009 August 15, 2009 September 30, 2009 November 15, 2010 December 31, 2009 February 15, 2010 March 31, 2010 May 15, 2010 June 30, 2010 August 15, 2010 September 30, 2010 November 15, 2010 December 31, 2010 February 15, 2011
F. Funding Reporting Reclamation agreed in the MAA to seek additional funding, including grant funding, to support salinity control efforts. In its quarterly reports, Reclamation will report on its efforts to support the securing of additional funding.
Activity: • A funding request was submitted for the 2011 budget for administrative
coordination and activities related to the RTMP.
23 Supply Water Allocation Salt Load (tons) = LADMC = QDMC * 85 μS/cm * 0.8293
LADMC = DMC load allocation (1000 tons/month) QDMC = Volume of water delivered from the DMC to the subarea (1000 acre-feet/month) 85 μS/cm = Background specific conductance of water from the Sierra Nevada from Page IV-32.07 of the Basin Plan
24 Table 10b, Delta Mendota Canal Water Quality Monitoring Program for Selenium, Salinity and Boron, Reclamation