
Draft Annual Report - National Treasury
273
2017/2018 Draft Annual Report MAGARENG LOCAL MUNICIPALITY MAGRIETA PRINSLO WARRENTON 8530
Transcript of Draft Annual Report - National Treasury

2017/2018
Draft Annual Report
MAGARENG LOCAL MUNICIPALITY
M A G R I E T A P R I N S L O W A R R E N T O N 8 5 3 0

2 | P a g e
CONTENTS
CONTENTS ......................................................................................................................................................... 2,3,4,5,6
CHAPTER 1 – MAYOR’S FOREWORD AND EXECUTIVE SUMMARY ................................................................................. 7
COMPONENT A: MAYOR’S FOREWORD ......................................................................................................................... 7
COMPONENT B: EXECUTIVE SUMMARY ........................................................................................................................ 8
1.1. MUNICIPAL MANAGER’S OVERVIEW ............................................................................................................ 8
1.2. MUNICIPAL FUNCTIONS, POPULATION AND ENVIRONMENTAL OVERVIEW ................................................ 9
1.3. SERVICE DELIVERY OVERVIEW .................................................................................................................... 13
1.4. FINANCIAL HEALTH OVERVIEW .................................................................................................................. 14
1.5. ORGANISATIONAL DEVELOPMENT OVERVIEW ................................................................................ 14,15,16
1.6. AUDITOR GENERAL REPORT .................................................................................................................. 16,27
1.7. STATUTORY ANNUAL REPORT PROCESS ................................................................................................ 28,29
CHAPTER 2 – GOVERNANCE ........................................................................................................................................ 29
COMPONENT A: POLITICAL AND ADMINISTRATIVE GOVERNANCE ............................................................................ 30
2.1 POLITICAL GOVERNANCE ............................................................................................................................ 30
2.2 ADMINISTRATIVE GOVERNANCE ................................................................................................................ 35
COMPONENT B: INTERGOVERNMENTAL RELATIONS .................................................................................................. 40
2.3 INTERGOVERNMENTAL RELATIONS ....................................................................................................... 42,42
COMPONENT C: PUBLIC ACCOUNTABILITY AND PARTICIPATION ............................................................................... 44
2.4 PUBLIC MEETINGS ....................................................................................................................................... 44
2.5 IDP PARTICIPATION AND ALIGNMENT ................................................................................................... 48,48
COMPONENT D: CORPORATE GOVERNANCE .............................................................................................................. 49
2.6 RISK MANAGEMENT ................................................................................................................................... 49
2.7 ANTI‐CORRUPTION AND FRAUD ................................................................................................................. 49
2.8 SUPPLY CHAIN MANAGEMENT .............................................................................................................. 50,49
2.9 BY‐LAWS ..................................................................................................................................................... 50
2.10 WEBSITES ............................................................................................................................................... 50,50
2.11 PUBLIC SATISFACTION ON MUNICIPAL SERVICES ............................................................................. 51,51,52

3 | P a g e
CHAPTER 3 – SERVICE DELIVERY PERFORMANCE (PERFORMANCE REPORT PART I) ................................................... 53
COMPONENT A: BASIC SERVICES ....................................................................................................................... 55,55,53
3.1. WATER PROVISION ..................................................................................................................................... 56
3.2 WASTE WATER (SANITATION) PROVISION ................................................................................................. 57
3.3 ELECTRICITY ................................................................................................................................................ 57
3.4 WASTE MANAGEMENT (THIS SECTION TO INCLUDE: REFUSE COLLECTIONS, WASTE DISPOSAL, STREET
CLEANING AND RECYCLING) ........................................................................................................................................ 57
3.5 HOUSING ..................................................................................................................................................... 59
COMPONENT B: ROAD TRANSPORT ............................................................................................................................ 60
3.7 ROADS .................................................................................................................................................... 60,61
COMPONENT C: PLANNING AND DEVELOPMENT ....................................................................................................... 61
3.10 PLANNING& DEVELOPMENT .................................................................................................................. 61,61
3.11 LOCAL ECONOMIC DEVELOPMENT (INCLUDING TOURISM AND MARKET PLACES) ......................... 63,63,64
COMPONENT E: ENVIRONMENTAL PROTECTION ................................................................................................... 65,65
COMPONENT F: HEALTH .............................................................................................................................................. 67
3.19 HEALTH INSPECTION; FOOD AND ABBATOIR LICENSING AND INSPECTION; ETC ................................. 67,67
COMPONENT G: SECURITY AND SAFETY ..................................................................................................................... 69
3.21 FIRE ........................................................................................................................................................ 69,69
3.22 OTHER (DISASTER MANAGEMENT)............................................................................................................. 69
COMPONENT H: SPORT AND RECREATION ................................................................................................................. 70
3.23 SPORT AND RECREATION ............................................................................... Error! Bookmark not defined.
COMPONENT I: CORPORATE POLICY OFFICES AND OTHER SERVICES ......................................................................... 70
3.24 COUNCIL ..................................................................................................................................................... 71
3.25 FINANCIAL SERVICES .............................................................................................................................. 71,71
3.26 CORPORATE SERVICES ................................................................................................................................ 72
3.27 INFORMATION AND COMMUNICATION TECHNOLOGY (ICT) SERVICES ..................................................... 72
3.28 LEGAL SERVICES .......................................................................................................................................... 73
3.28.1 RISK MANAGEMENT ................................................................................................................................... 73
3.28.2 MINIMUM INFORMATION SECURITY .......................................................................................................... 74
3.28.3 PROCUREMENT SERVICES ........................................................................................................................... 75
4 | P a g e
COMPONENT J: MISCELLANEOUS ................................................................................................................. 78,75,76,77
COMPONENT K: ORGANISATIONAL PERFOMANCE SCORECARD ........................................................................... 78‐88
CHAPTER 4 – ORGANISATIONAL DEVELOPMENT PERFORMANCE .............................................................................. 90
(PERFORMANCE REPORT PART II)................................................................................................................................ 90
COMPONENT A: INTRODUCTION TO THE MUNICIPAL PERSONNEL ............................................................................ 90
4.1 EMPLOYEE TOTALS, TURNOVER AND VACANCIES ..........................................................................................
COMPONENT B: MANAGING THE MUNICIPAL WORKFORCE ...................................................................................... 92
4.2 POLICIES ...................................................................................................................................................... 92
4.3 INJURIES, SICKNESS AND SUSPENSIONS ..................................................................................................... 93
4.4 PERFORMANCE REWARDS .......................................................................................................................... 94
COMPONENT C: CAPACITATING THE MUNICIPAL WORKFORCE ................................................................................. 95
4.5 SKILLS DEVELOPMENT AND TRAINING ....................................................................................................... 96
COMPONENT D: MANAGING THE WORKFORCE EXPENDITURE ................................................................................ 100
CHAPTER 5 – FINANCIAL PERFORMANCE .................................................................................................................. 101
COMPONENT A: STATEMENTS OF FINANCIAL PERFORMANCE ............................................................................... 102
5.1 STATEMENTS OF FINANCIAL PERFORMANCE ................................................................................... 101‐229
5.2 GRANTS .................................................................................................... Error! Bookmark not defined.231
5.3 ASSET MANAGEMENT ....................................................................................................................... 233‐233
5.4 FINANCIAL RATIOS BASED ON KEY PERFORMANCE INDICATORS ............................................................. 235
COMPONENT B: SPENDING AGAINST CAPITAL BUDGET ........................................................................................... 235
5.5 CAPITAL EXPENDITURE ............................................................................................................................. 235
5.6 SOURCES OF FINANCE .............................................................................................................................. 236
5.7 CAPITAL SPENDING ON 5 LARGEST PROJECTS .......................................................................................... 237
5.8 BASIC SERVICE AND INFRASTRUCTURE BACKLOGS – OVERVIEW ............................................................. 238
COMPONENT C: CASH FLOW MANAGEMENT AND INVESTMENTS ........................................................................... 240
5.9 CASH FLOW ............................................................................................................................................... 241
5.10 BORROWING AND INVESTMENTS ............................................................................................................ 242
5.11 PUBLIC PRIVATE PARTNERSHIPS ............................................................................................................... 243
COMPONENT D: OTHER FINANCIAL MATTERS .......................................................................................................... 244

5 | P a g e
5.12 SUPPLY CHAIN MANAGEMENT ................................................................................................................. 244
5.13 GRAP COMPLIANCE .................................................................................................................................. 244
CHAPTER 6 – AUDITOR GENERAL AUDIT FINDINGS ................................................................................................... 245
COMPONENT A: AUDITOR‐GENERAL OPINION OF FINANCIAL STATEMENTS 2016‐2017 ......................................... 245
COMPONENT B: AUDITOR‐GENERAL OPINION YEAR‐ 2017‐2018 (CURRENT YEAR) ................................................. 246
6.2 AUDITOR GENERAL REPORT YEAR 2017‐2018 ..................................................................................................... 246
GLOSSARY .......................................................................................................................................................... 248‐249
APPENDICES ............................................................................................................................................................... 251
APPENDIX A – COUNCILLORS; COMMITTEE ALLOCATION AND COUNCIL ATTENDANCE .......................................... 251
APPENDIX B – COMMITTEES AND COMMITTEE PURPOSES ...................................................................................... 252
APPENDIX C –THIRD TIER ADMINISTRATIVE STRUCTURE .......................................................................................... 254
APPENDIX D – FUNCTIONS OF MUNICIPALITY / ENTITY ............................................................................................ 255
APPENDIX G – RECOMMENDATIONS OF THE MUNICIPAL AUDIT COMMITTEE YEAR – 2015‐2016 .................. 257‐259
APPENDIX G1 – MUNICIPAL AUDIT COMMITTEE REPORT 2015‐2016 ...................................................................... 257
APPENDIX H – LONG TERM CONTRACTS AND PUBLIC PRIVATE PARTNERSHIPS ....................................................... 260
APPENDIX I –SERVICE PROVIDER PERFORMANCE SCHEDULE ................................................................................... 261
APPENDIX J – DISCLOSURES OF FINANCIAL INTERESTS ............................................................................................. 262
APPENDIX K: REVENUE COLLECTION PERFORMANCE BY VOTE AND BY SOURCE .................................................... 263
APPENDIX K (i): REVENUE COLLECTION PERFORMANCE BY VOTE ............................................................................ 263
APPENDIX K (ii): REVENUE COLLECTION PERFORMANCE BY SOURCE ....................................................................... 264
APPENDIX L: CONDITIONAL GRANTS RECEIVED: EXCLUDING MIG ........................................................................... 265
APPENDIX M: CAPITAL EXPENDITURE – NEW & UPGRADE/RENEWAL PROGRAMMES ............................................ 266
APPENDIX M (i): CAPITAL EXPENDITURE ‐ NEW ASSETS PROGRAMME .................................................................... 266
APPENDIX M (ii): CAPITAL EXPENDITURE – UPGRADE/RENEWAL PROGRAMME ...................................................... 268
APPENDIX N – CAPITAL PROGRAMME BY PROJECT YEAR 2015‐2016 ....................................................................... 270
APPENDIX O – CAPITAL PROGRAMME BY PROJECT BY WARD YEAR 2015‐2016 ....................................................... 271

6 | P a g e
APPENDIX R – DECLARATION OF LOANS AND GRANTS MADE BY THE MUNICIPALITY .............................................. 272
VOLUME II: ANNUAL FINANCIAL STATEMENTS ......................................................................................................... 273

7 | P a g e
CHAPTER 1 – MAYOR’S FOREWORD AND EXECUTIVE SUMMARY
COMPONENT A: MAYOR’S FOREWORD
This annual report of the Magareng Local Municipality is compiled consistent with the Local Government Act
(Section 83) which requires each municipality to submit an annual report for the financial year starting from 1
July 2017 to 30 June 2018. This annual report provides the necessary tool for appraisal in respect of the
performance of our municipality in implementing the budget allocated projects as informed by our Integrated
Development Plan (IDP). As part of promoting transparency, the report gives an account of both financial and
non‐financial information on key municipal functions. Our pursuit of clean governance and prudent financial
management has once again resulted in the Magareng Local Municipality achieving qualified audit opinion during
the financial year under review.It is premised on enhancing the fight against poverty, unemployment and
inequality through the implementation of both the National Development Plan.
Conclusion
I would like to thank all councilors, management team and staff as a whole,our sister municipality‐ Frances Baard
District Municipality and the Northern Cape Provincial Government for their ongoing support to our work since
we took office as the current administration. We appreciate this support which is critical in ensuring that we
attain even greater success in the coming year as we seek to build a caring municipality.
I also thank my own family for their love, understanding and support in the execution of my work.
All the achievements we have made in the 2017/18 financial year would not have been possible without the
support of the residents of Magarengand for that reason we are really grateful for their contributions.
B MHALENI
MAYOR

8 | P a g e
COMPONENT B: EXECUTIVE SUMMARY
1.1. MUNICIPAL MANAGER’S OVERVIEW
This report is compiled and tabled in terms of Section 127(2) of the Municipal Finance Management Act (MFMA),
Act 56 of 2003, which requires that the annual report to the be tabled at the Municipal Council meeting by the
Executive Mayor after which the Municipal Manager must make the report public and invite the local community
to submit representations in respect of issues raised in the report.
Section 121(2) of the Municipal Finance Management Act, Act 56 of 2003, read with MFMA Circular 32 and
Circular 63, gives the purpose of the Annual Report as having:
to provide a record of the activities of the municipality or municipal entity during the financial year to
the report relates
to provide a record on performance against the budget of the municipality or the municipal entity for
that which financial year
to promote accountability to the local community for the decisions made throughout the year by the
municipality or municipal entity
This report will therefore attempt to cover the broad view of the Magareng Local Municipality municipal area
with information such as the socio‐economic profile of the area, the achievements relating to the delivery of
services to the community as well as the developmental and institutional aspects, including financial
performance. The report also covers governance and public participation engaged in by the municipality to
ensure involvement of the communities of the Magareng in planning as well as in delivery of services that meet
their needs in the period under review.
Furthermore, this report will reflect on the work carried out in 2017/2018 financial year and provide feedback on
performance against targets to various stakeholders, including the community, government departments and
other interested parties. It further ensures that accountability is upheld, and the clients of the municipality are
kept abreast of the decisions that were taken in the period under review.
All efforts were taken to ensure that the budget, Integrated Development Plan and the Service Delivery
Implementation Plan of the Magarengare aligned in spite of some challenges.
Let me at this point extend a word of gratitude to all personnel of the Magareng Local Municipality, the political
leadership and the community at large for the warm welcome I received.

9 | P a g e
Thanks for the dedication, hard work and commitment of employees. The oversight by Councillors cannot be
over‐emphasized.
I thank you all.
EM MONCHO
MUNICIPAL MANAGER
1.2. MUNICIPAL FUNCTIONS, POPULATION AND ENVIRONMENTAL OVERVIEW
INTRODUCTION TO BACKGROUND DATA
Geographic Profile
The Magareng Local Municipality (NC093) is a Category B municipality within the Frances Baard District of the
Northern Cape Province. It is bordered by Phokwane and the North West Province in the north, Sol Plaatje in the
south, the Free State Province in the east, and Dikgatlong in the west. It is one of the four municipalities that
make up the district, accounting for 12% of its geographical area. Magareng is a Setswana name meaning ‘in the
middle'. The name reflects the geographic location of the municipality in relation to other areas.
Water
.
Space-Time Research
Community Survey 2016
Table 1
Yes 15166
No 8529
Do not know 364
Unspecified -
Access to safe drinking water supply service for person weight, NC093: Magareng

10 | P a g e
T 1.2.1
Sanitation
Space-Time Research
Community Survey 2016
Table 1
The main type of toilet facility used for Person Weight, NC093 : Magareng
Flush toilet connected to a public sewerage system 19741
Flush toilet connected to a septic tank or conservancy tank 1036
Chemical toilet 70
Pit latrine/toilet with ventilation pipe 1136
Pit latrine/toilet without ventilation pipe 1040
Ecological toilet (e.g. urine diversion; enviroloo; etc.) 507
Bucket toilet (collected by municipality) 146
Bucket toilet (emptied by household) -
Other 153
None 233
Electricity
Space-Time Research Community Survey 2016 Table 1 Electricity for Person Weight, NC093 : Magareng Yes 22191
No 1034
Unspecified 835
Total 24059
Water Source
Space-Time Research Community Survey 2016

11 | P a g e
Table 1 Main source of water for drinking for Person Weight, NC093 : Magareng Piped (tap) water inside the dwelling/house
4894
Piped (tap) water inside yard 14601
Piped water on community stand 474
Borehole in the yard 241
Rain-water tank in yard 100
Neighbours tap 255
Public/communal tap 3075
Water-carrier/tanker 294
Borehole outside the yard 16
Flowing water/stream/river -
Well -
Spring -
Other 109
Education
Space-Time Research Community Survey 2016 Table 1 Highest level of education for Person Weight, NC093 : Magareng No schooling 4084
Grade 0 1100
Grade 1/Sub A/Class 1 719
Grade 2/Sub B/Class 2 802
Grade 3/Standard 1/ABET 1 1018
Grade 4/Standard 2 1018
Grade 5/Standard 3/ABET 2 1155
Grade 6/Standard 4 1136
Grade 7/Standard 5/ABET 3 1264
Grade 8/Standard 6/Form 1 1505
Grade 9/Standard 7/Form 2/ABET 4/Occupational certificate NQF Level 1 1600
Grade 10/Standard 8/Form 3/Occupational certificate NQF Level 2 1788
Grade 11/Standard 9/Form 4/NCV Level 3/ Occupational certificate NQF Level 3 1878
Grade 12/Standard 10/Form 5/Matric/NCV Level 4/ Occupational certificate NQF Level 3
4349
NTC I/N1 -
NTCII/N2 13
NTCIII/N3 49
N4/NTC 4/Occupational certificate NQF Level 5 15

12 | P a g e
N5/NTC 5/Occupational certificate NQF Level 5 -
N6/NTC 6/Occupational certificate NQF Level 5 32
Certificate with less than Grade 12/Std 10 -
Diploma with less than Grade 12/Std 10 -
Higher/National/Advanced Certificate with Grade 12/Occupational certificate NQF 35
Diploma with Grade 12/Std 10/Occupational certificate NQF Level 6 74
Higher Diploma/Occupational certificate NQF Level 7 28
Post-Higher Diploma (Master’s 14
Bachelor’s degree/Occupational certificate NQF Level 7 58
Honours degree/Post-graduate diploma/Occupational certificate NQF Level 8
44
Master’s/Professional Master’s at NQF Level 9 degree 27
PHD (Doctoral degree/Professional doctoral degree at NQF Level 10) -
Other 37
Do not know 203
Unspecified 13
Total 24059
HOUSING COMPOSITION COMMENTS
Magareng Local Municipality has a total of 6120 households with an average size of 4.0. This indicates that there is an average of 4 people per household. The majority of the household are headed by females, representing 41.7% of the population. Below is a table indicating the type and number of dwellings that exist in municipality (Statistics SA: Municipal Fact Sheet, 2011). Magareng Local Municipality has only 5061 housing structures, which is the lowest as compared to the other local municipalities in the district. In addition the eradication of informal dwelling is the lowest in the district compared to other local municipalities.T1.2.3
Space-Time Research Community Survey 2016 Table 1 Main dwelling that household currently lives in for Person Weight, NC093 : Magareng Formal dwelling/house or brick/concrete block structure on a
18894
Traditional dwelling/hut/structure made of traditional mater 98
Flat or apartment in a block of flats -
Cluster house in complex -

13 | P a g e
Townhouse (semi-detached house in a complex) 359
Semi-detached house 259
Formal dwelling/house/flat/room in backyard 538
Informal dwelling/shack in backyard 2247
Informal dwelling/shack not in backyard (e.g. in an informal 1666
Room/flatlet on a property or larger dwelling/servants quart -
Caravan/tent -
Other -
Unspecified -
Natural Resources
Major Natural Resource Relevance to Community
Land • Access to land• Security of Tenure • High Agriculture Potential • Food Production
Water • Access to water• Food Production
Mineral Resources - Diamonds
Job Creation Remittances
Economic Development
Environmental Sustainability
1.3. SERVICE DELIVERY OVERVIEW
SERVICE DELIVERY INTRODUCTION
The Department Technical Services is devoted to improve the quality of life of its community by providing
efficient, sustainable and affordable infrastructure specifically in terms of:
water and sanitation
Roads and Stormwater
Electricity, and
Housing
Effectively utilizing the available resources, and
Identifying the best option that would maximize the output.

14 | P a g e
Expanded & accelerated economic investment and availability of reliable economic infrastructure.Section 229 of
the Constitution allows municipalities to impose property rates and service charges. This obligation requires
strict financial management and accountability to the public.
The provision of basic services is one of the Key Performance Areas as contemplated in Sect 152(1) of the
Constitution. The National Minister in conjunction with the MEC for local government take their marching orders
from the State of the Nation Address to continuously improve service delivery and assist local municipalities in
meeting community needs.
Council conducted an audit of its indigent register to migrate as many deserving beneficiaries as possible. This
will enhance our capacity to control and monitor our age analysis and ensure proper credit control and revenue
collection.
1.4. FINANCIAL HEALTH OVERVIEW
FINANCIAL OVERVIEW
Magareng Local Municipality is a developing and growing Municipality striving for service delivery excellence.
Therefore many challenges are faced with regards to Financial Planning and are ever changing due to the
dynamic setting of Local Government.
The priority for the Municipality, from the financial perspective is to ensure viability and sustainability of the
Municipality. The Multi‐Year Financial Plan and related strategies will address a number of key areas in order to
achieve this priority. These strategies are detailed below:
Revenue Enhancement Strategy
Asset Management Strategy: Financial Management Strategies:
Operational Financing Strategies:
Capital Funding Strategies:
Cost‐Effective Strategy:
The South African economy is slowly recovering from the economic downturn and it will still take some time for
municipal revenues to increase through local economic growth. Consequently cash flows are expected to remain
under pressure forthe 2016/2017 financial year and a conservative approach must be followed to project
expected revenues and cash receipts.
1.5. ORGANISATIONAL DEVELOPMENT OVERVIEW
ORGANISATIONAL DEVELOPMENT PERFORMANCE
The Municipal Systems Act, MSA 2000 S67, requires municipalities to develop and adopt appropriate systems
and procedures to ensure fair; efficient; effective; and transparent personnel administration in accordance with
the Employment Equity Act 1998. In order to comply with the prescripts of the Municipal Systems Act No. 32 of
2000 the following strategic interventions, amongst others, have been invoked to ensure fair; efficient; effective;
and transparent personnel administration

15 | P a g e
Establishment of the Local Labour Forum (where Management and Organized Labour engage vigorously on
matters relating to Conditions of Employment for employees), which is fully functional irrespective of the
teething challenges, experienced.
A number of workforce policies that forms part of the Human Resources Strategy were compiled and reviewed
during the period under review and are to be tabled for adoption by Council after the Council members are work
shopped on the policies. The policies will provide Management with strategic decision making and meeting the
organization’s strategic objectives.
The effective and efficient Human Resource Management and Development allowed us to identify and report on
all HR matters, which could have an effect on financials, performance management and compliance with rules
and regulations. Magareng Local Municipality has managed to become a Learning Organization with skills and
capacity due to our dedication and commitment to Human Resource Management and Human Resource
Development.
The position of Municipal Manager (MM) is filled and Head of Department Community Services is still vacant.
Site visits on Occupational health and Safety was done to educate and make employees aware about Health and
Safety measures in the workplace. The OHS Committee monitors all instances of injuries on duty and makes
follow up on all Occupational Health and Safety incidents within the Municipality and submits reports on
progress.
A proper record is kept for all types of leave instances and an amount of time taken each year is recorded as per
Human Resources Dashboard.
The Workplace Skill Plan (WSP) for the year under review has been submitted after proper consultation all
stakeholders within the Municipality. The WSP was populated based on the individual Personal Development
Plans (PDP) of employees and training/development will be carried out on the basis of these. Some of the HODs
and middle managers are currently attending the Competency Requirements course as determined by the
Municipal Finance Management Act (MFMA).
Challenges faced by the Municipality on Capacity Development are to some extent the unavailability or
insufficient funds to finance developmental training and capacity building for career‐pathing of employees within
Municipality.
Performance Management
The Performance Management System has been implemented and sustained to ensure Councillors and Officials
are able to monitor, review and report on performance.
The following key PMS elements were implemented:
‐ The Mayor approved the SDBIP by the 27th June 2017.
‐ The Municipal Manager and Section 56 Manager signed their Performance Agreements by the June
2017 .
‐ The PMS Framework was adopted by Council in July.
‐ PMS/IDP/BUDGET Process Plan was adopted by Council.

16 | P a g e
‐ The 2016/2017 Annual Report and Oversight Report were tabled during the financial year and submitted
to all the stakeholders i.e. Auditor‐General, Provincial and National Treasuries.
‐ All quarterly performance report were audited by the internal audit and tabled before council and audit
committee
‐ The municipality prepared the annual performance report (APR) under the year review
1.6. AUDITOR GENERAL REPORT
AUDITOR GENERAL REPORT:YEAR2017/2018(CURRENT YEAR)
The Magareng Local Municipality works very hard collectively to improve on the audit opinion it received during
2016/2017 financial year. The municipality received qualified opinion during the 2017/2018 financial year.
REPORT OF THE AUDITOR-GENERAL TO THE NORTHERN CAPE PROVINCIAL LEGISLATURE AND THE COUNCILON MAGARENG LOCAL MUNICIPALITY
REPORT ON THE AUDIT OF THEFINANCIAL STATEMENTS
Qualified opinion
1. I have audited thefinancial statements of theMagareng Local Municipality set out on pages, which comprise
thestatement of financial position as at 30 June 2018, thestatementoffinancialperformance,statement of
changes in net assets, cash flow statement and statement of comparison of budget information with actual
information for the year then ended, as well as the notes to thefinancial statements, including a summary of
significant accounting policies.
2. In my opinion, except for the possible effects of the matters described in the basis for qualified opinion section
of this auditor’s report, thefinancial statements present fairly, in all material respects, thefinancial position of the
Magareng Local Municipality as at 30 June 2018, and itsfinancial performance andcash flows for the year then
ended in accordance with the Standards of Generally Recognised Accounting Practice (Standards of GRAP) and
the requirements of the Municipal Finance Management Act of South Africa, 2003 (Act No. 56 of 2003) (MFMA)
and the Division of Revenue Act of South Africa, 2017 (Act No. 3 of 2017) (Dora).
Basis for qualified opinion
Property, plant and equipment
3. The municipality did not adequately assess infrastructure included in property, plant and equipment for
impairment in accordance with GRAP 21, Impairment of non‐cash generating assets, as the impairment
assessment did not take into account all impairment indicators to determine the carrying value of infrastructure

17 | P a g e
assets for the current and previous year. As the municipality did not have adequate systems to identify possible
indicators of impairment, I was unable to determine the impact on the net carrying amount of infrastructure
assets as it was impractical to do so. Additionally, there was a resultant impact on depreciation, impairment and
reversals, the deficit for the period and the accumulated surplus.
4. I was unable to obtain sufficient appropriate audit evidence for property, plant and equipment relating to
land, buildings and community assets. I was unable to confirm the physical assets by alternative means.
Consequently, I was unable to determine whether any adjustmentswere necessary relating to land, buildings and
community assets, stated at R31 415 852 in note 10to the financial statements.
5. The municipality did not record land in accordance with GRAP 17, Property, plant and equipment. The
assumptions used in determining the value of land are not a fair reflection of the market value. The full extent of
the misstatement for the current year as well as previous years could not be determined as it was impracticable
to do so. Additionally, there was a resultant impact on the deficit for the period and the accumulated surplus.
Investment property
6. The municipality did not record land in accordance with GRAP 16, Investment property. The assumptions used
in determining the value of land are not a fair reflection of the market value. The full extent of the misstatement
for the current year could not be determined as it was impracticable to do so. Additionally, there was a resultant
impact on the deficit for the period.
Receivables from non‐exchange transactions
7. The municipality did not recognize the allowance for doubtful debts in accordance with GRAP 104, Financial
instruments, as the municipality did not consider all credit exposure for the current and previous year.
Additionally, there was a resultant impact on the deficit for the period and on the accumulated surplus. I was
unable to confirm the impact on receivables from non ‐ exchange transactions by alternative
means.Consequently, I was unable to determine whether any adjustment relating to receivables from non ‐
exchange, stated at R 5 924 670(2017: R 1 940 945) in the financial statements, was necessary.
Receivables from exchange transactions
8. The municipality did not recognize the allowance for doubtful debts in accordance with GRAP 104, Financial
instruments, as the municipality did not consider all credit exposure for the current and previous year.
Additionally, there was a resultant impact on the deficit for the period and on the accumulated surplus.I was
unable to confirm the impact on receivables from exchange transactions by alternative means. Consequently, I
was unable to determine whether any adjustment relating to receivables from exchange, stated at R 8 751 999
(2017: R 3 483 249) in the financial statements, was necessary.
Employee benefit obligation
9. The municipality did not recognize post‐retirement benefits included in the employee benefit obligation
in accordance with GRAP 25, Employee benefit obligations, as the municipality provided for employees who are
not eligible for post‐retirement benefitsin accordance with the South African Local Government Association

18 | P a g e
human resource policy decisions. I was unable to determine the full extent of the misstatement for the current
and previous year asit was impracticable to do so. Additionally, there was a resultant impact on the employee
related costs, finance costs, actuarial gains, deficit for the period and the accumulated surplus.
Payables from exchange transactions
10. During 2017, I was unable to obtain sufficient appropriate evidence relating to payments received in advance,
as the municipality did not have adequate systems to maintain records of payments received in advance. I was
unable to confirm payments received in advance by alternative means. Consequently, I was unable to determine
whether any adjustments were necessary to payments received in advance, stated at R2 366 721 in note 13 to
the financial statements.
Revenue from exchange transactions
11. I was unable to obtain sufficient appropriate audit evidence that the municipality had properly accounted for
service charges, due to the status of the accounting records. The municipality did not have adequate systems of
internal control for the recording of all transactions. I could not confirm service charges by alternative means. In
addition, there was a resultant impact on receivables from exchange transactions, interest sundry and the VAT
receivable. Consequently, I was unable to determine whether any adjustments were necessary to service
charges, stated at R33 979 038 (2017: R27 902 830) in note 18 to the financial statements.
12. The municipality did not recognize revenue from exchange transactions relating to service charges in
accordance with GRAP 9, Revenue from exchange transactions, due to meter readings not having been done as
well asincorrect billing and tariffs used in the current and previous year. I was unable to determine the full extent
of the misstatement of revenue from exchange transactions relating to service charges and receivables from
exchange transactions as it was impracticable to do so.
Revenue from non‐exchange transactions
13. I was unable to obtain sufficient appropriate audit evidence for revenue from non‐exchange transaction
relating to property rates, as the municipality did not have adequate systems to maintain records of revenue
from non‐exchange transactions for the current and previous year. I was unable to confirm property ratesby
alternative means. In addition, there was a resultant impact on receivables from non‐exchange transactions.
Consequently, I was unable to determine whether any adjustments were necessary to property rates, stated at
R7 444 856 (2017: R6 894 000) in the financial statements.
14. I was unable to obtain sufficient appropriate audit evidence for revenue from non‐exchange transaction
relating to fines, penalties and forfeits, as the municipality did not have adequate systems to maintain records of
revenue from non‐exchange transactions for the current year. I was unable to confirm fines, penalties and
forfeits by alternative means. In addition, there was a resultant impact on receivables from non‐exchange
transactions. Consequently, I was unable to determine whether any adjustments were necessary to fines,
penalties and forfeits, stated at R17 118 619 in the financial statements.
Irregular expenditure

19 | P a g e
15. In terms of section 125(2)(d)(i) of the MFMA, the municipality must include particulars of irregular
expenditure in the notes to the annual financial statements. The municipality incurred expenditure in
contravention of the supply chain management (SCM) requirements that was not included in the irregular
expenditure disclosed in note 43 to the financial statements. I was unable to determine the full extent of the
understatement for the current as well as previous years as it was impracticable to do so. Consequently, I was
unable to determine whether any further adjustments were necessary to irregular expenditure disclosed as R54
022 510 (2017: R37 967 992) in note 43 to the financial statements.
Material losses
16. I was unable to obtain sufficient appropriate audit evidence for material losses, as the municipality did not
maintain adequate records of the number of water and electricity units distributed. I could not confirm these
amounts by alternative means. Consequently, I was unable to determine whether any adjustments were
necessary to material losses stated in note50 to the financial statements.
Context for the opinion
17. I conducted my audit in accordance with the International Standards on Auditing (ISAs). My
responsibilities under those standards are further described in the auditor‐general’s responsibilities for the audit
of the financial statements section of this auditor’s report.
18. I am independent of the municipality in accordance with the International Ethics Standards Board for
Accountants’ Code of ethics for professional accountants (IESBA code) and the ethical requirements that are
relevant to my audit in South Africa. I have fulfilled my other ethical responsibilities in accordance with these
requirements and the IESBA code.
19. I believe that the audit evidence I have obtained is sufficient and appropriate to provide a basis for my
qualified opinion.
Material uncertainty relating to going concern
20. I draw attention to the matter below. My opinion is not modified in respect of this matter.
21. With reference to note 46 to the financial statements, which indicates that the municipality incurred a net
loss of R 17 371 762 during the year ended 30 June 2018. As stated in note 46, these events or conditions, along
with other matters as set forth in note 46, indicate that a material uncertainty exists that may cast significant
doubt on the municipality’s ability to continue as a going concern.
Emphasis of matters
22. I draw attention to the matters below. My opinion is not modified in respect of these matters.
Restatement of corresponding figures

20 | P a g e
23. As disclosed in note 39 to the financial statements, the corresponding figures for 30 June 2017 were restated
as a result of an error in the financial statements of the municipality at, and for the year ended, 30 June 2018.
Underspending of the conditional grants
24. As disclosed in the note 23 to the financial statements, the municipality materially underspent on the
Integrated National Electrification Programme Grant by R 2 415 307, resulting in an inability to achieve the
service delivery targets for the current year.
Other matters
25. I draw attention to the matters below. My opinion is not modified in respect of these matters.
Unaudited disclosure notes
26. In terms of section 125(2)(e) of the MFMA, the municipality is required to disclose particulars of non‐
compliance with the MFMA in the financial statements. This disclosure requirement did not form part of the
audit of the financial statements and, accordingly, I do not express an opinion thereon.
Unaudited supplementary schedules
27. The supplementary information set out on pages x to x does not form part of the financial statements and is
presented as additional information. I have not audited these schedules and, accordingly, I do not express an
opinion on them.
Responsibilities of the accounting officer for the financial statements
28. The accounting officer is responsible for the preparation and fair presentation of the financial statements in
accordance with the Standards of GRAP and the requirements of the MFMA and Dora, and for such internal
control as the accounting officer determines is necessary to enable the preparation of financial statements that
are free from material misstatement, whether due to fraud or error.
29. In preparing the financial statements, the accounting officer is responsible for assessing the Magareng Local
Municipality’s ability to continue as a going concern, disclosing, as applicable, matters relating to going concern
and using the going concern basis of accounting unless the appropriate governance structure either intends to
liquidate the municipality or to cease operations, or has no realistic alternative but to do so.
Auditor‐general’s responsibilities for the audit of the financial statements
30. My objectives are to obtain reasonable assurance about whether the financial statements as a whole are free
from material misstatement, whether due to fraud or error, and to issue an auditor’s report that includes my
opinion. Reasonable assurance is a high level of assurance, but is not a guarantee that an audit conducted in
accordance with the ISAs will always detect a material misstatement when it exists. Misstatements can arise
from fraud or error and are considered material if, individually or in aggregate, they could reasonably be
expected to influence the economic decisions of users taken on the basis of these financial statements.
31. A further description of my responsibilities for the audit of the financial statements is included in the
annexure to this auditor’s report.

21 | P a g e
REPORT ON THE AUDIT OF THE ANNUAL PERFORMANCE REPORT
INTRODUCTION AND SCOPE
32. In accordance with the Public Audit Act of South Africa, 2004 (Act No. 25 of 2004) (PAA) and the general
notice issued in terms thereof, I have a responsibility to report material findings on the reported performance
information against predetermined objectives for selected key performance areas(KPAs) presented in the annual
performance report. I performed procedures to identify findings but not to gather evidence to express
assurance.
33. My procedures address the reported performance information, which must be based on the approved
performance planning documents of the municipality. I have not evaluated the completeness and
appropriateness of the performance indicators included in the planning documents. My procedures also did not
extend to any disclosures or assertions relating to planned performance strategies and information in respect of
future periods that may be included as part of the reported performance information. Accordingly, my findings
do not extend to these matters.
34. I evaluated the usefulness and reliability of the reported performance information in accordance with the
criteria developed from the performance management and reporting framework, as defined in the general
notice, for the following selected KPA presented in the annual performance report of the municipality for the
year ended 30 June 2018:
Key performance area Pages in the annual performance report
KPA 2: basic service delivery and infrastructure development
35. I performed procedures to determine whether the reported performance information was properly
presented and whether performance was consistent with the approved performance planning documents. I
performed further procedures to determine whether the indicators and related targets were measurable and
relevant, and assessed the reliability of the reported performance information to determine whether it was valid,
accurate and complete.
36. The material findings in respect of the usefulness of the selected KPA are as follows:
KPA 2: basic service delivery and infrastructure development
Refurbishment of existing electricity infrastructure
37. The method of calculation for achieving the planned indicator was not clearly defined. The measure of the
planned indicator is not consistent with the annual target.
Various indicators
38. I was unable to obtain sufficient appropriate audit evidence for the achievement and the related measures
taken to improve performance as reported in the annual performance report for the indicators listed below. This
was due to limitations placed on the scope of my work. I was unable to confirm the reported measures taken by

22 | P a g e
alternative means. Consequently, I was unable to determine whether any adjustments were required to the
reported measures taken to improve performance.
Indicator description Planned target Reported achievement
Water supply in Warrenton 100% Expenditure 90.46% Expenditure
Sewer reticulation at the station area 100% Expenditure 64.87% Expenditure
Other matters
39. I draw attention to the matters below.
Achievement of planned targets
40. Refer to the annual performance report on pages x to x for information on the achievement of planned
targets for the year. This information should be considered in the context of the material findings on the
usefulness of the reported performance information in paragraphs xof this report.
Adjustment of material misstatements
41. I identified material misstatements in the annual performance report submitted for auditing. These material
misstatements were on the reported performance information of KPA 2: basic service delivery and infrastructure
development. As management subsequently corrected only some of the misstatements, I raised material findings
on the usefulness of the reported performance information. Those that were not corrected are reported above.
REPORT ON THE AUDIT OF COMPLIANCE WITH LEGISLATION
INTRODUCTION AND SCOPE
42. In accordance with the PAA and the general notice issued in terms thereof, I have a responsibility to
report material findings on the compliance of the municipality with specific matters in key legislation. I
performed procedures to identify findings but not to gather evidence to express assurance.
43. The material findings on compliance with specific matters in key legislation are as follows:
Annual financial statements and annual reports
44. The financial statements submitted for auditing were not prepared in all material respects in accordance with
the requirements of section 122(1) of the MFMA. Material misstatements of non‐current assets, liabilities, and
disclosure items identified by the auditors in the submitted financial statements were subsequently corrected,
but the uncorrected material misstatements and supporting records that could not be provided resulted in the
financial statements receiving a qualified audit opinion.
45. The oversight report adopted by the council on the 2016‐17 annual report was not made public, as required
by section 129(3) of the MFMA.
Expenditure management

23 | P a g e
46. Money owed by the municipality was not always paid within 30 days, as required by section 65(2)(e)of the
MFMA.
47. Reasonable steps were not taken to prevent irregular expenditure, as required by section 62(1)(d) of the
MFMA. The expenditure disclosed does not reflect the full extent of the irregular expenditure incurred as
indicated in the basis for qualification paragraph.
48. Reasonable steps were not taken to prevent fruitless and wasteful expenditure amounting to R7 987 580, as
disclosed in note 42 to the annual financial statements, in contravention of section 62(1)(d) of the MFMA.The
majority of the disclosed fruitless and wasteful expenditure was caused by late payments to suppliers due to
municipal cash flow constraints.
49. Reasonable steps were not taken to prevent unauthorised expenditure amounting to R30 533 375, as
disclosed in note 41 to the annual financial statements, in contravention of section 62(1)(d) of the MFMA. The
majority of the unauthorised expenditure was caused by overspending on a vote.
Revenue management
50. A tariff policy was not adopted for the levying of fees for the provisioning of municipal services, as required
by section 74(1) of the Municipal Systems Act of South Africa, 2000 (Act No. 32 of 2000) (MSA) and section
62(1)(f)(i) of the MFMA.
51. A credit‐control and debt‐collection policy was not adopted, as required by section 96(b) of the MSA and
section 62(1)(f)(iii) of the MFMA.
52. A policy on the levying of rates on rate able property within the municipality was not adopted, as required by
section 3(1) of the Municipal Property Rates Act and section 62(1)(f)(ii) of the MFMA.
53. An adequate management, accounting and information system was not in place to account for revenue,
debtors and receipts of revenue, as required by section 64(2)(e) of the MFMA.
54. An effective system of internal control for debtors and revenue was not in place, as required by section
64(2)(f) of the MFMA.
55. Revenue due to the municipality was not calculated on a monthly basis, as required by section 64(2)(b) of the
MFMA.
56. Accounts for municipal tax and charges for municipal services were not prepared on a monthly basis, as
required by section 64(2)(c) of the MFMA.
Asset management
57. An effective system of internal control for assets (including an asset register) was not in place, as required by
section 63(2)(c) of the MFMA.

24 | P a g e
58. An investment policy adopted by the council was not in place, as required by section 13(2) of the MFMA and
municipal investment regulation 3(1)(a).
Strategic planning and performance management
59. The service delivery and budget implementation plan for the year under review did not include the monthly
operational and capital expenditure by vote, as required by section 1 of the MFMA.
60. The performance management system and related controls were inadequate, as it did not describe how the
performance planning, monitoring, measurement, review, reporting and improvement processes should be
conducted, organised and managed, as required by municipal planning and performance management regulation
7(1).
Procurement and contract management
61. Some goods and services with a transaction value below R200 000 were procured without obtaining the
required price quotations, in contravention of SCM regulation 17(a) and (c). Similar non‐compliance was also
reported in the prior year.
62. Some quotations were accepted from prospective providers who were not on the list of accredited
prospective providers and did not meet the listing requirements prescribed by the SCM policy, in contravention
of SCM regulations 16(a) and 17(b).
63. Goods and services with a transaction value above R200 000 were procured without inviting competitive
bids, as required by SCM regulation 19(a).
64. Sufficient appropriate audit evidence could not be obtained that bid adjudication committees were always
composed in accordance with SCM regulation 29(2). This non‐compliance was identified in the procurement
processes for the upgrade of the Warrenton water treatment plant.
65. Contracts were awarded to bidders who did not submit a declaration on whether they are employed by the
state or connected to any person employed by the state, as required by SCM regulation 13(c). Similar non‐
compliance was also reported in the prior year.
66. Sufficient appropriate audit evidence could not be obtained that contracts were only awarded to providers
whose tax matters had been declared by the South African Revenue Service to be in order, as required by SCM
regulation 43.
67. The preference point system was not applied to the procurement of goods and services above R30 000, as
required by section 2(a) of the Preferential Procurement Policy Framework Act of South Africa, 2000 (Act No. 5 of
2000). Similar non‐compliance was also reported in the prior year.
68. Construction contracts were awarded to contractors that did not qualify for the contract in accordance with
section 18(1) of the Construction Industry Development Board (CIDB) Act of South Africa, 2000 (Act No. 38 of
2000) and CIDB regulations 17 and 25(7A). Similar non‐compliance was also reported in the prior year. This non‐
compliance was identified in the procurement processes for the upgrade of the Warrenton water treatment
plant.

25 | P a g e
69. Bid documentation for the procurement of commodities designated for local content and production did not
stipulate the minimum threshold for local production and content, as required by the 2017 preferential
procurement regulation 8(2). Similar non‐compliance was also reported in the prior year. This non‐compliance
was identified in the procurement processes for the Supply and delivery of electrical materials..
70. Contracts were extended or modified without the approval of a properly delegated official, in contravention
of SCM regulation 5.
71. The performance of contractors or providers was not monitored on a monthly basis, as required by section
116(2)(b) of the MFMA. Similar non‐compliance was also reported in the prior year.
Human resource management
72. Appropriate systems and procedures to monitor, measure and evaluate performance of staff were not
developed and adopted, as required by section 67(1)(d) of the MSA.
73. An approved staff establishment was not in place, as required by section 66(1)(a) of the MSA.
Utilisation of conditional grants
74. Performance in respect of programmes funded by the municipal infrastructure grant was not evaluated, as
required by section 12(5) of Dora.
75. I was unable to obtain sufficient appropriate audit evidence that the integrated national electrification
programme grant (INEP) was spent for its intended purposes in accordance with the applicable grant framework,
as required by section 17(1) of Dora.
76. Performance in respect of programmes funded by the INEP grant was not evaluated, as required by section
12(5) of Dora.
Consequence management
77. Unauthorized expenditure incurred by the municipality was not investigated to determine if any person is
liable for the expenditure, as required by section 32(2)(a) of the MFMA.
78. Irregular expenditure as well as fruitless and wasteful expenditure incurred by the municipality was not
investigated to determine if any person is liable for the expenditure, as required by section 32(2)(b) of the
MFMA.
Other information
79. The accounting officer is responsible for the other information. The other information comprises the
information included in the annual report. The other information does not include the financial statements, the

26 | P a g e
auditor’s report and the selected KPA presented in the annual performance reportthat has been specifically
reported in this auditor’s report.
80. My opinion on the financial statements and findings on the reported performance information and
compliance with legislation do not cover the other information and I do not express an audit opinion or any form
of assurance conclusion thereon.
81. In connection with my audit, my responsibility is to read the other information and, in doing so, consider
whether the other information is materially inconsistent with the financial statements and the selected KPA
presented in the annual performance report, or my knowledge obtained in the audit, or otherwise appears to be
materially misstated.
82. I did not receive the other information prior to the date of this auditor’s report. When I do receive and read
this information, and if I conclude that there is a material misstatement therein, I am required to communicate
the matter to those charged with governance and request that the other information be corrected. If the other
information is not corrected, I may have to retract this auditor’s report and re‐issue an amended report as
appropriate. However, if it is corrected this will not be necessary.
Internal control deficiencies
83. I considered internal control relevant to my audit of the financial statements, reported performance
information and compliance with applicable legislation; however, my objective was not to express any form of
assurance on it. The matters reported below are limited to the significant internal control deficiencies that
resulted in the basis for the qualified opinion, the findings on the annual performance report and the findings on
compliance with legislation included in this report.
84. The leadership did not exercise adequate oversight responsibility regarding financial and performance
reporting and compliance as well as related internal controls. The municipality did not have sufficient monitoring
controls to ensure the proper implementation of the overall process of planning, budgeting, implementation and
reporting. This pertains to the overall performance management systems and processes, annual financial
statements and compliance with laws and regulations.
85. The leadership of the municipality did not take adequate responsibility for establishing and communicating
policies and procedures to enable and support the understanding and execution of internal control objectives,
processes and responsibilities in respect of consequence management.
86. The leadership of the municipality did not adequately develop and monitor the implementation of action
plans to address internal control deficiencies. The municipality developed a plan to address internal and external
audit findings, but the appropriate level of management did not implement and monitor adherence to the plan
in a timely manner. This was due to the audit action plan not having been compiled timeously to address audit
findings in a timely manner. This resulted in repeat findings being identified in the current year audit.
87. The municipality did not implement sufficient proper record keeping in a timely manner to ensure that
complete, relevant and accurate information was accessible and available to support financial and performance
reporting. Furthermore, the municipality did not have a proper filing system to maintain information that

27 | P a g e
supported the reported financial information. This included information that related to the collection, collation,
verification, storing and reporting of actual financial statement items.
88. The municipality did not adequately prepare regular, accurate and complete financial reports that were
supported and evidenced by reliable information. The financial statements contained numerous misstatements
that were corrected. This was mainly due to staff not fully understanding the requirements of the financial
reporting framework.
89. The municipality did not adequately prepare regular, accurate and complete performance reports that were
supported and evidenced by reliable information. The annual performance report contained numerous
misstatements that were corrected. This was mainly due to staff not fully understanding the performance
information requirements.
90. The municipality did not review and monitor compliance with applicable legislation. Furthermore, the
municipality did not have adequate processes in place to identify irregular expenditure. The processes in place
did not detect non‐compliance relating to procurement processes that had not been followed. A significant
amount of irregular expenditure was identified during the audit process that was not disclosed in the financial
statements.
91. The municipality did not design and implement formal controls over information technology systems to
ensure the reliability of the systems and the availability, accuracy and protection of information. Significant
deficiencies with regard to revenue and receivables resulted in material misstatements identified in the current
year audit.
92. The municipality did not implement appropriate risk management activities to ensure that regular risk
assessments, including the consideration of information technology risks and fraud prevention, were conducted
and that a risk strategy to address the risks was developed and monitored. As the municipality did not conduct a
risk assessment, as required by the MFMA, controls were not developed to prevent, detect and correct material
misstatements in financial and performance reporting.
Other reports
93. I draw attention to the following engagements conducted by various parties that had, or could have, an
impact on the matters reported in the municipality’s financial statements, reported performance information,
compliance with applicable legislation and other related matters. These reports did not form part of my opinion
on the financial statements or my findings on the reported performance information or compliance with
legislation.
94. The Directorate for Priority Crime Investigation (Hawks) is investigating allegations of fraud, corruption and
money laundering at the municipality regarding a capital project for the upgrading of new roads in Ikhutseng.
These proceedings were in progress at the date of this report.

28 | P a g e
1.7. STATUTORY ANNUAL REPORT PROCESS
No. Activity Timeframe
1
Consideration of next financial year’s Budget and IDP process plan. Except for the
legislative content, the process plan should confirm in‐year reporting formats to
ensure that reporting and monitoring feeds seamlessly into the Annual Report
process at the end of the Budget/IDP implementation period
July 2
Implementation and monitoring of approved Budget and IDP commences (In‐year
financial reporting).
3 Finalizethe4th quarter Report for previous financial year
4 Submit draft year 2017/2018 Annual Report to Internal Audit and Auditor‐General
5 Audit/Performance committee considers draft Annual Report of municipality and
entities (where relevant)
August
6 Mayor tables the unaudited Annual Report
7 Municipality submits draft Annual Report including consolidated annual financial
statements and performance report to Auditor General
8 Annual Performance Report as submitted to Auditor General to be provided as input
to the IDP Analysis Phase
9 Auditor General audits Annual Report including consolidated Annual Financial
Statements and Performance data September ‐
October
10 Municipalities receive and start to address the Auditor General’s comments
November 11
Mayor tables Annual Report and audited Financial Statements to Council complete
with the Auditor‐ General’s Report
12 Audited Annual Report is made public and representation is invited
13 Oversight Committee assesses Annual Report
14 Council adopts Oversight report
December 15 Oversight report is made public
16 Oversight report is submitted to relevant provincial councils
17 Commencement of draft Budget/ IDP finalization for next financial year. Annual
Report and Oversight Reports to be used as input January
T1.7.1
COMMENTON THE ANNUAL REPORT PROCESS:
It is necessary that the Magareng Local Municipality derive maximum benefit from its efforts in submitting
reports. Such benefits are typically obtained in the form of being able to compare and benchmark against other
municipalities and to learn from the feedback mechanisms.

29 | P a g e
The Annual Report process flow provides a framework for the municipality to follow in completing various
reports within each financial year cycle. It is recommended that Municipal Manager monitor this process flow
and ensure that reports are submitted timeously. If the process flow is followed, the Municipality should be able
to provide an unaudited Annual Report in August of each year, which is consistent with the MFMA.
One of the advantages of compiling an unaudited Annual Report in August is that it can be used to influence the
strategic objectives indicated in the IDP for the next financial year as well as the budgetary requirements related
to each vote.
An unaudited Annual Report is submitted in August will further provide the municipality with an opportunity to
review the functional areas that received attention during the current financial year and take the necessary
corrective actions to align the IDP and budget to other priority areas needing attention.
The Annual Report of a municipality and every municipal entity must be tabled in the Municipal Council on or
before 31 January each year (MFMA S127). In order to enhance oversight functions of the Council, this must be
interpreted as an outer deadline; hence the municipality must submit the Annual Report as soon as possible after
year end, namely, August. The entire process is concluded in the first or second week of December for all
municipalities, the same year in which the financial year ends and not a year later, as is currently the case. It is
expected that effective management of performance will also result from this change.
The Annual Report must be aligned with the planning documents and municipal budget for the year reported on.
This means that the IDP, budget, SDBIP, in‐year reports, annual performance report and Annual Report should
have similar and consistent information to facilitate understanding and to enable the linkage between plans and
actual performance.
The above can only occur if the municipality set appropriate key performance indicators and performance targets
with regards to the development of priorities and objectives in its IDP and outcomes (MSA S41). This requires an
approved budget together with a resolution of approving measurable performance objectives for revenue from
each source and each vote in the budget (MFMA, S24).
T1.7.1.1
CHAPTER 2 – GOVERNANCE
INTRODUCTION TO GOVERNANCE
The Magareng Local Municipality is committed to transparent and accountable governance. The broad range of
public participation programmes and processes, especially related to its IDP; Budget and Annual Report bears
testimony to the district municipality’s commitment to involve its communities in its planning and decision
making processes. All the above programs are administratively supported by the Municipal Manager and Senior
Management.
COMPONENT A: POLITICAL AND ADMINISTRATIVE GOVERNANCE

30 | P a g e
INTRODUCTION TO POLITICAL AND ADMINISTRATIVE GOVERNANCE
The Council of the Magareng Local Municipality is the highest decision‐making authority in the institution. It
guides and instructs the administrative component, which implements the decisions taken by the political
component.
T2.1.0
2.1 POLITICAL GOVERNANCE
INTRODUCTION TO POLITICAL GOVERNANCE
Council has 9 seats. The Mayor, Cllr B Mhaleni is the Political Head of the Municipality.
The following are Portfolio Committees that exist in the Magareng Local Municipality: Community Committee;
Corporate Services Committee; Budget and Treasury Committee; Health and Safety Committee, Training
Committee.
The Magareng Local Municipality has established Municipal Public Accounts Committee (MPAC) which serves as
an Oversight Committee and is comprised by non‐executive councillors and their responsibility is to provide
Council withrecommendations on the Annual Report and other Reports that may be referred to it by
Council.TheMunicipality has an Audit Committee which is a shared service with Frances Baard District
Municipality.
T2.1.1
Mayor/Speaker: B Mhaleni
Provide political guidance over the fiscal and
financial affairs of the municipality
To oversee the preparation of the annual budget
Submit quarterly reports to Council on the
implementation of the budget and the financial
status of the municipality
Coordinate the annual review of the IDP
To ensure that the council Committee is perform
its functions properly
Promotion of intergovernmental relations
Convene public hearings and meetings
Identifies the needs of the community in terms of
the IDP processes.
Reviews those needs in order of priority
Recommend to the municipal council strategies,
programmes and services to address priority

31 | P a g e
needs through the IDP, estimates revenues and
expenditure, taking into account any applicable
National and Provincial Plans
The Speaker presides over the council meetings
and maintains order during council meetings.
Ensure that the council meets at least quarterly.
Ensure that the rules of order are complied with
during the proceedings of council meetings.
Execute any other duties as delegated to the
speaker in terms of the council delegation
systems.
Maintains order during Council meetings
Ensure that Councilors adhere to the Code of
Conduct
Support to Councilors
Facilitate public participation coordinate the
establishment and functionality of ward
committees
Recommend and determine the best way, including
partnership and other approaches, to deliver those
strategies, programmes and services to the maximum
benefit of the community.
Councillor: T Mokola
Councillor: KG Freddie

32 | P a g e
Councillor: D Tshekedi
Councillor: K Zalisa
Councillor Ward 5: W Potgieter
Councillor: J Louw

33 | P a g e
Councillor M Mochane
Councillor: T Cross
COUNCILLORS
Cllr. B.Mhaleni : Proportional Representation
Cllr. T.Mokola : Directly Elected‐Ward 1
Cllr.KG.Freddie: Directly Elected‐Ward 2
Cllr. D.Tshekedi : Directly Elected‐Ward 3
Cllr.K.Zalisa: Directly Elected‐Ward 4
Cllr.W.Potgieter : Directly Elected‐Ward 5
Cllr. J.Louw: Proportional Representation
Cllr. T. Cross : Proportional Representation
Cllr. S.Pietersen : Proportional Representation
T2.1.2
POLITICAL DECISION‐MAKING
All council meetings are run according to the approved Standing Rules of Orders. These set out how the council
meeting should be run, how you can propose motions or pass resolutions and how decisions will be made. The
speaker or chairperson of the council decides whether anyone is breaking the Standing Orders and is responsible
for keeping order.
There is a political decision‐making is done in the following manner:
1. The Corporate Services Department is responsible and ensures that the agendas are preparedin timebefore
meetings and any committee reports, petitions or motions have to appear on an agenda before they can
be discussed and must be received by all Council at least seven (7) days before.
2.When an issue comes up for discussion at a council meeting it is often referred to a committee for further
discussion and a deadline is given for when a report should be made.

34 | P a g e
3. The council will then resolve on the matter. Most council decisions are taken after a committee held its
meeting and recommend to council. When council agrees by a majority resolution, the recommendation
becomes a resolution of council.
Councillorsat any stage put forward motions to call for or propose something emanating from any decision taken
by the administration or council itself. It is a useful tool to use especially if the administration is not co‐operating
with council, since council motions cannot be ignored.
Any Councillor may propose a motion in Council and in some cases the motion may be passed without being
referred for further discussion and once the motion has been passed it becomes a resolution of council.
T2.1.3
POLITICAL DECISION‐MAKING
IMPLEMENTATION OF COUNCIL RESOLUTIONS BY DEPARTMENTS
In 2017/2018Financial Year Council has resolved on ‐‐‐‐‐‐‐‐‐‐resolutions to be implemented.
DEPARTMENTS NO. OF
RESOLUTIONS
FOR 2017/2018[
NO. OF
RESOLUTIONS
IMPLEMENTED
2017/2018
NO. OF
RESOLUTIONS
WORK IN
PROGRESS
2017/2018
NO. OF RESOLUTIONS
NOT IMPLEMENTED
2017/2018& WHY?
1. CORPORATE SERVICES 17 16 01
0
2. TECHNICAL SERVICES ‐
3. COMMUNITY SERVICES ‐
4. BUDGET AND TREASURY ‐
5. MUNICIPAL MANAGER’S OFFICE

35 | P a g e
2.1.1 ADMINISTRATIVE GOVERNANCE
INTRODUCTION TO ADMINISTRATIVE GOVERNANCE
In terms of Part 7 Section 82 of the Municipal Structures Act 117 of 1998 as amended the municipality must
appoint the Municipal Manager who is the head of administration and therefore the Accounting Officer. In terms
of Section 55 of the Municipal Systems Act, 32 of 2000 (as amended) the Municipal Manager as head of
administration is subject to policy directives of the municipal council responsible for the formation and
development of an efficient, economical, effective and accountable administration and must manage the
municipality in accordance with all legislation and policies pertaining to Local Government.
In terms of section 50 of the Municipal Systems Act 32 of 2000 as amended, the Council in consultation with the
Municipal Manager must appoint managers who are directly accountableto theMunicipal Manager who must
have relevant and requisite skills and expertise to perform the duties associated with the posts they each occupy.
The Municipal Manager, MrsMalephoiMoncho is the Accounting Officer of Magareng LocalMunicipality and is
supported by three (3) Head of Departments.The Municipal Manager is also accountable for all the income and
expenditure and all assets as well as the discharge of liabilities of the municipality including proper and diligent
compliance with the Municipal Finance Management Act, 53 of 2003. Senior Managers who reports directly to
the Municipal Manager are delegated the functions which the Municipal Manager may delegate to them and are
responsible for all those matters delegated to them including financial management as well as discipline and
capacitating of officials within their areas of responsibility and compliance to all legislation governing Local
Government, its policies and By‐laws.
The Municipal Manager and Head of Departmentsforms the Senior Management Team and they are all
accountable to the Municipal Manager in terms of strategic management and oversight of their departments. All
budget expenditures in each department are managed by the Head of Departmentsin order to ensure that
service delivery matters are handled promptly.

36 | P a g e
EXECUTIVE STRUCTURE
TOP ADMINISTRATIVE STRUCTURE
Photo Designation Function
Municipal Manager
Ms E Moncho
• Forming and developing an economic,
efficient and accountable administration;
• Implementing and managing the
Municipality's performance management
system;
• Coordinating and implementing the
Municipality's IDP;
• Managing the Municipality's
administration in accordance with the
Constitution, the Local
• Government Structures Act, the
Municipal Systems Act, the Municipal
Finance; Management Act and all other
national and provincial legislation
applicable to the Local Municipality;
• Managing provision of services to the
local community in a sustainable and
equitable Manner;
• Facilitating participation of the local
community in the affairs of the Local
Municipality;
• Developing and maintaining a system to
access community satisfaction with
Municipal Services;
• Appointing, managing, effectively
utilizing and training staff and maintaining
staff discipline;
• Promoting sound labour relations and
compliance by the Municipality with
applicable labour legislation;
• Advising political structures and political
office bearers of the Municipality,
managing communications between
them, administering, implementing
council resolutions and carrying out their
decisions;
• Administering and implementing the

37 | P a g e
Municipality's by‐laws and other
legislation;
• Being responsible for all income and
expenditure of the municipality, all assets,
the discharge of all liabilities of the
Municipality and proper and diligent
compliance with applicable Municipal
Finance Management legislation
Implementing strategic goals of the
Municipality through co‐operation and
innovative.
Chief Financial Officer Ms. M Motswaledi
Reporting directly to the Municipal Manager on key departmental activities. • Overall management of the Budget & Treasury Office/Department. Implement the Integrated Development Plan (IDP) as well as strategic goals of the Budget & Treasury Office/Department. • Develop and implement key strategic / business plans including Supply Chain Management, Revenue Management, Expenditure Management and Budget & Reporting. • Prepare and implement municipal budget. • Prepare Annual Financial Statements and other mandatory financial management reports. • Manage Departmental budget, human resources & other resources in accordance with local government legislation; • Establish, operate and maintain support structures, processes and systems; • Direct and control key deliverables and outcomes for the department; Liaise with internal and external stakeholders; • Facilitate stakeholder participation and involvement; • Ensure legislative, regulatory, policy, practices and operating standards compliance;

38 | P a g e
• Management and monitoring of all income, expenditure, assets and Liabilities; Cash‐flow management; • Ensure implementation of GAMAP & GRAP Standards; • Ensure the development of appropriate Strategies, Policies and plans for all relevant areas in the Department linked to the IDP and that will also have a measurable positive impact on the financial performance; • Develop and implement Supply Chain Management Policy, specific procedures, systems and controls; • Ensure timely preparation of Budget and Financial Statements; Implement all financial policies and ensure they comply with applicable legislation and National Treasury Regulations.
Acting HOD: Technical Service Mr. B Macomo
• To manage the engineering, PMU and Town planning department of the municipality. • Assist the CFO to compile annual projects budgets • To assist the council to draw up and implement annual strategic plans • To ensure compliance to all water service providers • Ensure water and sewer effluent quality compliance to adhere to the Department of Water Affairs (DWA) Blue Drop and Green Drop requirements respectively. • Ensures that all required licensing and permitting of all raw water abstraction and sewer effluent will be done and upheld. • Ensure that Water Service development Plan (WSDP), By‐Laws and tariffs are regularly updated. • Approve technical reports of water, sanitation and roads projects in alignment with respective Municipal IDP’s and Regional provincial Growth and Development Plan. • Ensure that all projects are implemented using the EPWP principles. • Ensures compliance to all legal

39 | P a g e
aspects and conditions, required from different spheres of Government. • Manage all contract administration of all projects implemented by council. • Manage and control the approved budget of engineering department. • Be prepared to serve on the Bid Adjudication Committee or Bid Evaluation Committee as and when required by the Municipal Manager. • Maintain Project Performance data on a National Database.
HOD: Corporate Services
Mrs. D Lentsoe
Managing and controlling various line functions within the Directorate which include general administration, Human Resources, Council Support, Corporate strategy, Information Technology and Communications, and Security Services; • Leading, directing and managing staff within the Department so that they are able to meet their objectives; • Staff control and discipline; • Rendering Support by advising and overseeing all matters of procedures relating to minutes and resolutions of the Council Committees; • Planning, organising, coordinating and controlling the activities of management and administration section; • Providing administrative support to political Office‐bearers; • Managing and controlling the compilation and execution of the departmental capital and operating budget; • Executing any function delegated by the municipal Manager in terms of powers and delegations in the relevant legislation and related to the functions of this post; • Administering records/archives registry, skills development, legal matters and employment Equity;

40 | P a g e
COMPONENT B: INTERGOVERNMENTAL RELATIONS
INTRODUCTION TO CO‐OPERATIVE GOVERNANCE AND INTERGOVERNMENTAL RELATIONS
Chapter (3)three of the Constitution of 1996 is an overarching legislative tool used to guide and provide detailed
pieces of legislation like Municipal Systems Act, section 3, Municipal Structures Act, section 88 and the
Intergovernmental Relations Framework Act, Act 13 of 2005.
The Magareng Local Municipality complied with the above legislative requirements during the annual report
under review to ensure the continuous consultation with relevant stakeholders at the level of Co‐operative
Governance and Intergovernmental Relations (IGR) across the spheres of government to provide basic services to
the community of the district. Sectors do present their developmental projects and programs to IGR meetings for
inclusion in the Integrated Developmental Plan (IDP) of the district. We normally have outreach and service
delivery blitz programs where all sectors would provide services to a particular ward in one of our local
municipality. This is a response to the clarion call of having a developmental local government in South Africa.
However, there are some challenges in this process that need attention to be able to achieve the intended
objective. There is a perception that Intergovernmental Relations and Co‐operative governance is the
responsibility of municipalities alone and not the other two spheres of government. There is lack of commitment
from other sectors.
Inter‐Governmental Relations is the organisation of the relationships between the three spheres of government.
The Constitution states that "the three spheres of government are distinctive, interdependent and interrelated".
Local government is a sphere of government in its own right, and is no longer a function or administrative
implementing arm of national or provincial government. Although the three spheres of government are
autonomous, they exist in a unitary South Africa meaning that they have to work together on decision‐making,
co‐ordinate budgets, policies and activities, particularly for those functions that cut across the spheres.
Co‐operative governance means that the three spheres of government should work together (co‐operate) to
provide citizens with a comprehensive package of services (governance). Local government is represented in the
National Council of the Provinces and other important institutions like the Financial and Fiscal Commission and
the Budget Council. The South African Local Government Association [SALGA] is the official representative of
local government.
SALGA is made up of nine provincial associations. Local Municipalities join their provincial association. Executive
elections and decisions on policies and programmes happen at provincial or national general meetings. SALGA is
also an employers' organisation, and sits as the employer in the South African Local Government Bargaining
Council. SALGA’s main source of funding is membership fees payable by municipalities.There is no
intergovernmental strategy in the municipality

41 | P a g e

42 | P a g e
2.2 INTERGOVERNMENTAL RELATIONS
NATIONAL INTERGOVERNMENTAL STRUCTURES
The notion of Co‐operative Governance and Intergovernmental Relations (IGR) in the country is rapidly evolving
and gradually taking a particular shape and direction. The IGR system must be understood in the context of being
a facilitating and engagement platform of sectors across the three spheres to amongst others ensuring the
implementation of the National Development Plan (NDP), the Provincial Growth and Developmental Strategy
(PGDS) and the District Growth and Development Strategy (DGDS) which includes local municipalities. Our
engagements with national departments like Water and Sanitation, National Treasury, Land and Rural
Development, Monitoring and Evaluation, Public Works on EPWP program and Co‐operative Governance and
Traditional Affairs amongst others and the support they provide despite some challenges.
Intergovernmental Relations is about relations between different governments or between organs of state from
different governments about the conduct of their affairs.At its most basic level, intergovernmental relations is
about the relationships between the three “spheres” of government – national, provincial and local government
– and how these can be made to work together for the good of the country as a whole.
The function of the IGR Forums such as the Mayors Forum as (Political and Policy Directive), Municipal Managers
Forum as a (Technical Implementation Forum) will be established and their function is to:
‐ A consultative forum for the District Municipality, the respective Local Municipalitiesin the area, and the
relevantSector Departments from the North West Provincial Government to discuss and consult each other on
matters of strategic and mutualregional interest, including:
‐ Draft national and provincial policy and legislation, relating to matters affecting local government
interests in the municipal area;
‐ The implementation of national and provincial policy and legislation with respect to such matters in the
municipal Area;
‐ Matters arising in the Premier’s intergovernmental forum affecting the municipal area;
‐ Coherent planning and development in the Municipal Area, focusing on:
‐ Water Services;
‐ Sanitation
‐ Land;
‐ Subsistence farming;
‐ The processing of agricultural products;
‐ Housing; and
‐ Traditional Leaders.
‐ The provision of services in the Magareng Local Municipal Area;
At meetings of the IGR, as municipalities we discuss the implementation of national policy and legislationthat
affect the district and Provincial Government and discuss upcoming national policy and legislation that will affect
the municipality.
The IGR is an ideal forum to discuss progress with regard to service delivery in the municipality as well as the
problems that may impede such progress. Initiatives such as shared services models could also be dealt with at
forum meetings.

43 | P a g e
PROVINCIAL INTERGOVERNMENTAL STRUCTURE
The Magreng Local Municipality as part of the Northern Cape Province does participate in all the provincial
programmes that seek to improve the quality of the life of its area of jurisdiction. The Office of the Premierin the
province does extend invitations for municipalities to attend the Northern Cape Extended IGR.
South African Local Government Association in the Northern Cape that represent the interest of municipalities in
the provision of sustainable services to communities also ensured that it establish the provincial IGR practitioners
forum where all the municipalities in the province meet to chart a way of ensure that IGR and Back to Basics is
implemented. Magareng Local Municipality is fully participating at that level.
RELATIONSHIPS WITH MUNICIPAL ENTITITIES
No municipal entities.
DISTRICT INTERGOVERNMENTAL STRUCTURES
The White Paper on Local Government issued in 1998 expresses the role of the District municipalities as follows:
to build local municipalities where there is no capacity, initiating economic development of the district, planning
land‐use in the district and providing in the basic needs of people living in deprived areas. Number of processes
and structures has been established by law to manage the relations between municipalities exercising
jurisdiction over the same geographical area. First, the relationship should be one of mutual support and
coordination.
The Municipal Structures Act thus obliges district and local municipalities to support one another at the request
of either. The most important aspect of the relationship is probably the drafting of a district‐wide IDP. There are
also a number of structures in place in Frances BaardDistrict Municipality to give effect to the objectives of
mutual support and coordination. The following are IGR structures that we have in the district that are
operational: The local Intergovernmental Relations: According to section 88 of the Municipal Structures Act, Act
117 of 1998, the District Municipality has the responsibility to provide support to its family local municipalities.
The district provides support to locals in jointly convening at least one local IGR forum.

44 | P a g e
COMPONENT C: PUBLIC ACCOUNTABILITY AND PARTICIPATION
OVERVIEW OF PUBLIC ACCOUNTABILITY AND PARTICIPATION
Community participation in local government affairs gives expression to the democratic principles and values of
our Constitution and the political rights of the individual as entrenched in section 19 of the Constitution of the
Republic of South Africa, 1996.
The Municipal Council encourages participation of the community and community organisations in local
government matters and adheres to the democratic values and principles as enshrined in the Constitution of the
Republic of South Africa, 1996 which governs the public administration.
Public participation is a principle that is accepted by all spheres of government in South Africa. Participation is
important to make sure that government addresses the real needs of communities in the most appropriate way.
Public participation also helps to build an informed and responsible citizenry with a sense of ownership of
government developments and projects. It allows municipalities to get buy‐in and to develop partnerships with
stakeholders.
The Municipal Council encourages participation of the community and community organisations in the local
government matters and to adhere to the democratic values and principles as enshrined in the Constitution of
the Republic of South Africa, 1996 which governs the public administration through:
‐ The preparation, implementation and review of the IDP
‐ Establishment, implementation and review of performance management system
‐ Monitoring and review of the performance, including the outcomes and impact of such performance and
preparation of the municipal budget.
2.4 PUBLIC MEETINGS
COMMUNICATION, PARTICIPATION AND FORUMS
Communication is a two‐way process in which there is an exchange of thoughts, opinions, or information by
speech, writing, or symbols towards a mutually accepted goal or outcome. "Purpose of effective
communication is sustaining the on‐going work with maximum efficiency” Communication will help build
good relationships with team members, sponsors, and other key stakeholders, to increase the likelihood of
project or any activity success.
The Council also responds to the people‘s needs and encourage the public to participate in policy‐making
through IDP Representative Forums.
The Council fosters transparency by providing the public with timely, accessible and accurate information by
publishing information in the local newspapers, using three predominant official languages of Setswana,

45 | P a g e
Afrikaans and English. The municipality also make use of newspapers to communicate. The Municipal Council
also engages the community through consultation in matters such as the IDP, budget, performance
management, provision of services etc.
A key part of the municipality’s annual plans should be how to communicate all this to the people and how to
involve them in decisions or as partners. The municipality does not have public participation policy and
communication policy but we have drafts in place of the two policies.
The Frances Baard District Municipality has established the Communication Forum and Magareng Local
Municipality is part of the Communication Forum. Our current communication initiatives are the district
external newsletters issued yearly and other means of communication available.
WARD COMMITTEES
Legislation allows that Ward Committee be established in each ward of the local municipality. The purpose is to
assist and advise Ward Councillors on matters relating to service delivery and the improvement of public
participation.
Ward Committees are mainly advisory committees which can make recommendations on any matter affecting
the ward within a municipality. It is thus the responsibility of the ward councillors to present the views or reports
of ward committee to council for implementation purposes. The Municipal Council formulates the rules that
guide Ward Committee Members, how often should meetings be held and the circumstances under which a
member of a Ward Committee can be removed.
The purpose of a Ward Committee is to:
‐ Facilitate participatory democracy amongst community members.
‐ Ensure the dissemination of information or effective communication between the council and the
members of community.
‐ Help rebuild better partnership for better service delivery.
‐ Advise the ward councillor on service delivery and developmental projects in the community.
Structure of Ward Committee:
A Ward Committee consists of a Ward Councillor as elected in the local government elections and a maximum of
not more than 10 people from the Ward who are elected by the community they serve. The Councillor is the
Chairperson of the Ward Committee. Members of the Ward Committee must participate as volunteers and are
only getting stipends depending on the affordability of the municipality.

46 | P a g e
MUNICIPALITY NUMBER OF WARDS
Magareng Local Muncioality 5

47 | P a g e
MAGARENG LOCAL MUNICIPALITY IDP COMMUNITY PRIORITY LIST 2017‐2018.
1. Water and Sanitation
2. Roads
3. Unemployment
4. Education/FET
5. Housing
6. Land Development
7. Parks and Recreation
8. Library
9. Electricity
10. Safety
11. Health and Environment
12. Sports Facilities
13. Youth Development
14. Local Economic Development
15. Hospital
16. High Mast Light

48 | P a g e
17. Orphanage Homes
18. Arts and Culture
19. Agriculture
COMMENT ON THE EFFECTIVENESS OF THE PUBLIC MEETINGS HELD:
Participation is one of the cornerstones of our democracy and has equal benefits for politicians, officials and civil
society:
1. Consultation will help council make more appropriate decisions based on the real needs of people.
2. The more informed people are, the better they will understand what government is trying to do and what the budget and resource limitations are.
3. Councillors can only claim to be accountable if they have regular interactions with the people they represent
and ifthey consult and report back on key council decisions.
4. Government cannot address all the development needs on its own and partnerships are needed with communities, civil society and business to improve service deliveryand development.
2.5 IDP PARTICIPATION AND ALIGNMENT
IDP Participation and Alignment Criteria* Yes/No
Does the municipality have impact, outcome, input, output indicators?
Yes
Does the IDP have priorities, objectives, KPIs, development strategies?
Yes
Does the IDP have multi‐year targets?
Yes
Are the above aligned and can they calculate into a score?
Yes
Does the budget align directly to the KPIs in the strategic plan?
Yes
Do the IDP KPIs align to the Section 56 Managers
Yes
Do the IDP KPIs lead to functional area KPIs as per the SDBIP?
Yes
Yes

49 | P a g e
Do the IDP KPIs align with the provincial KPIs on the 12 Outcomes
Were the indicators communicated to the public?
Yes
Were the four quarter aligned reports submitted within stipulated time frames?
Yes
* Section 26 Municipal Systems Act 2000 T2.5.1
COMPONENT D: CORPORATE GOVERNANCE
OVERVIEW OF CORPORATE GOVERNANCE
Cooperative governance is the set of processes, practices, policies, laws and stakeholder affecting the way an
institution is directed, administered or controlled. Corporate Governance also includes the relationship among
the many stakeholders involved and the goals for the institution is governed and is also governed by King II & III
Code of Practice applicable to local government sphere.
2.6 RISK MANAGEMENT
RISK MANAGEMENT
Risk Governance
Magareng Local Municipality has shared service for Risk Management in terms of the Local Government:
Municipal Finance Management Act 56 of 2003 with Frances Baard District Municipality.
2.7 ANTI‐CORRUPTION AND FRAUD
FRAUD AND ANTI‐CORRUPTION STRATEGY
The provisions of Section 62(1) (a)(i) of the Municipal Finance Management Act stipulates thatthe Accounting Officer is responsible for ensuring that the Municipality has and maintains effective,efficient and transparent system of financial and risk management and internal control.
Furthermore, sections 3.2.1 and 27.2.1 of the Treasury Regulations require that risk assessment isconducted on regular basis and a risk management strategy, which includes a fraud prevention plan be used to direct internal audit effort. Magareng Local Municipality does not have Fraud Prevention Policy.

50 | P a g e
2.8 SUPPLY CHAIN MANAGEMENT
OVERVIEW SUPPLY CHAIN MANAGEMENT
The Magareng Local Municipality has SCM Unit that is functional and is in Budget and Treasury Directorate. The SCM Policy was approved by Council in 2018. A dedicated official was appointed. Three (3) committees are in place namely, Bid Specifications Committee (BSC), Bid Evaluation Committee (BEC) and Bid Adjudication Committees (BAC). Training of SCM Committees roles and responsibilities on the legislation, regulations and policy was not done.
T2.8.1
2.9 BY‐LAWS
2.10 WEBSITES
Municipal Website: Content and Currency of Material
Documents published on the Municipality's / Entity's Website Yes / No
Publishing Date
Current annual and adjustments budgets and all budget‐related documents No
All current budget‐related policies No
The previous annual report (2016‐2017) No
The annual report (2017‐2018) published/to be published Yes ‐
All current performance agreements required in terms of section 57(1)(b) of the Municipal Systems Act (2018‐2019) and resulting scorecards
Yes
15 July 2018
All service delivery agreements (2018‐2019) No
All long‐term borrowing contracts (2017‐2018) No
All supply chain management contracts above a prescribed value (give value) for (2017‐2018)
Yes
An information statement containing a list of assets over a prescribed value that have been disposed of in terms of section 14 (2) or (4) during Year 1
No
Contracts agreed in (2017‐2018) to which subsection (1) of section 33 apply, subject to subsection (3) of that section
No
By‐laws Introduced during 2017/2018
Newly Developed Revised Public Participation
Conducted Prior to
Adoption of By‐Laws
(Yes/No)
Dates of Public
Participation
By‐Laws
Gazetted*
(Yes/No)
Date of
Publication
None None None None None None
COMMENT ON BY‐LAWS: The Magareng Local Municipality did not embark on initiation of new By‐laws. This municipality will start with the process of reviewing and developing new By‐law. Community will be invited for comments/submissions and conducting meetings and workshops with officials representing Local Municipalities.

51 | P a g e
Public‐private partnership agreements referred to in section 120 made in (2017‐2018)
No
All quarterly reports tabled in the council in terms of section 52 (d) of MFMA 56 0F 2003 during (2017‐2018)Financial Year
Yes ‐
COMMENT MUNICIPAL WEBSITE CONTENT AND ACCESS:
A municipal website is an integral part of a municipality’s communication infrastracture and strategy. It serves as
a tool for community participation, improves stakeholder involvelvement and facilitate stakeholders monitoring
and evaluation of municipal peformance. Section 75 of the MFMA that the municipality place key documents and
information on their website, including the IDP, the annual budget, adjustments budget and budget related
documents and policies.
The Magareng Local Municipality’s Website is up and running and all our internal and external stakeholders have
access to it and is visited periodically.The only challenge is that the website is not updated on a regurlar basis.
2.11 PUBLIC SATISFACTION ON MUNICIPAL SERVICES
PUBLIC SATISFACTION LEVELS
The benefits the municipality derives from involving community members‐ are that decisions about the
operation of a municipal are made locally by members of the community, at open, public meetings. Because all
decisions are made locally, this municipal is uniquely able to respond to the community's needs, build on the
community's strengths, and reflect and advance the community's values. It is a challenge to satisfy every citizen
in this district municipal area. These are as a result of limited budget in all municipalities in the district. The needs
of communities are huge to such an extent that municipalities are unable to meet the demands on time.
Satisfaction Surveys Undertaken during: 2017‐2018
Subject matter of survey Survey method Survey date No. of people included in survey
Survey results indicating
satisfaction or better (%)*
Overall satisfaction with: Not conducted Not conducted Not conducted Not conducted
(a) Municipality
(b) Municipal Service Delivery
(c) Mayor
Satisfaction with: Not conducted Not conducted Not conducted Not conducted
(a) Refuse Collection
(b) Road Maintenance
(c) Electricity Supply

52 | P a g e
Concerning T 2.11.2:
No survey was planned and conducted in the 2017/2018 financial year due to the financial constraints. The
municipality plan to conduct the survey in future.
COMMENT ON SATISFACTION LEVELS:
No survey was planned and conducted in the 2017/2018 financial year due to the financial constraints.
.
2.12 INTERNAL AUDIT
Section 165 of the MFMA requires that each municipality must have an internal audit unit; however such
function may be outsourced.
The municipality’s internal audit function will need to be continuously involved in auditing the performance
reports of services and the corporate score cards. As required by the regulations, they will be required to
produce an audit report on a quarterly basis, to be submitted to the Municipal Manager and Audit Committee. If
required, the capacity of the internal audit unit will need to be improved beyond the auditing of financial
information.
The role of the Audit Committee will be to assess:
• The functionality of the municipality’s performance management system
• The adherence of the system to the Municipal Systems Act
• The extent to which performance measurements are reliable
Comments: Internal Audit is a shared service with Frances Baard District Municipality
2.13Audit Committee
The MFMA and the Municipal Planning and Performance Management Regulations require that the municipal
council establish an audit committee consisting of a minimum of three members, where the majority of
members are not employees of the municipality. No Councillor may be a member of an audit committee. Council
shall also appoint a chairperson who is not an employee.
Legislation provides municipalities with the option of establishing a separate performance audit committee.
However, the policy proposes only one audit committee regarding the financial and performance management
matters of the municipality.
(d) Water Supply
(e) Information supplied by municipality to the public
(f) Opportunities for consultation on municipal affairs

53 | P a g e
Legislation further requires the performance audit committee to:
• Review the quarterly reports submitted to it by the internal audit unit
• Review the municipality's performance management system and make recommendations in this regard
to the municipal council.
• Assess whether the performance indicators are sufficient
• At least twice during a financial year submit an audit report to the municipal council
In order to fulfil their function a Performance Audit Committee may, according to the MFMA and the
Regulations,
• Communicate directly with the council, municipal manager or the internal and external auditors of the municipality concerned • Access any municipal records containing information that is needed to perform its duties or exercise its powers • Request any relevant person to attend any of its meetings, and, if necessary, to provide information requested by the committee and • Investigate any matter it deems necessary for the performance of its duties and the exercise of its powers. Comments Audit Committee is a shared service with Frances Baard District Municipality.
CHAPTER 3 – SERVICE DELIVERY PERFORMANCE (PERFORMANCE REPORT PART I)
INTRODUCTION
The Magareng Local Municipality, as a Water Service Authority, is focusing all its efforts on provision of water
and sanitation as one of the key service delivery objectives in its five local municipalities. All services delivered to
the communities form part of the IDP indicators which are aligned with the budget allocated to the District
Municipality. The District Municipality is obliged, according to Section 41 of the Municipal System Act (No. 32 of
2000), to monitor and report on the performance (including Water Service Providers) against set objectives and
targets as indicated in its Integrated Development Plan (IDP).
Warrenton The distribution of water in Warrenton is done through a network of pipes with diameters from 50 mm to 160 mm. The pipes are mainly manufactured of asbes‐cement and PVC. Ring feeds were incorporated in the layout. All the developed erven are equipped with a metered connection. The water‐meters are monthly read and itemised bills are provided monthly to each consumer. Approximately 40 % of the network in Warrenton is in operation for more than 40 years but now the municipality is in a planning the of upgrading the aged infrastructure. This hamper the water service authority to provide an effective service and water are lost through leaking pipes. It is one of the main priorities of the municipality to upgrade the internal water

54 | P a g e
reticulation network in the older areas of Warrenton.
Ikhutseng
Water distribution in Ikhutseng is done with one 150 mm diameter pipe. Through this pipe water is pumped from a 5, 2 Ml reservoir to an elevated press steel tank. Utilising the distribution network water is pumped to a second elevated press steel tank. This operating methodology provides the following difficulties, viz., the supply to the area is limited to the capacity of the supply pipe, 150 mm diameter and the associated electrical driven pumps.
The distribution of water to individual sites in Ikhutseng is done through a network of pipes with diameters from 50 mm to 200 mm. The pipes are mainly manufactured of PVC because the network is relatively new. Ring feeds are incorporated in the distribution. All erven on the approved plan are equipped or can be provided with a metered water connection. The water‐meters are monthly read and itemised bills are provided monthly to each consumer. Approximately 250 households in Rabaadjie and 150 in Warrenvale have only access to communal taps. A number of unauthorised and unmetered or bypassed water connections where present in the area. With funds from the Municipal Support Programme a house‐to‐house survey was conducted and problem areas were identified. The municipality has put in place a programme of remedying the situation. This will assist to improve the income base of the municipality and reduce the amount of water unaccounted for.
Warrenvale
The distribution of water in Warrenvale is done through a network of pipes with diameters from 50 mm to 160 mm. Ring feeds with asbes‐cement and PVC pipes were incorporated in the network. All erven on the layout plan are or can be provided with a metered water connection. The meters are read each month and itemised bills are provided to each consumer.The 200 mm diameter connector pipe to Warrenvale is in a good condition. The capacity of the supply meets the current demand. Depending on the time frames for the provision of additional houses, the capacity of the electrical driven pumps, which supply water to an elevated tank, must be increased. Rural Areas The Frances Baard District Municipality before the amalgamation process provided electricity, water infrastructure and VIP toilets as well as hygiene awareness training to communities living in the rural areas. Arrangements were made with the farmers whereby the District Municipality provided infrastructure to the farm workers and the farmers had to maintain these services. Contracts were signed with these farmers. Presently, the municipality is responsible for maintaining the water pumps at Nazareth, Moleko’s farm, Sydney’s Hope, Majeng and Windsorton Station. Bull Hill and Hartsvallei depend on the farmers to maintain the infrastructure. Moleko’s farm needs to be provided with clean drinking water.
Bulk Infrastructure Supply: Water service Water for the urban node is abstracted from the Vaalharts irrigation canal and Vaal River that runs along the western boundary of Warrenton. The municipality has a permit to abstract 3572 Ml of raw water annually from both water sources. No groundwater is used to supplement the preset source. Water‐meters were installed and are maintained by the Department of Water Affairs and Forestry to monitor the consumption of the municipality at both abstraction points. The raw water abstracted from the canal is flowing under gravity to a sump at the purification plant. During the down time of this feeder line, raw water is pump with electrical driven borehole pumps from the Vaal River to the raw water sump.

55 | P a g e
The water purification plant was constructed in 1998 on the western side of the Vaal River, north of the N18 road. The capacity of the plant is 350 Kl/h. raw water is abstracted from both sources and gravitates or is pumped to the sump at the purification plant. From the sump the water is pumped to the DCP from where it gravitates through the sedimentation pond, sand filters to the 0,8 Ml balancing reservoir. All the back wash water from the plant gravitates to a sludge dam. After sedimentation the water is pumped back to the raw water sump.
From the reservoir at the purification plant purified water is gravitating through a 500 mm diameter 1 300 m long
siphon pipe through the Vaal River to a sump at the main water pump station. The main water pump station is
equipped with two sets of electrical driven pumps and a water‐meter of the municipality. One set of pumps
supplies purified water to an elevated reservoir in Warrenton. From this reservoir the water is distributed to the
town.
The second set of pumps supply water to an elevated storage tank near to Warrenton railway station, a 5, 2 Ml concrete reservoir near Ikhutseng as well as a 4, 5 Ml concrete reservoir near Warrenvale and the industrial area. The combined pumping capacity of the pumps is 350 Ml/hour. From the 4, 5 Ml concrete reservoir water is pumped with two electrical driven pumps to an elevated press steel tank.
COMPONENT A: BASIC SERVICES
This component includes: water; waste water (sanitation); electricity; waste management; and housing services;
and a summary of free basic services.
INTRODUCTION TO BASIC SERVICES
The Magareng Local Municipality Area comprises of Five Wards with a population figure of 24 064 according to
2011 census and its wards include the following:
Ward 1
Ward 2
Ward 3
Ward 4
Ward 5
T3.1.0
3.1 WATER PROVISION
Introduction to Water Provision
Warrenton The distribution of water in Warrenton is done through a network of pipes with diameters from 50 mm to 160 mm. The pipes are mainly manufactured of asbestos‐cement and PVC. Ring feeds were incorporated in the layout. All the developed erven are equipped with a metered connection. The water‐meters are monthly read and itemized bills are provided monthly to each consumer. Approximately 40 % of the network in Warrenton is in operation for more than 40 years but now the municipality is in a planning the of upgrading the aged infrastructure. This hamper the water service authority to provide an effective service and water are lost

56 | P a g e
through leaking pipes. It is one of the main priorities of the municipality to upgrade the internal water reticulation network in the older areas of Warrenton.
COMMENT ON WATER USE BY SECTOR:
The implementation of Water Services Implementation Grant WSIG) and Municipal Infrastructure Grant (MIG) is
toexpand the water Treatment Plant in the municipality. The existing water infrastructure is aging. The
municipality is implementing two massive water projects to address the water problems in the municipal area.

57 | P a g e
COMMENT ON WATER SERVICES PERFORMANCE OVERALL:
Generally, the performance on delivery of bulk water infrastructure is partially achieved through the large‐scale
WSIG and MIG projects currently under construction.
3.2 WASTE WATER (SANITATION) PROVISION
INTRODUCTION TO SANITATION PROVISION The sewer outfall works is situated in the centre of the urban node. Due to the relatively flat topography, all sewerage must be pumped to the outfall works. The outfall works is 12 years old and was designed to treat 2 Ml/day of raw sewerage. The treated effluent of the sewer outfall works drains via a natural watercourse through sections of Warrenton to the Vaal River. The quality of treated effluent is still good, although the present rate of inflow is 2, 4 Ml/ day. Extensions to the sewer outfall works is thus essential and it is proposed that a new plant be erected to accommodate both future demand but also to reduce the negative impact of the present locality of the plant on future developments. Warrenton town is serviced by either septic tanks or French drains. These systems require that the municipality empty these tanks on a regular basis. The effluent from these septic tanks is transported by tanker to the sewer outfall works. All sewage from Warrenvale drains to a single sewer pump station that pumps the sewage to the sewer outfall works. A small sewer pump station receives the sewage from the southern areas of Ikhutseng and then pumps it into one of the main gravity sewer lines. All the sewage of Ikhutseng then drains to a single pump station that pumps the sewage to the sewer outfall works. Groundwater contamination is presently experience with the septic and French drains operational in Warrenton. Urgent attention will therefore have to be paid to ensure that the drinking water is not affected so the septic tanks will have to be replaced to curb the problem.
Currently only indigent residents of Magareng excluding farming areas receive 6kl of water free and Majeng area is getting water from the borehole and jojotanks.The Municipality has requested for funding to erect solar panel water pumps to the farming areas.
Sanitation Project Description 2017/2018
New sewer network for 1298 low
cost housing in Warrenton
Sewer reticulation Continue
COMMENT ON SANITATION SERVICES PERFORMANCE OVERALL:
The Municipality is doing everything possible with its limited budget to address the delivery of services to the
people and such performance is hindered by lack of budget and as a result service delivery to is compromised.

58 | P a g e
3.3 ELECTRICITY
INTRODUCTION TO ELECTRICITY
Eskom supplies 11kv bulk supply to a substation situated in Warrenton. From there the 11kv supply is distributed to 11kv transformers which steps it down to 380V networks in Warrenton CBD, Warrenton residential, Warrenvale and the surrounding plots. Supply in Warrenvale is by means of prepaid metering system and Warrenton CBD and residential is by means of credit meters. Some residences in Warrenton have also changed to pre‐paid system. Municipality is planning to review to policy to standardize the electricity metering system. Moleko’s farm gets the bulk supply from Eskom and the municipality distributes it by means of a pre‐paid system. The following areas get both the bulk and low tension supply directly from Eskom: Ikhutseng, Bull Hill, Sydney’s Hope and Hartsvalley. Windsorton station and Majeng have not yet been electrified. Windsorton station previously was supplied by Transnet. Transnet gets the bulk 11kv supply from the municipality and further distribute this to their own transformers and networks. The electrical network also is very old therefore needs to be upgraded. Only indigents beneficiaries are receiving 50 kW of electricity free both the residents’ services by Eskom and municipality as service providers. Internal Reticulation The municipality is responsible for electricity distribution to Warrenton, Warrenvale and Moleko’s farm. The municipality is planning to upgrade existing and construct the electricity new mainline for the new developments as well as its electrification. Cost needed. Backlogs in Electricity Supply Most of the backlogs in electrical supply relates to the rural areas not yet serviced by Eskom as well as problem of ageing infrastructure.
Electricity Project Description 2017/2018
Refurbishment of Electricity
Infrastructure in Warrenton
Change of the electrical
infrastructure in Warrenton and
Warrenvale
Continue
COMMENT ON ELECTRICITY SEVICES PERFORMANCE OVERALL
100% of Magareng residents recieves electricity. Eskom supply Ikhutseng community with electricity.
3.4 WASTE MANAGEMENT (THIS SECTION TO INCLUDE: REFUSE COLLECTIONS, WASTE DISPOSAL)
CORE ISSUES
DUMPING AREAS:
Many people dump waste on open areas. The reasons offered is the lack of waste bins and the irregular service
currently received from the municipality. Building material, in particular, gets dumped everywhere as people
are not having access to transport to remove these materials.
Waste collection not done regularly: The municipality has two heavy vehicles that need to service the urban node, one is not working and the other one is still operational.

59 | P a g e
Poor management of dumping sites:
The municipality does not have sufficient equipment to properly maintain the dumping sites in the area. This lead to pollution as waste gets blown away from the dumping area.
No recycling: There are presently no recycling initiatives in place. This can create some job opportunities for people taking initiative. However, recycling depots or buy‐back centres are not based locally and this hampers initiative.
Development Outcomes, Objectives, Strategies and Outputs
This development programme aim to achieve a clean and healthy environment. The following development outcomes have been formulated:
Outcome desiredClean and healthy environment
The following development objectives, strategies and outputs have been formulated:
Objective Strategies Outputs
Proper waste management
Reduce illegal dumping
Provide bulk containers at strategic locations and
plastic bags to residents
Raise awareness
Implement by‐laws
Expand and improve waste removal
service
Improve internal capacity and equipment
Expand waste collection service to new areas
Improve management of dumping
sites
Review and implement integrated solid waste waste
management plan
Upgrade equipment
Well maintained dumping site
Introduce recycling of waste Awareness campaigns implemented on recycling of
waste

60 | P a g e
Objective Strategies Outputs
Buy‐back centres established like food for waste
Develop policy on recycling
HOUSING DEVELOPMENT
INTRODUCTION TO HOUSING
Housing is a provincial function, not performed by the Magareng Local Municipality.
COMMENT ON THE PERFORMANCE OF THE HOUSING SERVICE OVERALL:
Not function of the Magareng Local Municipality
COMMENT ON FREE BASIC SERVICES AND INDIGENT SUPPORT:
The Magareng Local Municipality continue to provide free basic services to the community on a regular basis.
Indigent register is updated and a resident who which qualifies receives free basic services from the
municipality.
COMPONENT B:ROAD TRANSPORT
This component includes: roads; transport; and waste water (storm water drainage).
INTRODUCTION TO ROAD TRANSPORT
The Magareng Local Municipality is unable to fulfil its mandate on road transport due to lack of funding. With
the assistance of funds from other spheres of government i.e Frances Baard District Municipality and
Department of Public Works the municipality is continuously maintaining all its existing tar roads for adequate
access and improvement. Magareng Local Municipality has the Integrated Transport Plan (ITP), the plan has
been prepared by the Frances Baard District Municipality.
COMMENT ON THE PERFORMANCE OF ROADS OVERALL:
Roads are deteriorating in Magareng Local Muncipality and the municipality cannot fund roads projects due to
budget constraints.
T3.7.10

61 | P a g e
COMPONENT C: PLANNING AND DEVELOPMENT
This component includes: planning; and local economic development.
INTRODUCTION TO PLANNING AND DEVELOPMENT
The Planning and Development functions was established in 2012, when the then Department of Provincial and
Local Government (DPLG) initiated a national support system,Planning Implementation Management Supports
Systems (PIMSS), to assist municipalities with their strategic planning, management support, and development
of IDPs and implementation of the Performance Management Systems. While the support system was to be
provided to all municipalities, it was then felt that the main beneficiaries of such a system would obviously be
less capacitated and smaller, local municipalities. However this function is not a standalone function in the
municipality‐it has been integrated in other Departments.
3.10 PLANNING& DEVELOPMENT
INTRODUCTION TO PLANNING& DEVELOPMENT
The role of Planning and Development Department is to provide strategic management support to all the
Departments within the municipality. It is also responsible for the development of the Integrated Development
Plan (IDP) and implementation of Performance Management System (PMS), Strategic Planning, Facilitation, and
also by proving support to local municipalities and further ensure that there is effective inter‐governmental
relations.
Planning and Development Department is responsibility is to ensure that there is efficient and effective
compliance with legislation such as Integrated Development Plan (IDP), Public Participation, Performance
Management System (PMS) and other applicable laws.
The top 3 service delivery priorities and the impact made during the year are outlined underneath together
with the measures taken to improve performance and the major efficiencies achieved by the Department
during the year:
1. Integrated Development Planning
The IDP Unit is responsible for ensuring compliance with implementation of Chapter 5 of the Systems Act,
especially compliance with Section 25 by identifying with the key deliverables and immediate goals detailed in
the Council’s IDP in respect of communication, investment, tourism and agricultural dimensions of local
economic development.

62 | P a g e
5. Performance Management System
The PMS Unit is responsible for the implementation of PMS in line with the Municipal Systems Act (MSA) 2000
which requires municipalities to establish a Performance Management System (PMS), the Municipal Finance
Management Act (MFMA) which requires that the IDP to be aligned to the municipal budget and to be
monitored for the performance of the budget against the IDP via the Service Delivery and the Budget
Implementation Plan (SDBIP).
6. Governance
The Department is also charged with the responsibility to ensure that there is effective governance processes in
the municipality. It has also been instrumental in ensuring that the Council performs its oversight
responsibilities and functions by ensuring that the MPAC is functional in terms of Section 79 of the Structures
Act and the MFMA Guideline on Establishment of MPACs.
The following were achieved during the financial year:
‐ The Mayor approved the SDBIP by the 27 June 2017.
‐ The Municipal Manager and Section 56 Manager signed their Performance Agreements by the 31st July
2017.
‐ All Quarterly Reviews Sessions were held and the Quarterly Reports were done as required during
financial year.
‐ The PMS Framework was adopted by Council.
‐
‐ The 2016/2017 Annual Reports and Oversight Report were tabled during the financial year and
submitted to all the stakeholders i.e. Auditor‐General, Provincial and National Treasuries.
‐ The Annual Performance Evaluation of the Municipal Manager and Section 57 for the year under
review were not done.
T 3.10.1
COMMENT ON THE PERFORMANCE OF PLANNING& DEVELOPMENT OVERALL:
The priority for the institution is to effectively implement the automated performance management system to
ensure that it is cascaded to the lower levels.
T 3.10.7

63 | P a g e
3.11 LOCAL ECONOMIC DEVELOPMENT (INCLUDING TOURISM AND MARKET PLACES)
INTRODUCTION TO LOCAL ECONOMIC DEVELOPMENT
Local Economic Development (LED) is an outcome: It is a continuous development process basedon
local initiatives and driven by local stakeholders. It involves identifying and using local resources and
skills to stimulate economic growth and development. Source: “Northern Cape Local Economic
Development Manual(NCLEDM).
LED is about communities continually improving their investment climate and business enabling
environment to enhance their competitiveness, retain jobs and improve incomes.Local communities
respond to their LED needs in many ways, and a variety of approaches can be taken thatinclude:
Ensuringthatthelocalinvestmentclimateisfunctionalforlocalbusinesses;
Supporting small and medium sizedenterprises;
Encouraging the formation of newenterprises;
Attractingexternalinvestment(nationallyandinternationally);
Investing in physical (hard)infrastructure;
Investing in soft infrastructure (educational and workforce development,
institutional support systems and regulatoryissues);
Supporting the growth of particular clusters ofbusinesses;
The Magareng Local Municipality is considered an agricultural hub within the province and as a result, special
attention is given to promoting agricultural initiatives and ensure value chain benefits by the sector. While it is
acknowledged that agriculture is one of the main sectors contributing effectively to the province’s GDP, the
district has ensured equitable focus on other sectors of the economy. Tourism for instance, is one area that has
extreme potential for development and promotion. Equally so, other sectors of the economy including but not
limited to trade, small businesses, cooperatives, etc. remain to be substantially harnessed for job creating
opportunities. Focused attention has been towards supporting agricultural initiatives since they not only create
significant job opportunities BUT also contribute towards human day to day livelihood. To date, a total of 269
emerging and established agricultural SMMEs and Cooperatives were provided with various interventions from
skills development, market access to funding (livestock water infrastructure).
The anticipated establishment of the Agriparksin the district has seen some progress with the sites’
identification process undertaken and the Master Plan completed and duly adopted for implementation.
Among some of the overall objectives of the Agriparks is to ensure that processing facilities, warehousing and

64 | P a g e
distribution of raw material produced are directly linked with the production areas supporting small holder
farmers, communities as well as emerging black farmers. Support will focus mainly in enhancing production,
farm infrastructure, extension services, production inputs as well as mechanisation inputs. Thus far, sites have
been identified through local municipalities and Service Providers for Infrastructure Development, EIA studies
and Feasibility Studies regarding the establishment of the Agri‐Hubs on identified sites are appointed and
currently working on producing expected reports to guide implementation.
3.12 LOCAL ECONOMIC DEVELOPMENT STRATEGY
The Local Economic Development Unit is in the process of developing an LED Strategy for Magareng Local
Municipality; the objective being to:
I. Crystallize the Local Economic Vision;
II. Identify our competitive advantage
III. Create value chain in our leading Economic Sectors;
IV. Have implementable LED Programmes and Projects with clear outcomes;
LED Pillar Application
Pillar Description Activity Opportunity
Building Diverse Economic Base
Sectorial Development, Local economic development, Locall industrial development, Industrial cluster development.
Agri Parks, Agriculture and Agro processing, Small scale Mining and Transport. Support to SMMEs
Fresh produce cluster – Agro processing Transport node with Linkages
Developing learning and skillful economy
Developing an entrepreneurial culture, Developing leadership andmanagement skills
Entrepreneurial Development and Training.
SMME workshops and training, LED capacity building.
Developing InclusiveEconomies
Township economic development, EPWP Informal economy support
Community services and Rural Development, Township revitalisation programs.
EPWP programs, Develop informal economystrategy.
Enterprise SMMEs and Cooperatives, Retail and SMMEs. SMME development and
SMME support and development policy
Magareng Local Municipality played an active role in supporting and developing local SMME’s including
Informal Businesses because these entities play a pivotal role in employment creation, improving household
income and poverty reduction.

65 | P a g e
Investment incentives policy
Investment Incentives Policy Framework aims to inform and guide the provision of incentives for job creating
investment within the Magareng Local Municipality. For any municipal administration, the question of how to
design a comprehensive incentives strategy must be located within both a global and local context. For
Magareng, the local context demands that the administration performs a careful balancing act. Whilst
incentives packages can play a role in encouraging investment that is critical for driving economic growth and
job creation, Magareng local municipality must also be cognizant of the revenue implications to address its
other strategic policy priorities and service delivery.
COMMENT ON LOCAL JOB OPPORTUNITIES:
As indicated above, the department continued its intensified effort in the 2017/2018 financial year towards
capacity development including skills enhancement of existing and emerging small businesses across sectors
(farmers, traders, entrepreneurs in general, etc.). This approach and its success was made possible through
strategic partnerships the municipality entered into with relevant agencies and other government departments.
The youth in the continue to be the most beneficiaries of these interventions including emerging
entrepreneurs whose applications for funding received favourable outcomes. Most existing and emerging job
opportunities were as a result sustained through these interventions.
COMMENT ON LOCAL ECONOMIC DEVELOPMENT PERFORMANCEOVERALL:
Magareng Local Municipality established LED Forum and the forum is functional. Magareng adopted the LED
strategy in 2017/2018 financial year.
COMPONENT E: ENVIRONMENTAL PROTECTION
This component includes: pollution control; biodiversity and landscape; and climate change.
INTRODUCTION TO ENVIRONMENTAL PROTECTION
Section 24 of the Constitution provides that everyone has the right to an environment that is not harmful to
their health or well‐being and to have the environment protected, for the benefit of present and future
generations, through reasonable legislative and other measures that:
prevent pollution and ecological degradation;
promote conservation; and
Secure ecologically sustainable development and use of natural resources while promoting
justifiable economic and social development.
There are a number of regulation, policies, acts and treaties that are meant at the protection, preservation

66 | P a g e
and conservation of our natural resources. Below is the summary of the legislative framework of the state.
The National Environmental Management Act, No. 107 of 1998 (NEMA) came into operation in January
1999. It is the flagship environmental statute of South Africa. NEMA’s primary purpose is to provide for co‐
operative environmental governance by establishing principles for decision‐making on all matters affecting
the environment. NEMA also establishes procedures and institutions that will promote public participation
in environmental management.
The National Water Act, No. 36 of 1998 (‘the National Water Act’) recognises that water is a natural
resource that belongs to all people. The National Water Act regulates the manner in which persons obtain
the right to use water and provides for just and equitable utilisation of water resources. Sustainability and
equity are identified as central guiding principles in the protection, use and management of water
resources. These guiding principles recognise:
The basic human needs of present and future generations;
The need to protect water resources;
The need to share some water resources with other countries; and
The need to promote social and economic development through the use of water.
The National Environmental Management: Waste Act, No. 59 of 2008 (‘Waste Act’) was enacted to reform
the law regulating waste management and to govern waste management activities. The 127 | P a g e Waste
Act has repealed and replaced those sections of the Environment Conservation Act that dealt with the
prevention of littering and waste management. The Act creates a general duty in respect of waste
management obliging holders of waste to minimise waste, recycle and dispose of waste in an
environmentally sound manner. Holders must also prevent any employees from contravening the Waste Act
The National Environmental Management: Biodiversity Act, No. 10 of 2004 provides for the management
and conservation of South Africa’s biodiversity, the protection of threatened and protected species and
ecosystems, the sustainable use of indigenous biological resources and the fair and equitable sharing of
benefits arising out of the bio‐prospecting of those resources.
The Air Quality Act regulates air quality in order to protect the environment. It provides reasonable
measures for the prevention of pollution and ecological degradation and for securing ecologically
sustainable development while promoting justifiable economic and social development. The Act further
provides for national norms and standards regulating air quality monitoring, management and control by all
spheres of government. It also provides for specific air quality measures.

67 | P a g e
COMPONENT F: HEALTH
This component includes: clinics; ambulance services; and health inspections.
INTRODUCTION TO HEALTH
Health is a state of complete physical, mental and social well‐ being and not merely the absence of disease or
infirmity.Environmental Health – is the branch of Public Health that is concerned with all aspects of the Natural
and built Environmental that may affect human Health.
3.19 HEALTH INSPECTION; FOOD AND ABBATOIR LICENSING AND INSPECTION; ETC
INTRODUCTIONTO HEALTH INSPECTIONS; FOOD AND ABATTOIR LICENCING AND INSPECTIONS, ETC
Section 24 of the SA constitution 1996 states that; everyone has the right‐ to an environment that is not
harmful to their health or well‐being.The Foodstuffs, Cosmetics and Disinfectant Act No. 54 of 1972; provides
for the control of sales, manufacture and importation of foodstuffs, cosmetics and disinfectants; and to provide
for incidental matters.
The Meat safety Act No. 40 0f 2000; provides for measures to promote meat safety and the safety of animal
products, to establish and maintain essential standards in respect of abattoirs; to regulate the importation and
exportation of meat; to establish meat safety schemes and to provide for matters connected therewith.The
Business Act No. 71 of 1991; provides for the repeal or amendment of certain laws regarding the licensing and
carrying on of businesses and shop hours; to make certain new provision regarding such licensing and carrying
on of business and to provide for matters connected therewith.Regulations defining the scope of profession of
Environmental Health as amended, R. 698 of 26 June 2009. The Scope of Practice of Environmental Health
Practitioners, define Environmental Health Services as including the performance of the following acts:
1. Water Quality Monitoring
2. Food Control
3. Waste Management and General Hygiene Monitoring
4. Health Surveillance of Premises
5. Surveillance and Prevention of Communicable Diseases; excluding immunization
6. Vector Control Monitoring
7. Environmental Pollution Control
8. Disposal of the Dead
9. Chemical Safety
10. Noise Control
11. Radiation (ionising and non‐ionising) Monitoring and Control

68 | P a g e
SERVICE STATISTICS FOR HEALTH INSPECTION, Etc

69 | P a g e
COMPONENT G: SECURITY AND SAFETY
This component includes: police; fire; disaster management, licensing and control of animals, and control of
public nuisances, etc.
INTRODUCTION TO SECURITY & SAFETY
The Frances Baard District Municipality is responsible for the Disaster Management and Fire‐Fighting in the
district.
3.21 FIRE
INTRODUCTION TO FIRE SERVICES
The District Municipality is responsible for provision of fire‐fighting service throughout the District in terms of
Section 84(1) j of the Municipal Structures Act, (Act 117 of 1998).
“The District Municipality is, inter alia, responsible for provision of fire‐fighting services serving the area of the
district municipality as a whole, which include:
• Planning, co‐ordination and regulating fire services
• Specialised firefighting services such as mountain, veld and chemical fire services
• Co‐ordination of the standardisation of infrastructure, vehicles, equipment and procedures
• Training fire officers”
Fire Fighting Service ‐ Local Municipality Function
The District Municipality is also responsible for provision of fire‐fighting service to local municipalities in terms
of the adjustment by the of Section 84 (2) of the Municipal Structures Act, (Act 117 of 1998)The Act further
describes the local function as:
• Preventing the outbreak or spread of a fire
• Fighting or extinguishing a fire
• The protection of life or property against a fire or other threatening danger
• The rescue of life or property from a fire or other danger”

70 | P a g e
COMMENT ON THE PERFORMANCE OF FIRESERVICES OVERALL:
Fire services are the function of Frances Baard District Municipality.
COMMENT ON THE PERFORMANCE OF DISASTER MANAGEMENT:
Frances Baard District Municipality is custodian of disaster management as the district municipality. During
2017/2018 financial year Magareng did not experience any disaster.
COMPONENT H: SPORT AND RECREATION
This component includes: community parks; sports fields; sports halls; stadiums; swimming pools; and camp
sites.
INTRODUCTION TO SPORT AND RECREATION
The main of sport and recreation is to integrate local sport and recreation activities in the MagarengLocal
Municipality, to transfer sustainable skills to the local sports people through development programmes. The
ultimate is to ensure that all sporting codes are managed effectively and efficiently and running well in the local
municipality
COMMENT ON THE PERFORMANCE OFSPORT AND RECREATION OVERALL:
The municipality has no capital project budget for Sports and Recreation. There is no amount is allocated from
operational budget of the municipality. This is as a result of municipal powers and functions. Sport is not a core
function of the municipality‐ it is the core function of Department of Sports. The municipality is just providing a
supportive role to communities on certain sporting codes.
COMPONENT I: CORPORATE POLICY OFFICES AND OTHER SERVICES
This component includes: corporate policy offices, financial services, human resource services, ICT services,
property services.
INTRODUCTION TO CORPORATE POLICY OFFICES, Etc
A Municipal Council must, within the municipality’s financial and administrative capacity and having regard for
practical considerations,

71 | P a g e
• exercise the municipality’s legislative authority and use the resources of the municipality in the best interests
of the community;
• provide, without favour or prejudice, democratic and accountable government;
• encourage the involvement of the community;
• strive to ensure that municipal services are provided to the community in a financially and environmentally
sustainable manner;
• consult the community about the level, quality, range and impact of municipal services and the available
options for service delivery;
• give members of the community equitable access to the municipal services to which they are entitled;
• promote and undertake development in the municipality;
• promote gender equity in the exercise of the municipality’s legislative authority;
• promote a safe and healthy environment in the municipality; and
• contribute, together with other organs of state, to the progressive realisation of the fundamental rights
contained in sections 24, 25, 26, 27 and 29 of the Constitution.
3.24 COUNCIL
This component includes: (Mayor; Councilors; and Municipal Manager).
INTRODUCTION TO COUNCIL
The top political office consists of the Offices of Mayor/Speaker. This political management cluster is led by the
Mayor. The Municipal Manager is responsible for the administration wing of the municipality. The Annual
Budget was also approved thirty days before the end of the Financial Year.
COMMENT ON THE PERFORMANCE OF THE COUNCIL:
Working relationship between council and the administration is healthy and stable.
.
3.25 FINANCIAL SERVICES
INTRODUCTION FINANCIAL SERVICES
The financial management of the municipality is coordinated under the Budget and Treasury Office as
established in terms of S80 of the MFMA. The responsibilities for the municipal coffers including financial
management, financial planning, financial accounting and supply chain management are placed within the
Budget and Treasury Office. The staff complement within the BTO is twenty people, headed by the Chief
Financial Officer. The vacancy rate of the budget and treasury office increased from one vacant position to four
during the financial year based on the newly reviewed organisational structure. Two resignations and one
promotion contributed to the increased in the vacancy rate.
The Budget and Treasury Office is divided into two performance units, namely Income, Budgeting and
Expenditure Management Unit and the Supply Chain and Reporting Unit. These units are further divided into

72 | P a g e
four sections (Income and Budgeting section, Supply Chain and Asset Management section, Payroll section and
Expenditure Management section). These performance arrangements were agreed upon during a strategic
planning session which was held by the Budget and Treasury Office during the financial year. The department
has gone through the year ensuring that the reporting requirements of the National and Provincial Treasury are
timeously done, and that general compliance with the Municipal Finance Management Act is achieved.
3.26 CORPORATE SERVICES
INTRODUCTION TO CORPORATE SERVICES
The Corporate Services Department has developed the Human Resources Strategy which will assist the
employees of the Magareng Local Municipality to perform better by sending them to different trainings and
short courses as stated in the Workplace Skills Plan.
COMMENT ON THE PERFORMANCE OFCORPORATE SERVICES OVERALL:
The main purpose of the Corporate Services Department is to render support services to key line departments
with regard to human resources; administration and records management, legal & security services, ICT
services and training & development.
T3.26.7
3.27 INFORMATION AND COMMUNICATION TECHNOLOGY (ICT) SERVICES
This component includes: Information and Communication Technology (ICT) services.
INTRODUCTION TO INFORMATION AND COMMUNICATION TECHNOLOGY (ICT) SERVICES
Key to the strategic nature of ICT in the Magareng Local municipality is the enabling of the municipal key
objectives of the municipality in order to meet its constitutional obligations. Municipal ICT enable the
achievement of these obligations by deploying relevant information technology solutions
Municipal ICT Unit intend to:
Services that are currently provided by the district municipality to locals are as follows.
• Collaborator Systems: records management system.
• TGIS: Geographical Information System
• IT Support Services

73 | P a g e
• Internet and email access (not all locals)
• To assist by addressing Auditor General IT findings
COMMENT ON THE PERFORMANCE OFICT SERVICESOVERALL:
Addressed at Corporate Services Overall Performance.
3.28 LEGAL SERVICES
This component includes: property; legal; risk management and procurement services.
INTRODUCTION TO LEGAL SERVICES
The aim of Legal Services is to provide proper legal services, including legal advice, legal opinion and contract
management to Council and management of Magareng Local Municipality.
Priorities for Legal Services are as follows:
i. To provide legal advice and legal opinion
ii. To ensure that policies are in place and complied with
iv. Management of contract
v. Liaise with outside firm of attorneys
COMMENT ON THE PERFORMANCE OFLEGAL SERVICES UNIT:
The priorities for Legal Services are to implement the following:
i. To provide legal advice and legal opinion
ii. To ensure that policies are in place and complied with
iii. Assist in labour related matters including representing the District Municipality at Bargaining Council
iv. Management of contract
v. Liaise with outside firm of attorneys.
3.28.1 RISK MANAGEMENT
INTRODUCTION TO RISK MANAGEMENT
In terms of Sections 62(1) (c) (i) and 95(c) (i) of the MFMA, Accounting officers, and other officials within the
organisation, should ensure that they have effective, efficient and transparent systems of financial and risk
management and internal control. In order to assist officials in discharging certain of their risk management
responsibilities, the Risk Management Unit embarked on a process to facilitate the identification and rating of
business risks.

74 | P a g e
COMMENT ON THE PERFORMANCE OF RISK MANAGEMENT SERVICES OVERALL:
There were no specific capital projects for the 2017‐2018. Risk management is shared service with the district
municipality.
3.28.2 MINIMUM INFORMATION SECURITY
INTRODUCTION TO MINIMUM SECURITY STANDARDS
It is the responsibility of any institution to ensure that its employees, information and properties are safely
secured or protected. Magareng Local Municipality as a government institution must comply with all
legislations governing security issues such as MISS. The purpose is to provide a safe and secure working
environment.
SERVICE STATISTICS FOR MINIMUM SECURITY STANDARDS
1.Access control is a process in which several measures are applied to ensure that any person entering and
leaving the premises has a bona fide reason to enter and does not commit any security breaches during the
stay period. In order to achive this we have strengthen the security by creating one entrance and exit.
2.Counter espionage information that is sensitive which is in the national interest must be protected from
unlawful disclosure.Awareness campaigns were not conducted with the State Security Agency in order to
educate officials with regard to safeguarding of information.
3.Security clearance and Vetting it is the process undertaken in order to determine security competence of an
individual‐ the challenge is that not all officials comply with the act to undergo the vetting process.
4. There is no CCTV cameras in the municipality
5. Biometrics system has not been installed in order to monitor and regulate working hours of employees

75 | P a g e
COMMENT ON THE PERFORMANCE OF MINIMUM SECURITY STANDARD SERVICES OVERALL:
There were no security project in the 2017/2018 financial year and security of the municipality remains a
concern.
T 3.28.7.2
3.28.3 PROCUREMENT SERVICES
INTRODUCTION TO PROCUREMENT SERVICES
Delete Directive note once comment is completed– Provide brief introductory comments. Set out priorities and
the impact you have had on them during the year. Explain the measures taken to improve performance and the
major efficiencies achieved by Property, legal, risk management and procurement services during the year.

76 | P a g e
Procurement Services Policy Objectives Taken From IDP Service Objectives
Outline Service Targets
2014/2015 2015/2016 2016/2017 2017/2018
Target Actual Target Actual Target
Service Indicators
*Previous Year
*Previous Year *Current Year
*Current Year *Current Year *Following Year
(i) (ii) (iii) (iv) (v) (vi) (vii) (viii) (ix) (x)
Service Objective xxx
Included in the
financial
services
Included in
the
financial
services
Included in
the financial
services
Included in
the
financial
services
Included in
the financial
services
Included in
the financial
services
Included in
the financial
services
Included in
the financial
services
Included in the
financial
services
Included in the
financial
services

77 | P a g e
Financial Performance 2017/2018: Procurement Services R'000
Details
2016/2017 2017/2018
Actual Original Budget
Adjustment Budget
Actual Variance to Budget
Total Operational Revenue
Included in the financial services
Included in the
financial
services
Included in the
financial
services
Included in
the financial
services
Included in
the financial
services
Expenditure:
Employees %
Repairs and Maintenance %
Other %
Total Operational Expenditure %
Net Operational Expenditure %
Net expenditure to be consistent with summary T 5.1.2 in Chapter 5. Variances are calculated by dividing the difference between the Actual and Original Budget by the Actual. T 3.28.5.3

78 | P a g e
Capital Expenditure 2017/2018: Procurement Services
R' 000
Capital Projects
2017/2018
Budget Adjustment Budget
Actual Expenditure
Variance from original
budget
Total Project Value
Total All
Included in the financial
services
Included in
the financial
services
Included in
the financial
services
Included in
the financial
services
Included in
the financial
services
Project A %
Project B %
Project C %
Project D %
Total project value represents the estimated cost of the project on approval by council (including past and future expenditure as appropriate.
COMMENT ON THE PERFORMANCE OF PROCUREMENT SERVICES OVERALL:
Delete Directive note once comment is completed– Explain the priority of the four largest capital projects and
explain the variations from budget for net operating and capital expenditure. Confirm your year 5 targets set
out in the IDP schedule can be attained within approved budget provision and if not then state how you intend
to rectify the matter. Explain the priority of the four largest capital projects and explain variances from budget
for net operating and capital expenditure. Also explain any likely variation to the total approved project value
(arising from year 0 and/or previous year actuals, or expected future variations).
COMPONENT J: MISCELLANEOUS
This component includes: the provision of Airports, Abattoirs, Municipal Courts and Forestry as municipal
enterprises.
INTRODUCTION TO MISCELLANEOUS
Currently Magareng LocalMunicipality don’t have airports, municipal courts, forestry but only abattoirs.

79 | P a g e
COMPONENT K: ORGANISATIONAL PERFOMANCE SCORECARD
DEPARTMENTAL SCORECARDS
ANNUAL PERFORMANCE REPORT 2017/2018
KPA 1: INSTITUTIONAL TRANSFORMATION AND ORGANIZATIONAL DEVELOPMENT
KEY PERFORMANCE AREA KEY PERFORMANCE
INDICATORS (KPI's)
Baseline Annual Measure Verification Budget Annual Target Annual
Outcome
Corporate Goal Corporate Objective 30/06/2017 2017/18 Unit PoE 2017/18 2017/18 Reason for Variance
Corrective Measure
Sub‐KPA 1.1 Provide file and
archiving services
Number of reports on the
registry and archiving function
4
4
Number of reports Quarterly Reports
received
Operational
4
4
‐
‐
Sub‐KPA 1.2 Provide Occupational
Health and Safety
Number of meetings of the
OHS Committee held
4
4
Number of meeting held Minutes Operational
4
4
‐
‐
Sub‐KPA 1.3: Human Resource
Development
Number of Recruitment and
Selection Reports
2
2
Percentage compliance Recruitment and
Selection Reports
Operational
2
2
‐
‐
Submission of WSP(LGSETA)
1
1
Percentage compliance Quarterly reports Operational
1
1
‐
‐
Sub‐KPA 1.4: Information
Communication Technology. ICT
Number of ICT reports
4
4
Number of ICT reports Number of ICT reports Operational
4
4
‐
‐
Sub‐KPA 1.5. support to council Number of council committee
sitting
4
16
Quarterly committee
and council meetings
Minutes of council
committees
Operational
16
13
Non sitting of
committee
meeting
Directorate will make sure
all meetings sit in the
2018/2019 financial year
Number of Ordinary Council Number of meetings Minutes Operational

80 | P a g e
meetings per year 4 4 held 4 4 ‐ ‐
Sub KPA 1.6 Provide Customer
Care Services
Reports on customer care
1
4
Number of Reports Quarterly Reports Operational
4
4
‐
‐
Sub KPA 1.7.Performance
Management system
Reports on performance
management system
4
4
Number of quarterly
performance reports
Quarterly reports Operational
4
4
‐
‐
Sub KPA 1.8 Compliance with
employment equity Act
Reports on employment
equity
1
1
Report submitted to
Department of Labour
Submission of the
report
Operational
1
1
‐
‐
Institutional transformation and organizational development have 9 sub key performance areas
Key performance indicators are 10
9 targets were achieved
1 target was not achieved
8
10
9
1
Number of KPA
Number of KPIs
Target Achieved
Target not Achieved

81 | P a g e
KPA 2: BASIC SERVICE DELIVERY AND INFRASTRUCTURE DEVELOPMENT
KEY PERFORMANCE AREA KEY PERFORMANCE INDICATORS
(KPI's)
Baseline Annual Target Measure Verification Budget Annual Target Annual Outcome
Corporate Goal Corporate Objective 30/06/2017 2017/18 Unit PoE 2017/18 2017/18 Reason for Variance
Corrective Measure
Sub‐KPA 2.1Provide Water and
Sanitation
Upgrading Water treatment plant
in Warrenton
10% Expenditure
100% Expenditure
Percentage Expenditure Status reports 14 758 050 100% Expenditure
34% Expenditure
Only the
District Funded
the proj with
5mil.
Solicit funding from
DWS.
Water Supply in Warrenton 50.06% 100% expenditure Percentage Expenditure Status Report 11 027 939.57 100% Expenditure 90.46%
Expenditure
4.2 mil was
withheld by
National
Treasury due to
lack of progress
Improve on Pre‐
Planning to negate
regress
Sewer Reticulation at the station
area
100% Expenditure on
a phase one
100%
Expenditure
Percentage expenditure
on sewer reticulation
Status reports
1000 000
100% Expenditure
64.87%
Expenditure
Incorretly
budgeted for
the KPI
Municipality to
spend EPWP funds
strictly on EPWP
activities
Supply and delivery of water and
sanitation materials
4
4
Number of supplies
received
Delivery reports
400 000
4
0
Service
provider’s
contract was
terminated
The KPI has been
removed in the
2018/2019 SDBIP
due to similarities
of the KPIs with
revamping of water
and sanitation
pumps
Revamping of water and sanitation
pumps
4
4
Number of supplies
received
Delivery reports
400 000
4
13
Overachieveme
nt, target was
exceeded by
more 7 supplies
due to
emergency

82 | P a g e
Basic services delivery and infrastructure development have 2 sub key performance areas
Key performance indicators were 7
2 targets were achieved
5 targets were not achieved
2
7
2
5
Number of KPAs
Number of KPIs
Target Achieved
Target not Achieved
Sub‐KPA 2.2 Electricity supply Refurbishment of existing
electricity infrastructure
Complexion of phase 2 100% Expenditure Percentage on progress Status reports 15 000 000 100%
Expenditure
13.35% Expenditure Treasury
withheld 10mil
due to no
progress and
Contractor
failed to
complete 5 mill
The municipality
will start the
procurement
processes of the
tender early
Supply and delivery of electricity
materials
4
4
Number of supplies
received
Delivery reports
400 000
4
10
Overachieveme
nt, target was
exceeded by 5
more electrical
supply due to
emergency
‐

83 | P a g e
KPA 3. COMMUNITY SERVICES
KEY PERFORMANCE AREA KEY PERFORMANCE
INDICATORS (KPI's)
Baseline Annual Measure Verification Budget
Annual Target Annual Outcome
Corporate Goal Corporate Objective 30/06/2017 2017/18 Unit PoE 2017/18 2017/18 Reason for Variance Corrective Measure
Sub‐KPA 3.1 LED
Number of entity registrations in
leading and emerging Economic
Sectors
4
4
Number of entity registered
Entity Certificates
Operational
4
9
target exceeded
‐
Number of sector development
workshops to be conducted in
2017/18
2
2
No of workshops conducted
Quarterly reports
Operational
2
2
‐
‐
Reports of LED initiatives
4
4
Functional LED projects
Quarterly Reports
Operational
4
4
‐
‐
Economic Stakeholders
engagement through LED Forum
1
4
Number of reports Quarterly reports
Operational
4
9
Target was exceeded
‐
Sub KPA 3.2Tourism
Reports of Tourism initiatives
12
8
Functional LED projects
Monthly Reports
Operational
8
5
Two initiatives
targets set on the
first quarter was not
achieved, only taget
out of two was
achieved in the
fourth quarter
LED Unit to achieve
their tourism targets
in the 2018/2019
financial year
Sub‐KPA 3.3 Parks and Recreation Number of reports on Parks and
recreation
12
12
Number of reports Monthly Reports
Operational
12
12
‐
‐
Sub KPA 3.4 Traffic Services Number of reports on Traffic Number of reports Reports ‐

84 | P a g e
management services 12 12 Operational 12 12 ‐
Community services has 4 sub key performance areas
Key performance indicators were 7
5 targets were achieved
2 targets were not achieved
4
7
5
2
Number of KPAs
Number of KPIs
Target Achieved
Target not Achieved

85 | P a g e
KPA 4‐GOOD GOVERNANCE AND PUBLIC PARTICIPATION
KEY PERFORMANCE AREA KEY PERFORMANCE INDICATORS
(KPI's)
Baseline Annual Target Measure Verification Budget Annual Target Annual Outcome
Corporate Goal Corporate Objective 30/06/2017 2017/18 Unit PoE 2017/18 2017/18 Reason for Variance
Corrective Measure
Sub KPA:4.1
Broaden/deepen local
democracy
Promote Community participation
4
4
Imbizos& ward based
meetings
Attendance register
& minutes
‐
4
4
‐
‐
Number of initiatives on special
programmes
4
4
No of gender &senior
citizen programmes
Attendance register
&programme
‐
4
4
‐
‐
Number of functional ward
committees
4
15
Number of meetings Minutes and
attendance register
‐
15
15
‐
‐
Sub KPA: 4.2 Good
governance
Number of oversight reports
2
4
No of oversights
reports
MPAC reports ‐
4
1
Non sitting of
the Oversight
meetings
Mayor’s office to
convene all the
oversight meetings in
the 2018/2019 financial
year
Sub KPA: 4.3 Promote
institutional governance
and Performance
Management
Number of quarterly performance
reviews
New
4 feedback sessions
conducted by June
2017
Quarterly performance
report
Reports
‐
4
4
‐
‐

86 | P a g e
Good governance and public participation has 3 sub key performance areas
Key performance indicators are 5
4 targets are achieved
1 target is not achieved
3
5
7
2
Number of KPAs
Number of KPIs
Target Achieved
Target not Achieved

87 | P a g e
KPA 5‐MUNICIPAL FINANCIAL VIABILITY AND MANAGEMENT
KEY PERFORMANCE AREA KEY PERFORMANCE INDICATORS
(KPI's)
Baseline Annual Target Measure Verification Budget Annual Target Annual Outcome
Corporate Goal Corporate Objective 30/06/2017 2017/18 Unit PoE 2017/18 2017/18 Reason for Variance
Corrective Measure
Sub‐KPA:
Timeous submission of the 2016/2017
Annual financial Statements to the
Office of the Auditor General
Submitted 2016/17
AFS
31 August 2017
AFS 2015/16 AFS signed off by
the Office of the AG
R1 200 0 00
Submission by
31 August 2017
AFS was submitted
by the 31 August
2017
‐
‐
Number of Section 71 (MBS) Reports
submitted to treasury on time
12
12
Number of reports submitted by due date
Copies of reports
signed off by the
Mayor
Operational
12
12
‐
‐
Number of Section 52 Reports
submitted to treasury on time
4
4
Number of reports submitted by due date
Copies of reports
signed off by the
Mayor
Operational
4
4
‐
‐
Section 72 Report submitted to
treasury on time
1
1
Report submitted by
due date
Copy of a report
signed off by the
Mayor
Operational
1
1
‐
‐
Timeous adoption of the Adjustment
Budget of 2017/2018 Approved by
Council
2016/17 Adjustment
budget approved
Adjustment budget completed by January 2018
Performance review
and adjustment budget
Copy of budget and
council resolution
Operational
Adjustment
budget
completed by
January 2018
Adjustment was
Approved by
January 2018
‐
‐
Percentage compliance with the
legislative requirements for a sound
supply chain management system
12
12
% of compliance Status report
Operational
12
12
‐
‐
Percentage expenditure on the annual 100% 100% % of compliance Monthly/ Quarterly R140 294 646 100% 41.09% Cash flow Collect 60% of the

88 | P a g e
Municipal financial viability and management sub key performance areas is 1
Key performance indicators were 10
8 targets were achieved
2 targets were not achieved
1
10
8
2
Number of KPAs
Number of KPIs
Achieved Target
Target not Achieved
budget reports problems revenue
Percentage (%) collection of revenue
achieved by the end of the financial
year
50%
60%
% of collection
Cash Flow
indicating increase
Operational
60%
29.38%
Variance of ‐
30.62% due to non
collection of
revenue
Enhance the revenue
collection
Timeous adoption of the 2018/19
Municipal Budget
2017/18 Budget was
adopted on time
2018/2019 Budget Approval by 31 May 2018
Approved
b11111111udget
2018/19
Council resolutions
Operational
2018/2019
Budget Approval
by 31 May 2018
Budget was
adopted by
council on the
31 May 2018
‐
‐
Number of reports on Asset
management
4 4 No. of reports Quarterly reports Operational
4
4
‐
‐

89 | P a g e
ANNUAL PERFORMANCE REPORT SCORES 2017/18
Scores
1. Institutional Transformation and Organisational Development
KPIs for 2017/18 were
KPI Achieved KPI Not Achieved
10 9 1
2. Basic Service Delivery and Infrastructure Development
KPIs for 2017/18 were
7
4
3
3. Community Services
KPIs for 2017/18 were
7
5
2
4. Good Governance and Public Participation
KPIs for 2017/18 were 5 4
1
5. Financial Viability
KPIs for 2017/18 were 10 8
2
Total 39 28 11

90 | P a g e
CHAPTER 4 – ORGANISATIONAL DEVELOPMENT PERFORMANCE
(PERFORMANCE REPORT PART II)
INTRODUCTION
The Magareng Local Municipality has at the end of the 2017/2018 financial year had a total workforce of 165
including 20 temporary workers and 5 Interns. Vacant positions cannot be filled all at once due to budget
constraints, the municipality filled positions that were prioritized and funded.
COMPONENT A: INTRODUCTION TO THE MUNICIPAL PERSONNEL
Employees
Description
2016/2017 2017/2018
Employees Approved Posts
Employees Vacancies Vacancies
No. No. No. No. %
Water 17 22 17 5
Waste Water (Sanitation) 10 19 10 9
Electricity 5 8 5 3
Waste Management 27 42 27 15
Housing 1 6 1 5
Waste Water (Storm‐water Drainage) ‐ ‐ ‐ ‐
Roads 2 2
Transport ‐ ‐ ‐ ‐
Economic Development 2 3 2 1
Planning and Development (Strategic & Regulatory)
Community & Social Services – Fire and Disaster N/A N/A N/A N/A N/A
Environmental Health N/A N/A N/A N/A N/A
Security and Safety 15 26 13 11
Sport and Recreation 3 8 8 0
Corporate Services 15 24 14 8
Budget and Treasury 35 41 32 6
Executive Support N/A N/A N/A N/A N/A
Internal Audit 0 0 0 0 0
Totals

91 | P a g e
Headings follow the order of services as set out in chapter 3. Service totals should equate to those included in the Chapter 3 employee schedules. Employee and Approved Posts numbers are as at 30 June, as per the approved organogram.
Vacancy Rate: 2017/ 2018
Designations *Total Approved Posts
*Vacancies (Total time that vacancies exist using fulltime equivalents)
*Vacancies (as a proportion of total posts in each
category)
No. No. %
Municipal Manager 1 0 0.00
CFO 1 0 0
Other S56 Managers (excluding Finance Posts) 3 2
Other S56 Managers (Finance posts) N/A N/A 0
Fire fighters N/A N/A 0
Management: Levels 0 – 3 (excluding Finance Posts) 10 10 ‐
Senior management: Levels 13‐15 (Finance posts) 4 4 ‐
Highly skilled supervision: levels 9‐12 (excluding Finance posts) ‐ ‐ 0
Highly skilled supervision: levels 9‐12 (Finance posts) ‐ ‐ 0
Total
Note: *For posts which are established and funded in the approved budget or adjustments budget (where changes in employee provision have been made). Full‐time equivalents are calculated by taking the total number of working days lost (excluding weekends and public holidays) while a post remains vacant and adding together all such days lost by all posts within the same set (e.g. ‘senior management’) then dividing that total by 250 to give the number of posts equivalent to the accumulated days.
Turn‐ over Rate
Details Total Appointment as of beginning of financial year
No.
Termination during the financial year
No.
Turn‐ over Rate
No.
2016/17 165 2
2017/18 165 3
Divide the number of employees who have left the organisation within a year by total number of employees who occupied posts at the beginning of the year.

92 | P a g e
COMPONENT B: MANAGING THE MUNICIPAL WORKFORCE
INTRODUCTION TO MUNICIPAL WORKFORCE MANAGEMENT
The Municipality has reviewed 3 policies which are explained to the workforce as and when are adopted by
Council or reviewed periodically. The workforce through the Local Labour Forum, as an important stakeholder,
in the development of such policies are properly consulted on all matters of mutual interest. The departments,
units and the organisation in general holding continuous staff meeting in order to create a platform for the staff
to air their views in matters of mutual interest
4.2 POLICIES
HR Policies and Plans
No.
Name of Policy Completed Reviewed
Date adopted by council or comment on failure to adopt
% %
1 Ethics Policy 0 0 The municipality does not have ethics policy
2 Fraud Prevention Policy 100 100 30 June 2018
3 Whistle Blowing Policy 0 0 The municipality does not have whistle blowing policy
4 Risk Management Committee Charter 100 100 30 June 2018
5 Risk Management Strategy 0 0 Shared Service with FBDM
6 Asset Management Policy 100 100 The municipality does not have Contingent Liability and Contingent Asset Policy
7 SCM Policy 100 100 The municipality does not have expenditure management policy
8 Telephone Policy 100 100 The municipality does not have telephone policy
9 Notebooks and Mobile Computing Policy100
100 Awaiting Council’s approval in the next meeting
10 Leave and Overtime Policy 100 100 Awaiting Council’s approval in the next meeting

93 | P a g e
11 Recruitment and Selection Policy 100 100 Awaiting Council’s approval in the next meeting
12 Information Technology (IT) Policy 100 100 30 June 2018
13 Information Technology (ICT Disaster Recovery Plan)
0 0 Awaiting Council’s approval in the next meeting
14 IT Corporate Governance Policy Framework 100 100 Awaiting Council’s approval in the next meeting
4.3 INJURIES, SICKNESS AND SUSPENSIONS
Number and Cost of Injuries on Duty
Type of injury Injury Leave Taken
Employees using injury
leave
Proportion employees using sick leave
Average Injury
Leave per employee
Total Estimated
Cost
Days No. % Days R'000
Required basic medical attention only
15 1 0 0 0
Temporary total disablement N/A 0 0 0 0
Permanent disablement N/A 0 0 0 0
Fatal N/A 0 0 0 0
Total 15 1 0 0 0
Number of days and Cost of Sick Leave (excluding injuries on duty)
Salary band
Total sick leave
Proportion of sick leave
without medical
certification
Employees using sick leave
Total employees in post*
*Average sick leave
per Employees
Estimated cost
Days % No. No. Days R' 000
Interns and temporary employees
0 0 150 3
Lower skilled (Levels 11‐12)
Skilled (Levels 8‐10)
Highly skilled supervision (levels 4‐7)
Management (Levels 0 – 3)

94 | P a g e
MM and S57 4
Total 165
* ‐ Number of employees in post at the beginning of the year
T 4.3.2 *Average is calculated by taking sick leave in column 2 divided by total employees in column 5
Disciplinary Action Taken on Cases of Financial Misconduct
Position Nature of Alleged Misconduct and Rand value of any loss to the
municipality
Disciplinary action taken Date Finalised
N/A None None None
4.4 PERFORMANCE REWARDS
Performance Rewards By Gender
Designations Beneficiary profile
Gender Total number of employees
in group
Number of beneficiaries
Expenditure on rewards Year 1
Proportion of beneficiaries within group
R' 000 %
Interns and temporary employees
Female N/A N/A N/A
Male N/A N/A N/A
Lower skilled (Levels 11‐12) Female N/A N/A N/A
Male N/A N/A N/A
Skilled (Levels 8‐10) Female N/A N/A N/A
Male N/A N/A N/A
Highly skilled supervision (Levels 4‐7)
Female N/A N/A N/A
Male N/A N/A N/A
Management (Levels 0‐3) Female N/A N/A N/A
Male N/A N/A N/A
MM and S56 Female N/A N/A N/A
Male N/A N/A N/A
Total
The statutory municipal calculator has not as yet been used as no performance evaluation has been conducted
No performance rewards have been paid to any of the officials in 2017‐2018 financial year.

95 | P a g e
COMMENT ON PERFORMANCE REWARDS:
Performance management system is currently applicable to Section 56 managers only. It has not been cascaded
down to employees below Section 56 managers. No performance assessments were conducted for Section 56
managers for 2017/2018 financial year.
COMPONENT C: CAPACITATING THE MUNICIPAL WORKFORCE
INTRODUCTION TO WORKFORCE CAPACITY DEVELOPMENT
TheMagareng Local Municipality has a Workplace Skills Plan in place to develop and capacitate its staff

96 | P a g e
4.5 SKILLS DEVELOPMENT AND TRAINING
Skills Matrix
Management level
Gender Employees in
post as at 30 June Year 2018
Number of skilled employees required and actual as at 30 June Year 2016
Learner‐ships Skills programmes & other short courses
Other forms of training Total
No.
Actual: End of 2017/ 2018
Actual: End of 2017/ 2018
2017/ 2018 Target
Actual: End of 2017/ 2018
Actual: End of 2017/ 2018
2017/ 2018 Target
Actual: End of 2017/ 2018
Actual: End of 2017/ 2018
2017/ 2018 Target
Actual: End of 2017/ 2018
Actual: End of 2017/ 2018
2017/ 2018 Target
MM and s57 Female 3
Male 1
Councillors, senior officials and managers
Female 2
Male 7
Technicians and associate professionals*
Female 2
Male 9
Professionals Female
Male
Sub total Female
Male
Total

97 | P a g e
Financial Competency Development: Progress Report*
Description A. Total number of officials employed by municipality (Regulation 14(4)(a) and (c))
B. Total number of officials employed by municipal entities (Regulation 14(4)(a) and (c)
Consolidated: Total of A and B
Consolidated: Competency assessments completed for A and B (Regulation 14(4)(b) and (d))
Consolidated: Total number of officials whose performance agreements comply with Regulation 16 (Regulation 14(4)(f))
Consolidated: Total number of officials that meet prescribed competency levels (Regulation 14(4)(e))
Financial Officials N/A
Accounting officer 1 N/A 1 1 1
Chief financial officer
1 N/A 1 1 1
Senior managers 2 N/A 2 2 2
Any other financial officials
N/A 0 0 0
Supply Chain Management Officials
2 N/A 0 0 0
Heads of supply chain management units
0 N/A 0 0 0
Supply chain management senior managers
0 N/A
TOTAL 6 4 4 4
* This is a statutory report under the National Treasury: Local Government: MFMA Competency Regulations (June 2007) T 4.5.2

98 | P a g e

99 | P a g e
COMMENT ON SKILLS DEVELOPMENT AND RELATED EXPENDITURE AND ON THE FINANCIAL COMPETENCY
REGULATIONS:
TRAINING PLANS AND IMPLEMENTATION: Training plans are developed in consultation with employees
through conducting skills audit and skills need analysis. However, there are some deviations during
implementation as some training programmes that are not planned are at times provided by sector
departments and other government agencies wholly funded.
VARIANCE BETWEEN BUDGETED AND ACTUAL EXPENDITURE: Variances between budgeted and actual
expenditure are as a result of escalating training costs and uncoordinated training wherein employees attend
training that is not included in the training plan. Also, the financial constraints in which the municipality found
itself also contributed to the variances.
ADEQUACY OF FUNDING: Funding for training is not adequate as it does not cover all or most of the
employees. The municipality does not budget 1% of the annual payroll as required by Skills Levies Act No 9 of
1999.
MFMA COMPETENCY REGULATIONS: There is a 90% compliance with the regulations as all senior managers
and most of managers as well as financial officials have completed MFMA training and were declared
competent.
T 4.5.4

100 | P a g e
COMPONENT D: MANAGING THE WORKFORCE EXPENDITURE
INTRODUCTION TO WORKFORCE EXPENDITURE
The strict control of the workforce budget enables the municipality to implement and achieve the pre‐
determined objectives as set out in the IDP because all vacant and budgeted posts will be fill immediately the
vacancy arise. The workforce budget is spent with the parameters of the approved budget. Appointment is
done in terms of the requirements of the post because the salary package is commensurate to the experience
and qualifications of the post.
Employees appointed to posts not approved
Department Level Date of
appointment No.
appointed Reason for appointment when no established post exist
N/A N/A N/A N/A N/A
DISCLOSURES OF FINANCIAL INTERESTS
The disclosures of officials and councillors concerning their financial interests as required by PM Regulations
805 of 2006 are set out in Appendix J.

101 | P a g e
CHAPTER 5 – FINANCIAL PERFORMANCE
INTRODUCTION
The detailed financial performance, financial position and cash flow activities of the municipality are presented in the annual
financial statements for the year ended 30 June 2018. The municipality has during the financial year, strived to comply with
the requirements of the relevant legislative prescripts and the guidelines set by the National Treasury in as far as financial
management is concerned.
Chapter 5 contains information regarding financial performance and highlights specific accomplishments. The chapter
comprises of three components:
Component A: Statement of Financial Performance
Component B: Spending Against Capital Budget
Component C: Other Financial Matters
Component D: Supply Chain Matters

102 | P a g e
COMPONENT A: STATEMENTS OF FINANCIAL PERFORMANCE
INTRODUCTION TO FINANCIAL STATEMENTS
The financial statements presented in this report are presented on the basis that the municipality is a going concern. The
principles of GRAP have been taken into consideration when preparing these annual financial statements. The annual
financial statements have been prepared in‐house and have been submitted on time as prescribed in the Municipal Finance
Management Act to the Auditor General.
Analyzing the financial position of the municipality as outlined in the statement of financial position, in the annual financial
statements, the municipality is still financially viable. The municipality has maintained a sustainable and sufficient asset base,
despite the fact that providing enough for repairs and maintenance remains a challenge.

103 | P a g e
Magareng Local Municipality (Registration number NC093) Annual Financial Statements for the year ended 30 June 2018 Accounting Officer's Report
The accounting officers submit their report for the year ended 30 June 2018. 1. Review of activities Main
business and operations
The municipality is engaged in providing municipal services and maintaining the best interest of the local community within the Magareng municipal area and operates principally in South Africa. The operating results and state of affairs of the municipality are fully set out in the attached annual financial statements and do not in our opinion require any further comment. Net deficit of the municipality was R 17 371 762 (2017: deficit R 29 654 709). 2. Going concern We draw attention to the fact that at 30 June 2018, the municipality had an accumulated surplus (deficit) of R 107 034 008 and that the municipality's total liabilities exceed its assets by R 107 034 008. The annual financial statements have been prepared on the basis of accounting policies applicable to a going concern. This basis presumes that funds will be available to finance future operations and that the realisation of assets and settlement of liabilities, contingent obligations and commitments will occur in the ordinary course of business. Furthermore management has reviewed the municipality's cash flow forecast for the year ended 30 June 2019 and, in the light of this review and the current financial position, management is satisfied that the municipality has, or has acess to, adequate resoources to continue it's operation existing for the foreseeable furture. The municipality still has the ability to levy services, rates and taxes and will continue to receive funding from government as evident from the Equitable Share allocations as published in terms of the Division of Revenue Act (Act 1 of 2016). For details of managements assumptions with respect to the applicability of the going concern assumption refer to note 46. 3. Subsequent events Matters arising since the end of the financial year have been discolsed on note 47. 4. Accounting Officers' interest in contracts No matters to report. 5. Accounting policies The annual financial statements are prepared in accordance with the prescribed Standards of Generally Recognised Accounting Practices (GRAP), including any directives and interpretations of such Standards issued by the Accounting Standards Board and in accordance with Section 122(3) of the Municipal Finance Management Act (Act No.56 of 2003). 6. Accounting Officer The accounting officers of the municipality during the year and to the date of this report are as follows: Name Nationality ChangesMs CD Lentsoe (Acting) South African Acting period lapsedMs MM MonyamaneMasuku (Acting) South African Acting period lapsedMs EM Moncho South African Appointed 01 July 2018

104 | P a g e
7. Auditors The Auditor‐General of South Africa will continue in office for the next financial period.

105 | P a g e
Statement of Financial Position as at 30 June 2018 Figures in Rand Note(s)
Assets
Current Assets Inventories 3Operating lease asset 4Receivables from non‐exchange transactions 5VAT receivable 6Receivables from exchange transactions 7Cash and cash equivalents 8
Non‐Current Assets Investment property 9Property, plant and equipment 10Intangible assets 11Heritage assets 12
Total Assets
Liabilities
Current Liabilities Payables from exchange transactions 13Consumer deposits 14Employee benefit obligation 15Funds to be surrendered 16
Non‐Current Liabilities Employee benefit obligation 15Provisions 17
Total Liabilities Net Assets Accumulated surplus
556 930 557 22217 291 21 7665 924 670 1 940 94515 854 926 16 192 5268 751 999 3 483 2493 887 003 106 107
34 992 819 22 301 815
8 890 803 8 890 803 239 751 803 242 072 242237 485 299 099370 999 370 999
249 251 090 251 633 143
284 243 909 273 934 958
141 995 462 117 844 283900 478 869 0151 397 000 1 545 00012 150 699 8 954 160
156 443 639 129 212 458
10 616 000 10 804 000 10 150 262 9 512 730
20 766 262 20 316 730
177 209 901 149 529 188
107 034 008 124 405 770
107 034 008 124 405 770

106 | P a g e
Statement of Financial Performance Figures in Rand
Revenue Revenue from exchange transactions Service charges Rental of facilities and equipment Interest earned ‐ outstanding receivables Licences and permits Other income Interest earned ‐ external investments Total revenue from exchange transactions Revenue from non‐exchange transactions Taxation revenue Property rates Transfer revenue Government grants & subsidies Donations in kind Fines, Penalties and Forfeits Total revenue from non‐exchange transactions
Total revenue
Expenditure Employee related costs Remuneration of councillors Depreciation and amortisation Impairment loss/ Reversal of impairments Finance costs Debt Impairment Bulk purchases Contracted services General expenses Total expenditure Operating deficit (Loss) gain on disposal of assets and liabilities Actuarial gains/losses
Deficit for the year
Note(s) 2018 2017 Restated*
18 33 979 038 27 902 83019 ‐ 57 236
11 121 069 9 278 342357 244 343 195
20 405 469 488 48621 635 838 254 531
46 498 658 38 324 620
22 7 444 856 6 894 000
23 61 521 232 59 526 116 6 611 613 1 425 63317 118 619 78 581
92 696 320 67 924 330
24 139 194 978 106 248 950
25
(41 809 772) (36 748 602) 26 (3 068 748) (3 268 132)27 (13 845 239) (11 479 813)28 (4 396 401) (3 099 138)29 (7 652 816) (6 981 432)30 (39 831 557) (26 210 388)31 (32 292 738) (32 361 350)32 (3 896 857) (5 455 269)33 (10 633 973) (12 361 403)
(157 428 101) (137 965 527)
(18 233 123) (31 716 577)(1 148 086) 135 635
15 2 009 447 1 926 233
861 361 2 061 868
(17 371 762) (29 654 709)

107 | P a g e

108 | P a g e
Statement of Changes in Net Assets Accumulated Total netFigures in Rand surplus assets
Opening balance as previously reported 153 165 969 153 165 969 Adjustments Prior year adjustments 894 510 894 510
Balance at 01 July 2016 as restated* 154 060 479 154 060 479Changes in net assets Restated Deficit for the year (29 654 709) (29 654 709)
Total changes (29 654 709) (29 654 709)
Restated* Balance at 01 July 2017 124 405 770 124 405 770Changes in net assets Deficit for the year (17 371 762) (17 371 762)
Total changes (17 371 762) (17 371 762)
Balance at 30 June 2018 107 034 008 107 034 008
Cash Flow Statement Figures in Rand
Cash flows from operating activities
Receipts
Taxation Sale of goods and servicesGrants
Payments
Employee costs Suppliers Finance costs
Net cash flows from operating activitie
Cash flows from investing activities
Purchase of property, plant and equipmProceeds from sale of property, plant anPurchase of other intangible assets
Net cash flows from investing activities
Cash flows from financing activities
Finance lease receipts
Net increase/(decrease) in cash and casCash and cash equivalents at the beginn
Cash and cash equivalents at the end o

109 | P a g e
2018 2017 Restated*
11 756 907 9 532 873 10 221 194 9 919 238 71 329 383 63 397 243
93 307 484 82 849 354
(43 205 071) (38 296 501) (21 665 502) (24 790 607) (8 369 749) (6 981 432)
(73 240 322) (70 068 540)
20 067 162 12 780 814
(16 642 738) (13 271 081) 351 999 388 899 ‐ (8 640)
(16 290 739) (12 890 822)
4 473 2 221
3 780 896 (107 787) 106 107 213 894
3 887 003 106 107

110 | P a g e
Statement of Comparison of Budget and Actual Amounts Budget on Accrual Basis Approved Adjustments Final Budget Actual amounts Difference Reference budget on comparable between final Basis budget and Figures in Rand actual
Statement of Financial Performance
Revenue
Revenue from exchange Transactions Service charges 35 183 000 ‐ 35 183 000 33 979 038 (1 203 962) Note 53, x1Rental of facilities andequipment 100 000 ‐ 100 000 ‐ (100 000) Note 53, x2 Interest received (trading) 7 801 800 ‐ 7 801 800 11 121 069 3 319 269 Note 53, x3Agency services 33 150 ‐ 33 150 ‐ (33 150) Note 53, x4Licences and permits 648 678 ‐ 648 678 357 244 (291 434) Note 53, x5Other income 90 154 ‐ 90 154 405 469 315 315 Note 53, x6Interest received ‐ investment 450 000 ‐ 450 000 635 838 185 838 Note 53, x7
Total revenue from exchange 44 306 782 ‐ 44 306 782 46 498 658 2 191 876 Transactions
Revenue from non‐exchange
Transactions
Taxation revenue Property rates 7 499 584 ‐ 7 499 584 7 444 856 (54 728) Note 53, x8
Transfer revenue Government grants & subsidies 42 714 000 ‐ 42 714 000 61 521 232 18 807 232 Note 53, x9Public contributions and ‐ ‐ ‐ 6 611 613 6 611 613 Donations Fines, Penalties and Forfeits 1 364 011 ‐ 1 364 011 17 118 619 15 754 608 Note 53, x10
Total revenue from non‐ 51 577 595 ‐ 51 577 595 92 696 320 41 118 725 exchange transactions
Total revenue 95 884 377 ‐ 95 884 377 139 194 978 43 310 601
Expenditure
Employee related costs (37 803 342) ‐ (37 803 342) (41 809 772) (4 006 430) Note 53, x11Remuneration of councillors (3 164 303) ‐ (3 164 303) (3 068 748) 95 555 Note 53, x12Depreciation and amortisation (12 706 762) ‐ (12 706 762) (13 845 239) (1 138 477) Note 53, x13Impairment loss/ Reversal of ‐ ‐ ‐ (4 396 401) (4 396 401) Note 53, x14Impairments Finance costs (188 206) ‐ (188 206) (7 652 816) (7 464 610) Note 53, x15Debt Impairment (21 571 873) ‐ (21 571 873) (39 831 557) (18 259 684) Note 53, x16Repairs and maintenance ‐ ‐ ‐ (2 417 015) (2 417 015) Note 53, x17Bulk purchases (40 000 000) ‐ (40 000 000) (32 292 738) 7 707 262 Note 53, x18Contracted Services (3 836 236) ‐ (3 836 236) (3 896 857) (60 621) Note 53, x19General Expenses (21 023 725) ‐ (21 023 725) (8 216 958) 12 806 767 Note 53, x20
Total expenditure (140 294 447) ‐ (140 294 447) (157 428 101) (17 133 654)
Deficit before for the year (44 410 070) ‐ (44 410 070) (17 371 762) 27 038 308

111 | P a g e
Actual Amount on Comparable (44 410 070) ‐ (44 410 070) (17 371 762) 27 038 308 Basis as Presented in the Budget and Actual Comparative Statement

112 | P a g e
Statement of Comparison of Budget and Actual Amounts Budget on Accrual Basis Approved Adjustments Final Budget Actual amounts Difference Reference budget on comparable between final basis budget and Figures in Rand actual
Statement of Financial Position
Assets
Current Assets Inventories 100 000 ‐ 100 000 556 930 456 930 Note 53, x21Operating lease asset ‐ ‐ ‐ 17 291 17 291 Note 53, x22Receivables from non‐exchange 7 000 000 ‐ 7 000 000 5 924 670 (1 075 330) Note 53, x23transactions VAT receivable ‐ ‐ ‐ 15 854 926 15 854 926 Note 53, x24Consumer debtors 118 000 000 ‐ 118 000 000 8 751 999 (109 248 001) Note 53, x25Cash and cash equivalents ‐ ‐ ‐ 3 887 003 3 887 003 Note 53, x26
125 100 000 ‐ 125 100 000 34 992 819 (90 107 181)
Non‐Current Assets Investment property 901 720 ‐ 901 720 8 890 803 7 989 083 Note 53, x27Property, plant and equipment 125 994 000 ‐ 125 994 000 239 751 803 113 757 803 Note 53, x28Intangible assets 356 492 ‐ 356 492 237 485 (119 007) Note 53, x29Heritage assets 723 499 ‐ 723 499 370 999 (352 500) Note 53, x30
127 975 711 ‐ 127 975 711 249 251 090 121 275 379
Total Assets 253 075 711 ‐ 253 075 711 284 243 909 31 168 198
Liabilities
Current Liabilities Payables from exchange 90 000 000 ‐ 90 000 000 141 995 460 51 995 460 Note 53, x31transactions Consumer deposits 711 000 ‐ 711 000 900 478 189 478 Note 53, x32Employee benefit obligation ‐ ‐ ‐ 1 397 000 1 397 000 Note 53, x33Funds to be surrendered ‐ ‐ ‐ 12 150 699 12 150 699 Note 53, x35Bank overdraft 31 475 924 ‐ 31 475 924 ‐ (31 475 924) Note 53, x36
122 186 924 ‐ 122 186 924 156 443 637 34 256 713
Non‐Current Liabilities Employee benefit obligation ‐ ‐ ‐ 10 616 000 10 616 000 Note 53, x37Provisions 18 050 000 ‐ 18 050 000 10 150 262 (7 899 738) Note 53, 38
18 050 000 ‐ 18 050 000 20 766 262 2 716 262
Total Liabilities 140 236 924 ‐ 140 236 924 177 209 899 36 972 975
Net Assets 112 838 787 ‐ 112 838 787 107 034 010 (5 804 777)
Net Assets
Net Assets Attributable to Owners of Controlling Entity

113 | P a g e
Reserves Accumulated surplus 112 838 787 ‐ 112 838 787 107 034 010 (5 804 777)

114 | P a g e
Appropriation Statement Figures in Rand Original Budget Final Shifting of Virement Final budget Actual Unauthorised Variance Actual Actual budget adjustments adjustments funds (i.t.o. (i.t.o. council outcome expenditure outcome outcome (i.t.o. s28 and budget s31 of the approved as % of as % of s31 of the MFMA) policy) final original MFMA) budget budget
2018
Financial Performance Property rates 7 499 584 ‐ 7 499 584 ‐ 7 499 584 7 444 856 (54 728) 99 % 99 % Service charges 35 183 000 ‐ 35 183 000 ‐ 35 183 000 33 979 038 (1 203 962) 97 % 97 % Investment revenue 450 000 ‐ 450 000 ‐ 450 000 635 838 185 838 141 % 141 % Transfers recognised ‐ 42 714 000 ‐ 42 714 000 ‐ 42 714 000 46 908 769 4 194 769 110 % 110 %
Operational
Other own revenue 10 037 793
‐ 10 037 793 ‐
31 011 848 20 974 055 309 % 309 % 10 037 793
Total revenue 95 884 377
‐ 95 884 377 ‐
119 980 349 24 095 972 125 % 125 % 95 884 377
(excluding capital transfers and contributions)
Employee costs (37 803 342) ‐ (37 803 342) ‐ ‐ (37 803 342) (41 809 772) ‐ (4 006 430) 111 % 111 % Remuneration of (3 164 303) ‐ (3 164 303) ‐ ‐ (3 164 303) (3 068 748) ‐ 95 555 97 % 97 % Councillors Debt impairment (21 571 873) ‐ (21 571 873) (21 571 873) (39 831 557) ‐ (18 259 684) 185 % 185 % Depreciation and asset (12 706 762) ‐ (12 706 762) (12 706 762) (18 241 640) ‐ (5 534 878) 144 % 144 % Impairment Finance charges (188 206) ‐ (188 206) ‐ ‐ (188 206) (7 652 816) ‐ (7 464 610) 4 066 % 4 066 % Materials and bulk (40 845 000) ‐ (40 845 000) ‐ ‐ (40 845 000) (32 292 738) ‐ 8 552 262 79 % 79 % Purchases Other expenditure (24 014 961) ‐ (24 014 961) ‐ ‐ (24 014 961) (15 678 916) ‐ 8 336 045 65 % 65 %
Total expenditure (140 294 447) ‐ (140 294 447) ‐ ‐ (140 294 447) (158 576 187) ‐ (18 281 740) 113 % 113 %
Surplus/(Deficit) (44 410 070) ‐ (44 410 070) ‐ (44 410 070) (38 595 838) 5 814 232 87 % 87 %

115 | P a g e
Appropriation Statement Figures in Rand Original Budget Final Shifting of Virement Final budget Actual Unauthorised Variance Actual Actual budget adjustments adjustments funds (i.t.o. (i.t.o. council outcome expenditure outcome outcome (i.t.o. s28 and budget s31 of the approved as % of as % of s31 of the MFMA) policy) final original MFMA) budget budget
Transfers recognised ‐ ‐ ‐ ‐ ‐
14 612 463 14 612 463 DIV/0 % DIV/0 % ‐
Capital
Contributions recognised ‐ ‐ ‐ ‐
6 611 613 DIV/0 % DIV/0 % ‐ 6 611 613
‐ capital and contributed Assets Surplus (Deficit) after (44 410 070) ‐ (44 410 070) ‐ (44 410 070) (17 371 762) 27 038 308 39 % 39 %
capital transfers and
Contributions Surplus/(Deficit) for the (44 410 070) ‐ (44 410 070) ‐ (44 410 070) (17 371 762) 27 038 308 39 % 39 % Year
The accounting policies on pages 15 to 43 and the notes on pages 44 to 94 form an integral part of the annual financial statements.

116 | P a g e
Accounting Policies
‐ Presentation of Annual Financial Statements
The annual financial statements have been prepared in accordance with the Standards of Generally Recognised Accounting Practice (GRAP), issued by the Accounting Standards Board in accordance with Section 122(3) of the Municipal Finance Management Act (Act 56 of 2003). These annual financial statements have been prepared on an accrual basis of accounting and are in accordance with historical cost convention as the basis of measurement, unless specified otherwise. They are presented in South African Rand. All figures have been rounded to the nearest Rand. A summary of the significant accounting policies, which have been consistently applied in the preparation of these annual financial statements, are disclosed below. These accounting policies are consistent with the previous period. 1.1 Presentation currency These annual financial statements are presented in South African Rand, which is the functional currency of the municipality. 1.2 Going concern assumption These annual financial statements have been prepared based on the expectation that the municipality will continue to operate as a going concern for at least the next 12 months. 1.3 Significant judgements and sources of estimation uncertainty In preparing the annual financial statements, management is required to make estimates and assumptions that affect the amounts represented in the annual financial statements and related disclosures. Use of available information and the application of judgement is inherent in the formation of estimates. Actual results in the future could differ from these estimates which may be material to the annual financial statements. Significant judgements include: Trade receivables / Held to maturity investments and/or loans receivables The municipality assesses its trade receivables, held to maturity investments and loans and receivables for impairment at the end of each reporting period. In determining whether an impairment loss should be recorded in surplus or deficit, the municipality makes judgement as to whether there is observable data indicating a measurable decrease in the estimated future cash flows from a financial asset.
The impairment for trade receivables, held to maturity investments and loans and receivables is calculated on portfolio basis, based on historical loss ratios, adjusted for national and industry‐specific economic conditions and other indicators present at the reporting date that correlate with defaults on the portfolio. These annual loss rations are applied to loan balances in the portfolio and scaled to the estimated loss emergence period. Fair value estimation
The fair value of financial instruments traded in active markets (such as trading and available‐for‐sale securities) is based on quoted market prices at the end of the reporting period. The quoted market price used for financial assets held by the municipality is the current bid price. The fair value of financial instruments that are not traded in an active market (for example, over‐the counter derivatives) is determined by using valuation techniques. The municipality uses a variety of methods and makes assumptions that are based on market conditions existing at the end of each reporting period. Quoted market prices or dealer quotes for similar instruments are used for long‐term debt. Other techniques, such as estimated discounted cash flows, are used to determine fair value for the remaining financial instruments. The fair value of interest rate swaps is calculated as the present value of the estimated future cash flows. The fair value of forward foreign exchange contracts is determined using quoted forward exchange rates at the end of the reporting period.
The carrying value less impairment provision of trade receivables and payables are assumed to approximate their fair values. The fair value of financial liabilities for disclosure purposes is estimated by discounting the future contractual cash flows at the current market interest rate that is available to the municipality for similar financial instruments.

117 | P a g e
Accounting Policies
1.3 Significant judgements and sources of estimation uncertainty (continued) Impairment testing
The recoverable amounts of cash‐generating units and individual assets have been determined based on the higher of value‐in‐use calculations and fair values less costs to sell. These calculations require the use of estimates and assumptions. It is reasonably possible that the provisions and post retirement benefit assumption may change which may then impact our estimations and may then require a material adjustment to the carrying value of goodwill and tangible assets.
The municipality reviews and tests the carrying value of assets when events or changes in circumstances suggest that the carrying amount may not be recoverable. In addition, goodwill is tested on an annual basis for impairment. Assets are grouped at the lowest level for which identifiable cash flows are largely independent of cash flows of other assets and liabilities. If there are indications that impairment may have occurred, estimates are prepared of expected future cash flows for each group of assets. Expected future cash flows used to determine the value in use of goodwill and tangible assets are inherently uncertain and could materially change over time. They are significantly affected by a number of factors including production estimates, supply demand, together with economic factors such as exchange rates inflation interest. Provisions Provisions were raised and management determined an estimate based on the information available. Additional disclosure of these estimates of provisions are included in note 17 ‐ Provisions. Post retirement benefits
The present value of the post retirement obligation depends on a number of factors that are determined on an actuarial basis using a number of assumptions. The assumptions used in determining the net cost (income) include the discount rate. Any changes in these assumptions will impact on the carrying amount of post retirement obligations. The municipality determines the appropriate discount rate at the end of each year. This is the interest rate that should be used to determine the present value of estimated future cash outflows expected to be required to settle the pension obligations. In determining the appropriate discount rate, the municipality considers the interest rates of high‐quality corporate bonds that are denominated in the currency in which the benefits will be paid, and that have terms to maturity approximating the terms of the related pension liability. Other key assumptions for pension obligations are based on current market conditions. Additional information is disclosed in Note 15. Allowance for doubtful debts On debtors an impairment loss is recognised in surplus and deficit when there is objective evidence that it is impaired. The impairment is measured as the difference between the debtors carrying amount and the present value of estimated future cash flows discounted at the effective interest rate, computed at initial recognition. Useful lives and residual values
The entity's management determines the estimated useful lives, residual values and related depreciation charges for assets as noted in accounting policy 1.5 Property Plant and equipment. These estimates are based on industry norms. Management will increase the depreciation charge prospectively where useful lives are less than previously estimated useful lives. Management will decrease the depreciation charge prospectively where useful lives are more than previously estimated useful lives. Where changes are made to the estimated residual values, management also makes these changes prospectively. 1.4 Investment property
Investment property is property (land or a building ‐ or part of a building ‐ or both) held to earn rentals or for capital appreciation or both, rather than for:
1. use in the production or supply of goods or services or for 2. administrative purposes, or 3. sale in the ordinary course of operations.

118 | P a g e
Accounting Policies
1.4 Investment property (continued)
Owner‐occupied property is property held for use in the production or supply of goods or services or for administrative purposes. Investment property is recognised as an asset when, it is probable that the future economic benefits or service potential that are associated with the investment property will flow to the municipality, and the cost or fair value of the investment property can be measured reliably. Investment property is initially recognised at cost. Transaction costs are included in the initial measurement. Where investment property is acquired through a non‐exchange transaction, its cost is its fair value as at the date of acquisition. Costs is the amount of cash or cash equivalent or the fair value of the consideration given to acquire an asset at the time of its acquisition or construction. Costs include costs incurred initially and costs incurred subsequently to add to, or to replace a part of, or service a property. If a replacement part is recognised in the carrying amount of the investment property, the carrying amount of the replaced part is derecognised. Fair value Subsequent to initial measurement investment property is measured at fair value. The fair value of investment property reflects market conditions at the reporting date. A gain or loss arising from a change in fair value is included in net surplus or deficit for the period in which it arises. If the entity determines that the fair value of an investment property under construction is not reliably determinable but expects the fair value of the property to be reliably measurable when construction is complete, it measures that investment property under construction at cost until either its fair value becomes reliably determinable or construction is completed (whichever is earlier). If the entity determines that the fair value of an investment property (other than an investment property under construction) is not reliably determinable on a continuing basis, the entity measures that investment property using the cost model (as per the accounting policy on Property, plant and equipment). The residual value of the investment property is then assumed to be zero. The entity applies the cost model (as per the accounting policy on Property, plant and equipment) until disposal of the investment property.
Once the entity becomes able to measure reliably the fair value of an investment property under construction that has previously been measured at cost, it measures that property at its fair value. Once construction of that property is complete, it is presumed that fair value can be measured reliably. If this is not the case, the property is accounted for using the cost model in accordance with the accounting policy on Property, plant and equipment. Compensation from third parties for investment property that was impaired, lost or given up is recognised in surplus or deficit when the compensation becomes receivable. Property interests held under operating leases are classified and accounted for as investment property in the following circumstances: When classification is difficult, the criteria used to distinguish investment property from owner‐occupied property and from property held for sale in the ordinary course of operations, including the nature or type of properties classified as held for strategic purposes, are as follows: The nature OR type of properties classified as held for strategic purposes are as follows:
The municipality separately discloses expenditure to repair and maintain investment property in the notes to the annual financial statements (see note 9). The municipality discloses relevant information relating to assets under construction or development, in the notes to the annual financial statements (see note 9).

119 | P a g e
Accounting Policies
1.4 Investment property (continued) Derecognition
Items of investment property are derecognised when the asset is disposed of or when there are no further economic benefits or service potential expected from the use or disposal of asset. The gain or loss arising from the derecognition of an item of investment property is included in surplus or deficit when the item is derecognised. The gain or loss arising from the derecognition of an item of investment property is determined as the difference between the net disposal proceeds and the carrying amount of the asset. 1.5 Property, plant and equipment Property, plant and equipment are tangible non‐current assets (including infrastructure assets) that are held for use in the production or supply of goods or services, rental to others (other than Investment Property), or for administrative purposes, and are expected to be used during more than one period. The cost of an item of property, plant and equipment is recognised as an asset when:
Ÿ it is probable that future economic benefits or service potential associated with the item will flow to the municipality; and
Ÿ the cost of the item can be measured reliably. Property, plant and equipment is initially measured at cost.
The cost of an item of property, plant and equipment is the purchase price and other costs attributable to bring the asset to the location and condition necessary for it to be capable of operating in the manner intended by management. Trade discounts and rebates are deducted in arriving at the cost. Where an asset is acquired through a non‐exchange transaction, its cost is its fair value as at date of acquisition.
Where an item of property, plant and equipment is acquired in exchange for a non‐monetary asset or monetary assets, or a combination of monetary and non‐monetary assets, the asset acquired is initially measured at fair value (the cost). If the acquired item's fair value was not determinable, it's deemed cost is the carrying amount of the asset(s) given up. When significant components of an item of property, plant and equipment have different useful lives, they are accounted for as separate items (major components) of property, plant and equipment. Costs include costs incurred initially to acquire or construct an item of property, plant and equipment and costs incurred subsequently to add to, replace part of, or service it. If a replacement cost is recognised in the carrying amount of an item of property, plant and equipment, the carrying amount of the replaced part is derecognised. The initial estimate of the costs of dismantling and removing the item and restoring the site on which it is located is also included in the cost of property, plant and equipment, where the entity is obligated to incur such expenditure, and where the obligation arises as a result of acquiring the asset or using it for purposes other than the production of inventories. Recognition of costs in the carrying amount of an item of property, plant and equipment ceases when the item is in the location and condition necessary for it to be capable of operating in the manner intended by management. Major spare parts and stand by equipment which are expected to be used for more than one period are included in property, plant and equipment. In addition, spare parts and stand by equipment which can only be used in connection with an item of property plant and equipment are accounted for as property plant and equipment. Purchased software that is integral to the functionality of the related equipment is capitalised as part of that equipment. Subsequent measurement:
Property, plant and equipment is carried at cost less accumulated depreciation and any impairment losses except for land and buldings and community assets which is carried at revalued amount being the fair value at the date of revaluation less any subsequent accumulated depreciation and subsequent accumulated impairment losses.

120 | P a g e
Accounting Policies
1.5 Property, plant and equipment (continued)
Revaluations are made with sufficient regularity, by registered valuators for every class separately, such that the carrying amount does not differ materially from that which would be determined using fair value at the end of the reporting period. When an item of property, plant and equipment is revalued, any accumulated depreciation at the date of the revaluation is restated proportionately with the change in the gross carrying amount of the asset so that the carrying amount of the asset after revaluation equals its revalued amount. Any increase in an asset’s carrying amount, as a result of a revaluation, is credited directly to a revaluation surplus. The increase is recognised in surplus or deficit to the extent that it reverses a revaluation decrease of the same asset previously recognised in surplus or deficit. Any decrease in an asset’s carrying amount, as a result of a revaluation, is recognised in surplus or deficit in the current period. The decrease is debited directly to a revaluation surplus to the extent of any credit balance existing in the revaluation surplus in respect of that asset. The revaluation surplus included in the net assets related to a specific item of property, plant and equipment is transferred directly to retained earnings when the asset is derecognised. The revaluation surplus included in the net assets related to a specific item of property, plant and equipment is transferred directly to retained earnings as the asset is used. The amount transferred is equal to the difference between depreciation based on the revalued carrying amount and depreciation based on the original cost of the asset. Depreciation and impairment:
Property, plant and equipment are depreciated on the straight line basis over their expected useful lives to their estimated residual value. Land, except for landfill and quarry sites, is not depreciated as it has an indefinite useful life. Depreciation of an asset begins when it is available for use, i.e. when it is in the location and condition necessary for it to be capable of operating in the manner intended by management. Each part of an item of property plant and equipment with a cost that is significant in relation to the total cost of the item shall be depreciated separately. Components of asset that are significant in relation to the whole asset and that have different useful lives are depreciated separately. Subsequent to initial recognition, property plant and equipment on the cost model, is carried at cost less accumulated depreciation and any accumulated impairment losses. Assets held under finance leases are depreciated over their expected useful lives on the same basis as owned assets or, where shorter, the term of the relevant lease. The useful lives of items of property, plant and equipment have been assessed as follows: Item Depreciation method Average useful life
Land Indefinite Buildings Straight line 10 ‐ 30 years Landfill sites Straight line 15 years Other assets Straight line 4 ‐ 7 years Community assets Straight line 20 ‐ 30 years Infrastructure Straight line 5 ‐ 90 years The depreciable amount of an asset is allocated on a systematic basis over its useful life.
Each part of an item of property, plant and equipment with a cost that is significant in relation to the total cost of the item is depreciated separately.

121 | P a g e
Accounting Policies
1.5 Property, plant and equipment (continued)
The depreciation method used reflects the pattern in which the asset’s future economic benefits or service potential are expected to be consumed by the municipality. The depreciation method applied to an asset is reviewed at least at each reporting date and, if there has been a significant change in the expected pattern of consumption of the future economic benefits or service potential embodied in the asset, the method is changed to reflect the changed pattern. Such a change is accounted for as a change in an accounting estimate. The municipality assesses at each reporting date whether there is any indication that the municipality expectations about the residual value and the useful life of an asset have changed since the preceding reporting date. If any such indication exists, the municipality revises the expected useful life and/or residual value accordingly. The change is accounted for as a change in an accounting estimate. The depreciation charge for each period is recognised in surplus or deficit unless it is included in the carrying amount of another asset. Items of property, plant and equipment are derecognised when the asset is disposed of or when there are no further economic benefits or service potential expected from the use of the asset. The gain or loss arising from the derecognition of an item of property, plant and equipment is included in surplus or deficit when the item is derecognised. The gain or loss arising from the derecognition of an item of property, plant and equipment is determined as the difference between the net disposal proceeds, if any, and the carrying amount of the item. Assets which the municipality holds for rentals to others and subsequently routinely sell as part of the ordinary course of activities, are transferred to inventories when the rentals end and the assets are available‐for‐sale. Proceeds from sales of these assets are recognised as revenue. All cash flows on these assets are included in cash flows from operating activities in the cash flow statement. The municipality separately discloses expenditure to repair and maintain property, plant and equipment in the notes to the financial statements (see note 10). The municipality discloses relevant information relating to assets under construction or development, in the notes to the financial statements (see note 10). Commitments:
Where the municipality has a contractual commitment in respect of the acquisition of property, plant and equipment, these are disclosed in note 36. The commitments as disclosed are the contractual amount less any payment made in respect of the contract. 1.6 Site restoration and dismantling cost The municipality has an obligation to dismantle, remove and restore items of property, plant and equipment. Such obligations are referred to as ‘decommissioning, restoration and similar liabilities’. The cost of an item of property, plant and equipment includes the initial estimate of the costs of dismantling and removing the item and restoring the site on which it is located, the obligation for which an municipality incurs either when the item is acquired or as a consequence of having used the item during a particular period for purposes other than to produce inventories during that period. If the related asset is measured using the cost model:
Ÿ subject to (b), changes in the liability are added to, or deducted from, the cost of the related asset in the current period;
Ÿ if a decrease in the liability exceeds the carrying amount of the asset, the excess is recognised immediately in surplus or deficit; and
Ÿ if the adjustment results in an addition to the cost of an asset, the municipality considers whether this is an indication that the new carrying amount of the asset may not be fully recoverable. If it is such an indication, the asset is tested for impairment by estimating its recoverable amount or recoverable service amount, and any impairment loss is recognised in accordance with the accounting policy on impairment of cash‐generating assets and/or impairment of non‐cash‐generating assets.

122 | P a g e
Accounting Policies
1.7 Intangible assets An asset is identifiable if it either:
(a) is separable, i.e. is capable of being separated or divided from an entity and sold, transferred, licensed, rented or exchanged, either individually or together with a related contract, identifiable assets or liability, regardless of whether the entity intends to do so; or
(b) arises from binding arrangements (including rights from contracts), regardless of whether those rights are transferable or separable from the municipality or from other rights and obligations.
A binding arrangement describes an arrangement that confers similar rights and obligations on the parties to it as if it were in the form of a contract. An intangible asset is recognised when:
Ÿ it is probable that the expected future economic benefits or service potential that are attributable to the asset will flow to the municipality; and
Ÿ the cost or fair value of the asset can be measured reliably. The municipality assesses the probability of expected future economic benefits or service potential using reasonable and supportable assumptions that represent management’s best estimate of the set of economic conditions that will exist over the useful life of the asset. Intangible assets are initially recognised at cost.
Where an intangible asset is acquired through a non‐exchange transaction, its initial cost at the date of acquisition is measured at its fair value as at that date. Expenditure on research (or on the research phase of an internal project) is recognised as an expense when it is incurred. Subsequent measurement: Intangible assets are carried at cost less any accumulated amortisation and any impairment losses.
An intangible asset is regarded as having an indefinite useful life when, based on all relevant factors, there is no foreseeable limit to the period over which the asset is expected to generate net cash inflows or service potential. Amortisation is not provided for these intangible assets, but they are tested for impairment annually and whenever there is an indication that the asset may be impaired. For all other intangible assets amortisation is provided on a straight line basis over their useful life. The amortisation period and the amortisation method for intangible assets are reviewed at each reporting date. Reassessing the useful life of an intangible asset with a finite useful life after it was classified as indefinite is an indicator that the asset may be impaired. As a result the asset is tested for impairment and the remaining carrying amount is amortised over its useful life. Amortisation begins when intangible assets are in the location and condition necessary for it to be capable of operating in the manner intended by management and ceases at the earlier of the date that asset is classified as held for sale (or included a disposal group that is classified as held for sale) in accordance with the standard of GRAP on Non‐current Assets Held for Sale and Discontinued Operations and the date that the asset is derecognised. Amortisation is provided to write down the intangible assets, on a straight line basis, to their residual values as follows: Item Useful life Computer software 3 ‐ 10 years Derecognition: Intangible assets are derecognised:
Ÿ on disposal; or Ÿ when no future economic benefits or service potential are expected from its use or disposal.

123 | P a g e
The gain or loss arising from the derecognition of an intangible assets is included in surplus or deficit when the asset is derecognised (unless the Standard of GRAP on leases requires otherwise on a sale and leaseback).

124 | P a g e
Accounting Policies
1.8 Heritage assets
Cost is the amount of cash or cash equivalents paid or the fair value of the other consideration given to acquire an asset at the time of its acquisition or construction or, where applicable, the amount attributed to that asset when initially recognised in accordance with the specific requirements of other Standards of GRAP. Heritage assets are assets that have a cultural, environmental, historical, natural, scientific, technological or artistic significance and are held indefinitely for the benefit of present and future generations. Recoverable amount is the higher of a cash‐generating asset’s net selling price and its value in use. Recoverable service amount is the higher of a non‐cash‐generating asset’s fair value less costs to sell and its value in use.
Value in use of a cash‐generating asset is the present value of the future cash flows expected to be derived from an asset or cash‐generating unit. Value in use of a non‐cash‐generating asset is the present value of the asset’s remaining service potential. Recognition
The municipality recognises a heritage asset as an asset if it is probable that future economic benefits or service potential associated with the asset will flow to the municipality, and the cost or fair value of the asset can be measured reliably. Initial measurement A heritage asset that qualifies for the recognition as an asset is measured at cost. Where a heritage asset is acquired through a non‐exchange transaction, its cost is measured at its fair value as at the date of acquisition. Subsequent measurement After recognition as an asset, a class of heritage assets, whose fair value can be measured reliably, is carried at a revalued amount, being its fair value at the date of the revaluation less any subsequent impairment losses. If a heritage asset’s carrying amount is increased as a result of a revaluation, the increase is credited directly to a revaluation surplus. However, the increase is recognised in surplus or deficit to the extent that it reverses a revaluation decrease of the same heritage asset previously recognised in surplus or deficit. If a heritage asset’s carrying amount is decreased as a result of a revaluation, the decrease is recognised in surplus or deficit. However, the decrease is debited directly to a revaluation surplus to the extent of any credit balance existing in the revaluation surplus in respect of that heritage asset. Impairment
The heritage assets of the municipality shall not be depreciated but, the municipality assess at each reporting date whether there is an indication that it may be impaired. If any such indication exists, the municipality estimates the recoverable amount or the recoverable service amount of the heritage asset. Transfers Transfers from heritage assets are only made when the particular asset no longer meets the definition of a heritage asset. Transfers to heritage assets are only made when the asset meets the definition of a heritage asset.
For a transfer from investment property carried at fair value, on inventories to heritage assets at a revalued amount, any difference between the fair value of the asset at that date and its previous carrying amount shall be recognised in surplus or deficit.

125 | P a g e

126 | P a g e
Accounting Policies
1.8 Heritage assets (continued) Derecognition The municipality derecognises heritage asset on disposal, or when no future economic benefits or service potential are expected from its use or disposal. The gain or loss arising from the derecognition of a heritage asset is included in surplus or deficit when the item is derecognised (unless the Standard of GRAP on leases requires otherwise on a sale and leaseback). Application of deemed cost ‐ Directive 7 The Municipality opted to take advantage of the transitional provision as contained in the Directive 7 of the Accounting Standards Board, issued in December 2009. The municipality applied deemed cost where the acquisition cost of an asset could not be determined. The fair value as determined by a valuator was used in order to determine the deemed cost as on 1 July 2010. 1.9 Financial instruments A financial instrument is any contract that gives rise to a financial asset of one entity and a financial liability or a residual interest of another entity. The amortised cost of a financial asset or financial liability is the amount at which the financial asset or financial liability is measured at initial recognition minus principal repayments, plus or minus the cumulative amortisation using the effective interest method of any difference between that initial amount and the maturity amount, and minus any reduction (directly or through the use of an allowance account) for impairment or uncollectibility. A concessionary loan is a loan granted to or received by an entity on terms that are not market related. Credit risk is the risk that one party to a financial instrument will cause a financial loss for the other party by failing to discharge an obligation. Currency risk is the risk that the fair value or future cash flows of a financial instrument will fluctuate because of changes in foreign exchange rates. Derecognition is the removal of a previously recognised financial asset or financial liability from an entity’s statement of financial position. A derivative is a financial instrument or other contract with all three of the following characteristics:
Ÿ Its value changes in response to the change in a specified interest rate, financial instrument price, commodity price, foreign exchange rate, index of prices or rates, credit rating or credit index, or other variable, provided in the case of a non‐financial variable that the variable is not specific to a party to the contract (sometimes called the ‘underlying’).
Ÿ It requires no initial net investment or an initial net investment that is smaller than would be required for other types of contracts that would be expected to have a similar response to changes in market factors.
Ÿ It is settled at a future date. The effective interest method is a method of calculating the amortised cost of a financial asset or a financial liability (or group of financial assets or financial liabilities) and of allocating the interest income or interest expense over the relevant period. The effective interest rate is the rate that exactly discounts estimated future cash payments or receipts through the expected life of the financial instrument or, when appropriate, a shorter period to the net carrying amount of the financial asset or financial liability. When calculating the effective interest rate, an entity shall estimate cash flows considering all contractual terms of the financial instrument (for example, prepayment, call and similar options) but shall not consider future credit losses. The calculation includes all fees and points paid or received between parties to the contract that are an integral part of the effective interest rate (see the Standard of GRAP on Revenue from Exchange Transactions), transaction costs, and all other premiums or discounts. There is a presumption that the cash flows and the expected life of a group of similar financial instruments can be estimated reliably. However, in those rare cases when it is not possible to reliably estimate the cash flows or the expected life of a financial instrument (or group of financial instruments), the entity shall use the contractual cash flows over the full contractual term of the financial instrument (or group of financial instruments).

127 | P a g e
Fair value is the amount for which an asset could be exchanged, or a liability settled, between knowledgeable willing parties in an arm’s length transaction.

128 | P a g e
Accounting Policies
1.9 Financial instruments (continued) A financial asset is:
Ÿ Cash and cash equivalents; Ÿ a residual interest of another entity; or Ÿ a contractual right to:
receive cash or another financial asset from another entity; or exchange financial assets or financial liabilities with another entity under conditions that are potentially favourable to the entity.
A financial guarantee contract is a contract that requires the issuer to make specified payments to reimburse the holder for a loss it incurs because a specified debtor fails to make payment when due in accordance with the original or modified terms of a debt instrument. A financial liability is any liability that is a contractual obligation to:
Ÿ deliver cash or another financial asset to another entity; or Ÿ exchange financial assets or financial liabilities under conditions that are potentially unfavourable to the entity.
Interest rate risk is the risk that the fair value or future cash flows of a financial instrument will fluctuate because of changes in market interest rates. Liquidity risk is the risk encountered by an entity in the event of difficulty in meeting obligations associated with financial liabilities that are settled by delivering cash or another financial asset. Loan commitment is a firm commitment to provide credit under pre‐specified terms and conditions. Loans payable are financial liabilities, other than short‐term payables on normal credit terms.
Market risk is the risk that the fair value or future cash flows of a financial instrument will fluctuate because of changes in market prices. Market risk comprises three types of risk: currency risk, interest rate risk and other price risk. Other price risk is the risk that the fair value or future cash flows of a financial instrument will fluctuate because of changes in market prices (other than those arising from interest rate risk or currency risk), whether those changes are caused by factors specific to the individual financial instrument or its issuer, or factors affecting all similar financial instruments traded in the market. A financial asset is past due when a counterparty has failed to make a payment when contractually due.
A residual interest is any contract that manifests an interest in the assets of an entity after deducting all of its liabilities. A residual interest includes contributions from owners, which may be shown as:
Ÿ equity instruments or similar forms of unitised capital; Ÿ a formal designation of a transfer of resources (or a class of such transfers) by the parties to the transaction as
forming part of an entity’s net assets, either before the contribution occurs or at the time of the contribution; or Ÿ a formal agreement, in relation to the contribution, establishing or increasing an existing financial interest in the
net assets of an entity. Transaction costs are incremental costs that are directly attributable to the acquisition, issue or disposal of a financial asset or financial liability. An incremental cost is one that would not have been incurred if the entity had not acquired, issued or disposed of the financial instrument. Financial instruments at amortised cost are non‐derivative financial assets or non‐derivative financial liabilities that have fixed or determinable payments, excluding those instruments that:
Ÿ the entity designates at fair value at initial recognition; or Ÿ are held for trading.
Financial instruments at cost are investments in residual interests that do not have a quoted market price in an active market, and whose fair value cannot be reliably measured. Financial instruments at fair value comprise financial assets or financial liabilities that are:
Ÿ derivatives;

129 | P a g e
Ÿ combined instruments that are designated at fair value;

130 | P a g e
Accounting Policies 1.9 Financial instruments (continued)
instruments held for trading. A financial instrument is held for trading if: ‐ it is acquired or incurred principally for the purpose of selling or repurchasing it in the near‐term; or ‐ on initial recognition it is part of a portfolio of identified financial instruments that are managed together and for which there is evidence of a recent actual pattern of short term profit‐taking; ‐ non‐derivative financial assets or financial liabilities with fixed or determinable payments that are designated at fair value at initial recognition; and ‐ financial instruments that do not meet the definition of financial instruments at amortised cost or financial instruments at cost.
Classification
The entity has the following types of financial assets (classes and category) as reflected on the face of the statement of financial position or in the notes thereto: Class Category Cash and cash equivalents Financial asset measured at amortised cost Receivables from exchange and non‐exchange transactions Financial asset measured at amortised cost Other receivables from exchange transactions Financial asset measured at amortised cost The entity has the following types of financial liabilities (classes and category) as reflected on the face of the statement of financial position or in the notes thereto: Class Consumer deposits Payables from exchange transactions Unspent conditional grants and receipts Funds to be surrendered
Initial recognition
Category Financial liability measured at amortised cost Financial liability measured at amortised cost Financial liability measured at amortised cost Financial liability measured at amortised cost
The entity recognises a financial asset or a financial liability in its statement of financial position when the entity becomes a party to the contractual provisions of the instrument. Initial measurement of financial assets and financial liabilities The entity measures a financial asset and financial liability initially at its fair value plus transaction costs that are directly attributable to the acquisition or issue of the financial asset or financial liability. The entity measures a financial asset and financial liability initially at its fair value [if subsequently measured at fair value].
The entity first assesses whether the substance of a concessionary loan is in fact a loan. On initial recognition, the entity analyses a concessionary loan into its component parts and accounts for each component separately. The entity accounts for that part of a concessionary loan that is:
Ÿ a social benefit in accordance with the Framework for the Preparation and Presentation of Financial Statements, where it is the issuer of the loan; or
Ÿ non‐exchange revenue, in accordance with the Standard of GRAP on Revenue from Non‐exchange Transactions (Taxes and Transfers), where it is the recipient of the loan.
Subsequent measurement of financial assets and financial liabilities The entity measures all financial assets and financial liabilities after initial recognition using the following categories:
Ÿ Financial instruments at amortised cost. Ÿ Financial instruments at cost.
All financial assets measured at amortised cost, or cost, are subject to an impairment review. Impairment and uncollectibility of financial assets

131 | P a g e
Accounting Policies
1.9 Financial instruments (continued)
The entity assess at the end of each reporting period whether there is any objective evidence that a financial asset or group of financial assets is impaired. Financial assets measured at amortised cost: If there is objective evidence that an impairment loss on financial assets measured at amortised cost has been incurred, the amount of the loss is measured as the difference between the asset’s carrying amount and the present value of estimated future cash flows (excluding future credit losses that have not been incurred) discounted at the financial asset’s original effective interest rate. The carrying amount of the asset is reduced directly OR through the use of an allowance account. The amount of the loss is recognised in surplus or deficit. If, in a subsequent period, the amount of the impairment loss decreases and the decrease can be related objectively to an event occurring after the impairment was recognised, the previously recognised impairment loss is reversed directly OR by adjusting an allowance account. The reversal does not result in a carrying amount of the financial asset that exceeds what the amortised cost would have been had the impairment not been recognised at the date the impairment is reversed. The amount of the reversal is recognised in surplus or deficit. Financial assets measured at cost: If there is objective evidence that an impairment loss has been incurred on an investment in a residual interest that is not measured at fair value because its fair value cannot be measured reliably, the amount of the impairment loss is measured as the difference between the carrying amount of the financial asset and the present value of estimated future cash flows discounted at the current market rate of return for a similar financial asset. Such impairment losses are not reversed.

132 | P a g e
Accounting Policies
1.9 Financial instruments (continued) Derecognition Financial assets The entity derecognises financial assets using trade date accounting. The entity derecognises a financial asset only when:
Ÿ the contractual rights to the cash flows from the financial asset expire, are settled or waived; Ÿ the entity transfers to another party substantially all of the risks and rewards of ownership of the financial asset;
or Ÿ the entity, despite having retained some significant risks and rewards of ownership of the financial asset, has
transferred control of the asset to another party and the other party has the practical ability to sell the asset in its entirety to an unrelated third party, and is able to exercise that ability unilaterally and without needing to impose additional restrictions on the transfer. In this case, the entity : ‐ derecognise the asset; and ‐ recognise separately any rights and obligations created or retained in the transfer.
The carrying amounts of the transferred asset are allocated between the rights or obligations retained and those transferred on the basis of their relative fair values at the transfer date. Newly created rights and obligations are measured at their fair values at that date. Any difference between the consideration received and the amounts recognised and derecognised is recognised in surplus or deficit in the period of the transfer.
If the entity transfers a financial asset in a transfer that qualifies for derecognition in its entirety and retains the right to service the financial asset for a fee, it recognise either a servicing asset or a servicing liability for that servicing contract. If the fee to be received is not expected to compensate the entity adequately for performing the servicing, a servicing liability for the servicing obligation is recognised at its fair value. If the fee to be received is expected to be more than adequate compensation for the servicing, a servicing asset is recognised for the servicing right at an amount determined on the basis of an allocation of the carrying amount of the larger financial asset.
If, as a result of a transfer, a financial asset is derecognised in its entirety but the transfer results in the entity obtaining a new financial asset or assuming a new financial liability, or a servicing liability, the entity recognise the new financial asset, financial liability or servicing liability at fair value. On derecognition of a financial asset in its entirety, the difference between the carrying amount and the sum of the consideration received is recognised in surplus or deficit. If the transferred asset is part of a larger financial asset and the part transferred qualifies for derecognition in its entirety, the previous carrying amount of the larger financial asset is allocated between the part that continues to be recognised and the part that is derecognised, based on the relative fair values of those parts, on the date of the transfer. For this purpose, a retained servicing asset is treated as a part that continues to be recognised. The difference between the carrying amount allocated to the part derecognised and the sum of the consideration received for the part derecognised is recognised in surplus or deficit. If a transfer does not result in derecognition because the entity has retained substantially all the risks and rewards of ownership of the transferred asset, the entity continue to recognise the transferred asset in its entirety and recognise a financial liability for the consideration received. In subsequent periods, the entity recognises any revenue on the transferred asset and any expense incurred on the financial liability. Neither the asset, and the associated liability nor the revenue, and the associated expenses are offset.

133 | P a g e

134 | P a g e
Accounting Policies
1.9 Financial instruments (continued) Financial liabilities The entity removes a financial liability (or a part of a financial liability) from its statement of financial position when it is extinguished — i.e. when the obligation specified in the contract is discharged, cancelled, expires or waived. An exchange between an existing borrower and lender of debt instruments with substantially different terms is accounted for as having extinguished the original financial liability and a new financial liability is recognised. Similarly, a substantial modification of the terms of an existing financial liability or a part of it is accounted for as having extinguished the original financial liability and having recognised a new financial liability. The difference between the carrying amount of a financial liability (or part of a financial liability) extinguished or transferred to another party and the consideration paid, including any non‐cash assets transferred or liabilities assumed, is recognised in surplus or deficit. Any liabilities that are waived, forgiven or assumed by another entity by way of a non‐exchange transaction are accounted for in accordance with the Standard of GRAP on Revenue from Non‐exchange Transactions (Taxes and Transfers). Presentation Interest relating to a financial instrument or a component that is a financial liability is recognised as revenue or expense in surplus or deficit. Dividends or similar distributions relating to a financial instrument or a component that is a financial liability is recognised as revenue or expense in surplus or deficit. Losses and gains relating to a financial instrument or a component that is a financial liability is recognised as revenue or expense in surplus or deficit. Distributions to holders of residual interests are recognised by the entity directly in net assets. Transaction costs incurred on residual interests are accounted for as a deduction from net assets. Income tax [where applicable] relating to distributions to holders of residual interests and to transaction costs incurred on residual interests are accounted for in accordance with the International Accounting Standard on Income Taxes. A financial asset and a financial liability are only offset and the net amount presented in the statement of financial position when the entity currently has a legally enforceable right to set off the recognised amounts and intends either to settle on a net basis, or to realise the asset and settle the liability simultaneously. In accounting for a transfer of a financial asset that does not qualify for derecognition, the entity does not offset the transferred asset and the associated liability. Cash and cash equivalents Cash and cash equivalents comprise of cash on hand and demand deposits, and other short‐term highly liquid investments that are readily convertible to a known amount of cash and are subject to an insignificant risk of changes in value. These are initially and subsequently recorded at amortised cost. Fair value approximates the carrying amount. However, where the asset is not readily convertible into cash amounts for a period exceeding three months these are treated as investments. 1.10 Leases
A lease is classified as a finance lease if it transfers substantially all the risks and rewards incidental to ownership. A lease is classified as an operating lease if it does not transfer substantially all the risks and rewards incidental to ownership. When a lease includes both land and buildings elements, the entity assesses the classification of each element separately.

135 | P a g e
Accounting Policies
1.10 Leases (continued) Operating leases ‐ lessor Operating lease revenue is recognised as revenue on a straight‐line basis over the lease term. Initial direct costs incurred in negotiating and arranging operating leases are added to the carrying amount of the leased asset and recognised as an expense over the lease term on the same basis as the lease revenue. The aggregate cost of incentives is recognised as a reduction of rental revenue over the lease term on a straight‐line basis. The aggregate benefit of incentives is recognised as a reduction of rental expense over the lease term on a straight‐line basis. Income for leases is disclosed under revenue in statement of financial performance. 1.11 Inventories Inventories are initially measured at cost except where inventories are acquired through a non‐exchange transaction, then their costs are their fair value as at the date of acquisition. Subsequently inventories are measured at the lower of cost and net realisable value. Inventories are measured at the lower of cost and current replacement cost where they are held for;
Ÿ distribution at no charge or for a nominal charge; or Ÿ consumption in the production process of goods to be distributed at no charge or for a nominal charge.
Net realisable value is the estimated selling price in the ordinary course of operations less the estimated costs of completion and the estimated costs necessary to make the sale, exchange or distribution. Current replacement cost is the cost the municipality incurs to acquire the asset on the reporting date.
The cost of inventories comprises of all costs of purchase, costs of conversion and other costs incurred in bringing the inventories to their present location and condition. The cost of inventories of items that are not ordinarily interchangeable and goods or services produced and segregated for specific projects is assigned using specific identification of the individual costs. The cost of inventories is assigned using the weighted average cost formula. The same cost formula is used for all inventories having a similar nature and use to the municipality. When inventories are sold, the carrying amounts of those inventories are recognised as an expense in the period in which the related revenue is recognised. If there is no related revenue, the expenses are recognised when the goods are distributed, or related services are rendered. The amount of any write‐down of inventories to net realisable value or current replacement cost and all losses of inventories are recognised as an expense in the period the write‐down or loss occurs. The amount of any reversal of any write‐down of inventories, arising from an increase in net realisable value or current replacement cost, are recognised as a reduction in the amount of inventories recognised as an expense in the period in which the reversal occurs. 1.12 Impairment of cash‐generating assets
Cash‐generating assets are assets used with the objective of generating a commercial return. Commercial return means that positive cash flows are expected to be significantly higher than the cost of the asset. Impairment is a loss in the future economic benefits or service potential of an asset, over and above the systematic recognition of the loss of the asset’s future economic benefits or service potential through depreciation (amortisation). Carrying amount is the amount at which an asset is recognised in the statement of financial position after deducting any accumulated depreciation and accumulated impairment losses thereon.

136 | P a g e
A cash‐generating unit is the smallest identifiable group of assets used with the objective of generating a commercial return that generates cash inflows from continuing use that are largely independent of the cash inflows from other assets or groups of assets.

137 | P a g e
Accounting Policies
1.12 Impairment of cash‐generating assets (continued)
Costs of disposal are incremental costs directly attributable to the disposal of an asset, excluding finance costs and income tax expense. Depreciation (Amortisation) is the systematic allocation of the depreciable amount of an asset over its useful life. Fair value less costs to sell is the amount obtainable from the sale of an asset in an arm’s length transaction between knowledgeable, willing parties, less the costs of disposal. Recoverable amount of an asset or a cash‐generating unit is the higher its fair value less costs to sell and its value in use. Useful life is either:
Ÿ the period of time over which an asset is expected to be used by the municipality; or Ÿ the number of production or similar units expected to be obtained from the asset by the municipality.
1.13 Impairment of non‐cash‐generating assets
Cash‐generating assets are assets used with the objective of generating a commercial return. Commercial return means that positive cash flows are expected to be significantly higher than the cost of the asset. Non‐cash‐generating assets are assets other than cash‐generating assets.
Impairment is a loss in the future economic benefits or service potential of an asset, over and above the systematic recognition of the loss of the asset’s future economic benefits or service potential through depreciation (amortisation). Carrying amount is the amount at which an asset is recognised in the statement of financial position after deducting any accumulated depreciation and accumulated impairment losses thereon. A cash‐generating unit is the smallest identifiable group of assets managed with the objective of generating a commercial return that generates cash inflows from continuing use that are largely independent of the cash inflows from other assets or groups of assets. Costs of disposal are incremental costs directly attributable to the disposal of an asset, excluding finance costs and income tax expense. Depreciation (Amortisation) is the systematic allocation of the depreciable amount of an asset over its useful life. Fair value less costs to sell is the amount obtainable from the sale of an asset in an arm’s length transaction between knowledgeable, willing parties, less the costs of disposal. Recoverable service amount is the higher of a non‐cash‐generating asset’s fair value less costs to sell and its value in use. Useful life is either:
Ÿ the period of time over which an asset is expected to be used by the municipality; or Ÿ the number of production or similar units expected to be obtained from the asset by the municipality.
1.14 Employee benefits Employee benefits are all forms of consideration given by an entity in exchange for service rendered by employees.
A qualifying insurance policy is an insurance policy issued by an insurer that is not a related party (as defined in the Standard of GRAP on Related Party Disclosures) of the reporting entity, if the proceeds of the policy can be used only to pay or fund employee benefits under a defined benefit plan and are not available to the reporting entity’s own creditors (even in liquidation) and cannot be paid to the reporting entity, unless either:
Ÿ the proceeds represent surplus assets that are not needed for the policy to meet all the related employee benefit obligations; or
Ÿ the proceeds are returned to the reporting entity to reimburse it for employee benefits already paid. Termination benefits are employee benefits payable as a result of either:
Ÿ an entity’s decision to terminate an employee’s employment before the normal retirement date; or Ÿ an employee’s decision to accept voluntary redundancy in exchange for those benefits.

138 | P a g e
Accounting Policies
1.14 Employee benefits (continued)
Other long‐term employee benefits are employee benefits (other than post‐employment benefits and termination benefits) that are not due to be settled within twelve months after the end of the period in which the employees render the related service. Vested employee benefits are employee benefits that are not conditional on future employment. Composite social security programmes are established by legislation and operate as multi‐employer plans to provide post‐employment benefits as well as to provide benefits that are not consideration in exchange for service rendered by employees. A constructive obligation is an obligation that derives from an entity’s actions where by an established pattern of past practice, published policies or a sufficiently specific current statement, the entity has indicated to other parties that it will accept certain responsibilities and as a result, the entity has created a valid expectation on the part of those other parties that it will discharge those responsibilities. Short‐term employee benefits Short‐term employee benefits are employee benefits (other than termination benefits) that are due to be settled within twelve months after the end of the period in which the employees render the related service. Short‐term employee benefits include items such as:
Ÿ wages, salaries and social security contributions; Ÿ short‐term compensated absences (such as paid annual leave and paid sick leave) where the compensation for the
absences is due to be settled within twelve months after the end of the reporting period in which the employees render the related employee service;
Ÿ bonus, incentive and performance related payments payable within twelve months after the end of the reporting period in which the employees render the related service; and
Ÿ non‐monetary benefits (for example, medical care, and free or subsidised goods or services such as housing, cars and cellphones) for current employees.
When an employee has rendered service to the entity during a reporting period, the entity recognise the undiscounted amount of short‐term employee benefits expected to be paid in exchange for that service:
Ÿ as a liability (accrued expense), after deducting any amount already paid. If the amount already paid exceeds the undiscounted amount of the benefits, the entity recognise that excess as an asset (prepaid expense) to the extent that the prepayment will lead to, for example, a reduction in future payments or a cash refund; and
Ÿ as an expense, unless another Standard requires or permits the inclusion of the benefits in the cost of an asset. The expected cost of compensated absences is recognised as an expense as the employees render services that increase their entitlement or, in the case of non‐accumulating absences, when the absence occurs. The entity measure the expected cost of accumulating compensated absences as the additional amount that the entity expects to pay as a result of the unused entitlement that has accumulated at the reporting date.
The entity recognise the expected cost of bonus, incentive and performance related payments when the entity has a present legal or constructive obligation to make such payments as a result of past events and a reliable estimate of the obligation can be made. A present obligation exists when the entity has no realistic alternative but to make the payments. Post‐employment benefits
Post‐employment benefits are employee benefits (other than termination benefits) which are payable after the completion of employment. Post‐employment benefit plans are formal or informal arrangements under which an entity provides post‐employment benefits for one or more employees. Multi‐employer plans are defined contribution plans (other than state plans and composite social security programmes) or defined benefit plans (other than state plans) that pool the assets contributed by various entities that are not under common control and use those assets to provide benefits to employees of more than one entity, on the basis that contribution and benefit levels are determined without regard to the identity of the entity that employs the employees concerned.

139 | P a g e
Accounting Policies
1.14 Employee benefits (continued) Post‐employment benefits: Defined contribution plans Defined contribution plans are post‐employment benefit plans under which an entity pays fixed contributions into a separate entity (a fund) and will have no legal or constructive obligation to pay further contributions if the fund does not hold sufficient assets to pay all employee benefits relating to employee service in the current and prior periods. When an employee has rendered service to the entity during a reporting period, the entity recognise the contribution payable to a defined contribution plan in exchange for that service:
Ÿ as a liability (accrued expense), after deducting any contribution already paid. If the contribution already paid exceeds the contribution due for service before the reporting date, an entity recognise that excess as an asset (prepaid expense) to the extent that the prepayment will lead to, for example, a reduction in future payments or a cash refund; and
Ÿ as an expense, unless another Standard requires or permits the inclusion of the contribution in the cost of an asset.
Where contributions to a defined contribution plan do not fall due wholly within twelve months after the end of the reporting period in which the employees render the related service, they are discounted. The rate used to discount reflects the time value of money. The currency and term of the financial instrument selected to reflect the time value of money is consistent with the currency and estimated term of the obligation. Post‐employment benefits: Defined benefit plans Defined benefit plans are post‐employment benefit plans other than defined contribution plans.
Actuarial gains and losses comprise experience adjustments (the effects of differences between the previous actuarial assumptions and what has actually occurred) and the effects of changes in actuarial assumptions. In measuring its defined benefit liability the entity recognise actuarial gains and losses in surplus or deficit in the reporting period in which they occur. Assets held by a long‐term employee benefit fund are assets (other than non‐transferable financial instruments issued by the reporting entity) that are held by an entity (a fund) that is legally separate from the reporting entity and exists solely to pay or fund employee benefits and are available to be used only to pay or fund employee benefits, are not available to the reporting entity’s own creditors (even in liquidation), and cannot be returned to the reporting entity, unless either:
Ÿ the remaining assets of the fund are sufficient to meet all the related employee benefit obligations of the plan or the reporting entity; or
Ÿ the assets are returned to the reporting entity to reimburse it for employee benefits already paid.
Current service cost is the increase in the present value of the defined benefit obligation resulting from employee service in the current period. Interest cost is the increase during a period in the present value of a defined benefit obligation which arises because the benefits are one period closer to settlement. Past service cost is the change in the present value of the defined benefit obligation for employee service in prior periods, resulting in the current period from the introduction of, or changes to, post‐employment benefits or other long‐term employee benefits. Past service cost may be either positive (when benefits are introduced or changed so that the present value of the defined benefit obligation increases) or negative (when existing benefits are changed so that the present value of the defined benefit obligation decreases). In measuring its defined benefit liability the entity recognise past service cost as an expense in the reporting period in which the plan is amended. Plan assets comprise assets held by a long‐term employee benefit fund and qualifying insurance policies. The present value of a defined benefit obligation is the present value, without deducting any plan assets, of expected future payments required to settle the obligation resulting from employee service in the current and prior periods. The return on plan assets is interest, dividends or similar distributions and other revenue derived from the plan assets, together with realised and unrealised gains or losses on the plan assets, less any costs of administering the plan (other than those included in the actuarial assumptions used to measure the defined benefit obligation) and less any tax payable by the plan itself.

140 | P a g e
Accounting Policies
1.14 Employee benefits (continued) The entity account not only for its legal obligation under the formal terms of a defined benefit plan, but also for any constructive obligation that arises from the entity’s informal practices. Informal practices give rise to a constructive obligation where the entity has no realistic alternative but to pay employee benefits. An example of a constructive obligation is where a change in the entity’s informal practices would cause unacceptable damage to its relationship with employees. The amount recognised as a defined benefit liability is the net total of the following amounts:
Ÿ the present value of the defined benefit obligation at the reporting date; Ÿ minus the fair value at the reporting date of plan assets (if any) out of which the obligations are to be settled
directly; Ÿ plus any liability that may arise as a result of a minimum funding requirement
The amount determined as a defined benefit liability may be negative (an asset). The entity measure the resulting asset at the lower of:
Ÿ the amount determined above; and Ÿ the present value of any economic benefits available in the form of refunds from the plan or reductions in future
contributions to the plan. The present value of these economic benefits is determined using a discount rate which reflects the time value of money.
Any adjustments arising from the limit above is recognised in surplus or deficit. The entity determine the present value of defined benefit obligations and the fair value of any plan assets with sufficient regularity such that the amounts recognised in the annual financial statements do not differ materially from the amounts that would be determined at the reporting date. The entity recognises the net total of the following amounts in surplus or deficit, except to the extent that another Standard requires or permits their inclusion in the cost of an asset:
Ÿ current service cost; Ÿ interest cost; Ÿ the expected return on any plan assets and on any reimbursement rights; Ÿ actuarial gains and losses; Ÿ past service cost; Ÿ the effect of any curtailments or settlements; and Ÿ the effect of applying the limit on a defined benefit asset (negative defined benefit liability).
The entity uses the Projected Unit Credit Method to determine the present value of its defined benefit obligations and the related current service cost and, where applicable, past service cost. The Projected Unit Credit Method (sometimes known as the accrued benefit method pro‐rated on service or as the benefit/years of service method) sees each period of service as giving rise to an additional unit of benefit entitlement and measures each unit separately to build up the final obligation.
In determining the present value of its defined benefit obligations and the related current service cost and, where applicable, past service cost, an entity shall attribute benefit to periods of service under the plan’s benefit formula. However, if an employee’s service in later years will lead to a materially higher level of benefit than in earlier years, an entity shall attribute benefit on a straight‐line basis from:
Ÿ the date when service by the employee first leads to benefits under the plan (whether or not the benefits are conditional on further service); until
Ÿ the date when further service by the employee will lead to no material amount of further benefits under the plan, other than from further salary increases.
Actuarial valuations are conducted on an annual basis by independent actuaries separately for each plan. The results of the valuation are updated for any material transactions and other material changes in circumstances (including changes in market prices and interest rates) up to the reporting date. The entity recognises gains or losses on the curtailment or settlement of a defined benefit plan when the curtailment or settlement occurs. The gain or loss on a curtailment or settlement comprises:
Ÿ any resulting change in the present value of the defined benefit obligation; and Ÿ any resulting change in the fair value of the plan assets.

141 | P a g e
Before determining the effect of a curtailment or settlement, the entity re‐measure the obligation (and the related plan assets, if any) using current actuarial assumptions (including current market interest rates and other current market prices).

142 | P a g e
Accounting Policies
1.14 Employee benefits (continued)
When it is virtually certain that another party will reimburse some or all of the expenditure required to settle a defined benefit obligation, the right to reimbursement is recognised as a separate asset. The asset is measured at fair value. In all other respects, the asset is treated in the same way as plan assets. In surplus or deficit, the expense relating to a defined benefit plan is [OR is not] presented as the net of the amount recognised for a reimbursement. The entity offsets an asset relating to one plan against a liability relating to another plan when the entity has a legally enforceable right to use a surplus in one plan to settle obligations under the other plan and intends either to settle the obligations on a net basis, or to realise the surplus in one plan and settle its obligation under the other plan simultaneously. Actuarial assumptions Actuarial assumptions are unbiased and mutually compatible. Financial assumptions are based on market expectations, at the reporting date, for the period over which the obligations are to be settled. The rate used to discount post‐employment benefit obligations (both funded and unfunded) reflect the time value of money. The currency and term of the financial instrument selected to reflect the time value of money is consistent with the currency and estimated term of the post‐employment benefit obligations. Post‐employment benefit obligations are measured on a basis that reflects:
Ÿ estimated future salary increases; Ÿ the benefits set out in the terms of the plan (or resulting from any constructive obligation that goes beyond those
terms) at the reporting date; and Ÿ estimated future changes in the level of any state benefits that affect the benefits payable under a defined benefit
plan, if, and only if, either: Ÿ those changes were enacted before the reporting date; or Ÿ past history, or other reliable evidence, indicates that those state benefits will change in some predictable
manner, for example, in line with future changes in general price levels or general salary levels. Assumptions about medical costs take account of estimated future changes in the cost of medical services, resulting from both inflation and specific changes in medical costs. Other post retirement obligations
The municipality provides post‐retirement health care benefits, housing subsidies and gratuities upon retirement to some retirees. The entitlement to post‐retirement health care benefits is based on the employee remaining in service up to retirement age and the completion of a minimum service period. The expected costs of these benefits are accrued over the period of employment. Independent qualified actuaries carry out valuations of these obligations. The municipality also provides a gratuity and housing subsidy on retirement to certain employees. An annual charge to income is made to cover both these liabilities. The amount recognised as a liability for other long‐term employee benefits is the net total of the following amounts:
Ÿ the present value of the defined benefit obligation at the reporting date; Ÿ minus the fair value at the reporting date of plan assets (if any) out of which the obligations are to be settled
directly. The entity shall recognise the net total of the following amounts as expense or revenue, except to the extent that another Standard requires or permits their inclusion in the cost of an asset:
Ÿ current service cost; Ÿ interest cost; Ÿ the expected return on any plan assets and on any reimbursement right recognised as an asset; Ÿ actuarial gains and losses, which shall all be recognised immediately; Ÿ past service cost, which shall all be recognised immediately; and Ÿ the effect of any curtailments or settlements.

143 | P a g e
Accounting Policies
1.14 Employee benefits (continued) Termination benefits The entity recognises termination benefits as a liability and an expense when the entity is demonstrably committed to either:
Ÿ terminate the employment of an employee or group of employees before the normal retirement date; or Ÿ provide termination benefits as a result of an offer made in order to encourage voluntary redundancy.
The entity is demonstrably committed to a termination when the entity has a detailed formal plan for the termination and is without realistic possibility of withdrawal. The detailed plan includes post employment medical aid as a minimum
Ÿ the location, function, and approximate number of employees whose services are to be terminated; Ÿ the termination benefits for each job classification or function; and Ÿ the time at which the plan will be implemented.
Implementation begins as soon as possible and the period of time to complete implementation is such that material changes to the plan are not likely. Where termination benefits fall due more than 12 months after the reporting date, they are discounted using an appropriate discount rate. The rate used to discount the benefit reflects the time value of money. The currency and term of the financial instrument selected to reflect the time value of money is consistent with the currency and estimated term of the benefit. In the case of an offer made to encourage voluntary redundancy, the measurement of termination benefits shall be based on the number of employees expected to accept the offer. Provision for Staff Leave Liabilities for annual leave are recognised as they accrue to employees. The liability is based on the total amount of leave days due to employees at year‐end, capped at a maximum of 48 days, and also on the total remuneration package of the employee. Accumulating leave is carried forward and can be used in future periods, if the current period's entitlement is not used in full. All unused leave will be paid out to the specific employee at the end of that employee's employment term. Accumulated leave is vesting. Staff Bonuses Accrued Liabilities for staff bonuses are recognised as they are accrued to employees. The liability at year‐end is based on bonus accrued at year‐endfor each employee. 1.15 Commitments
Items are classified as commitments when an entity has committed itself to future transactions that will normally result in the outflow of cash. Disclosures are required in respect of unrecognised contractual commitments.
Commitments for which disclosure is necessary to achieve a fair presentation should be disclosed in a note to the financial statements, if both the following criteria are met:
Ÿ Contracts should be non‐cancellable or only cancellable at significant cost (for example, contracts for computer or building maintenance services); and
Ÿ Contracts should relate to something other than the routine, steady, state business of the entity – therefore salary commitments relating to employment contracts or social security benefit commitments are excluded.
1.16 Provisions and contingencies Provisions are recognised when:
Ÿ the municipality has a present obligation as a result of a past event; Ÿ it is probable that an outflow of resources embodying economic benefits or service potential will be required
to settle the obligation; and Ÿ a reliable estimate can be made of the obligation.

144 | P a g e
Accounting Policies
1.16 Provisions and contingencies (continued)
The amount of a provision is the best estimate of the expenditure expected to be required to settle the present obligation at the reporting date. Where the effect of time value of money is material, the amount of a provision is the present value of the expenditures expected to be required to settle the obligation. The discount rate is a pre‐tax rate that reflects current market assessments of the time value of money and the risks specific to the liability. Where some or all of the expenditure required to settle a provision is expected to be reimbursed by another party, the reimbursement is recognised when, and only when, it is virtually certain that reimbursement will be received if the municipality settles the obligation. The reimbursement is treated as a separate asset. The amount recognised for the reimbursement does not exceed the amount of the provision.
Provisions are reviewed at each reporting date and adjusted to reflect the current best estimate. Provisions are reversed if it is no longer probable that an outflow of resources embodying economic benefits or service potential will be required, to settle the obligation. Where discounting is used, the carrying amount of a provision increases in each period to reflect the passage of time. This increase is recognised as an interest expense. A provision is used only for expenditures for which the provision was originally recognised. Provisions are not recognised for future operating surplus (deficit). If an entity has a contract that is onerous, the present obligation (net of recoveries) under the contract is recognised and measured as a provision. A constructive obligation to restructure arises only when an entity:
Ÿ has a detailed formal plan for the restructuring, identifying at least: ‐ the activity/operating unit or part of a activity/operating unit concerned; ‐ the principal locations affected; ‐ the location, function, and approximate number of employees who will be compensated for services being terminated; ‐ the expenditures that will be undertaken; and ‐ when the plan will be implemented; and
Ÿ has raised a valid expectation in those affected that it will carry out the restructuring by starting to implement that plan or announcing its main features to those affected by it.
A restructuring provision includes only the direct expenditures arising from the restructuring, which are those that are both:
Ÿ necessarily entailed by the restructuring; and Ÿ not associated with the ongoing activities of the municipality
No obligation arises as a consequence of the sale or transfer of an operation until the municipality is committed to the sale or transfer, that is, there is a binding arrangement. After their initial recognition contingent liabilities recognised in entity combinations that are recognised separately are subsequently measured at the higher of:
Ÿ the amount that would be recognised as a provision; and Ÿ the amount initially recognised less cumulative amortisation.
A contingent liability is a possible obligation that arises from past events and whose existence will be confirmed only by the occurrence or non‐occurrence of one or more uncertain future events not wholly within the control of the municipality. A contingent liability could also be a present obligation that arises from past events, but is not recognised because it is not probable that an outflow of resources embodying economic benefits will be required to the obligation or the amount of the obligation cannot be measures with sufficient reliability.

145 | P a g e
The municipality does not recognise a contingent liability or contingent asset. A contingent liability is disclosed unless the probability of an outflow of resources embodying economic benefits or service potential is remote. A contingent asset is disclosed where the inflow of economic benefits or service potential is probable

146 | P a g e
Accounting Policies
1.16 Provisions and contingencies (continued) Management judgement is required when recognising and measuring contingent liabilities. Contingent assets and contingent liabilities are not recognised. Contingencies are disclosed in note 37. A financial guarantee contract is a contract that requires the issuer to make specified payments to reimburse the holder for a loss it incurs because a specified debtor fails to make payment when due in accordance with the original or modified terms of a debt instrument. Loan commitment is a firm commitment to provide credit under pre‐specified terms and conditions.
The municipality recognises a provision for financial guarantees and loan commitments when it is probable that an outflow of resources embodying economic benefits and service potential will be required to settle the obligation and a reliable estimate of the obligation can be made. Determining whether an outflow of resources is probable in relation to financial guarantees requires judgement. Indications that an outflow of resources may be probable are:
Ÿ financial difficulty of the debtor; Ÿ defaults or delinquencies in interest and capital repayments by the debtor; Ÿ breaches of the terms of the debt instrument that result in it being payable earlier than the agreed term and the
ability of the debtor to settle its obligation on the amended terms; and Ÿ a decline in prevailing economic circumstances (e.g. high interest rates, inflation and unemployment) that impact
on the ability of entities to repay their obligations. Where a fee is received by the municipality for issuing a financial guarantee and/or where a fee is charged on loan commitments, it is considered in determining the best estimate of the amount required to settle the obligation at reporting date. Where a fee is charged and the municipality considers that an outflow of economic resources is probable, an municipality recognises the obligation at the higher of:
Ÿ the amount determined using in the Standard of GRAP on Provisions, Contingent Liabilities and Contingent Assets; and
Ÿ the amount of the fee initially recognised less, where appropriate, cumulative amortisation recognised in accordance with the Standard of GRAP on Revenue from Exchange Transactions.
1.17 Revenue from exchange transactions Revenue is the gross inflow of economic benefits or service potential during the reporting period when those inflows result in an increase in net assets, other than increases relating to contributions from owners. An exchange transaction is one in which the municipality receives assets or services, or has liabilities extinguished, and directly gives approximately equal value (primarily in the form of goods, services or use of assets) to the other party in exchange. Fair value is the amount for which an asset could be exchanged, or a liability settled, between knowledgeable, willing parties in an arm’s length transaction. Measurement Revenue is measured at the fair value of the consideration received or receivable, net of trade discounts and volume rebates. Sale of goods Revenue from the sale of goods is recognised when all the following conditions have been satisfied:
Ÿ the municipality has transferred to the purchaser the significant risks and rewards of ownership of the goods; Ÿ the municipality retains neither continuing managerial involvement to the degree usually associated with
ownership nor effective control over the goods sold; Ÿ the amount of revenue can be measured reliably; Ÿ it is probable that the economic benefits or service potential associated with the transaction will flow to the
municipality; and Ÿ the costs incurred or to be incurred in respect of the transaction can be measured reliably.

147 | P a g e
Accounting Policies
1.17 Revenue from exchange transactions (continued) Rendering of services
When the outcome of a transaction involving the rendering of services can be estimated reliably, revenue associated with the transaction is recognised by reference to the stage of completion of the transaction at the reporting date. The outcome of a transaction can be estimated reliably when all the following conditions are satisfied:
Ÿ the amount of revenue can be measured reliably; Ÿ it is probable that the economic benefits or service potential associated with the transaction will flow to the
municipality; Ÿ the stage of completion of the transaction at the reporting date can be measured reliably; and Ÿ the costs incurred for the transaction and the costs to complete the transaction can be measured reliably.
When services are performed by an indeterminate number of acts over a specified time frame, revenue is recognised on a straight line basis over the specified time frame unless there is evidence that some other method better represents the stage of completion. When a specific act is much more significant than any other acts, the recognition of revenue is postponed until the significant act is executed. When the outcome of the transaction involving the rendering of services cannot be estimated reliably, revenue is recognised only to the extent of the expenses recognised that are recoverable. Service revenue is recognised by reference to the stage of completion of the transaction at the reporting date. Stage of completion is determined by services performed to date as a percentage of total services to be performed. Interest, royalties and dividends Revenue arising from the use by others of entity assets yielding interest, royalties and dividends or similar distributions is recognised when:
Ÿ It is probable that the economic benefits or service potential associated with the transaction will flow to the municipality, and
Ÿ The amount of the revenue can be measured reliably. Interest is recognised, in surplus or deficit, using the effective interest rate method. Royalties are recognised as they are earned in accordance with the substance of the relevant agreements. Dividends or similar distributions are recognised, in surplus or deficit, when the municipality’s right to receive payment has been established. Service fees included in the price of the product are recognised as revenue over the period during which the service is performed. Pre‐paid electricity
Prepaid electricity revenue is recognised at the point of sale. Revenue is measured at the fair value of the consideration received or receivable, net of trade discounts and volume rebates. Pre‐paid electricity sales are reconciled on a monthly basis and the sum of the monthly sales provides the total sales for the year. The financial year is divided in two seasons based on the application of tariffs with the seasons being summer (1 September – 31 May) and winter (1 June to 31 August). The deferred portion of revenue is accounted for by an adjustment for units not consumed at year end. This adjustment is based on the average consumption history, multiplied by the weighted average cost of units sold in June. Average consumption in units is determined per active prepaid meter using a trend analysis of historical consumer purchase data per meter for the months of May, June and July.The deferred portion of revenue is the amount by which the actual prepaid electricity sold for the month of June exceeds the average consumption calculated. 1.18 Revenue from non‐exchange transactions Revenue comprises gross inflows of economic benefits or service potential received and receivable by an municipality, which represents an increase in net assets, other than increases relating to contributions from owners.

148 | P a g e
Conditions on transferred assets are stipulations that specify that the future economic benefits or service potential embodied in the asset is required to be consumed by the recipient as specified or future economic benefits or service potential must be returned to the transferor.

149 | P a g e
Accounting Policies
1.18 Revenue from non‐exchange transactions (continued)
Control of an asset arise when the municipality can use or otherwise benefit from the asset in pursuit of its objectives and can exclude or otherwise regulate the access of others to that benefit. Exchange transactions are transactions in which one entity receives assets or services, or has liabilities extinguished, and directly gives approximately equal value (primarily in the form of cash, goods, services, or use of assets) to another entity in exchange. Expenses paid through the tax system are amounts that are available to beneficiaries regardless of whether or not they pay taxes. Fines are economic benefits or service potential received or receivable by entities, as determined by a court or other law enforcement body, as a consequence of the breach of laws or regulations. Non‐exchange transactions are transactions that are not exchange transactions. In a non‐exchange transaction, an municipality either receives value from another municipality without directly giving approximately equal value in exchange, or gives value to another municipality without directly receiving approximately equal value in exchange. Restrictions on transferred assets are stipulations that limit or direct the purposes for which a transferred asset may be used, but do not specify that future economic benefits or service potential is required to be returned to the transferor if not deployed as specified. Stipulations on transferred assets are terms in laws or regulation, or a binding arrangement, imposed upon the use of a transferred asset by entities external to the reporting municipality. Tax expenditures are preferential provisions of the tax law that provide certain taxpayers with concessions that are not available to others. The taxable event is the event that the government, legislature or other authority has determined will be subject to taxation.
Taxes are economic benefits or service potential compulsorily paid or payable to entities, in accordance with laws and or regulations, established to provide revenue to government. Taxes do not include fines or other penalties imposed for breaches of the law. Transfers are inflows of future economic benefits or service potential from non‐exchange transactions, other than taxes. Recognition An inflow of resources from a non‐exchange transaction recognised as an asset is recognised as revenue, except to the extent that a liability is also recognised in respect of the same inflow. As the municipality satisfies a present obligation recognised as a liability in respect of an inflow of resources from a non‐exchange transaction recognised as an asset, it reduces the carrying amount of the liability recognised and recognises an amount of revenue equal to that reduction. Measurement Revenue from a non‐exchange transaction is measured at the amount of the increase in net assets recognised by the municipality. When, as a result of a non‐exchange transaction, the municipality recognises an asset, it also recognises revenue equivalent to the amount of the asset measured at its fair value as at the date of acquisition, unless it is also required to recognise a liability. Where a liability is required to be recognised it will be measured as the best estimate of the amount required to settle the obligation at the reporting date, and the amount of the increase in net assets, if any, recognised as revenue. When a liability is subsequently reduced, because the taxable event occurs or a condition is satisfied, the amount of the reduction in the liability is recognised as revenue.

150 | P a g e
Accounting Policies
1.18 Revenue from non‐exchange transactions (continued) Taxes
The municipality recognises an asset in respect of taxes when the taxable event occurs and the asset recognition criteria are met. Resources arising from taxes satisfy the definition of an asset when the municipality controls the resources as a result of a past event (the taxable event) and expects to receive future economic benefits or service potential from those resources. Resources arising from taxes satisfy the criteria for recognition as an asset when it is probable that the inflow of resources will occur and their fair value can be reliably measured. The degree of probability attached to the inflow of resources is determined on the basis of evidence available at the time of initial recognition, which includes, but is not limited to, disclosure of the taxable event by the taxpayer. The municipality analyses the taxation laws to determine what the taxable events are for the various taxes levied. The taxable event for income tax is the earning of assessable income during the taxation period by the taxpayer. The taxable event for value added tax is the undertaking of taxable activity during the taxation period by the taxpayer. The taxable event for customs duty is the movement of dutiable goods or services across the customs boundary. The taxable event for estate duty is the death of a person owning taxable property. The taxable event for property tax is the passing of the date on which the tax is levied, or the period for which the tax is levied, if the tax is levied on a periodic basis. Taxation revenue is determined at a gross amount. It is not reduced for expenses paid through the tax system. Transfers
Apart from Services in kind, which are not recognised, the municipality recognises an asset in respect of transfers when the transferred resources meet the definition of an asset and satisfy the criteria for recognition as an asset. The municipality recognises an asset in respect of transfers when the transferred resources meet the definition of an asset and satisfy the criteria for recognition as an asset. Transferred assets are measured at their fair value as at the date of acquisition. Fines Fines are recognised as revenue when the receivable meets the definition of an asset and satisfies the criteria for recognition as an asset. Assets arising from fines are measured at the best estimate of the inflow of resources to the municipality. Where the municipality collects fines in the capacity of an agent, the fine will not be revenue of the collecting entity. Gifts and donations, including goods in‐kind
Gifts and donations, including goods in kind, are recognised as assets and revenue when it is probable that the future economic benefits or service potential will flow to the municipality and the fair value of the assets can be measured reliably. Services in‐kind
Except for financial guarantee contracts, the municipality recognise services in‐kind that are significant to its operations and/or service delivery objectives as assets and recognise the related revenue when it is probable that the future economic benefits or service potential will flow to the municipality and the fair value of the assets can be measured reliably. Where services in‐kind are not significant to the municipality’s operations and/or service delivery objectives and/or do not satisfy the criteria for recognition, the municipality disclose the nature and type of services in‐kind received during the reporting period.

151 | P a g e
Accounting Policies
1.19 Investment income Investment income is recognised on a time‐proportion basis using the effective interest method. 1.20 Borrowing costs Borrowing costs are interest and other expenses incurred by an entity in connection with the borrowing of funds. Borrowing costs are recognised as an expense in the period in which they are incurred. 1.21 Comparative figures Where necessary, comparative figures have been reclassified to conform to changes in presentation in the current year. 1.22 Unauthorised expenditure Unauthorised expenditure means:
Ÿ overspending of a vote or a main division within a vote; and Ÿ expenditure not in accordance with the purpose of a vote or, in the case of a main division, not in accordance with
the purpose of the main division. All expenditure relating to unauthorised expenditure is recognised as an expense in the statement of financial performance in the year that the expenditure was incurred. The expenditure is classified in accordance with the nature of the expense, and where recovered, it is subsequently accounted for as revenue in the statement of financial performance. 1.23 Fruitless and wasteful expenditure
Fruitless expenditure means expenditure which was made in vain and would have been avoided had reasonable care been exercised. All expenditure relating to fruitless and wasteful expenditure is recognised as an expense in the statement of financial performance in the year that the expenditure was incurred. The expenditure is classified in accordance with the nature of the expense, and where recovered, it is subsequently accounted for as revenue in the statement of financial performance. 1.24 Irregular expenditure Where irregular expenditure was incurred in the previous financial year and is only condoned in the following financial year, the register and the disclosure note to the financial statements must be updated with the amount condoned. Irregular expenditure that was incurred and identified during the current financial year and which was not condoned by the National Treasury or the relevant authority must be recorded appropriately in the irregular expenditure register. If liability for the irregular expenditure can be attributed to a person, a debt account must be created if such a person is liable in law. Immediate steps must thereafter be taken to recover the amount from the person concerned. If recovery is not possible, the accounting officer or accounting authority may write off the amount as debt impairment and disclose such in the relevant note to the financial statements. The irregular expenditure register must also be updated accordingly. If the irregular expenditure has not been condoned and no person is liable in law, the expenditure related thereto must remain against the relevant programme/expenditure item, be disclosed as such in the note to the financial statements and updated accordingly in the irregular expenditure register. Irregular expenditure is expenditure that is contrary to the Municipal Finance Management Act (Act No.56 of 2003), the Municipal Systems Act (Act No.32 of 2000), and the Public Office Bearers Act (Act No. 20 of 1998) or is in contravention of the economic entity’s supply chain management policy. Irregular expenditure excludes unauthorised expenditure. Irregular expenditure is accounted for as expenditure in the Statement of Financial Performance and where recovered, it is subsequently accounted for as revenue in the Statement of Financial Performance.

152 | P a g e
Accounting Policies
1.25 Use of estimates
The preparation of annual financial statements in conformity with Standards of GRAP requires the use of certain critical accounting estimates. It also requires management to exercise its judgement in the process of applying the municipality’s accounting policies. The areas involving a higher degree of judgement or complexity, or areas where assumptions and estimates are significant to the annual financial statements are disclosed in the relevant sections of the annual financial statements. Although these estimates are based on management’s best knowledge of current events and actions they may undertake in the future, actual results ultimately may differ from those estimates. 1.26 Conditional grants and receipts Revenue received from conditional grants, donations and funding are recognised as revenue to the extent that the municipality has complied with any of the criteria, conditions or obligations embodied in the agreement. To the extent that the criteria, conditions or obligations have not been met a liability is recognised. 1.27 Materiality Material omissions or misstatements of items are material if they could, individually or collectively, influence the decision or assessments of users made on the basis of the financial statement. Materiality depends on the nature or size of the omission or mistatements judged in the surrounding circumstances. The nature or size of the information item, or a combination of both, could be the determining factor. Materiality is determined as 1% of total expenditure. This materiality is from management's perspective and does not correlate with the auditor's materiality. 1.28 Budget information Municipality are typically subject to budgetary limits in the form of appropriations or budget authorisations (or equivalent), which is given effect through authorising legislation, appropriation or similar. General purpose financial reporting by municipality shall provide information on whether resources were obtained and used in accordance with the legally adopted budget. The approved budget is prepared on a accrual basis and presented by economic classification linked to performance outcome objectives. The approved budget covers the fiscal period from 2017/07/01 to 2018/06/30. The budget for the economic entity includes all the entities approved budgets under its control.
The annual financial statements and the budget are on the same basis of accounting therefore a comparison with the budgeted amounts for the reporting period have been included in the Statement of comparison of budget and actual amounts. 1.29 Related parties A related party is a person or an entity with the ability to control or jointly control the other party, or exercise significant influence over the other party, or vice versa, or an entity that is subject to common control, or joint control. Control is the power to govern the financial and operating policies of an entity so as to obtain benefits from its activities. Joint control is the agreed sharing of control over an activity by a binding arrangement, and exists only when the strategic financial and operating decisions relating to the activity require the unanimous consent of the parties sharing control (the venturers). Related party transaction is a transfer of resources, services or obligations between the reporting entity and a related party, regardless of whether a price is charged. Significant influence is the power to participate in the financial and operating policy decisions of an entity, but is not control over those policies. Management are those persons responsible for planning, directing and controlling the activities of the municipality, including those charged with the governance of the municipality in accordance with legislation, in instances where they are required to perform such functions.

153 | P a g e
Accounting Policies
1.29 Related parties (continued)
Close members of the family of a person are considered to be those family members who may be expected to influence, or be influenced by, that management in their dealings with the municipality. The municipality is exempt from disclosure requirements in relation to related party transactions if that transaction occurs within normal supplier and/or client/recipient relationships on terms and conditions no more or less favourable than those which it is reasonable to expect the municipality to have adopted if dealing with that individual entity or person in the same circumstances and terms and conditions are within the normal operating parameters established by that reporting entity's legal mandate. Where the municipality is exempt from the disclosures in accordance with the above, the municipality discloses narrative information about the nature of the transactions and the related outstanding balances, to enable users of the entity’s financial statements to understand the effect of related party transactions on its annual financial statements. 1.30 Events after reporting date Events after reporting date are those events, both favourable and unfavourable, that occur between the reporting date and the date when the financial statements are authorised for issue. Two types of events can be identified:
Ÿ those that provide evidence of conditions that existed at the reporting date (adjusting events after the reporting date); and
Ÿ those that are indicative of conditions that arose after the reporting date (non‐adjusting events after the reporting date).
The municipality will adjust the amount recognised in the financial statements to reflect adjusting events after the reporting date once the event occurred. The municipality will disclose the nature of the event and an estimate of its financial effect or a statement that such estimate cannot be made in respect of all material non‐adjusting events, where non‐disclosure could influence the economic decisions of users taken on the basis of the financial statements. 1.31 Value Added Tax (VAT) The municipality accounts for VAT on the cash basis. The municipality is liable to account for VAT at the standard rate 15% as from 1 April 2018 (2017: 14%) in terms of section 7 (1) (a) of the VAT Act in respect of the supply of goods or services, except where the supplies are specifically zero‐rated in terms of section 11, exempted in terms of section 12 of the VAT Act or are scoped out for VAT purposes. The Municipality accounts for VAT on a bi‐monthly basis. 1.32 Accumulated surplus The municipality’s surplus or deficit for the year is accounted for in the accumulated surplus in the statement of changes in net assets. The accumulated surplus/deficit represents the net difference between total assets and total liabilities of the municipality. Any surpluses and deficits realised during a specific financial year are credited/debited against accumulated surplus/deficit. Prior year adjustments relating to income and expenditure are debited/credited against accumulated surplus when retrospective adjustments are made.

154 | P a g e
Notes to the Annual Financial Statements Figures in Rand 2018 2017
2. New standards and interpretations 2.1 Standards and interpretations issued, but not yet effective The municipality has not applied the following standards and interpretations, which have been published and are mandatory for the municipality’s accounting periods beginning on or after 01 July 2018 or later periods: GRAP 110: Living and Non‐living Resources The objective of this Standard is to prescribe the:
Ÿ recognition, measurement, presentation and disclosure requirements for living resources; and Ÿ disclosure requirements for non‐living resources
It furthermore covers Definitions, Recognition, Measurement, Depreciation, Impairment, Compensation for impairment, Transfers, Derecognition, Disclosure, Transitional provisions and Effective date. The effective date of the standard is not yet set by the Minister of Finance. The municipality expects to adopt the standard for the first time when the Minister sets the effective date for the standard. The impact of this standard is currently being assessed. GRAP 110 (as amended 2016): Living and Non‐living Resources
Amendments to the Standard of GRAP on Living and Non‐living Resources resulted from editorial changes to the original text and inconsistencies in measurement requirements in GRAP 23 and other asset‐related Standards of GRAP in relation to the treatment of transaction costs. Other changes resulted from changes made to IPSAS 17 on Property, Plant and Equipment (IPSAS 17) as a result of the IPSASB’s Improvements to IPSASs 2014 issued in January 2015 and Improvements to IPSASs 2015 issued in March 2016. The most significant changes to the Standard are:
Ÿ General improvements: To clarify the treatment of transaction costs and other costs incurred on assets acquired in non‐exchange transactions to be in line with the principle in GRAP 23; and To clarify the measurement principle when assets may be acquired in exchange for a non‐monetary asset or assets, or a combination of monetary and non‐monetary assets
Ÿ IPSASB amendments: To clarify the revaluation methodology of the carrying amount and accumulated depreciation when a living resource is revalued; To clarify acceptable methods of depreciating assets; and To define a bearer plant and include bearer plants within the scope of GRAP 17 or GRAP 110, while the produce growing on bearer plants will remain within the scope of GRAP 27
The effective date of the amendment is for years beginning on or after 01 April 2020. The municipality expects to adopt the amendment for the first time in the 2020 annual financial statements. It is unlikely that the amendment will have a material impact on the municipality's annual financial statements. GRAP 7 (as revised 2010): Investments in Associates
Paragraphs .03 and .42 were amended by the Improvements to the Standards of GRAP issued in November 2010. An entity shall apply these amendments prospectively for annual financial periods beginning on or after the effective date [in conjunction with the effective date to be determined by the Minister of Finance for GRAP 105, 106 and 107]. If an entity elects to apply these amendments earlier, it shall disclose this fact.
The Standards of GRAP on Transfer of Functions Between Entities Under Common Control, Transfer of Functions Between Entities Not Under Common Control and Mergers amended paragraphs .22, .28 and .38 and added paragraph .24. An entity shall apply these amendments and addition when it applies the Standards of GRAP on Transfer of Functions Between Entities Under Common Control, Transfer of Functions Between Entities Not Under Common Control and Mergers.

155 | P a g e
Notes to the Annual Financial Statements
2. New standards and interpretations (continued) An municipality shall apply this amendment for annual financial statements covering periods beginning on or after the effective date [in conjunction with the effective date to be determined by the Minister of Finance for GRAP 105, 106 and 107]. The municipality expects to adopt the amendment for the first time in the 2019 annual financial statements. It is unlikely that the amendment will have a material impact on the municipality's annual financial statements. GRAP 20: Related parties The objective of this standard is to ensure that a reporting entity’s annual financial statements contain the disclosures necessary to draw attention to the possibility that its financial position and surplus or deficit may have been affected by the existence of related parties and by transactions and outstanding balances with such parties. An entity that prepares and presents financial statements under the accrual basis of accounting (in this standard referred to as the reporting entity) shall apply this standard in:
Ÿ identifying related party relationships and transactions; Ÿ identifying outstanding balances, including commitments, between an entity and its related parties; Ÿ identifying the circumstances in which disclosure of the items in (a) and (b) is required; and Ÿ determining the disclosures to be made about those items.
This standard requires disclosure of related party relationships, transactions and outstanding balances, including commitments, in the consolidated and separate financial statements of the reporting entity in accordance with the Standard of GRAP on Consolidated and Separate Financial Statements. This standard also applies to individual annual financial statements. Disclosure of related party transactions, outstanding balances, including commitments, and relationships with related parties may affect users’ assessments of the financial position and performance of the reporting entity and its ability to deliver agreed services, including assessments of the risks and opportunities facing the entity. This disclosure also ensures that the reporting entity is transparent about its dealings with related parties.
The standard states that a related party is a person or an entity with the ability to control or jointly control the other party, or exercise significant influence over the other party, or vice versa, or an entity that is subject to common control, or joint control. As a minimum, the following are regarded as related parties of the reporting entity:
Ÿ A person or a close member of that person’s family is related to the reporting entity if that person: ‐ has control or joint control over the reporting entity; ‐ has significant influence over the reporting entity; ‐ is a member of the management of the entity or its controlling entity.
Ÿ An entity is related to the reporting entity if any of the following conditions apply: ‐ the entity is a member of the same economic entity (which means that each controlling entity, controlled entity and fellow controlled entity is related to the others); ‐ one entity is an associate or joint venture of the other entity (or an associate or joint venture of a member of an economic entity of which the other entity is a member); ‐ both entities are joint ventures of the same third party; ‐ one entity is a joint venture of a third entity and the other entity is an associate of the third entity; ‐ the entity is a post‐employment benefit plan for the benefit of employees of either the entity or an entity related to the entity. If the reporting entity is itself such a plan, the sponsoring employers are related to the entity; ‐ the entity is controlled or jointly controlled by a person identified in (a); and ‐ a person identified in (a)(i) has significant influence over that entity or is a member of the management of that entity (or its controlling entity).
The standard furthermore states that related party transaction is a transfer of resources, services or obligations between the reporting entity and a related party, regardless of whether a price is charged. The standard elaborates on the definitions and identification of:
Ÿ Close member of the family of a person; Ÿ Management;

156 | P a g e
Ÿ Related parties; Ÿ Remuneration; and

157 | P a g e
Notes to the Annual Financial Statements
2. New standards and interpretations (continued) Significant influence
The standard sets out the requirements, inter alia, for the disclosure of:
Ÿ Control; Ÿ Related party transactions; and Ÿ Remuneration of management
The effective date of the standard is not yet set by the Minister of Finance. The municipality expects to adopt the standard for the first time when the Minister sets the effective date for the standard. The adoption of this standard is not expected to impact on the results of the municipality, but may result in more disclosure than is currently provided in the annual financial statements. GRAP 105: Transfers of functions between entities under common control The objective of this Standard is to establish accounting principles for the acquirer and transferor in a transfer of functions between entities under common control. It requires an acquirer and a transferor that prepares and presents financial statements under the accrual basis of accounting to apply this Standard to a transaction or event that meets the definition of a transfer of functions. It includes a diagram and requires that entities consider the diagram in determining whether this Standard should be applied in accounting for a transaction or event that involves a transfer of functions or merger. It furthermore covers Definitions, Identifying the acquirer and transferor, Determining the transfer date, Assets acquired or transferred and liabilities assumed or relinquished, Accounting by the acquirer and transferor, Disclosure, Transitional provisions as well as the Effective date of the standard. The effective date of the standard is for years beginning on or after 01 April 2019. The municipality expects to adopt the standard for the first time in the 2019 annual financial statements. It is unlikely that the amendment will have a material impact on the municipality's annual financial statements. GRAP 107: Mergers The objective of this Standard is to establish accounting principles for the acquirer in a transfer of functions between entities not under common control. It requires an entity that prepares and presents financial statements under the accrual basis of accounting to apply this Standard to a transaction or other event that meets the definition of a transfer of functions. It includes a diagram and requires that entities consider the diagram in determining whether this Standard should be applied in accounting for a transaction or event that involves a transfer of functions or merger. It furthermore covers Definitions, Identifying a transfer of functions between entities not under common control, The acquisition method, Recognising and measuring the difference between the assets acquired and liabilities assumed and the consideration transferred, Measurement period, Determining what is part of a transfer of functions, Subsequent measurement and accounting, Disclosure, Transitional provisions as well as the Effective date of the standard. The effective date of the standard is for years beginning on or after 01 April 2019. The municipality expects to adopt the standard for the first time in the 2019 annual financial statements. It is unlikely that the amendment will have a material impact on the municipality's annual financial statements. GRAP 108: Statutory Receivables
The objective of this Standard is: to prescribe accounting requirements for the recognition, measurement, presentation and disclosure of statutory receivables. It furthermore covers: Definitions, recognition, derecognition, measurement, presentation and disclosure, transitional provisions, as well as the effective date.

158 | P a g e
The effective date of the standard is not yet set by the Minister of Finance.

159 | P a g e
Notes to the Annual Financial Statements
2. New standards and interpretations (continued) The municipality expects to adopt the standard for the first time when the Minister sets the effective date for the standard. It is unlikely that the standard will have a material impact on the municipality's annual financial statements. GRAP 109: Accounting by Principals and Agents
The objective of this Standard is to outline principles to be used by an entity to assess whether it is party to a principal‐agent arrangement, and whether it is a principal or an agent in undertaking transactions in terms of such an arrangement. The Standard does not introduce new recognition or measurement requirements for revenue, expenses, assets and/or liabilities that result from principal‐agent arrangements. The Standard does however provide guidance on whether revenue, expenses, assets and/or liabilities should be recognised by an agent or a principal, as well as prescribe what information should be disclosed when an entity is a principal or an agent.
It furthermore covers Definitions, Identifying whether an entity is a principal or agent, Accounting by a principal or agent, Presentation, Disclosure, Transitional provisions and Effective date. The effective date of the standard is not yet set by the Minister of Finance. The municipality expects to adopt the standard for the first time when the Minister sets the effective date for the standard. It is unlikely that the standard will have a material impact on the municipality's annual financial statements. IGRAP 18: Interpretation of the Standard of GRAP on Recognition and Derecognition of Land
This Interpretation of the Standards of GRAP applies to the initial recognition and derecognition of land in an entity’s financial statements. It also considers joint control of land by more than one entity. When an entity concludes that it controls the land after applying the principles in this Interpretation of the Standards of GRAP, it applies the applicable Standard of GRAP, i.e. the Standard of GRAP on Inventories, Investment Property (GRAP 16), Property, Plant and Equipment (GRAP 17) or Heritage Assets. As this Interpretation of the Standards of GRAP does not apply to the classification, initial and subsequent measurement, presentation and disclosure requirements of land, the entity applies the applicable Standard of GRAP to account for the land once control of the land has been determined. An entity also applies the applicable Standards of GRAP to the derecognition of land when it concludes that it does not control the land after applying the principles in this Interpretation of the Standards of GRAP.
In accordance with the principles in the Standards of GRAP, buildings and other structures on the land are accounted for separately. These assets are accounted for separately as the future economic benefits or service potential embodied in the land differs from those included in buildings and other structures. The recognition and derecognition of buildings and other structures are not addressed in this Interpretation of the Standards of GRAP. The effective date of the interpretation is for years beginning on or after 01 April 2019. The municipality expects to adopt the interpretation for the first time in the 2019 annual financial statements. It is unlikely that the interpretation will have a material impact on the municipality's annual financial statements. GRAP 12 (as amended 2016): Inventories Amendments to the Standard of GRAP on Inventories resulted from inconsistencies in measurement requirements in GRAP 23 and other asset‐related Standards of GRAP in relation to the treatment of transaction costs. Other changes resulted from changes made to IPSAS 12 on Inventories (IPSAS 12) as a result of the IPSASB’s Improvements to IPSASs 2015 issued in March 2016. The most significant changes to the Standard are:
Ÿ General improvements: To clarify the treatment of transaction costs and other costs incurred on assets acquired in non‐exchange transactions to be in line with the principle in GRAP 23 (paragraph .12)

160 | P a g e
Ÿ IPSASB amendments: To align terminology in GRAP 12 with that in IPSAS 12. The term “ammunition” in IPSAS 12 was replaced with the term “military inventories” and provides a description of what it comprises in accordance with Government Finance Statistics terminology

161 | P a g e
Notes to the Annual Financial Statements
2. New standards and interpretations (continued) The effective date of the amendment is for years beginning on or after 01 April 2018. The municipality expects to adopt the amendment for the first time in the 2018 annual financial statements. It is unlikely that the amendment will have a material impact on the municipality's annual financial statements. GRAP 17 (as amended 2016): Property, Plant and Equipment
Amendments to the Standard of GRAP on Property, Plant and Equipment resulted from editorial changes to the original text and inconsistencies in measurement requirements in GRAP 23 and other asset‐related Standards of GRAP in relation to the treatment of transaction costs. Other changes resulted from changes made to IPSAS 17 on Property, Plant and Equipment (IPSAS 17) as a result of the IPSASB’s Improvements to IPSASs 2014 issued in January 2015 and Improvements to IPSASs 2015 issued in March 2016. The most significant changes to the Standard are:
Ÿ General improvements: To clarify the treatment of transaction costs and other costs incurred on assets acquired in non‐exchange transactions to be in line with the principle in GRAP 23 (paragraph .12); and To clarify the measurement principle when assets may be acquired in exchange for a non‐monetary asset or assets, or a combination of monetary and non‐monetary assets.
Ÿ IPSASB amendments: To clarify the revaluation methodology of the carrying amount and accumulated depreciation when an item of property, plant, and equipment is revalued; To clarify acceptable methods of depreciating assets; To align terminology in GRAP 17 with that in IPSAS 17. The term “specialist military equipment” in IPSAS 17 was replaced with the term “weapon systems” and provides a description of what it comprises in accordance with Government Finance Statistics terminology; and To define a bearer plant and include bearer plants within the scope of GRAP 17, while the produce growing on bearer plants will remain within the scope of GRAP 27.
The effective date of the amendment is for years beginning on or after 01 April 2018. The municipality expects to adopt the amendment for the first time in the 2018 annual financial statements. The impact of this amendment is currently being assessed. GRAP 21 (as amended 2016): Impairment of non‐cash‐generating assets Amendments to the Standard of GRAP on Impairment of Non‐cash Generating Assets resulted from changes made to IPSAS 21 on Impairment of Non‐Cash‐Generating Assets (IPSAS 21) as a result of the IPSASB’s Impairment of Revalued Assets issued in March 2016. The most significant changes to the Standard are:
Ÿ IPSASB amendments: To update the Basis of conclusions and Comparison with IPSASs to reflect the IPSASB’s recent decision on the impairment of revalued assets.
The effective date of the amendment is for years beginning on or after 01 April 2018. The municipality expects to adopt the amendment for the first time in the 2018 annual financial statements. It is unlikely that the amendment will have a material impact on the municipality's annual financial statements. GRAP 26 (as amended 2016): Impairment of cash‐generating assets Amendments Changes to the Standard of GRAP on Impairment of Cash Generating Assets resulted from changes made to IPSAS 26 on Impairment of Cash‐Generating Assets (IPSAS 26) as a result of the IPSASB’s Impairment of Revalued Assets issued in March 2016. The most significant changes to the Standard are:
Ÿ IPSASB amendments: To update the Basis of conclusions and Comparison with IPSASs to reflect the IPSASB’s recent decision on the impairment of revalued assets.

162 | P a g e
Notes to the Annual Financial Statements
2. New standards and interpretations (continued) The effective date of the amendment is for years beginning on or after 01 April 2018. The municipality expects to adopt the amendment for the first time in the 2018 annual financial statements. It is unlikely that the amendment will have a material impact on the municipality's annual financial statements. GRAP 31 (as amended 2016): Intangible Assets
Amendments to the Standard of GRAP on Intangible Assets resulted from inconsistencies in measurement requirements in GRAP 23 and other asset‐related Standards of GRAP in relation to the treatment of transaction costs. Other changes resulted from changes made to IPSAS 31 on Intangible Assets (IPSAS 31) as a result of the IPSASB’s Improvements to IPSASs 2014 issued in January 2015. The most significant changes to the Standard are:
Ÿ General improvements: To add the treatment of transaction costs and other costs incurred on assets acquired in non‐exchange transactions to be in line with the principle in GRAP 23 (paragraph .12); and To clarify the measurement principle when assets may be acquired in exchange for a non‐monetary asset or assets, or a combination of monetary and non‐monetary assets
Ÿ IPSASB amendments: To clarify the revaluation methodology of the carrying amount and accumulated depreciation when an item of intangible assets is revalued; and To clarify acceptable methods of depreciating assets
The effective date of the amendment is for years beginning on or after 01 April 2018. The municipality expects to adopt the amendment for the first time in the 2018 annual financial statements. It is unlikely that the amendment will have a material impact on the municipality's annual financial statements. 2.2 Standards and interpretations not yet effective or relevant The following standards and interpretations have been published and are mandatory for the municipality’s accounting periods beginning on or after 01 July 2018 or later periods but are not relevant to its operations: GRAP 18 (as amended 2016): Segment Reporting
Amendments to the Standard of GRAP on Segment Reporting resulted from editorial and other changes to the original text have been made to ensure consistency with other Standards of GRAP. The most significant changes to the Standard are:
Ÿ General improvements: An appendix with illustrative segment disclosures has been deleted from the Standard as the National Treasury has issued complete examples as part of its implementation guidance.
The effective date of the amendment is for years beginning on or after 01 April 2019
The municipality does not envisage the adoption of the standard until such time as it becomes applicable to the municipality's operations. The impact of this amendment is currently being assessed. GRAP 32: Service Concession Arrangements: Grantor
The objective of this Standard is: to prescribe the accounting for service concession arrangements by the grantor, a public sector entity. It furthermore covers: Definitions, recognition and measurement of a service concession asset, recognition and measurement of liabilities, other liabilities, contingent liabilities, and contingent assets, other revenues, presentation and disclosure, transitional provisions, as well as the effective date. The effective date of the standard is not yet set by the Minister of Finance.

163 | P a g e
Notes to the Annual Financial Statements
2. New standards and interpretations (continued) The municipality does not envisage the adoption of the standard until such time as it becomes applicable to the municipality's operations. It is unlikely that the standard will have a material impact on the municipality's annual financial statements. GRAP 106 (as amended 2016): Transfers of functions between entities not under common control
Amendments to the Standard of GRAP on Transfer of Functions Between Entities Not Under Common Control resulted from changes made to IFRS 3 on Business Combinations (IFRS 3) as a result of the IASB’s amendments on Annual Improvements to IFRSs 2010 – 2012 Cycle issued in December 2013. The most significant changes to the Standard are:
Ÿ IASB amendments: To require contingent consideration that is classified as an asset or a liability to be measured at fair value at each reporting period.
The effective date of the amendment is for years beginning on or after 01 April 2019.
The municipality does not envisage the adoption of the standard until such time as it becomes applicable to the municipality's operations. It is unlikely that the amendment will have a material impact on the municipality's annual financial statements. IGRAP 17: Service Concession Arrangements where a Grantor Controls a Significant Residual Interest in an Asset
This Interpretation of the Standards of GRAP provides guidance to the grantor where it has entered into a service concession arrangement, but only controls, through ownership, beneficial entitlement or otherwise, a significant residual interest in a service concession asset at the end of the arrangement, where the arrangement does not constitute a lease. This Interpretation of the Standards of GRAP shall not be applied by analogy to other types of transactions or arrangements. A service concession arrangement is a contractual arrangement between a grantor and an operator in which the operator uses the service concession asset to provide a mandated function on behalf of the grantor for a specified period of time. The operator is compensated for its services over the period of the service concession arrangement, either through payments, or through receiving a right to earn revenue from third party users of the service concession asset, or the operator is given access to another revenue‐generating asset of the grantor for its use. Before the grantor can recognise a service concession asset in accordance with the Standard of GRAP on Service Concession Arrangements: Grantor, both the criteria as noted in paragraph .01 of this Interpretation of the Standards of GRAP need to be met. In some service concession arrangements, the grantor only controls the residual interest in the service concession asset at the end of the arrangement, and can therefore not recognise the service concession asset in terms of the Standard of GRAP on Service Concession Arrangements: Grantor. A consensus is reached, in this Interpretation of the Standards of GRAP, on the recognition of the performance obligation and the right to receive a significant interest in a service concession asset. The effective date of the interpretation is not yet set by the Minister of Finance. The municipality does not envisage the adoption of the interpretation until such time as it becomes applicable to the municipality's operations. It is unlikely that the interpretation will have a material impact on the municipality's annual financial statements. IGRAP 19: Liabilities to Pay Levies This Interpretation of the Standards of GRAP provides guidance on the accounting for levies in the financial statements of the entity that is paying the levy. It clarifies when entities need to recognise a liability to pay a levy that is accounted for in accordance with GRAP 19.

164 | P a g e
Notes to the Annual Financial Statements
2. New standards and interpretations (continued) To clarify the accounting for a liability to pay a levy, this Interpretation of the Standards of GRAP addresses the following issues:
Ÿ What is the obligating event that gives rise to the recognition of a liability to pay a levy? Ÿ Does economic compulsion to continue to operate in a future period create a constructive obligation to pay a
levy that will be triggered by operating in that future period? Ÿ Does the going concern assumption imply that an entity has a present obligation to pay a levy that will be
triggered by operating in a future period? Ÿ Does the recognition of a liability to pay a levy arise at a point in time or does it, in some circumstances, arise
progressively over time? Ÿ What is the obligating event that gives rise to the recognition of a liability to pay a levy that is triggered if a
minimum threshold is reached? Consensus reached in this interpretation:
Ÿ The obligating event that gives rise to a liability to pay a levy is the activity that triggers the payment of the levy, as identified by the legislation;
Ÿ An entity does not have a constructive obligation to pay a levy that will be triggered by operating in a future period as a result of the entity being economically compelled to continue to operate in that future period;
Ÿ The preparation of financial statements under the going concern assumption does not imply that an entity has a present obligation to pay a levy that will be triggered by operating in a future period;
Ÿ The liability to pay a levy is recognised progressively if the obligating event occurs over a period of time; Ÿ If an obligation to pay a levy is triggered when a minimum threshold is reached, the accounting for the liability
that arises from that obligation shall be consistent with the principles established in this Interpretation of the Standards of GRAP; and
Ÿ An entity shall recognise an asset, in accordance with the relevant Standard of GRAP, if it has prepaid a levy but does not yet have a present obligation to pay that levy.
The effective date of the standard is for years beginning on or after 01 April 2019. The municipality expects to adopt the standard for the first time in the 2020 financial statements. It is unlikely that the interpretation will have a material impact on the municipality's annual financial statements. GRAP 16 (as amended 2016): Investment Property Amendments to the Standard of GRAP on Investment Property resulted from editorial changes to the original text and inconsistencies in measurement requirements in GRAP 23 and other asset‐related Standards of GRAP in relation to the treatment of transaction costs. Other changes resulted from changes made to IAS 40 on Investment Property (IAS 40) as a result of the IASB’s amendments on Annual Improvements to IFRSs 2011 – 2013 Cycle issued in December 2013. The most significant changes to the Standard are:
Ÿ General improvements: To clarify the treatment of transaction costs and other costs incurred on assets acquired in non‐exchange transactions to be in line with the principle in GRAP 23 (paragraph .12); and To clarify the measurement principle when assets may be acquired in exchange for a non‐monetary asset or assets, or a combination of monetary and non‐monetary assets.
Ÿ IASB amendments: To clarify the interrelationship between the Standards of GRAP on Transfer of Functions Between Entities Not Under Common Control and Investment Property when classifying investment property or owner‐occupied property.
The effective date of the amendment is for years beginning on or after 01 April 2018. The municipality does not envisage the adoption of the amendment until such time as it becomes applicable to the municipality's operations. It is unlikely that the amendment will have a material impact on the municipality's annual financial statements. GRAP 27 (as amended 2016): Agriculture
Amendments to the Standard of GRAP on Agriculture resulted from changes made to IPSAS 27 on Agriculture (IPSAS 27) as a result of the IPSASB’s Improvements to IPSASs 2015 issued in March 2016.

165 | P a g e
Notes to the Annual Financial Statements
2. New standards and interpretations (continued) The most significant changes to the Standard are:
Ÿ IPSASB amendments: To define a bearer plant and include bearer plants within the scope of GRAP 17, while the produce growing on bearer plants will remain within the scope of GRAP 27. In addition to the changes made by the IPSASB, a consequential amendment has been made to GRAP 103 on Heritage Assets. The IPSASB currently does not have a pronouncement on this topic.
The effective date of the amendment is for years beginning on or after 01 April 2018. The municipality does not envisage the adoption of the amendment until such time as it becomes applicable to the municipality's operations. It is unlikely that the amendment will have a material impact on the municipality's annual financial statements. GRAP 103 (as amended 2016): Heritage Assets
Amendments to the Standard of GRAP on Heritage Assets resulted from inconsistencies in measurement requirements in GRAP 23 and other asset‐related Standards of GRAP in relation to the treatment of transaction costs. Other changes resulted from editorial changes to the original text. The most significant changes to the Standard are:
Ÿ General improvements: To clarify the treatment of transaction costs and other costs incurred on assets acquired in non‐exchange transactions to be in line with the principle in GRAP 23 (paragraph .12); and To clarify the measurement principle when assets may be acquired in exchange for a non‐monetary asset or assets, or a combination of monetary and non‐monetary assets
The effective date of the amendment is for years beginning on or after 01 April 2018.
The municipality does not envisage the adoption of the amendment until such time as it becomes applicable to the municipality's operations. It is unlikely that the amendment will have a material impact on the municipality's annual financial statements. Directive 12: The Selection of an Appropriate Reporting Framework by Public Entities
Historically, public entities have prepared financial statements in accordance with generally recognised accounting practice, unless the Accounting Standards Board (the Board) approved the application of generally accepted accounting practice for that entity. “Generally accepted accounting practice” has been taken to mean Statements of Generally Accepted Accounting Practice (Statements of GAAP), or for certain entities, International Financial Reporting Standards (IFRSs) issued by the International Accounting Standards Board. Since Statements of GAAP have been withdrawn from 1 December 2012, public entities will be required to apply another reporting framework in the future.
The purpose of this Directive is to prescribe the criteria to be applied by public entities in selecting and applying an appropriate reporting framework. The effective date of the directive is for years beginning on or after 01 April 2018.
The municipality does not envisage the adoption of the directive until such time as it becomes applicable to the municipality's operations. It is unlikely that the directive will have a material impact on the municipality's annual financial statements.

166 | P a g e
Notes to the Annual Financial Statements Figures in Rand
3. Inventories Water ‐ at cost Unsold properties held for resale
Inventory pledged as security No inventory was pledged as security for any financial liability at year‐end. 4. Operating lease asset Current assets
The Municipality as Lessor Opening balance Movement during the year
2018 2017
51 256 51 548505 674 505 674
556 930 557 222
17 291 21 766
21 766 23 985 (4 475) (2 219)
17 291 21 766
At the Statement of Financial Position date, where the municipality acts as a lessor under operating leases, it will receive operating lease income as follows: Up to 1 year 32 905 30 4681 to 5 years 38 536 71 442
71 441 101 910
This relates to a 9 years 11 months lease agreement with MTN as Lessee for land on which a cell phone tower was erected. This lease commenced in October 2010 and escalates at 8% per year.
This lease income was determined from contracts that have a specific conditional income and does not include lease income which has a undetermined conditional income. The Municipality does not engage in any sub‐lease arrangements. The Municipality did not receive any contingent rent during the year. 5. Receivables from non‐exchange transactions Fines Government grants and subsidies Prepaid expense Other receivables Property rates Less: allowance for doubtful debts
3 277 190 ‐‐ 169 8602 069 2 0681 044 910 273 53023 451 626 19 536 825(21 851 125) (18 041 338)
5 924 670 1 940 945

167 | P a g e
None of the receivables from non‐exchange transactions were pledged as security for any financial liability at year‐end. Debtors are payable within 30 days. This credit period granted is considered to be consistent with the terms used in the public sector, through established practices and legislation. Ageing of Receivables from non‐exchange transactions:

168 | P a g e
Notes to the Annual Financial Statements Figures in Rand 2018 2017
5. Receivables from non‐exchange transactions (continued) Property rates: Ageing Current (0 ‐ 30 days) 31 ‐ 60 days 60 ‐ 90 days 91 days + Less impairment Reconciliation of provision for impairment of receivables from non‐exchange transactions: Balance at the beginning of the year Contribution (to) / from allowance property rates Contribution (to) / from allowance traffic fines
Credit quality of receivables from non‐exchange transactions
589 887 564 640503 454 487 246484 140 466 26721 874 145 18 018 672(21 851 125) (18 041 338)
1 600 501 1 495 487 (18 041 338) (14 335 028)(3 809 787) (3 706 310)(11 637 205) ‐
(33 488 330) (18 041 338)
The credit quality of other receivables from non‐exchange transactions that are neither past nor due nor impaired can be assessed by reference to external credit ratings (if available) or to historical information about counterparty default rates: Fair value of receivables from non‐exchange transactions Receivables from non‐exchange transactions past due but not impaired
Receivables from non‐exchange transactions which are less than 3 months past due are not evaluated for impairment. At 30 June 2018, R ‐ (2017: R 1 495 487) were past due but not impaired. The ageing of amounts past due but not impaired is as follows:
1 to 3 months past due property rates 1 600 501 1 495 487 1 to 3 months past due traffic fines 3 277 190 ‐ Receivables from non‐exchange transactions impaired
As of 30 June 2018, receivables from non‐exchange transactions of R 33 488 330 (2017: R 18 041 338) were impaired and provided for. The ageing of these loans is as follows: 3 to 6 months 33 488 330 18 041 338 6. VAT receivable Net Vat receivable 15 854 926 16 192 526
Vat is receivable on the cash basis. All VAT returns for the period under review have been submitted on time.

169 | P a g e
Notes to the Annual Financial Statements Figures in Rand
7. Receivables from exchange transactions Gross balances Electricity Water Sewerage Refuse Housing rental Interest, sundry Less: Allowance for impairment Electricity Water Sewerage Refuse Interest and sundry Net balance Electricity Water Sewerage Refuse Housing rental Interest and sundry Electricity Current (0 ‐30 days) 31 ‐ 60 days 61 ‐ 90 days 91 days + Less: Impairment Water Current (0 ‐30 days) 31 ‐ 60 days 61 ‐ 90 days 91 days + Less: Impairment Sewerage Current (0 ‐30 days) 31 ‐ 60 days 61 ‐ 90 days 91 days + Less: Impairment
2018 2017 32 237 753 23 563 78835 734 620 29 802 61424 929 595 21 437 61823 839 669 20 466 164‐ 20 59054 343 174 43 266 131
171 084 811 138 556 905
(25 487 332) (22 081 605) (34 987 071) (29 248 786)(24 811 387) (21 290 274)(23 729 036) (20 322 845)(53 317 986) (42 130 146)
(162 332 812) (135 073 656)
6 750 421 1 482 183 747 549 553 828118 208 147 344110 633 143 319‐ 20 5901 025 188 1 135 985
8 751 999 3 483 249
2 184 106 1 334 673 1 609 606 604 237464 061 704 89527 979 980 20 919 983(25 487 332) (22 081 605)
6 750 421 1 482 183
990 745 915 497 552 185 545 356546 850 563 81133 644 840 27 777 950(34 987 071) (29 248 786)
747 549 553 828

170 | P a g e
328 484 334 808 314 892 320 290 310 055 315 735 23 976 164 20 466 785 (24 811 387) (21 290 274)
118 208 147 344

171 | P a g e
Notes to the Annual Financial Statements Figures in Rand 2018 2017
7. Receivables from exchange transactions (continued) Refuse Current (0 ‐30 days) 31 ‐ 60 days 61 ‐ 90 days 91 days + Less: Impairment Housing rental 61 ‐ 90 days 91 days + Interest and sundry Current (0 ‐30 days) 31 ‐ 60 days 61 ‐ 90 days 91 days + Less: Impairment Reconciliation of allowance for impairment Balance at beginning of the year Contributions to allowance
Receivables from exchange transactions pledged as security
327 191 333 561314 518 322 158310 852 317 40722 887 108 19 493 039(23 729 036) (20 322 846)
110 633 143 319
‐ 554 ‐ 20 036
‐ 20 590
1 389 224 996 853 1 073 478 847 362998 154 834 20250 882 319 40 587 714(53 317 987) (42 130 146)
1 025 188 1 135 985
(135 073 656) (110 632 277)(27 259 156) (24 441 379)
(162 332 812) (135 073 656)
No receivables from exchange transactions were pledged as security for any financial liability at year‐end. Credit quality of receivables from exchange transactions The credit quality of receivables from exchange transactions that are neither past nor due nor impaired can be assessed by reference to external credit ratings (if available) or to historical information about counterparty default rates: Terms receivables from exchange transactions Receivables from exchange transactions are payable within 30 days. The credit period granted is considered to be consistent with the terms used in the public sector, through established practices and legislation. Discounting of receivables from exchange transactions on initial recognition is not deemed necessary. Receivables from exchange transactions past due but not impaired
Receivables from exchange transactions which are less than 3 months past due are not considered to be impaired. At 30 June 2018, R 8 788 089 (2017: R 3 483 249) were past due but not impaired. The ageing of amounts past due but not impaired is as follows: 1 month past due 8 751 999 3 483 249

172 | P a g e
Notes to the Annual Financial Statements Figures in Rand 2018 2017
7. Receivables from exchange transactions (continued)
Receivables from exchange transactions impaired
As of 30 June 2018, receivables from exchange transactions of R 162 322 812 (2017: R 135 073 656) were impaired and provided for.
The ageing of these loans is as follows:
3 to 6 months 162 332 812 135 073 656
8. Cash and cash equivalents
Cash and cash equivalents consist of:
Cash on hand 2 000 2 000 Bank balances 588 736 93 050Short‐term deposits 3 296 267 11 057
3 887 003 106 107
Credit quality of cash at bank and short term deposits, excluding cash on hand The credit quality of cash at bank and short term deposits, excluding cash on hand that are neither past due nor impaired can be assessed by reference to external credit ratings: Credit rating F3 3 885 003 104 107 Cash and cash equivalents pledged as collateral No cash and cash equivalents were pledged as security for any financial liability at year‐end. The municipality had the following bank accounts Account number / description Bank statement balances Cash book balances 30 June 2018 30 June 2017 30 June 2016 30 June 2018 30 June 2017 30 June 2016First National Bank ‐ Current 588 736 93 050 211 894 588 736 93 050 211 894Account ‐ 623124181075 First National Bank ‐ 7‐day 1 248 764 11 057 ‐ 1 248 764 11 057 ‐Notice Account ‐ 74629069896 First National Bank ‐ 7‐day 1 932 578 ‐ ‐ 1 932 578 ‐ ‐Notice Account ‐ 74713727011 First National Bank ‐ 7‐day 114 925 ‐ ‐ 114 925 ‐ ‐Notice Account ‐ 74713729611
Total 3 885 003 104 107 211 894 3 885 003 104 107 211 894
9. Investment property
2018 2017
Cost / Accumulated Carrying value Cost / Accumulated Carrying value Valuation depreciation Valuation depreciation and and

173 | P a g e
accumulated accumulated impairment impairment
Investment property 8 890 803 ‐ 8 890 803 8 890 803 ‐ 8 890 803

174 | P a g e
Notes to the Annual Financial Statements Figures in Rand 2018 2017
9. Investment property (continued)
Reconciliation of investment property ‐ 2018
Opening Total balance Investment property 8 890 803 8 890 803
Reconciliation of investment property ‐ 2017
Opening Total balance Investment property 8 890 803 8 890 803
Pledged as security There are no investment properties pledged as security: A register containing the information required by section 63 of the Municipal Finance Management Act is available for inspection at the registered office of the municipality. There are no restrictions on the realisation of investment property or the remittance of revenue and proceeds of disposal. There are no contractual obligations to purchase, construct or develop investment property or for repairs, maintenance or enhancements.
Deemed cost Deemed cost was determined using fair value. Magareng Local Municipality (Registration number NC093) Annual Financial Statements for the year ended 30 June 2018 Notes to the Annual Financial Statements
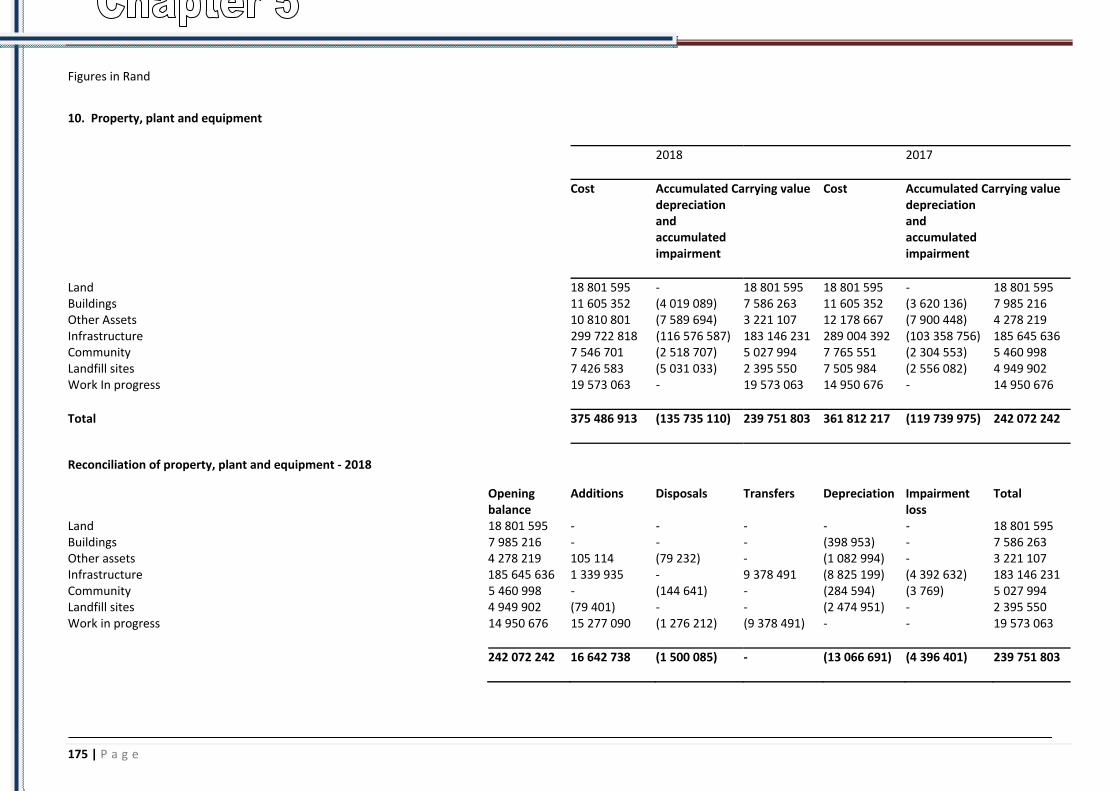
175 | P a g e
Figures in Rand
10. Property, plant and equipment
2018 2017
Cost Accumulated Carrying value Cost Accumulated Carrying value depreciation depreciation and and accumulated accumulated impairment impairment
Land 18 801 595 ‐ 18 801 595 18 801 595 ‐ 18 801 595 Buildings 11 605 352 (4 019 089) 7 586 263 11 605 352 (3 620 136) 7 985 216 Other Assets 10 810 801 (7 589 694) 3 221 107 12 178 667 (7 900 448) 4 278 219 Infrastructure 299 722 818 (116 576 587) 183 146 231 289 004 392 (103 358 756) 185 645 636 Community 7 546 701 (2 518 707) 5 027 994 7 765 551 (2 304 553) 5 460 998 Landfill sites 7 426 583 (5 031 033) 2 395 550 7 505 984 (2 556 082) 4 949 902 Work In progress 19 573 063 ‐ 19 573 063 14 950 676 ‐ 14 950 676
Total 375 486 913 (135 735 110) 239 751 803 361 812 217 (119 739 975) 242 072 242
Reconciliation of property, plant and equipment ‐ 2018
Opening Additions Disposals Transfers Depreciation Impairment Total balance loss Land 18 801 595 ‐ ‐ ‐ ‐ ‐ 18 801 595 Buildings 7 985 216 ‐ ‐ ‐ (398 953) ‐ 7 586 263 Other assets 4 278 219 105 114 (79 232) ‐ (1 082 994) ‐ 3 221 107 Infrastructure 185 645 636 1 339 935 ‐ 9 378 491 (8 825 199) (4 392 632) 183 146 231 Community 5 460 998 ‐ (144 641) ‐ (284 594) (3 769) 5 027 994 Landfill sites 4 949 902 (79 401) ‐ ‐ (2 474 951) ‐ 2 395 550 Work in progress 14 950 676 15 277 090 (1 276 212) (9 378 491) ‐ ‐ 19 573 063
242 072 242 16 642 738 (1 500 085) ‐ (13 066 691) (4 396 401) 239 751 803

176 | P a g e
Notes to the Annual Financial Statements Figures in Rand 10. Property, plant and equipment (continued)
Reconciliation of property, plant and equipment ‐ 2017
Opening Additions Disposals Transfers Depreciation Impairment Total balance loss Land 18 801 595 ‐ ‐ ‐ ‐ ‐ 18 801 595 Buildings 8 405 845 ‐ ‐ ‐ (420 629) ‐ 7 985 216 Other assets 4 846 725 777 940 (253 264) ‐ (1 093 182) ‐ 4 278 219 Infrastructure 186 892 793 980 048 ‐ 9 261 707 (8 389 774) (3 099 138) 185 645 636 Community 5 755 986 ‐ ‐ ‐ (294 988) ‐ 5 460 998 Landfill sites 6 076 039 89 071 ‐ ‐ (1 215 208) ‐ 4 949 902 Work in progress 12 788 361 11 424 022 ‐ (9 261 707) ‐ ‐ 14 950 676
243 567 344 13 271 081 (253 264) ‐ (11 413 781) (3 099 138) 242 072 242
Pledged as security
No property, plant and equipment has been pledged as security for any financial liability at year‐end.
Other information
Property, plant and equipment fully depreciated and still in use (Gross carrying amount) Infrastructure 79 ‐ Other assets 152 ‐ Community assets 16 ‐ Buildings 2 ‐
249 ‐

177 | P a g e
Notes to the Annual Financial Statements Figures in Rand 15. Property, plant and equipment (continued)
Reconciliation of Work‐in‐Progress 2018
Opening balance Additions/capital expenditure Write off of wip due to terminated project Transferred to completed items
Reconciliation of Work‐in‐Progress 2017 Opening balance Additions/capital expenditure Transferred to completed items
Expenditure incurred to repair and maintain property, plant and equipment
2018 2017 Included Totalwithin Infrastructure14 950 676 14 950 67615 277 090 15 277 090(1 276 212) (1 276 212)(9 378 491) (9 378 491)
19 573 063 19 573 063 Included Totalwithin Infrastructure12 788 361 12 788 36111 424 022 11 424 022(9 261 707) (9 261 707)
14 950 676 14 950 676
Expenditure incurred to repair and maintain property, plant and equipment included in Statement of Financial Performance Inventory, spares and parts consumed 2 417 015 2 042 223
A register containing the information required by section 63 of the Municipal Finance Management Act is available for inspection at the registered office of the municipality. Deemed cost Deemed cost was determined using depreciated replacement cost. 11. Intangible assets 2018 2017
Cost / Accumulated Carrying value Cost / Accumulated Carrying value Valuation amortisation Valuation amortisation and and accumulated accumulated impairment impairment
Computer software 848 685 (611 200) 237 485 848 685 (549 586) 299 099
Reconciliation of intangible assets ‐ 2018
Opening Amortisation Total

178 | P a g e
balance Computer software 299 099 (61 614) 237 485

179 | P a g e
Notes to the Annual Financial Statements Figures in Rand 16. Intangible assets (continued)
Reconciliation of intangible assets ‐ 2017
Opening Additions balance Computer software 356 492 8 640
Pledged as security
2018 2017 Amortisation Total (66 033) 299 099
No intangible assets were pledged as security for any financial liability at year‐end. The following material intangible assets are included in the carrying value above No intangible assets were assessed as having an indefinite useful life. There are no internally generated intangible assets at reporting date. There are no contractual commitments for the acquisition of intangible assets. There are no intangible assets whose title is restricted. 12. Heritage assets 2018 2017
Cost / Accumulated Carrying value Cost / Accumulated Carrying value Valuation impairment Valuation impairment losses losses
Art Collections, antiquities and 370 999 ‐ 370 999 370 999 ‐ 370 999exhibits
Reconciliation of heritage assets 2018
Opening Total balance Art Collections, antiquities and exhibits 370 999 370 999
Reconciliation of heritage assets 2017
Opening Total balance Art Collections, antiquities and exhibits 370 999 370 999
Restrictions on heritage assets There are no restrictions on the realisability of heritage assets or the remitance of revenue and proceeds of disposal. Pledged as security There are no heritage assets pledged as security. Deemed costs

180 | P a g e
Deemed cost was determined using depreciated replacement cost.

181 | P a g e
Notes to the Annual Financial Statements Figures in Rand
13. Payables from exchange transactions Trade payables Payments received in advance Unkown deposits Salary control Retention creditor Sundry creditors Other Creditors Accrued leave pay Accrued staff bonus
14. Consumer deposits Electricity Water Sale of land Halls and facilities
15. Employee benefit obligations The amounts recognised in the statement of financial position are as follows: Carrying value Present value of the defined benefit obligation‐wholly unfunded Present value of the defined benefit obligation‐partly or wholly funded Non‐current liabilities Current liabilities
Employee benefits Benefits Post retirement Long service awards Total Non‐current Employee Benefit Liabilities
Post retirement benefits Balance 1 July Contribution for the year Interest cost Expenditure for the year Actuarial (Gain)/Loss Total post retirement benefit ‐ 30 June Less: Transfer to current portion
Balance 30 June

182 | P a g e
2018 2017
129 516 613 108 236 051 2 242 455 2 366 721 249 162 379 228 3 537 839 1 959 716 1 436 288 844 816 824 315 343 924 16 593 99 743 3 037 525 2 640 845 1 134 672 973 239
141 995 462 117 844 283 762 646 606 196 ‐ 124 987 130 322 130 322 7 510 7 510
900 478 869 015
(9 931 000) (10 352 000) (2 082 000) (1 997 000)
(12 013 000) (12 349 000)
(10 616 000) (10 804 000) (1 397 000) (1 545 000)
(12 013 000) (12 349 000)
8 746 000 8 961 0001 870 000 1 843 000
10 616 000 10 804 000
10 352 000 10 524 000514 000 515 0001 071 000 978 000(207 000) (163 521)(1 799 000) (1 501 479)
9 931 000 10 352 000(1 185 000) (1 391 000)
8 746 000 8 961 000

183 | P a g e
Notes to the Annual Financial Statements Figures in Rand
15. Employee benefit obligations (continued) Long service award Balance 1 July Contribution for the year Interest Expenditure for the year Actuarial (Gain)/Loss Total long term service 30 June Less: Transfer to current portion Balance 30 June
Total non‐current employee benefits Balance 1 July Contribution for the year Interest cost Expenditure for the year Actuarial (Gain)/Loss Total Employee benefit 30 June Less: Transfer to current portion
Post Retirement Medical Aid Benefit
2018 2017 1 997 000 2 031 000219 000 224 000208 000 204 000(147 727) (37 246)(194 273) (424 754)
2 082 000 1 997 000(212 000) (154 000)
1 870 000 1 843 000
12 349 000 12 555 000733 000 739 0001 279 000 1 182 000(354 727) (200 767)(1 993 273) (1 926 233)
12 013 000 12 349 000(1 397 000) (1 545 000)
10 616 000 10 804 000
The Post Retirement Benefit Plan is a defined benefit plan, of which the members are made up as follows: Members In‐service (employee) members 57 57Continuation members (Pensioners) 6 5
63 62
The liability in respect of past service has been estimated to be as follows:
Liability In‐service (employee) members 7 708 000 8 381 000Continuation members (Pensioners) 2 223 000 1 971 000
9 931 000 10 352 000
The liability in respect of periods commencing prior to the comparative year has been estimated as follows: 2016 2015 2014In‐service members 8 378 000 6 392 163 5 714 302
184 | P a g e
Continuation members 2 146 000 2 249 740 1 886 532
10 524 000 8 641 903 7 600 834
Experience adjustments were calculated as follows:

185 | P a g e
Notes to the Annual Financial Statements Figures in Rand 2018 2017
15. Employee benefit obligations (continued) The municipality makes monthly contributions for health care arrangements to the following medical aid schemes: Bonitas LA Health Samwumed Keyhealth Hosmed Fed Health Key actuarial assumptions used: i) Rate of interest Discount rate Yield Curve Yield curveCPI (Consumer Price Inflation) Difference Difference between between nominal and nominal and yield curves yield curvesHealth Care Cost Inflation Rate CPI+1% CPI+1%Net Effective Discount Rate Yield curve Yield curve based based GRAP 25 defines the determination of the Discount rate assumption to be used as follows: “The discount rate that reflects the time value of money is best approximated by reference to market yields at the reporting date on government bonds. Where there is no deep market in government bonds with a sufficiently long maturity to match the estimated maturity of all the benefit payments, an entity uses current market rates of the appropriate term to discount shorter term payments, and estimates the discount rate for longer maturities by extrapolating current market rates along the yield curve.” We used the nominal and real zero curves as at 29 June 2018 supplied by the JSE to determine our discount rates and CPI assumptions at each relevant time period. In the event that the valuation is performed prior to the effective valuation date, we use the prevailing yield at the time of performing our calculations. We have changed this methodology from a point estimate in order to present a more accurate depiction of the liability. For example a liability which pays out in 1 year will be discounted at a different rate than a liability which pays out in 30 years. Previously only one discount rate was used to value all the liabilities. The Medical Aid Contribution Inflation rate was set with reference to the past relationship between the (yield curve based) Discount Rate for each relevant time period and the (yield curve based) Medical Aid Contribution Inflation for each relevant time period. South Africa has experienced high health care cost inflation in recent years. The annualised compound rates of increase for the last ten years show that registered medical aid schemes contribution inflation outstripped general CPI by almost 3% year on year. We do not consider these increases to be sustainable and have assumed that medical aid contribution increases would out‐strip general inflation by 1% per annum over the foreseeable future. Average Retirement Age
The average retirement age for all active employees was assumed to be 63 years. This assumption implicitly allows for ill‐health and early retirements. Normal retirement age It has been assumed that in‐service members will retire at age 65, which then implicitly allows for expected rates of early and ill‐health retirement.

186 | P a g e
Notes to the Annual Financial Statements Figures in Rand 2018 2017
‐ Employee benefit obligations (continued)
Mortality rates
Mortality before retirement has been based on the SA 85‐90 mortality tables. These are the most commonly used tables in the industry. Mortality post‐employment (for pensioners) has been based on the PA (90) ultimate mortality tables. No explicit assumption was made about additional mortality or health care costs due to AIDS. Spouses and Dependants
We assumed that the marital status of members who are currently married will remain the same up to retirement. It was also assumed that 90% of all single employees would be married at retirement with no dependent children. Where necessary it was assumed that female spouses would be five years younger than their male spouses at retirement and vice versa. The amounts recognised in the Statement of Financial Position are as follows: Present value of fund obligation 9 931 000 10 352 000
Reconciliation of present value of fund obligation – 2018
Opening Total expenses Actuarial gain Transfers Closing Balance balance10 352 000 1 585 000 (1 799 000) (207 000) 9 931 000
Reconciliation of present value of fund obligation – 2017
Opening Total expenses Actuarial loss Transfers Closing Balance balance10 524 000 1 493 000 (1 501 479) (163 521) 10 352 000
Sensitivity Analysis on the Accrued Liability
Assumption Change Total liability (Rm)Valuation Assumptions 9 931 000Health care inflation +1% 11 643 000Health care inflation ‐1% 8 552 000Mortality rate +20% 9 135 000Mortality rate ‐20% 10 920 000
Sensitivity Analysis on Current‐service and Interest Costs for year ending 30/06/2018
Assumption Change Current service Interest Cost Total cost Valuation Assumption 455 000 966 000 1 421 000Health care inflation +1% 566 000 1 171 000 1 737 000Health care inflation ‐1% 370 000 855 000 1 225 000Mortality rate +20% 416 000 915 000 1 331 000Mortality rate ‐20% 504 000 1 096 000 1 600 000 Long Service Bonuses The Long Service Bonus plans are defined benefit plans.

187 | P a g e
Notes to the Annual Financial Statements Figures in Rand 2018 2017
15. Employee benefit obligations (continued)
Total eligible As at year end, the following number of employees were eligible for long service bonuses. 151 154
Key actuarial assumptions used:
i) Rate of interest
Discount rate Yield Curve Yield Curve CPI (Consumer Price Inflation) Difference Difference between between nominal and nominal and
real yield curve real yieldcurve
General Salary Inflation CPI+1% CPI+1%Net Effective Discount Rate applied to salary‐related Long Service Bonuses Yield Curve Yield Curve Based Based GRAP 25 defines the determination of the Discount rate assumption to be used as follows: “The discount rate that reflects the time value of money is best approximated by reference to market yields at the reporting date on government bonds. Where there is no deep market in government bonds with a sufficiently long maturity to match the estimated maturity of all the benefit payments, an entity uses current market rates of the appropriate term to discount shorter term payments, and estimates the discount rate for longer maturities by extrapolating current market rates along the yield curve.” We use the nominal and real zero curves as at 29 June 2018 supplied by the JSE to determine our discounted rates and CPI assumptions at each relevant time period. We have changed this methodology from a point estimate in order to present a more accurate depiction of the liability. For example, a liability which pays out in 1 year will be discounted at a different rate than a liability which pays out in 30 years. Previously only one discount rate was used to value all the liabilities. Normal Salary Inflation Rate
We have derived the underlying future rate of consumer price index inflation (CPI inflation) from the relationship between the (yield curve based) Conventional Bond Rate for each relevant time period and the (yield curve based) Inflation‐linked Bond rate for each relevant time period. Our assumed rate of salary inflation was set as the assumed value of CPI plus 1%. The salaries used in the valuation include an assumed increase on 01 July 2018 of 7.36%. The next salary increase was assumed to take place on 01 July 2019. Average Retirement Age
The average retirement age for all active employees was assumed to be 63 years. This assumption implicitly allows for ill‐health and early retirements. Normal Retirement Age The normal retirement age (NRA) for all active employees was assumed to be 65 years. Mortality Rates
Mortality before retirement has been based on the SA 85‐90 mortality tables. These are the most commonly used tables in the industry. The amounts recognised in the Statement of Financial Position are as follows: Present value of fund obligations 2 082 000 1 997 000

188 | P a g e
The liability in respect of periods commencing prior to the comparative year has been estimated as follows:

189 | P a g e
Notes to the Annual Financial Statements Figures in Rand
15. Employee benefit obligations (continued) 2016 2015Total Liability 2 031 000 1 685 756
Experience adjustments were calculated as follows:
2018 2017
2014 20131 433 528 1 400 593
2018 2017 2016 2015Liabilities: (Gain) / loss (194 273) (424 754) 199 478 202 341
The municipality performed their first actuarial valuation on 30 June 2012. Thus there are no experience adjustment figures available on or before 30 June 2012 to fully comply with GRAP 25. Reconciliation of present value of fund obligation ‐ 2018
Opening Total expenses Actuarial Transfers Total balance gain/(loss) 1 997 000 427 000 (194 273) (147 727) 2 082 000
Reconciliation of present value of fund obligation ‐ 2017
Opening Total expenses Actuarial Transfers Total balance gain/(loss) 2 031 000 428 000 (424 754) (37 246) 1 997 000
Sensitivity Analysis on the unfunded accrued liability:
Assumption Change Liability Valuation assumptions 2 082 000General salary inflation +1% 2 227 000General salary inflation ‐1% 1 950 000Withdrawal rate +20% 1 977 000Withdrawal rate ‐20% 2 199 000
Sensitivity Analysis on Current‐service and Interest Costs for year ending 30/06/2018
Assumption Change Current service Interest cost Total cost Valuation Assumption 222 000 206 000 461 000Health care inflation +1% 241 000 222 000 499 000Health care inflation ‐1% 205 000 193 000 427 000Withdrawal rate +20% 205 000 195 000 431 000Withdrawal rate ‐20% 241 000 219 000 496 000 Sensitivity Analysis on Current‐service and Interest Costs for year ending 30/06/2018 Retirement funds The Municipality requested detailed employee and pensioner information as well as information on the Municipality’s share of the Pension and Retirement Funds’ assets from the fund administrator. The fund administrator confirmed that assets of the Pension and Retirement Funds are not split per participating employer. Therefore, the Municipality is unable to determine the value of the plan assets as defined in GRAP 25.

190 | P a g e
As part of the Municipality’s process to value the defined benefit liabilities, the Municipality requested pensioner data from the fund administrator. The fund administrator claim that the pensioner data to be confidential and were not willing to share the information with the Municipality. Without detailed pensioner data the Municipality was unable to calculate a reliable estimate of the accrued liability in respect of pensioners who qualify for a defined benefit pension.

191 | P a g e
Notes to the Annual Financial Statements Figures in Rand 2018 2017
15. Employee benefit obligations (continued) Therefore, although the Consolidated Retirement Fund for Local Government is a Multi Employer fund defined as defined benefit plan, it will be accounted for as defined contribution plan. All the required disclosure has been made as defined in GRAP 25.31. Consolidated Retirement Fund for Local Government The contribution rate payable is 9% by members and 18% by Council. The last actuarial valuation performed for the year ended 30 June 2017 revealed that the fund is in a sound financial position with a funding level of 100.5% (30 June 2016 ‐ 100.0%).
Contributions paid recognised in the Statement of Financial Performance 1 140 176 ‐ Defined contribution funds Council contributes to the SALA Pension Fund, Municipal Councillors Pension Fund and Municipal Workers Retirement Fund which are defined contribution funds. The retirement benefit fund is subject to the Pension Fund Act, 1956, with pension being calculated on the pensionable remuneration paid. Current contributions by Council are charged against expenditure on the basis of current service costs. SALA Pension Fund 1 587 025 ‐Municipal Councillors Pension Fund 252 254 ‐Municipal Workers Retirement Fund 1 669 071 ‐
3 508 350 ‐
16. Funds to be surrendered
Carrying amount of funds to be surrendered
Opening balance 8 954 160 6 587 247 Transferred from unspent conditional grants 3 196 539 3 398 913Withheld during the year ‐ (1 032 000)
12 150 699 8 954 160
Funds to be surrendered represents unspent conditional grants and receipts from National Treasury for which no rollover application has been submitted and / or approved at 30 June. Furthermore unspent conditional grants and receipts which are not cash backed as required are also transferred to this line item.

192 | P a g e
Notes to the Annual Financial Statements Figures in Rand 2018 2017
17. Provisions
Reconciliation of provisions ‐ 2018
Opening Reversed Change in Total Balance during the discount year factor Environmental rehabilitation 9 512 730 (79 401) 716 933 10 150 262
Reconciliation of provisions ‐ 2017
Opening Additions Change in Total Balance discount factor Environmental rehabilitation 8 848 506 89 071 575 153 9 512 730
Environmental rehabilitation provision
The municipality has an obligation to rehabilitate landfill sites at the end of the expected useful life of the asset. Total cost and estimated date of decommission of the sites are as follows: Warrenton Cost of Cost of rehabilitation rehabilitationEstimated decommission date ‐ 2019 10 150 262 9 512 730
Material Assumption used:
Area of landfill site consumed 2015 2016 2017 2018 Warrenton 80,59 % 60,97 % 40,37 % 99,99 %Discount rate used 5,24 % 6,16 % 6,50 % 7,60 % The discount rate used the calculate the present value of the rehabilitation costs at each reporting period is based on a calculated risk free rate as determined by the municipality. This rate is in line with a competitive investment rate the municipality can obtain from an A grade financial institution. This rate used is also within the inflation target range of the South African Reserve Bank of between 3% to 6%. The licence of the landfill site is currently issued to Frances Baard District Municipality and must still be transferred to Magareng Municipality. 18. Service charges Sale of electricity Sale of water Sewerage and sanitation charges Refuse removal Less: Indigent subsidies
20 092 105 14 300 0687 559 118 6 354 8154 768 232 4 436 7784 567 464 4 294 779(3 007 881) (1 483 610)
33 979 038 27 902 830
19. Rental of facilities and equipment
Premises Premises ‐ 25 993Venue hire ‐ 31 243

193 | P a g e
‐ 57 236

194 | P a g e
Notes to the Annual Financial Statements Figures in Rand
20. Other income Commonage Photocopies Burial fees Valuation and clearance certificates Commissions Sundry income
21. Investment revenue Interest revenue Bank
‐ Property rates
Rates received
Residential Commercial State Other Less: Income forgone
Valuations Residential Commercial State Municipal Small holdings and farms
2018 2017
35 580 82 795‐ 15 32148 390 49 63813 099 9 1003 516 4 750304 884 326 882
405 469 488 486 635 838 254 531
4 832 731 5 275 1611 341 262 1 303 493464 536 445 325806 327 766 825‐ (896 804)
7 444 856 6 894 000 428 715 710 428 715 71088 080 700 88 080 70021 409 830 21 409 8304 733 800 4 733 8001 451 680 240 1 451 680 240
1 994 620 280 1 994 620 280
Valuations on land and buildings are performed every 4 years. The last general valuation came into effect on 1 July 2015. Interim valuations are processed on an annual basis to take into account changes in individual property values due to alterations and subdivisions. Rates are levied on a monthly basis and are payable within 30 days. Interest at prime plus 1% per annum (2017:prime plus ‐%) is levied on rates outstanding two months after due date.

195 | P a g e
Notes to the Annual Financial Statements Figures in Rand
23. Government grants and subsidies Operating grants Equitable share Finance Management Grant Frances Baard District Municipality Operating Grant Library Development Fund Northern Cape Provincial Treasury Grant ‐ AFS Expanded Public Works Programme (EPWP)
Capital grants Municipal Infrastructure Grant Intergrated National Electrification Programme Grant Frances Baard District Municipality Capital Grant Water Grant (Department of Water and Sanitation)
Conditional and Unconditional Included in above are the following grants and subsidies received: Conditional grants received Unconditional grants received
Equitable Share
2018 2017 37 698 000 35 300 0001 900 000 782 7644 100 000 3 091 1601 092 000 906 6501 118 769 2 500 0001 000 000 1 000 000
46 908 769 43 580 574
7 000 000 8 776 081 2 584 693 4 875 5915 027 770 1 519 947‐ 773 923
14 612 463 15 945 542
61 521 232 59 526 116
21 795 309 20 819 46646 337 536 40 132 283
68 132 845 60 951 749
In terms of the Constitution, this grant is used to subsidise the provision of basic services to indigent community members. Current‐year receipts 37 698 000 35 300 000Conditions met ‐ transferred to revenue (37 698 000) (35 300 000)
‐ ‐
Finance Management Grant
Current‐year receipts 1 900 000 1 825 000 Conditions met ‐ transferred to revenue (1 900 000) (782 764)Transferred to funds to be surrendered ‐ (1 042 236)
‐ ‐
The Financial Management Grant is paid by National Treasury to municipalities to help implement the financial reforms required by the Municipal Finance Management Act (MFMA), 2003. The Finance Management Grant also pays for the cost of the Financial Management Internship Programme (e.g. salary costs of the Financial Management Interns).

196 | P a g e
Municipal Infrastructure Grant
Current‐year receipts 7 000 000 10 653 000 Conditions met ‐ transferred to revenue (7 000 000) (8 776 081)Transferred to funds to be surrendered ‐ (1 876 919)
‐ ‐
The Municipal Infrastructure Grant (MIG) is a conditional grant to support municipal capital budgets to fund municipal infrastructure and to upgrade existing infrastructure, primarily benefiting poor households.

197 | P a g e
Notes to the Annual Financial Statements Figures in Rand
23. Government grants and subsidies (continued) Frances Baard District Municipality Capital and Operating Grant Current‐year receipts Conditions met ‐ transferred to revenue Raising a non‐exchange receivable
2018 2017 9 297 630 4 441 247(9 127 770) (4 611 107)(169 860) 169 860
‐ ‐
The Frances Baard Operational Grant is paid by Frances Baard District Municipality to the municipality to subsidise operational maintenance of infrastructure. Furthermore the Frances Baard District Municipality is co‐funding certain infrastructure projects. Library Development Fund
Current‐year receipts 1 092 000 1 262 000 Conditions met ‐ transferred to revenue (1 092 000) (906 650)Transferred to funds to be surrendered ‐ (355 350)
‐ ‐
The Department of Sport, Arts & Culture grant was used for the development of libraries in the Magareng area. Expanded Public Works Programme
Current‐year receipts 1 000 000 ‐ Conditions met ‐ transferred to revenue (1 000 000) ‐
‐ ‐
The EPWP grant was used or road infrastructure development in the Warrenton area.
Water Grant (Department of Water and Sanitation)
Current‐year receipts ‐ 773 923 Conditions met ‐ transferred to revenue ‐ (773 923)
‐ ‐
The Department of Water and Forestry grant was used for water personnel salaries in the Magareng area. Intergrated National Electrification Programme
Current‐year receipts 5 000 000 5 000 000 Conditions met ‐ transferred to revenue (2 584 693) (4 875 591)Transferred to funds to be surrendered (2 415 307) (124 409)
‐ ‐

198 | P a g e
Conditions still to be met ‐ remain liabilities (see note ).

199 | P a g e
Notes to the Annual Financial Statements Figures in Rand 23. Government grants and subsidies (continued)
Northern Cape Provincial Treasury Grant ‐ AFS
Current‐year receipts Conditions met ‐ transferred to revenue Transferred to funds to be surrendered
Conditions still to be met ‐ remain liabilities (see note ).
2018 2017 1 900 000 2 500 000(1 118 769) (2 500 000)(781 231) ‐
‐ ‐
Northern Cape Provincial Treasury provided the grant to assist the municipality in funding the compilation of GRAP compliant Annual Financial Statements and a Fixed Asset Register for the financial year ended 30 June 2018. 24. Revenue Service charges Rental of facilities and equipment Interest earned ‐ outstanding receivables Licences and permits Other income Interest earned ‐ external investments Property rates Government grants & subsidies Public contributions and donations Fines, Penalties and Forfeits The amount included in revenue arising from exchanges of goods or services are as follows: Service charges Rental of facilities and equipment Interest earned ‐ outstanding receivables Licences and permits Other income Interest earned ‐ external investments The amount included in revenue arising from non‐exchange transactions is as follows: Taxation revenue Property rates Transfer revenue Government grants & subsidies Public contributions and donations Fines, Penalties and Forfeits
33 979 038 27 902 830‐ 57 23611 121 069 9 278 342357 244 343 195405 469 488 486635 838 254 5317 444 856 6 894 00061 521 232 59 526 1166 611 613 1 425 63317 118 619 78 581
139 194 978 106 248 950 33 979 038 27 902 830‐ 57 23611 121 069 9 278 342357 244 343 195405 469 488 486635 838 254 531
46 498 658 38 324 620
7 444 856 6 894 000
61 521 232 59 526 116 6 611 613 1 425 63317 118 619 78 581
92 696 320 67 924 330

200 | P a g e
Notes to the Annual Financial Statements Figures in Rand
25. Employee related costs Basic Bonus Medical aid ‐ company contributions UIF SDL Industrial council Leave pay provision charge Pension contributions Post retirement medical aid benefit Travel, motor car, accommodation, subsistence and other allowances Overtime payments Long‐service awards Acting allowances Housing benefits and allowances Standby allowance
Remuneration of municipal manager ‐ JFT Leeuw (March 2013 to May 2016) Leave pay Remuneration of the Acting Municipal Manager ‐ KG Gaborone (4 July 2016 to 31 May 2017) Acting Allowance Cellphone allowance Contributions to UIF, Medical and Pension Funds Remuneration of the Acting Municipal Manager ‐ CD Lentsoe (1 June 2017 to 30 November 2017) Acting Allowance
Remuneration of the Acting Municipal Manager ‐ MM MonyamaneMasuku (1 December 2017 to 30 June 2018) Annual Remuneration Contributions to UIF, Medical and Pension Funds Remuneration of the Chief Financial Officer ‐ MM Motswaledi (Appointed 1 March 2017) Annual Remuneration Travel Allowance Contributions to UIF, Medical and Pension Funds
2018 2017
27 085 295 24 187 4242 102 243 1 709 7561 715 911 1 604 184282 842 265 086335 466 300 64414 083 12 787645 977 819 8564 396 272 3 921 512514 000 515 000617 015 361 4193 314 068 2 342 946219 000 224 00081 109 47 880305 025 275 912181 466 160 196
41 809 772 36 748 602
361 212 11 000 5 358
377 570
66 675 13 335
115 099 ‐297 ‐
115 396 ‐ 520 712 163 361165 907 55 302126 754 44 242
813 373 262 905

201 | P a g e
Notes to the Annual Financial Statements Figures in Rand
25. Employee related costs (continued) Remuneration of the HOD Corporate Services ‐ CD Lentsoe (Appointed May 2012) Annual Remuneration Car Allowance Cellphone allowance Contributions to UIF, Medical and Pension Funds
Remuneration of the HOD Technical Services ‐ LM Mokoena (Appointed June 2012) Annual Remuneration Car Allowance Cellphone allowance Contributions to UIF, Medical and Pension Funds
2018 2017
571 200 546 00094 876 42 000‐ 2 250148 505 144 182
814 581 734 432
548 808 548 808182 862 121 7629 000 9 000160 675 160 180
901 345 839 750

202 | P a g e
Notes to the Annual Financial Statements Figures in Rand 2018 2017
26. Remuneration of councillors
Annual remuneration 3 068 748 3 268 132
Remuneration of the Mayor ‐ Mrs GE Manopole (May 2011 to August 2016) Councillor salary ‐ 130 609Medical aid contributions ‐ 5 264Pension contributions ‐ 5 570Travel allowance ‐ 41 112Cellphone allowance ‐ 2 735
‐ 185 290
Remuneration of the Mayor ‐ Mr B Mhaleni (started August 2016)
Councillor salary 461 592 415 605Pension contributions 68 349 57 861Travel allowance 178 922 162 657Cellphone allowance 25 800 19 129
734 663 655 252
In‐kind benefits The Mayor is full‐time. The mayor is provided with an office and secretarial support at the cost of the Council. The Mayor has the use of Council owned vehicles and a driver for official duties.
Councillor: OM Majola (May 2011 to August 2016) Councillor salary ‐ 29 285Councillors medical aid contributions ‐ 4 503Councillors pension contributions ‐ 1 550Travel allowance ‐ 12 606Cellphone allowance ‐ 10 211
‐ 58 155
Councillor: J Louw (Started August 2016)
Councillor salary 219 331 223 308Travel allowance 60 119 71 735Cellphone allowance 29 400 32 040
308 850 327 083
Councillor: BV Ximba (May 2011 to August 2016)
Councillor salary ‐ 27 902Councillors pension Contributions ‐ 1 744Travel allowance ‐ 12 605Cellphone allowance ‐ 10 211
‐ 52 462Councillor: MR Moleko (May 2011 to August 2016)

203 | P a g e
Councillor salary ‐ 27 902Councillors pension contributions ‐ 1 744Travel allowance ‐ 12 606Cellphone allowance ‐ 10 211
‐ 52 463

204 | P a g e
Notes to the Annual Financial Statements Figures in Rand
26. Remuneration of councillors (continued) Councillor: WJ Potgieter (started August 2016) Councillor salary Councillors pension contributions Travel allowance Cellphone allowance Councillor: EM Hans (May 2011 to August 2016) Councillor salary Concillors medical aid contributions Concillors pension contributions Travel allowance Cellphone allowance Councillor: MK Majoro (November 2014 to August 2016) Councillor salary Travel allowance Cellphone allowance Councillor: AK Zalisa (started June 2015) Councillor salary Concillors pension contributions Travel allowance Cellphone allowance Councillor: JD Tshekedi (started August 2016) Councillor salary Concillors medical aid contributions Concillors pension contributions Travel allowance Cellphone allowance Concillor: KG Freddie (started August 2016) Councillor salary Concillors pension contributions Travel allowance Cellphone allowance Councillor: KR Landry (August 2016 to May 2017) Councillor salary Concillors pension contributions Travel allowance Cellphone allowance Councillor: T Cross (started August 2016)
2018 2017 216 170 193 00131 670 14 04068 158 61 63329 400 32 040
345 398 300 714
‐ 30 686 ‐ 6 756‐ 1 354‐ 12 606‐ 10 211
‐ 61 613
‐ 50 047 ‐ 12 606‐ 10 211
‐ 72 864
228 520 201 914 33 374 21 39472 098 71 73629 400 32 040
363 392 327 084
234 223 135 073 30 199 28 75734 082 18 92047 590 59 13029 400 22 129
375 494 264 009
228 296 151 567 33 076 21 39472 098 59 13029 400 22 129
362 870 254 220

205 | P a g e
‐ 136 646 ‐ 19 156 ‐ 53 410 ‐ 20 090
‐ 229 302

206 | P a g e
Notes to the Annual Financial Statements Figures in Rand 24. Remuneration of councillors (continued) Councillor salary Concillors pension contributions Travel allowance Cellphone allowance Councillor: S Petersen (started August 2016) Councillor salary Travel allowance Cellphone allowance Councillor: TE Mokola (started September 2017) Councillor salary Concillors medical aid contributions Concillors pension contributions Travel allowance Cellphone allowance
27. Depreciation and amortisation Property, plant and equipment
28. Impairment loss/reversal of impairments Impairments Property, plant and equipment The recoverable amount of all assets were assessed at year end and it was found that certain assets had aa recoverable less that the carry value, therefore an impairment loss was raised.
29. Finance costs Trade and other payables Employee benefit liability Landfill rehabilitation provision
30. Debt impairment Contributions to debt impairment provision
31. Bulk purchases Electricity Water
2018 2017
219 868 125 213 31 970 17 441 37 082 49 027 29 400 22 129
318 320 213 810
202 382 142 653 56 180 49 027 29 400 22 129
287 962 213 809
143 437 ‐ 20 244 ‐ 19 733 ‐ 54 407 ‐ 24 120 ‐
261 941 ‐
13 845 239 11 479 813
4 396 401 3 099 138
6 373 816 5 224 279 1 279 000 1 182 000 ‐ 575 153
7 652 816 6 981 432
39 831 557 26 210 388

207 | P a g e
18 234 229 19 082 951 14 058 509 13 278 399
32 292 738 32 361 350

208 | P a g e
Notes to the Annual Financial Statements Figures in Rand
32. Contracted services Outsourced services Professional services Contractors
33. General expenses Advertising Auditors fees Bank charges Cleaning Commission paid Legal fees Entertainment Insurance Motor vehicle expenses Printing and stationery Protective clothing Inventory consumed Subscriptions and membership fees Training Travel ‐ local Municipal departmental charges Sundry expenses Communication Chemicals
34. Auditors' fees Fees
35. Cash generated from operations Deficit Adjustments for: Depreciation and amortisation Gain (loss) on sale of assets and liabilities Impairment deficit Debt impairment Movements in retirement benefit assets and liabilities Movements in provisions Changes in working capital: Receivables from exchange transactions Receivables from exchange transactions Receivables non‐exchange transactions Other receivables from non‐exchange transactions Payables from exchange transactions VAT Unspent conditional grants and receipts Consumer deposits
2018 2017
77 054 75 5633 554 978 5 096 369264 825 283 337
3 896 857 5 455 269 63 456 81 9802 917 178 2 606 703112 195 251 906‐ 70 488305 816 76 5207 701 2 193123 134 155 439288 011 1 391 153772 754 1 702 195467 476 533 606393 753 1 0002 417 015 2 042 223526 972 506 500‐ 183 240598 780 683 119‐ 635 190‐ 54 594522 846 458 6361 116 886 924 718
10 633 973 12 361 403 2 917 178 2 606 703
(17 371 762) (29 654 709)
13 128 306 11 479 813 1 148 086 (135 635)4 396 401 3 099 13839 831 557 26 210 388(336 000) (206 000)637 532 664 224
292 (7 977) ‐ 19 605(45 100 307) (25 282 403)(3 983 725) (503 711)24 151 175 29 859 081

209 | P a g e
337 600 (5 160 941) 3 196 544 2 366 913 31 463 33 028
20 067 162 12 780 814

210 | P a g e
Notes to the Annual Financial Statements Figures in Rand 2018 2017
‐ Commitments Authorised
capital expenditure
Already contracted for but not provided for
Property, plant and equipment 42 025 638 39 959 810
Total capital commitments
Already contracted for but not provided for 42 025 638 39 959 810
Total commitments
Total commitments Authorised capital expenditure 42 025 638 39 959 810
This committed expenditure relates to property, plant and equipment and will be financed by government grants. 37. Contingent liability
2018: Neo Ikaneng vs Magareng Local Municipality 5 000 000 5 000 000The plaintiff is suing the municipality for unlawful prosecution, suspension, dismissal and defamation. The matter has been referred to the municipal lawyers and since the initial correspondence no further instruction has been received from the plaintiff's claims.
2017:
Skillfull 1149 CC vs Magareng Local Municipality 437 340 437 340The plaintiff claims that they have completed work at the hospital road and the municipality is refusing to pay for the work done. The matter has been referred for arbitration. Neo Ikaneng vs Magareng Local Municipality 5 000 000 5 000 000The plaintiff is suing the municipality for unlawful prosecution, suspension, dismissal and defamation. The matter has been referred to the municipal lawyers and since the initial correspondence no further instruction has been received from the plaintiff's claims. ‐ ‐ ‐ ‐
5 437 340 5 437 340

211 | P a g e
Notes to the Annual Financial Statements Figures in Rand 2018 2017
38. Related parties
Relationships Councillors MayorUltimate controlling entity Part‐time councillorsAccounting Officer Municipal ManagerMembers of key management Chief financial officer HOD Corporate Services HOD Technical Services
Key management and Councillors receive and pay for services on the same terms and conditions as other ratepayers / residents. Related party transactions
2018: Rates ‐ Levied Service Other ‐ Levied Outstanding Councillors 1July 2017 ‐ charges ‐ 1 July 2017 ‐ balance 30 June 2018 Levied 1 July 30 June 2018 2017 ‐ 30 June 2018 WJ Potgieter (100894) 3 918 ‐ ‐ 326WJ Potgieter (100899) ‐ 16 365 ‐ 1 351AK Zalisa 2 457 (11 019) (2 597) 7 885J Louw ‐ 3 535 235 4 610SS Perterson ‐ 3 622 1 434 21 858TE Crosss 1 262 2 991 315 4 916JD Tshekedi 819 2 285 ‐ 17 128B Mhlaleni ‐ 2 420 ‐ (7)KG Freddie ‐ 2 824 3 (317)
8 456 23 023 (610) 57 750
Municipal Manager and Section 57 Employees Rates ‐ Levied Service Other ‐ Levied Outstanding 1July 2017 ‐ charges ‐ 1 July 2017 ‐ balance 30 June 2018 Levied 1 July 30 June 2018 2017 ‐ 30 June 2018 CD Lentsoe 4 050 13 297 ‐ 663
2017: Rates ‐ Levied Service Other ‐ Levied Outstanding Councillors 1July 2016 ‐ charges ‐ 1 July 2016 ‐ balance 30 June 2017 Levied 1 July 30 June 2017 2016 ‐ 30 June 2017 WJ Potgieter (100894) 3 682 ‐ ‐ 307WJ Potgieter (100899) ‐ 3 857 ‐ 1 855BV Ximba (resigned 16 Aug 2016) ‐ 264 49 8 368J Louw (1004957) 465 ‐ ‐ 4 237AK Zalisa 2 308 (21 902) 3 001 22 536JD Tshekedi 624 1 263 955 15 933EM Hans (resigned 16 Aug 2016) ‐ 200 80 15 459
7 079 (16 318) 4 085 68 695

212 | P a g e
Municipal Manager and Section 57 Employees Rates ‐ Levied Service Other ‐ Levied Outstanding 1July 2017 ‐ charges ‐ 1 July 2016 ‐ balance 30 June 2018 Levied 1 July 30 June 2017 2016 ‐ 30 June 2017 CD Lentsoe 386 1 733 ‐ 923

213 | P a g e
Notes to the Annual Financial Statements Figures in Rand 2018 2017
38. Related parties (continued) Key Management Personnel No related party transactios took place during the financial year except those at arms length for provision of services. Refer to note 25 for detailed remuneration of Key management personnel and note 26 for the remuneration of councillors. 39. Prior period errors
The municipality corrected the following prior period errors retrospectively and restated comparative amounts in terms of GRAP 3 ‐ Accounting policies, Changes in Estimates and Errors. 39.1. Prior period error ‐ Overstatement of payables from exchange transactions
During the period under review it was noted that salary control balance was overstated as some of the 3rd party payments were not taken into account to reduce the control balance. The comparative statements for 2016/17 financial year have been restated. The effect of the correction of the error(s) is summarised below: The correction of the error(s) results in adjustments as follows:
Statement of Financial Position Decrease in payables from exchange transactions 14 626 Increase in opening accumulated surplus or deficit (14 626) 39.2. Prior period error ‐ Understatement of payables from exchange transactions
During the period under review it was noted that salary control balance was understated due to the underpayment of 3rd parties on behalf of retired former employees. The comparative statements for 2016/17 financial year have been restated. The effect of the correction of the error(s) is summarised below: Statement of Financial PositionDecrease in payables from exchange transactions 149 423 Decrease in opening accumulated surplus or deficit 22 116
Statement of Financial Performance Increase in other income (42 702) Decrease in employee related costs (128 837) 39.3. Prior period error ‐ Deferred revenue on prepaid sales not recognised:
During the period under review it was noted that deferred revenue based on unused prepaid electricity tokens was not recognised at year‐end. The comparative statements for 2016/17 financial year have been restated. The effect of the correction of the error(s) is summarised below: The correction of the error(s) results in adjustments as follows:
Statement of Financial Position Increase in payables from exchange transactions (99 743) Decrease in opening accumulated surplus or deficit 28 584
Statement of Financial Performance Decrease in revenue from exchange transactions 71 159 39.4. Prior period error ‐ Consumption across year‐ends not recognised:
During the period under review it was noted that accrued revenue from electricity and water sales was not recognised at year‐end. The comparative statements for 2016/17 financial year have been restated. The effect of the correction of the error(s) is summarised below:

214 | P a g e
Notes to the Annual Financial Statements Figures in Rand 2018 2017
39. Prior period errors (continued)
The correction of the error(s) results in adjustments as follows:
Statement of Financial Position Increase in receivables from exchange transactions 586 869Increase in opening accumulated surplus or deficit (770 823)Decrease in vat receivable (72 072)
Statement of Financial Performance Decrease in revenue from exchange transactions 256 026 39.5. Prior period error ‐ Understatement of payables from exchange transactions
During the period under review it was noted that trade creditors were understated as certain year end creditors were not recorded. The comparative statements for 2016/17 financial year have been restated. The effect of the correction of the error(s) is summarised below: The correction of the error(s) results in adjustments as follows:
Statement of financial position Increase in payables from exchange transactions (98 893) Decrease in consumer deposits 2 396
Statement of Financial Performance Increase in general expenses 91 703 Increase in repairs & maintenance 4 794 39.6. Prior period error ‐ Understatement of VAT receivable During the period under review it was noted that audit fees, VAT receivable and donations in kind were understated as payments by NCPT to Auditor General on behalf of the municipality were not correctly recognised. The comparative statements for 2016/17 financial year have been restated. The effect of the correction of the error(s) is summarised below: The correction of the error(s) results in adjustments as follows:
Statement of financial position Increase in VAT receivable 175 078
Statement of Financial Performance Increase in general expenses 1 250 556 Increase in Donations in kind (1 425 633) 39.7. Prior period error ‐ Correction of payables from exchange transactions During the period under review it was noted that trade creditors balances were incorrectly stated as invoices on the statements were not taken into account and a debit creditor balance recorded against payables. The comparative statements for 2016/17 financial year have been restated. The effect of the correction of the error(s) is summarised below: The correction of the error(s) results in adjustments as follows:
Statement of financial position Increase in payables from exchange transactions (273 121) Increase in other receivables from non‐exchange 2 068 Decrease in VAT receivable (95 043)
Statement of Financial Performance Increase in bulk purchases 322 196 Increase in general expenses 43 900

215 | P a g e
Notes to the Annual Financial Statements Figures in Rand 2018 2017
39. Prior period errors (continued) 39.8. Prior period error ‐ Correction of other assets far During the period under review it was noted that certain movable assets were not removed from the register at 30 June 2017 despite the fact that these assets were disposed at 30 June 2017. The comparative statements for 2016/17 financial year have been restated. The effect of the correction of the error(s) is summarised below: The correction of the error(s) results in adjustments as follows:
Statement of financial position Decrease in other assets (1 076)
Statement of Financial Performance Increase in loss on sale of assets 1 076 39.9. Prior period error ‐ Correction of wip due to project creditor
During the period under review it was noted that a project creditor was not accurued for in work‐in ‐progress at 30 June 2017. The comparative statements for 2016/17 financial year have been restated. The effect of the correction of the error(s) is summarised below: Statement of financial positionIncrease in payables from exchange transactions (129 049) Increase in vat receivable 15 848Increase in capital work in progress 113 201 39.10. Prior period error ‐ Unrecorded receipts not allocated at year‐end During the period under review it was noted that various amounts deposisted in to the municipality's main bank account were not receipted in the accounting records at 30 June 2017. The comparative statements for 2016/17 financial year have been restated. The effect of the correction of the error(s) is summarised below: Statement of financial positionDecrease in payables from exchange transactions 169 759Increase in opening accumulated surplus or deficit (159 759)
Statement of Financial Performance Increase in non‐exchange revenue (10 000)
40. Comparative figures Certain comparative figures have been reclassified. During the year under review it was noted that in the prior year account balances and totals were mistated due to a missmapping of various general ledger accounts. The error has since been rectified in the current year. The effects of the reclassification are as follows:

216 | P a g e
Notes to the Annual Financial Statements Figures in Rand ‐ Comparative figures (continued)
Statement of financial performance ‐ extract
Employee related costs Repairs and maintenance Contracted services General expenses Total
Comparative Reclassificati Afterfigures on reclassificatiopreviously nreported (37 826 811) 1 078 209 (36 748 602)(3 075 774) 3 075 774 ‐(5 446 171) (9 098) (5 455 269)(8 172 619) (4 144 885) (12 317 504)
(54 521 375) ‐ (54 521 375)
41. Unauthorised expenditure Opening balance Current year ‐ capital
77 442 536 61 772 95730 533 375 15 669 579
107 975 911 77 442 536 42. Fruitless and wasteful expenditure Opening balance Current year Condonement by Council
11 494 719 6 270 4407 987 580 5 224 279‐ ‐
Fruitless and wasteful expenditure awaiting further action 19 482 299 11 494 719
Details of fruitless and wasteful expenditure ‐ current year Disciplinary steps taken/criminal proceedings Disciplinary steps taken/criminal proceedings Interest on late payments ‐ suppliers Awaiting Council decision 6 354 963Interest and penalties on late payment ‐ SARS Awaiting Council decision 356 405PAYE & SITE WIP Project written off Awaiting Council decision 1 276 212
7 987 580
Details of fruitless and wasteful expenditure‐ prior year
Disciplinary steps taken/criminal proceedings Disciplinary steps taken/criminal proceedings Interest on late payments ‐ suppliers Awaiting Council decision 5 081 269Interest and penalties on late payment ‐ SARS Awaiting Council decision 140 311PAYE & SITE Interest and penalties on late payment ‐ SARS Awaiting Council decision 2 699VAT
5 224 279
43. Irregular expenditure
Opening balance 37 967 992 25 770 634 Add: Irregular Expenditure ‐ current year 13 129 848 12 197 358Less: Amounts condoned ‐ ‐

217 | P a g e
51 097 840 37 967 992
Details of irregular expenditure – current year
Condoned by (condoning authority) Disciplinary steps taken/criminal proceedings Various contravention of procurementprescripts
Various contravention of procurement prescripts 13 129 848

218 | P a g e
Notes to the Annual Financial Statements Figures in Rand 2018 2017
43. Irregular expenditure (continued)
Details of irregular expenditure ‐ prior year Condoned by (condoning authority) Condoned by (condoning authority)Various contravention of procurementprescripts Awaiting Council decision 12 197 358
The irregular expenditure as indicated above is inclusive of VAT. 27. Risk management
Financial risk management
The municipality’s activities expose it to a variety of financial risks: market risk (including currency risk, fair value interest rate risk, cash flow interest rate risk and price risk), credit risk and liquidity risk. The municipality’s overall risk management program focuses on the unpredictability of financial markets and seeks to minimise potential adverse effects on the municipality’s financial performance. Liquidity risk Prudent liquidity risk management implies maintaining sufficient cash, the availability of funding through an adequate amount of committed credit facilities. Due to the dynamic nature of the underlying business, the treasury maintains flexibility in funding by maintaining availability under credit lines. The entity's risk to liquidity is a result of the funds available to cover future commitments. The entity manages liquidity risk through an ongoing review of future commitments and credit facilities. The table below analyses the municipality’s financial liabilities and net‐settled derivative financial liabilities into relevant maturity groupings based on the remaining period at the statement of financial position to the contractual maturity date. The amounts disclosed in the table are the contractual undiscounted cash flows. Balances due within 12 months equal their carrying balances as the impact of discounting is not significant. Credit risk
Credit risk is the risk that a counter party to a financial or non‐financial asset will fail to discharge an obligation and cause the municipality to incur a financial loss. Credit risk consist mainly of cash deposits, cash equivalents, trade and other receivables and unpaid conditional grants and subsidies. Receivables are disclosed net after provisions are made for impairment and bad debts. Trade debtors comprise of a large number of ratepayers, dispersed across different sectors and geographical areas. Ongoing credit evaluations are performed on the financial condition of these debtors. Credit risk pertaining to trade and other debtors is considered to be moderate due the diversified nature of debtors and immaterial nature of individual balances. In the case of consumer debtors the municipality effectively has the right to terminate services to customers but in practice this is difficult to apply. In the case of debtors whose accounts become in arrears, Council endeavours to collect such accounts by "levying of penalty charges", "demand for payment", "restriction of services" and, as a last resort, "handed over for collection", whichever procedure is applicable in terms of Council's Credit Control and Debt Collection Policy.
All rates and services are payable within 30 days from invoice date. Refer to note 11 and 13 for all balances outstanding longer than 30 days. These balances represent all debtors at year end which defaulted on their credit terms. Also refer to note 11 and 13 for balances included in receivables that were re‐negotiated for the period under review. Credit risk consists mainly of cash deposits, cash equivalents, derivative financial instruments and trade debtors. The municipality only deposits cash with major banks with high quality credit standing and limits exposure to any one counter‐party.

219 | P a g e
Notes to the Annual Financial Statements Figures in Rand 2018 2017
37. Risk management (continued)
Interest rate risk
As the municipality has no significant interest‐bearing assets, and therefore it is not exposed to interest rate risk Foreign exchange risk The municipality does not engage in foreign exchange transactions.
The municipality reviews its foreign currency exposure, including commitments on an ongoing basis. The municipality expects its foreign exchange contracts to hedge foreign exchange exposure. Price risk The municipality is not exposed to price risk Post‐tax surplus for the year would increase/decrease as a result of gains or losses on equity securities classified as at fair value through surplus or deficit. Other components of equity would increase/decrease as a result of gains or losses on equity securities classified a available‐for‐sale.

220 | P a g e
Figures in Rand 45. Financial instruments disclosure
Categories of financial instruments
2018
Financial assets Receiavable from non‐exchange transactions Receivables from exchange transactions Cash and cash equivalents
Financial liabilities Payables from exchange transactions Consumer deposits Funds to be surrendered
2017 Financial assets Receivables from non‐exchange transactions Receivables from exchange transactions Cash and cash equivalents
Financial liabilities
2018 2017
At amortised Total cost Payables from exchange transactions 114 230 199 114 230 199Consumer deposits 869 015 869 015Funds to be surrendered 8 954 160 8 954 160
124 053 374 124 053 374
At amortised Totalcost 5 924 670 5 924 6708 751 999 8 751 9993 887 003 3 887 003
18 563 672 18 563 672
At amortised Totalcost 137 823 265 137 823 265900 478 900 47812 150 699 12 150 699
150 874 442 150 874 442
At amortised Totalcost 1 940 945 1 940 9453 483 249 3 483 249106 107 106 107
5 530 301 5 530 301

221 | P a g e
46. Going concern
We draw attention to the fact that at 30 June 2018, a material uncertainity exists regarding the ability of the municipality to continue as a going concern. These factors are listed below:

222 | P a g e
Notes to the Annual Financial Statements Figures in Rand 2018 2017
46. Going concern (continued) 46. The provisions for rehabilitation of landfill sites and employee benefit provisions are not cash backed. 47. Funds to be surrendered are not fully cash backed as required. 48. The municipality experienced cash flow problems during the year, which resilted in major creditors not being paid
timeously. 49. The consumer debtors days outstanding increased to 1081 days from (2017: 1277 days). 50. Electricity distribution lossess (technical and non‐technical) have decreased to 15% (2017: 27%) and the water distribution losses has decreased to 40% from (2017: 90%). 51. The municipalitiy's current liabilities exceeds it's current assets by R121 450 762 (2017: R106 910 643) which indicates a current ratio which is below the required norm of 1.5 ‐ 2. 52. The municipality incurred a net defiict for the year under review of R17 371 762 (2017: R29 654 709), the major contributors to this change is increases impairments, finance costs, employee related costs. Even though the above uncertainties exist regarding the municipality's ability to continue as a going concern, the annual financial statements have been prepared on the basis of accounting policies applicable to a going concern. This basis presumes that funds will be available to finance future operations and that the realisation of assets and settlement of liabilities, contingent obligations and commitments will occur in the ordinary course of business.
The ability of the municipality to continue as a going concern is dependant on a number of factors. The most significant of these is that the Accounting Officer continues to procure funding for teh ongoing operations of the municipality. Furthermore the municipality has embarked on implementing strategies which will strengthen its ability to continue as a going concern. The most significant of these is that the municipality is currently implementing a system to enhance revenue collection and cash flow by improving on the debt recoverability. The municipality still has the ability to levy rates and taxes and will continue to receive funding from government as evident from the Equitable Share allocation in terms of the Division of Revenue Act. 47. Events after the reporting date Ms EM Moncho was appointed as Accounting Officer on 1 July 2018.
On 1 October 2018 a settlement agreement between Magareng Local Municipality and Miss CC Kruger was reached. The municipality is liable to pay Miss CC Kruger an amount of R 132,371.90 of which R 43,231.40 has been provided for under payables from exchange transactions at 30 June 2018. 48. In‐kind donations and assistance
The municipality received in‐kind donations or assistance during the period under review relating to payments made to Eskom and Auditor General by Frances Baard District Municipality and Northern Cape Provincial Treasury respectively. Refer to note 23. 49. Private Public Partnerships Council has not entered into any private public partnerships during the financial year. 1) Additional disclosure in terms of Municipal Finance Management Act
Contributions to organised local government
Opening balance Current year subscription / fee Amount paid ‐ current year Amount paid ‐ previous years
515 500 489 000519 072 506 500(44 500) ‐(515 500) (480 000)

223 | P a g e
474 572 515 500

224 | P a g e
Notes to the Annual Financial Statements Figures in Rand 51. Additional disclosure in terms of Municipal Finance Management Act (continued)
Material losses
Electricity distribution losses (kWh) Purchased Sold kWh Losses
% losses Average cost per kWh unit
Losses in Rand value
Water distribution losses (kilolitres) Purchased Sold Kilolitre losses
% losses Average cost per kilolitre
Losses in Rand value
Audit fees Opening balance Current year subscription / fee Amount paid ‐ current year Amount paid ‐ previous years
PAYE and UIF Opening balance Current year subscription / fee Amount paid ‐ current year Amount paid ‐ previous years
Pension and Medical Aid Deductions Opening balance Current year subscription / fee Amount paid ‐ current year Amount paid ‐ previous years
2018 2017 14 291 710 14 972 959 (12 149 652) (11 004 967)
2 142 058 3 967 992
15% 27%
1,41 1,42
3 012 442 5 627 342
4 126 478 4 178 678 (2 467 097) (427 323)
1 659 381 3 751 355
40% 90%
3,89 3,72
6 454 098 13 960 002
4 383 125 4 468 717 3 662 875 1 847 641 (3 582 493) ‐ (4 383 125) (1 933 233)
80 382 4 383 125
308 119 307 361 4 963 843 3 780 488 (3 753 374) (3 472 368) (308 119) (307 362)
1 210 469 308 119

225 | P a g e
1 297 036 669 511 9 861 012 8 735 002 (8 008 357) (7 437 966) (1 297 036) (669 511)
1 852 655 1 297 036

226 | P a g e
Notes to the Annual Financial Statements Figures in Rand 2018 2017
51. Additional disclosure in terms of Municipal Finance Management Act (continued) VAT VAT receivable 15 854 926 16 192 526VAT payable ‐ ‐
15 854 926 16 192 526
In accordance with the VAT act, the municipality is required to submit vat returns on the 25th day following the vat period, however through inspection of the vat returns it was noted that the following vat returns were not submitted when they were due
51. Vat period: June/July 2017 52. Vat period: August/September 2017 53. Vat period: October/November 2017 54. Vat period: December/January 2018 55. Vat period: February/March 2018 56. Vat period: April/May 2018
Councillors' arrear consumer accounts The following Councillors had arrear accounts outstanding for more than 90 days at 30 June 2018: 30 June 2018 Outstanding Outstanding Total less than 90 more than 90 R days days R R Councillor JD Tshekedi 820 16 308 17 128Councillor AK Zalisa 921 6 964 7 885Councillor J Louw 1 052 3 558 4 610Councillor SS Peterson 1 435 20 424 21 859Councillor TE Cross 1 264 3 653 4 917WJ Potgieter (1000894) 326 ‐ 326WJ Potgieter (1000899) 1 351 ‐ 1 351
7 169 50 907 58 076
30 June 2017 Outstanding Outstanding Total less than 90 more than 90 R days days R R Councillor WJ Potgieter (1000899) Councillor WJ Potgieter (1000894) Councillor JD Tshekedi Councillor KG Freddie Councillor J Louw Councillor AK Zalisa
307 ‐ 3071 855 ‐ 1 8551 028 14 905 15 933763 8 635 9 3981 319 2 918 4 23716 032 6 503 22 535
21 304 32 961 54 265
Non‐compliance with Municipal Finance Management Act and other Legislation

227 | P a g e
Non‐compliance with Municipal Finance Management Act During the current financial year the following non‐compliance issues were identified: Non‐compliance with MFMA sec 65(2)(e)
Money owing by the municipality was not paid within 30 days of receiving the relevant invoice orstatement mainly due to lack of proper supporting documents and late submission of invoices by the suppliers.

228 | P a g e
Notes to the Annual Financial Statements Figures in Rand 2018 2017
51. Deviation Section 36(2) Supply Chain Management Regulations Reason for deviation: Emergency Other
52. Other non‐compliance (MFMA 125(2)(e))
Less than R 30 Between R 30 Between R 100 000 001 and R 100 001 and R 2
000 000 00029 679 181 542 257 283158 607 45 120 1 590 262
188 286 226 662 1 847 545
Money owing by the municipality was not always paid within 30 days of receiving an invoice, as required by section 65(2)(e) of the MFMA. Payments were made without the approval of the accounting officer or a properly authorised official, as required by section 11(1) of the MFMA. Although the accounting officer has taken reasonable steps to ensure that the municipality has and maintains an effective system of expenditure control, including procedures for the approval, authorization, withdrawal and payment of funds as required by Section 65(2)(a) of the MFMA, there are still deficiencies. A credit control and debt collection policy was not fully implemented, as required by section 96(b) of the MSA.
Section 9(b) of the MFMA requires that annually before the start of a financial year, the name of each bank where the municipality holds a bank account, and the type and number of each account should be submitted to the relevant provincial treasury and the Auditor‐General in writing. The municipality did not adhere to this section in the current year. The municipality did not update their website with all relevant documentation as required by Section 75(2) of the MFMA. 53. Budget differences Material differences between budget and actual amounts
All variances greater / less than 10% will be explained on the final Annual Financial Statements for the year ended 30 June 2017. 1: Variance below 10%, therefore insignificant. 2: Rental of facilities is difficult to predict as it is based on the frequency of unpredictable events. 3: Economic climate has impacted on debtors payment percentages and therefore interest levied higher than expected. 4: Agency services were no longer required as initially planned. 5: License and permits income is difficult to predict as it is based on the frequency of unpredictable events. 6: Other income is difficult to predict as it is based on the frequency of unpredictable events i.e. burial fees etc. 7: Due to funds being kept in investment accounts longer than expected. 8: Variance below 10%, therefore insignificant. 9: Significant increase in the assistance from the District Municipality and inflation related Equitable share adjustment.
10: Increase due to the appointment of a traffic fines service provider which resulted in improved the collection of data of fines issued.. 11: Due to salary increase and increase in unplanned overtime.

229 | P a g e
12: Variance below 10%, therefore insignificant.

230 | P a g e
Notes to the Annual Financial Statements Figures in Rand 2018 2017
53. Budget differences (continued) 13: Due to the adoption of an amended FAR with significant changes to the values, useful lives and condition of all assets. 14: Due to increase in long outstanding debtors. 15: Interest on trade creditors, mainly interest on Eskom not considered on budgeted figure. 16: Due to change in classification due to introduction of mSCOA. 17: The budgeted figure for bulk purchases incorrectly included VAT and tariff increase applied on amount including VAT. 18: Variance below 10%, therefore insignificant. 19: Cost cutting measures applied due to municipality going through financial difficulty. 20: Actuarial gains and losses not budgeted for. 21: Inventories not correctly budgeted for by management. 22: Operating lease not correctly budgeted for by management. 23: Decrease due to a lower tarrif increase than expected. 24: Management anticipated that all refunds due to the municipality would be settled. 25: Management did not take into account the debt impairment on the budgeted figure. 26: Management did not anticipate to have unspent grants money at year end. 27: Investment property not correctly budgeted for by management. 28: Property, plant and property not correctly budgeted for by management. 29: Intangible assets not correctly budgeted for by management. 30: Heritage not correctly budgeted for by management.
31: Management incorrectly budget for trade creditors under the overdraft vote, this should have been budget as part of payables from exchange transactions. 32: Management had anticipated to reduce payable by making refunds during the year. 33: Short term portion of employee benefit obligations ‐ not budget for separately. 34: Unexpected delay in projects. 35: Management had anticipated that the funds would be repaid back.
36: Management incorrectly budget for trade creditors under the overdraft vote, this should have been budget as part of payables from exchange transactions. 37: Budgeted for as part of provisions. 38: Includes budget for employee benefits obligation.

231 | P a g e
5.1 STATEMENTS OF FINANCIAL PERFORMANCE

232 | P a g e
Grants Received From Sources Other Than Division of Revenue Act (DoRA) Details of Donor Actual
Grant Year ‐1
Actual Grant Year 0
Year 0Municipal
Contribution
Date Grant terminates
Date Municipal
contribution terminates
Nature and benefit from the
grant received, include description of
any contributions in
kind
Parastatals
A ‐ "Project 1" Information in the AFS
Information in the AFS
Information in the AFS
Information in the AFS
Information in the AFS
Information in the AFS
A ‐ "Project 2"
B ‐ "Project 1"
B ‐ "Project 2"
Foreign Governments/Development Aid Agencies
A ‐ "Project 1"
A ‐ "Project 2"
B ‐ "Project 1"
B ‐ "Project 2"
Private Sector / Organisations
A ‐ "Project 1"
A ‐ "Project 2"
B ‐ "Project 1"
B ‐ "Project 2"
Provide a comprehensive response to this schedule

233 | P a g e
5.2 ASSET MANAGEMENT
INTRODUCTION TO ASSET MANAGEMENT
The objectives of an asset management policy are:
• To ensure the effective and efficient control, utilization, safeguarding and management of a
municipality’s assets.
• To ensure staff is aware of their responsibilities in regards of assets.
• To set out the standards of physical management, recording and internal controls to ensure assets are
safeguarded.
• To specify the process required before expenditure on assets occurs..Explain how asset management is
organised, the staff involved and the key delegations.
This policy is applied with due observance of the Municipality’s policy with regard to delegated powers. Such
delegations refer to delegations between the Council and Municipal Manager as well as between the Municipal
Manager and other responsible officials. All delegations in terms of this policy document should be recorded in
writing.
T5.3.1
The information of the below table will be dealt with later after the audit of the Asset Register is completed:
TREATMENT OF THE THREE LARGEST ASSETS ACQUIRED 2017/2018
Asset 1
Name N/A
Description N/A
Asset Type N/A
Key Staff Involved
Staff Responsibilities
Asset Value 2014/2015 2015/2016 2016/2017 2017/2018
Capital Implications
Future Purpose of Asset
Describe Key Issues
Policies in Place to Manage Asset

234 | P a g e
Asset 2
Name
Description
Asset Type
Key Staff Involved
Staff Responsibilities
Asset Value 2014/2015 2015/2016 2016/2017 2017/2018
Capital Implications
Future Purpose of Asset
Describe Key Issues
Policies in Place to Manage Asset
Asset 3
Name
Description
Asset Type
Key Staff Involved
Staff Responsibilities
Asset Value 2014/2015 2015/2016 2016/2017 2017/2018
Capital Implications
Future Purpose of Asset
Describe Key Issues
Policies in Place to Manage Asset
T 5.3.2
COMMENTON ASSET MANAGEMENT: The asset management information is on the asset register.

235 | P a g e
Repair and Maintenance Expenditure: 2017/2018
R' 000
Information can be found in the audited AFS Original Budget Adjustment Budget Actual Budget
variance
Repairs and Maintenance Expenditure %
COMMENT ON REPAIR AND MAINTENANCE EXPENDITURE: Information on the above is in the audited AFS.
T5.3.4.1
5.4 FINANCIAL RATIOS BASED ON KEY PERFORMANCE INDICATORS To be updated with the data of the 2017-2018 AFS later
COMPONENT B: SPENDING AGAINST CAPITAL BUDGET
INTRODUCTION TO SPENDING AGAINST CAPITAL BUDGET
Information to be updated with the AFS later
T5.5.0
5.5 CAPITAL EXPENDITURE
T5.5.1

236 | P a g e
5.6 SOURCES OF FINANCE
Information to be updated with the AFS later
Capital Expenditure ‐ Funding Sources: 2016/2017 to 2017/2018 R' 000
Details
Year ‐1 Year 0
Actual Original Budget (OB)
Adjustment Budget
Actual Adjustment to OB Variance (%)
Actual to OB Variance (%)
Source of finance
External loans ‐ ‐ ‐ ‐ % %
Public contributions and donations
‐ ‐ ‐ ‐ % %
Grants and subsidies
% %
Other % %
Total % %
Percentage of finance
External loans % % % % % %
Public contributions and donations
% % % % % %
Grants and subsidies
% % % % % %
Other % % % % % %
Capital expenditure
Water and sanitation
% %
Electricity % %
Housing % %
Roads and storm water
% %
Other % %
Total % %
Percentage of expenditure
Water and sanitation
% % % % % %
Electricity % % % % % %
Housing % % % % % %
Roads and storm water
% % % % % %
Other % % % % % %
T 5.6.1

237 | P a g e
COMMENT ON SOURCES OF FUNDING:
Any variations from the approved budget of more than 10% and the total capital expenditure as a viable
proportion of total expenditure will be explained later with the 2017‐2018 AFS
5.7 CAPITAL SPENDING ON 5 LARGEST PROJECTS
Capital Expenditure of 5 largest projects* R' 000
Name of Project
Current: Year 2016‐2017 Variance: Current Year 2017‐
2018
Original Budget
Adjustment Budget
Actual Expenditure
Original Variance (%)
Adjustment variance (%)
A ‐ Name of Project % %
B ‐ Name of Project % %
C ‐ Name of Project % %
D ‐ Name of Project % %
E ‐ Name of Project % %
* Projects with the highest capital expenditure in Year 0
Name of Project ‐ A
Objective of Project
Delays
Future Challenges
Anticipated citizen benefits
Name of Project ‐ B
Objective of Project
Delays
Future Challenges
Anticipated citizen benefits
Name of Project ‐ C
Objective of Project
Delays
Future Challenges
Anticipated citizen benefits
Name of Project ‐ D
Objective of Project
Delays
Future Challenges
Anticipated citizen benefits
Name of Project ‐ E
Objective of Project
Delays
Future Challenges
Anticipated citizen benefits
T 5.7.1

238 | P a g e
COMMENT ON CAPITAL PROJECTS:
The information is in the audited AFS.
T5.7.1.1
5.8 BASIC SERVICE AND INFRASTRUCTURE BACKLOGS– OVERVIEW
INTRODUCTION TO BASIC SERVICE AND INFRASTRUCTURE BACKLOGS
To provided later.
T5.8.1
Service Backlogs as at 30 June Year 2018
Households (HHs)
Information/data to be provided later
*Service level above minimum standard
**Service level below minimum standard
No. HHs % HHs No. HHs % HHs
Water % %
Sanitation % %
Electricity % %
Waste management % %
Housing % %
% HHs are the service above/below minimum standard as a proportion of total HHs. 'Housing' refers to * formal and ** informal settlements. T 5.8.2

239 | P a g e
Information to be provided later after reconciliation have been done on the AFS
Municipal Infrastructure Grant (MIG)* Expenditure 2017/2018 on Service backlogs
R' 000
Details
Budget Adjustments Budget
Actual Variance Major conditions applied by donor
(continue below if
necessary)
Budget Adjust‐ments Budget
Infrastructure ‐ Road transport % %
Roads, Pavements & Bridges ‐ ‐ ‐ % %
Storm water ‐ ‐ ‐ % %
Infrastructure – Electricity % %
Generation ‐ ‐ ‐ % %
Transmission & Reticulation ‐ ‐ ‐ % %
Street Lighting ‐ ‐ ‐ % %
Infrastructure – Water % %
Dams & Reservoirs ‐ ‐ ‐ % %
Water purification ‐ ‐ ‐ % %
Reticulation ‐ ‐ ‐ % %
Infrastructure – Sanitation % %
Reticulation ‐ ‐ ‐ % %
Sewerage purification ‐ ‐ ‐ % %
Infrastructure – Other % %
Waste Management ‐ ‐ ‐ % %
Transportation ‐ ‐ ‐ % %
Gas ‐ ‐ ‐ % %
Other Specify:
% %
% %
% %
Total % %
* MIG is a government grant program designed to fund a reduction in service backlogs, mainly: Water; Sanitation; Roads; Electricity. Expenditure on new, upgraded and renewed infrastructure is set out at Appendix M; note also the calculation of the variation. Variances are calculated by dividing the difference between actual and original/adjustments budget by the actual. T 5.8.3

240 | P a g e
COMMENT ON BACKLOGS:
MIG grants expenditure updated will be provided later.
T5.8.4
COMPONENT C: CASH FLOW MANAGEMENT AND INVESTMENTS
INTRODUCTION TO CASH FLOW MANAGEMENT AND INVESTMENTS
Cash flow to be provided in the AFS
T5.9

241 | P a g e
5.9 CASH FLOW
Cash Flow Outcomes
R'000
Description
Year ‐2016/2017
Current: Year 201/2018
Audited Outcome
Original Budget
Adjusted Budget
Actual
CASH FLOW FROM OPERATING ACTIVITIES
Receipts
Ratepayers and other
Government – operating
Government – capital
Interest
Payments
Suppliers and employees
Finance charges
Transfers and Grants
NET CASH FROM/(USED) OPERATING ACTIVITIES
CASH FLOWS FROM INVESTING ACTIVITIES
Receipts
Proceeds on disposal of PPE
Payments
Capital assets
NET CASH FROM/(USED) INVESTING ACTIVITIES
CASH FLOWS FROM FINANCING ACTIVITIES
Receipts
Short term loans
Borrowing long term/refinancing
Payments
Repayment of borrowing
NET CASH FROM/(USED) FINANCING ACTIVITIES

242 | P a g e
NET INCREASE/ (DECREASE) IN CASH HELD ‐
Cash/cash equivalents at the year begin:
Cash/cash equivalents at the year‐end:
Source: MBRR A7 T
5.10 BORROWINGAND INVESTMENTS
INTRODUCTION TO BORROWING AND INVESTMENTS
The Magareng Local Municipality doesn’t have loans.T5.10.1
No borrowings for the 2017‐2018 Financial Year
Actual Borrowings: 2016/2017– 2017/2018
R' 000
Instrument 2015/2016 2016/2017 2017/2018
Municipality
Long‐Term Loans (annuity/reducing balance)
Long‐Term Loans (non‐annuity)
Local registered stock
Instalment Credit
Financial Leases
PPP liabilities
Finance Granted By Cap Equipment Supplier
Marketable Bonds
Non‐Marketable Bonds
Bankers Acceptances
Financial derivatives
Other Securities
Municipality Total
Municipal Entities
Long‐Term Loans (annuity/reducing balance)
Long‐Term Loans (non‐annuity)
Local registered stock
Instalment Credit
Financial Leases
PPP liabilities
Finance Granted By Cap Equipment Supplier
Marketable Bonds
Non‐Marketable Bonds
Bankers Acceptances
Financial derivatives

243 | P a g e
Other Securities
Entities Total 0 0 0
COMMENT ON BORROWING AND INVESTMENTS: Clarifying comments on the investmentsis in the AFS
5.11 PUBLIC PRIVATE PARTNERSHIPS
PUBLIC PRIVATE PARTNERSHIPS
No Public Private Partnership (PPP) arrangements have been entered into during the financial year under
review.

244 | P a g e
COMPONENT D: OTHER FINANCIAL MATTERS
5.12 SUPPLY CHAIN MANAGEMENT
SUPPLY CHAIN MANAGEMENT
The Supply Chain Management Unit of the municipality is fully functional. The municipality experienced issues
with the Supply Chain Manager who did not come to work for better part of 2017/2018. The municipality
appointed the Acting Supply Chain Manager.
The Supply Chain Committees (Bid Committees) are established and operational; however there are still non‐
compliance issues within the supply chain function. The Bid Committees need training to capacitate them. The
SCM Policy has been reviewed as part of the policy review process of the municipality and adopted in council in
2018/2019.
T5.12.1
5.13 GRAP COMPLIANCE
GRAP COMPLIANCE
GRAP is the acronym for Generally Recognized Accounting Practice and it provides the rules by which
municipalities are required to maintain their financial accounts. Successful GRAP compliance will ensure that
municipal accounts are comparable and more informative for the municipality. It will also ensure that the
municipality is more accountable to its citizens and other stakeholders. Information on GRAP compliance is
needed to enable National Treasury to assess the pace of progress and consider the implications.
The financial statements of the Magareng Local Municipality are GRAP compliant. This means that the
municipality’s financial information can be relied upon and can be used by the community and other financial
information users to analyse the financial affairs of the municipality. Magareng Local Municipality is therefore
more accountable to its citizens and other stakeholders.

245 | P a g e
CHAPTER 6 – AUDITOR GENERAL AUDIT FINDINGS
INTRODUCTION
Note: The Constitution S188 (1) (b) states that the functions of the Auditor‐General includes the auditing and
reporting on the accounts, financial statements and financial management of all municipalities. MSA section 45
states that the results of performance measurement… must be audited annually by the Auditor‐General.
COMPONENT A: AUDITOR‐GENERAL OPINION OF FINANCIAL STATEMENTS2017‐2018
6.1 AUDITOR GENERAL REPORTS 2017‐2018

246 | P a g e
COMPONENT B: AUDITOR-GENERAL OPINION YEAR- 2017-2018(CURRENT YEAR)
6.2 AUDITORGENERAL REPORT YEAR 2017-2018 The report was issued on the 30th November 2018
Status of audit report:Non-Compliance Issues Remedial Action Taken
T 6.2.1
Auditor-General Report on Financial Performance Year 0*
Note:* The report's status is supplied by the Auditor General and ranges from unqualified (at best); to unqualified with other matters specified; qualified; adverse; and disclaimed (at worse). This table will be completed prior to the publication of the Annual report but following the receipt of the Auditor- General Report on Financial Performance Year 0.

247 | P a g e
AUDITOR GENERAL REPORT ON THE FINANCIAL STATEMENTS:YEAR2017-2018 Auditor General’s report was issued on the 30 November 2018.
T6.2.3
COMMENTS ON AUDITOR-GENERAL’S OPINION YEAR 2017-2018: Magareng Local Municipality received Qualified Audit Opinion.
COMMENTS ON MFMA SECTION 71 RESPONSIBILITIES:
Section 71 of the MFMA requires municipalities to return a series of financial performance data to the National
Treasury at specified intervals throughout the year. The Chief Financial Officer states that these data sets have
been returned according to the reporting requirements.
Signed (Chief Financial Officer)………………………………………………………..... Dated
T
Status of audit report**:Non-Compliance Issues Remedial Action Taken
T 6.2.2
Auditor-General Report on Service Delivery Performance: Year 0*
* This table will be completed prior to the publication of the Annual report but following the receipt of the Auditor- General Report on Service Delivery Performance Year 0** Inclusion of "Status" depends on nature of AG's remarks on Performance Data.
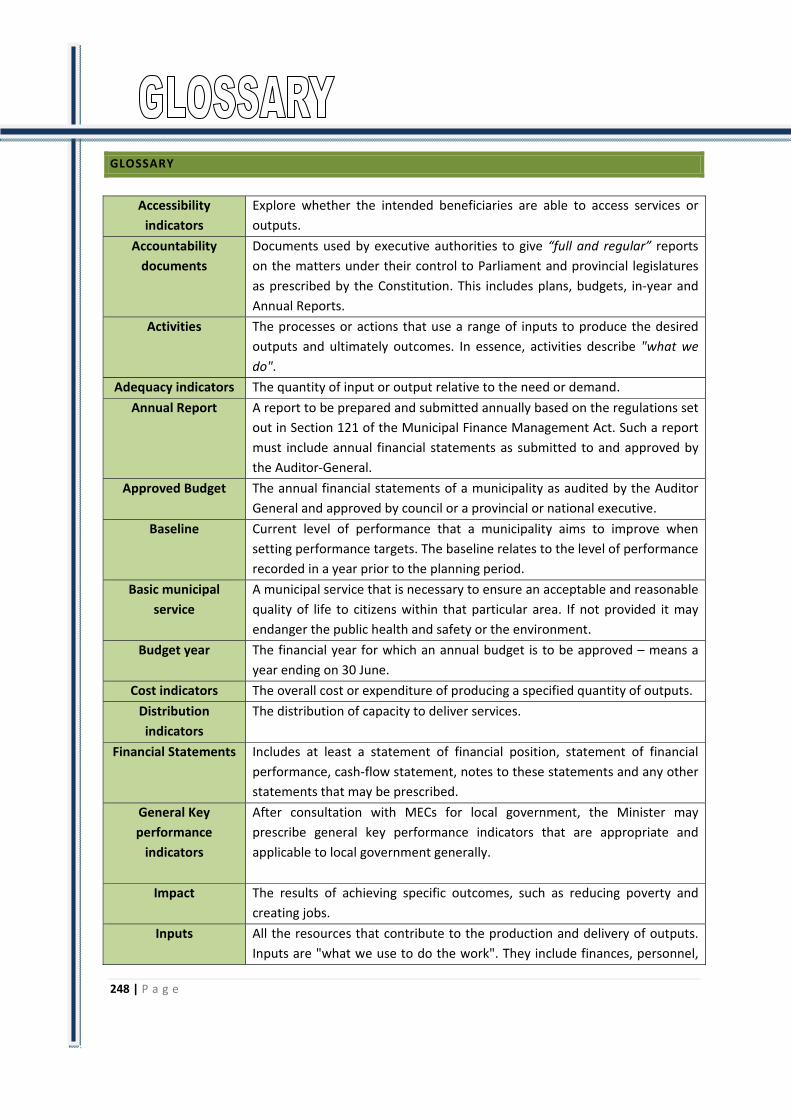
248 | P a g e
GLOSSARY
Accessibility
indicators
Explore whether the intended beneficiaries are able to access services or
outputs.
Accountability
documents
Documents used by executive authorities to give “full and regular” reports
on the matters under their control to Parliament and provincial legislatures
as prescribed by the Constitution. This includes plans, budgets, in‐year and
Annual Reports.
Activities The processes or actions that use a range of inputs to produce the desired
outputs and ultimately outcomes. In essence, activities describe "what we
do".
Adequacy indicators The quantity of input or output relative to the need or demand.
Annual Report A report to be prepared and submitted annually based on the regulations set
out in Section 121 of the Municipal Finance Management Act. Such a report
must include annual financial statements as submitted to and approved by
the Auditor‐General.
Approved Budget The annual financial statements of a municipality as audited by the Auditor
General and approved by council or a provincial or national executive.
Baseline Current level of performance that a municipality aims to improve when
setting performance targets. The baseline relates to the level of performance
recorded in a year prior to the planning period.
Basic municipal
service
A municipal service that is necessary to ensure an acceptable and reasonable
quality of life to citizens within that particular area. If not provided it may
endanger the public health and safety or the environment.
Budget year The financial year for which an annual budget is to be approved – means a
year ending on 30 June.
Cost indicators The overall cost or expenditure of producing a specified quantity of outputs.
Distribution
indicators
The distribution of capacity to deliver services.
Financial Statements Includes at least a statement of financial position, statement of financial
performance, cash‐flow statement, notes to these statements and any other
statements that may be prescribed.
General Key
performance
indicators
After consultation with MECs for local government, the Minister may
prescribe general key performance indicators that are appropriate and
applicable to local government generally.
Impact The results of achieving specific outcomes, such as reducing poverty and
creating jobs.
Inputs All the resources that contribute to the production and delivery of outputs.
Inputs are "what we use to do the work". They include finances, personnel,

249 | P a g e
equipment and buildings.
Integrated
Development Plan
(IDP)
Set out municipal goals and development plans.
National Key
performance areas
• Service delivery & infrastructure
• Economic development
• Municipal transformation and institutional development
• Financial viability and management
• Good governance and community participation
Outcomes The medium‐term results for specific beneficiaries that are the consequence
of achieving specific outputs. Outcomes should relate clearly to an
institution's strategic goals and objectives set out in its plans. Outcomes are
"what we wish to achieve".
Outputs The final products, or goods and services produced for delivery. Outputs may
be defined as "what we produce or deliver". An output is a concrete
achievement (i.e. a product such as a passport, an action such as a
presentation or immunization, or a service such as processing an application)
that contributes to the achievement of a Key Result Area.
Performance
Indicator
Indicators should be specified to measure performance in relation to input,
activities, outputs, outcomes and impacts. An indicator is a type of
information used to gauge the extent to
which an output has been achieved (policy developed, presentation
delivered, service rendered)
Performance
Information
Generic term for non‐financial information about municipal services and
activities. Can also be used interchangeably with performance measure.
Performance
Standards:
The minimum acceptable level of performance or the level of performance
that is generally accepted. Standards are informed by legislative
requirements and service‐level agreements. Performance standards are
mutually agreed criteria to describe how well work must be done in terms of
quantity and/or quality and timeliness, to clarify the outputs and related
activities of a job by describing what the required result should be. In this
EPMDS performance standards are divided into indicators and the time
factor.
Performance Targets: The level of performance that municipalities and its employees strive to
achieve. Performance Targets relate to current baselines and express a
specific level of performance that a municipality aims to achieve within a
given time period.

250 | P a g e
Service Delivery
Budget
Implementation Plan
Detailed plan approved by the mayor for implementing the municipality’s
delivery of services; including projections of the revenue collected and
operational and capital expenditure by vote for each month. Service delivery
targets and performance indicators must also be included.
Vote: One of the main segments into which a budget of a municipality is divided
for appropriation of money for the different departments or functional areas
of the municipality. The Vote specifies the total amount that is appropriated
for the purpose of a specific department or functional area.
Section 1 of the MFMA defines a “vote” as:
a) one of the main segments into which a budget of a municipality is divided
for the appropriation of money for the different departments or functional
areas of the municipality; and
b) which specifies the total amount that is appropriated for the purposes of
the department or functional area concerned

Magareng Local Municipality | APPENDICES 251
APPENDICES
APPENDIX A – COUNCILLORS; COMMITTEE ALLOCATION AND COUNCILATTENDANCE
Councillors, Committees Allocated and Council Attendance
Council Members Full Time / Part Time
Committees Allocated
*Ward and/ or Party Represented
Percentage Council Meetings Attendance
Percentage Apologies for non‐
attendance
FT/PT % %
B Mhaleni Full Time Mayor/Speaker ANC Proportional % 0%
T Mokola Part Time Chairperson: Corporate Services Committee
ANC Councilor Ward 1
% 0%
KG Freddie Part Time Chairperson: Technical Services Committee
ANC Councilor Ward 2
% %
M Tshekedi Part Time Chairperson; : Community Services
ANC Ward Councilor 3
% %
K Zalisa Part Time Chairperson ; Budget and Treasury
ANC Ward Councilor 3
% 0%
W Potgieter Part Time Chairperson; Community Services
DA Ward Councilor 5
%
0%
J Louw Part Time DA Proportional % %
S Pietersen Part Time Chairperson :Budget and Treasury
EFF Proportional % %
T Cross Part Time EFF Proportional %
%
Concerning TA
No Comment
TA.1

Magareng Local Municipality | APPENDICES 252
APPENDIX B – COMMITTEES ANDCOMMITTEE PURPOSES
Committees and Purposes of Committees
Municipal Committees Purpose of Committee
Corporate Services Considering reports from all Departments and thereafter refer them to the Portfolio Committees with recommendations.
Submitting inputs during budget preparation and monitor the implementation thereof
Participating in the process of policy development and reviewof IDP
Representing the employer in Local Labour forum
Taking decisions on delegated matters in terms of the Delegation Policy
Budget and Treasury Considering financial reports from Budget and Treasury Department and thereafter refer them to the BTO Portfolio Committee with recommendations.
Taking a lead in the preparation of the Annual Budget and monitoring the implementation thereof
Participating in the process of policy development and reviewof IDP
Taking decisions on delegated matters in terms of Delegation Policy
Technical Services Considering reports on different projects as indicated in the IDP from Engineering & Technical Services Department and thereafter refer them to the Technical Services ACommittee with recommendations.
Assisting Finance Portfolio Committee to compile annual projects budget and monitoring implementation thereof
Participating in the process of policy development and reviewof IDP
Taking decisions on delegated matters in terms of Delegation Policy
Community Services Considering reports on different projects as indicated in the IDP and Community Services Department and thereafter refer them to the Community Services Committee with recommendations.
Assisting Finance Portfolio Committee to compile annual projects budget and monitoring implementation thereof
Participating in the process of policy development and review of IDP
Taking decisions on delegated matters in terms of Delegation Policy
Health and Safety Committee
Is an oversight that evaluates and monitor the implementation of health and safety compliances in

Magareng Local Municipality | APPENDICES 253
the municipality
Training Committee Deals with skills development and training issues
Municipal Public Accounts Committee Exercise oversight over the executive functionaries of council and to ensure good governance in the municipality by interrogating amongst others the following financial aspects addressed in the Municipal Finance Management Act
Unforeseen and unavoidable expenditure (section29)
Unauthorised, irregular or fruitless and wasteful expenditure (section 32)
Analyse and investigate Section 52(d), 71,72, 124,126,127,129,131,and 166 reports and report to Council on their findings and recommendations
Audit Committee It is established to advise the municipal council, political office bearers, the accounting officer and management on matters relating to internal controls, financial controls, internal audits, performance management and review the financial statements before submission to external auditors and other matters as outlined in MFMA Act 56 off 2003, Section 166.
T B

Magareng Local Municipality | APPENDICES 254
APPENDIX C –THIRD TIER ADMINISTRATIVE STRUCTURE
Third Tier Structure
Directorate Director/Manager ‐ State title Name
Municipal Manager Acting Municipal Manager Ms Millicent Masuku
Corporate Services HOD: Corporate Services Ms DibuengLentsoe
Budget & Treasury Chief Financial Officer Ms MalebogoMotswaledi
Technical Services HOD: Technical Services Mr Leslie Mokoena
Community Services HOD : Community Services Vacant
Use as a spill‐over schedule if top 3 tiers cannot be accommodated in chapter 2 (T2.2.2).
T C

Magareng Local Municipality | APPENDICES 255
APPENDIX D – FUNCTIONS OF MUNICIPALITY / ENTITY
Municipal / Entity Functions
MUNICIPAL FUNCTIONS Function Applicable to Municipality (Yes / No)*
Function Applicable to Entity
(Yes / No)
Constitution Schedule 4, Part B functions: N/A Air pollution Yes Building regulations Yes Child care facilities No Electricity and gas reticulation Yes Firefighting services Yes Local tourism Yes Municipal airports No Municipal planning Yes Municipal health services no Municipal public transport Yes Municipal public works only in respect of the needs of municipalities in the
discharge of their responsibilities to administer functions specifically assigned to them under this Constitution or any other law
Yes
Pontoons, ferries, jetties, piers and harbours, excluding the regulation of international and national shipping and matters related thereto
No
Stormwater management systems in built-up areas Yes Trading regulations yes Water and sanitation services limited to potable water supply systems and
domestic waste-water and sewage disposal systems Yes
Beaches and amusement facilities No Billboards and the display of advertisements in public places No Cemeteries, funeral parlours and crematoria Yes Cleansing Yes Control of public nuisances Yes Control of undertakings that sell liquor to the public No Facilities for the accommodation, care and burial of animals Yes Fencing and fences Yes Licensing of dogs No Licensing and control of undertakings that sell food to the public Yes Local amenities Yes Local sport facilities Yes Markets Yes Municipal abattoirs Yes Municipal parks and recreation Yes Municipal roads Yes Noise pollution Yes Pounds No Public places Yes Refuse removal, refuse dumps and solid waste disposal Yes

Magareng Local Municipality | APPENDICES 256
Street trading Yes Street lighting Yes Traffic and parking Yes
* If municipality: indicate (yes or No); * If entity: Provide name of entity T D

Magareng Local Municipality | APPENDICES 257
APPENDIX G – RECOMMENDATIONS OF THE MUNICIPAL AUDIT COMMITTEE YEAR – 2017-2018
APPENDIX G1 – MUNICIPAL AUDIT COMMITTEE REPORT 2017-2018
MAGARENG LOCALMUNICIPALITY ANNUAL REPORT OF THE AUDIT AND PERFORMANCE COMMITTEE FOR THE FINANCIAL YEAR ENDED 30 JUNE
2018
Municipal Audit Committee Recommendations
Date of Committee
Committee recommendations during 2017/18
Recommendations adopted (enter Yes) If not adopted (provide explanation)
2017/08/28 (Review of the draft AFS)
The APRC advised management to re‐assess the going concern of the
municipality and adjust the paragraph.
No Property, Plant and Equipment
Delays in the WIP must be reassessed and properly disclosed.
Classes of assets must be separated as this will have impact on the auditors’
opinion.
Repairs and maintenance
This should not be a line item in the statement of financial performance.This
must be disclosed by class and by nature and management must consider
additional disclosure requirement to address the prior year error.
No
General Expenses (Note 26)
Management needs to consider the extent of the fruitless and
wastefulexpenditure to the bank charges disclosed.

Magareng Local Municipality | APPENDICES 258
Page 60: Employee related costs (Note 27)
There must be a support statement included under the municipal manager
which indicates the period served.
.
Page 62: Remuneration of councillors (Note 28)
The APRC recommended that there must be a support statement included
under both the current and the previous mayors.
The accounting policies be reviewed, and assurance be provided to the
adoption and implementation of these accounting policies.
The municipality must evaluate its current financial situation and establish a
plan on how they are going to survive as a municipality.
The financial recovery plan should be developed by the municipality.
Management was advised to disclose repairs and maintenance by class and
by nature to avoid any qualifications as well as consider additional
disclosure requirements in terms of prior period errors.
2017/11/23
To consider revising paragraph 6 that indicates inconsistencies on meters
read as estimates were not noted in some billings, and address the issue
throughout the report to reach reasonability of opinions.
No
AGSA to consider rephrasing paragraph 12 on VAT since the matter is
accepted countrywide, and to indicate that management did not perform
reconciliations.
Internal audit to ensure that there is alignment with the SDBIP, IDP and the
budget.
2018/02/16 The draft annual report of the municipality to be sent to the APRC prior to it

Magareng Local Municipality | APPENDICES 259
being taken to council and the community.
The municipality to communicate the right message to the public.
Municipality needs to revisit the audit action plan and include proper
remedial actions.
APRC cautioned the municipality to stop using the funds for conditional
grants on operational activities as this constitutes to unauthorized
expenditure.
Council be informed that there are still challenges with MSCOA.
Yes
APRC recommended that Internal Audit extend the scope of the MFMA
compliance audit.
2018/05/29
APRC takes note of Section 71 report and cannot place reliance on the
incomplete report and advised management to apply section 74; 171 and
173 of the MFMA.
No
APRC noted the summary of the trial balance and advised the municipality
to apply section 74 of the MFMA.
To check applicability of GRAP 110 on living and non‐living resources and
whether there is a likelihood of this in future.
2018/06/25
Meeting was declared not to be legally constituted and will be rescheduled.
Fruitless expenditure to be considered by Council for the absence of the
acting municipal manager and or a duly authorized representative from the
municipality.

Magareng Local Municipality | APPENDICES 260
APPENDIX H – LONG TERM CONTRACTS AND PUBLIC PRIVATE PARTNERSHIPS
Information to be detailed in the AFS
Name of Service Provider (Entity or Municipal Department)
Description of Services Rendered by the Service Provider
Start Date of Contract
Expiry date of Contract
Project manager Contract Value
T H.1
Long Term Contracts (20 Largest Contracts Entered into during Year 0)
R' 000
R' 000Name and Description of Project Name of Partner(s) Initiation Date Expiry date Project manager Value
2008/09
T H.2
Public Private Partnerships Entered into during Year 0

Magareng Local Municipality | APPENDICES
APPENDIX I –SERVICE PROVIDER PERFORMANCE SCHEDULE
Information to be indicated in the AFS
Name of Entity & Purpose (a) Service Indicators Year 2Target Actual Actual
*Previous Year *Previous Year *Current Year *Current Year *Current Year *Following Year(i) (ii) (iii) (iv) (v) (vi) (vii) (viii) (ix) (x)
T I
Note: This statement should include no more than the top four priority indicators. * 'Previous Year' refers to the targets that were set in the Year -1 Budget/IDP round; *'Current Year' refers to the targets set in the Year 0 Budget/IDP round. *'Following Year' refers to the targets set in the Year 1 Budget/IDP round. Note that all targets must be fundable within approved budget provision. In column (ii) set out the Service Indicator (In bold italics) then the Service Target underneath (not in bold - standard type face) to denote the difference.
(b) Service Targets
Municipal Entity/Service Provider Performance ScheduleYear 0 Year 1 Year 3
Target Target
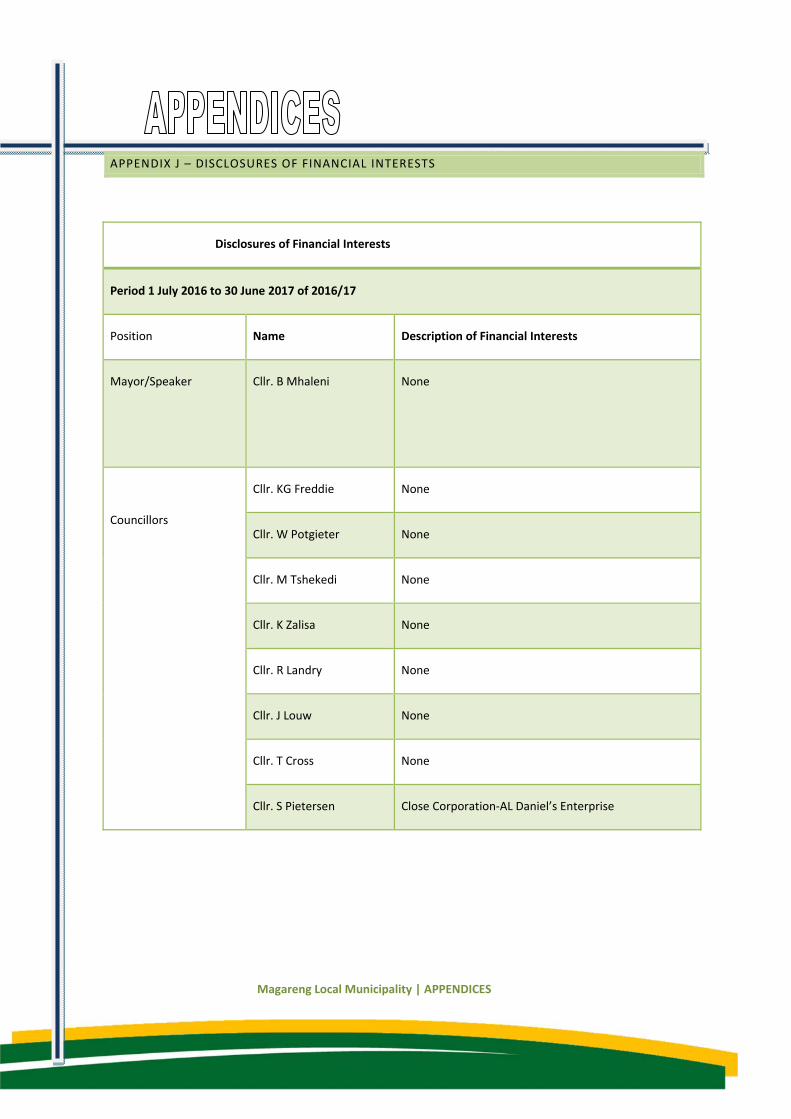
Magareng Local Municipality | APPENDICES
APPENDIX J – DISCLOSURES OF FINANCIAL INTERESTS
Disclosures of Financial Interests
Period 1 July 2016 to 30 June 2017 of 2016/17
Position Name Description of Financial Interests
Mayor/Speaker
Cllr. B Mhaleni
None
Councillors
Cllr. KG Freddie None
Cllr. W Potgieter None
Cllr. M Tshekedi None
Cllr. K Zalisa None
Cllr. R Landry None
Cllr. J Louw None
Cllr. T Cross None
Cllr. S Pietersen Close Corporation‐AL Daniel’s Enterprise

Magareng Local Municipality | APPENDICES 263
APPENDIX K: REVENUE COLLECTION PERFORMANCE BY VOTE AND BY SOURCE
Information to be indicated in the AFS
APPENDIX K (i): REVENUE COLLECTION PERFORMANCE BY VOTE
Information to be indicated in the AFS
R' 000
Year -1
Actual Original Budget
Adjusted Budget
Actual Original Budget
Adjustments Budget
Example 1 - Vote 1
Example 2 - Vote 2
Example 3 - Vote 3
Example 4 - Vote 4
Example 5 - Vote 5
Example 6 - Vote 6
Example 7 - Vote 7
Example 8 - Vote 8
Example 9 - Vote 9
Example 10 - Vote 10
Example 11 - Vote 11
Example 12 - Vote 12
Example 13 - Vote 13
Example 14 - Vote 14
Example 15 - Vote 15
Total Revenue by Vote – – – – – –
T K.1
Revenue Collection Performance by Vote
Current: Year 0 Year 0 Variance
Vote Description
Variances are calculated by dividing the difference between actual and original/adjustments budget by the actual. This table is aligned to MBRR table A3

Magareng Local Municipality | APPENDICES 264
APPENDIX K (ii): REVENUE COLLECTION PERFORMANCE BY SOURCE
Information to be indicated in the AFS
Year -1
Actual Original Budget
Adjustments Budget
Actual Original Budget
Adjustments Budget
Property rates 26,485 23,572 28,075 23,042 -2% -22%
Property rates - penalties & collection charges 8,541 8,285 9,054 8,456 2% -7%
Service Charges - electricity revenue 12,355 10,254 12,478 13,219 22% 6%
Service Charges - water revenue 14,232 13,235 13,662 12,097 -9% -13%
Service Charges - sanitation revenue 6,542 5,496 5,954 6,346 13% 6%
Service Charges - refuse revenue 1,865 1,622 1,865 1,510 -7% -23%
Service Charges - other 5,643 5,530 5,925 5,304 -4% -12%
Rentals of facilities and equipment 5,643 5,530 5,925 5,304 -4% -12%
Interest earned - external investments 5,322 4,470 5,747 4,630 3% -24%
Interest earned - outstanding debtors 8,455 8,455 8,624 9,554 12% 10%
Dividends received 1,254 1,003 1,191 1,354 26% 12%
Fines 2,516 2,063 2,264 2,340 12% 3%
Licences and permits 6,846 6,230 7,256 6,640 6% -9%
Agency services 12,546 10,413 11,793 11,542 10% -2%
Transfers recognised - operational 2,355 2,190 2,425 2,402 9% -1%
Other revenue 48,542 40,776 48,542 46,115 12% -5%
Gains on disposal of PPE 4,565 3,698 4,337 4,291 14% -1%
Enviromental Proctection 5,649 4,971 6,157 4,971 0% -24%
Total Revenue (excluding capital transfers and contributions)
179,353 157,791 181,274 169,118 6.70% -7.19%
T K.2Variances are calculated by dividing the difference between actual and original/adjustments budget by the actual. This table is aligned to MBRR table A4.
Revenue Collection Performance by SourceR '000
DescriptionYear 0 Year 0 Variance

Magareng Local Municipality | APPENDICES 265
APPENDIX L: CONDITIONAL GRANTS RECEIVED: EXCLUDING MIG
Information to be indicated in the AFS
COMMENT ON CONDITIONAL GRANTS EXCLUDING MIG: Additional information will be provided after the release of the AFS TL.1
Budget Adjustments Budget
Neighbourhood Development Partnership Grant
Public Transport Infrastructure and Systems Grant
Other Specify:
Total
T L
* This includes Neighbourhood Development Partnership Grant, Public Transport Infrastructure and Systems Grant and any other grant excluding Municipal Infrastructure Grant (MIG) which is dealt with in the main report, see T 5.8.3. Variances are calculated by dividing the difference between actual and original/adjustments budget by the actual. Obtain a list of grants from national and provincial government.
Conditional Grants: excluding MIGR' 000
Details
Budget Adjustments Budget
Actual Variance Major conditions applied by donor (continue below if necessary)

Magareng Local Municipality | APPENDICES 266
APPENDIX M: CAPITAL EXPENDITURE – NEW & UPGRADE/RENEWAL PROGRAMMES
Information to be indicated in the AFS
APPENDIX M (i): CAPITAL EXPENDITURE - NEW ASSETS PROGRAMME
Information is indicated in the AFS
Year -1
ActualOriginal Budget
Adjustment Budget
Actual Expenditure
FY + 1 FY + 2 FY + 3
Capital expenditure by Asset ClassInfrastructure - Total – – – – – –
Infrastructure: Road transport - Total – – – – – –
Roads, Pavements & BridgesStorm water
Infrastructure: Electricity - Total – – – – – –
GenerationTransmission & ReticulationStreet Lighting
Infrastructure: Water - Total – – – – – –
Dams & ReservoirsWater purificationReticulation
Infrastructure: Sanitation - Total – – – – – –
ReticulationSewerage purification
Infrastructure: Other - Total – – – – – –
Waste ManagementTransportationGasOther
Community - Total – – – – – –
Parks & gardensSportsfields & stadiaSwimming poolsCommunity hallsLibrariesRecreational facilitiesFire, safety & emergencySecurity and policingBusesClinicsMuseums & Art GalleriesCemeteriesSocial rental housingOther
Table continued next page
Year 0 Planned Capital expenditure
Capital Expenditure - New Assets Programme*
DescriptionR '000

Magareng Local Municipality | APPENDICES 267
Table continued from previous page
Year -1
ActualOriginal Budget
Adjustment Budget
Actual Expenditure
FY + 1 FY + 2 FY + 3
Capital expenditure by Asset ClassHeritage assets - Total – – – – – –
BuildingsOther
Investment properties - Total – – – – – –
Housing developmentOther
Other assets – – – – – –
General vehiclesSpecialised vehiclesPlant & equipmentComputers - hardware/equipmentFurniture and other office equipmentAbattoirsMarketsCivic Land and BuildingsOther BuildingsOther LandSurplus Assets - (Investment or Inventory)Other
Agricultural assets – – – – – –
List sub-class
Biological assets – – – – – –
List sub-class
Intangibles – – – – – –
Computers - software & programmingOther (list sub-class)
Total Capital Expenditure on new assets – – – – – –
Specialised vehicles – – – – – –
RefuseFireConservancyAmbulances
T M.1* Note: Information for this table may be sourced from MBRR (2009: Table SA34a)
Capital Expenditure - New Assets Programme*
Year 0 Planned Capital expenditureDescription
R '000

Magareng Local Municipality | APPENDICES 268
APPENDIX M (ii): CAPITAL EXPENDITURE – UPGRADE/RENEWAL PROGRAMME
Information to be indicated in the AFS
Year -1
ActualOriginal Budget
Adjustment Budget
Actual Expenditure
FY + 1 FY + 2 FY + 3
Capital expenditure by Asset ClassInfrastructure - Total – – – – – –
Infrastructure: Road transport -Total – – – – – –
Roads, Pavements & BridgesStorm water
Infrastructure: Electricity - Total – – – – – –
GenerationTransmission & ReticulationStreet Lighting
Infrastructure: Water - Total – – – – – –
Dams & ReservoirsWater purificationReticulation
Infrastructure: Sanitation - Total – – – – – –
ReticulationSewerage purification
Infrastructure: Other - Total – – – – – –
Waste ManagementTransportationGasOther
Community – – – – – –
Parks & gardensSportsfields & stadiaSwimming poolsCommunity hallsLibrariesRecreational facilitiesFire, safety & emergencySecurity and policingBusesClinicsMuseums & Art GalleriesCemeteriesSocial rental housingOther
Heritage assets – – – – – –
BuildingsOther
Table continued next page
Capital Expenditure - Upgrade/Renewal Programme*
Year 0 Planned Capital expenditureDescription
R '000

Magareng Local Municipality | APPENDICES 269
Table continued from previous page
Year -1
ActualOriginal Budget
Adjustment Budget
Actual Expenditure
FY + 1 FY + 2 FY + 3
Capital expenditure by Asset ClassInvestment properties – – – – – –
Housing developmentOther
Other assets – – – – – –
General vehiclesSpecialised vehiclesPlant & equipmentComputers - hardware/equipmentFurniture and other office equipmentAbattoirsMarketsCivic Land and BuildingsOther BuildingsOther LandSurplus Assets - (Investment or Inventory)Other
Agricultural assets – – – – – –
List sub-class
Biological assets – – – – – –
List sub-class
Intangibles – – – – – –
Computers - software & programmingOther (list sub-class)
Total Capital Expenditure on renewal of existing assets – – – – – –
Specialised vehicles – – – – – –
RefuseFireConservancyAmbulances
T M.2* Note: Information for this table may be sourced from MBRR (2009: Table SA34b)
Capital Expenditure - Upgrade/Renewal Programme*
Year 0 Planned Capital expenditureDescription
R '000

Magareng Local Municipality | APPENDICES 270
APPENDIX N – CAPITAL PROGRAMME BY PROJECT YEAR 2017-2018
Information to be indicated in the AFS

Magareng Local Municipality | APPENDICES 271
APPENDIX O – CAPITAL PROGRAMME BY PROJECT BY WARDYEAR 2017-2017
Information is indicated in the AFS
Capital Project Ward(s) affected Works completed (Yes/No)
Water
"Project A"
"Project B"
Sanitation/Sewerage
Electricity
Housing
Refuse removal
Stormwater
Economic development
Sports, Arts & Culture
Environment
Health
Safety and Security
ICT and Other
Capital Programme by Project by Ward: Year 0
T O
R' 000

Magareng Local Municipality | APPENDICES 272
All Organisation or Person in receipt of Loans */Grants* provided by the
municipality
Nature of project Conditions attached to funding
Value Year 0 R' 000
Total Amount committed over
previous and future years
T R
Declaration of Loans and Grants made by the municipality: Year 0
* Loans/Grants - whether in cash or in kind
APPENDIX R – DECLARATION OF LOANS AND GRANTS MADE BY THE MUNICIPALITY
Information is indicated in the AFS

Magareng Local Municipality | APPENDICES
VOLUME II: ANNUAL FINANCIAL STATEMENTS
The completed and audited AFS are on page 101-229 of the 2017-2018Annual Report.