DRAFT ANNUAL BUDGET OF Knysna Municipality annual budget of ... 1.12 measurable performance...
78
29 March 2018 DRAFT ANNUAL BUDGET OF Knysna Municipality 2018/19 TO 2020/21 MEDIUM TERM REVENUE AND EXPENDITURE FORECASTS Copies of this document can be viewed: In the foyers of all municipal buildings All public libraries within the municipality At www.knysna.gov.za
Transcript of DRAFT ANNUAL BUDGET OF Knysna Municipality annual budget of ... 1.12 measurable performance...

29 March 2018
DRAFT ANNUAL BUDGET OF
Knysna Municipality
2018/19 TO 2020/21
MEDIUM TERM REVENUE AND
EXPENDITURE FORECASTS
Copies of this document can be viewed:
In the foyers of all municipal buildings
All public libraries within the municipality
At www.knysna.gov.za

Knysna Municipality 2018/19 Draft Annual Budget and MTREF
March 2018 i
Table of Contents
PART 1 – ANNUAL BUDGET ...................................................................................................................... 2
1.1 MAYOR’S REPORT ....................................................................................................................................... 2
1.2 DRAFT COUNCIL RESOLUTIONS .................................................................................................................. 2
1.3 EXECUTIVE SUMMARY ................................................................................................................................. 3
1.4 STAKEHOLDERS ENGAGEMENT ................................................................................................................... 5
1.5 CHALLENGES, ECONOMIC OUTLOOK, BUDGET PROCESS, FUNDING CHOICES ........................................... 5
1.6 OPERATING REVENUE FRAMEWORK ........................................................................................................... 8
1.7 OPERATING EXPENDITURE FRAMEWORK .................................................................................................. 21
1.8 CAPITAL EXPENDITURE .............................................................................................................................. 27
1.9 ANNUAL BUDGET TABLES – MUNICIPALITY ............................................................................................... 28
PART 2 – SUPPORTING DOCUMENTATION ...................................................................................... 49
1.10 OVERVIEW OF THE ANNUAL BUDGET PROCESS ......................................................................................... 49
1.11 OVERVIEW OF ALIGNMENT OF ANNUAL BUDGET WITH IDP ....................................................................... 50
1.12 MEASURABLE PERFORMANCE OBJECTIVES AND INDICATORS ................................................................... 56
1.13 OVERVIEW OF BUDGET RELATED-POLICIES ............................................................................................... 66
1.14 OVERVIEW OF BUDGET ASSUMPTIONS ...................................................................................................... 67
1.15 OVERVIEW OF BUDGET FUNDING ............................................................................................................... 68
1.16 CONTRACTS HAVING FUTURE BUDGETARY IMPLICATIONS ........................................................................ 73
1.17 LEGISLATION COMPLIANCE STATUS ........................................................................................................... 74
1.18 MUNICIPAL MANAGER’S QUALITY CERTIFICATE ......................................................................................... 75
List of Tables
Table 1 Consolidated Overview of the 2018/19 MTREF .............................................................................. 8
Table 2 Summary of revenue classified by main revenue source .............................................................. 10
Table 3 Percentage growth in revenue by main revenue source .............................................................. 11
Table 4 Operating Transfers and Grant Receipts ........................................................................................ 12
Table 5 Comparison of proposed Rate in a Rand of 2017/2018 to levied for 2018/19 ............................. 14
Table 6 Proposed Water Tariffs ................................................................................................................. 15
Table 7 Comparison between current sanitation charges and increases with other Municipalities in the
Garden Route .............................................................................................................................................. 17
Table 8 Repairs and maintenance per asset class ...................................................................................... 25
Table 9 2018/19 Medium-term capital budget per vote ........................................................................... 27
Table 10 MBRR Table A1 - Budget Summary ............................................................................................. 29
Table 11 MBRR Table A2 - Budgeted Financial Performance (revenue and expenditure by Municipal vote
classification)............................................................................................................................................... 31
Table 12 MBRR Table A3 - Budgeted Financial Performance (revenue and expenditure by municipal
vote) ............................................................................................................................................................ 33
Table 13 MBRR Table A4 - Budgeted Financial Performance (revenue and expenditure) ........................ 34

Knysna Municipality 2018/19 Draft Annual Budget and MTREF
ii
Table 14 MBRR Table A5 - Budgeted Capital Expenditure by vote, standard classification and funding
source .......................................................................................................................................................... 37
Table 15 MBRR Table A6 - Budgeted Financial Position ............................................................................ 39
Table 16 MBRR Table A7 - Budgeted Cash Flow Statement ...................................................................... 41
Table 17 MBRR Table A8 - Cash Backed Reserves/Accumulated Surplus Reconciliation .......................... 42
Table 18 MBRR Table A9 - Asset Management.......................................................................................... 43
Table 19 MBRR Table A10 - Basic Service Delivery Measurement ............................................................ 47
Table 20 IDP Strategic Objectives reconciled to revenue .......................................................................... 52
Table 21 IDP Strategic Objectives reconciled to expenditure ..................................................................... 53
Table 22 MBRR Table SA6 - Reconciliation between the IDP strategic objectives and budgeted capital
expenditure ................................................................................................................................................. 56
Table 23 MBRR Table SA7 - Measurable performance objectives ............................................................. 58
Table 24 MBRR Table SA8 - Performance indicators and benchmarks...................................................... 63
Table 25 MBRR SA15 – Detail Investment Information ............................................................................. 71
Table 26 Sources of capital revenue over the MTREF ............................................................................... 71
Table 27 MBRR Table SA 17 - Detail of borrowings ................................................................................... 73
List of Figures
Figure 1 Same bricks but different builders and architects .......................................................................... 4
Figure 2 Major sources of revenue for the 2018/2019 financial year ........................................................ 11
Figure 3 Summary of the proposed tariffs .................................................................................................. 15
Figure 4 Main expenditure categories for the 2018/19 financial year ....................................................... 24
Figure 5 Capital Infrastructure Program ..................................................................................................... 28
Figure 6 Revenue by source ........................................................................................................................ 35
Figure 7 Expenditure by type ..................................................................................................................... 36
Figure 8 Planning, budgeting and reporting cycle ..................................................................................... 57
Figure 9 Breakdown of operating revenue over the 2018/19 MTREF ....................................................... 70
Figure 10 Sources of capital revenue for the 2018/19 financial year ........................................................ 72
Annexures
Annexure A - Draft Rates, Tariffs and fees for 2018/2019
Annexure B - Policies for revision

Knysna Municipality 2018/19 Draft Annual Budget and MTREF
iii
Abbreviations and Acronyms
AMR Automated Meter Reading ASGISA Accelerated and Shared Growth
Initiative BPC Budget Planning Committee CBD Central Business District CFO Chief Financial Officer CM City Manager CPI Consumer Price Index CRRF Capital Replacement Reserve Fund DBSA Development Bank of South Africa DoRA Division of Revenue Act DWA Department of Water Affairs EE Employment Equity EEDSM Energy Efficiency Demand Side
Management EM Executive Mayor FBS Free basic services GAMAP Generally Accepted Municipal
Accounting Practice GDP Gross domestic product GDS Gauteng Growth and Development
Strategy GFS Government Financial Statistics GRAP General Recognised Accounting
Practice HR Human Resources HSRC Human Science Research Council IDP Integrated Development Strategy IT Information Technology kℓ kilolitre km kilometre KPA Key Performance Area KPI Key Performance Indicator kWh kilowatt ℓ litre
LED Local Economic Development MEC Member of the Executive Committee MFMA Municipal Financial Management Act
Programme MIG Municipal Infrastructure Grant MMC Member of Mayoral Committee MPRA Municipal Properties Rates Act MSA Municipal Systems Act MTEF Medium-term Expenditure
Framework MTREF Medium-term Revenue and
Expenditure Framework NDP National Development Plan NERSA National Electricity Regulator South
Africa NGO Non-Governmental organisations NKPIs National Key Performance Indicators OHS Occupational Health and Safety OP Operational Plan PBO Public Benefit Organisations PHC Provincial Health Care PMS Performance Management System PPE Property Plant and Equipment PPP Public Private Partnership PTIS Public Transport Infrastructure
System RG Restructuring Grant RSC Regional Services Council SALGA South African Local Government
Association SAPS South African Police Service SDBIP Service Delivery Budget
Implementation Plan SMME Small Micro and Medium Enterprises
Knysna Municipality 2018/19 Draft Annual Budget and MTREF
29 March 2018 2
Part 1 – Annual Budget
1.1 Mayor’s Report
To be included with final draft budget when tabled in Council meeting to be held in May 2018.
1.2 Draft Council Resolutions
1. The Council of Knysna Local Municipality, acting in terms of section 24 of the Municipal
Finance Management Act, (Act 56 of 2003) approves for consultation 1.1. The annual budget of the municipality for the financial year 2018/19 and the multi-year
and single-year capital appropriations as set out in the following tables: 1.1.1. Budgeted Financial Performance (revenue and expenditure by standard
classification) as contained in Table 11 on page 30 (MBRR Table A2); 1.1.2. Budgeted Financial Performance (revenue and expenditure by municipal vote) as
contained in Table 12 on page 32 (MBRR Table A3); 1.1.3. Budgeted Financial Performance (revenue by source and expenditure by type) as
contained in Table 13 on page 33 (MBRR Table A4); and 1.1.4. Multi-year and single-year capital appropriations by municipal vote and standard
classification and associated funding by source as contained in Table 14 on page 36 (MBRR Table A5).
1.2. The financial position, cash flow budget, cash-backed reserve/accumulated surplus,
asset management and basic service delivery targets are approved for consultation as set out in the following tables:
1.2.1. Budgeted Financial Position as contained in Table 15 on page 38 (MBRR Table A6);
1.2.2. Budgeted Cash Flows as contained in Table 16 on page 40 (MBRR Table A7); 1.2.3. Cash backed reserves and accumulated surplus reconciliation as contained in
Table 17 on page 41 (MBRR Table A8); 1.2.4. Asset management as contained in Table 18 on page 42 (MBRR Table A9); and 1.2.5. Basic service delivery measurement as contained in Table 19 on page 46 (MBRR
Table A10).
2. The Council of Knysna Local Municipality, acting in terms of section 75A of the Local Government: Municipal Systems Act (Act 32 of 2000) approves for consultation with effect from 1 July 2018; the tariffs for property rates, the tariffs for electricity, the tariffs for the supply of water, the tariffs for sanitation services, the tariffs for solid waste services as set out in Annexure 4:
3. The Council of Knysna Local Municipality, acting in terms of 75A of the Local Government: Municipal Systems Act (Act 32 of 2000) approves for consultation with effect from 1 July 2018 the tariffs and fees for other services, as set out in Annexure 4.
4. To give proper effect to the municipality’s annual budget, the Council of Knysna Local Municipality approves: 4.1. That cash backing be implemented through the utilisation of a portion of the realisable
accumulated surplus as at the end of the financial year to ensure that all capital reserves and provisions, unspent long-term loans and unspent conditional grants are cash backed as required in terms of the municipality’s funding and reserves policy as prescribed by section 8 of the Municipal Budget and Reporting Regulations.

Knysna Municipality 2018/19 Draft Annual Budget and MTREF
29 March 2018 3
4.2. That the municipality be permitted to enter into long-term loans for the funding of the capital programmes in respect of the 2018/19 financial year limited to an amount of R 60 Million per financial year for 2018/19 and 2019/20 in terms of Section 46 of the Municipal Finance Management Act.
4.3. That the Municipal Manager be authorised to sign all necessary agreements and documents to give effect to the above lending programme.
1.3 Executive Summary
Managing a Municipality in an unstable, politically charged environment with high level of inequalities after more than 22 years of democracy is a highly complex task, and has an impact on organizational leadership, strategies and organizational architecture (building blocks). Among the reason for heightened complexity are; staff turnover at senior management level, the inclination towards strategic flexibility to accommodate change, the emergence of networked community groups and the concern for sustainability and organizational culture. More than before it is vital that Knysna leadership think strategically as to how the objectives will be achieved and what it means to be sustainable in the current context of economic downturn, most importantly how will leadership contribute towards strategic development, change and transformation. In the context of Knysna Municipality this contribution towards strategic development and transformation includes, amongst others;
Empowering previously disadvantage communities and involving them in the formal economy,
Ensure integrated human settlement
Be a responsible Municipality that subscribe to the values of King IV. When thinking strategically about Knysna Municipality, current situation and future prospects in an environment where demand outstrips the supply, management is faced with four critical questions:
Where are we now?
Where do we want to go?
How will we get there?
How are we doing in trying to get there? To answer the first question management should consider the following in the Municipality;
Competitive advantage of the greater Knysna,
The standard and quality of Municipal infrastructure,
Resources and dynamics,
The extent to which the Municipality meets the needs and expectations of its customers and stakeholders,
Environmental integrity,
Current performance. The second question refers to the strategic direction that Leadership believes the Municipality should adopt. To answer the third question will depend on, how the strategy is formulated at different levels of the organization and whether the strategy formulation was based on customer needs, stakeholder’s expectations, integration with environment and ethical perspectives. The influence of leadership, organizational values, organizational culture and organizational architectures on strategy implementation.

Knysna Municipality 2018/19 Draft Annual Budget and MTREF
29 March 2018 4
Finally, to answer the last question requires that strategic leaders manage the performance of the Municipality by means of strategic control measures and appropriate feedback. An Integrated Development Plan (IDP) is a plan for the Municipal area, that gives an overall framework for development. It aims to co-ordinate the work of local and other spheres of government in a coherent plan to improve the quality of life for all the people living in an area. It should take into account the existing conditions and problems and resources available for development. The plan should look at economic and social development for the area as a whole. It must set a framework for how land should be used, what infrastructure and services are needed and how the environment should be protected. Strategic management can be defined as a set of decisions and actions that result in the formulation and implementation of plans designed to achieve an organisation’s goals (Pearce & Robinson, 2009:3). In a similar way Municipal IDP is built on the evolution of various community needs, ideas and functionalities – which we collect from the IDP public engagements with our communities and specific stakeholders. Knysna Municipal IDP can be viewed as the direction and scope of the Municipality over the long term, which achieve service delivery for the Municipality through its configuration of resources within a changing environment and to fulfill stakeholder’s expectations. If we are to be good strategic management leaders, we need to understand the various perspectives and thoughts of our communities. If we do not understand or have a sound knowledge of the evolution of our community needs, our knowledge and understanding of Municipal IDP, and our ability to apply and respond to, will be limited. It is also important to understand from the very beginning that the IDP building blocks are similar to the bricks used to build with a building. The shape of the final building is determined by the architectural design or plan, as well as by the workmanship of the builder. Although, two different buildings may not be similar in any way, they may still use the same bricks. The same applies to the IDP: the building blocks could take different forms given different contexts. Understanding the essence of each block therefore facilitates its application.
Figure 1 Same bricks but different builders and architects
Knysna Municipality 2018/19 Draft Annual Budget and MTREF
29 March 2018 5
1.4 Stakeholders Engagement
Louw and Venter (2013) highlight the importance of considering stakeholders in strategic decisions. This is especially important in the Knysna context. It is important that Knysna Municipality identify its key stakeholders and explicitly state its key responsibilities towards them by asking: How do we view our responsibilities to employees, communities, the environment, social issues? (Louw & Venter, 2013:89). These responsibilities should be taken into consideration in the vision and mission formulation process. If Knysna municipality directly addresses its stakeholders, it will ensure that the Municipality earns their support. The Municipality is accountable to a broad range of stakeholders, that include ward committees, rates payer’s associations, unions and employees, who can make it either more difficult or easier to execute a strategy. Knysna Municipality is not separate from society, and the success of the Municipality is inextricably linked to the wellbeing of the wider community. This is the main reason why Council must consider stakeholders’ interests, needs and preferences. The concept of stakeholders is a fundamental element of the King reports on corporate governance in South Africa, and Louw and Venter (2013) illustrate how this concept relates to both corporate governance and corporate citizenship. After all, Corporate governance is also about the responsible leadership that is transparent, answerable and accountable towards the Municipality identified stakeholders (Naidoo, 2002:2). The power and influence of stakeholders over strategic decisions is an important consideration for Council. Power can take the form of formal voting power, economic power (suppliers, rate payers), or political power (unions, political action groups and governmental bodies). Khoza and Adam (2005:45) state that any organization is the sum of its stakeholders. While all have a common interest in the organization’s success, stakeholders have different perspectives on the organization, each looking to take something different out of it. All stakeholders have an ability to influence that success. It is not easy, and sometimes not practical, to engage with stakeholders because their claims and expectations may be conflicting. Thus, it is important for Council to strike a balance between conflicting stakeholder interests which on its own is a fundamental challenge and require strategic Leadership. The strategic direction should be communicated to all the stakeholders both inside and outside the organisation. Inclusivity of stakeholders is essential to achieving sustainability and the legitimate interests and expectations of stakeholders must be taken into account in decision-making and strategy.
1.5 Challenges, Economic outlook, Budget process, Funding choices The application of sound financial management principles for the compilation of Knysna Municipality’s strategic plan is essential and critical to ensure that Knysna Municipality remains financially viable and that municipal services are provided sustainably, economically and equitably to all communities. Knysna Municipality’s business and service delivery priorities were reviewed as part of this year’s planning and budgeting process. Where appropriate, funds were transferred to address crucial service delivery needs and to ensure compliance with legislative requirements and to meet service delivery obligations. The February 2018 adjustment budget is reflective of this principle and supports the municipality’s quest for financial sustainability. Knysna Municipality has embarked on implementing a range of revenue collection strategies to optimize the collection of debt owed by consumers and to ensure that all revenue due is billed

Knysna Municipality 2018/19 Draft Annual Budget and MTREF
29 March 2018 6
and collected. Furthermore, Knysna Municipality will undertake various customer care initiatives to ensure the municipality truly involves all citizens in the process of ensuring true community participation. National Treasury’s MFMA Circular No. 89 and 91 were used to guide the compilation of the 2018/19 MTREF. The main challenges experienced during the compilation of the 2018/19 MTREF can be summarized as follows:
• Compliance with mSCOA requirements • Political instability • Turnover rate at senior management positions • The slow recovery from the economic downturn that is still hampering economic growth
and development not only locally but provincially and nationally. • Limited available own funding to fund much needed infrastructure. • Population growth placing a strain on infrastructure and housing needs. • Ageing and poorly maintained water, roads and electricity infrastructure; • The increased cost of bulk electricity as a result of continued annual increases which is
placing upward pressure on service tariffs to residents. • Wage increases for municipal staff that continue to exceed consumer inflation, as well as
the need to fill critical vacancies; • Availability of affordable capital/borrowing. The South African economy and inflation targets
The GDP growth rate is forecasted at 1.5 per cent in 2018, 1.8 per cent in 2019 and 2.1 per cent in 2020. Statistics South Africa’s December 2017 economic statistics showed an unexpected improvement in the economic outlook, largely as a result of growth in agriculture and mining.
The main risks to the economic outlook are continued policy uncertainty and deterioration in the finances of state-owned entities.
CPI inflation has been estimated at 5.3 per cent for 2017/18 and 2018/19 respectively and forecasted to increase to 5.4 per cent for 2019/20 and 5.5 per cent for 2020/21.
The current water crisis in the Knysna, Western Cape and other provinces will have a severe effect on economic growth. As such, the Western Cape growth is estimated to increase to 0.7 per cent in 2017, contracts by 0.3 per cent in 2018 and increases by 2.8 per cent in 2019 - The contraction in 2018 is largely due to the short-term impact of the drought on the agricultural sector.
Key focus areas for the 2018/19 Budget process
The 2017 Medium Term Budget Policy Statement (MTBPS) indicates that reprioritisation and reductions undertaken have affected planned spending for 2018/19.
A total of R13.9 billion has been cut from direct local government grant allocations for the 2018 Medium Term Expenditure Framework (MTEF) period since the 2017 MTBPS was tabled. Indirect Grants to local government have been reduced by an additional R2.2 billion.
The reductions did not affect all conditional grants and not all grants were reduced by the same percentage. The large infrastructure conditional grants were the ones that were affected as this was considered the most practical approach.
Knysna Municipality 2018/19 Draft Annual Budget and MTREF
29 March 2018 7
The overall impact of reducing this funding affects capital programmes, thus local government’s share of the reductions is higher than their share of the division of revenue, given that municipalities receive a number of infrastructure grants. The average reductions over the medium term are 3.5 per cent of local government allocations. Thus, it is imperative that municipalities understand and comply with the conditions stipulated in the Division of Revenue Act (DoRA) in order to access the funding.
The equitable share and the sharing of the general fuel levy constitute additional unconditional funding, of which the equitable share is designed to fund the provision of free basic services to disadvantaged communities.
The total value of conditional grants directly transferred to local government increases from R43.3 billion in 2018/19 to R44.8 billion in 2019/20 and R47.8 billion in 2020/21.
Large municipalities are expected to invest more of their own resources, offsetting some of the impact of reductions to infrastructure grants, while building partnerships with the private sector for infrastructure delivery over the period ahead.
The 2018 Budget provides for R382.8 billion to be transferred directly to local government and a further R21.8 billion allocated to indirect grants for the 2018 MTREF. National Government will provide financial assistance to areas that have been affected by drought to ensure that basic needs are met.
Schedule A - version to be used for the 2018/19 MTREF
National Treasury has released Version 6.2 of Schedule A1(Excel Formats) which is aligned to version 6.2 of the mSCOA classification framework. This version must be used by ALL municipalities when compiling their 2018/19 MTREF budget.
Municipalities must prepare their 2018/19 MTREF budgets in their mSCOA financial systems and that the A1 schedule be produced directly from their financial systems.
The following budget principles and guidelines directly informed the compilation of the 2018/19 MTREF: • The 2017/18 Adjustments Budget priorities and targets, as well as the base line allocations
contained in that Adjustments Budget were adopted as the upper limits for the new baselines for the 2018/19 annual budget; where appropriate a zero base approached has been used.
• Tariff and property rate increases should be affordable and should generally not exceed inflation as measured by the CPI, except where there are price increases in the inputs of services that are beyond the control of the municipality, for instance the cost of bulk electricity, the draught situation, compliance with environmental regulations and the continued escalation of staff cost. In addition, tariffs need to remain or move towards being cost reflective, and should take into account the need to address infrastructure backlogs;
• In saying the above it was critical that for the first time in many years that cost reflective tariffs and tariffs modeling, was to be performed.
• The increases were looked at in terms of the total basket of providing total services and not in isolation.
• The tabled draft budget had to be balanced and funded. • Implementation of circular 82 and the regulations dealing with cost containment measures. In view of the aforementioned, the following table is a consolidated overview of the proposed 2018/19 Medium-term Revenue and Expenditure Framework:
Knysna Municipality 2018/19 Draft Annual Budget and MTREF
29 March 2018 8
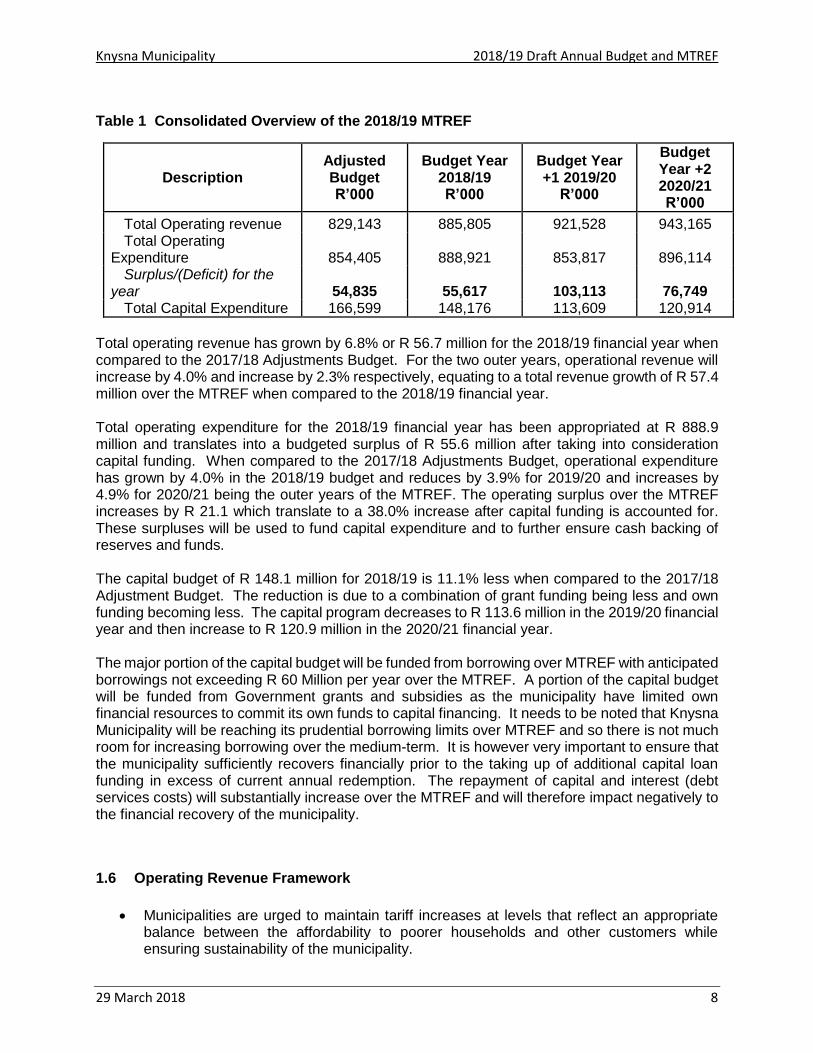
Table 1 Consolidated Overview of the 2018/19 MTREF
Description Adjusted Budget R’000
Budget Year 2018/19 R’000
Budget Year +1 2019/20
R’000
Budget Year +2 2020/21 R’000
Total Operating revenue 829,143 885,805 921,528 943,165 Total Operating
Expenditure 854,405 888,921 853,817 896,114 Surplus/(Deficit) for the
year 54,835 55,617 103,113 76,749 Total Capital Expenditure 166,599 148,176 113,609 120,914
Total operating revenue has grown by 6.8% or R 56.7 million for the 2018/19 financial year when compared to the 2017/18 Adjustments Budget. For the two outer years, operational revenue will increase by 4.0% and increase by 2.3% respectively, equating to a total revenue growth of R 57.4 million over the MTREF when compared to the 2018/19 financial year. Total operating expenditure for the 2018/19 financial year has been appropriated at R 888.9 million and translates into a budgeted surplus of R 55.6 million after taking into consideration capital funding. When compared to the 2017/18 Adjustments Budget, operational expenditure has grown by 4.0% in the 2018/19 budget and reduces by 3.9% for 2019/20 and increases by 4.9% for 2020/21 being the outer years of the MTREF. The operating surplus over the MTREF increases by R 21.1 which translate to a 38.0% increase after capital funding is accounted for. These surpluses will be used to fund capital expenditure and to further ensure cash backing of reserves and funds. The capital budget of R 148.1 million for 2018/19 is 11.1% less when compared to the 2017/18 Adjustment Budget. The reduction is due to a combination of grant funding being less and own funding becoming less. The capital program decreases to R 113.6 million in the 2019/20 financial year and then increase to R 120.9 million in the 2020/21 financial year. The major portion of the capital budget will be funded from borrowing over MTREF with anticipated borrowings not exceeding R 60 Million per year over the MTREF. A portion of the capital budget will be funded from Government grants and subsidies as the municipality have limited own financial resources to commit its own funds to capital financing. It needs to be noted that Knysna Municipality will be reaching its prudential borrowing limits over MTREF and so there is not much room for increasing borrowing over the medium-term. It is however very important to ensure that the municipality sufficiently recovers financially prior to the taking up of additional capital loan funding in excess of current annual redemption. The repayment of capital and interest (debt services costs) will substantially increase over the MTREF and will therefore impact negatively to the financial recovery of the municipality.
1.6 Operating Revenue Framework
Municipalities are urged to maintain tariff increases at levels that reflect an appropriate balance between the affordability to poorer households and other customers while ensuring sustainability of the municipality.

Knysna Municipality 2018/19 Draft Annual Budget and MTREF
29 March 2018 9
The Consumer Price Index (CPI) inflation is forecasted to be within the upper limit of the 3 to 6 per cent target band; thus municipalities are required to justify all increases in excess of the projected inflation target for 2018/19 in their budget narratives, and pay careful attention to the
differential incidence of tariff increases across all consumer groups.
Municipalities should include a detail of their revenue growth assumption for the different service charges in their budget narratives.
The local government sphere confronts tough fiscal choices in the face of financial and institutional difficulties that result in service delivery breakdowns and unpaid bills, thus municipalities can offset these trends by improving own revenue collection, working more efficiently and implementing cost containment measures.
The National Energy Regulator of South Africa (NERSA) published their “Municipal Tariff Guideline Increase, Benchmarks and Proposed Timelines for Municipal Tariff Approval Process for the 2018/19 Financial Year” on 28 February 2018. Municipalities are encouraged to download the full guideline document (available at www.nersa.org.za) and study it carefully.
The NERSA document proposes a 6.84 per cent guideline increase for municipal electricity tariffs for 2018/19. This is based on a bulk tariff increase for municipalities of 7.32 per cent.
Municipalities are advised to examine the cost structure of providing electricity services and to apply to NERSA for electricity tariff increases that reflect the total cost of providing the service so that they work towards achieving fully cost-reflective tariffs that will help them achieve financial sustainability.
Municipalities in arrears with Eskom should ensure that their payment arrangements are effected in their 2018/19 MTREF budget.
For Knysna Municipality to continue improving the quality of life of its communities through the delivery of high quality services, it is necessary to generate sufficient revenue from service charges and rates. It is also important to ensure that all billable revenue is firstly correctly charged and secondly adequately collected. The prevailing economic circumstances are adding to the difficulties in collecting the revenue due to the municipality and additional savings initiatives will need to be implemented in the MTREF to ensure the financial sustainability of the municipality. The expenditure required to address the needs of the community will inevitably always exceed available funding; hence difficult choices have to be made in relation to tariff increases and balancing expenditures against realistically anticipated revenues. The municipality’s revenue strategy is built around the following key components: • National Treasury’s guidelines and macroeconomic policy; • Revenue enhancement and maximizing the revenue base; • Data cleansing and accuracy; • Efficient revenue management, which aims to ensure a minimum 97% annual collection
rate; • Electricity tariff increases as approved by the National Electricity Regulator of South Africa
(NERSA); • For the first time in many years moving towards cost reflective tariff increases for water,
sanitation, electricity and rates. There is still some work to be done on refuse tariffs and the real cost drivers will become clear once the Mosselbay waste transfer discussions are finalized.;

Knysna Municipality 2018/19 Draft Annual Budget and MTREF
29 March 2018 10
• Budgeting for a moderate surplus to ensure availability of cash reserves to back statutory funds and provisions.
• Fully subsidizing all indigent households in terms of the relief offered by the municipality • Ensuring financial sustainability of the current rate base. The following table is a summary of the 2018/19 MTREF (classified by main revenue source): Table 2 Summary of revenue classified by main revenue source
Description Ref
R thousand 1Original
Budget
Adjusted
Budget
Full Year
Forecast
Pre-audit
outcome
Budget Year
2018/19
Budget Year
+1 2019/20
Budget Year
+2 2020/21
Revenue By Source
Property rates 2 200 734 205 069 205 069 – 209 581 217 964 226 683
Serv ice charges - electricity rev enue 2 233 235 233 754 233 754 – 250 865 269 228 288 936
Serv ice charges - w ater rev enue 2 71 324 66 681 66 681 – 71 815 77 345 83 301
Serv ice charges - sanitation rev enue 2 14 034 15 639 15 639 – 18 080 20 903 24 165
Serv ice charges - refuse rev enue 2 21 033 20 983 20 983 – 22 074 23 277 24 488
Serv ice charges - other 4 979 – – – – –
Rental of facilities and equipment 6 328 6 328 6 328 6 657 7 003 7 367
Interest earned - ex ternal inv estments 9 700 11 200 11 200 11 760 11 760 11 760
Interest earned - outstanding debtors 3 541 11 477 11 477 12 074 12 702 13 362
Div idends receiv ed – – – – – –
Fines, penalties and forfeits 98 429 105 030 105 030 110 597 116 458 122 631
Licences and permits 1 482 1 492 1 492 1 572 1 654 1 742
Agency serv ices 2 763 2 763 2 763 2 909 3 066 3 235
Transfers and subsidies 140 596 134 896 134 896 152 800 145 409 119 970
Other rev enue 2 4 479 13 330 13 330 – 14 021 14 758 15 526
Gains on disposal of PPE 500 500 500 1 000 – –
Total Revenue (excluding capital transfers
and contributions)
813 157 829 143 829 143 – 885 805 921 528 943 165
2018/19 Medium Term Revenue &
Expenditure FrameworkCurrent Year 2017/18

Knysna Municipality 2018/19 Draft Annual Budget and MTREF
29 March 2018 11
Table 3 Percentage growth in revenue by main revenue source
Revenue generated from services charges remain the major source of revenue for the municipality amounting to 40.9% of total revenue. The major sources of revenue for the 2018/2019 financial year can be summarized as follows:
Figure 2 Major sources of revenue for the 2018/2019 financial year
Description Ref
R thousand 1Adjusted
Budget%
Budget Year
2018/19%
Budget Year
+1 2019/20%
Budget Year
+2 2020/21%
Revenue By Source
Property rates 2 205 069 24,73% 209 581 23,66% 217 964 23,65% 226 683 24,03%
Serv ice charges - electricity rev enue 2 233 754 28,19% 250 865 28,32% 269 228 29,22% 288 936 30,63%
Serv ice charges - w ater rev enue 2 66 681 8,04% 71 815 8,11% 77 345 8,39% 83 301 8,83%
Serv ice charges - sanitation rev enue 2 15 639 1,89% 18 080 2,04% 20 903 2,27% 24 165 2,56%
Serv ice charges - refuse rev enue 2 20 983 2,53% 22 074 2,49% 23 277 2,53% 24 488 2,60%
Serv ice charges - other – 0,00% – 0,00% – 0,00% – 0,00%
Rental of facilities and equipment 6 328 0,76% 6 657 0,75% 7 003 0,76% 7 367 0,78%
Interest earned - ex ternal inv estments 11 200 1,35% 11 760 1,33% 11 760 1,28% 11 760 1,25%
Interest earned - outstanding debtors 11 477 1,38% 12 074 1,36% 12 702 1,38% 13 362 1,42%
Div idends receiv ed – 0,00% – 0,00% – 0,00% – 0,00%
Fines 105 030 12,67% 110 597 12,49% 116 458 12,64% 122 631 13,00%
Licences and permits 1 492 0,18% 1 572 0,18% 1 654 0,18% 1 742 0,18%
Agency serv ices 2 763 0,33% 2 909 0,33% 3 066 0,33% 3 235 0,34%
Transfers recognised - operational 134 896 16,27% 152 800 17,25% 145 409 15,78% 119 970 12,72%
Other rev enue 2 13 330 1,61% 14 021 1,58% 14 758 1,60% 15 526 1,65%
Gains on disposal of PPE 500 0,06% 1 000 0,11% – 0,00% – 0,00%
Total Revenue (excluding capital transfers
and contributions)
829 143 100,00% 885 805 100,00% 921 528 100,00% 943 165 100,00%
2018/19 Medium Term Revenue & Expenditure Framework
Source Amount (R Million) Percentage
Assessment Rates 209,58 23,66%
Electricity revenue 250,86 28,32%
Water revenue 71,82 8,11%
Sewerage Charges 18,08 2,04%
Refuse Charges 22,07 2,49%
Grants and subsidies 152,80 17,25%

Knysna Municipality 2018/19 Draft Annual Budget and MTREF
29 March 2018 12
The second largest source is property rates totaling R 209.5 million. Grants is the third largest at R152.8 million and mainly comprises of Equitable Share allocated through the Division of Revenue Act and Provincial housing allocation for the construction of Houses. Other operating grants include the Finance management grant; municipal systems improvement grant as well as EPWP incentive grant. Other revenue consists of various items such as income received from permits and licenses, building plan fees, connection fees, fines collected and other sundry receipts and totals R 160.6 Million for the 2018/2019 financial year. Departments have been urged to review the tariffs of these items on an annual basis to ensure they are cost reflective and market related. Table 4 Operating Transfers and Grant Receipts
Tariff Setting Tariff-setting is a pivotal and strategic part of the compilation of any budget. When rates, tariffs and other charges were revised, local economic conditions, input costs and the affordability of services were taken into account to ensure the financial sustainability of the Municipality.
National Treasury continues to encourage municipalities to keep increases in rates, tariffs and other charges as low as possible. Municipalities should justify in their budget documentation all increases in excess of the 5.2% upper boundary of the South African Reserve Bank’s inflation target. Circular 72 stated that, if municipalities continue to act in this manner that increase tariff above inflation, the National Treasury will have no other option but to set upper limits of tariff
Description Ref
R thousandOriginal
Budget
Adjusted
Budget
Full Year
Forecast
Budget Year
2018/19
Budget Year
+1 2019/20
Budget Year
+2 2020/21
RECEIPTS: 1, 2
Operating Transfers and Grants
National Government: 79 441 79 308 79 308 84 474 91 408 100 478
Equitable Share 70 833 70 833 70 833 78 375 85 909 94 186
Financial Management Grant 1 550 1 550 1 550 1 550 1 550 1 550
Municipal Intrastructure Grant 4 047 4 047 4 047 3 362 3 949 4 742
Neighbourhood Dev elopment Partnership Grant 1 228 1 094 1 094 – – –
Ex panded Public Works Programme Integrated Grant 1 415 1 415 1 415 1 187 – –
Integrated National Electrification Programme Grant 368 368 368 – – –
Provincial Government: 60 968 55 121 55 121 68 126 54 001 19 492
Community Dev elopment Workers 56 56 56 56 56 56
Housing 52 360 44 168 44 168 58 424 44 200 9 750
Libraries, Archiv es and Museums 8 470 7 901 7 901 8 711 9 181 9 686
Other - Fire Serv ices – 147 147 – – –
Public Transport 82 82 82 86 – –
Maintenance of Road Infrastructure – 487 487 – – –
Other - Financial Management Support (WC_FMGSG) – 2 280 2 280 849 564 –
District Municipality: – – – – – –
Other grant providers: 200 200 200 200 – –
Non-profit institutions - Unspecified 200 200 200 200 – –
Total Operating Transfers and Grants 5 140 609 134 629 134 629 152 800 145 409 119 970
Current Year 2017/182018/19 Medium Term Revenue &
Expenditure Framework
Knysna Municipality 2018/19 Draft Annual Budget and MTREF
29 March 2018 13
increases for property rates and service charges to which municipalities will have to conform. Excessive increases are likely to be counterproductive to economic growth and development, resulting in higher levels of non-payment which is prevalent in Knysna.
The 6.84 % increases in the average Eskom bulk purchase price once again exceeds the upper boundary of the Reserve bank inflation target resulting in an average proposed increase of 7.32 % in the municipal electricity tariff. Other factors contributing to the rising cost include the anticipated collectively agreement on salaries and wage which is anticipated to be also above upper boundary, the increase in price of chemicals, spares and other materials that collectively contribute to the extent that tariffs needs to be increased annually. The finance department has embarked on value for money audit process, this entails ensuring that all tenders are publicized openly and avoid deviations in order to ensure competitive pricing is received. There are already good signs of reduced cost of doing business when compared with previously awarded tenders. This will assist in reducing cost and providing much needed cash injection on Capital Replacement Reserve fund.
1.6.1 Property Rates
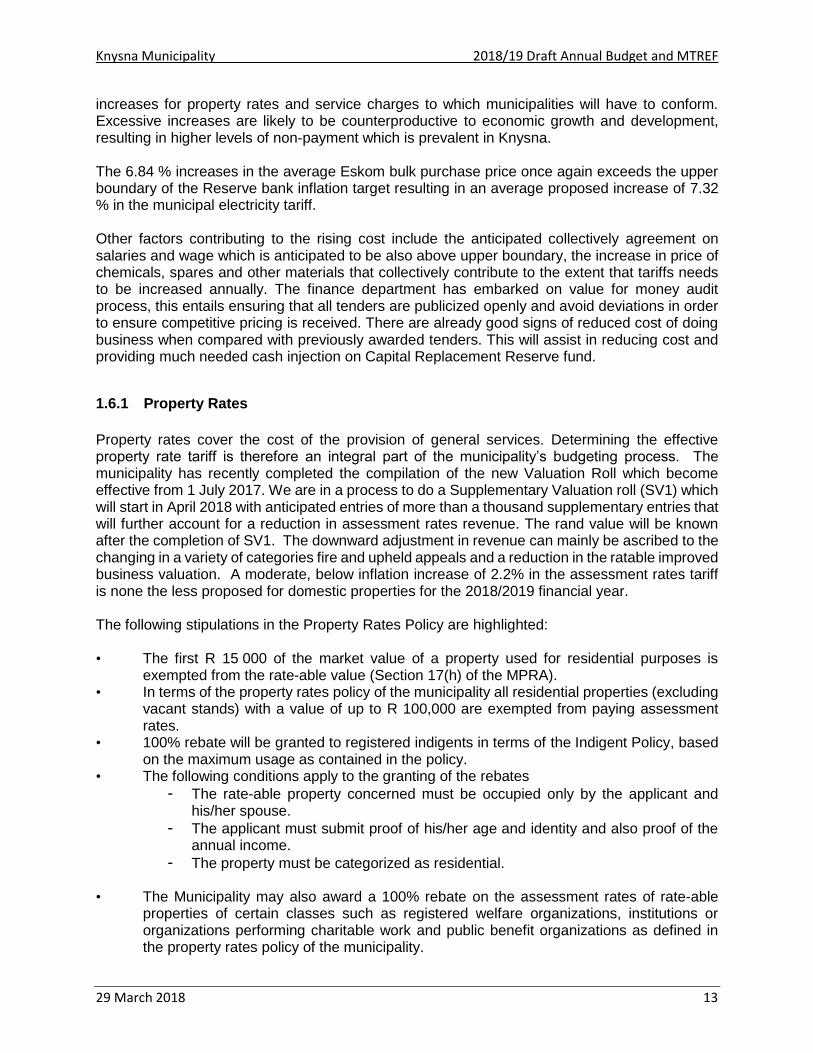
Property rates cover the cost of the provision of general services. Determining the effective property rate tariff is therefore an integral part of the municipality’s budgeting process. The municipality has recently completed the compilation of the new Valuation Roll which become effective from 1 July 2017. We are in a process to do a Supplementary Valuation roll (SV1) which will start in April 2018 with anticipated entries of more than a thousand supplementary entries that will further account for a reduction in assessment rates revenue. The rand value will be known after the completion of SV1. The downward adjustment in revenue can mainly be ascribed to the changing in a variety of categories fire and upheld appeals and a reduction in the ratable improved business valuation. A moderate, below inflation increase of 2.2% in the assessment rates tariff is none the less proposed for domestic properties for the 2018/2019 financial year. The following stipulations in the Property Rates Policy are highlighted: • The first R 15 000 of the market value of a property used for residential purposes is
exempted from the rate-able value (Section 17(h) of the MPRA). • In terms of the property rates policy of the municipality all residential properties (excluding
vacant stands) with a value of up to R 100,000 are exempted from paying assessment rates.
• 100% rebate will be granted to registered indigents in terms of the Indigent Policy, based on the maximum usage as contained in the policy.
• The following conditions apply to the granting of the rebates
- The rate-able property concerned must be occupied only by the applicant and his/her spouse.
- The applicant must submit proof of his/her age and identity and also proof of the annual income.
- The property must be categorized as residential. • The Municipality may also award a 100% rebate on the assessment rates of rate-able
properties of certain classes such as registered welfare organizations, institutions or organizations performing charitable work and public benefit organizations as defined in the property rates policy of the municipality.
Knysna Municipality 2018/19 Draft Annual Budget and MTREF
29 March 2018 14
• In order to encourage development and investment in the greater Knysna, further rebate of rates is provided to new business as follows;
a) 100% first year b) 75% second year c) 50% in the third year where after the full rates become payable.
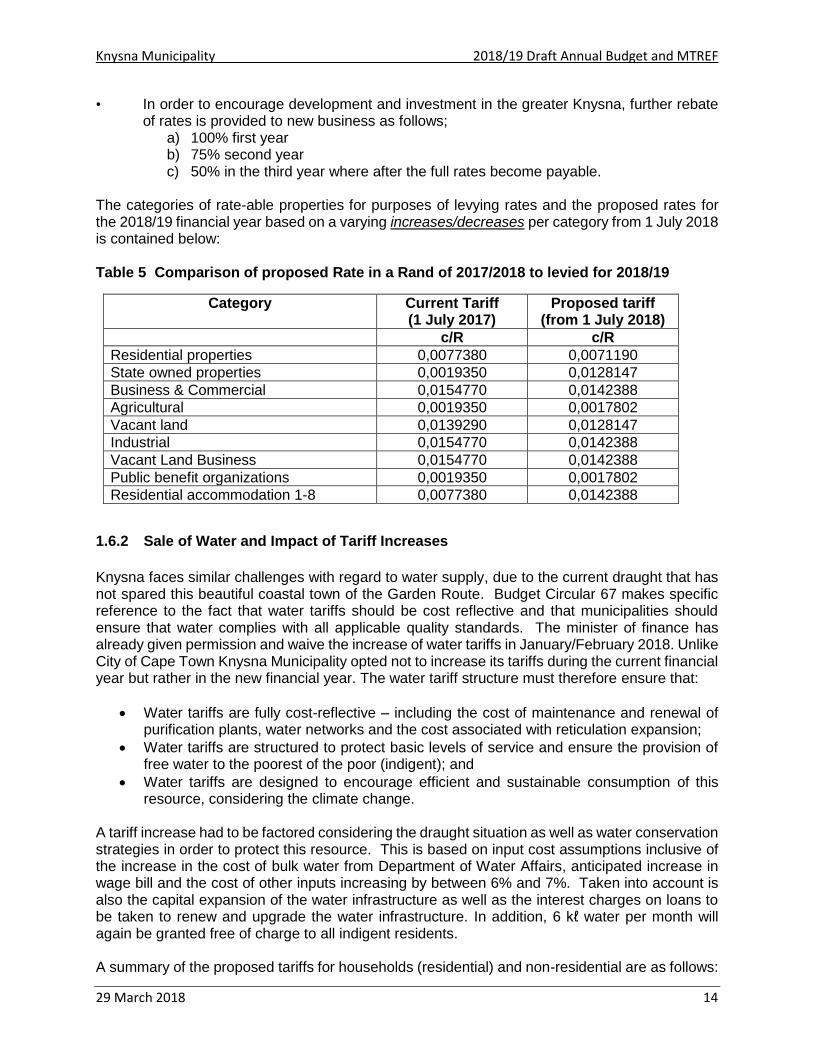
The categories of rate-able properties for purposes of levying rates and the proposed rates for the 2018/19 financial year based on a varying increases/decreases per category from 1 July 2018 is contained below: Table 5 Comparison of proposed Rate in a Rand of 2017/2018 to levied for 2018/19
Category Current Tariff (1 July 2017)
Proposed tariff (from 1 July 2018)
c/R c/R
Residential properties 0,0077380 0,0071190
State owned properties 0,0019350 0,0128147
Business & Commercial 0,0154770 0,0142388
Agricultural 0,0019350 0,0017802
Vacant land 0,0139290 0,0128147
Industrial 0,0154770 0,0142388
Vacant Land Business 0,0154770 0,0142388
Public benefit organizations 0,0019350 0,0017802
Residential accommodation 1-8 0,0077380 0,0142388
1.6.2 Sale of Water and Impact of Tariff Increases
Knysna faces similar challenges with regard to water supply, due to the current draught that has not spared this beautiful coastal town of the Garden Route. Budget Circular 67 makes specific reference to the fact that water tariffs should be cost reflective and that municipalities should ensure that water complies with all applicable quality standards. The minister of finance has already given permission and waive the increase of water tariffs in January/February 2018. Unlike City of Cape Town Knysna Municipality opted not to increase its tariffs during the current financial year but rather in the new financial year. The water tariff structure must therefore ensure that:
Water tariffs are fully cost-reflective – including the cost of maintenance and renewal of purification plants, water networks and the cost associated with reticulation expansion;
Water tariffs are structured to protect basic levels of service and ensure the provision of free water to the poorest of the poor (indigent); and
Water tariffs are designed to encourage efficient and sustainable consumption of this resource, considering the climate change.
A tariff increase had to be factored considering the draught situation as well as water conservation strategies in order to protect this resource. This is based on input cost assumptions inclusive of the increase in the cost of bulk water from Department of Water Affairs, anticipated increase in wage bill and the cost of other inputs increasing by between 6% and 7%. Taken into account is also the capital expansion of the water infrastructure as well as the interest charges on loans to be taken to renew and upgrade the water infrastructure. In addition, 6 kℓ water per month will again be granted free of charge to all indigent residents. A summary of the proposed tariffs for households (residential) and non-residential are as follows:

Knysna Municipality 2018/19 Draft Annual Budget and MTREF
29 March 2018 15
Figure 3 Summary of the proposed tariffs
Table 6 Proposed Water Tariffs
The following table shows the impact of the proposed increases in water tariffs on the water charges: Table 7 Comparison between current water charges and increases
Water Tariff Base
Category Tariff (R)
Residential Indigent 0
Residential Non-Indigent 160,23
Commercial 320,46
Consumer Category 2017/2018Proposed
218/2019
Increase/
Decrease%
Residential - Indigent 0 0 - 0
Residential 148,68 160,23 I 7,77
Cluster 148,68 160,23 I 7,77
Commercial/Business 300,37 320,46 I 6,69
Industry 300,37 320,46 I 6,69
Farms 300,37 320,46 I 6,69
Education 247,3 320,46 I 29,58
Government/Institution 300,37 320,46 I 6,69
Parks 300,37 320,46 I 6,69
Other 300,37 320,46 I 6,69

Knysna Municipality 2018/19 Draft Annual Budget and MTREF
29 March 2018 16
The tariff structure of the 2018/19 financial year has been changed. The tariff structure is designed to charge higher levels of consumption a higher rate per kiloliter for consumption in
excess of 100kℓ per month.
1.6.3 Sale of Electricity and Impact of Tariff Increases
NERSA has announced the revised bulk electricity pricing structure. A 6.84 % increase in the Eskom bulk electricity tariff to municipalities will be effective from 1 July 2018. Considering the Eskom increases, the consumer tariff had to be increased by 7.32 % to offset the additional bulk purchase cost as well as recover the additional cost components such as the increase in the wage bill, general expenditure and increased maintenance and material cost for the 2018/19 financial year. The continued above average increase in electricity prices may result in a downward trend in the average consumption patterns of consumers in an attempt to mitigate the effect of the increased cost of electricity and this may result in a negative impact on the municipal electricity revenue. Registered indigents as well as sub-economic consumers will again be granted 50 kWh per month free of charge. In line with circular 82 on cost containment measures, the Municipality will test the market and embark on energy savings initiatives. The first project involves the retrofit of existing street luminaires with energy efficient equivalents. The extended baseline showed that most electricity consumption on most public infrastructure in the greater Knysna is far below current energy efficiency standards. Therefore, there is a high potential for the implementation of retrofit project in all the relevant areas. However due to budgetary constraints, only a fraction of the relevant potential projects can be implemented in the next financial year. This project will assist in ensuring that the cost of bulk electricity purchase is substantially reduced. The lights replacement and fitting project which will be aligned to smart cities principles is to be started in the next six months as it relates to the following;
Retrofits of Street lights to be replaced
Retrofit of Traffic lights to be replaced
Repair of load Control/PFC Installation
High Mass lights to be replaced
Smart meters to be installed at Municipal buildings
Building lights/Services to be replaced
Pump motors (DOL) to be replaced
Pump Control systems to be replaced.
Community parks and/ or public spaces installations of lights The following table shows the impact of the proposed increases in electricity tariffs on the electricity charges for domestic customers:

Knysna Municipality 2018/19 Draft Annual Budget and MTREF
29 March 2018 17
Table 8 Comparison current vs. new electricity charges (Domestic up to 60A connection)
Monthly Current amount
Proposed amount Difference
Percentage change
Consumption payable Payable (Increase)
kWh R R R
100.00 79.44 85.26 5.82 7.32
250.00 212.42 227.97 15.55 7.32
500.00 560.12 601.12 41.00 7.32
750.00 894.01 959.45 65.44 7.32
1 000.00 1250.92 1342.49 91.57 7.32
2 000.00 2678.57 2874.64 196.07 7.32
1.6.4 Sanitation and Impact of Tariff Increases
This service has been operating at a loss, meaning the income generated has not been sufficient to cover the cost. As a result, for all the years it has been subsidized by property rates income, which should not be the case as each service must be self-sufficient. The proposed increase in sanitation takes into account the above statement and is phased over five years to dampen the huge impact that would have been over three years. Knysna Municipality when compared to other Municipalities in the Garden Route have been under charging for this service for years. The increase in tariffs can also be ascribed to rising wage cost, the increase in electricity used in purification and pumping processes, the increase in fuel prices and the general increase in the price of goods and services. It must also be emphasized that the municipality must ensure that purification processes complies with quality standards and that green drop status is maintained. Additional budgetary allocation has been considered for increasing of process controllers and other waste water purification staff members critical in maintaining high quality purification processes and results. Table 7 Comparison between current sanitation charges and increases with other Municipalities in the Garden Route
Table 10 Comparison current sanitation charges in relation to other neighboring Municipalities before their increases.
George Bitou Mossel Bay Knysna Proposed 2016 2017/2018 2017/2018 2017/2018 2018/2019
Sewer Residential 173.79 396.25 210.46 71.49 196.27
Sewer Fixed
Category Tariff (R)
Residential Indigent 0
Residential Non-Indigent 196,27
Commercial 333,66

Knysna Municipality 2018/19 Draft Annual Budget and MTREF
29 March 2018 18
The following table shows the impact of the proposed increases in sanitation tariffs on the amounts charged per consumer category Table 11 Comparison between current sanitation charges and new, per consumer type
1.6.5 Waste Removal and Impact of Tariff Increases
Budget circular 66 and 67 state that municipalities should strive to budget for a moderate surplus in order to ensure that the required funding levels are maintained and to ensure that the provision for the rehabilitation of the land fill site is cash backed. The Municipality is currently in a process to close the current land fill site and it is therefore of essence that sufficient funds are available for the rehabilitation of the landfill site estimated to be in excess of R 2.1 Million. The municipality has for now no alternative but to transport its waste to the Petro SA dumpsite at an exorbitant cost. The Manager waste services has been appointed and will attempt to reduce this cost, by considering composting of green waste to be done in order to reduce the volumes. Recycling is promoted to further reduce the volumes and subsequent cost of transporting of waste. The combined cost of transporting, composting and recycling is estimated at R 6.1 Million for the current 2017/2018 financial year. In accordance with the National Treasury directive cost reflective tariff setting is engaged with resulting in an increase of 5.3% in the waste removal tariff with effect from 1 July 2018. To avoid further higher than normal increases in the refuse tariff it is essential that consumers make use of composting and recycling to reduce refuse volumes. Knysna resident has already been hit by an 18% increase in the current budget, the Municipality will engage in many options to try and reduce the burden of these cost to the customers. In order to ensure that all owners of property contribute fairly towards to cost associated with the service an availability charge for refuse is implemented as the refuse facilities needs to make provision for all possible units of refuse generated measured in terms of all approved erven. The following table compares current and proposed amounts payable from 1 July 2018:
Sewer tariff Increase
Consumer Category 2017/2018Proposed
218/2019
Increase/
Decrease%
Residential - Indigent 0 0 - 0
Residential 71,49 196,27 I 174,54
Cluster 71,49 196,27 I 174,54
Commercial/Business 288,60 333,66 I 15,61
Industry 288,60 333,66 I 15,61
Farms 288,60 333,66 I 15,61
Education 288,60 333,66 I 15,61
Government/Institution 288,60 333,66 I 15,61
Parks 288,60 333,66 I 15,61
Other 288,60 333,66 I 15,61

Knysna Municipality 2018/19 Draft Annual Budget and MTREF
29 March 2018 19
Table 12 Comparison between current waste removal fees and increases
Current Tariff
Proposed Tariff
Difference %
2017/18 2018/19 Per Annum
Difference
One removal per bin per week Per Annum (R)
Per Annum (R) Per month (R)
Domestic removed once a week R 1 090.50
R 1 156
65.50 6.0%
Business/Commercial removed per week
R 1 926.30
R 2 042
115.70 6.0%
1.6.6 Overall impact of tariff increases on households
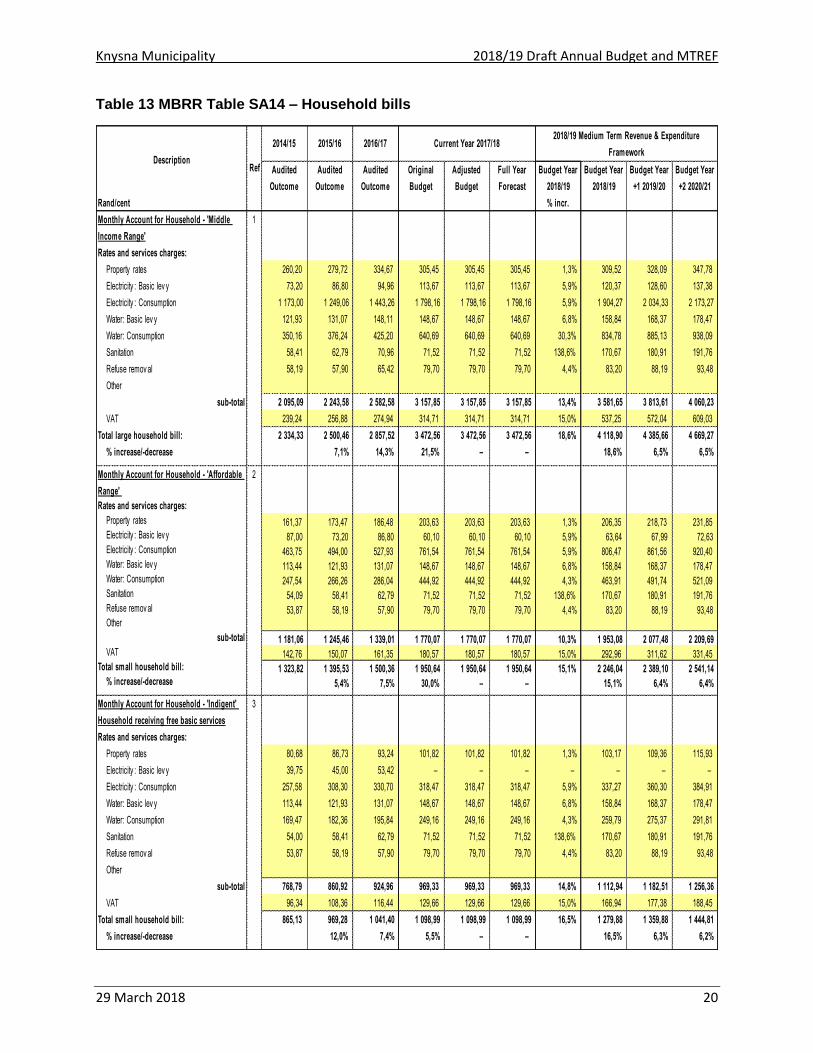
The following table shows the overall expected impact of the tariff increases on a large and small household, as well as an indigent household receiving free basic services. Note that in all instances the overall impact of the tariff increases on household’s bills has been kept to between 5% and 7%, with the increase for indigent households 0% due to full subsidization.
Knysna Municipality 2018/19 Draft Annual Budget and MTREF
29 March 2018 20
Table 13 MBRR Table SA14 – Household bills
2014/15 2015/16 2016/172018/19 Medium Term Revenue & Expenditure
Framework
Audited
Outcome
Audited
Outcome
Audited
Outcome
Original
Budget
Adjusted
Budget
Full Year
Forecast
Budget Year
2018/19
Budget Year
2018/19
Budget Year
+1 2019/20
Budget Year
+2 2020/21
Rand/cent % incr.
Monthly Account for Household - 'Middle
Income Range'
1
Rates and services charges:
Property rates 260,20 279,72 334,67 305,45 305,45 305,45 1,3% 309,52 328,09 347,78
Electricity : Basic lev y 73,20 86,80 94,96 113,67 113,67 113,67 5,9% 120,37 128,60 137,38
Electricity : Consumption 1 173,00 1 249,06 1 443,26 1 798,16 1 798,16 1 798,16 5,9% 1 904,27 2 034,33 2 173,27
Water: Basic lev y 121,93 131,07 148,11 148,67 148,67 148,67 6,8% 158,84 168,37 178,47
Water: Consumption 350,16 376,24 425,20 640,69 640,69 640,69 30,3% 834,78 885,13 938,09
Sanitation 58,41 62,79 70,96 71,52 71,52 71,52 138,6% 170,67 180,91 191,76
Refuse remov al 58,19 57,90 65,42 79,70 79,70 79,70 4,4% 83,20 88,19 93,48
Other
sub-total 2 095,09 2 243,58 2 582,58 3 157,85 3 157,85 3 157,85 13,4% 3 581,65 3 813,61 4 060,23
VAT 239,24 256,88 274,94 314,71 314,71 314,71 15,0% 537,25 572,04 609,03
Total large household bill: 2 334,33 2 500,46 2 857,52 3 472,56 3 472,56 3 472,56 18,6% 4 118,90 4 385,66 4 669,27
% increase/-decrease 7,1% 14,3% 21,5% – – 18,6% 6,5% 6,5%
Monthly Account for Household - 'Affordable
Range'
2
Rates and services charges:
Property rates 161,37 173,47 186,48 203,63 203,63 203,63 1,3% 206,35 218,73 231,85
Electricity : Basic lev y 87,00 73,20 86,80 60,10 60,10 60,10 5,9% 63,64 67,99 72,63
Electricity : Consumption 463,75 494,00 527,93 761,54 761,54 761,54 5,9% 806,47 861,56 920,40
Water: Basic lev y 113,44 121,93 131,07 148,67 148,67 148,67 6,8% 158,84 168,37 178,47
Water: Consumption 247,54 266,26 286,04 444,92 444,92 444,92 4,3% 463,91 491,74 521,09
Sanitation 54,09 58,41 62,79 71,52 71,52 71,52 138,6% 170,67 180,91 191,76
Refuse remov al 53,87 58,19 57,90 79,70 79,70 79,70 4,4% 83,20 88,19 93,48
Other
sub-total 1 181,06 1 245,46 1 339,01 1 770,07 1 770,07 1 770,07 10,3% 1 953,08 2 077,48 2 209,69
VAT 142,76 150,07 161,35 180,57 180,57 180,57 15,0% 292,96 311,62 331,45
Total small household bill: 1 323,82 1 395,53 1 500,36 1 950,64 1 950,64 1 950,64 15,1% 2 246,04 2 389,10 2 541,14
% increase/-decrease 5,4% 7,5% 30,0% – – 15,1% 6,4% 6,4%
0,39 3,00 -1,00 - Monthly Account for Household - 'Indigent'
Household receiving free basic services
3
Rates and services charges:
Property rates 80,68 86,73 93,24 101,82 101,82 101,82 1,3% 103,17 109,36 115,93
Electricity : Basic lev y 39,75 45,00 53,42 – – – – – – –
Electricity : Consumption 257,58 308,30 330,70 318,47 318,47 318,47 5,9% 337,27 360,30 384,91
Water: Basic lev y 113,44 121,93 131,07 148,67 148,67 148,67 6,8% 158,84 168,37 178,47
Water: Consumption 169,47 182,36 195,84 249,16 249,16 249,16 4,3% 259,79 275,37 291,81
Sanitation 54,00 58,41 62,79 71,52 71,52 71,52 138,6% 170,67 180,91 191,76
Refuse remov al 53,87 58,19 57,90 79,70 79,70 79,70 4,4% 83,20 88,19 93,48
Other
sub-total 768,79 860,92 924,96 969,33 969,33 969,33 14,8% 1 112,94 1 182,51 1 256,36
VAT 96,34 108,36 116,44 129,66 129,66 129,66 15,0% 166,94 177,38 188,45
Total small household bill: 865,13 969,28 1 041,40 1 098,99 1 098,99 1 098,99 16,5% 1 279,88 1 359,88 1 444,81
% increase/-decrease 12,0% 7,4% 5,5% – – 16,5% 6,3% 6,2%
Ref
Current Year 2017/18
Description

Knysna Municipality 2018/19 Draft Annual Budget and MTREF
29 March 2018 21
1.7 Operating Expenditure Framework
1.7.1 Employee related costs The Salary and Wage Collective Agreement for the period 01 July 2015 to 31 June 2018 has come to an end. The process is under consultation; therefore, in the absence of other information from the South African Local Government Bargaining Council communication will be provided at a later stage. It is important to note that the Municipality is busy with an organisational redesign process which is also expected to be completed in May or June. The absence of both information in these critical process may negatively affect the budget as these are fixed cost that must be managed and taken into account before the draft budget is tabled. 1.7.2 Remuneration of councillors Municipalities are advised to budget for the actual costs approved in accordance with the Government Gazette on the Remuneration of Public Office Bearers Act: Determination of Upper Limits of Salaries, Allowances and Benefits of different members of municipal councils published annually between December and January by the Department of Cooperative Governance. Any overpayment to councillors contrary to the upper limits as published by the Minister of Cooperative Governance and Traditional Affairs will be irregular expenditure in terms of section 167 of the MFMA and must be recovered from the councillor(s) concerned. The cost associated with the remuneration of public office bearers is determined by the Minister of Co-operative Governance and Traditional Affairs in accordance with the Remuneration of Public Office Bearers Act, 1998 (Act 20 of 1998). The remuneration cost of councilors is partially subsidized through the equitable share allocation awarded to the municipality in terms of the division of revenue Act. An allocation in the amount of R 78.3 million is awarded to Knysna for the 2018/19 financial year. 1.7.3 Impact of VAT increase on tariffs VAT will increase from 14 per cent to 15 per cent from April 2018. In terms of Section 7(4) of Value-Added Tax Act (No. 89 of 1991), the VAT increase takes effect on 1 April. It is a tax increase as a result of tax legislation that municipalities must implement and not an increase of tariffs by municipalities. Section 28(6) of the MFMA is not applicable in this regard. Provincial Treasury will in due course provide clarity regarding the practicalities of implementing the VAT increase. Municipalities are in the interim advised to consult the VAT Increase Guidelines issued by the South African Revenue Service (SARS) as part of MFMA Circular 91. Knysna Municipality’s expenditure framework for the 2018/19 budget and MTREF is informed by the following: • The asset renewal strategy and the repairs and maintenance plan; • Balanced budget constraint (operating expenditure should not exceed operating revenue)
unless there are existing uncommitted cash-backed reserves to fund any deficit; • The financial recovery of the municipality to ensure the required funding levels are
achieved and maintained. • Continued provision of basic services and financial sustainability • Operational gains and efficiencies will be directed to ensure appropriate cash backing of
statutory funds, provisions and reserves as well as funding the capital budget and other core services.

Knysna Municipality 2018/19 Draft Annual Budget and MTREF
29 March 2018 22
The following table is a high level summary of the 2018/19 budget and MTREF (classified per main type of operating expenditure):
Table 14 Summary of operating expenditure by standard classification item
The budgeted allocation for employee related costs for the 2018/19 financial year totals R 243.0 Million, which equals 27.3% of the total operating expenditure. Based on the collective SALGBC wage agreement, salary increases have been factored into this budget at a percentage increase of 6.79% for the 2018/19 financial year. An annual increase of 6.4% has been included respectively for the 2019/20 and 2020/21 financial year In order to ensure economic viability and to not overstretch the already limited financial resources, and cash management strategy, the Municipality is busy with an organizational redesign process which is expected to be completed by end of May/June 2018. Positions and vacancies have been significantly rationalized downwards and budgeted in a staggering manner. Only the positions that are critical for service delivery will be included in the final draft budget for the 2018/19 financial year. These positions are normally mainly at electricity services, water and waste water, fire services and to some extent on areas where the work is currently done by consultants and could be cheaper to do internally. Use of consultants will be reviewed as contracts expires. The latter is in line with National Treasury advocacy on minimizing use of external service providers but rather build internal capacity where it can be cost effective to do the work internally. The cost to fill the organizational structure is to be determined when the final budget is presented and it is unknown at this time. In this MTREF it is advisable to fund the structure, once finalized in a staggering approach, meaning core service delivery positions and some critical positions are funded in the first year and other department positions be funded in the following year as resources becomes available.
Description Ref
R thousand 1Original
Budget
Adjusted
Budget
Full Year
Forecast
Pre-audit
outcome
Budget Year
2018/19
Budget Year
+1 2019/20
Budget Year
+2 2020/21
Expenditure By Type
Employ ee related costs 2 220 119 239 827 239 827 – 243 042 255 129 268 905
Remuneration of councillors 8 302 8 942 8 942 8 653 9 120 9 612
Debt impairment 3 82 993 110 833 110 833 116 707 123 009 129 652
Depreciation & asset impairment 2 30 899 30 899 30 899 – 32 041 32 162 32 127
Finance charges 19 502 23 322 23 322 33 208 34 545 36 001
Bulk purchases 2 157 625 165 925 165 925 – 177 274 185 854 194 850
Other materials 8 31 746 47 976 47 976 51 470 54 146 56 962
Contracted serv ices 29 676 160 086 160 086 – 161 942 116 484 122 443
Transfers and subsidies 2 280 8 415 8 415 – 6 958 692 692
Other ex penditure 4, 5 228 839 58 180 58 180 – 57 625 42 677 44 870
Loss on disposal of PPE – – – – –
Total Expenditure 811 980 854 405 854 405 – 888 921 853 817 896 114
2018/19 Medium Term Revenue &
Expenditure FrameworkCurrent Year 2017/18
Knysna Municipality 2018/19 Draft Annual Budget and MTREF
29 March 2018 23
The provision of debt impairment was determined based on an annual collection rate of 95% and the Debt Write-off Policy of the Municipality. It is anticipated that the recovery of debt, through the increase in debt collection action will reach a level of 97% upon conclusion of the current financial year. The provision amounts to R 33.6 million excluding traffic fines for the 2018/19 financial year. traffic fines are dealt with in terms of iGRAP1 where the total revenue for fines issued must be recognized and then impaired at the end of the financial year. Provision for depreciation and asset impairment has been informed by the Municipality’s Asset Management Policy. Depreciation is widely considered a proxy for the measurement of the rate at which assets are consumed. Budget appropriations in this regard total R 32.0 million for the 2018/19 financial and equates to 3.6% of the total operating expenditure. Finance charges consist primarily of the repayment of interest on long-term borrowing (cost of capital). Finance charges make up 3.7% (R33.2 million) of operating expenditure excluding annual redemption for 2018/19 and reaches 4.0% through the remainder of the MTREF. Knysna Municipality has will be reaching its prudential limits for borrowing and care needs to be taken to ensure that annual finance charges remains within the affordability threshold of ratepayers and consumers considering the prevailing economic circumstances. Bulk purchases are directly informed by the purchase of electricity from Eskom. The annual price increases have been factored into the budget appropriations and directly inform the revenue provisions. Provision for this expenditure has been appropriated at R 177.3 million for the 2018/19 financial year. The expenditure includes electricity distribution losses which equals 8.2%, Water distribution losses as at 30 June 2017 amounted to 23.9% and a concerted effort is necessary to ensure the reduction of the losses to within acceptable levels. In the organization redesign consideration must be made to make provision for full time loss control officers at electricity and water to ensure that these losses are kept to a minimum. Other materials comprise of amongst others the purchase of materials and spares for maintenance, cleaning materials and chemicals. In line with Knysna Municipality’s repairs and maintenance plan this group of expenditure has been prioritized to ensure sustainability of Knysna Municipality’s infrastructure. For 2018/19 the appropriation against this group of expenditure has grown by 5.8% (R51.5 million). Contracted services relate to the provision of services by means of the appointment of service providers where the necessary in-house skills are not available or have not yet been adequately developed. Certain functions also require the contracting of specialist knowledge contracted from time to time due to the fact that the municipality cannot afford to employ experts on a full-time basis. This category of expenditure increases by only R1.8 million when compared to the 2017/18 adjusted budget, and increase to R161.9 million this equates to 18.2% of the total expenditure. This again emphasizes the need to build capacity to ensure certain functions are performed in-house as recommended by National Treasury. Efforts need to be made to try and reduce this category of expenditure. Other expenditure comprises of various line items relating to the daily operations of the municipality. This group of expenditure has also been identified as an area in which cost savings and efficiencies can be achieved. The growth in other expenditure decreases by 0.9% for the 2018/19 financial year and reduces with 25.9% for the 2019/20 year, where-after it increase by 5.1% for the 2020/21 financial year. total allocation for this category of expenditure is appropriated at R57.6 million in the 2018/19 financial year.

Knysna Municipality 2018/19 Draft Annual Budget and MTREF
29 March 2018 24
The following graph gives a breakdown of the main expenditure categories for the 2018/19 financial year.
Figure 4 Main expenditure categories for the 2018/19 financial year
1.7.1 Priority given to repairs and maintenance
In order to ensure the health of the assets of the municipality and to prolong the useful lives, it is necessary to ensure that repairs and maintenance is adequately budgeted. Budget circular 66 cautions municipalities not to affect savings in repairs and maintenance to balance the budget but to ensure that sufficient budgetary allocation is made for this expenditure item. The following table is a consolidation of all the expenditures associated with repairs and maintenance:
Repairs and maintenance is decreasing by 2.0 % in the 2018/19 financial year without taking into
consideration costing of salary of staff that mainly do maintenance and repairs. This expenditure
category decrease from R 62.6 million to R 61.4 million. During the 2017/18 Adjustment Budget
this allocation was adjusted slightly upwards. As part of the 2018/19 MTREF this strategic
imperative remains a priority as can be seen by the budget appropriations over the MTREF. The
allocation to repairs and maintenance substantially increases by 14.6 % over the MTREF.
Other materials6% Remuneration of
councillors1% Transfers and grants
1%
Debt impairment13%
Contracted services18%
Finance charges4%
Depreciation & asset impairment
4%
Other expenditure6%
Bulk purchases20%
Employee related costs27%
Budget Year 2018/19

Knysna Municipality 2018/19 Draft Annual Budget and MTREF
29 March 2018 25
The table below provides a breakdown of the repairs and maintenance in relation to asset class:
Table 8 Repairs and maintenance per asset class
Description Ref
R thousand 1Original
Budget
Adjusted
Budget
Full Year
Forecast
Budget Year
2018/19
Budget Year
+1 2019/20
Budget Year
+2 2020/21
Repairs and maintenance expenditure by Asset Class/Sub-class
Infrastructure 59 422 49 397 49 397 51 237 62 699 66 147
Roads Infrastructure 35 550 25 465 25 465 26 036 37 470 39 531
Roads 35 500 25 445 25 445 26 015 37 417 39 475
Capital Spares 50 20 20 21 53 56
Storm w ater Infrastructure 1 000 1 000 1 000 1 053 1 054 1 112
Drainage Collection 1 000 1 000 1 000 1 053 1 054 1 112
Electrical Infrastructure 4 655 4 073 4 073 4 289 4 906 5 176
HV Transmission Conductors 4 565 3 993 3 993 4 205 4 812 5 077
MV Networks 90 80 80 84 95 100
Water Supply Infrastructure 10 392 11 096 11 096 11 684 10 953 11 556
Pump Stations 607 607 607 639 639 674
Water Treatment Works 6 383 6 627 6 627 6 978 6 728 7 098
Capital Spares 3 403 3 863 3 863 4 067 3 586 3 783
Sanitation Infrastructure 7 015 6 934 6 934 7 301 7 394 7 801
Waste Water Treatment Works 6 936 6 854 6 854 7 217 7 310 7 712
Capital Spares 80 80 80 84 84 88
Solid Waste Infrastructure 810 830 830 874 921 972
Landfill Sites 100 120 120 126 133 141
Waste Transfer Stations 510 510 510 537 566 597
Waste Drop-off Points 200 200 200 211 222 234
Community Assets 3 757 3 848 3 848 168 177 186
Community Facilities 2 458 2 419 2 419 168 177 186
Halls 301 301 301 – – –
Fire/Ambulance Stations 100 100 100 – – –
Museums 118 112 112 118 124 131
Cemeteries/Crematoria 215 225 225 – – –
Police 345 302 302 – – –
Public Open Space 1 219 1 219 1 219 – – –
Public Ablution Facilities 160 160 160 50 53 56
Sport and Recreation Facilities 1 299 1 429 1 429 – – –
Outdoor Facilities 1 299 1 429 1 429 – – –
Other assets 2 891 3 011 3 011 3 539 2 031 2 142
Operational Buildings 2 251 2 371 2 371 2 155 2 031 2 142
Municipal Offices 1 829 1 829 1 829 1 584 1 585 1 673
Depots 422 542 542 571 445 470
Housing 640 640 640 1 384 – –
Staff Housing 150 150 150 1 384 – –
Social Housing 490 490 490 – – –
Computer Equipment – 1 183 1 183 1 246 – –
Computer Equipment 1 183 1 183 1 246 – –
Furniture and Office Equipment 27 32 32 3 0 0
Furniture and Office Equipment 27 32 32 3 0 0
Machinery and Equipment – – – – – –
Transport Assets 5 000 4 948 4 948 4 949 5 216 5 503
Transport Assets 5 000 4 948 4 948 4 949 5 216 5 503
Libraries 228 223 223 229 242 255
Libraries 228 223 223 229 242 255
Zoo's, Marine and Non-biological Animals – – – – – –
Total Repairs and Maintenance Expenditure 1 71 325 62 643 62 643 61 372 70 364 74 234
Current Year 2017/182018/19 Medium Term Revenue &
Expenditure Framework

Knysna Municipality 2018/19 Draft Annual Budget and MTREF
29 March 2018 26
For the 2018/19 financial year, 83.5% or R 51.2 million of total repairs and maintenance will be spent on infrastructure assets. Electricity infrastructure received an allocation totaling 6.9% (R4.3 million), road infrastructure 42.4% (R26.0 million), sanitation 11.9% (R7.3 million) and water 19.0% (R11.7 million). Roads and water infrastructure receives a significant amount in terms of the total allocation for this category of expenditure.
1.7.2 Free Basic Services: Basic Social Services Package
The social package assists households that are poor or face other circumstances that limit their ability to pay for services. To receive these free services, the households are required to register in terms of Knysna Municipality’s Indigent Policy. It is estimated that between 3000 and 4000 households will receive subsidy on tariffs and rates in the 2018/19 financial year, either by means of the full basket of services given as Indigent subsidies or in terms of the property value threshold where owners of properties with a value of less than R 100, 000 qualify for services at sub-economic tariffs. The estimated expenditure on free and subsidized services, inclusive of assessment rate rebates will amount to R 36.1 million for the 2018/19 financial year. The results of 2016 Census Survey has also shown that the population of Knysna have significantly increased over the last 10 years, making it one of the fastest growing area, measured by population in the Garden route region from census to census. The indigent process is one of self-registration therefore households needing assistance must annually apply for the subsidy. The cost of the social package of the registered indigent households is largely financed by national government through the local government equitable share received in terms of the annual Division of Revenue Act.
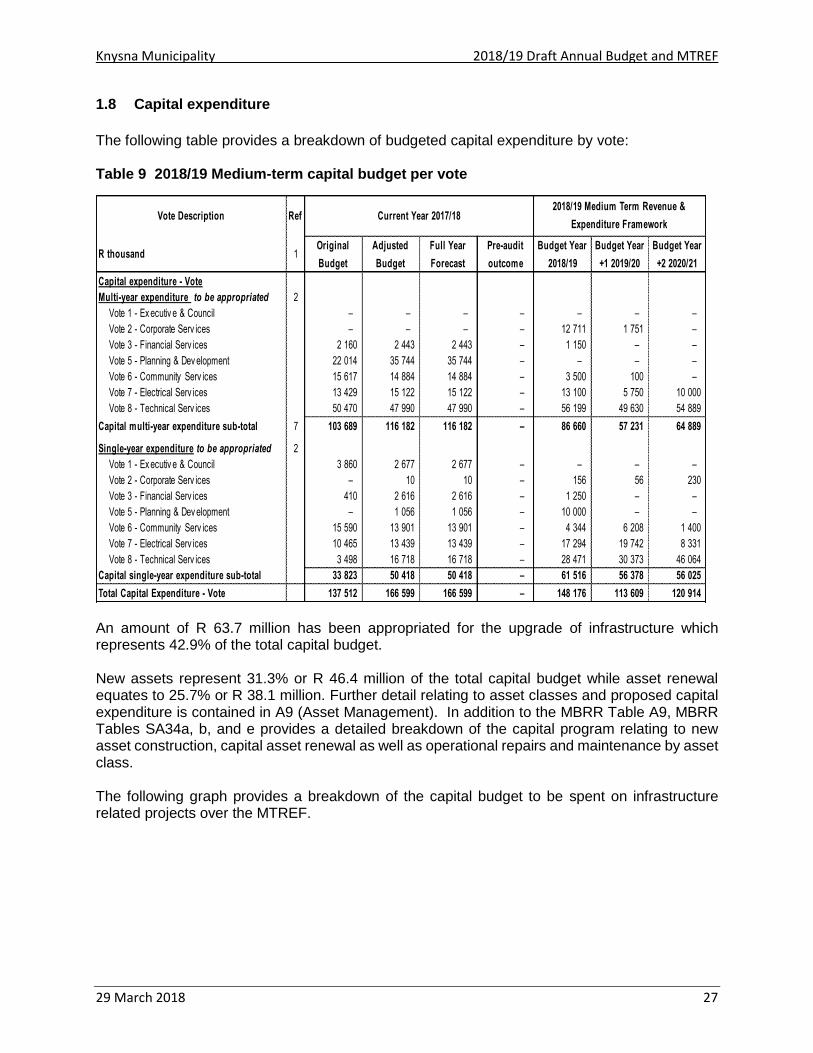
Knysna Municipality 2018/19 Draft Annual Budget and MTREF
29 March 2018 27
1.8 Capital expenditure
The following table provides a breakdown of budgeted capital expenditure by vote: Table 9 2018/19 Medium-term capital budget per vote
An amount of R 63.7 million has been appropriated for the upgrade of infrastructure which represents 42.9% of the total capital budget. New assets represent 31.3% or R 46.4 million of the total capital budget while asset renewal equates to 25.7% or R 38.1 million. Further detail relating to asset classes and proposed capital expenditure is contained in A9 (Asset Management). In addition to the MBRR Table A9, MBRR Tables SA34a, b, and e provides a detailed breakdown of the capital program relating to new asset construction, capital asset renewal as well as operational repairs and maintenance by asset class. The following graph provides a breakdown of the capital budget to be spent on infrastructure related projects over the MTREF.
Vote Description Ref
R thousand 1Original
Budget
Adjusted
Budget
Full Year
Forecast
Pre-audit
outcome
Budget Year
2018/19
Budget Year
+1 2019/20
Budget Year
+2 2020/21
Capital expenditure - Vote
Multi-year expenditure to be appropriated 2
Vote 1 - Ex ecutiv e & Council – – – – – – –
Vote 2 - Corporate Serv ices – – – – 12 711 1 751 –
Vote 3 - Financial Serv ices 2 160 2 443 2 443 – 1 150 – –
Vote 5 - Planning & Dev elopment 22 014 35 744 35 744 – – – –
Vote 6 - Community Serv ices 15 617 14 884 14 884 – 3 500 100 –
Vote 7 - Electrical Serv ices 13 429 15 122 15 122 – 13 100 5 750 10 000
Vote 8 - Technical Serv ices 50 470 47 990 47 990 – 56 199 49 630 54 889
Capital multi-year expenditure sub-total 7 103 689 116 182 116 182 – 86 660 57 231 64 889
Single-year expenditure to be appropriated 2
Vote 1 - Ex ecutiv e & Council 3 860 2 677 2 677 – – – –
Vote 2 - Corporate Serv ices – 10 10 – 156 56 230
Vote 3 - Financial Serv ices 410 2 616 2 616 – 1 250 – –
Vote 5 - Planning & Dev elopment – 1 056 1 056 – 10 000 – –
Vote 6 - Community Serv ices 15 590 13 901 13 901 – 4 344 6 208 1 400
Vote 7 - Electrical Serv ices 10 465 13 439 13 439 – 17 294 19 742 8 331
Vote 8 - Technical Serv ices 3 498 16 718 16 718 – 28 471 30 373 46 064
Capital single-year expenditure sub-total 33 823 50 418 50 418 – 61 516 56 378 56 025
Total Capital Expenditure - Vote 137 512 166 599 166 599 – 148 176 113 609 120 914
2018/19 Medium Term Revenue &
Expenditure FrameworkCurrent Year 2017/18

Knysna Municipality 2018/19 Draft Annual Budget and MTREF
29 March 2018 28
Figure 5 Capital Infrastructure Program
1.9 Annual Budget Tables – Municipality
The following eighteen pages present the ten main budget tables as required in terms of section 8 of the Municipal Budget and Reporting Regulations. These tables set out the municipality’s 2018/19 budget and MTREF as tabled in Council. Each table is accompanied by explanatory notes on the facing page.
Original
Budget
2017/18
Adjusted
Budget
2017/18
Full Year
Forecast
2017/18
Pre-audit
outcome
2017/18
Budget Year
2018/19
Budget Year
+1 2019/20
Budget Year
+2 2020/21
Infrastructure - Road transport 23637 310 24079 587 24079 587 24079 587 19030 279 15243 043 12838 277
Infrastructure - Electricity 22874 000 28555 115 28555 115 28555 115 29694 000 24492 000 18331 000
Infrastructure - Water 26131 537 43748 984 43748 984 43748 984 38635 429 52318 842 75074 133
Infrastructure - Sanitation 28132 677 30306 180 30306 180 30306 180 27004 585 9840 281 10240 281
Infrastructure - Other 1200 000 1200 000 1200 000 1200 000 1530 000 600 000 600 000
10
20
30
40
50
60
70
80
R M
illi
on

Knysna Municipality 2018/19 Draft Annual Budget and MTREF
29 March 2018 29
Table 10 MBRR Table A1 - Budget Summary
Description
R thousandsOriginal
Budget
Adjusted
Budget
Full Year
Forecast
Pre-audit
outcome
Budget Year
2018/19
Budget Year
+1 2019/20
Budget Year
+2 2020/21
Financial Performance
Property rates 200 734 205 069 205 069 – 209 581 217 964 226 683
Serv ice charges 344 605 337 057 337 057 – 362 835 390 753 420 890
Inv estment rev enue 9 700 11 200 11 200 – 11 760 11 760 11 760
Transfers recognised - operational 140 596 134 896 134 896 – 152 800 145 409 119 970
Other ow n rev enue 117 522 140 920 140 920 – 148 830 155 641 163 863
Total Revenue (excluding capital transfers
and contributions)
813 157 829 143 829 143 – 885 805 921 528 943 165
Employ ee costs 220 119 239 827 239 827 – 243 042 255 129 268 905
Remuneration of councillors 8 302 8 942 8 942 – 8 653 9 120 9 612
Depreciation & asset impairment 30 899 30 899 30 899 – 32 041 32 162 32 127
Finance charges 19 502 23 322 23 322 – 33 208 34 545 36 001
Materials and bulk purchases 189 371 213 901 213 901 – 228 744 240 000 251 811
Transfers and grants 2 280 8 415 8 415 – 6 958 692 692
Other ex penditure 341 508 329 100 329 100 – 336 274 282 170 296 965
Total Expenditure 811 980 854 405 854 405 – 888 921 853 817 896 114
Surplus/(Deficit) 1 176 (25 263) (25 263) – (3 116) 67 711 47 051
Transfers and subsidies - capital (monetary allocations) (National / Prov incial and District)58 101 80 098 80 098 – 58 732 35 402 29 698
Contributions recognised - capital & contributed assets – – – – – – –
Surplus/(Deficit) after capital transfers &
contributions
59 277 54 835 54 835 – 55 617 103 113 76 749
Share of surplus/ (deficit) of associate – – – – – – –
Surplus/(Deficit) for the year 59 277 54 835 54 835 – 55 617 103 113 76 749
Capital expenditure & funds sources
Capital expenditure 137 512 166 599 166 599 – 148 176 113 609 120 914
Transfers recognised - capital 58 101 78 136 78 136 – 52 290 33 057 28 659
Public contributions & donations – – – – – – –
Borrow ing 38 570 35 033 35 033 – 65 994 52 135 62 987
Internally generated funds 40 842 53 431 53 431 – 29 892 28 417 29 267
Total sources of capital funds 137 512 166 599 166 599 – 148 176 113 609 120 914
Financial position
Total current assets 268 125 212 995 212 995 – 222 317 302 027 359 816
Total non current assets 1 263 620 1 191 675 1 191 675 – 1 307 809 1 389 256 1 478 043
Total current liabilities 150 512 164 396 164 396 – 175 671 188 024 201 558
Total non current liabilities 259 247 287 624 287 624 – 346 189 391 879 448 171
Community w ealth/Equity 1 141 044 952 650 952 650 – 1 008 267 1 111 379 1 188 129
Cash flows
Net cash from (used) operating 143 546 100 116 100 116 – 100 107 150 011 124 599
Net cash from (used) inv esting (137 012) (163 367) (163 367) – (144 103) (110 619) (117 616)
Net cash from (used) financing 25 183 21 639 21 639 – 51 553 38 274 48 444
Cash/cash equivalents at the year end 107 284 66 601 66 601 – 74 157 151 822 207 249
Cash backing/surplus reconciliation
Cash and inv estments av ailable 134 414 96 950 96 950 – 104 500 182 165 237 592
Application of cash and inv estments 77 654 70 053 70 053 – 79 486 89 647 100 695
Balance - surplus (shortfall) 56 760 26 897 26 897 – 25 013 92 518 136 897
Asset management
Asset register summary (WDV) 1 253 584 1 278 313 1 278 313 1 426 489 1 540 098 1 661 012
Depreciation 30 899 30 899 30 899 – – –
Renew al of Ex isting Assets 53 462 37 554 37 554 38 115 25 241 31 297
Repairs and Maintenance 71 325 62 643 62 643 61 372 70 364 74 234
Free services
Cost of Free Basic Serv ices prov ided 14 398 14 527 14 527 – – – –
Rev enue cost of free serv ices prov ided 63 729 19 956 19 956 36 081 36 081 38 329 40 573
Households below minimum service level
Water: 2 – – – – – –
Sanitation/sew erage: 1 – – – – – –
Energy : 1 – – – – – –
Refuse: 2 – – – – – –
2018/19 Medium Term Revenue &
Expenditure FrameworkCurrent Year 2017/18

Knysna Municipality 2018/19 Draft Annual Budget and MTREF
29 March 2018 30
Explanatory notes to MBRR Table A1 - Budget Summary 1. Table A1 is a budget summary and provides a concise overview of Knysna Municipality’s
budget from all of the major financial perspectives (operating, capital expenditure, financial position, cash flow, and MFMA funding compliance).
2. The table provides an overview of the amounts approved by Council for operating performance, resources deployed to capital expenditure, financial position, cash and funding compliance, as well as the municipality’s commitment to eliminating basic service delivery backlogs.
3. Financial management reforms emphasize the importance of the municipal budget being funded. This requires the simultaneous assessment of the Financial Performance, Financial Position and Cash Flow Budgets, along with the Capital Budget. The Budget Summary provides the key information in this regard:
a. The operating surplus/deficit (after Total Expenditure) is positive over the MTREF b. Capital expenditure is balanced by capital funding sources, of which
i. Transfers recognized is reflected on the Financial Performance Budget; ii. Borrowing is incorporated in the net cash from financing on the Cash Flow
Budget iii. Internally generated funds are financed from the anticipated operating surplus
to be realized at 30 June 2018. The amount is incorporated in the Net cash from investing on the Cash Flow Budget. The fact that the municipality’s cash flow remains positive, and is improving indicates that the necessary cash resources are gradually becoming available to fund the Capital Budget.
4. The Cash backing/surplus reconciliation shows that in previous financial years the municipality was not paying much attention to managing this aspect of its finances, and consequently many of its obligations were not cash-backed. This has then placed the municipality in a very vulnerable financial position, with the improve revenue collection this situation has started to improve as all current provisions are 100% backed by cash. Consequently, Council needs to ensure adequate cash-backing for all material obligations in accordance with the Funding and Reserves Policy. This cannot be achieved in one financial year. But over the MTREF there is progressive improvement in the level of cash-backing of obligations. It is anticipated that the goal of having all obligations cash-back may exceed the MTREF as service delivery requirements also need to receive the appropriate attention. The long term financial plan will greatly assist in this regard and council need to adopt this policy.
5. Even though the Council is placing great emphasis on securing the financial sustainability of the municipality, this is not being done at the expense of services to the poor. The section of Free Services shows that the amount spent on Free Basic Services and the revenue cost of free services provided by the municipality continues to increase.
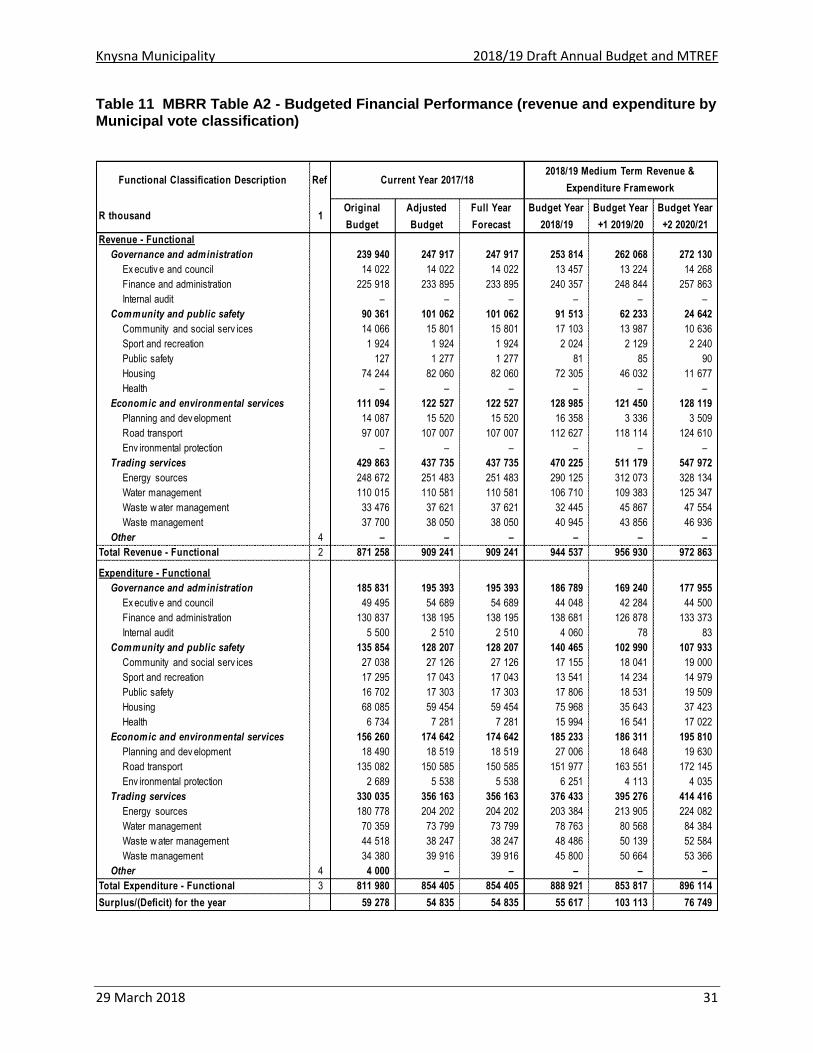
Knysna Municipality 2018/19 Draft Annual Budget and MTREF
29 March 2018 31
Table 11 MBRR Table A2 - Budgeted Financial Performance (revenue and expenditure by Municipal vote classification)
Functional Classification Description Ref
R thousand 1Original
Budget
Adjusted
Budget
Full Year
Forecast
Budget Year
2018/19
Budget Year
+1 2019/20
Budget Year
+2 2020/21
Revenue - Functional
Governance and administration 239 940 247 917 247 917 253 814 262 068 272 130
Ex ecutiv e and council 14 022 14 022 14 022 13 457 13 224 14 268
Finance and administration 225 918 233 895 233 895 240 357 248 844 257 863
Internal audit – – – – – –
Community and public safety 90 361 101 062 101 062 91 513 62 233 24 642
Community and social serv ices 14 066 15 801 15 801 17 103 13 987 10 636
Sport and recreation 1 924 1 924 1 924 2 024 2 129 2 240
Public safety 127 1 277 1 277 81 85 90
Housing 74 244 82 060 82 060 72 305 46 032 11 677
Health – – – – – –
Economic and environmental services 111 094 122 527 122 527 128 985 121 450 128 119
Planning and dev elopment 14 087 15 520 15 520 16 358 3 336 3 509
Road transport 97 007 107 007 107 007 112 627 118 114 124 610
Env ironmental protection – – – – – –
Trading services 429 863 437 735 437 735 470 225 511 179 547 972
Energy sources 248 672 251 483 251 483 290 125 312 073 328 134
Water management 110 015 110 581 110 581 106 710 109 383 125 347
Waste w ater management 33 476 37 621 37 621 32 445 45 867 47 554
Waste management 37 700 38 050 38 050 40 945 43 856 46 936
Other 4 – – – – – –
Total Revenue - Functional 2 871 258 909 241 909 241 944 537 956 930 972 863
Expenditure - Functional
Governance and administration 185 831 195 393 195 393 186 789 169 240 177 955
Ex ecutiv e and council 49 495 54 689 54 689 44 048 42 284 44 500
Finance and administration 130 837 138 195 138 195 138 681 126 878 133 373
Internal audit 5 500 2 510 2 510 4 060 78 83
Community and public safety 135 854 128 207 128 207 140 465 102 990 107 933
Community and social serv ices 27 038 27 126 27 126 17 155 18 041 19 000
Sport and recreation 17 295 17 043 17 043 13 541 14 234 14 979
Public safety 16 702 17 303 17 303 17 806 18 531 19 509
Housing 68 085 59 454 59 454 75 968 35 643 37 423
Health 6 734 7 281 7 281 15 994 16 541 17 022
Economic and environmental services 156 260 174 642 174 642 185 233 186 311 195 810
Planning and dev elopment 18 490 18 519 18 519 27 006 18 648 19 630
Road transport 135 082 150 585 150 585 151 977 163 551 172 145
Env ironmental protection 2 689 5 538 5 538 6 251 4 113 4 035
Trading services 330 035 356 163 356 163 376 433 395 276 414 416
Energy sources 180 778 204 202 204 202 203 384 213 905 224 082
Water management 70 359 73 799 73 799 78 763 80 568 84 384
Waste w ater management 44 518 38 247 38 247 48 486 50 139 52 584
Waste management 34 380 39 916 39 916 45 800 50 664 53 366
Other 4 4 000 – – – – –
Total Expenditure - Functional 3 811 980 854 405 854 405 888 921 853 817 896 114
Surplus/(Deficit) for the year 59 278 54 835 54 835 55 617 103 113 76 749
Current Year 2017/182018/19 Medium Term Revenue &
Expenditure Framework
Knysna Municipality 2018/19 Draft Annual Budget and MTREF
29 March 2018 32
Explanatory notes to MBRR Table A2 - Budgeted Financial Performance (revenue and expenditure by standard classification) 1. Table A2 is a view of the budgeted financial performance in relation to revenue and
expenditure per standard classification. The modified GFS standard classification divides the municipal services into 15 functional areas. Municipal revenue, operating expenditure and capital expenditure are then classified in terms if each of these functional areas which enables the National Treasury to compile ‘whole of government’ reports.
2. Note the Total Revenue on this table includes capital revenues (Transfers recognized – capital) and so does not balance to the operating revenue shown on Table A4.
3. Note that as a general principle the revenues for the Trading Services should exceed their expenditures. The table highlights that this is the case for Electricity, Water and Waste water as well as waste management function. Administrative functions have been charged to the respective service delivery departments and surpluses are absorbed by the allocation of administrative and other overhead cost associated with governance.
4. Other functions that show a deficit between revenue and expenditure are being financed from rates revenues and other revenue sources reflected under the Corporate Services.

Knysna Municipality 2018/19 Draft Annual Budget and MTREF
29 March 2018 33
Table 12 MBRR Table A3 - Budgeted Financial Performance (revenue and expenditure by municipal vote)
Explanatory notes to MBRR Table A3 - Budgeted Financial Performance (revenue and expenditure by municipal vote) 1. Table A3 is a view of the budgeted financial performance in relation to the revenue and
expenditure per municipal vote. This table facilitates the view of the budgeted operating performance in relation to the organizational structure of Knysna Municipality. This means it is possible to present the operating surplus or deficit of a vote.
Vote Description Ref
R thousandOriginal
Budget
Adjusted
Budget
Full Year
Forecast
Budget Year
2018/19
Budget Year
+1 2019/20
Budget Year
+2 2020/21
Revenue by Vote 1
Vote 1 - Ex ecutiv e & Council 14 022 14 022 14 022 13 457 13 224 14 268
Vote 2 - Corporate Serv ices 4 143 4 146 4 146 4 361 4 587 4 825
Vote 3 - Financial Serv ices 229 012 235 895 235 895 245 087 241 191 249 802
Vote 5 - Planning & Dev elopment 78 331 86 489 86 489 76 663 49 367 15 186
Vote 6 - Community Serv ices 153 103 166 338 166 338 175 232 181 237 187 512
Vote 7 - Electrical Serv ices 248 672 251 483 251 483 290 125 312 073 328 134
Vote 8 - Technical Serv ices 143 975 148 686 148 686 139 612 155 250 173 135
Total Revenue by Vote 2 871 258 907 059 907 059 944 537 956 930 972 863
Expenditure by Vote to be appropriated 1
Vote 1 - Ex ecutiv e & Council 36 918 54 030 54 030 48 100 33 810 35 562
Vote 2 - Corporate Serv ices 39 478 33 958 33 958 39 394 29 821 31 150
Vote 3 - Financial Serv ices 66 327 75 453 75 453 72 635 71 575 75 377
Vote 5 - Planning & Dev elopment 97 343 87 229 87 229 112 549 61 536 64 390
Vote 6 - Community Serv ices 208 769 218 370 218 370 202 170 215 144 226 655
Vote 7 - Electrical Serv ices 182 838 192 279 192 279 206 347 217 022 227 370
Vote 8 - Technical Serv ices 180 307 193 086 193 086 207 725 224 908 235 610
Total Expenditure by Vote 2 811 980 854 405 854 405 888 921 853 817 896 114
Surplus/(Deficit) for the year 2 59 278 52 653 52 653 55 617 103 113 76 749
Current Year 2017/182018/19 Medium Term Revenue &
Expenditure Framework
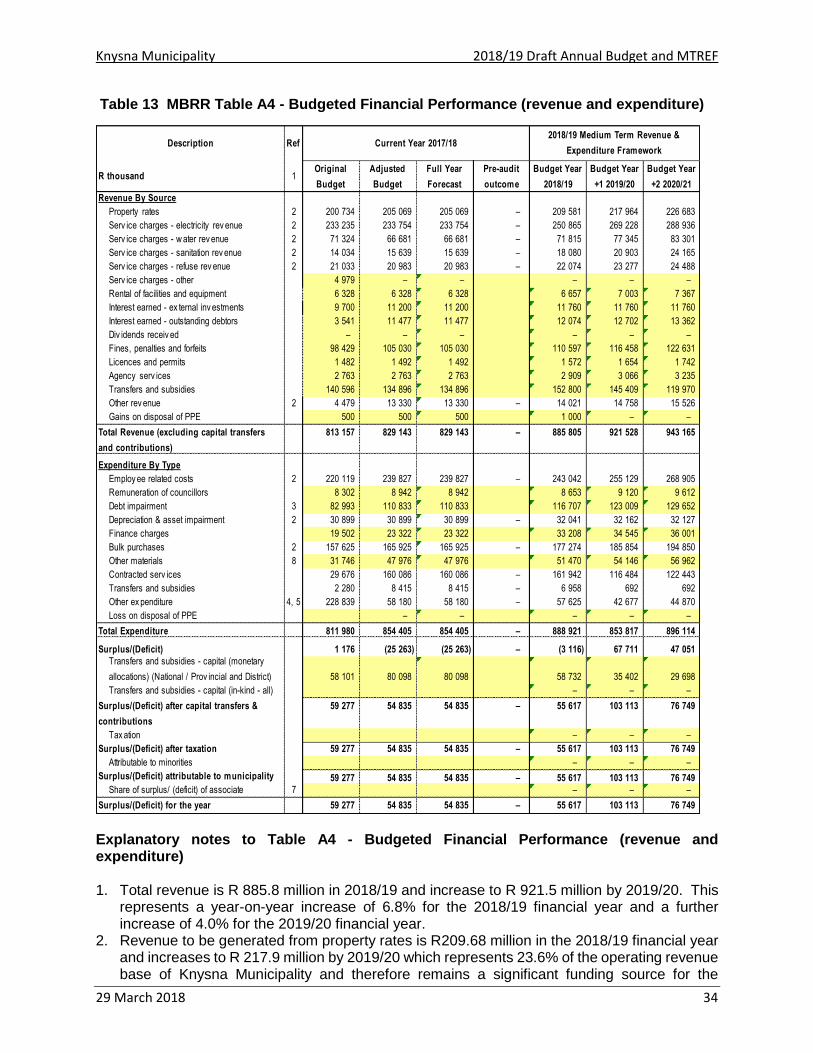
Knysna Municipality 2018/19 Draft Annual Budget and MTREF
29 March 2018 34
Table 13 MBRR Table A4 - Budgeted Financial Performance (revenue and expenditure)
Explanatory notes to Table A4 - Budgeted Financial Performance (revenue and expenditure) 1. Total revenue is R 885.8 million in 2018/19 and increase to R 921.5 million by 2019/20. This
represents a year-on-year increase of 6.8% for the 2018/19 financial year and a further increase of 4.0% for the 2019/20 financial year.
2. Revenue to be generated from property rates is R209.68 million in the 2018/19 financial year and increases to R 217.9 million by 2019/20 which represents 23.6% of the operating revenue base of Knysna Municipality and therefore remains a significant funding source for the
Description Ref
R thousand 1Original
Budget
Adjusted
Budget
Full Year
Forecast
Pre-audit
outcome
Budget Year
2018/19
Budget Year
+1 2019/20
Budget Year
+2 2020/21
Revenue By Source
Property rates 2 200 734 205 069 205 069 – 209 581 217 964 226 683
Serv ice charges - electricity rev enue 2 233 235 233 754 233 754 – 250 865 269 228 288 936
Serv ice charges - w ater rev enue 2 71 324 66 681 66 681 – 71 815 77 345 83 301
Serv ice charges - sanitation rev enue 2 14 034 15 639 15 639 – 18 080 20 903 24 165
Serv ice charges - refuse rev enue 2 21 033 20 983 20 983 – 22 074 23 277 24 488
Serv ice charges - other 4 979 – – – – –
Rental of facilities and equipment 6 328 6 328 6 328 6 657 7 003 7 367
Interest earned - ex ternal inv estments 9 700 11 200 11 200 11 760 11 760 11 760
Interest earned - outstanding debtors 3 541 11 477 11 477 12 074 12 702 13 362
Div idends receiv ed – – – – – –
Fines, penalties and forfeits 98 429 105 030 105 030 110 597 116 458 122 631
Licences and permits 1 482 1 492 1 492 1 572 1 654 1 742
Agency serv ices 2 763 2 763 2 763 2 909 3 066 3 235
Transfers and subsidies 140 596 134 896 134 896 152 800 145 409 119 970
Other rev enue 2 4 479 13 330 13 330 – 14 021 14 758 15 526
Gains on disposal of PPE 500 500 500 1 000 – –
Total Revenue (excluding capital transfers
and contributions)
813 157 829 143 829 143 – 885 805 921 528 943 165
Expenditure By Type
Employ ee related costs 2 220 119 239 827 239 827 – 243 042 255 129 268 905
Remuneration of councillors 8 302 8 942 8 942 8 653 9 120 9 612
Debt impairment 3 82 993 110 833 110 833 116 707 123 009 129 652
Depreciation & asset impairment 2 30 899 30 899 30 899 – 32 041 32 162 32 127
Finance charges 19 502 23 322 23 322 33 208 34 545 36 001
Bulk purchases 2 157 625 165 925 165 925 – 177 274 185 854 194 850
Other materials 8 31 746 47 976 47 976 51 470 54 146 56 962
Contracted serv ices 29 676 160 086 160 086 – 161 942 116 484 122 443
Transfers and subsidies 2 280 8 415 8 415 – 6 958 692 692
Other ex penditure 4, 5 228 839 58 180 58 180 – 57 625 42 677 44 870
Loss on disposal of PPE – – – – –
Total Expenditure 811 980 854 405 854 405 – 888 921 853 817 896 114
Surplus/(Deficit) 1 176 (25 263) (25 263) – (3 116) 67 711 47 051
Transfers and subsidies - capital (monetary
allocations) (National / Prov incial and District) 58 101 80 098 80 098 58 732 35 402 29 698
Transfers and subsidies - capital (in-kind - all) – – –
Surplus/(Deficit) after capital transfers &
contributions
59 277 54 835 54 835 – 55 617 103 113 76 749
Tax ation – – –
Surplus/(Deficit) after taxation 59 277 54 835 54 835 – 55 617 103 113 76 749
Attributable to minorities – – –
Surplus/(Deficit) attributable to municipality 59 277 54 835 54 835 – 55 617 103 113 76 749
Share of surplus/ (deficit) of associate 7 – – –
Surplus/(Deficit) for the year 59 277 54 835 54 835 – 55 617 103 113 76 749
2018/19 Medium Term Revenue &
Expenditure FrameworkCurrent Year 2017/18

Knysna Municipality 2018/19 Draft Annual Budget and MTREF
29 March 2018 35
municipality. It remains relatively constant over the medium-term and tariff increases have been factored in at 2.2%, 4.0% and 4.0% for each of the respective financial years of the MTREF.
3. Services charges relating to electricity, water, sanitation and refuse removal constitutes the biggest component of the revenue basket of Knysna Municipality totaling R 362.8 million for the 2018/19 financial year and increasing to R 390.8 million by 2019/20. For the 2018/19 financial year services charges amount to 40.9% of the total revenue base.
4. Transfers recognized – operating includes the local government equitable share and other operating grants from national and provincial government. It needs to be noted that the reduction in the operating grants from 2018/19 to 2020/21 is as a result in the reduction of the housing allocation. The equitable share increases by 10.6% for the 2018/19 year and by 9.6% and 9.62% for the 2019/20 and 2020/21 year respectively.
5. The following graph illustrates the major revenue items per type over the 7 year budget cycle.
Figure 6 Revenue by source
Transfers recognised -
operat ional
Service charges - water
revenue
Transfers recognised -
capital
Service charges - electric ity
revenueProperty rates
14/15 AUD
15/16 AUD
16/17 AUD
CY 17/18 BUD 140596 120 71324 000 58100 880 233235 000 200734 000
CY 17/18 ADJ 134896 338 66681 000 80097 935 233754 000 205069 400
CY 17/18 FCST 134896 338 66681 000 80097 935 233754 000 205069 400
CY 17/18 ACT 134896 338 66681 000 80097 935 233754 000 205069 400
Budget Year 18/19 152799 529 71815 437 58732 471 250864 793 209580 927
Budget Year +1 19/20 145409 071 77345 227 35401 929 269228 095 217964 164
Budget Year +2 20/21 119970 000 83300 810 29698 000 288935 592 226682 733
50000 000
100000 000
150000 000
200000 000
250000 000
300000 000
350000 000
Rm
Revenue by Source - Major - Chart A5(b) - source trend

Knysna Municipality 2018/19 Draft Annual Budget and MTREF
29 March 2018 36
6. The following graph illustrates the major expenditure items per type over the 7 year budget cycle.
Figure 7 Expenditure by type
7. Bulk purchases have significantly increased by 6.8% when compared to the adjusted budget. This category of expenditure further increases over the 2018/19 to 2019/20 period escalating from R 177.3 million to R 185.8 million. These increases can be attributed to the substantial increase in the cost of bulk electricity from Eskom.
8. Employee related costs, bulk purchases and contracted services are the main cost drivers within the municipality and alternative operational gains and efficiencies will have to be identified to lessen the impact of wage and bulk tariff increases in future years.
Depreciation & asset impairment Other expenditure Bulk purchases Employee related costs
14/15 AUD
15/16 AUD
16/17 AUD
CY 17/18 BUD 30898 600 228839 072 157625 000 220119 467
CY 17/18 ADJ 30898 600 58180 081 165925 000 239826 835
CY 17/18 FCST 30898 600 58180 081 165925 000 239826 835
CY 17/18 ACT 30898 600 58180 081 165925 000 239826 835
Budget Year 18/19 32041 300 57624 947 177274 270 243042 398
Budget Year +1 19/20 32162 100 42677 140 185854 345 255128 500
Budget Year +2 20/21 32127 400 44869 713 194849 695 268904 600
50000 000
100000 000
150000 000
200000 000
250000 000
300000 000
Rm
Expenditure by Type - Major - Chart A7

Knysna Municipality 2018/19 Draft Annual Budget and MTREF
29 March 2018 37
Table 14 MBRR Table A5 - Budgeted Capital Expenditure by vote, standard classification and funding source
Vote Description Ref
R thousand 1Original
Budget
Adjusted
Budget
Full Year
Forecast
Pre-audit
outcome
Budget Year
2018/19
Budget Year
+1 2019/20
Budget Year
+2 2020/21
Capital expenditure - Vote
Multi-year expenditure to be appropriated 2
Vote 1 - Ex ecutiv e & Council – – – – – – –
Vote 2 - Corporate Serv ices – – – – 12 711 1 751 –
Vote 3 - Financial Serv ices 2 160 2 443 2 443 – 1 150 – –
Vote 5 - Planning & Dev elopment 22 014 35 744 35 744 – – – –
Vote 6 - Community Serv ices 15 617 14 884 14 884 – 3 500 100 –
Vote 7 - Electrical Serv ices 13 429 15 122 15 122 – 13 100 5 750 10 000
Vote 8 - Technical Serv ices 50 470 47 990 47 990 – 56 199 49 630 54 889
Capital multi-year expenditure sub-total 7 103 689 116 182 116 182 – 86 660 57 231 64 889
Single-year expenditure to be appropriated 2
Vote 1 - Ex ecutiv e & Council 3 860 2 677 2 677 – – – –
Vote 2 - Corporate Serv ices – 10 10 – 156 56 230
Vote 3 - Financial Serv ices 410 2 616 2 616 – 1 250 – –
Vote 5 - Planning & Dev elopment – 1 056 1 056 – 10 000 – –
Vote 6 - Community Serv ices 15 590 13 901 13 901 – 4 344 6 208 1 400
Vote 7 - Electrical Serv ices 10 465 13 439 13 439 – 17 294 19 742 8 331
Vote 8 - Technical Serv ices 3 498 16 718 16 718 – 28 471 30 373 46 064
Capital single-year expenditure sub-total 33 823 50 418 50 418 – 61 516 56 378 56 025
Total Capital Expenditure - Vote 137 512 166 599 166 599 – 148 176 113 609 120 914
Capital Expenditure - Functional
Governance and administration 10 350 7 746 7 746 – 3 456 56 56
Ex ecutiv e and council 3 860 2 677 2 677 – – –
Finance and administration 6 490 5 069 5 069 3 456 56 56
Internal audit – – – – –
Community and public safety 40 131 59 885 59 885 – 28 125 7 459 974
Community and social serv ices 16 117 18 993 18 993 15 311 3 051 174
Sport and recreation 2 000 2 785 2 785 2 154 4 408 800
Public safety – 1 306 1 306 660 – –
Housing 22 014 36 800 36 800 10 000 – –
Health – – – – –
Economic and environmental services 14 253 4 903 4 903 – 18 530 12 330 13 084
Planning and dev elopment – – – – –
Road transport 14 253 4 903 4 903 18 530 12 330 13 084
Env ironmental protection – – – – –
Trading services 72 778 94 066 94 066 – 98 064 93 764 106 800
Energy sources 23 894 28 561 28 561 30 394 25 492 18 331
Water management 26 132 43 749 43 749 38 635 52 319 75 324
Waste w ater management 19 553 16 056 16 056 27 505 15 353 12 545
Waste management 3 200 5 700 5 700 1 530 600 600
Other – – – – –
Total Capital Expenditure - Functional 3 137 512 166 599 166 599 – 148 176 113 609 120 914
Funded by:
National Gov ernment 32 578 31 620 31 620 42 234 33 001 28 603
Prov incial Gov ernment 25 523 46 515 46 515 10 056 56 56
District Municipality – – – – –
Other transfers and grants – – – – –
Transfers recognised - capital 4 58 101 78 136 78 136 – 52 290 33 057 28 659
Public contributions & donations 5 – – – – –
Borrowing 6 38 570 35 033 35 033 65 994 52 135 62 987
Internally generated funds 40 842 53 431 53 431 29 892 28 417 29 267
Total Capital Funding 7 137 512 166 599 166 599 – 148 176 113 609 120 914
2018/19 Medium Term Revenue &
Expenditure FrameworkCurrent Year 2017/18

Knysna Municipality 2018/19 Draft Annual Budget and MTREF
29 March 2018 38
Explanatory notes to Table A5 - Budgeted Capital Expenditure by vote, standard classification and funding source 1. Table A5 is a breakdown of the capital program in relation to capital expenditure by municipal
vote (multi-year and single-year appropriations); capital expenditure by standard classification; and the funding sources necessary to fund the capital budget, including information on capital transfers from national and provincial departments.
2. The MFMA provides that a municipality may approve multi-year or single-year capital budget appropriations. In relation to multi-year appropriations. Multi-year projects are those projects that will not be commissioned at the end of the financial year but will stretch over more than one financial year.
3. Single-year capital expenditure has been appropriated at R 61.5 million for the 2018/19
financial year and relatively decreases over the MTREF at levels of R 56.4 million and R 56.0 million respectively for the two outer years.
4. Unlike multi-year capital appropriations, single-year appropriations relate to expenditure that
will be incurred in the specific budget year such as the procurement of vehicles and specialized tools and equipment. The budget appropriations for the two outer years are indicative allocations based on the departmental business plans and will be reviewed on an annual basis to assess the relevance of the expenditure in relation to the strategic objectives and service delivery imperatives of Knysna Municipality. For the purpose of funding assessment of the MTREF, these appropriations have been included but no commitments will be incurred against single-year appropriations for the two outer-years.
5. The capital program is funded from capital, national, provincial grants and transfers, borrowing
and internally generated funds from current year anticipated surpluses. For 2018/19, capital transfers totals R 52.3 million and decrease to R 33.0 million by 2019/20. Borrowing has been provided at R 65.9 million over the MTREF with internally generated funding totaling R 29.9 million in the 2018/19 financial year.

Knysna Municipality 2018/19 Draft Annual Budget and MTREF
29 March 2018 39
Table 15 MBRR Table A6 - Budgeted Financial Position
Description Ref
R thousandOriginal
Budget
Adjusted
Budget
Full Year
Forecast
Pre-audit
outcome
Budget Year
2018/19
Budget Year
+1 2019/20
Budget Year
+2 2020/21
ASSETS
Current assets
Cash 107 284 66 601 66 601 74 157 151 822 207 249
Call inv estment deposits 1 – – – – – – –
Consumer debtors 1 138 203 35 658 40 355 – 32 067 23 746 15 425
Other debtors 16 027 102 150 97 452 106 992 116 812 126 916
Current portion of long-term receiv ables 65 8 8 8 8 8
Inv entory 2 6 546 8 578 8 578 9 093 9 639 10 217
Total current assets 268 125 212 995 212 995 – 222 317 302 027 359 816
Non current assets
Long-term receiv ables 161 – – 7 7 7
Inv estments 27 131 30 349 30 349 30 343 30 343 30 343
Inv estment property 99 308 77 004 77 004 77 004 77 004 77 004
Inv estment in Associate – –
Property , plant and equipment 3 1 135 212 1 064 978 1 064 978 – 1 181 115 1 262 565 1 351 354
Agricultural – – – –
Biological – – – – –
Intangible 7 157 157 154 151 148
Other non-current assets 1 801 19 188 19 188 19 188 19 188 19 188
Total non current assets 1 263 620 1 191 675 1 191 675 – 1 307 809 1 389 256 1 478 043
TOTAL ASSETS 1 531 745 1 404 670 1 404 670 – 1 530 127 1 691 283 1 837 858
LIABILITIES
Current liabilities
Bank ov erdraft 1 – – – –
Borrow ing 4 15 210 14 947 14 947 – 14 947 14 947 14 947
Consumer deposits 12 147 12 024 12 024 12 793 13 612 14 483
Trade and other pay ables 4 96 544 109 392 109 392 – 119 696 131 015 143 450
Prov isions 26 612 28 033 28 033 28 236 28 450 28 678
Total current liabilities 150 512 164 396 164 396 – 175 671 188 024 201 558
Non current liabilities
Borrow ing 120 131 149 642 149 642 – 200 425 237 880 285 453
Prov isions 139 116 137 982 137 982 – 145 763 153 999 162 718
Total non current liabilities 259 247 287 624 287 624 – 346 189 391 879 448 171
TOTAL LIABILITIES 409 759 452 020 452 020 – 521 860 579 903 649 729
NET ASSETS 5 1 121 986 952 650 952 650 – 1 008 267 1 111 379 1 188 129
COMMUNITY WEALTH/EQUITY
Accumulated Surplus/(Deficit) 1 039 724 907 019 907 019 962 636 1 065 748 1 142 498
Reserv es 4 101 320 45 631 45 631 – 45 631 45 631 45 631
TOTAL COMMUNITY WEALTH/EQUITY 5 1 141 044 952 650 952 650 – 1 008 267 1 111 379 1 188 129
2018/19 Medium Term Revenue &
Expenditure FrameworkCurrent Year 2017/18

Knysna Municipality 2018/19 Draft Annual Budget and MTREF
29 March 2018 40
Explanatory notes to Table A6 - Budgeted Financial Position 1. Table A6 is consistent with international standards of good financial management practice,
and improves understandability for councilors and management of the impact of the budget on the statement of financial position (balance sheet).
2. This format of presenting the statement of financial position is aligned to GRAP1, which is
generally aligned to the international version which presents Assets Less Liabilities as “accounting” Community Wealth. The order of items within each group illustrates items in order of liquidity; i.e. assets readily converted to cash, or liabilities immediately required to be met from cash, appear first.
3. Table A6 is supported by an extensive table of notes (Table SA3) providing a detailed analysis
of the major components of a number of items, including: • Consumer debtors; • Property, plant and equipment; • Investment Property; • Trade and other payables; • Provisions non-current; • Changes in net assets; and • Reserves
4. The municipal equivalent of equity is Community Wealth/Equity. The justification is that
ownership and the net assets of the municipality belong to the community. 5. Any movement on the Budgeted Financial Performance or the Capital Budget will inevitably
impact on the Budgeted Financial Position. As an example, the collection rate assumption will impact on the cash position of the municipality and subsequently inform the level of cash and cash equivalents at year end. Similarly, the collection rate assumption should inform the budget appropriation for debt impairment which in turn would impact on the provision for bad debt. These budget and planning assumptions form a critical link in determining the applicability and relevance of the budget as well as the determination of ratios and financial indicators. In addition, the funding compliance assessment is informed directly by forecasting the statement of financial position.

Knysna Municipality 2018/19 Draft Annual Budget and MTREF
29 March 2018 41
Table 16 MBRR Table A7 - Budgeted Cash Flow Statement
Explanatory notes to Table A7 - Budgeted Cash Flow Statement 1. The budgeted cash flow statement is the first measurement in determining if the budget is
funded. 2. It shows the expected level of cash in-flow versus cash out-flow that is likely to result from the
implementation of the budget. 3. The cash levels of Knysna Municipality are gradually improving with an increase in cash and
cash equivalents for the 2018/19 financial period, anticipated to further increase in the 2019/20 financial year improving over the MTREF.
4. A cash surplus is expected over the MTREF indicating that the budget is cash backed in respect of cash in and out flows.
Description Ref
R thousandOriginal
Budget
Adjusted
Budget
Full Year
Forecast
Pre-audit
outcome
Budget Year
2018/19
Budget Year
+1 2019/20
Budget Year
+2 2020/21
CASH FLOW FROM OPERATING ACTIVITIES
Receipts
Property rates 190 205 194 816 194 816 199 102 207 066 215 349
Serv ice charges 326 529 320 204 320 204 344 693 371 216 399 845
Other rev enue 113 149 44 675 44 675 47 022 49 503 52 112
Gov ernment - operating 1 140 596 134 896 134 896 152 800 145 409 119 970
Gov ernment - capital 1 58 101 80 098 80 098 58 732 35 402 29 698
Interest 13 055 22 103 22 103 23 230 23 827 24 454
Div idends – – – – –
Payments
Suppliers and employ ees (676 307) (664 938) (664 938) (685 306) (647 175) (680 136)
Finance charges (19 502) (23 322) (23 322) (33 208) (34 545) (36 001)
Transfers and Grants 1 (2 280) (8 415) (8 415) (6 958) (692) (692)
NET CASH FROM/(USED) OPERATING ACTIVITIES 143 546 100 116 100 116 – 100 107 150 011 124 599
CASH FLOWS FROM INVESTING ACTIVITIES
Receipts
Proceeds on disposal of PPE 500 500 500 1 000 – –
Decrease (Increase) in non-current debtors – – – – –
Decrease (increase) other non-current receiv ables – – – – –
Decrease (increase) in non-current inv estments – – – – –
Payments
Capital assets (137 512) (163 867) (163 867) (145 103) (110 619) (117 616)
NET CASH FROM/(USED) INVESTING ACTIVITIES (137 012) (163 367) (163 367) – (144 103) (110 619) (117 616)
CASH FLOWS FROM FINANCING ACTIVITIES
Receipts
Short term loans – – – – –
Borrow ing long term/refinancing 38 570 35 033 35 033 65 994 52 135 62 987
Increase (decrease) in consumer deposits 731 723 723 770 819 871
Payments
Repay ment of borrow ing (14 117) (14 117) (14 117) (15 210) (14 680) (15 414)
NET CASH FROM/(USED) FINANCING ACTIVITIES 25 183 21 639 21 639 – 51 553 38 274 48 444
NET INCREASE/ (DECREASE) IN CASH HELD 31 717 (41 612) (41 612) – 7 556 77 665 55 427
Cash/cash equiv alents at the y ear begin: 2 75 566 108 213 108 213 66 601 74 157 151 822
Cash/cash equiv alents at the y ear end: 2 107 284 66 601 66 601 – 74 157 151 822 207 249
2018/19 Medium Term Revenue &
Expenditure FrameworkCurrent Year 2017/18

Knysna Municipality 2018/19 Draft Annual Budget and MTREF
29 March 2018 42
Table 17 MBRR Table A8 - Cash Backed Reserves/Accumulated Surplus Reconciliation
Explanatory notes to Table A8 - Cash Backed Reserves/Accumulated Surplus Reconciliation 1. The cash backed reserves/accumulated surplus reconciliation is aligned to the requirements
of MFMA Circular 42 – Funding a Municipal Budget. 2. In essence the table evaluates the funding levels of the budget by firstly forecasting the cash
and investments at year end and secondly reconciling the available funding to the liabilities/commitments that exist.
3. The outcome of this exercise would either be a surplus or deficit. A deficit would indicate that the applications exceed the cash and investments available and would be indicative of non-compliance with the MFMA requirements that the municipality’s budget must be “funded”.
4. There is compliance with section 18 of the MFMA because the budget is funded and there is no shortfall.
5. From the table it can be seen that for the financial period 2018/19 a surplus is reflected, it will however improve over the MTREF which is good indicator of a recovery.
6. Considering the requirements of section 18 of the MFMA, it can be concluded that from the draft 2018/19 MTREF the budget is funded.
Description Ref
R thousandOriginal
Budget
Adjusted
Budget
Full Year
Forecast
Pre-audit
outcome
Budget Year
2018/19
Budget Year
+1 2019/20
Budget Year
+2 2020/21
Cash and investments available
Cash/cash equiv alents at the y ear end 1 107 284 66 601 66 601 – 74 157 151 822 207 249
Other current inv estments > 90 day s – – – – – – –
Non current assets - Inv estments 1 27 131 30 349 30 349 – 30 343 30 343 30 343
Cash and investments available: 134 414 96 950 96 950 – 104 500 182 165 237 592
Application of cash and investments
Unspent conditional transfers – – – – – – –
Unspent borrow ing – – – – – –
Statutory requirements 2
Other w orking capital requirements 3 (50 277) (3 611) (3 611) – 5 620 15 566 26 386
Other prov isions 26 612 28 033 28 033 28 236 28 450 28 678
Long term inv estments committed 4 – – – – – – –
Reserv es to be backed by cash/inv estments 5 101 320 45 631 45 631 45 631 45 631 45 631
Total Application of cash and investments: 77 654 70 053 70 053 – 79 486 89 647 100 695
Surplus(shortfall) 56 760 26 897 26 897 – 25 013 92 518 136 897
2018/19 Medium Term Revenue &
Expenditure FrameworkCurrent Year 2017/18

Knysna Municipality 2018/19 Draft Annual Budget and MTREF
29 March 2018 43
Table 18 MBRR Table A9 - Asset Management
Description Ref
R thousandOriginal
Budget
Adjusted
Budget
Full Year
Forecast
Budget Year
2018/19
Budget Year
+1 2019/20
Budget Year
+2 2020/21
CAPITAL EXPENDITURE
Total New Assets 1 41 655 67 772 67 772 46 366 38 422 36 495
Roads Infrastructure 14 837 21 970 21 970 930 500 704
Storm water Infrastructure – 90 90 – 3 913 1 304
Electrical Infrastructure 5 132 8 239 8 239 17 244 15 202 12 831
Water Supply Infrastructure 3 000 6 215 6 215 7 420 9 500 17 500
Sanitation Infrastructure 11 000 15 204 15 204 2 000 – –
Solid Waste Infrastructure 400 400 400 730 600 600
Infrastructure 34 369 52 118 52 118 28 324 29 715 32 939
Community Facilities 4 186 3 344 3 344 1 776 1 751 –
Sport and Recreation Facilities – – – – – –
Community Assets 4 186 3 344 3 344 1 776 1 751 –
Housing 580 1 256 1 256 10 000 – –
Other Assets 580 1 256 1 256 10 000 – –
Computer Equipment – 1 048 1 048 1 000 – –
Furniture and Office Equipment 20 1 380 1 380 1 666 56 56
Machinery and Equipment – – – 600 – –
Transport Assets 2 500 8 627 8 627 – 6 900 3 500
Libraries – – – 3 000 – –
Total Renewal of Existing Assets 2 53 462 37 554 37 554 38 115 25 241 31 297
Roads Infrastructure 8 800 1 520 1 520 17 600 10 080 10 080
Electrical Infrastructure 10 842 9 077 9 077 7 500 3 000 4 300
Water Supply Infrastructure 18 546 18 546 18 546 12 815 10 961 15 617
Sanitation Infrastructure 5 624 4 288 4 288 – 1 000 1 200
Coastal Infrastructure – 53 53 200 200 100
Infrastructure 43 812 33 483 33 483 38 115 25 241 31 297
Community Facilities 1 000 948 948 – – –
Sport and Recreation Facilities 2 000 1 599 1 599 – – –
Community Assets 3 000 2 547 2 547 – – –
Operational Buildings 875 508 508 – – –
Housing – 961 961 – – –
Other Assets 875 1 470 1 470 – – –
Computer Equipment 1 285 54 54 – – –
Furniture and Office Equipment 580 – – – – –
Transport Assets 3 910 – – – – –
Current Year 2017/182018/19 Medium Term Revenue &
Expenditure Framework
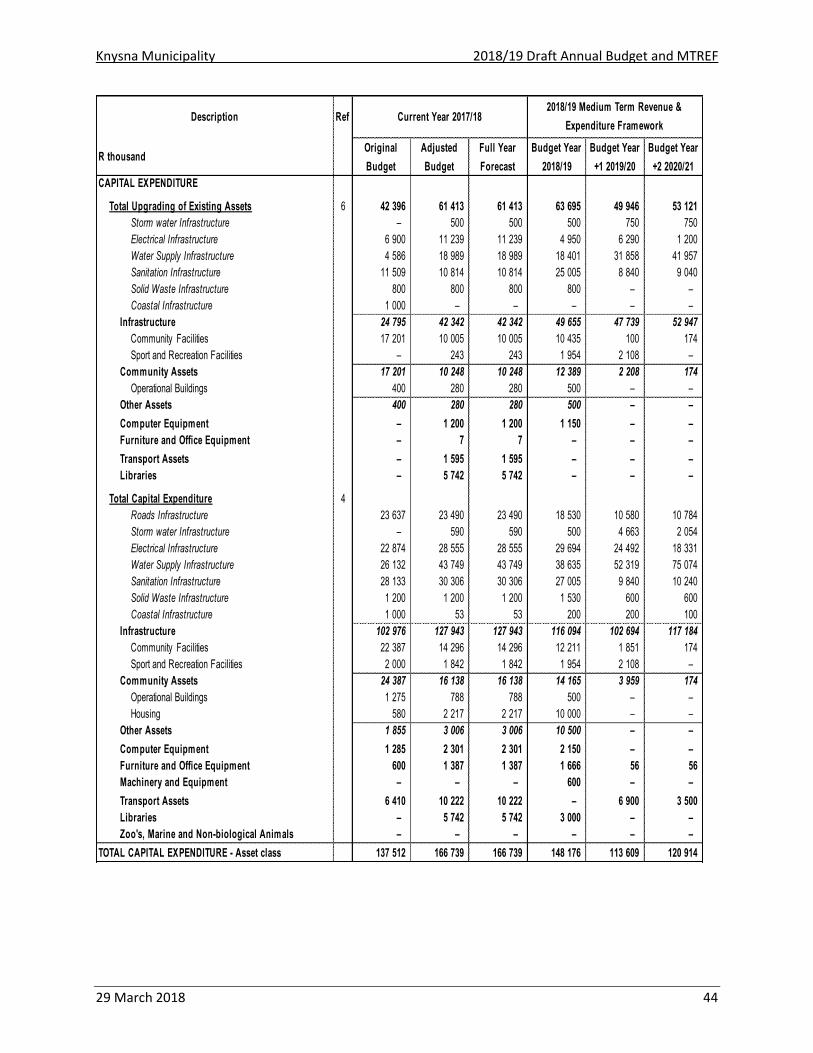
Knysna Municipality 2018/19 Draft Annual Budget and MTREF
29 March 2018 44
Description Ref
R thousandOriginal
Budget
Adjusted
Budget
Full Year
Forecast
Budget Year
2018/19
Budget Year
+1 2019/20
Budget Year
+2 2020/21
CAPITAL EXPENDITURE
Total Upgrading of Existing Assets 6 42 396 61 413 61 413 63 695 49 946 53 121
Storm water Infrastructure – 500 500 500 750 750
Electrical Infrastructure 6 900 11 239 11 239 4 950 6 290 1 200
Water Supply Infrastructure 4 586 18 989 18 989 18 401 31 858 41 957
Sanitation Infrastructure 11 509 10 814 10 814 25 005 8 840 9 040
Solid Waste Infrastructure 800 800 800 800 – –
Coastal Infrastructure 1 000 – – – – –
Infrastructure 24 795 42 342 42 342 49 655 47 739 52 947
Community Facilities 17 201 10 005 10 005 10 435 100 174
Sport and Recreation Facilities – 243 243 1 954 2 108 –
Community Assets 17 201 10 248 10 248 12 389 2 208 174
Operational Buildings 400 280 280 500 – –
Other Assets 400 280 280 500 – –
Computer Equipment – 1 200 1 200 1 150 – –
Furniture and Office Equipment – 7 7 – – –
Transport Assets – 1 595 1 595 – – –
Libraries – 5 742 5 742 – – –
Total Capital Expenditure 4
Roads Infrastructure 23 637 23 490 23 490 18 530 10 580 10 784
Storm water Infrastructure – 590 590 500 4 663 2 054
Electrical Infrastructure 22 874 28 555 28 555 29 694 24 492 18 331
Water Supply Infrastructure 26 132 43 749 43 749 38 635 52 319 75 074
Sanitation Infrastructure 28 133 30 306 30 306 27 005 9 840 10 240
Solid Waste Infrastructure 1 200 1 200 1 200 1 530 600 600
Coastal Infrastructure 1 000 53 53 200 200 100
Infrastructure 102 976 127 943 127 943 116 094 102 694 117 184
Community Facilities 22 387 14 296 14 296 12 211 1 851 174
Sport and Recreation Facilities 2 000 1 842 1 842 1 954 2 108 –
Community Assets 24 387 16 138 16 138 14 165 3 959 174
Operational Buildings 1 275 788 788 500 – –
Housing 580 2 217 2 217 10 000 – –
Other Assets 1 855 3 006 3 006 10 500 – –
Computer Equipment 1 285 2 301 2 301 2 150 – –
Furniture and Office Equipment 600 1 387 1 387 1 666 56 56
Machinery and Equipment – – – 600 – –
Transport Assets 6 410 10 222 10 222 – 6 900 3 500
Libraries – 5 742 5 742 3 000 – –
Zoo's, Marine and Non-biological Animals – – – – – –
TOTAL CAPITAL EXPENDITURE - Asset class 137 512 166 739 166 739 148 176 113 609 120 914
Current Year 2017/182018/19 Medium Term Revenue &
Expenditure Framework

Knysna Municipality 2018/19 Draft Annual Budget and MTREF
29 March 2018 45
Description Ref
R thousandOriginal
Budget
Adjusted
Budget
Full Year
Forecast
Budget Year
2018/19
Budget Year
+1 2019/20
Budget Year
+2 2020/21
CAPITAL EXPENDITURE
ASSET REGISTER SUMMARY - PPE (WDV) 5
Roads Infrastructure 133 028 132 778 132 778 151 308 161 888 172 672
Storm water Infrastructure 1 075 1 075 1 075 1 575 6 238 8 292
Electrical Infrastructure 225 719 226 069 226 069 255 763 280 255 298 586
Water Supply Infrastructure 215 189 228 447 228 447 267 083 319 401 394 476
Sanitation Infrastructure 162 798 166 470 166 470 193 475 203 315 213 555
Solid Waste Infrastructure 1 652 1 652 1 652 3 182 3 782 4 382
Coastal Infrastructure 1 000 1 069 1 069 1 269 1 469 1 569
Information and Communication Infrastructure – – – – –
Infrastructure 740 461 757 561 757 561 873 655 976 349 1 093 533
Community Facilities 98 495 100 667 100 667 112 878 114 729 114 903
Sport and Recreation Facilities 16 203 16 748 16 748 18 703 20 810 20 810
Community Assets 114 698 117 415 117 415 131 581 135 540 135 714
Heritage Assets 19 057 19 057 19 057 19 057 19 057 19 057
Rev enue Generating 20 800 20 800 20 800 20 800 20 800 20 800
Non-rev enue Generating 78 508 78 508 78 508 78 508 78 508 78 508
Investment properties 99 308 99 308 99 308 99 308 99 308 99 308
Operational Buildings 218 406 218 406 218 406 218 906 218 906 218 906
Housing 580 1 541 1 541 11 541 11 541 11 541
Other Assets 218 986 219 948 219 948 230 448 230 448 230 448
Licences and Rights 7 7 7 7 7 7
Intangible Assets 7 7 7 7 7 7
Computer Equipment 5 766 5 646 5 646 7 796 7 796 7 796
Furniture and Office Equipment 4 490 4 575 4 575 6 241 6 297 6 353
Machinery and Equipment 9 788 9 788 9 788 10 388 10 388 10 388
Transport Assets 31 015 35 001 35 001 35 001 41 901 45 401
Libraries 10 008 10 008 10 008 13 008 13 008 13 008
Zoo's, Marine and Non-biological Animals – – – – –
TOTAL ASSET REGISTER SUMMARY - PPE (WDV) 5 1 253 584 1 278 313 1 278 313 1 426 489 1 540 098 1 661 012
EXPENDITURE OTHER ITEMS
Depreciation 7 30 899 30 899 30 899 – – –
Repairs and Maintenance by Asset Class 3 71 325 62 643 62 643 61 372 70 364 74 234
Roads Infrastructure 35 550 25 465 25 465 26 036 37 470 39 531
Storm water Infrastructure 1 000 1 000 1 000 1 053 1 054 1 112
Electrical Infrastructure 4 655 4 073 4 073 4 289 4 906 5 176
Water Supply Infrastructure 10 392 11 096 11 096 11 684 10 953 11 556
Sanitation Infrastructure 7 015 6 934 6 934 7 301 7 394 7 801
Solid Waste Infrastructure 810 830 830 874 921 972
Infrastructure 59 422 49 397 49 397 51 237 62 699 66 147
Community Facilities 2 458 2 419 2 419 168 177 186
Sport and Recreation Facilities 1 299 1 429 1 429 – – –
Community Assets 3 757 3 848 3 848 168 177 186
Operational Buildings 2 251 2 371 2 371 2 155 2 031 2 142
Housing 640 640 640 1 384 – –
Other Assets 2 891 3 011 3 011 3 539 2 031 2 142
Computer Equipment – 1 183 1 183 1 246 – –
Furniture and Office Equipment 27 32 32 3 0 0
Transport Assets 5 000 4 948 4 948 4 949 5 216 5 503
Libraries 228 223 223 229 242 255
TOTAL EXPENDITURE OTHER ITEMS 102 224 93 542 93 542 61 372 70 364 74 234
Renewal and upgrading of Existing Assets as % of total capex 69,7% 59,4% 59,4% 68,7% 66,2% 69,8%
Renewal and upgrading of Existing Assets as % of deprecn 310,2% 320,3% 320,3% 0,0% 0,0% 0,0%
R&M as a % of PPE 6,3% 5,9% 5,9% 5,2% 5,6% 5,5%
Renewal and upgrading and R&M as a % of PPE 13,0% 13,0% 13,0% 11,0% 9,0% 10,0%
Current Year 2017/182018/19 Medium Term Revenue &
Expenditure Framework

Knysna Municipality 2018/19 Draft Annual Budget and MTREF
29 March 2018 46
Explanatory notes to Table A9 - Asset Management
1. Table A9 provides an overview of municipal capital allocations to building new assets and the renewal of existing assets, as well as spending on repairs and maintenance by asset class.
2. National Treasury has recommended that municipalities should allocate at least 40% of their capital budget to the renewal of existing assets, and allocations to repairs and maintenance should be 8% of PPE. The Municipality does not meet these recommendations.
3. The following graph provides an analysis between depreciation and operational repairs and maintenance over the MTREF. It highlights Knysna Municipality’s strategy to address the maintenance backlog.

Knysna Municipality 2018/19 Draft Annual Budget and MTREF
29 March 2018 47
Table 19 MBRR Table A10 - Basic Service Delivery Measurement
Original
Budget
Adjusted
Budget
Full Year
Forecast
Budget Year
2018/19
Budget Year
+1 2019/20
Budget Year
+2 2020/21
Household service targets 1
Water:
Piped w ater inside dw elling 19 934 19 934 – 19 543 20 579 21 690
Piped w ater inside y ard (but not in dw elling) 3 463 3 463 – 3 395 3 575 3 768
Using public tap (at least min.serv ice lev el) 2 1 137 1 137 – 2 070 2 180 2 297
Other w ater supply (at least min.serv ice lev el) 4 – – – – – –
Minimum Service Level and Above sub-total 24 534 24 534 – 25 008 26 333 27 755
Using public tap (< min.serv ice lev el) 3 948 948 – – – –
Other w ater supply (< min.serv ice lev el) 4 948 948 – 869 915 964
No w ater supply – – – – – –
Below Minimum Service Level sub-total 1 896 1 896 – 869 915 964
Total number of households 5 26 430 26 430 – 25 877 27 248 28 720
Sanitation/sewerage:
Flush toilet (connected to sew erage) 21 655 21 655 – 23 940 25 209 26 570
Flush toilet (w ith septic tank) 2 741 2 741 – – – –
Chemical toilet 23 23 – – – –
Pit toilet (v entilated) 1 313 1 313 – 1 287 1 355 1 428
Other toilet prov isions (> min.serv ice lev el) – – – – – –
Minimum Service Level and Above sub-total 25 732 25 732 – 25 227 26 564 27 998
Bucket toilet 308 308 – 302 318 335
Other toilet prov isions (< min.serv ice lev el) 117 117 – 348 366 386
No toilet prov isions 238 238 – – – –
Below Minimum Service Level sub-total 663 663 – 650 684 721
Total number of households 5 26 395 26 395 – 25 877 27 248 28 720
Energy:
Electricity (at least min.serv ice lev el) 24 980 24 980 – 24 490 25 788 27 181
Electricity - prepaid (min.serv ice lev el) – – – – – –
Minimum Service Level and Above sub-total 24 980 24 980 – 24 490 25 788 27 181
Electricity (< min.serv ice lev el) – – – – – –
Electricity - prepaid (< min. serv ice lev el) – – – – – –
Other energy sources 1 414 1 414 – 95 100 105
Below Minimum Service Level sub-total 1 414 1 414 – 95 100 105
Total number of households 5 26 394 26 394 – 24 585 25 888 27 286
Refuse:
Remov ed at least once a w eek 24 563 24 563 – 24 081 25 357 26 727
Minimum Service Level and Above sub-total 24 563 24 563 – 24 081 25 357 26 727
Remov ed less frequently than once a w eek 764 764 – 749 789 831
Using communal refuse dump 338 338 – 331 349 367
Using ow n refuse dump 409 409 – 401 422 445
Other rubbish disposal 159 159 – 70 74 78
No rubbish disposal 162 162 – 156 164 173
Below Minimum Service Level sub-total 1 832 1 832 – 1 707 1 797 1 895
Total number of households 5 26 395 26 395 – 25 788 27 155 28 621
Current Year 2017/182018/19 Medium Term Revenue &
Expenditure FrameworkDescription Ref

Knysna Municipality 2018/19 Draft Annual Budget and MTREF
29 March 2018 48
Explanatory notes to Table A10 - Basic Service Delivery Measurement
1. Table A10 provides an overview of service delivery levels, including backlogs (below minimum service level), for each of the main services.
Original
Budget
Adjusted
Budget
Full Year
Forecast
Budget Year
2018/19
Budget Year
+1 2019/20
Budget Year
+2 2020/21
Cost of Free Basic Services provided - Formal Settlements (R'000) 8
Water (6 kilolitres per indigent household per month) 4 300 4 300 4 300 4 600 4 600 4 600
Sanitation (free sanitation serv ice to indigent households) 4 300 4 300 4 300 4 600 4 600 4 600
Electricity /other energy (50kw h per indigent household per month) 7 900 7 900 7 900 8 200 8 200 8 200
Refuse (remov ed once a w eek for indigent households) 7 900 7 900 7 900 8 200 8 200 8 200
Cost of Free Basic Services provided - Informal Formal Settlements (R'000) – – – – – –
Total cost of FBS provided 24 400 24 400 24 400 25 600 25 600 25 600
Highest level of free service provided per household
Property rates (R v alue threshold) 100 000 100 000 100 000 100 000 100 000 100 000
Water (kilolitres per household per month) 6 6 6 6 6 6
Sanitation (kilolitres per household per month)
Sanitation (Rand per household per month)
Electricity (kw h per household per month) 50 50 50 50 50 50
Refuse (av erage litres per w eek) 170 170 170 170 170 170
Revenue cost of subsidised services provided (R'000) 9
Property rates (tariff adjustment) ( impermissable values per section 17 of MPRA ) 15 15 15 15 15 15
Property rates ex emptions, reductions and rebates and impermissable values in
excess of section 17 of MPRA) 49 316 19 956 19 956 20 395 21 211 22 059
Water (in excess of 6 kilolitres per indigent household per month) 4 300 – – 8 130 8 756 9 431
Sanitation (in excess of free sanitation service to indigent households) 4 300 – – 1 314 1 693 1 958
Electricity /other energy (in excess of 50 kwh per indigent household per month) 7 900 – – 4 859 5 215 5 597
Refuse (in excess of one removal a week for indigent households) 7 900 – – 1 381 1 453 1 529
Municipal Housing - rental rebates
Housing - top structure subsidies 6
Other
Total revenue cost of subsidised services provided 73 731 19 971 19 971 36 096 38 344 40 588
Current Year 2017/182018/19 Medium Term Revenue &
Expenditure FrameworkDescription Ref

Knysna Municipality 2018/19 Draft Annual Budget and MTREF
29 March 2018 49
Part 2 – Supporting Documentation
1.10 Overview of the annual budget process
Political overview of the budget process
Section 53 of the MFMA stipulates that the Mayor should exercise general political guidance over
the budgeting process and must direct the drafting of the budget.
1.10.1 Budget Process Overview
In terms of section 21 of the MFMA the Mayor is required to table in Council ten months before the start of the new financial year, a time schedule that sets out the process to revise the IDP and prepare the budget. The Mayor tabled in Council the required IDP and budget time schedule in August 2017 with Key dates applicable to the process:
1.10.2 IDP and Service Delivery and Budget Implementation Plan
The 2018/19 MTREF is the first review of the fourth IDP Cycle and the consultation process commenced after the tabling of the IDP Process Plan and the Budget Time Schedule for the 2018/19 MTREF in August 2017. Knysna Municipality’s IDP is its principal strategic planning instrument, which directly guides and informs its planning, budget, management and development actions. This framework is rolled out into objectives, key performance indicators and targets for implementation which directly inform the Service Delivery and Budget Implementation Plan. The Process Plan includes the following key IDP processes and deliverables: • Registration of community needs; • Compilation of departmental business plans including key performance indicators and
targets; • Financial planning and budgeting process; • Public participation process; • Compilation of the SDBIP, and • The review of the performance management and monitoring processes. The IDP has been taken into a business and financial planning process leading up to the 2018/19 MTREF, based on the approved 2017/18 adjusted budget and Mid-Year Review. The planning process has subsequently been adjusted after considering the revised revenue projections and expenditure patterns contained in the approved adjustments budget. With the compilation of the 2018/19 MTREF, each department/function had to review the business planning process, including the setting of priorities and targets after reviewing the mid-year performance against the 2017/18 adjusted budget.

Knysna Municipality 2018/19 Draft Annual Budget and MTREF
29 March 2018 50
1.10.3 Financial Modeling and Key Planning Drivers
As part of the compilation of the 2018/19 MTREF, extensive financial analysis was undertaken for a variety of expenditure items and categories to ensure affordability and long-term financial sustainability. The following key factors and planning strategies have informed the compilation of the 2018/19 MTREF: • Growth in the Local Economy • Policy priorities and strategic objectives • Asset maintenance • Economic climate and trends (i.e. inflation, Eskom increases, household debt, migration
patterns as evident from Census survey of 2016) • Performance trends • The approved 2017/18 adjustments budget and Year to Date performance • Cash Flow Management Strategy • Debtor payment levels • Loan and investment possibilities • The need for tariff increases versus the ability of the community to pay for services; • Improved and sustainable service delivery In addition to the above, the contents of the National Treasury’s MFMA previous budget related Circulars and recent ones in Circular 89 and 91 have been taken into account in the planning and prioritisation process.
1.10.4 Community Consultation
The draft 2018/19 MTREF as tabled before Council today will be published in the local media and municipal notice boards, libraries and on the municipality’s website to afford the community the opportunity to provide input on the draft budget and to ensure transparency in the financial management processes of the municipality. The input received from the local community will be considered prior to the finalisation and submission of the final budget for approval by council end of May 2018.
1.11 Overview of alignment of annual budget with IDP The Constitution mandates local government with the responsibility to exercise local developmental and cooperative governance. The eradication of imbalances in South African society as highlighted in the National Development Plan can only be realized through a credible integrated developmental planning process. Knysna Municipality need to utilise integrated development planning as a method to plan future development in its areas and so find the best solutions to achieve sound long-term development goals. A municipal IDP provides a five-year strategic programme of action aimed at setting short, medium and long term strategic and budget priorities to create a development platform. An IDP is therefore a key instrument which municipalities use to provide vision, leadership and direction to all those that have a role to play in the development of a municipal area. The IDP enables municipalities to make the best use of scarce resources and speed up service delivery. This is the first review of the fourth IDP cycle of 5 years and it is of essence that all stakeholders actively participate in the IDP process in order to ensure appropriate priorities are linked to scarce funding sources.

Knysna Municipality 2018/19 Draft Annual Budget and MTREF
29 March 2018 51
One of the key objectives is therefore to ensure that there exists alignment between national and provincial priorities, policies and strategies and Knysna Municipality’s response to these requirements. The national and provincial priorities, policies and strategies of importance include amongst others: • Green Paper on National Strategic Planning of 2009; • The National Development Plan • Development Facilitation Act of 1995; • Provincial Growth and Development Strategy (GGDS); • National and Provincial spatial development perspectives; • National Key Performance Indicators (NKPIs); • Accelerated and Shared Growth Initiative (ASGISA); • National 2014 Vision; • National Spatial Development Perspective (NSDP) and SPLUMA

Knysna Municipality 2018/19 Draft Annual Budget and MTREF
29 March 2018 52
Table 20 IDP Strategic Objectives reconciled to revenue
Strategic Objective GoalGoal
Code
R thousand
Original
Budget
Adjusted
Budget
Full Year
Forecast
Budget Year
2018/19
Budget Year
+1 2019/20
Budget Year
+2 2020/21
To ensure the prov ision of bulk infrastructure and
basic serv ices through the upgrading and
replacement of ageing infrastructure, and the
ex pansion of new infrastructure.
BASIC SERVICE DELIVERY: 574 196 581 910 630 190 700 802 709 859
§ To create an enabling env ironment for socio-
economic grow th.
LOCAL ECONOMIC
DEVELOPMENT:
4 087 4 429 4 361 2 839 2 995
§ To encourage the inv olv ement of communities in
the matters of local gov ernment, through the
promotion of open channels of communication.
GOOD GOVERNANCE AND
PUBLIC PARTICIPATION:
14 022 14 032 13 467 14 234 15 278
§ To grow the rev enue base of the municipality MUNICIPAL FINANCIAL
VIABILITY AND
TRANSFORMATION:
217 498 223 191 236 937 203 553 214 551
§ To structure and manage the municipal
administration to ensure efficient serv ice deliv ery .
MUNICIPAL
TRANSFORMATION AND
ORGANISATIONAL
DEVELOPMENT:
3 166 5 580 4 112 1 968 1 551
To ensure the prov ision of bulk infrastructure and
basic serv ices through the upgrading and
replacement of ageing infrastructure, and the
ex pansion of new infrastructure.
BASIC SERVICE DELIVERY: 49 516 70 369 45 036 33 534 28 629
§ To structure and manage the municipal
administration to ensure efficient serv ice deliv ery .
MUNICIPAL
TRANSFORMATION AND
ORGANISATIONAL
DEVELOPMENT:
8 772 9 729 10 435 – –
Allocations to other priorities 2
Total Revenue (excluding capital transfers and contributions) 1 871 258 909 241 – 944 537 956 930 972 863
Current Year 2017/182018/19 Medium Term Revenue &
Expenditure FrameworkRef

Knysna Municipality 2018/19 Draft Annual Budget and MTREF
29 March 2018 53
Table 21 IDP Strategic Objectives reconciled to expenditure
In order to ensure integrated and focused service delivery between all spheres of government it was important for Knysna Municipality to align its budget priorities with that of national and provincial government. All spheres of government place a high priority on infrastructure development, economic development and job creation, efficient service delivery, poverty alleviation and building sound institutional arrangements.
Strategic Objective GoalGoal
Code
R thousand
Original
Budget
Adjusted
Budget
Full Year
Forecast
Budget Year
2018/19
Budget Year
+1 2019/20
Budget Year
+2 2020/21
§ To encourage the
inv olv ement of communities in
the matters of local
gov ernment, through the
GOOD GOVERNANCE AND
PUBLIC PARTICIPATION:
633 528 658 739 685 656 680 737 714 373
§ To structure and manage
the municipal administration to
ensure efficient serv ice
deliv ery .
MUNICIPAL
TRANSFORMATION AND
ORGANISATIONAL
DEVELOPMENT:
21 156 17 412 17 554 17 041 17 937
To ensure the prov ision of
bulk infrastructure and basic
serv ices through the
upgrading and replacement of
BASIC SERVICE DELIVERY: 51 205 60 590 68 563 44 411 46 627
§ To grow the rev enue base
of the municipality
MUNICIPAL FINANCIAL
VIABILITY AND
TRANSFORMATION:
42 579 38 912 44 383 48 712 51 340
§ To create an enabling
env ironment for socio-
economic grow th.
LOCAL ECONOMIC
DEVELOPMENT:
60 825 73 215 68 044 58 803 61 803
To promote a safe and healthy
env ironment through the
protection of our natural
resources.
BASIC SERVICE DELIVERY: 2 689 5 538 4 721 4 113 4 035
Allocations to other priorities
Total Expenditure 1 811 980 854 405 – 888 921 853 817 896 114
Current Year 2017/182018/19 Medium Term Revenue &
Expenditure FrameworkRef

Knysna Municipality 2018/19 Draft Annual Budget and MTREF
29 March 2018 54
Local priorities were identified as part of the IDP review process which is directly aligned to that of the national and provincial priorities. The key performance areas can be summarised as follows against the five strategic objectives:
1. Provision of quality basic services and infrastructure which includes, amongst others: o Provide electricity; o Provide water; o Provide sanitation; o Provide waste removal; o Provide housing; o Provide roads and storm water; o Provide public transport; o Provide city planning services; and o Maintaining the infrastructure of Knysna Municipality.
2. Economic growth and development that leads to sustainable job creation by:
o Ensuring there is spatial development framework for Knysna Municipality; o Ensuring planning processes function in accordance with set timeframes; o Facilitating the use of labour intensive approaches in the delivery of services and
the building of infrastructure.
3.1 Fight poverty and build clean, healthy, safe and sustainable communities: o Effective implementation of the Indigent Policy; o Extending waste removal services and ensuring an effective cleansing service; o Ensuring all waste water treatment works are operating optimally and retaining
green drop status; o Creating a safe environment for our communities in collaboration with the SAPS; o Ensuring safe working environments by effective enforcement of building and
health regulations; o Promote viable, sustainable communities through proper zoning; and o Promote environmental sustainability by protecting wetlands, the seashore and
key public open spaces.
3.2 Integrated Social Services for empowered and sustainable communities o Work with provincial departments to ensure the development of community
infrastructure such as schools and clinics is properly coordinated.
4. Foster participatory democracy and Batho Pele principles through a caring, accessible and accountable service by: o Optimizing effective community participation in the ward committee system; and o Implementing Batho Pele in the revenue management strategy.
5.1 Promote sound transparent and accountable governance through:
o Publishing the outcomes of all tender processes on the municipal website o Ensure a well-functioning audit- and oversight committee/ MPAC
5.2 Ensure financial sustainability through:
o Carefully evaluating all spending decisions o Limiting the use of consultants and reviewing the use of contracted services o Ensuring value for money spending in all procurement processes. o Continuing to implement the infrastructure renewal strategy and the repairs and
maintenance plan

Knysna Municipality 2018/19 Draft Annual Budget and MTREF
29 March 2018 55
5.3 Optimal institutional transformation to ensure capacity to achieve set objectives
o Implementation of the revised organizational structure to optimize the use of personnel;
In line with the MSA, the IDP constitutes a single, inclusive strategic plan for Knysna Municipality. The five-year programme responds to the development challenges and opportunities faced by the municipality by identifying the key performance areas to achieve the five the strategic objectives mentioned above. In addition to the five-year IDP, Knysna Municipality has embarked on an extensive planning and developmental strategy that will primarily focus on a longer-term horizon; 15 to 20 years. This process is necessary to influence the future development path and to set clear goals for the future development within the municipal area. The long term strategy needs to target future developmental opportunities in traditional dormitory settlements. It should provide direction to Knysna Municipality’s IDP, associated sectorial plans and strategies, and the allocation of resources from the municipality and other service delivery partners. A step in the right direction has been taken by developing a long term financial plan which not only takes into account financial analysis but broader analysis which includes condition of the infrastructure, social and economic trends.

Knysna Municipality 2018/19 Draft Annual Budget and MTREF
29 March 2018 56
Table 22 MBRR Table SA6 - Reconciliation between the IDP strategic objectives and budgeted capital expenditure
1.12 Measurable performance objectives and indicators Performance Management is a system intended to manage and monitor service delivery progress against the identified strategic objectives and priorities. In accordance with legislative requirements and good business practices as informed by the National Framework for Managing Programme Performance Information, Knysna Municipality has developed and implemented a performance management system of which system is constantly refined as the integrated planning process unfolds. The Municipality targets, monitors, assess and reviews organisational performance which in turn is directly linked to individual employee’s performance. At any given time within government, information from multiple years is being considered; plans and budgets for next year; implementation for the current year; and reporting on last year's performance. Although performance information is reported publicly during the last stage, the performance information process begins when policies are being developed, and continues through each of the planning, budgeting, implementation and reporting stages. The planning, budgeting and reporting cycle can be graphically illustrated as follows:
Strategic Objective GoalGoal
Code
R thousand
Original
Budget
Adjusted
Budget
Full Year
Forecast
Budget Year
2018/19
Budget Year
+1 2019/20
Budget Year
+2 2020/21
To ensure the prov ision of
bulk infrastructure and basic
serv ices through the
upgrading and replacement of
BASIC SERVICE DELIVERY: A 127 052 159 009 146 870 112 353 120 858
§ To create an enabling
env ironment for socio-
economic grow th.
LOCAL ECONOMIC
DEVELOPMENT:
B – –
§ To encourage the
inv olv ement of communities in
the matters of local
gov ernment, through the
GOOD GOVERNANCE AND
PUBLIC PARTICIPATION:
C 3 860 2 521 56 56 56
§ To grow the rev enue base
of the municipality
MUNICIPAL FINANCIAL
VIABILITY AND
TRANSFORMATION:
D 300 374
§ To structure and manage
the municipal administration to
ensure efficient serv ice
deliv ery .
MUNICIPAL
TRANSFORMATION AND
ORGANISATIONAL
DEVELOPMENT:
E 6 300 4 695 1 250 1 200
Allocations to other priorities 3
Total Capital Expenditure 1 137 512 166 599 – 148 176 113 609 120 914
Current Year 2017/182018/19 Medium Term Revenue &
Expenditure FrameworkRef

Knysna Municipality 2018/19 Draft Annual Budget and MTREF
29 March 2018 57
Figure 8 Planning, budgeting and reporting cycle
The performance of Knysna Municipality relates directly to the extent to which it has achieved success in realising its goals and objectives, complied with legislative requirements and meeting stakeholder expectations. Knysna Municipality therefore has adopted one integrated performance management system which encompasses: • Planning (setting goals, objectives, targets and benchmarks); • Monitoring (regular monitoring and checking on the progress against plan); • Measurement (indicators of success); • Review (identifying areas requiring change and improvement); • Reporting (what information, to whom, from whom, how often and for what purpose); and • Improvement (making changes where necessary).
The performance information concepts used by Knysna Municipality in its integrated performance management system are aligned to the Framework of Managing Programme Performance Information issued by the National Treasury:

Knysna Municipality 2018/19 Draft Annual Budget and MTREF
29 March 2018 58
The following table provides some of the main measurable performance objectives the municipality undertakes to achieve this financial year. Table 23 MBRR Table SA7 - Measurable performance objectives
WC048 Knysna - Supporting Table SA7 Measureable performance objectives
2014/15 2015/16 2016/17
Audited
Outcome
Audited
Outcome
Audited
Outcome
Original
Budget
Adjusted
Budget
Full Year
Forecast2018/19
Budget Year
+1 2019/20
Budget Year
+2 2020/21
Vote 1 - Council and Executive
Function 1 - Basic Services
Function 1 - Basic Services
The number of single residential properties with access to basic level of
electricity: The Indicator reflects the number of residential properties that the
Municipality is aware of which are connected to the municipal electrical
infrastructure network for both credit and prepaid metering . (A10) - Local
Government: Municipal Planning and Performance Management Regulations,
2001: Regulation10 (a) General Key performance indicators.
Number of registered consumers
on the Promun billing sy stem.
18,976 18,959 17,553 19,917 19,917 19,917 20,414 20,924 21,447
Sub-function 2 - Water Network Users
The number of single residential properties with Access to basic level of water:
The Indicator reflects the number of residential properties that the Municipality
is aware of which are connected to the municipal water infrastructure network
(A10) - Local Government: Municipal Planning and Performance
Regulations,2001: Regulation 10(a) General key performance indicators
Number of registered consumers
on the Promun billing sy stem.
15,932 14,489 15,105 15,223 15,223 15,223 15,603 15,923 16,321
Sub-function 3 - Sanitation ( Waste Water) Network Users
The number of single residential properties with access to basic level of
sanitation: The indicator reflects the number of residential properties that the
Municipality is aware of connected to the municipal waste water
(sanitation/sewerage) network irrespective of the number of water
closets(toilets). (A10)- Local Government: Municipal Planning and Performance
Management Regulations,2001: Regulation 10(a) General key performance
indicators
Number of registers domestic
consumers on the Promun billing
sy stem.
11,469 12,000 12,242 12,609 12,609 12,609 12,925 13,003 13,328
Sub-function 4 - Refuse (Solid Waste) Network Users
The number of single residential properties with level of solid waste removal:
The indicator reflects the number of single residential properties that the
Municipality is aware of which are receiving a weekly door to door refuse
removal service. This excludes cavant residential properties. (A10)- Local
Government Municipal Planning and Performance Management
Regulations,2001: Regulation 10 (a) General key performance indicator.
Number of registered domestic
consumers on the Promun billing
sy stem.
14,131 14,841 15,100 15,212 15,212 15,212 15,592 15,982 16,382
Sub-function 5 -Rebates Free Basic Service Electricity
The number of formalised single properties with access to free basic service:
ELECTRICY: This indicator relates to the Pre-Paid Electricity Tariff
Electrification Housing Scheme (Limited to 20A ) Limited to 400kW and first
50KWH free- Local Government: Municipal Planning and Performance
Management Regulations, 2001: Regulation 10(b) general Key performance
indicators.
Number of single residential
properties receiv ing free basic
Electricity as per indigent register
8,933 6,744 7,009 6,913 6,913 6,913 7,085 7,444 7,630
Sub-function 6 -
The number of formalised single properties with access to free basic service:
WATER: The indicator reflects the 100% social rebate granted in respect to the
annual water availability fee charged to qualifying home owners of single
residential properties. (A)-Local Government: Municipal Planning and
Performance Management Regulations, 2001: Regulation 10(b) General key
performance indicators.
Number of single residential
properties receiv ing free basic
Water as per indigent register
1,655 1,399 1,539 1,552 1,552 1,552 1,552 1,552 1,591
Description Unit of measurement
Current Year 2017\/182019/20 Medium Term Revenue &
Expenditure Framework

Knysna Municipality 2018/19 Draft Annual Budget and MTREF
29 March 2018 59
WC048 Knysna - Supporting Table SA7 Measureable performance objectives
2014/15 2015/16 2016/17
Audited
Outcome
Audited
Outcome
Audited
Outcome
Original
Budget
Adjusted
Budget
Full Year
Forecast2018/19
Budget Year
+1 2019/20
Budget Year
+2 2020/21
Vote 1 - Council and Executive
Sub-function 7 -
The number of formalised single properties with access to free basic service:
SANITATION / SEWERAGE: The indicator reflects the 100% social rebate
granted in respect to the annual water availability fee charged to qualifying
home owners of single residential properties. (A)-Local Government: Municipal
Planning and Performance Management Regulations, 2001: Regulation 10(b)
General key performance indicators.
Number of single residential
properties receiv ing free basic
Sanitation / Sew er as per indigent
register
1,655 1,399 1,539 1,552 1,552 1,552 1,552 1,552 1,591
Sub-function 8 -
The number of formalised single properties with access to free basic service:
SOLID WASTE / REFUSE: The indicator reflects the 100% social rebate
granted in respect to the annual water availability fee charged to qualifying
home owners of single residential properties. (A)-Local Government: Municipal
Planning and Performance Management Regulations, 2001: Regulation 10(b)
General key performance indicators.
Number of single residential
properties receiv ing free basic
Solid Waste / Refuse as per
indigent register
1,655 1,399 1,539 1,552 1,552 1,552 1,552 1,552 1,591
Function 2 -Local Economic Development (LED
Sub-function 1 - Expanded Public Works Programme (EPWP)
Number of Expanded Public Works Programme (EPWP) job opportunities
created by the organisation: The indicator measures the number of
opportunities created through EPWP. It is paid work created for an individual
on an EPWP project, within the employment conditions of the Code of Good
Practice for Special Public Works Programmes. Directorates should create
EPWP opportunities and report them to the EPWP administrator. The individual
target per directorate is reflected in the Director's scorecard. LGMP& PMR
2001: Regulation 10(d) General key performance indicator.
An EPWP w ork opportunity is paid
w ork created for an indiv idual on
an EPWP project for any period of
time, w ithin the employ ment
conditions of the Code of Good
Practice for Special Public Works
Programmes.
2,466 2,492 2,306 1,600 1,600 1,600 1,600 1,600 1,640
Function 3 - Financial Ratios
Sub-function 1 - Debt Coverage
Financial viability as expressed by the following ratio: Debt Coverage: The
ratio measures the ability to cover debt services payment with own revenue to
aid in determining the financial viability of the Municipality (SAB) LGMP and
PMR 2001: Regulation 10 (g) General key performance indicator.
(Numerator/denominator) Total
Rev enue-Less: grants
recognised/Debt serv ice pay ments
due
23.9 26.2 22.6 23.2 23.2 23.2 19.0 19.5 20.6
Sub-function 2 - Cost Coverage
Financial viability as expressed by the following ratio: Cost Coverage: To
calculate the ability to cover fixed cost with available cash to aid in
determining the financial viability of the Municipality(SAB)- Local Government:
MP&PMR 2001,Regulation 10(g) general key performance indicator.
(Numerator/denominator) Cash
and cash equiv alent &
Inv estments/Fix ed monthly cost
3.1 2.6 3.4 2.1 2.1 2.1 1.3 2.5 3.3
Sub-function 3 - Outstanding Service Debtors to Revenue
Financial viability as expressed by the following ratio: Outstanding Services
Debtors Revenue: To calculate the ration of service debtor to service revenue
to aid in determining the financial viability of the Municipality(SAB). Local
Government: Regulations,2001: Regulation 10(g) general key performance
indicator.
Total outstanding debtors / Total
serv ice rev enue
19.7 18.0 15.0 28.0 28.0 28.0 24.0 22.8 21.7
Description Unit of measurement
Current Year 2017\/182019/20 Medium Term Revenue &
Expenditure Framework
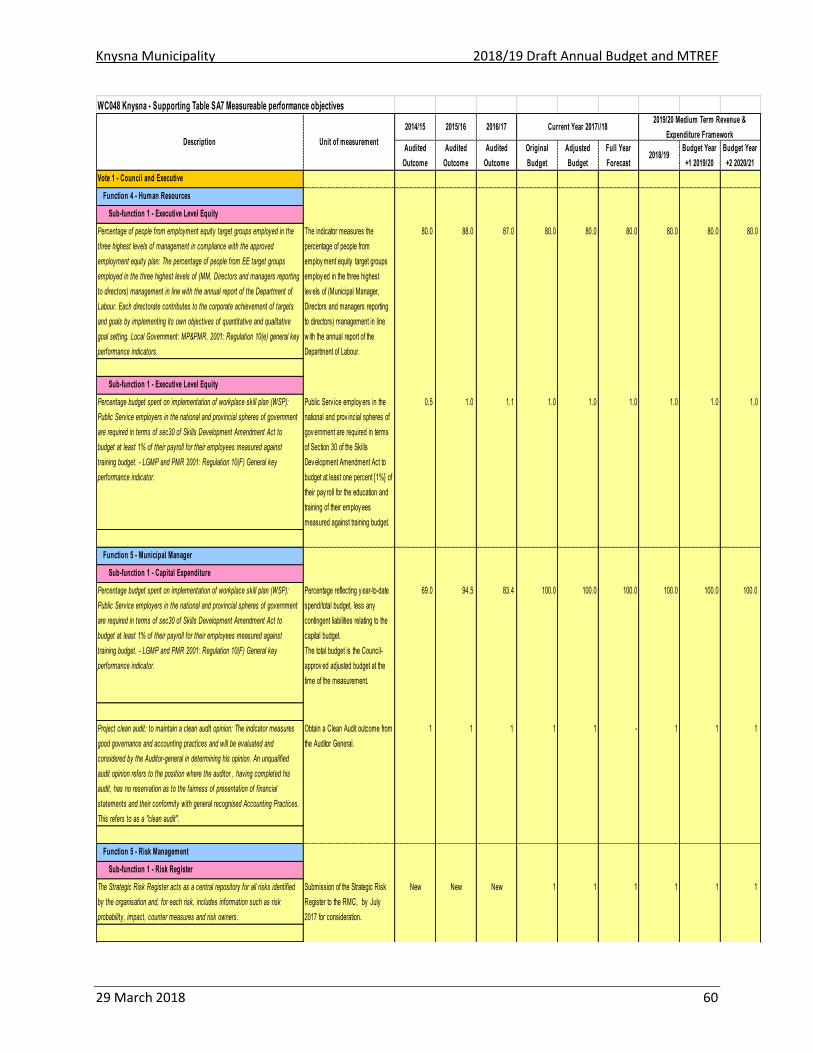
Knysna Municipality 2018/19 Draft Annual Budget and MTREF
29 March 2018 60
WC048 Knysna - Supporting Table SA7 Measureable performance objectives
2014/15 2015/16 2016/17
Audited
Outcome
Audited
Outcome
Audited
Outcome
Original
Budget
Adjusted
Budget
Full Year
Forecast2018/19
Budget Year
+1 2019/20
Budget Year
+2 2020/21
Vote 1 - Council and Executive
Function 4 - Human Resources
Sub-function 1 - Executive Level Equity
Percentage of people from employment equity target groups employed in the
three highest levels of management in compliance with the approved
employment equity plan: The percentage of people from EE target groups
employed in the three highest levels of (MM, Directors and managers reporting
to directors) management in line with the annual report of the Department of
Labour. Each directorate contributes to the corporate achievement of targets
and goals by implementing its own objectives of quantitative and qualitative
goal setting. Local Government: MP&PMR, 2001: Regulation 10(e) general key
performance indicators.
The indicator measures the
percentage of people from
employ ment equity target groups
employ ed in the three highest
lev els of (Municipal Manager,
Directors and managers reporting
to directors) management in line
w ith the annual report of the
Department of Labour.
80.0 88.0 87.0 80.0 80.0 80.0 80.0 80.0 80.0
Sub-function 1 - Executive Level Equity
Percentage budget spent on implementation of workplace skill plan (WSP):
Public Service employers in the national and provincial spheres of government
are required in terms of sec30 of Skills Development Amendment Act to
budget at least 1% of their payroll for their employees measured against
training budget. - LGMP and PMR 2001: Regulation 10(F) General key
performance indicator.
Public Serv ice employ ers in the
national and prov incial spheres of
gov ernment are required in terms
of Section 30 of the Skills
Dev elopment Amendment Act to
budget at least one percent [1%] of
their pay roll for the education and
training of their employ ees
measured against training budget.
0.5 1.0 1.1 1.0 1.0 1.0 1.0 1.0 1.0
Function 5 - Municipal Manager
Sub-function 1 - Capital Expenditure
Percentage budget spent on implementation of workplace skill plan (WSP):
Public Service employers in the national and provincial spheres of government
are required in terms of sec30 of Skills Development Amendment Act to
budget at least 1% of their payroll for their employees measured against
training budget. - LGMP and PMR 2001: Regulation 10(F) General key
performance indicator.
Percentage reflecting y ear-to-date
spend/total budget, less any
contingent liabilities relating to the
capital budget.
The total budget is the Council-
approv ed adjusted budget at the
time of the measurement.
69.0 94.5 83.4 100.0 100.0 100.0 100.0 100.0 100.0
Project clean audit: to maintain a clean audit opinion: The indicator measures
good governance and accounting practices and will be evaluated and
considered by the Auditor-general in determining his opinion. An unqualified
audit opinion refers to the position where the auditor , having completed his
audit, has no reservation as to the fairness of presentation of financial
statements and their conformity with general recognised Accounting Practices.
This refers to as a "clean audit".
Obtain a Clean Audit outcome from
the Auditor General.
1 1 1 1 1 - 1 1 1
Function 5 - Risk Management
Sub-function 1 - Risk Register
The Strategic Risk Register acts as a central repository for all risks identified
by the organisation and, for each risk, includes information such as risk
probability, impact, counter measures and risk owners.
Submission of the Strategic Risk
Register to the RMC, by July
2017 for consideration.
New New New 1 1 1 1 1 1
Description Unit of measurement
Current Year 2017\/182019/20 Medium Term Revenue &
Expenditure Framework
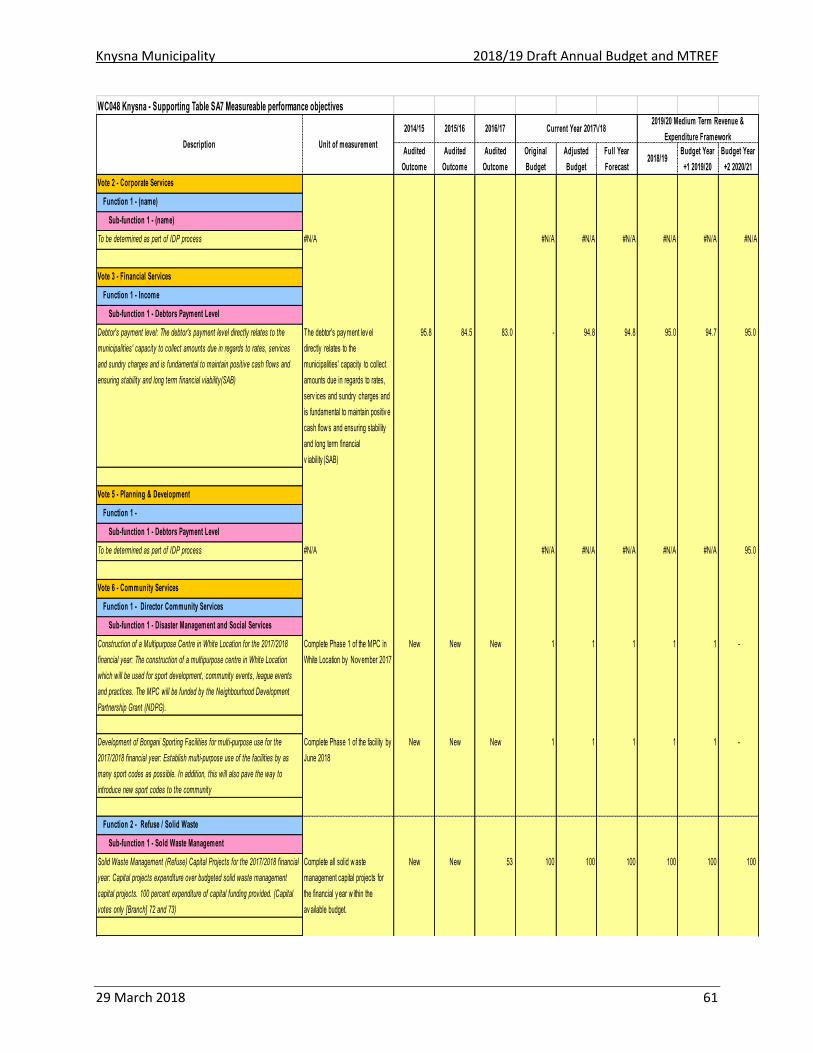
Knysna Municipality 2018/19 Draft Annual Budget and MTREF
29 March 2018 61
WC048 Knysna - Supporting Table SA7 Measureable performance objectives
2014/15 2015/16 2016/17
Audited
Outcome
Audited
Outcome
Audited
Outcome
Original
Budget
Adjusted
Budget
Full Year
Forecast2018/19
Budget Year
+1 2019/20
Budget Year
+2 2020/21
Vote 2 - Corporate Services
Function 1 - (name)
Sub-function 1 - (name)
To be determined as part of IDP process #N/A #N/A #N/A #N/A #N/A #N/A #N/A
Vote 3 - Financial Services
Function 1 - Income
Sub-function 1 - Debtors Payment Level
Debtor's payment level: The debtor's payment level directly relates to the
municipalities' capacity to collect amounts due in regards to rates, services
and sundry charges and is fundamental to maintain positive cash flows and
ensuring stability and long term financial viability(SAB)
The debtor's pay ment lev el
directly relates to the
municipalities' capacity to collect
amounts due in regards to rates,
serv ices and sundry charges and
is fundamental to maintain positiv e
cash flow s and ensuring stability
and long term financial
v iability (SAB)
95.8 84.5 83.0 - 94.8 94.8 95.0 94.7 95.0
Vote 5 - Planning & Development
Function 1 -
Sub-function 1 - Debtors Payment Level
To be determined as part of IDP process #N/A #N/A #N/A #N/A #N/A #N/A 95.0
Vote 6 - Community Services
Function 1 - Director Community Services
Sub-function 1 - Disaster Management and Social Services
Construction of a Multipurpose Centre in White Location for the 2017/2018
financial year: The construction of a multipurpose centre in White Location
which will be used for sport development, community events, league events
and practices. The MPC will be funded by the Neighbourhood Development
Partnership Grant (NDPG).
Complete Phase 1 of the MPC in
White Location by Nov ember 2017
New New New 1 1 1 1 1 -
Development of Bongani Sporting Facilities for multi-purpose use for the
2017/2018 financial year: Establish multi-purpose use of the facilities by as
many sport codes as possible. In addition, this will also pave the way to
introduce new sport codes to the community
Complete Phase 1 of the facility by
June 2018
New New New 1 1 1 1 1 -
Function 2 - Refuse / Solid Waste
Sub-function 1 - Sold Waste Management
Solid Waste Management (Refuse) Capital Projects for the 2017/2018 financial
year: Capital projects expenditure over budgeted solid waste management
capital projects. 100 percent expenditure of capital funding provided. (Capital
votes only [Branch] 72 and 73)
Complete all solid w aste
management capital projects for
the financial y ear w ithin the
av ailable budget.
New New 53 100 100 100 100 100 100
Description Unit of measurement
Current Year 2017\/182019/20 Medium Term Revenue &
Expenditure Framework

Knysna Municipality 2018/19 Draft Annual Budget and MTREF
29 March 2018 62
WC048 Knysna - Supporting Table SA7 Measureable performance objectives
2014/15 2015/16 2016/17
Audited
Outcome
Audited
Outcome
Audited
Outcome
Original
Budget
Adjusted
Budget
Full Year
Forecast2018/19
Budget Year
+1 2019/20
Budget Year
+2 2020/21
Vote 7 - Electricity
Function 1 - Electrical Services
Sub-function 1 - Electrical
Implementation of the approved projected Electrical Capital Projects for the
2017/2018 financial year:Capital projects expenditure over budgeted capital
projects. 100 percent expenditure of capital funding provided. (Capital votes
only [Branch] 76)
Complete all electrical capital
projects for the financial y ear
w ithin the av ailable budget.
New New 102 100 100 100 100 100 100
Vote 8 - Technical Services
Function 1 - Water
Sub-function 1 - Water Quality
Implementation of the approved projected Water Capital Projects for the
2017/2018 financial year: Capital projects expenditure over budgeted capital
projects. 100 percent expenditure of capital funding provided. (Capital votes
only [Branch] 92 and 93)
Complete all w ater capital projects
for the financial y ear w ithin the
av ailable budget.
New 70 98 100 100 100 100 100 100
Function 2 - PMU
Sub-function 1 - MIG Projects
Implement and monitor projects to utilize the MIG grant allocation to the
municipality for the 2017/2018 financial year: Capital MIG projects expenditure
over budgeted MIG capital projects. 100 percent expenditure of capital funding
provided (all MIG funded Capital expenditure)
Complete all MIG funded capital
projects for the financial y ear
w ithin the av ailable budget.
New 101 106 100 100 100 100 100 100
Function 3 - Public Works
Sub-function 1 - Streets
Implementation of the approved projected Roads and Stormwater Capital
Projects for the 2017/2018 financial year: Capital projects expenditure over
budgeted capital projects. 100 percent expenditure of capital funding provided.
(Capital votes only [Branch] 87 and 88).
Complete all roads and stormw ater
capital projects for the financial
y ear w ithin the av ailable budget.
New Nerw 103 100 100 100 100 100 100
Roads and Stormwater Maintenance for the 2017/2018 financial year: 100%
expenditure of the maintenance budget for Main Roads, Streets and
Stormwater (Operational votes [Branch] 86, 87 and 88 only sub-vote-no 22)
Complete all projected
maintenance for the financial y ear,
w ithin the av ailable budget
New New 102 100 100 100 100 100 100
And so on for the rest of the Votes
Description Unit of measurement
Current Year 2017\/182019/20 Medium Term Revenue &
Expenditure Framework
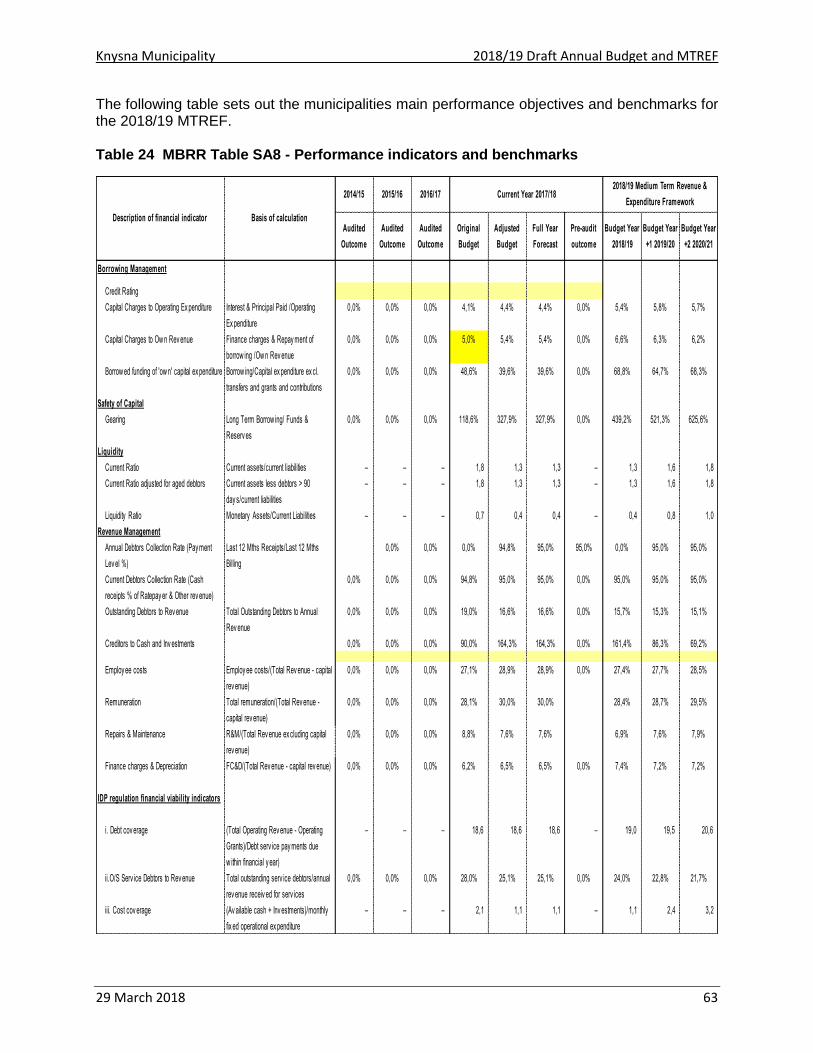
Knysna Municipality 2018/19 Draft Annual Budget and MTREF
29 March 2018 63
The following table sets out the municipalities main performance objectives and benchmarks for the 2018/19 MTREF. Table 24 MBRR Table SA8 - Performance indicators and benchmarks
2014/15 2015/16 2016/17
Audited
Outcome
Audited
Outcome
Audited
Outcome
Original
Budget
Adjusted
Budget
Full Year
Forecast
Pre-audit
outcome
Budget Year
2018/19
Budget Year
+1 2019/20
Budget Year
+2 2020/21
Borrowing Management
Credit Rating
Capital Charges to Operating Ex penditure Interest & Principal Paid /Operating
Ex penditure
0,0% 0,0% 0,0% 4,1% 4,4% 4,4% 0,0% 5,4% 5,8% 5,7%
Capital Charges to Ow n Rev enue Finance charges & Repay ment of
borrow ing /Ow n Rev enue
0,0% 0,0% 0,0% 5,0% 5,4% 5,4% 0,0% 6,6% 6,3% 6,2%
Borrow ed funding of 'ow n' capital ex penditure Borrow ing/Capital ex penditure ex cl.
transfers and grants and contributions
0,0% 0,0% 0,0% 48,6% 39,6% 39,6% 0,0% 68,8% 64,7% 68,3%
Safety of Capital
Gearing Long Term Borrow ing/ Funds &
Reserv es
0,0% 0,0% 0,0% 118,6% 327,9% 327,9% 0,0% 439,2% 521,3% 625,6%
Liquidity
Current Ratio Current assets/current liabilities – – – 1,8 1,3 1,3 – 1,3 1,6 1,8
Current Ratio adjusted for aged debtors Current assets less debtors > 90
day s/current liabilities
– – – 1,8 1,3 1,3 – 1,3 1,6 1,8
Liquidity Ratio Monetary Assets/Current Liabilities – – – 0,7 0,4 0,4 – 0,4 0,8 1,0
Revenue Management
Annual Debtors Collection Rate (Pay ment
Lev el %)
Last 12 Mths Receipts/Last 12 Mths
Billing
0,0% 0,0% 0,0% 94,8% 95,0% 95,0% 0,0% 95,0% 95,0%
Current Debtors Collection Rate (Cash
receipts % of Ratepay er & Other rev enue)
0,0% 0,0% 0,0% 94,8% 95,0% 95,0% 0,0% 95,0% 95,0% 95,0%
Outstanding Debtors to Rev enue Total Outstanding Debtors to Annual
Rev enue
0,0% 0,0% 0,0% 19,0% 16,6% 16,6% 0,0% 15,7% 15,3% 15,1%
Creditors to Cash and Inv estments 0,0% 0,0% 0,0% 90,0% 164,3% 164,3% 0,0% 161,4% 86,3% 69,2%
Employ ee costs Employ ee costs/(Total Rev enue - capital
rev enue)
0,0% 0,0% 0,0% 27,1% 28,9% 28,9% 0,0% 27,4% 27,7% 28,5%
Remuneration Total remuneration/(Total Rev enue -
capital rev enue)
0,0% 0,0% 0,0% 28,1% 30,0% 30,0% 28,4% 28,7% 29,5%
Repairs & Maintenance R&M/(Total Rev enue ex cluding capital
rev enue)
0,0% 0,0% 0,0% 8,8% 7,6% 7,6% 6,9% 7,6% 7,9%
Finance charges & Depreciation FC&D/(Total Rev enue - capital rev enue) 0,0% 0,0% 0,0% 6,2% 6,5% 6,5% 0,0% 7,4% 7,2% 7,2%
IDP regulation financial viability indicators
i. Debt cov erage (Total Operating Rev enue - Operating
Grants)/Debt serv ice pay ments due
w ithin financial y ear)
– – – 18,6 18,6 18,6 – 19,0 19,5 20,6
ii.O/S Serv ice Debtors to Rev enue Total outstanding serv ice debtors/annual
rev enue receiv ed for serv ices
0,0% 0,0% 0,0% 28,0% 25,1% 25,1% 0,0% 24,0% 22,8% 21,7%
iii. Cost cov erage (Av ailable cash + Inv estments)/monthly
fix ed operational ex penditure
– – – 2,1 1,1 1,1 – 1,1 2,4 3,2
Description of financial indicator
2018/19 Medium Term Revenue &
Expenditure Framework
Basis of calculation
Current Year 2017/18

Knysna Municipality 2018/19 Draft Annual Budget and MTREF
29 March 2018 64
1.12.1 Performance indicators and benchmarks
1.12.1.1 Borrowing Management
Capital expenditure in local government can be funded by capital grants, own-source revenue and long term borrowing. The ability of a municipality to raise long term borrowing is largely dependent on its creditworthiness and financial position. As with all other municipalities, Knysna Municipality’s borrowing strategy is primarily informed by the affordability of debt repayments. The structure of Knysna Municipality’s debt portfolio is dominated by annuity loans. The following financial performance indicators have formed part of the compilation of the 2018/19 MTREF: • Capital charges to operating expenditure are a measure of the cost of borrowing in relation
to the operating expenditure. It can be seen that the cost of borrowing has remained constant at 5.5% in MTREF. While borrowing is considered a prudent financial instrument in financing capital infrastructure development, this indicator will have to be carefully monitored going forward as Knysna Municipality is reaching its prudential borrowing limits.
• Borrowing funding of own capital expenditure measures the degree to which own capital
expenditure (excluding grants and contributions) has been funded by way of borrowing. The average over MTREF is 68.8% which substantiates the above mentioned statement that Knysna Municipality is reaching its prudential borrowing limits.
Knysna Municipality’s debt profile provides some interesting insights on Knysna Municipality’s future borrowing capacity. Firstly, the use of amortising loans leads to high debt service costs at the beginning of the loan, which declines steadily towards the end of the loan’s term. Knysna Municipality has raised mainly amortising loans over the past five years, hence effectively ‘front-loading’ its debt service costs. This is reflected in Knysna Municipality’s debt service profile, which predicts a decline in debt service over the MTREF. In summary, various financial risks could have a negative impact on the future borrowing capacity of the municipality. In particular, the continued ability of Knysna Municipality to meet its revenue targets and ensure its forecasted cash flow targets are achieved will be critical in meeting the repayments of the debt service costs. It is very unfortunate that the municipality cash flow is still under pressure thereby prolonging the period necessary for building sufficient cash reserves.
1.12.1.2 Safety of Capital
• The debt-to-equity ratio is a financial ratio indicating the relative proportion of equity and debt used in financing the municipality’s assets. The indicator is based on the total of loans, creditors, and overdraft as well as tax provisions as a percentage of funds and reserves.
1.12.1.3 Liquidity
• Current ratio is a measure of the current assets divided by the current liabilities and as a benchmark Knysna Municipality has set a limit of 1, hence at no point in time should this ratio be less than 1. For the 2018/19 MTREF the current ratio is 1.3 in the 2019/20 financial year 1.6 and for the 2020/21 financial year 1.8.

Knysna Municipality 2018/19 Draft Annual Budget and MTREF
29 March 2018 65
• The liquidity ratio is a measure of the ability of the municipality to utilize cash and cash equivalents to extinguish or retire its current liabilities immediately. Ideally the municipality should have the equivalent cash and cash equivalents on hand to meet at least the current liabilities, which should translate into a liquidity ratio of 1. Anything below 1 indicates a shortage in cash to meet creditor obligations. For the 2018/19 financial year the ratio is 0.4 and as part of the long term financial planning strategy it has been increased to 0.8 in the 2019/20 financial year. The ratio improves over the MTREF to 1.0 in 2020/21. As part of the longer term financial planning objectives this ratio will have to be set at a minimum of 1.2 as an acceptable ratio.
1.12.1.4 Revenue Management
• As part of the financial sustainability strategy, an aggressive revenue management framework has been implemented to increase cash inflow, this include ongoing revenue enhancement services to ensure all revenue remains in the revenue net, as well as strict application of the credit control policy to collect all debt current and debt that has fallen in arrears.
1.12.1.5 Creditors Management
• Knysna Municipality has managed to ensure that creditors are settled within the legislated 30 days of invoice. With the liquidity ratio is improving and by applying daily cash flow management the municipality has managed to ensure a 100% compliance rate to this legislative obligation. This has had a favorable impact on suppliers’ perceptions of risk of doing business with Knysna Municipality, which is expected to benefit the Municipality in the form of more competitive pricing of tenders, as suppliers compete for Knysna Municipality’s business.
1.12.1.6 Other Indicators
• The electricity distribution losses will be significantly managed and reduced from 8.2% in the 2016/17 financial year and this need to be reduced. The initiatives to ensure this is achieved include managing illegal connections, replacement of meters, minimizing unread meters and revenue enhancement initiatives where large consumers of electricity can be discovered that may not be metered. The funding for these initiatives has already been allocated in the adjustments budget of 201718 which was approved in February 2018.
• The water distribution losses must also be reduced from 23.9% in 2016/17. Losses must be managed through a combination of exception reports, meter deviation reports and revenue enhancement initiatives. Installation of smart water meters will assist in curbing these huge losses. A concerted effort is necessary to reduce the losses even further to within acceptable norms by the conclusion of the MTREF.
• Employee costs as a percentage of operating revenue is increasing in the 2018/2019
financial year and escalates by R 25.8 million year on year as a result of anticipated adoption of the new organizational structure and the filling of critical vacancies necessary for service delivery as well as the general salary increase. Employee related cost continues to be one of the major costs related to service delivery and is carefully managed to be within acceptable norms.
• Repairs and maintenance as percentage of operating revenue is decreasing marginally
by 0.7%. In real terms, repairs and maintenance has increased as part of Knysna Municipality’s strategy to ensure the management of its asset base.

Knysna Municipality 2018/19 Draft Annual Budget and MTREF
29 March 2018 66
1.12.2 Free Basic Services: basic social services package for indigent households
The social package assists residents that have difficulty paying for services and are registered as indigent households in terms of the Indigent Policy of Knysna Municipality. Registered indigents as well as residents in properties where the value is below R 100,000 qualify for either free basic services or service tariffs at a reduced rate. For the 2018/19 financial year between indigent households will receive subsidies for free or reduced cost services. In terms of the Municipality’s indigent policy registered households are entitled to 6kℓ fee water, 50 kwh of electricity, free sanitation and free waste removal services, as well as a discount/full subsidy on their property rates. Further detail relating to the number of households receiving free basic services, the cost of free basic services, highest level of free basic services as well as the revenue cost associated with the free basic services is contained in MBRR A10 (Basic Service Delivery Measurement). Note that the number of households in Eskom distribution areas that receive free services and the cost of these services are not taken into account in the table noted above.
1.12.3 Providing clean water and managing waste water
Knysna Municipality is the Water Services Authority for the entire municipal area in terms of the Water Services Act, 1997 and also acts as water services provider. The Department of Water Affairs conducts an annual performance rating of water works, presenting a Blue Drop or Green Drop award respectively to potable water works and waste water treatment works that meet certain criteria of excellence. The following is briefly the main challenges facing Knysna Municipality with regards to water and waste water management. • The infrastructure at certain waste water treatment works is old and require upgrade and
refurbishment to continue meeting quality standards; • Shortage of skilled personnel makes proper operations and maintenance difficult; • Water sources are scarce and bulk water augmentation is critical for the immediate future. The following are some of the steps that have been taken to address these challenges: • Infrastructure shortcomings are being addressed through the capital budget, • The filling of critical vacancies has received attention in this MTREF; • The Division is working in consultation with the Department of Water Affairs, Provincial
government to address bulk water augmentation.
1.13 Overview of budget related-policies Knysna Municipality’s budgeting process is guided and governed by relevant legislation, frameworks, strategies and related policies. All budget related policies have been reviewed to ensure alignment with the strategic objectives. These policies will continue to be reviewed until the final adoption and approval of the budget in May 2018. All policies will be made public in order

Knysna Municipality 2018/19 Draft Annual Budget and MTREF
29 March 2018 67
to ensure that communities are given relevant information to make their submission and or comments.
1.14 Overview of budget assumptions
1.14.1 External factors
It is expected that the economic recovery will be slow and prolonged; the anticipated growth for 2018 is 1.5% rising to 2.1% in 2021. Knysna municipality still find itself in the shadow of the economic downturn with limited financial resources at our disposal for service delivery this is also evident in the effort that needs to be made for the recovery of debt owed to the municipality. It is also therefore necessary to carefully evaluate spending decisions and to ensure value for money in all procurement processes.
1.14.2 General inflation outlook and its impact on the municipal activities
There are five key factors that have been taken into consideration in the compilation of the 2018/19 MTREF: • National Government macro-economic targets; • The general inflationary outlook and the impact on the municipalities residents and
businesses; • The impact of municipal cost drivers; • The increase in prices for bulk electricity and water; and • The increase in the cost of remuneration. Employee related costs comprise 27.0% of total
operating expenditure in the 2018/19 MTREF and therefore this increase above inflation places additional upward pressure on the expenditure budget.
1.14.3 Credit rating outlook
The Municipality has not had a credit rating done and will consider doing one before the end of the financial year.
1.14.4 Interest rates for borrowing and investment of funds
The MFMA specifies that borrowing can only be utilised to fund capital or refinancing of borrowing in certain conditions. Knysna Municipality intends to take up al loan of R65 Million in the 2018/19 financial year. The 2018/19 MTREF is based on the assumption that all borrowings are undertaken using fixed interest rates for amortisation-style loans requiring both regular principal and interest payments on a bi-annual basis. Interest rates for investment purposes low and the average interest rate on investment is anticipated to average between 5% and 6% for the 20182019 financial year with little upward movement anticipated for the remainder of the MTREF.

Knysna Municipality 2018/19 Draft Annual Budget and MTREF
29 March 2018 68
1.14.5 Collection rate for revenue services
The base assumption is that tariff and rating increases will increase at a rate slightly higher that CPI over the long term. It is also assumed that current economic conditions, and relatively controlled inflationary conditions, will continue through the MTREF. The rate of revenue collection is currently expressed as a percentage (95.0%) of annual billings. Cash flow is assumed to be 95.0% of billings, plus an increased collection of arrear debt from the revised collection and credit control policy. The performance of arrear collections will however only be considered a source of additional cash in-flow once the performance has been carefully monitored.
1.14.6 Growth or decline in tax base of the municipality
Debtor’s revenue is assumed to increase at a rate that is influenced by the consumer debtor’s collection rate, tariff/rate pricing, real growth rate of Knysna Municipality, household formation growth rate and the poor household change rate. compilation of the general valuation roll for the period 2017 to 2022 has resulted in a growth in the assessment rates base for the MTREF, when allowing for objections and appeals on valuations as well as changes in categories in terms of the property rates policy, it is estimated that a real growth of between 3% and 4% will realise. Prudent financial management dictates that a conservative approach best serves a positive outcome and therefore the additional anticipated revenue as a result of the change in valuations necessitated a low additional revenue forecast.
1.14.7 Ability of the municipality to spend and deliver on the programmes
It is estimated that a spending rate of at least 97.0% is achieved on operating expenditure and 100% on the capital programme for the 2018/19 MTREF of which performance has been factored into the cash flow budget. The spending on both the operating budget and capital budget financed from own funding alike will be dependent on the realising of the revenue as per the revenue and cash flow estimates for the MTREF. 1.15 Overview of budget funding Funding of the Budget Section 18(1) of the MFMA determines that an annual budget can only be funded from: • Realistically expected revenue to be collected; • Cash-backed accumulated funds of preceding years’ surpluses not earmarked for other purposes; and • Borrowed funds, but only for the capital budget referred to in Section 17. Full achievement of this requirement effectively entails that a Council ‘balances’ its budget by ensuring that the budgeted outflow balances with a combination of planned inflow.
Knysna Municipality 2018/19 Draft Annual Budget and MTREF
29 March 2018 69
Credible Budget A credible budget, among other things, is a budget, which: • Only funds activities which are in line with the revised IDP and vice versa and which ensure that the IDP is realistically achievable while taking account of the financial restrictions of the municipality; • Is achievable in respect of agreed service delivery and performance targets; • Contains revenue and expenditure projections that are in line with current and previous performance and that are supported by documented evidence of future assumptions; • Does not compromise the financial viability of the municipality (ensures that the financial position is contained within generally accepted prudent limits and that obligations can be met in the short, medium and long term); and • Provides managers with suitable levels of delegation to enable them to fulfill their financial and managerial responsibilities. A budget sets out certain service delivery levels and accompanying financial implications. Consequently, the community must realistically expect to receive these promised service levels and to understand the accompanying financial implications. High under spending due to under collection of revenue or poor planning is a clear example of a budget that is not credible and realistic. Furthermore, budgets tabled as early as 90 days before the start of the budget year, must remain credible and fairly close to the final approved budget. Long term financial planning The current draft budget only proposes to borrow an amount equal to the redemption portion of current borrowing as it will not place an unaffordable strain on the municipal financial position. The municipality has made current provision, cash- backed at 100%. The budget is fully compliant with GRAP standards. This will assist the basis for sound financial practices and compliance in terms of the MFMA and GRAP.
1.15.1 Medium-term outlook: operating revenue
The following table is a breakdown of the operating revenue over the medium-term:
The following graph is a breakdown of the operational revenue per main category for the 2018/19 financial year.

Knysna Municipality 2018/19 Draft Annual Budget and MTREF
29 March 2018 70
Figure 9 Breakdown of operating revenue over the 2018/19 MTREF
Tariff setting plays a major role in ensuring desired levels of revenue. Getting tariffs right assists in the compilation of a credible and funded budget. Knysna Municipality derives most of its operational revenue from the provision of goods and services such as water, electricity, sanitation and solid waste removal. Property rates, operating and capital grants from organs of state and other minor charges (such as building plan fees, licenses and permits etc.) are other forms of revenue. The revenue strategy is a function of key components such as: • Growth in Knysna Municipality and economic development; • Revenue management and enhancement; • Achievement of a 95.0% annual collection rate for consumer revenue; • National Treasury guidelines; • Electricity tariff increases within the National Electricity Regulator of South Africa (NERSA)
approval; • Achievement of full cost recovery of specific user charges; • Determining tariff escalation rate by establishing/calculating revenue requirements; • The Property Rates Policy in terms of the Municipal Property Rates Act, and • And the ability to extend new services and obtain cost recovery levels.
14/15 AUD 15/16 AUD 16/17 AUDCY 17/18
BUDCY 17/18
ADJCY 17/18
FCSTCY 17/18
ACTBudget Year
18/19Budget Year
+1 19/20Budget Year
+2 20/21
Property rates 200734 000 205069 400 205069 400 205069 400 209580 927 217964 164 226682 733
Service charges - electricity revenue 233235 000 233754 000 233754 000 233754 000 250864 793 269228 095 288935 592
Transfers recognised - capital 58100 880 80097 935 80097 935 80097 935 58732 471 35401 929 29698 000
Service charges - water revenue 71324 000 66681 000 66681 000 66681 000 71815 437 77345 227 83300 810
Transfers recognised - operational 140596 120 134896 338 134896 338 134896 338 152799 529 145409 071 119970 000
100000 000
200000 000
300000 000
400000 000
500000 000
600000 000
700000 000
800000 000
Rm
Revenue by Source - Major - Chart A5(a)

Knysna Municipality 2018/19 Draft Annual Budget and MTREF
29 March 2018 71
The above principles guide the annual increase in the tariffs charged to the consumers and the ratepayers aligned to the economic forecasts. The tables below provide detail investment information and investment particulars by maturity.
Table 25 MBRR SA15 – Detail Investment Information
1.15.2 Medium-term outlook: capital revenue
The following table is a breakdown of the funding composition of the 2018/19 medium-term capital programme:
Table 26 Sources of capital revenue over the MTREF
WC048 Knysna - Supporting Table SA15 Investment particulars by type
Budget Year
2018/19
Budget Year
+1 2019/20
Budget Year
+2 2020/21
R thousand
Parent municipality
Securities - National Gov ernment
Deposits - Bank 88 108 88 108 88 108
Deposits - Public Inv estment Commissioners
Municipality sub-total 1 88 108 88 108 88 108
Consolidated total: 88 108 88 108 88 108
2018/19 Medium Term Revenue &
Expenditure Framework
RefInvestment type
Vote Description Ref
R thousand 1Original
Budget
Adjusted
Budget
Full Year
Forecast
Pre-audit
outcome
Budget Year
2018/19
Budget Year
+1 2019/20
Budget Year
+2 2020/21
Funded by:
National Gov ernment 32 578 31 620 31 620 42 234 33 001 28 603
Prov incial Gov ernment 25 523 46 515 46 515 10 056 56 56
District Municipality – – – – –
Other transfers and grants – – – – –
Transfers recognised - capital 4 58 101 78 136 78 136 – 52 290 33 057 28 659
Public contributions & donations 5 – – – – –
Borrowing 6 38 570 35 033 35 033 65 994 52 135 62 987
Internally generated funds 40 842 53 431 53 431 29 892 28 417 29 267
Total Capital Funding 7 137 512 166 599 166 599 – 148 176 113 609 120 914
2018/19 Medium Term Revenue &
Expenditure FrameworkCurrent Year 2017/18

Knysna Municipality 2018/19 Draft Annual Budget and MTREF
29 March 2018 72
The above table is graphically represented as follows for the 2018/19 financial year.
Figure 10 Sources of capital revenue for the 2018/19 financial year
14/15 AUD 15/16 AUD 16/17 AUDCY 17/18
BUDCY 17/18 ADJ
CY 17/18FCST
CY 17/18ACT
Budget Year18/19
Budget Year+1 19/20
Budget Year+2 20/21
Transfers recognised - capital 58100 880 78135 574 78135 574 78135 574 52290 000 33056 695 28659 174
Internally generated funds 40841 600 53430 741 53430 741 53430 741 29892 061 28417 354 29267 354
Borrowing 38569 614 35032 890 35032 890 35032 890 65993 513 52135 186 62987 075
Public contribut ions & donations
20000 000
40000 000
60000 000
80000 000
100000 000
120000 000
140000 000
160000 000
180000 000
Rm
Capital funding by source - Chart A13

Knysna Municipality 2018/19 Draft Annual Budget and MTREF
29 March 2018 73
The following table is a detailed analysis of Knysna Municipality’s borrowing liability. Table 27 MBRR Table SA 17 - Detail of borrowings
1.15.3 Cash Flow Management
Cash flow management and forecasting is a critical step in determining if the budget is funded over the medium-term. The table below is consistent with international standards of good financial management practice and also improves understandability for councilors and management. Some specific features include: • Clear separation of receipts and payments within each cash flow category; • Clear separation of capital and operating receipts from government, which also enables
cash from ‘Ratepayers and other’ to be provide for as cash inflow based on actual performance. In other words, the actual collection rate of billed revenue., and
• Separation of borrowing and loan repayments (no set-off), to assist with MFMA compliance assessment regarding the use of long term borrowing (debt).
It can be concluded that Knysna Municipality has a surplus against the cash backed and accumulated surpluses reconciliation. The challenge for Knysna Municipality will be to ensure that the underlying planning and cash flow assumptions are meticulously managed, especially the performance against the collection rate.
1.16 Contracts having future budgetary implications
In terms of Knysna Municipality’s Supply Chain Management Policy, no contracts are awarded beyond the medium-term revenue and expenditure framework (three years). In ensuring adherence to this contractual time frame limitation, all reports submitted to either the Bid Evaluation and Adjudication Committees must obtain formal financial comments from the Financial Management Division of the Treasury Department.
Borrowing - Categorised by type Ref
R thousandBudget Year
2018/19
Budget Year
+1 2019/20
Budget Year
+2 2020/21
Parent municipality
Annuity and Bullet Loans 163 132 197 938 233 449
Municipality sub-total 1 163 132 197 938 233 449
Total Borrowing 1 163 132 197 938 233 449
Unspent Borrowing - Categorised by type
Parent municipality
Total Unspent Borrowing 1 – – –
2018/19 Medium Term Revenue &
Expenditure Framework
Knysna Municipality 2018/19 Draft Annual Budget and MTREF
29 March 2018 74
1.17 Legislation compliance status
Compliance with the MFMA implementation requirements have been substantially adhered to through the following activities: 1. In year reporting
Reporting to National Treasury in electronic format is fully complied with on a monthly basis up until the last section 71 reporting to the Executive Mayor (within 10 working days) and has progressively improved and includes monthly published financial performance on Knysna Municipality’s website.
2. Internship program
Knysna Municipality is participating in the Municipal Financial Management Internship program. There are currently eleven interns with five of them funded in the FMG in the current financial year of which it will be increased to fund eight in the 2018/2019 financial year.
3. Budget and Treasury Office
The Budget and Treasury Office has been established in accordance with the MFMA and guidelines for establishment of BTO as issued by Provincial Treasury.
4. Audit Committee
An Audit Committee has been established and is fully functional. 5. Service Delivery and Implementation Plan
The detail SDBIP document is submitted as draft with the daft MTREF and will be approved with the 2018/19 MTREF in May 2018 directly aligned and informed by the 2018/19 MTREF.
6. Annual Report
Annual report is compiled in terms of the MFMA and National Treasury requirements. The annual report was tabled in Council on 22 March 2018 and has been approved and adopted by Council.
7. Minimum competency training
Minimum competency training is underway and all required staff members are enrolled for the completion of the required training. Extension for the compliance has been granted by the National Treasury. Our participation in this program is in line with the assessment of current skills pool and capacity building to ensure less reliance on consulting services.

Knysna Municipality 2018/19 Draft Annual Budget and MTREF
29 March 2018 75
1.18 Municipal manager’s quality certificate
I KAM CHETTY, municipal manager of Knysna Municipality, hereby certify that the annual budget
and supporting documentation have been prepared in accordance with the Municipal Finance
Management Act and the regulations made under the Act, and that the annual budget and
supporting documents are consistent with the Integrated Development Plan of the municipality.
Print Name: K CHETTY
Municipal Manager of Knysna Municipality (WC048)
Signature: ______________________________________________
Date 29 March 2018