Draft 2.0 For Discussion Only, Not for Citation Growing the Bereas Economy from...
26
Draft 2.0 – For Discussion Only, Not for Citation 1 Growing the Bereas Economy from the Inside Out Part I By Michael H. Shuman 1 Overview Compared to fellow Americans who are now struggling with an unemployment rate stuck stubbornly above 9%, the residents of Berea, Kentucky, are doing relatively well. According to Workforce Kentucky (www.workforcekentucky.ky.gov ), in August 2011 Madison County, where Berea is located, enjoyed an unemployment rate of 7.1%. Specifically, its labor force of 43,515 has 3,320 workers who are unemployed and seeking work. With about 29% of the total population of Madison County, Berea has an estimated 963 people unemployed right now. These data suggest two conclusions. One is that the region is doing something right. Whether Madison County’s better-than-average employment performance reflects fortuitous market forces or smart economic-development initiatives is unclear. A second conclusion, however, is that more must be done—much more. For most of the past generation, an unemployment rate of 7.1% would be considered a failure, and certainly for the 963 residents who are unemployed – some for two or three years – the problem represents a personal disaster. This paper suggests that existing approaches to economic development, which are largely focused on the attraction and retention of outside businesses, should be supplemented by a new approach to nurture and expand the region’s local businesses. It begins with an overview of the Berea economy. Next, it provides an overview of the concept of ―Local Living Economies.‖ Integral to this approach to economic development is to identify and plug dollar leakages within the economy—that is, opportunities for substituting for imports through new or expanded local businesses that meet local demand. The paper then performs two leakage analysis: a simple comparison of each sector with that of a perfectly self-reliant U.S. community (adjusted to Berea’s size); and a more sophisticated analysis of the consequences of meeting all current local demand with expanded local industry. The simple leakage analysis, performed with the online calculators (designed by the author) of the Business Alliance for Local Living Economies, suggests that through self- reliance Berea could create 5,739 direct jobs—more than enough to put every unemployed resident of Madison County back to work. Achieving just 25% of this goal 1 Michael H. Shuman is Director of Research for Cutting Edge Capital, based in Oakland, California. He is a Stanford-educated economist, attorney, and author. His latest book is The Small-Mart Revolution: How Local Businesses Are Beating the Global Competition (Berrett-Koehler, 2006), and is available at www.small-mart.orgFor comments on this paper or to conduct similar analysis of another community, contact Michael H. Shuman by phone (202-669-1220), e-mail ([email protected]), or mail (2203 Quinton Rd., Silver Spring, MD 20910).
-
Upload
nguyenhanh -
Category
Documents
-
view
214 -
download
0
Transcript of Draft 2.0 For Discussion Only, Not for Citation Growing the Bereas Economy from...
Draft 2.0 – For Discussion Only, Not for Citation
1
Growing the Bereas Economy from the Inside Out
Part I
By Michael H. Shuman1
Overview
Compared to fellow Americans who are now struggling with an unemployment rate stuck
stubbornly above 9%, the residents of Berea, Kentucky, are doing relatively well.
According to Workforce Kentucky (www.workforcekentucky.ky.gov ), in August 2011
Madison County, where Berea is located, enjoyed an unemployment rate of 7.1%.
Specifically, its labor force of 43,515 has 3,320 workers who are unemployed and
seeking work. With about 29% of the total population of Madison County, Berea has an
estimated 963 people unemployed right now.
These data suggest two conclusions. One is that the region is doing something right.
Whether Madison County’s better-than-average employment performance reflects
fortuitous market forces or smart economic-development initiatives is unclear. A second
conclusion, however, is that more must be done—much more. For most of the past
generation, an unemployment rate of 7.1% would be considered a failure, and certainly
for the 963 residents who are unemployed – some for two or three years – the problem
represents a personal disaster.
This paper suggests that existing approaches to economic development, which are largely
focused on the attraction and retention of outside businesses, should be supplemented by
a new approach to nurture and expand the region’s local businesses. It begins with an
overview of the Berea economy. Next, it provides an overview of the concept of ―Local
Living Economies.‖ Integral to this approach to economic development is to identify and
plug dollar leakages within the economy—that is, opportunities for substituting for
imports through new or expanded local businesses that meet local demand. The paper
then performs two leakage analysis: a simple comparison of each sector with that of a
perfectly self-reliant U.S. community (adjusted to Berea’s size); and a more sophisticated
analysis of the consequences of meeting all current local demand with expanded local
industry.
The simple leakage analysis, performed with the online calculators (designed by the
author) of the Business Alliance for Local Living Economies, suggests that through self-
reliance Berea could create 5,739 direct jobs—more than enough to put every
unemployed resident of Madison County back to work. Achieving just 25% of this goal
1 Michael H. Shuman is Director of Research for Cutting Edge Capital, based in Oakland, California. He is
a Stanford-educated economist, attorney, and author. His latest book is The Small-Mart Revolution: How
Local Businesses Are Beating the Global Competition (Berrett-Koehler, 2006), and is available
at HHUUwww.small-mart.orgUUH. For comments on this paper or to conduct similar analysis of another community,
contact Michael H. Shuman by phone (202-669-1220), e-mail ( [email protected] UUHH), or mail (2203 Quinton
Rd., Silver Spring, MD 20910).
Draft 2.0 – For Discussion Only, Not for Citation
2
would generate 1,435 new jobs paying about $53 million in wages annually – more than
enough to put every resident back to work.
A more comprehensive leakage analysis is possible using IMPLAN, the Minnesota Input-
Output Model used extensively by economic development agencies nationwide.
IMPLAN corrects, unifies, and fills in gaps (like farmers and self-employed individuals)
in the Economic Census data. It also can model how changes in one industry can lead to
changes in other industries (indirect effects) and changes in personal consumption
(induced effects). This analysis finds that realizing 25% of the potential jobs from local
demand would generate 2,182 new jobs: 1,398 directly, 211 indirectly, and 572 induced.
These new jobs, moreover, would lead to $92 million more in wages each year, $152
million in additional value-added production, and $11 million in indirect business taxes.
This comprehensive analysis, like the more simple one, shows that a 25% shift could
more than eliminate unemployment in Berea.
How can Berea realize these opportunities through new or expanded local businesses? A
helpful starting place is to review strengths, weaknesses, opportunities, and threats
(SWOT). In mid-September, the author spoke with several dozen key people in the
community to make the SWOT analysis, including policymakers, businesspeople,
economic developers, and business support agents.
The next action steps for the community will be to review, sharpen, and prioritize the list
of promising sectors for expansion. The community should assess which sectors, given
local assets and markets, could most easily achieve, say, a 25% localization goal. With
that information, the author will proceed to prepare Part II of this paper, with specific
recommendations of promising economic-development strategies and programs that
could help realize the 25% shift.
Draft 2.0 – For Discussion Only, Not for Citation
3
The Existing Berea Economy
To understand what kinds of new jobs are possible in Berea, it’s helpful to begin by
reviewing what jobs exist today. Two government databases are useful for this analysis.
Employer data can be found at ―County Business Patterns,‖ available from the U.S.
Census Bureau (http://www.census.gov/econ/cbp/index.html ). Self-employment data
also can be found with the U.S. Census Bureau, in its ―Nonemployer Statistics‖
(http://www.census.gov/econ/nonemployer/index.html). Both are organized around the
North American Industrial Classification System (NAICS), which contains about 1,100
categories (with two-digit categories being the broadest categories, like manufacturing,
and six-digit categories being the most narrow). Unfortunately, these data lag 2-3 years
behind, so the best picture one can paint is not entirely up-to-date.
For purposes of this analysis, the Berea economy is assumed to comprise two zip codes –
40403 and 40404 – both part of Madison County. County Business Patterns go down to
the zip code level. According to the 2009 edition, zip code 40403 has 389 establishments
employing 6,025 people, receiving an annual payroll of $194 million. Zip code 40404
has just three additional establishments, and their characteristics are kept confidential.
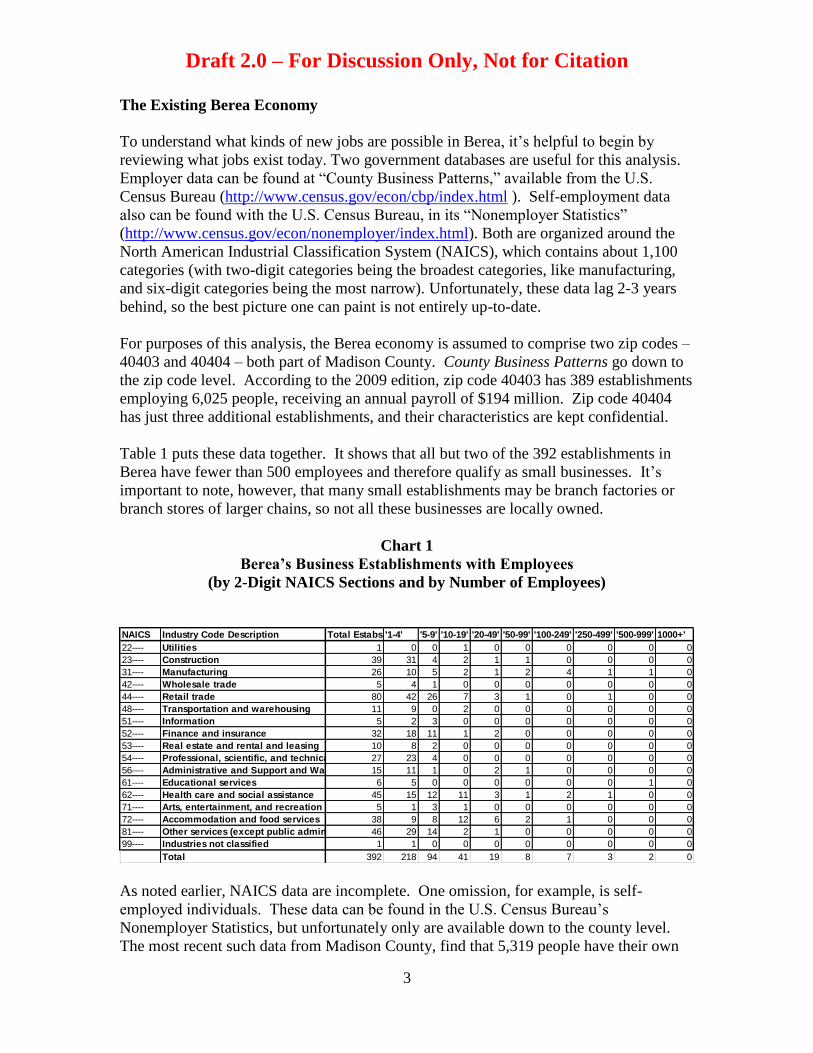
Table 1 puts these data together. It shows that all but two of the 392 establishments in
Berea have fewer than 500 employees and therefore qualify as small businesses. It’s
important to note, however, that many small establishments may be branch factories or
branch stores of larger chains, so not all these businesses are locally owned.
Chart 1
Berea’s Business Establishments with Employees
(by 2-Digit NAICS Sections and by Number of Employees)
As noted earlier, NAICS data are incomplete. One omission, for example, is self-
employed individuals. These data can be found in the U.S. Census Bureau’s
Nonemployer Statistics, but unfortunately only are available down to the county level.
The most recent such data from Madison County, find that 5,319 people have their own
NAICS Industry Code Description Total Estabs '1-4' '5-9' '10-19' '20-49' '50-99' '100-249' '250-499' '500-999' 1000+'
22---- Utilities 1 0 0 1 0 0 0 0 0 0
23---- Construction 39 31 4 2 1 1 0 0 0 0
31---- Manufacturing 26 10 5 2 1 2 4 1 1 0
42---- Wholesale trade 5 4 1 0 0 0 0 0 0 0
44---- Retail trade 80 42 26 7 3 1 0 1 0 0
48---- Transportation and warehousing 11 9 0 2 0 0 0 0 0 0
51---- Information 5 2 3 0 0 0 0 0 0 0
52---- Finance and insurance 32 18 11 1 2 0 0 0 0 0
53---- Real estate and rental and leasing 10 8 2 0 0 0 0 0 0 0
54---- Professional, scientific, and technical services27 23 4 0 0 0 0 0 0 0
56---- Administrative and Support and Waste Mang and Remediation Srvs15 11 1 0 2 1 0 0 0 0
61---- Educational services 6 5 0 0 0 0 0 0 1 0
62---- Health care and social assistance 45 15 12 11 3 1 2 1 0 0
71---- Arts, entertainment, and recreation 5 1 3 1 0 0 0 0 0 0
72---- Accommodation and food services 38 9 8 12 6 2 1 0 0 0
81---- Other services (except public administration) 46 29 14 2 1 0 0 0 0 0
99---- Industries not classified 1 1 0 0 0 0 0 0 0 0
Total 392 218 94 41 19 8 7 3 2 0
Draft 2.0 – For Discussion Only, Not for Citation
4
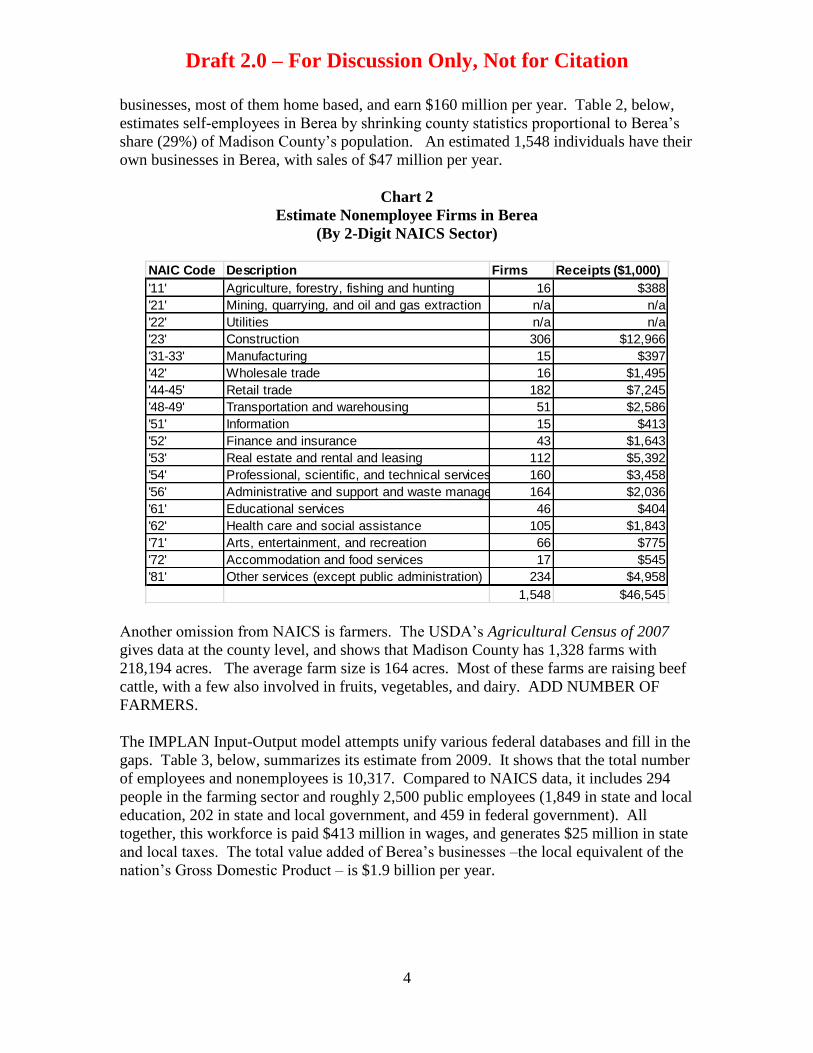
businesses, most of them home based, and earn $160 million per year. Table 2, below,
estimates self-employees in Berea by shrinking county statistics proportional to Berea’s
share (29%) of Madison County’s population. An estimated 1,548 individuals have their
own businesses in Berea, with sales of $47 million per year.
Chart 2
Estimate Nonemployee Firms in Berea
(By 2-Digit NAICS Sector)
Another omission from NAICS is farmers. The USDA’s Agricultural Census of 2007
gives data at the county level, and shows that Madison County has 1,328 farms with
218,194 acres. The average farm size is 164 acres. Most of these farms are raising beef
cattle, with a few also involved in fruits, vegetables, and dairy. ADD NUMBER OF
FARMERS.
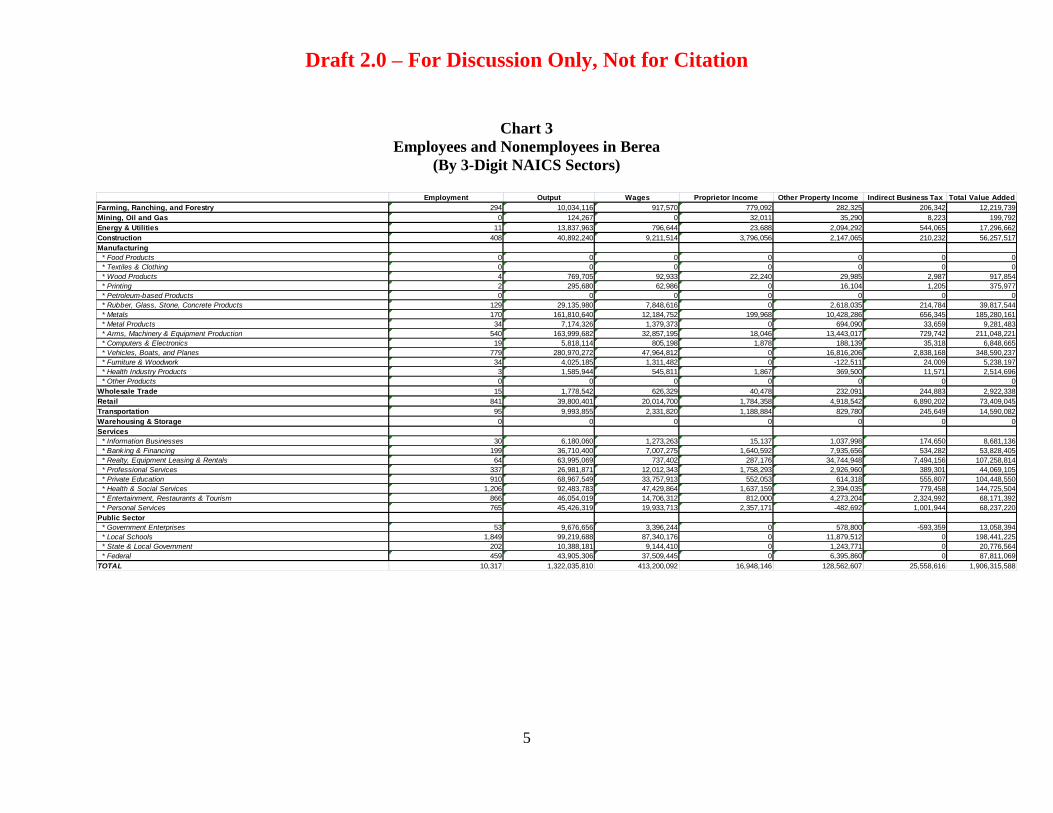
The IMPLAN Input-Output model attempts unify various federal databases and fill in the
gaps. Table 3, below, summarizes its estimate from 2009. It shows that the total number
of employees and nonemployees is 10,317. Compared to NAICS data, it includes 294
people in the farming sector and roughly 2,500 public employees (1,849 in state and local
education, 202 in state and local government, and 459 in federal government). All
together, this workforce is paid $413 million in wages, and generates $25 million in state
and local taxes. The total value added of Berea’s businesses –the local equivalent of the
nation’s Gross Domestic Product – is $1.9 billion per year.
NAIC Code Description Firms Receipts ($1,000)
'11' Agriculture, forestry, fishing and hunting 16 $388
'21' Mining, quarrying, and oil and gas extraction n/a n/a
'22' Utilities n/a n/a
'23' Construction 306 $12,966
'31-33' Manufacturing 15 $397
'42' Wholesale trade 16 $1,495
'44-45' Retail trade 182 $7,245
'48-49' Transportation and warehousing 51 $2,586
'51' Information 15 $413
'52' Finance and insurance 43 $1,643
'53' Real estate and rental and leasing 112 $5,392
'54' Professional, scientific, and technical services 160 $3,458
'56' Administrative and support and waste management and remediation services164 $2,036
'61' Educational services 46 $404
'62' Health care and social assistance 105 $1,843
'71' Arts, entertainment, and recreation 66 $775
'72' Accommodation and food services 17 $545
'81' Other services (except public administration) 234 $4,958
1,548 $46,545
Draft 2.0 – For Discussion Only, Not for Citation
5
Chart 3
Employees and Nonemployees in Berea
(By 3-Digit NAICS Sectors)
Employment Output Wages Proprietor Income Other Property Income Indirect Business Tax Total Value Added
Farming, Ranching, and Forestry 294 10,034,116 917,570 779,092 282,325 206,342 12,219,739
Mining, Oil and Gas 0 124,267 0 32,011 35,290 8,223 199,792
Energy & Utilities 11 13,837,963 796,644 23,688 2,094,292 544,065 17,296,662
Construction 408 40,892,240 9,211,514 3,796,056 2,147,065 210,232 56,257,517
Manufacturing
* Food Products 0 0 0 0 0 0 0
* Textiles & Clothing 0 0 0 0 0 0 0
* Wood Products 4 769,705 92,933 22,240 29,985 2,987 917,854
* Printing 2 295,680 62,986 0 16,104 1,205 375,977
* Petroleum-based Products 0 0 0 0 0 0 0
* Rubber, Glass, Stone, Concrete Products 129 29,135,980 7,848,616 0 2,618,035 214,784 39,817,544
* Metals 170 161,810,640 12,184,752 199,968 10,428,286 656,345 185,280,161
* Metal Products 34 7,174,326 1,379,373 0 694,090 33,659 9,281,483
* Arms, Machinery & Equipment Production 540 163,999,682 32,857,195 18,046 13,443,017 729,742 211,048,221
* Computers & Electronics 19 5,818,114 805,198 1,878 188,139 35,318 6,848,665
* Vehicles, Boats, and Planes 779 280,970,272 47,964,812 0 16,816,206 2,838,168 348,590,237
* Furniture & Woodwork 34 4,025,185 1,311,482 0 -122,511 24,009 5,238,197
* Health Industry Products 3 1,585,944 545,811 1,867 369,500 11,571 2,514,696
* Other Products 0 0 0 0 0 0 0
Wholesale Trade 15 1,778,542 626,329 40,478 232,091 244,883 2,922,338
Retail 841 39,800,401 20,014,700 1,784,358 4,918,542 6,890,202 73,409,045
Transportation 95 9,993,855 2,331,820 1,188,884 829,780 245,649 14,590,082
Warehousing & Storage 0 0 0 0 0 0 0
Services
* Information Businesses 30 6,180,060 1,273,263 15,137 1,037,998 174,650 8,681,136
* Bank ing & Financing 199 36,710,400 7,007,275 1,640,592 7,935,656 534,282 53,828,405
* Realty, Equipment Leasing & Rentals 64 63,995,069 737,402 287,176 34,744,948 7,494,156 107,258,814
* Professional Services 337 26,981,871 12,012,343 1,758,293 2,926,960 389,301 44,069,105
* Private Education 910 68,967,549 33,757,913 552,053 614,318 555,807 104,448,550
* Health & Social Services 1,206 92,483,783 47,429,864 1,637,159 2,394,035 779,458 144,725,504
* Entertainment, Restaurants & Tourism 866 46,054,019 14,706,312 812,000 4,273,204 2,324,992 68,171,392
* Personal Services 765 45,426,319 19,933,713 2,357,171 -482,692 1,001,944 68,237,220
Public Sector
* Government Enterprises 53 9,676,656 3,396,244 0 578,800 -593,359 13,058,394
* Local Schools 1,849 99,219,688 87,340,176 0 11,879,512 0 198,441,225
* State & Local Government 202 10,388,181 9,144,410 0 1,243,771 0 20,776,564
* Federal 459 43,905,306 37,509,445 0 6,395,860 0 87,811,069
TOTAL 10,317 1,322,035,810 413,200,092 16,948,146 128,562,607 25,558,616 1,906,315,588
Draft -- Not for Distribution or Circulation
6
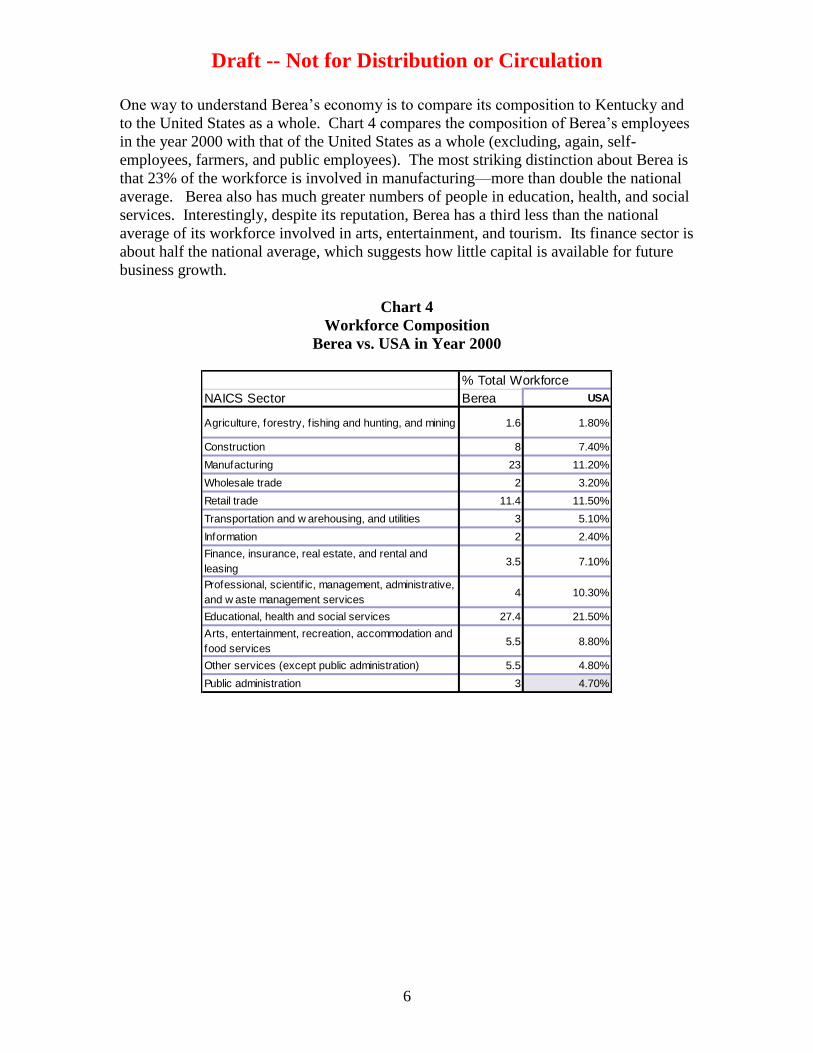
One way to understand Berea’s economy is to compare its composition to Kentucky and
to the United States as a whole. Chart 4 compares the composition of Berea’s employees
in the year 2000 with that of the United States as a whole (excluding, again, self-
employees, farmers, and public employees). The most striking distinction about Berea is
that 23% of the workforce is involved in manufacturing—more than double the national
average. Berea also has much greater numbers of people in education, health, and social
services. Interestingly, despite its reputation, Berea has a third less than the national
average of its workforce involved in arts, entertainment, and tourism. Its finance sector is
about half the national average, which suggests how little capital is available for future
business growth.
Chart 4
Workforce Composition
Berea vs. USA in Year 2000
% Total Workforce
NAICS Sector Berea USA
Agriculture, forestry, f ishing and hunting, and mining 1.6 1.80%
Construction 8 7.40%
Manufacturing 23 11.20%
Wholesale trade 2 3.20%
Retail trade 11.4 11.50%
Transportation and w arehousing, and utilities 3 5.10%
Information 2 2.40%
Finance, insurance, real estate, and rental and
leasing3.5 7.10%
Professional, scientif ic, management, administrative,
and w aste management services4 10.30%
Educational, health and social services 27.4 21.50%
Arts, entertainment, recreation, accommodation and
food services5.5 8.80%
Other services (except public administration) 5.5 4.80%
Public administration 3 4.70%
Draft -- Not for Distribution or Circulation
7
Local Living Economies
The conventional paradigm of economic development is that a locale should attract and
retain globe-trotting companies, and do so by doling out huge sums of public money.
The best estimate of the annual cost of these ―incentives‖ by state and local governments
is $50 billion per year, with federal agencies contributing at least as much (and
significantly more over the past two years in the name of ―stimulus‖). A growing body
of evidence suggests, however, that this model of economic development is ineffectual at
best and a huge waste of local resources and opportunities at worst. Moreover, many of
the most popular concepts in economic development today – industrial parks, high-tech
clusters, tax-increment financing (TIFs), business incubators, even green jobs – turn out
ultimately rely on the flawed paradigm of attraction and retention.
My two books, Going Local and The Small-Mart Revolution, argue that economic
development performs best when it is focused, laser-like, on businesses that are LOIS –
that is locally owned and import-substituting. Local ownership means that working
control of a company is held within a small geographic area. Import-substituting means
that the company is focused first and foremost (though not exclusively) on cost-effective
production for local markets.
Numerous studies in recent years suggest that locally owned businesses contribute more
to economic development than do global businesses attracted. Local ownership matters
in at least five ways:2
Higher Multipliers – Locally owned businesses generally contribute more to
the ―economic multiplier‖– typically two to four times the income, wealth,
jobs, and tax payments per dollar of output. The reason is simple: local
businesses spend more money locally, particularly on management, business
services, and advertising, and local businesses recycle profits locally.
More Reliable – While absentee-owned businesses increasingly consider
moving to Mexico, China, or low-wage U.S. state, with little concern for
throwing the community into an economic tailspin, businesses anchored
locally produce wealth more reliably for many years, often many generations.
Higher Standards – Because local businesses tend to stay put, a community
with primarily local businesses can raise labor and environmental standards
with confidence that its businesses will adapt rather than flee.
More Dynamic – A community made up of smaller, locally owned businesses
is better equipped to promote smart growth and walkable communities, draw
tourists through unique stores and attractions, retain talented young people
who seek entrepreneurial opportunities and a distinct sense of place, and
reduce the noise, fumes, and risks of traffic. It also can save families the
2 Extensive documentation of these points can be found in The Small-Mart Revolution, Chapter 2.
Draft -- Not for Distribution or Circulation
8
headache and expense of maintaining multiple vehicles (currently running $8-
10,000 per vehicle per year, an expense that will rise as oil and gasoline prices
rise).
Better Social Impacts – Compared to economies dependent on absentee-
owned enterprises, local-business economies tend to have more social
stability, lower levels of welfare, and greater political participation.
Import substitution also promotes economic prosperity. Every time a community imports
a good or service that it might have cost-effectively produced for itself, it ―leaks‖ dollars
and loses the critically important multipliers associated with them. Moreover,
unnecessary imports – of petroleum, for example –subject a community to risks of price
hikes and disruptions far beyond local control. They also deny a community a diversified
base of businesses and skills needed to take advantage of unknown (and unknowable)
future opportunities in the global economy.
Three examples help to illustrate the potential benefits of import substitution:
Fifteen years ago, Güssing was a dying rural community of 4,000 in Austria.
Its old industries of logging and farming had been demolished by global
competition. Many of today's economic developers would have given up and
encouraged the residents to move elsewhere. But the mayor of Güssing
decided that the key to prosperity was to plug energy "leaks." He built a small
district heating system, fueled with local wood. The local money saved by
importing less energy was then reinvested in expanding the district heating
system and in new energy businesses. Since then, 50 new firms have opened,
creating 1,000 new jobs. And most remarkably, the town estimates that this
economic expansion actually will result in a reduction of its carbon footprint
by 90 percent.
In autumn of 2008 Marian Burros of the New York Times wrote a piece about
how the 3000-person community of Hardwick, Vermont, has prospered by
creating a new "economic cluster" around local food. Cutting-edge
restaurants, artisan cheese makers, and organic orchardists turning fruit into
exquisite pies are just some of the new businesses that have added an
estimated 75-100 jobs to the area in recent years. A new Vermont Food
Venture Center hopes to accelerate this creation of enterprises.
Even a single, visionary business can lead a community-wide effort at import
subsitution. Take Zingerman’s in Ann Arbor, Michigan. On its first day of
business in a college town known globally more for its radicalism than for its
food, Zingerman's Deli sold about $100 worth of sandwiches. That was 1982.
It has since grown into a community of nine businesses, each independent but
linked through overlapping partnerships that collectively employ 525 people
and achieve annual sales of over $27 million. Over that period the proprietors
conscientiously built a food cluster from scratch. They carefully assessed the
Draft -- Not for Distribution or Circulation
9
items going into the deli – bread, coffee, cheeses – and saw profitable
opportunities for creating a bakery, a coffee roaster, and a creamery. They
looked at the products being sold at the deli – fabulous coffee cakes and high-
quality meats – and built new, value-adding businesses with these products,
including a mail-order company and a restaurant called the Roadhouse.
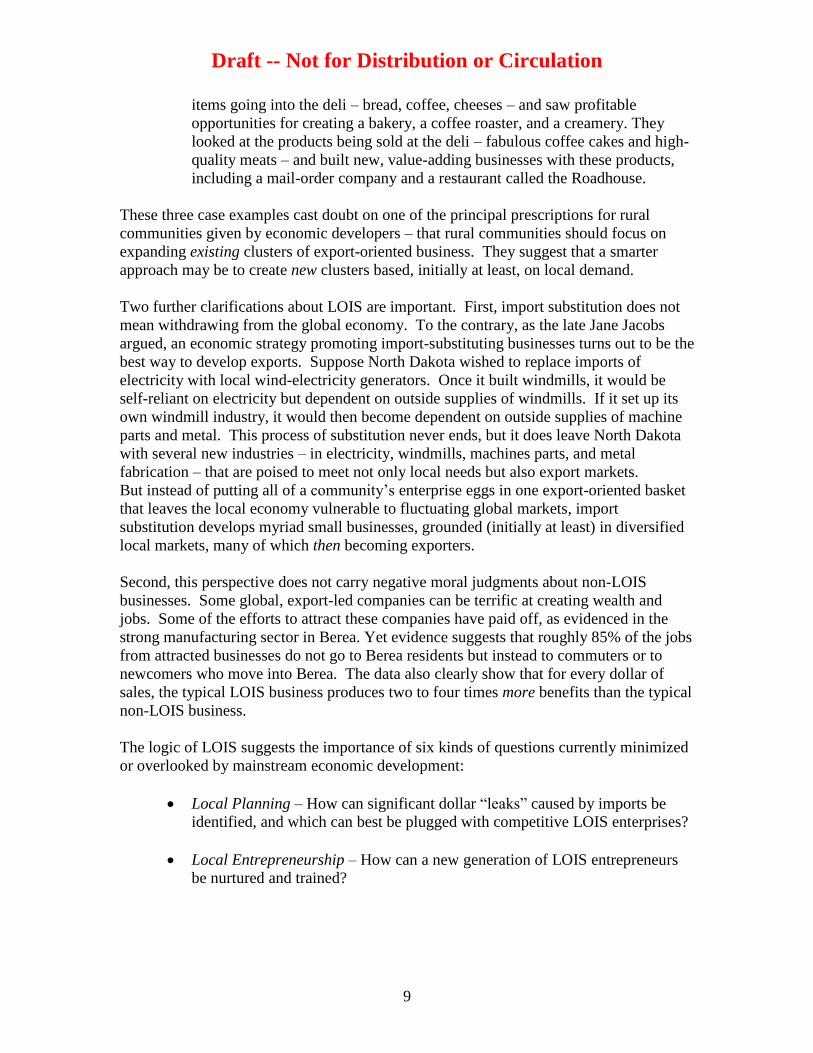
These three case examples cast doubt on one of the principal prescriptions for rural
communities given by economic developers – that rural communities should focus on
expanding existing clusters of export-oriented business. They suggest that a smarter
approach may be to create new clusters based, initially at least, on local demand.
Two further clarifications about LOIS are important. First, import substitution does not
mean withdrawing from the global economy. To the contrary, as the late Jane Jacobs
argued, an economic strategy promoting import-substituting businesses turns out to be the
best way to develop exports. Suppose North Dakota wished to replace imports of
electricity with local wind-electricity generators. Once it built windmills, it would be
self-reliant on electricity but dependent on outside supplies of windmills. If it set up its
own windmill industry, it would then become dependent on outside supplies of machine
parts and metal. This process of substitution never ends, but it does leave North Dakota
with several new industries – in electricity, windmills, machines parts, and metal
fabrication – that are poised to meet not only local needs but also export markets.
But instead of putting all of a community’s enterprise eggs in one export-oriented basket
that leaves the local economy vulnerable to fluctuating global markets, import
substitution develops myriad small businesses, grounded (initially at least) in diversified
local markets, many of which then becoming exporters.
Second, this perspective does not carry negative moral judgments about non-LOIS
businesses. Some global, export-led companies can be terrific at creating wealth and
jobs. Some of the efforts to attract these companies have paid off, as evidenced in the
strong manufacturing sector in Berea. Yet evidence suggests that roughly 85% of the jobs
from attracted businesses do not go to Berea residents but instead to commuters or to
newcomers who move into Berea. The data also clearly show that for every dollar of
sales, the typical LOIS business produces two to four times more benefits than the typical
non-LOIS business.
The logic of LOIS suggests the importance of six kinds of questions currently minimized
or overlooked by mainstream economic development:
Local Planning – How can significant dollar ―leaks‖ caused by imports be
identified, and which can best be plugged with competitive LOIS enterprises?
Local Entrepreneurship – How can a new generation of LOIS entrepreneurs
be nurtured and trained?
Draft -- Not for Distribution or Circulation
10
Local Business Organizing – How can existing LOIS businesses work
together (through, for example, joint purchasing or marketing cooperatives) to
improve their competitiveness?
Local Investing – How can local savings, whether in banks or pension funds,
be tapped to support new or expanded LOIS businesses?
Local Purchasing – How can LOIS businesses achieve greater success
through ―Local First‖ purchasing by consumers, businesses, and government
agencies?
Local Public Policymaking – How can the myriad biases that currently exist
against LOIS (the vast majority of state and local businesses subsidies, for
example, target nonlocal business) be eliminated so that local businesses can
compete on a level playing field?
Another needed shift in economic development is from a pork-barrel consumer of public
dollars to a self-financing producer of public and private wealth. It’s ironic that those
promoting entrepreneurship do not demand that they themselves operate in an
entrepreneurial capacity. Advocates of LOIS, in contrast, are increasingly designing,
testing, and deploying models for self-financing economic development, everything from
local gift and debit cards to business-to-business contract facilitators. These programs
are called ―meta-businesses,‖ since they are designed to operate profitably like other
businesses, but benefit not just shareholders but all LOIS businesses.
The LOIS perspective, once deemed on the fringe, is now becoming increasingly
mainstream. Just in the last decade has emerged a worldwide movement for local living
economies. Around the country, and increasingly throughout the world, community-
based initiatives are springing up that are challenging the conventional economic
development paradigm. At the forefront has been the Business Alliance for Local Living
Economies (BALLE), which since its founding in 2001 has grown into coalition of 80
networks across North America formally representing 22,000 local business members
(and informally representing millions of local businesses that operate in these networks’
regions). In fact, these numbers represent only a small fraction of the movement. Other
organizations involving local businesses, including the American Independent Business
Alliance (AMIBA), the Post-Carbon Institute, and Transition Towns, are bringing
hundreds of other communities into this movement. And to this list should be added the
growing roster of organizations promoting local food, local banking, and local energy.
Draft -- Not for Distribution or Circulation
11
A Simple Leakage Analysis
Leakage analysis identifies all those sectors in the economy where a community is
unnecessarily importing goods and services. Every unnecessary import represents a loss
of dollars and a loss of the "multiplier" impacts those dollars could have locally. It also
represents a loss of other documented benefits local business brings, like knowledge,
skills, tax payments, charitable giving, revitalized downtowns, tourists, stronger civil
society, and more political participation.
Two tools can help to measure dollar leakages. One – a ―jobs leakage calculator‖ -- was
created by the author for the Business Alliance for Local Living Economies (BALLE)
(www.livingeconomies.org ). The calculator basically constructs an employment profile
for a self-reliant United States by adjusting each NAICS sector’s actual employment by
the nation’s trade balance in that sector. It then creates a jobs composite of a self-reliant
Berea by shrinking the jobs composite of a self-reliant United States down to the town’s
population. Each sector then compares the actual employment in Berea with the expected
self-reliant employment. The year of the data is 2009. The calculator shows that 5,739
jobs are possible in Berea and they would pay $210,607,739.
It’s worth noting that this analysis is conservative in one significant respect. In any
category where Berea is deemed 100% self-reliant, no additional jobs from import
substitution are considered possible. In fact, some of those ―self-reliance‖ jobs in fact
may be oriented to exports, which means there are still opportunities for further job
creation through import substitution.
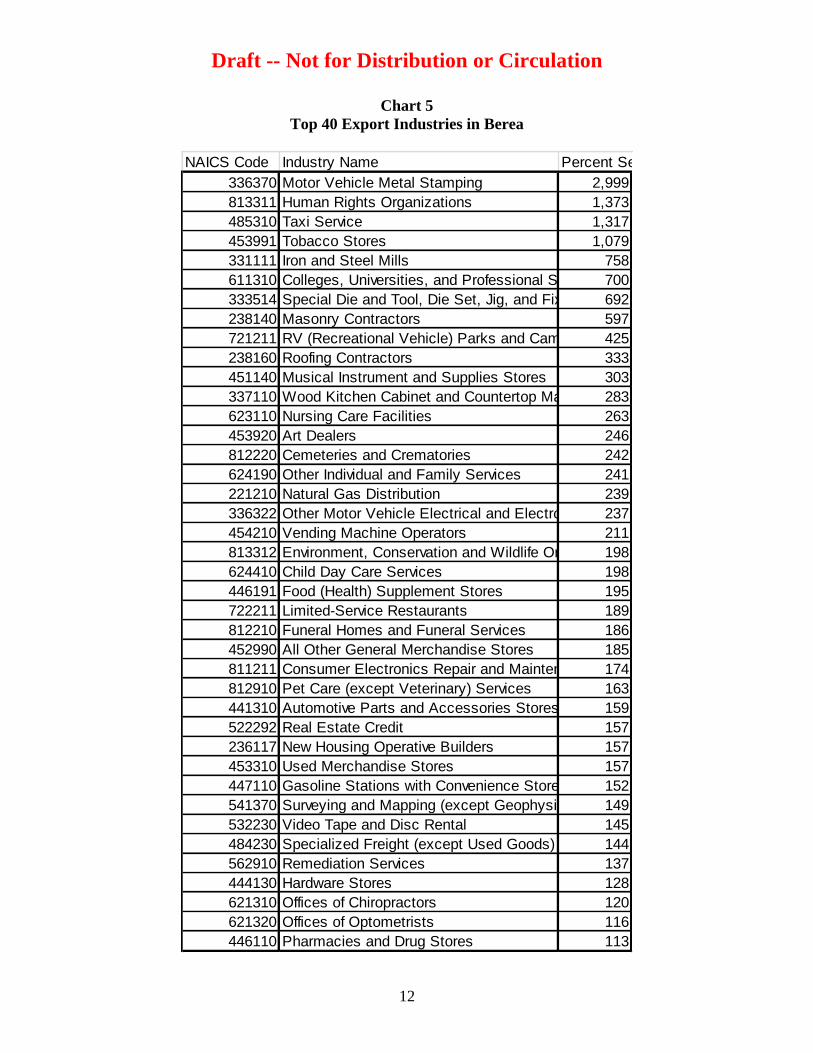
Levels of self-reliance greater than 100% mark export industries. Chart 5 shows the top
40 export industries in Berea. Among the things that the data show are:
industries manufacturing parts for automobiles, some undoubtedly supplying
the assemble plant in Georgetown, Kentucky;
the important role of Berea College, and the spinoffs of many nonprofits
promoting human rights and environmental protection;
the presence of a largely retirement population, which requires a greater
presence of nursing homes, funeral parlors, and cemetaries;
a large arts sector linked with the production of musical instruments and many
art dealers; and
a major services sector that is providing residents throughout the region (some
of whom may be coming to work in Berea) with child care, taxis, limited
service restaurants (often lunch and breakfast food), and vending machines.
Draft -- Not for Distribution or Circulation
12
Chart 5
Top 40 Export Industries in Berea
NAICS Code Industry Name Percent Self Reliant
336370 Motor Vehicle Metal Stamping 2,999
813311 Human Rights Organizations 1,373
485310 Taxi Service 1,317
453991 Tobacco Stores 1,079
331111 Iron and Steel Mills 758
611310 Colleges, Universities, and Professional Schools 700
333514 Special Die and Tool, Die Set, Jig, and Fixture Manufacturing692
238140 Masonry Contractors 597
721211 RV (Recreational Vehicle) Parks and Campgrounds425
238160 Roofing Contractors 333
451140 Musical Instrument and Supplies Stores 303
337110 Wood Kitchen Cabinet and Countertop Manufacturing283
623110 Nursing Care Facilities 263
453920 Art Dealers 246
812220 Cemeteries and Crematories 242
624190 Other Individual and Family Services 241
221210 Natural Gas Distribution 239
336322 Other Motor Vehicle Electrical and Electronic Equipment Manufacturing237
454210 Vending Machine Operators 211
813312 Environment, Conservation and Wildlife Organizations198
624410 Child Day Care Services 198
446191 Food (Health) Supplement Stores 195
722211 Limited-Service Restaurants 189
812210 Funeral Homes and Funeral Services 186
452990 All Other General Merchandise Stores 185
811211 Consumer Electronics Repair and Maintenance 174
812910 Pet Care (except Veterinary) Services 163
441310 Automotive Parts and Accessories Stores 159
522292 Real Estate Credit 157
236117 New Housing Operative Builders 157
453310 Used Merchandise Stores 157
447110 Gasoline Stations with Convenience Stores 152
541370 Surveying and Mapping (except Geophysical) Services149
532230 Video Tape and Disc Rental 145
484230 Specialized Freight (except Used Goods) Trucking, Long-Distance144
562910 Remediation Services 137
444130 Hardware Stores 128
621310 Offices of Chiropractors 120
621320 Offices of Optometrists 116
446110 Pharmacies and Drug Stores 113
Draft -- Not for Distribution or Circulation
13
Mainstream economic development looks at these industries as the indicators of the
region’s competitive advantages. That is, whatever is exported is, by definition, what the
region can produce well. Clusters of these industries can be ascertained, and expansion
of these clusters is often viewed as the most promising strategy for economic
development.
But leakage analysis suggests another approach for economic development. By focusing
on areas of weakness, where few or no local businesses are meeting local demand, the
region can diversity itself and create new clusters. And that Berea is producing less than
it consumes in more than 90% (CK) of its NAICS industries suggests how many
opportunities it has.
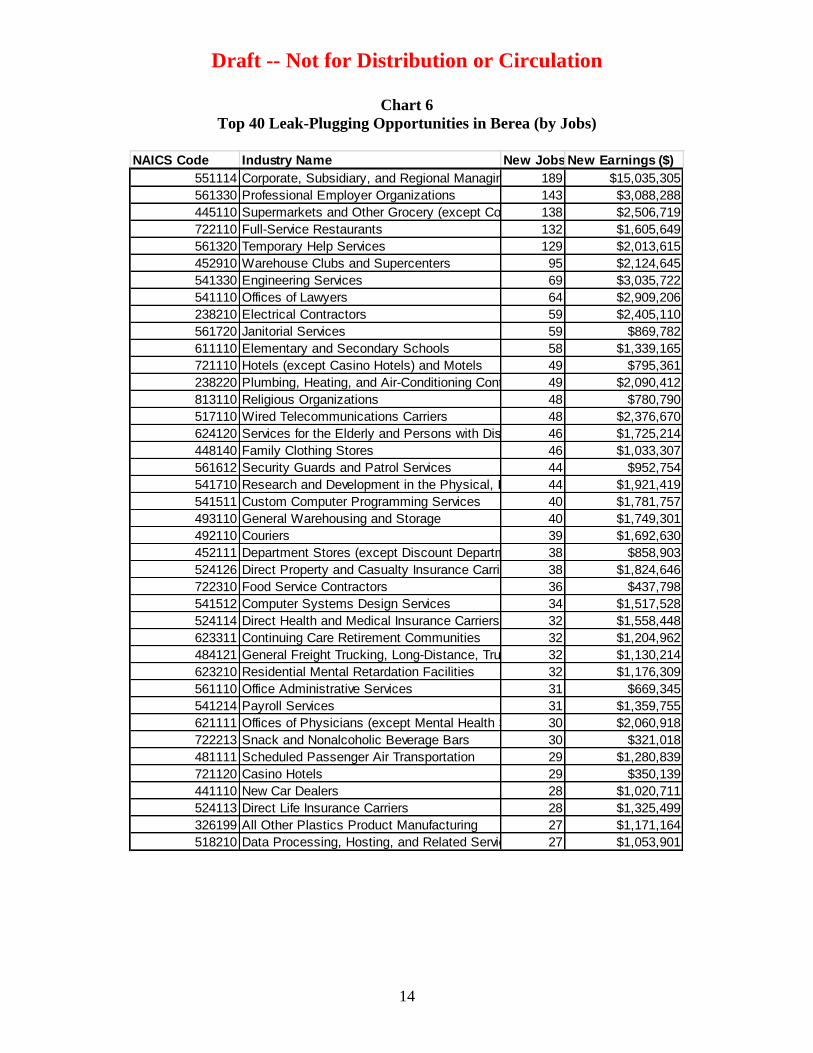
Chart 6 on the next page shows the 40 leaky sectors that, with new local businesses
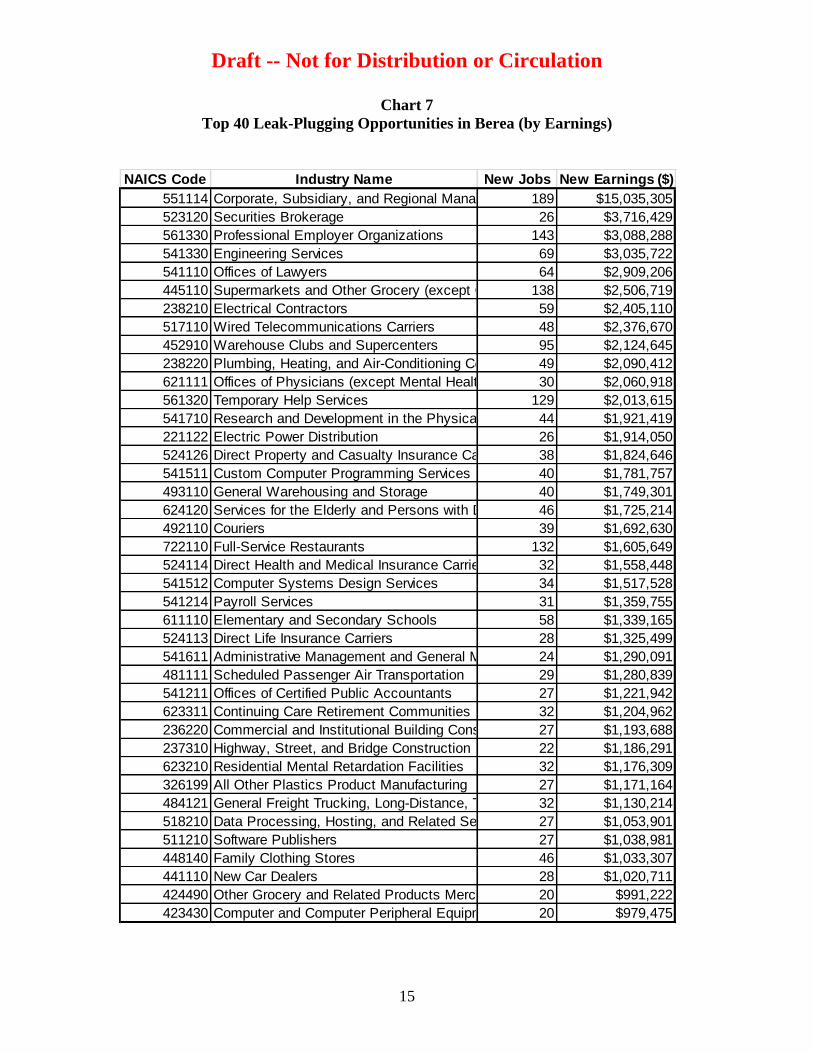
meeting local demand, could produce the most new jobs. Chart 7 shows the 40 leaky
sectors that could produce the highest new earnings (new jobs times average state wage
in that sector). Among the most important leakages revealed by this analysis are.
Global Companies – Most of the larger companies in Berea are branch
factories or offices, not headquarters. Hence two of the largest job gaps are
managers and professional-employer organizations.
Professional Services – Companies within Berea are outsourcing their needs
for engineers, lawyers, janitors, security guards, computer programmers, data
processors, and payroll specialists.
Intermediaries – Even though Berea has a greater-than-average manufacturing
sector, that sector is outsourcing its needs for warehouses, distribution,
couriers, and trucking.
Tourism – Berea is trying to be a tourist magnet, but currently lacks hotels,
full-service restaurants, and bars. Even residents and students common go
elsewhere for entertainment.
Food & Retail – In addition to the tourist gaps above, Berea is not capturing
its fair share of shoppers (including tourist shoppers) because it lacks grocery
stores, department stores, clothing stores, and car dealers. It also lacks other
food contracting infrastructure to connect farmers with consumers.
Finance – While Berea has a number of important local banks, it lacks
insurance and securities brokers.
Health Care – There are important gaps in health services, such as physicians
offices and mental-health-care facilities. There is also a need more full-
service retirement communities.
Draft -- Not for Distribution or Circulation
14
Chart 6
Top 40 Leak-Plugging Opportunities in Berea (by Jobs)
NAICS Code Industry Name New Jobs New Earnings ($)
551114 Corporate, Subsidiary, and Regional Managing Offices189 $15,035,305
561330 Professional Employer Organizations 143 $3,088,288
445110 Supermarkets and Other Grocery (except Convenience) Stores138 $2,506,719
722110 Full-Service Restaurants 132 $1,605,649
561320 Temporary Help Services 129 $2,013,615
452910 Warehouse Clubs and Supercenters 95 $2,124,645
541330 Engineering Services 69 $3,035,722
541110 Offices of Lawyers 64 $2,909,206
238210 Electrical Contractors 59 $2,405,110
561720 Janitorial Services 59 $869,782
611110 Elementary and Secondary Schools 58 $1,339,165
721110 Hotels (except Casino Hotels) and Motels 49 $795,361
238220 Plumbing, Heating, and Air-Conditioning Contractors 49 $2,090,412
813110 Religious Organizations 48 $780,790
517110 Wired Telecommunications Carriers 48 $2,376,670
624120 Services for the Elderly and Persons with Disabilities 46 $1,725,214
448140 Family Clothing Stores 46 $1,033,307
561612 Security Guards and Patrol Services 44 $952,754
541710 Research and Development in the Physical, Engineering, and Life Sciences44 $1,921,419
541511 Custom Computer Programming Services 40 $1,781,757
493110 General Warehousing and Storage 40 $1,749,301
492110 Couriers 39 $1,692,630
452111 Department Stores (except Discount Department Stores)38 $858,903
524126 Direct Property and Casualty Insurance Carriers 38 $1,824,646
722310 Food Service Contractors 36 $437,798
541512 Computer Systems Design Services 34 $1,517,528
524114 Direct Health and Medical Insurance Carriers 32 $1,558,448
623311 Continuing Care Retirement Communities 32 $1,204,962
484121 General Freight Trucking, Long-Distance, Truckload 32 $1,130,214
623210 Residential Mental Retardation Facilities 32 $1,176,309
561110 Office Administrative Services 31 $669,345
541214 Payroll Services 31 $1,359,755
621111 Offices of Physicians (except Mental Health Specialists)30 $2,060,918
722213 Snack and Nonalcoholic Beverage Bars 30 $321,018
481111 Scheduled Passenger Air Transportation 29 $1,280,839
721120 Casino Hotels 29 $350,139
441110 New Car Dealers 28 $1,020,711
524113 Direct Life Insurance Carriers 28 $1,325,499
326199 All Other Plastics Product Manufacturing 27 $1,171,164
518210 Data Processing, Hosting, and Related Services 27 $1,053,901
Draft -- Not for Distribution or Circulation
15
Chart 7
Top 40 Leak-Plugging Opportunities in Berea (by Earnings)
NAICS Code Industry Name New Jobs New Earnings ($)
551114 Corporate, Subsidiary, and Regional Managing Offices189 $15,035,305
523120 Securities Brokerage 26 $3,716,429
561330 Professional Employer Organizations 143 $3,088,288
541330 Engineering Services 69 $3,035,722
541110 Offices of Lawyers 64 $2,909,206
445110 Supermarkets and Other Grocery (except Convenience) Stores138 $2,506,719
238210 Electrical Contractors 59 $2,405,110
517110 Wired Telecommunications Carriers 48 $2,376,670
452910 Warehouse Clubs and Supercenters 95 $2,124,645
238220 Plumbing, Heating, and Air-Conditioning Contractors 49 $2,090,412
621111 Offices of Physicians (except Mental Health Specialists)30 $2,060,918
561320 Temporary Help Services 129 $2,013,615
541710 Research and Development in the Physical, Engineering, and Life Sciences44 $1,921,419
221122 Electric Power Distribution 26 $1,914,050
524126 Direct Property and Casualty Insurance Carriers 38 $1,824,646
541511 Custom Computer Programming Services 40 $1,781,757
493110 General Warehousing and Storage 40 $1,749,301
624120 Services for the Elderly and Persons with Disabilities46 $1,725,214
492110 Couriers 39 $1,692,630
722110 Full-Service Restaurants 132 $1,605,649
524114 Direct Health and Medical Insurance Carriers 32 $1,558,448
541512 Computer Systems Design Services 34 $1,517,528
541214 Payroll Services 31 $1,359,755
611110 Elementary and Secondary Schools 58 $1,339,165
524113 Direct Life Insurance Carriers 28 $1,325,499
541611 Administrative Management and General Management Consulting Services24 $1,290,091
481111 Scheduled Passenger Air Transportation 29 $1,280,839
541211 Offices of Certified Public Accountants 27 $1,221,942
623311 Continuing Care Retirement Communities 32 $1,204,962
236220 Commercial and Institutional Building Construction 27 $1,193,688
237310 Highway, Street, and Bridge Construction 22 $1,186,291
623210 Residential Mental Retardation Facilities 32 $1,176,309
326199 All Other Plastics Product Manufacturing 27 $1,171,164
484121 General Freight Trucking, Long-Distance, Truckload 32 $1,130,214
518210 Data Processing, Hosting, and Related Services 27 $1,053,901
511210 Software Publishers 27 $1,038,981
448140 Family Clothing Stores 46 $1,033,307
441110 New Car Dealers 28 $1,020,711
424490 Other Grocery and Related Products Merchant Wholesalers20 $991,222
423430 Computer and Computer Peripheral Equipment and Software Merchant Wholesalers20 $979,475
Draft -- Not for Distribution or Circulation
16
Note that there are very few large-job manuafacturing opportunities on the top-40 list.
This is because local demand for any given manufacturer is small. Most manufacturers
must serve a broader population, regionally or globally, to achieve competitive scale.
The exceptions, where local production could generate a significant number of new jobs,
include computers, software, and plastics. The people who would fill these jobs tend to
be well-educated and well-paid.
IMPLAN Leakage Analysis
A more comprehensive leakage analysis is possible using IMPLAN, the Minnesota Input-
Output Model used extensively by economic development agencies nationwide.
IMPLAN corrects, unifies, and fills in gaps (like farmers and self-employed individuals)
in the Economic Census data. It also can model how changes in one industry can lead to
changes in other industries (indirect effects) and changes in personal consumption
(induced effects).
IMPLAN combines the 1,100 NAICS sectors into about 460 model-specific sectors. For
example, multiple wholesale sectors in NAICS are reduced to one wholesale sector in
IMPLAN. It’s possible to model local self-reliance by looking at the value of the
Regional Purchasing Coefficient (RPC), which estimates how much of Total Gross
Demand is currently met by local industry. The demand figure includes both local and
nonlocal consumption. Multiplying Total Gross Demand by 1-RPC shows how much
additional industry is possible to meet local demand (without reducing production for
export).
When IMPLAN is used to study very small areas, as is the case in this study, the model
has many zero-activity sectors. To model a self-reliant economy, these sectors – most in
manufacturing – need to be created with a minimum of one worker. ―Production
functions‖ based on national composites of industries are then imported to show the
linkage of new sector’s expenditures with other local industries.
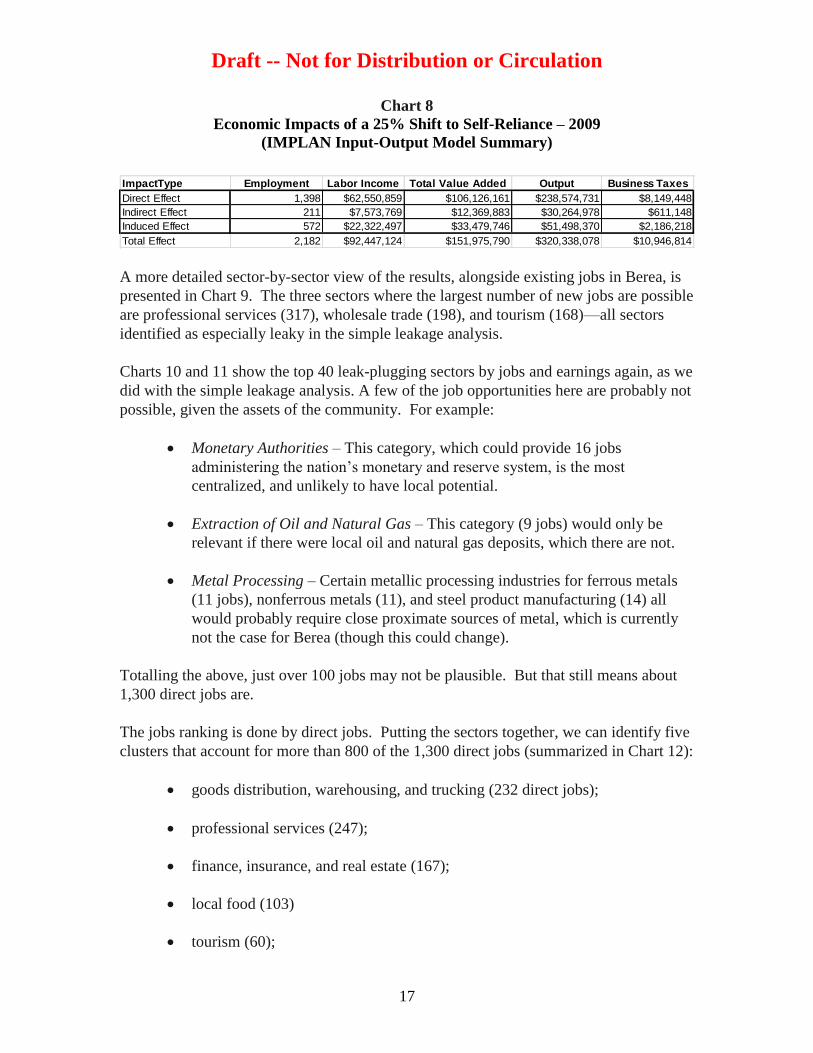
Chart 8 shows the total impact of ramping up industry in Berea to go 25% of the way to
meet total existing local demand. Specifically, 25% localization would generate 2,182
new jobs: 1,398 directly, 211 indirectly, and 572 induced. Note that the estimate of
1,398 direct jobs is very close to the 1,435 jobs new predicted with the BALLE
calculator. IMPLAN predicts, moreover, that these new jobs will lead to $92 million
more in wages each year, $152 million in additional annual value-added production, and
$11 million in indirect business taxes.
Draft -- Not for Distribution or Circulation
17
Chart 8
Economic Impacts of a 25% Shift to Self-Reliance – 2009
(IMPLAN Input-Output Model Summary)
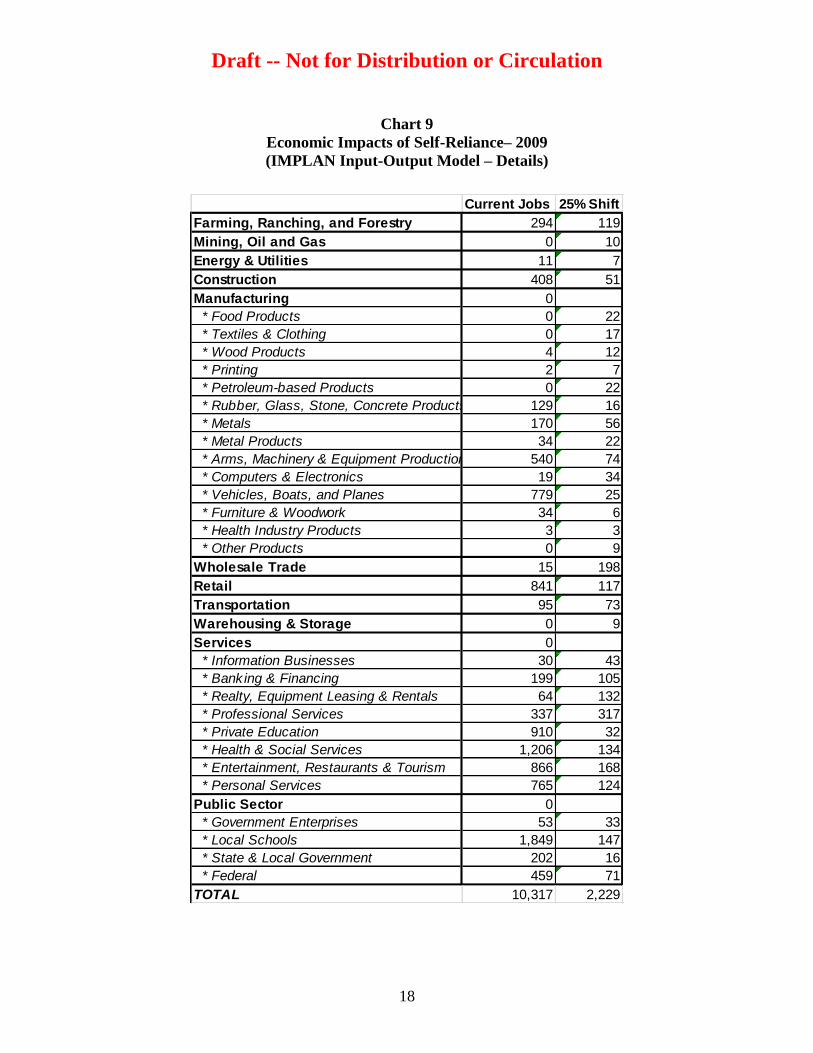
A more detailed sector-by-sector view of the results, alongside existing jobs in Berea, is
presented in Chart 9. The three sectors where the largest number of new jobs are possible
are professional services (317), wholesale trade (198), and tourism (168)—all sectors
identified as especially leaky in the simple leakage analysis.
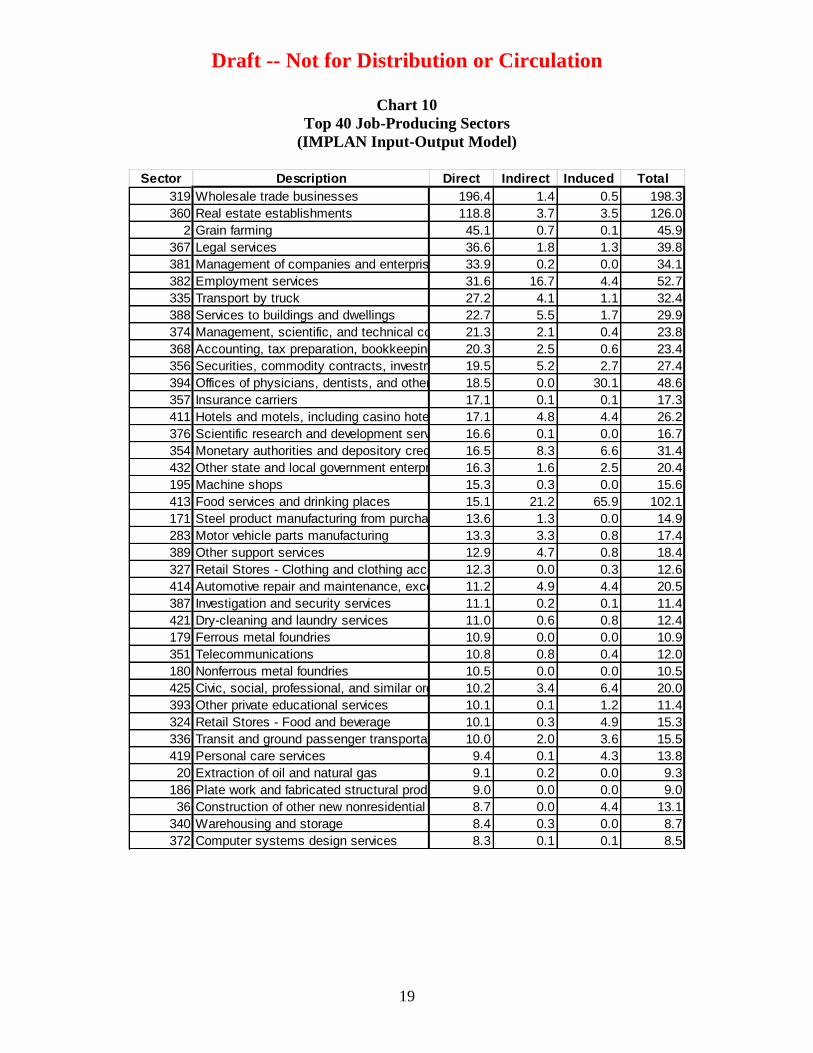
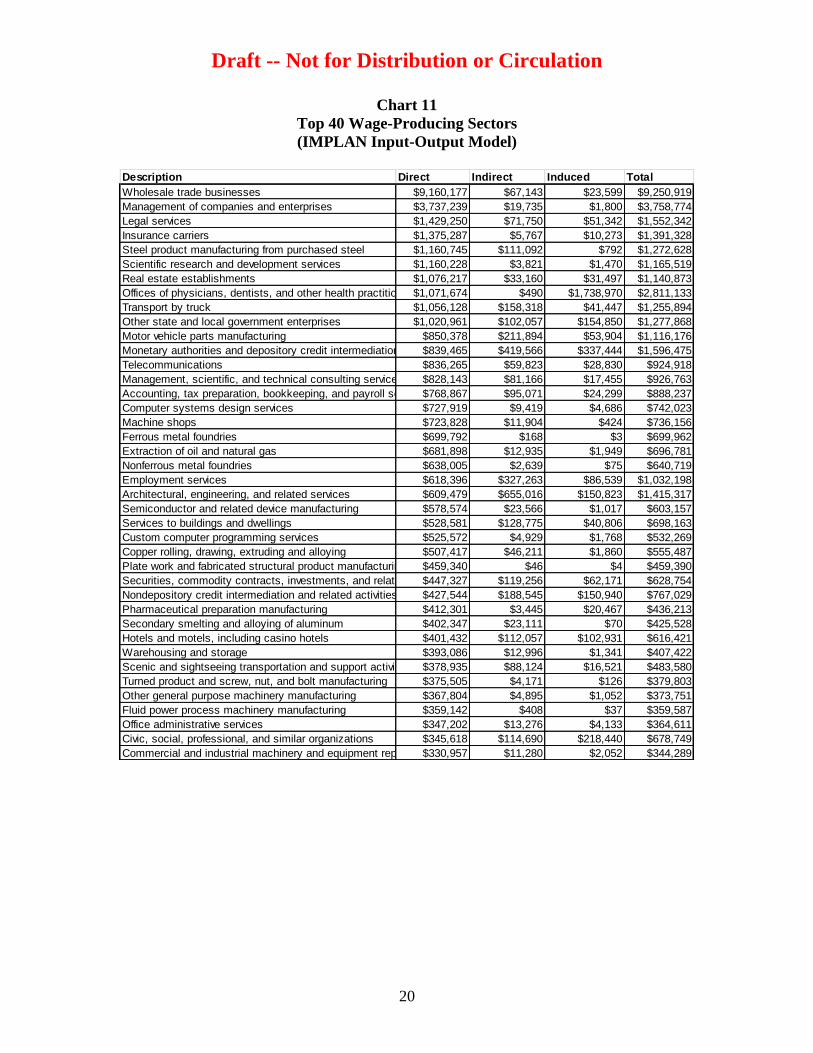
Charts 10 and 11 show the top 40 leak-plugging sectors by jobs and earnings again, as we
did with the simple leakage analysis. A few of the job opportunities here are probably not
possible, given the assets of the community. For example:
Monetary Authorities – This category, which could provide 16 jobs
administering the nation’s monetary and reserve system, is the most
centralized, and unlikely to have local potential.
Extraction of Oil and Natural Gas – This category (9 jobs) would only be
relevant if there were local oil and natural gas deposits, which there are not.
Metal Processing – Certain metallic processing industries for ferrous metals
(11 jobs), nonferrous metals (11), and steel product manufacturing (14) all
would probably require close proximate sources of metal, which is currently
not the case for Berea (though this could change).
Totalling the above, just over 100 jobs may not be plausible. But that still means about
1,300 direct jobs are.
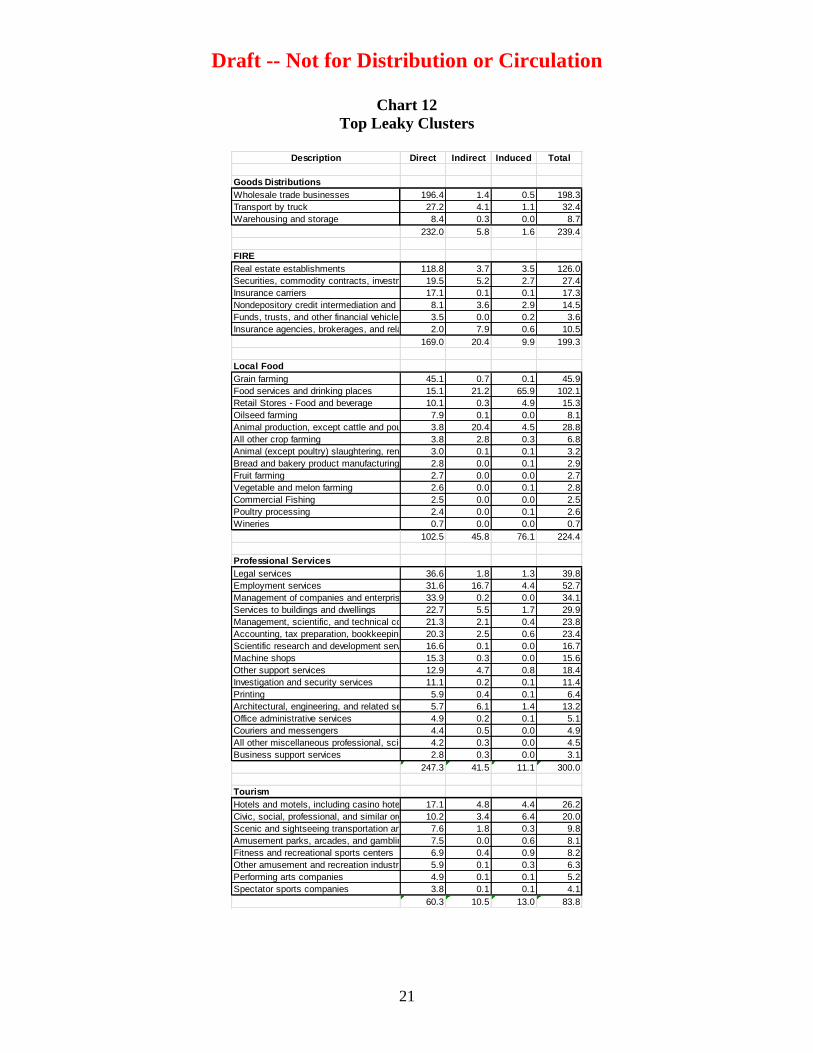
The jobs ranking is done by direct jobs. Putting the sectors together, we can identify five
clusters that account for more than 800 of the 1,300 direct jobs (summarized in Chart 12):
goods distribution, warehousing, and trucking (232 direct jobs);
professional services (247);
finance, insurance, and real estate (167);
local food (103)
tourism (60);
ImpactType Employment Labor Income Total Value Added Output Business Taxes
Direct Effect 1,398 $62,550,859 $106,126,161 $238,574,731 $8,149,448
Indirect Effect 211 $7,573,769 $12,369,883 $30,264,978 $611,148
Induced Effect 572 $22,322,497 $33,479,746 $51,498,370 $2,186,218
Total Effect 2,182 $92,447,124 $151,975,790 $320,338,078 $10,946,814
Draft -- Not for Distribution or Circulation
18
Chart 9
Economic Impacts of Self-Reliance– 2009
(IMPLAN Input-Output Model – Details)
Current Jobs 25% Shift
Farming, Ranching, and Forestry 294 119
Mining, Oil and Gas 0 10
Energy & Utilities 11 7
Construction 408 51
Manufacturing 0
* Food Products 0 22
* Textiles & Clothing 0 17
* Wood Products 4 12
* Printing 2 7
* Petroleum-based Products 0 22
* Rubber, Glass, Stone, Concrete Products 129 16
* Metals 170 56
* Metal Products 34 22
* Arms, Machinery & Equipment Production 540 74
* Computers & Electronics 19 34
* Vehicles, Boats, and Planes 779 25
* Furniture & Woodwork 34 6
* Health Industry Products 3 3
* Other Products 0 9
Wholesale Trade 15 198
Retail 841 117
Transportation 95 73
Warehousing & Storage 0 9
Services 0
* Information Businesses 30 43
* Bank ing & Financing 199 105
* Realty, Equipment Leasing & Rentals 64 132
* Professional Services 337 317
* Private Education 910 32
* Health & Social Services 1,206 134
* Entertainment, Restaurants & Tourism 866 168
* Personal Services 765 124
Public Sector 0
* Government Enterprises 53 33
* Local Schools 1,849 147
* State & Local Government 202 16
* Federal 459 71
TOTAL 10,317 2,229
Draft -- Not for Distribution or Circulation
19
Chart 10
Top 40 Job-Producing Sectors
(IMPLAN Input-Output Model)
Sector Description Direct Indirect Induced Total
319 Wholesale trade businesses 196.4 1.4 0.5 198.3
360 Real estate establishments 118.8 3.7 3.5 126.0
2 Grain farming 45.1 0.7 0.1 45.9
367 Legal services 36.6 1.8 1.3 39.8
381 Management of companies and enterprises 33.9 0.2 0.0 34.1
382 Employment services 31.6 16.7 4.4 52.7
335 Transport by truck 27.2 4.1 1.1 32.4
388 Services to buildings and dwellings 22.7 5.5 1.7 29.9
374 Management, scientific, and technical consulting services21.3 2.1 0.4 23.8
368 Accounting, tax preparation, bookkeeping, and payroll services20.3 2.5 0.6 23.4
356 Securities, commodity contracts, investments, and related activities19.5 5.2 2.7 27.4
394 Offices of physicians, dentists, and other health practitioners18.5 0.0 30.1 48.6
357 Insurance carriers 17.1 0.1 0.1 17.3
411 Hotels and motels, including casino hotels 17.1 4.8 4.4 26.2
376 Scientific research and development services 16.6 0.1 0.0 16.7
354 Monetary authorities and depository credit intermediation activities16.5 8.3 6.6 31.4
432 Other state and local government enterprises 16.3 1.6 2.5 20.4
195 Machine shops 15.3 0.3 0.0 15.6
413 Food services and drinking places 15.1 21.2 65.9 102.1
171 Steel product manufacturing from purchased steel13.6 1.3 0.0 14.9
283 Motor vehicle parts manufacturing 13.3 3.3 0.8 17.4
389 Other support services 12.9 4.7 0.8 18.4
327 Retail Stores - Clothing and clothing accessories12.3 0.0 0.3 12.6
414 Automotive repair and maintenance, except car washes11.2 4.9 4.4 20.5
387 Investigation and security services 11.1 0.2 0.1 11.4
421 Dry-cleaning and laundry services 11.0 0.6 0.8 12.4
179 Ferrous metal foundries 10.9 0.0 0.0 10.9
351 Telecommunications 10.8 0.8 0.4 12.0
180 Nonferrous metal foundries 10.5 0.0 0.0 10.5
425 Civic, social, professional, and similar organizations10.2 3.4 6.4 20.0
393 Other private educational services 10.1 0.1 1.2 11.4
324 Retail Stores - Food and beverage 10.1 0.3 4.9 15.3
336 Transit and ground passenger transportation 10.0 2.0 3.6 15.5
419 Personal care services 9.4 0.1 4.3 13.8
20 Extraction of oil and natural gas 9.1 0.2 0.0 9.3
186 Plate work and fabricated structural product manufacturing9.0 0.0 0.0 9.0
36 Construction of other new nonresidential structures8.7 0.0 4.4 13.1
340 Warehousing and storage 8.4 0.3 0.0 8.7
372 Computer systems design services 8.3 0.1 0.1 8.5
Draft -- Not for Distribution or Circulation
20
Chart 11
Top 40 Wage-Producing Sectors
(IMPLAN Input-Output Model)
Description Direct Indirect Induced Total
Wholesale trade businesses $9,160,177 $67,143 $23,599 $9,250,919
Management of companies and enterprises $3,737,239 $19,735 $1,800 $3,758,774
Legal services $1,429,250 $71,750 $51,342 $1,552,342
Insurance carriers $1,375,287 $5,767 $10,273 $1,391,328
Steel product manufacturing from purchased steel $1,160,745 $111,092 $792 $1,272,628
Scientific research and development services $1,160,228 $3,821 $1,470 $1,165,519
Real estate establishments $1,076,217 $33,160 $31,497 $1,140,873
Offices of physicians, dentists, and other health practitioners$1,071,674 $490 $1,738,970 $2,811,133
Transport by truck $1,056,128 $158,318 $41,447 $1,255,894
Other state and local government enterprises $1,020,961 $102,057 $154,850 $1,277,868
Motor vehicle parts manufacturing $850,378 $211,894 $53,904 $1,116,176
Monetary authorities and depository credit intermediation activities$839,465 $419,566 $337,444 $1,596,475
Telecommunications $836,265 $59,823 $28,830 $924,918
Management, scientific, and technical consulting services $828,143 $81,166 $17,455 $926,763
Accounting, tax preparation, bookkeeping, and payroll services$768,867 $95,071 $24,299 $888,237
Computer systems design services $727,919 $9,419 $4,686 $742,023
Machine shops $723,828 $11,904 $424 $736,156
Ferrous metal foundries $699,792 $168 $3 $699,962
Extraction of oil and natural gas $681,898 $12,935 $1,949 $696,781
Nonferrous metal foundries $638,005 $2,639 $75 $640,719
Employment services $618,396 $327,263 $86,539 $1,032,198
Architectural, engineering, and related services $609,479 $655,016 $150,823 $1,415,317
Semiconductor and related device manufacturing $578,574 $23,566 $1,017 $603,157
Services to buildings and dwellings $528,581 $128,775 $40,806 $698,163
Custom computer programming services $525,572 $4,929 $1,768 $532,269
Copper rolling, drawing, extruding and alloying $507,417 $46,211 $1,860 $555,487
Plate work and fabricated structural product manufacturing $459,340 $46 $4 $459,390
Securities, commodity contracts, investments, and related activities$447,327 $119,256 $62,171 $628,754
Nondepository credit intermediation and related activities $427,544 $188,545 $150,940 $767,029
Pharmaceutical preparation manufacturing $412,301 $3,445 $20,467 $436,213
Secondary smelting and alloying of aluminum $402,347 $23,111 $70 $425,528
Hotels and motels, including casino hotels $401,432 $112,057 $102,931 $616,421
Warehousing and storage $393,086 $12,996 $1,341 $407,422
Scenic and sightseeing transportation and support activities for transportation$378,935 $88,124 $16,521 $483,580
Turned product and screw, nut, and bolt manufacturing $375,505 $4,171 $126 $379,803
Other general purpose machinery manufacturing $367,804 $4,895 $1,052 $373,751
Fluid power process machinery manufacturing $359,142 $408 $37 $359,587
Office administrative services $347,202 $13,276 $4,133 $364,611
Civic, social, professional, and similar organizations $345,618 $114,690 $218,440 $678,749
Commercial and industrial machinery and equipment repair and maintenance$330,957 $11,280 $2,052 $344,289
Draft -- Not for Distribution or Circulation
21
Chart 12
Top Leaky Clusters
Description Direct Indirect Induced Total
Goods Distributions
Wholesale trade businesses 196.4 1.4 0.5 198.3
Transport by truck 27.2 4.1 1.1 32.4
Warehousing and storage 8.4 0.3 0.0 8.7
232.0 5.8 1.6 239.4
FIRE
Real estate establishments 118.8 3.7 3.5 126.0
Securities, commodity contracts, investments, and related activities19.5 5.2 2.7 27.4
Insurance carriers 17.1 0.1 0.1 17.3
Nondepository credit intermediation and related activities8.1 3.6 2.9 14.5
Funds, trusts, and other financial vehicles 3.5 0.0 0.2 3.6
Insurance agencies, brokerages, and related activities2.0 7.9 0.6 10.5
169.0 20.4 9.9 199.3
Local Food
Grain farming 45.1 0.7 0.1 45.9
Food services and drinking places 15.1 21.2 65.9 102.1
Retail Stores - Food and beverage 10.1 0.3 4.9 15.3
Oilseed farming 7.9 0.1 0.0 8.1
Animal production, except cattle and poultry and eggs3.8 20.4 4.5 28.8
All other crop farming 3.8 2.8 0.3 6.8
Animal (except poultry) slaughtering, rendering, and processing3.0 0.1 0.1 3.2
Bread and bakery product manufacturing 2.8 0.0 0.1 2.9
Fruit farming 2.7 0.0 0.0 2.7
Vegetable and melon farming 2.6 0.0 0.1 2.8
Commercial Fishing 2.5 0.0 0.0 2.5
Poultry processing 2.4 0.0 0.1 2.6
Wineries 0.7 0.0 0.0 0.7
102.5 45.8 76.1 224.4
Professional Services
Legal services 36.6 1.8 1.3 39.8
Employment services 31.6 16.7 4.4 52.7
Management of companies and enterprises 33.9 0.2 0.0 34.1
Services to buildings and dwellings 22.7 5.5 1.7 29.9
Management, scientific, and technical consulting services21.3 2.1 0.4 23.8
Accounting, tax preparation, bookkeeping, and payroll services20.3 2.5 0.6 23.4
Scientific research and development services 16.6 0.1 0.0 16.7
Machine shops 15.3 0.3 0.0 15.6
Other support services 12.9 4.7 0.8 18.4
Investigation and security services 11.1 0.2 0.1 11.4
Printing 5.9 0.4 0.1 6.4
Architectural, engineering, and related services 5.7 6.1 1.4 13.2
Office administrative services 4.9 0.2 0.1 5.1
Couriers and messengers 4.4 0.5 0.0 4.9
All other miscellaneous professional, scientific, and technical services4.2 0.3 0.0 4.5
Business support services 2.8 0.3 0.0 3.1
247.3 41.5 11.1 300.0
Tourism
Hotels and motels, including casino hotels 17.1 4.8 4.4 26.2
Civic, social, professional, and similar organizations10.2 3.4 6.4 20.0
Scenic and sightseeing transportation and support activities for transportation7.6 1.8 0.3 9.8
Amusement parks, arcades, and gambling industries7.5 0.0 0.6 8.1
Fitness and recreational sports centers 6.9 0.4 0.9 8.2
Other amusement and recreation industries 5.9 0.1 0.3 6.3
Performing arts companies 4.9 0.1 0.1 5.2
Spectator sports companies 3.8 0.1 0.1 4.1
60.3 10.5 13.0 83.8
Draft -- Not for Distribution or Circulation
22
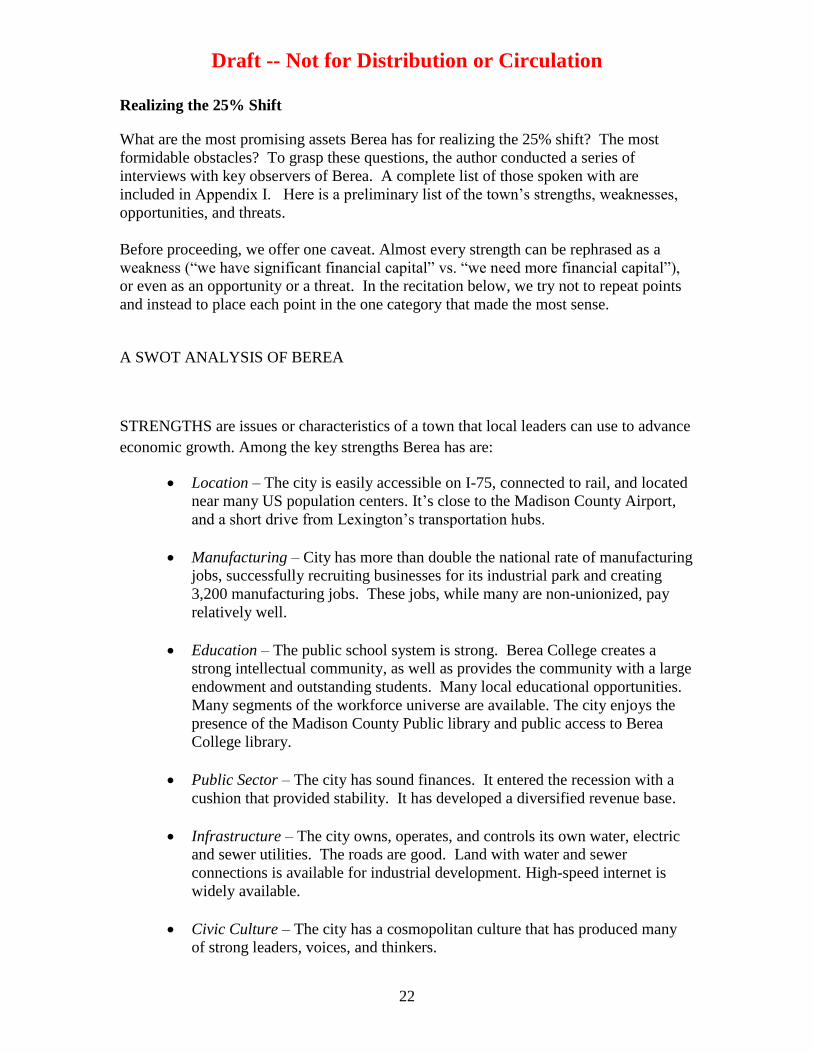
Realizing the 25% Shift
What are the most promising assets Berea has for realizing the 25% shift? The most
formidable obstacles? To grasp these questions, the author conducted a series of
interviews with key observers of Berea. A complete list of those spoken with are
included in Appendix I. Here is a preliminary list of the town’s strengths, weaknesses,
opportunities, and threats.
Before proceeding, we offer one caveat. Almost every strength can be rephrased as a
weakness (―we have significant financial capital‖ vs. ―we need more financial capital‖),
or even as an opportunity or a threat. In the recitation below, we try not to repeat points
and instead to place each point in the one category that made the most sense.
A SWOT ANALYSIS OF BEREA
STRENGTHS are issues or characteristics of a town that local leaders can use to advance
economic growth. Among the key strengths Berea has are:
Location – The city is easily accessible on I-75, connected to rail, and located
near many US population centers. It’s close to the Madison County Airport,
and a short drive from Lexington’s transportation hubs.
Manufacturing – City has more than double the national rate of manufacturing
jobs, successfully recruiting businesses for its industrial park and creating
3,200 manufacturing jobs. These jobs, while many are non-unionized, pay
relatively well.
Education – The public school system is strong. Berea College creates a
strong intellectual community, as well as provides the community with a large
endowment and outstanding students. Many local educational opportunities.
Many segments of the workforce universe are available. The city enjoys the
presence of the Madison County Public library and public access to Berea
College library.
Public Sector – The city has sound finances. It entered the recession with a
cushion that provided stability. It has developed a diversified revenue base.
Infrastructure – The city owns, operates, and controls its own water, electric
and sewer utilities. The roads are good. Land with water and sewer
connections is available for industrial development. High-speed internet is
widely available.
Civic Culture – The city has a cosmopolitan culture that has produced many
of strong leaders, voices, and thinkers.
Draft -- Not for Distribution or Circulation
23
Tourism – The city has a cosmopolitan local culture that is interesting for
outside visitors. It has numerous studio artists and crafts products. The rtisan
Center Designation, as long as the city’s designation as the as the Folk Arts
and Crafts Capital of Kentucky, has given this community greater visibility.
A well-coordinated tourism effort with adequate funding, successful
expansion of online Kentucky goods promotion;
Local Businesses – The city has several healthy sectors of local business. It is
the expansion of the local food movement. It has strong local banks and
credit unions. And it has nationally respected nonprofits like MACED.
Quality of Life – The city is scenic and environmentally rich. Taxes are low
(9.9 cents per $100 valuation compared to state average of 22 cents). The
crime rate is low. High-quality health care is available. There are many
recreational facilities, including pools, athletic fields, golf course, and
ahandicapped-accessible play ground.
WEAKNESSES are issues or characteristics that, if not addressed effectively, could limit
economic growth. For example, some of the following might be listed as weaknesses:
Limits to Manufacturing – The manufacturing base of the city is not locally
owned or controlled. It is overly dependent on the automotive sector. It has
many employees who do not live in Berea, which means that property taxes
are paid to other communities.
Finance Gaps – There is limited available investment capital for local
businesses, especially for start-ups.
Empty Storefronts – Local retailers have had a particularly difficult time
succeeding in Berea. This, despite the absence of local retail outlets for
clothing and groceries. Arts businesses not capable of filling these spaces.
Many Berea residents are not shopping ―local first.‖ Some retail areas lack
adequate parking.
No Fun – The city has limited entertainment opportunities: no movie theaters,
no skating rinks, no bars, early-closing and limited restaurants. This, along
with limited hotels, contributes to the city’s underperforming tourism sector.
Limited Entrepreneurship – Financing gaps, coupled with the absence of a
single place where entrepreneurs can go for assistance, has stunted the growth
of new local business.
Draft -- Not for Distribution or Circulation
24
Youth Out-Migration – The absence of fun and entrepreneurship opportunities
convinces many young people – especially the best and brightest – to leave
the community after being graduated from high school.
Tourism Deficits – Despite the city’s efforts to ramp up tourism, there are odd
shortcomings. The Artisan Center is disconnected from downtown Berea, and
this is not remedied by existing signs or roads. Small meeting spaces, like
those in the Artisan Center, are undersubscribed. Large meeting spaces, like a
conference center sought by the Chamber of Commerce, do not exist. The
artisan population that lies at the center of local tourism efforts is aging.
Workforce Shortcomings – The local workforce that often lacks basic job
skills (balance checkbook; arrive on time).
OPPORTUNITIES are assets, events, or trends that offer Berea the potential for
economic growth. For example, some of the following might be listed as opportunities:
Physical Assets – Berea has land in its industrial park and throughout the city
to facilitate all kinds of business growth, including more manufacturing.
Existing state-funded infra-structure improvement projects already designed
and budgeted. The Bluegrass Army Depot also provides opportunities for
economic development.
Regional Growth -- Significant growth in the I-75 corridor is expected. The
Madison County Airport may well expand.
Industrial Park – Existing companies could attract similar or supplier
companies to the area. Hitachi’s contract to produce an electric engine for
Hitachi’s contract to produce an electric engine for General Motors starting in
2012
Entrepreneurship Innovations – One proposal that would add to the
entrepreneurship resources of the region is a vocational school. Another is a
proposed partnership between EKU and Berea College for worker- retraining
programs. Others have proposed life-skill programs for unemployed workers
and new entrepreneurship programs. Yet another is to expand youth
entrepreneurship and mentorship programs.
Arts & Crafts – Berea’s existing reputation as an arts center could be built
upon. The Artisan Center’s role could be ramped up, tours of working-artist
studios could be created, and arts-in-the-curriculum programs for school
children could be expanded. The Chestnut Street connector proposal as a way
to fill empty lease space between the Old Town and College Square arts
districts with galleries and working-artist studios. The Arts Council could be
retained in one of Berea’s arts district.
Draft -- Not for Distribution or Circulation
25
Broader Approach to Tourism –But there is interest in the area to focus on
much more than folk arts and crafts. Tourism could emphasize local scenery,
sports tournaments, recreational activities like biking, music, and dance, local
history and culture, and local examples of sustainable living. Many fairs and
festivals throughout the year that support this definition, including a proposal
to combine workshops with festivals starting later this year.
Other Approaches to Economic Development – Wherever a critical mass of
excitement exists around an approach to economic development, it can and
should be seized. Currently, for example, substantial numbers of Berea
residents are eager to do all the following: create a new conference center;
expand the Boone Tavern; create (through United Church Homes) a
retirement community in Berea to augment existing skilled-nursing and long-
term care facilities; integrate Berea College more thoroughly into the city’s
economic growth (through more local investment, for example); promote
―think local first‖ campaigns and expand existing efforts around buy-local and
local currencies; expand the local food system through more farming, farmers
markets, and vineyards; formalize and empower the vast network of home-
based businesses in the community. The surest path to consensus in the city
might be for the government to support ALL these efforts equally.
Partners – Many partners exist in the region to help realize the opportunities
above. These include SKEN, Kentucky Ventures Corp., Kentucky Science
and Tech Corporation, Eastern Kentucky University, Kentucky Highlands,
KEAN, Coaches Institute, UK Appalachian Center, etc.
THREATS are obstacles, events, or trends that, if not addressed effectively, could
diminish Berea’s economic potential and its ability to create jobs. For example, some of
the following might be listed as threats:
Traffic Patterns – The Berea bypass could divert traffic from downtown areas,
threatening local retailers even further.
Aging Population – Like the rest of the country, Berea’s population is getting
older. The exit of young people, however, is accelerating this trend.
Infrastructure -- Water might become limited, as might energy. Roads need
upgrading and repair.
Globalization – Major companies in Berea might continue to offshore some
manufacturing jobs. Because the city’s revenue streams, while more
diversified than they one were, still depend heavily on payroll taxes,
offshoring could be particularly devastating to the city’s budget.
Draft -- Not for Distribution or Circulation
26
Over-focus on Corporate Attraction – The city’s focus on attracting outside
manufacturers, while successful thus far, could, if continued, prevent the
deployment of other economic-development strategies.
Investment Capital – Capital gaps facing local businesses could get worse.
Outside corporations might lose interest in Berea. Pension funds and other
investment institutions might continue to invest nonlocally.
Disasters – Close proximity to storage depots with old nerve gas is fraught
with danger.
Unplanned Growth – The city’s small-town character could be lost through
unplanned growth and development. Contributing to poor planning is the
absence of regional cooperation in economic development.
Poor Public Policies – Public policy choices made outside the city could
adversely impact the community. The Kentucky tax structure inhibits
regional cooperation on economic development. Enlargement of FEMA flood
area could limit development. State and federal funding for special projects is
likely to decline.
Divisions – Deep divisions within the community on some issues could
continue to prevent a more consensual, multi-strategy approach to economic
development. These divisions currently include whether to change alcohol
laws, whether to embrace gay and lesbian rights, whether to use public money
to build a convention center, whether to continue the tourism tax, and how
closely to work with Berea College.