DR45 - Town of Port Hedland - ANNUAL REPORT 201314 · PDF fileTroy Melville Councillor ... The...
116
Creating a nationally significant friendly city that people are proud to call home 2013-2014 Community Economic Environment Local Leadership
Transcript of DR45 - Town of Port Hedland - ANNUAL REPORT 201314 · PDF fileTroy Melville Councillor ... The...

Creating a nationally signifi cant
friendly city that people are proud to
call home
2013-2014
Community Economic Environment Local Leadership

2

Message from the Mayor ................................................ 4
Chief Executive Offi cer’s Report .................................... 5
Council as of 30 June 2014 ............................................. 6
Management as of 30 June 2014 ................................... 8
Port Hedland: who we are .............................................. 10
Port Hedland: Pilbara’s Port City ................................... 11
Employee remuneration - salary range $ ...................... 12
Councillor attendance - July 2013 to June 2014 .......... 13
National competition and policy statement .................. 14
Information management update .................................. 16
Disability Access and Inclusion Plan ............................. 17
Our performance 2013-2014 ........................................... 18
Financial Statements 2013-2014 .................................... 28
Contents
3

4
It’s an exciting time in Port Hedland as we continue our journey to
becoming a nationally signifi cant friendly city where people are proud to
call home. Much work has been accomplished and some truly impressive
results realised. While we have already achieved great things, there is
more ground to be covered on our journey to achieving our vision.
I am pleased to present the 2013/14 Town of Port Hedland Annual Report
which documents our achievements during the past fi nancial year, outlines
our fi nancial position and highlights key projects for the coming year.
We know that our region signifi cantly contributes to the Western
Australian and national economies and at the same time we enjoy high
quality facilities and services. Rapid growth has brought many positive
changes to our community and set us on the path to becoming a vibrant
and attractive regional city. 2013/14 saw the delivery of some major
infrastructure projects for the town and the introduction of key community
initiatives:
• In August 2013 we held the second North West Festival with
3,854 people attending the event
• Renovation works to the
Port Hedland International Airport
commenced in June 2014. The
$1.2 million interim works
program will signifi cantly
improve passenger fl ow
within the terminal and start
to create a space that is
refl ective of Port Hedland
and its stunning landscape.
• Koombana Park received a $650,000 facelift including more
playground equipment, BBQ facilities, shelter, a sealed car park and
CCTV cameras. The upgrade was project managed by the Town with
funding from Royalties for Regions.
• In June 2014 we opened the new $4 million South Hedland Bowling
and Tennis Club which was project managed by the Town with funding
by the State Government’s Royalties for Regions program through the
Pilbara Development Commission ($2.5 million), BHP Billiton Iron Ore
($1 million) and the South Hedland Bowling and Tennis Club ($500,000
via a self-supporting loan from the Town).
• The Great Northern Highway realignment and Wallwork Road Bridge
were both completed providing a safer uninterrupted road network
• $1 pool entry fee was introduced at our aquatic centres in an effort to
improve youth engagement
• 24 hour gym service at Wanangkura Stadium was introduced to
provide greater fl exibility for our community
• In-term swimming was re-introduced with support from Atlas Iron,
Fortescue Metals Group and the Port Hedland Chamber of Commerce
At the October 2013 Local Government Elections we welcomed three new
elected members – Lorraine Butson, Troy Melville and David Van Vugt –
and previous members Jan Gillingham and David Hooper to the council
body. I’d like to thank outgoing Elected Members Arnold Carter and Bill
Dziombak for their tremendous efforts in serving the community over the
period of their respective terms. It is an honour and privilege to represent
our community at a local, State or Federal level and one that my fellow
elected members and I take very seriously. It is exciting to have new
elected members on Council as they bring with them new perspectives.
I would also like to thank the Town of Port Hedland Chief Executive Offi cer
Mal Osborne and staff for their ongoing dedication and commitment.
Together we are committed to transforming this town into a vibrant
attractive regional city.
Kelly Howlett
Mayor
Message from the Mayor

5
Looking back on the 2013/14 year, I am pleased to report that the Town
of Port Hedland has successfully improved its fi nancial position, delivered
many key projects and continued to provide essential services for our
community.
Going into the 2013/14 year, the Town faced the challenge of achieving an
effi ciency dividend of $1.93 million which refl ected the rapid rate of growth
we had experienced over the past three years. We had been focused on
growing for growth – which meant building the necessary infrastructure
and services to prepare for an increased population and industry. During
this time we saw the construction of new facilities like Wanangkura
Stadium and Marquee Park, and the upgrade of existing facilities including
the JD Hardie Youth Zone, the South Hedland Aquatic Centre and the
Matt Dann Theatre and Cinema. We’ve also worked with Horizon Power to
implement the Pilbara Underground Power Project in South Hedland and
Wedgefi eld and introduced subsidised housing for GPs in partnership with
BHP Billiton Iron Ore and Royalties for Regions.
With all of these major projects and services delivered, we’re now focused
on growing with growth – consolidating our projects, appropriately
managing our existing assets, improving the provision of services and
developing current and future business and investment opportunities.
To address our effi ciency dividend of $1.93 million we consolidated our
operations and identifi ed areas where methods and processes could be
improved to achieve increased productivity. This included an organisational
restructure with 15 contracted positions being made redundant. It was a
diffi cult period for the administration, however I believe we have come out
stronger and with a more united staff body.
Some highlights of 2013/14:
• Rolling out of our organisational values “Our Team, Our Way” and
implementing our employee wellness program
• Continually improving the way we manage our assets and relationships
with tenants with the introduction of a new community leasing policy
• Holding the biggest citizenship ceremony for Port Hedland held on
Australia Day welcoming 63 new citizens to our country
• Looking internally to improve our systems and processes such as
fi nance, records and IT
• Progress on the proposed solar farm project in Precinct 3 including
advertising for a Request for Proposal
• Negotiating a cashless transaction with Megara for the development of
lots at Catamore Court, where Megara will build eight dwellings for staff
housing in exchange for the sale of the remaining lots
• Delivering on our commitment for continued asset improvement with
Wedgefi eld upgrades and drainage works
• Taking a moment to pause to check our vision and priorities are
on track by starting the review of our Strategic Community Plan,
Corporate Plan, Long-Term Financial Plan, IT and workforce plans
• Working to establish new waste to energy plant which will convert
majority of our industrial and municipal waste and convert to energy
(enough to power 21,000 homes) and with this establishing a new
landfi ll
• Announcing the Pilbara’s fi rst Bunnings and Dome Coffees
While the resources sector moves from construction to operations, our
town continues to grow with no evidence of ‘slowing down’. We are
progressing to achieving our vision of becoming a vibrant attractive
regional city and look forward to the journey.
2013/14 saw some signifi cant staff movements - we said farewell to two
outgoing directors, Corporate Services director Natalie
Octoman and Community Development
director Gordon MacMile. I’d like to
thank them for their contributions
to the Town. They will be greatly
missed by the staff.
I’d like to welcome our two new
directors - Clare Phelan who
steps into the role of Corporate
Services director and Eddie
Piper who will be acting in
the Community Development
director role for a fi xed term.
I look forward to working
closely with you to achieve our
organisational goals.
Last but not least I would like to
thank the Town’s staff for another
year of hard work and successful
outcomes.
Mal Osborne
Chief Executive
Offi cer
Chief Executive Offi cer’s Report

Council as of 30 June 2014
Kelly Howlett
Mayor
Term expiring Oct 2017
Gloria Jacob
Deputy Mayor
Term expiring Oct 2015
George Daccache
Councillor
Term expiring Oct 2015
Julie Hunt
Councillor
Term expiring Oct 2015
Jan Gillingham
Councillor
Term expiring Oct 2017
Troy Melville
Councillor
Term expiring Oct 2017
Penny Taylor
Councillor
Term expiring Oct 2015
Lorraine Butson
Councillor
Term expiring Oct 2017
David Van Vugt
Councillor
Term expiring Oct 2015
*resigned 1 May 2014
David Hooper
Councillor
Term expiring Oct 2017
Arnold Carter
Councillor
Term expired at October
2013 Local Government
Election
Bill Dziombak
Councillor
Term expired at October
2013 Local Government
Election
6

7

Executive Team — 2013/2014
Chief Executive
Offi cer
Mal Osborne
Director Engineering Services
Russell Dyer
Director Planning &
Development Services
Eber Butron
The CEO’s Offi ce is responsible for the overall management of the
Town of Port Hedland at an operational and strategic level.
The Engineering Services team oversees a range of services, such as:
• Infrastructure Development, including major projects and building
maintenance
• Waste Operations, including South Hedland Landfi ll
• Parks and Gardens
• Technical Services
• Engineering Operations
• Airport Operations
The Planning and Development directorate provides a range of
services including permit authority, building approvals, assisting
residents and developers with their planning and building
applications and community safety. It includes the following
departments:
• Planning Services
• Building Services
• Environmental Health Services (including emergency
management)
• Economic and Strategic Planning
• Ranger Services
8

Acting Director Community
Development
Eddie Piper
Director Community
Development
Gordon Macmile*resigned April 2014
Director Corporate Services
Natalie Octoman*resigned October 2013
Director Corporate Services
Clare Phelan
Corporate Services is responsible for high-quality corporate
support for the organisation. The directorate included the
following teams:
• Corporate Information
• People and Culture
• Asset Management and Commercial Property
• Finance
• Information Technology and Communications
• Customer Service
The Community Development team manages a range of community
facilities and events including:
• Matt Dann Theatre & Cinema
• JD Hardie Youth Zone
• Main events such as Australia Day Celebrations, Portbound, Spinifex
Spree Carnival and North West Festival
• Wanangkura Stadium
• South Hedland Aquatic Centre
• Gratwick Gym and Aquatic Centre
• All sporting grounds and reserves
• Sporting club development
9
Port Hedland: who we arePort Hedland is a dynamic town in Western Australia’s
beautiful North West. We are home to around 20,000 people
from diverse cultural backgrounds and cover 11,844 square
kilometres of the Pilbara region.
Our original inhabitants, the Karriyarra people, call the place
Marapikurrinya for the hand shaped formation of the tidal
creeks coming off the natural harbour.
Our lifestyle is relaxed and our location on the ocean provides
for a variety of leisure activities. Our two main residential
centres Port and South Hedland offer a range of community
services including cultural, recreation and shopping facilities.
The Wedgefi eld Industrial Area contains a variety of light
and service industry premises and the iron ore crushing and
shipping facilities are features synonymous with our rugged
landscape, along with the expanded port facilities.
We are proud to be the world’s largest bulk export port with
Pilbara Ports Authority recording a record annual tonnage
throughput of 372.3 million tonnes in 2013/14.
Our role is well established on the national and international
stage, attracting internationally prominent resource
companies and contributing at a nationally recognised level to
the broader Australian economy.
10

Port Hedland: Pilbara’s Port City
*(based on 2011 Census and 2014 accommodation surveys)
Area: 11, 844 square kilometres
Electricity supply: Horizon Power
Water supply: Water Corporation
Length of road: 181.65km sealed,
490.67 unsealed
Local industries: iron ore export,
salt, tourism, pastoral, light
industrial, transport
Distance from Perth:
1,765 kilometres via North
West Coastal Highway
1,638 kilometres via Great
Northern Highway
elected members
with one vacancy
(as of 30 June 2014)10
Total rates levied (2013/14): $22,522,391
Total operating revenue (2013/14): $76,370,000
• 40% are born overseas
• 21% are aged between 25 years and 34 years
• 15% are of Aboriginal or Torres Strait Islander descent
• Estimated 72 nationalities
New citizens naturalised 1 July 2013 to 30 June 2014:
• 98 adults
• 30 dependants/children
as of 30 June 2014
11
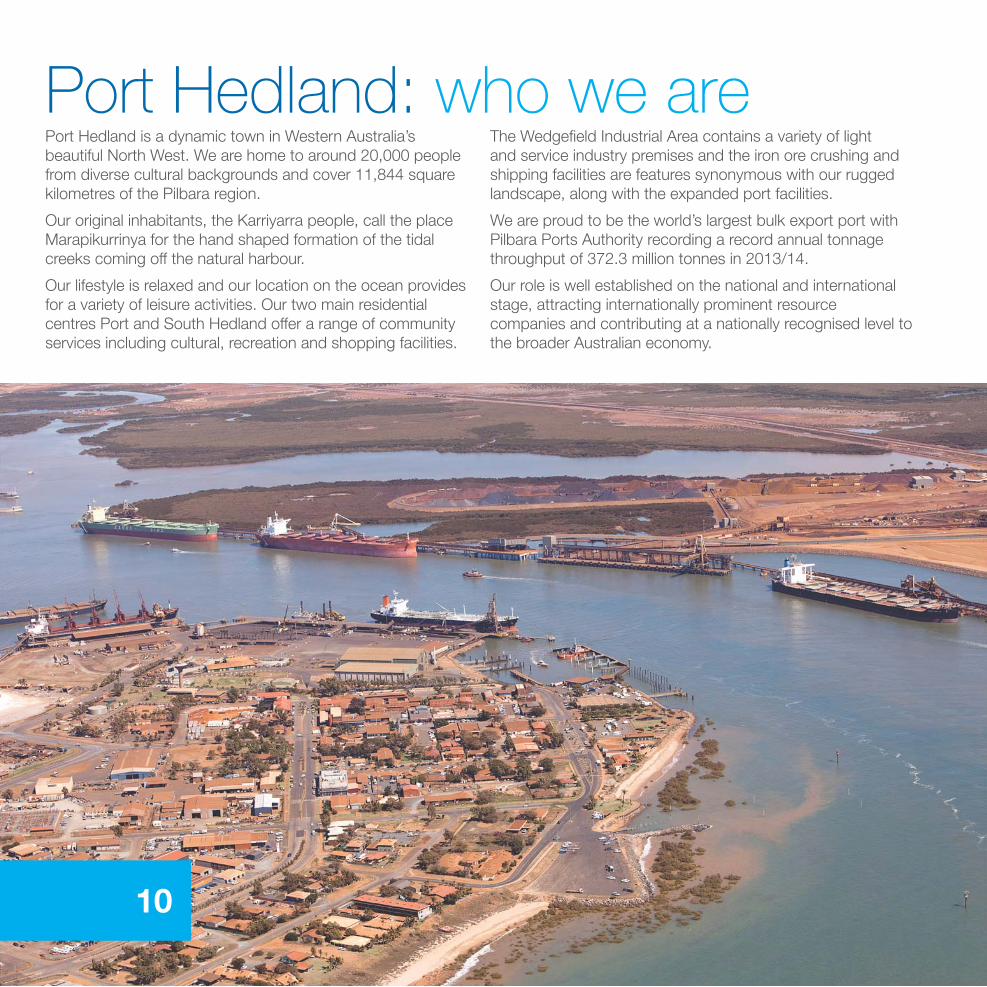
Number of staff receiving remuneration $100,000 pa and over as of 30 June 2014
$100,000 - $109,999 $110,000 - $119,999 $120,000 - $129,999 $130,000 - $139,999 $140,000 - $149,999 $150,000 - 159,999
2013 10 5 6 10 1 0
2014 7 9 1 0 11 2
Number of staff receiving remuneration $100,000 pa and over as of 30 June 2014
$160,000, 169,999 $170,000 - $179,999 $180,000 - $189,999 $190,000 - $199,999 $300,000 - $309,999 $310,000 - $319,999
2013 0 2 1 2 1 0
2014 0 0 3 1 1 1
Employee remuneration -
salary range $
Employees:
• 225 employees including casual staff
• 169 full-time employees
12

Elected Member attendance -
July 2013 to June 2014
Ordinary Council
Meetings (12)
Special Council
Meetings (6)
Electors Meeting (2) Total (20)
Mayor Kelly Howlett 10 5 2 17
Councillor Gloria Jacob 9 5 1 15
Councillor George Daccache 10 6 2 18
Councillor Jan Gillingham 10 5 2 17
Councillor David Hooper 10 5 2 17
Councillor Julie Hunt 10 5 1 16
Councillor Penny Taylor 8 4 2 14
Councillor Lorraine Butson* 9 of 9 3 of 3 2 14 of 14
Councillor Troy Melville* 8 of 9 2 of 3 1 11 of 14
Councillor David Van Vugt* 4 of 7 1 of 2 0 5 of 11
Councillor Arnold Carter* 1 of 3 3 of 3 N/A 4 of 6
Councillor Bill Dziombak 3 of 3 3 of 3 N/A 6 of 6
*Please note:
Councillor Carter’s position expired at the October 2013 Ordinary Local Government Elections.
Councillor Dziombak’s position expired at the October 2013 Ordinary Local Government Elections.
Councillor Butson was elected at the October 2013 Ordinary Local Government Elections.
Councillor Melville was elected at the October 2013 Ordinary Local Government Elections.
Councillor Van Vugt was elected at the October 2013 Ordinary Local Government Elections and resigned on 1 May 2014.
13

National competition and policy
statementThe Competition Principles Agreement is an Inter-government
Agreement between the Commonwealth and State/Territory
Governments that sets out how government will apply National
Competition Policy principles to public sector organisations within
their jurisdiction.
The State Government released a Policy Statement effective from
July 1996 called the Clause 7 Statement, which forms part of the
Competition Principles Agreement. The Clause 7 policy document
sets out nominated principles from the Agreement that now apply
to Local Government. The provisions of Clause 7 of the Competition
Principles Agreement require local government to report annually as
to the implementation, application and effects of the Competition
Policy.
The Competition Principles Agreement, under Clause 7, specifi es
three broad areas of reporting. These are:
• Competitive Neutrality
• Structural Review of Public Monopolies
• Legislative Review
In accordance with the requirements of the National Competition
Policy, the Town of Port Hedland makes the following disclosures
for 2013/2014.
Competitive Neutrality
The objective of competitive neutrality is introducing measures
which effectively remove any net competitive advantages arising as
a result government ownership of a business entity.
The Town of Port Hedland has previously assessed its operations
and considers that it has two business activities that would be
classed as signifi cant under the current guidelines.
The Town of Port Hedland does not operate a business enterprise
that has been classifi ed by the Australian Bureau of Statistics as
either a Public Trading Enterprise or Public Financial Enterprise.
The Port Hedland International Airport (PHIA) and the Town of Port
Hedland Landfi ll are both signifi cant business activity, as defi ned by
Clause 7 of the Competition Policy Statement, as they both have an
annual income from fees in excess of $200,000.
A Competitive Neutrality Review has previously been undertaken
where it was concluded that the Port Hedland International Airport
is not seen as unfairly taking advantage of its local government
ownership. Competitive Neutrality
Reviews will continue to be undertaken for the PHIA in the future.
For all other activities within the Town, opportunities are continually
being examined in order to generate effi ciency improvements. This
must be balanced with the type and level of service provision and
statutory and other.
An activity requiring scrutiny in this regard for the Town of Port
Hedland, and is not a public monopoly, is that of private works
on private property; however during 2013/14 no individual private
works project exceeded $200,000. The Town provides quotations
or submits tenders in order to win private works.
This process ensures the activity of private works is open to
competitive market testing.
The number of activities to which competitive neutrality principles
have been applied in the reporting period is Zero (0).
The number of activities to which competitive neutrality principles
have been considered but not applied in the reporting period is Zero
(0).
During the reporting period the Town of Port Hedland did not
become aware of any allegations of non-compliance with the
competitive neutrality principles made by a private entity against the
Town.
14
15
Structural Review of Public Monopolies
In relation to Structural review of public monopolies, the Town of
Port Hedland discloses the following:
• Structural reform principles have been applied to the following
number of activities in the reporting period: Zero (0); and
• Structural reform principles have been considered but not
applied to the following number of activities in the reporting
period: Zero (0)
As no structural reform has been applied to any activities, the review
requirements of principal SR.3 of Clause 7 of the Competition Policy
Statement have not been undertaken.
Legislative Review
Parties to the National Competition Policy package agreed that
legislation should not restrict competition unless:
• The benefi ts of the restriction to the community as a whole
outweigh the costs; and
• The objectives of the legislation can only be achieved by
restricting competition.
Accordingly, the Town of Port Hedland is required to implement
a systematic review of all of its existing legislation to determine
whether there are any direct or indirect effects on competition.
The Local Government Act 1995 requires all existing Local Laws to
be reviewed every eight years. As part of this process the intention
to review
Local Laws is advertised in the media giving residents and rate
payers the opportunity to comment on any proposed changes,
additions or deletions to the Town’s Local Laws.

The Town has an ongoing commitment to good records
management practices. The Town reviewed its 5 year Record
Keeping Plan in 2013 to ensure compliance with the State Records
Act 2000. The Town creates and maintains proper and adequate
records through its electronic records system, which provides
centralisation for all corporate documents and increases effi ciency
in document retrieval, storage and retention.
The Town continues to provide training to all staff to ensure they are
advised of their record keeping obligations and responsibilities.
During 2014/15 the Town will implement improvement to its
information management and record keeping processes with
a view to introducing a new electronic document management
system in 2015/16.
Information management updateReview of Local Laws
The Town commenced a review of its Local Laws with all the
project scheduled to be completed by 30 June 2015. Section
3.16 of the Local Government Act 1995 requires that all Local
Laws of a Local Government must be reviewed within an eight
year period after their commencement to determine if they should
remain unchanged or be repealed or amended.
During 2013/14 the Standing Orders Local Law was reviewed.
The following will be reviewed in 2014/15:
• Parking Local Law
• Dogs Local Law
• Cat Control Local Law
• Reserves and Foreshores Local Law
• Aquatic and Recreation Centres Local Law
• Town of Port Hedland International Airport Local Law
• Cemeteries Local Law
• Health Local Law
• Signs, Hoardings and Bill Postings Local Law
• Trading in Public Places Local Law
• General Provisions Local Law
Offi cial conduct report
The Local Government Act 1995 requires the Town to report
on the number of offi cial conduct complaints recorded under
Section 5.121 during a fi nancial year. The Town of Port Hedland
received no complaints of this nature during the 2013/14 fi nancial
year.
Freedom of Information (FOI) statistics
In accordance with Section 10(1) of the Freedom of Information Act
1992, residents have the right to access documents (which are not
otherwise exempt) held by State and Local Government agencies.
The table below illustrates all the applications received the Town of
Port Hedland in 2013/14.
Access Type Personal Non-personal Total
Access in full 1 3 4
Edited access 0 2 2
Access refused 0 0 0
No documents found 0 0 0
Withdrawn by
applicant
0 0 0
Not fi nalised 0 0 0
Total 1 5 6
16

The Town’s Disability Access and Inclusion Plan was revised and
endorsed in September 2013.
The 2013 – 2017 plan articulates the Town’s commitment to
creating a community that welcomes and includes people
of all abilities and sets out how the Town will meet legislative
requirements.
A number of works were undertaken in 2013/14 to provide and
improve disabled access:
• Ongoing review of community programs to ensure access and
inclusion
• Hedland Community Living Association being involved in the
development of Bike Week activities
• Opportunities have been identifi ed to engage access consultants
to provide advice on planning and design processes for
infrastructure projects including the Port Hedland International
Airport redevelopment works
• The Town’s People and Culture business unit has reviewed and
updated a range of processes and procedures to ensure access
and inclusion is embedded in the organisation
• In February 2014 Council endorsed the Town of Port Hedland’s
affi liation with the National Disability Services Commission
Companion Card Program. As an affi liate of the Companion
Card Program, the Town agrees to issue a companion ticket at
no charge to cardholders who require attendant care support
from a companion to participate at their venue/event
The Disability Access and Inclusion Plan identifi es the below
outcomes which include goals on how to deliver the outcomes.
1. People with disability have the same opportunities as other
people to access services of, and any event organised by, a
public authority.
2. People with disability have the same opportunities as other
people to access the buildings and other facilities of public
authority.
3. People with disability receive information from a public authority
in a format that will enable them to access the information as
readily as other people are able to access it
4. People with disability receive the same level and quality service
from the staff of a public authority as other people receive from
the staff of that public authority.
5. People with disability have the same opportunities as other
people to make complaints to a public authority.
6. People with disability have the same opportunities as other
people to participate in any public consultation by a public
authority.
7. People with disability have the same opportunities as other
people to obtain and maintain employment with the Town of Port
Hedland
Disability Access and Inclusion
Plan
17

Our vision is to become
a nationally signifi cant
friendly city that people are
proud to call home. Central
to this vision are four
themes and outcomes.
2013-2014
18

We are a friendly,
exciting city of
neighbours that
is vibrant and
diverse
Our economy
is resilient and
provides choice
and opportunities
A city in which
we live in balance
with our unique
surrounds
We are leaders in
the community,
with a structured
commitment to
transforming Port
Hedland
Building a unifi ed and
connected community is a
key priority for our regional
city. Recognised as a
vibrant destination by local
residents as well as national
and international tourists,
Prot Hedland will be a city
of neighbours, alive with
recreational, cultural and
entertainment activities to
enrich the quality of life of
residents and visitors.
An economic powerhouse of
Australia, Port Hedland will be
a domestic and international
gateway into and out of
Western Australia. We will
be a diversifi ed economy
and major distribution and
transport hub. The Town of
Port Hedland will boast local
employment and investment
opportunities that allow
families in our community to
grow and prosper.
Creating a vibrant and diverse
place to live that is in balance
with the natural elements of
our surroundings and cultural
heritage. A safe, modern and
attractive city, Port Hedland
is a community where
generations of residents
are proud to call home and
establish themselves as
a permanent fi xture in the
unique environment of Port
Hedland.
The Town of Port Hedland
provides committed
strategic planning and
leadership, focused on
strengthening Port Hedland’s
community, providing growth
opportunities, and diversifying
the local economy. Bringing
transformation to the Pilbara
and enhancing the quality
of life for Port Hedland’s
residents, the organisation
is governed in an ethically
responsible manner that
meets all of its legislative and
community obligations.
Community Economic EnvironmentLocal
Leadership
19

Community
We are a friendly,
exciting city of
neighbours that is
vibrant and diverse
2020

21
• South Hedland Aquatic Centre
The lighting and shade installation was completed in February
2014, allowing the facility to be used for longer periods of the day.
Additional car parking is scheduled for construction in 2014/15.
• North West Festival (NWF)
The 2013 North West Festival was a great success with 3,854
people attending the event. Council endorsed to expand the 2014
festival to a 3 day format and additional funding was secured.
• South Hedland Bowling and Tennis Club
The new facility was opened in June 2014, positioned to overlook
the existing tennis courts and bowling greens. Dining and bar
services to cater for 250 people are now provided.
• Trails Master Plan
The Trails Master Plan document was endorsed by Council in
August 2013. The master plan provides options for a number of off-
road walking and cycling trails throughout the Port Hedland, South
Hedland and Finucane Island.
• Recreation Services Events
Recreation Services has held a number of highly attended
community events which will continue in 2014/15.
» Paws Walk (October 2013)
» Hedland Community Awards (December 2013)
» South Hedland Aquatic Centre Opening Event (March 2014)
» Bike Week (March 2014)
» Mother’s Day Classic (May 2014)
• In-Term Swimming Lessons
The Town received funding from Atlas Iron to enable in-term
swimming lessons to be offered to local primary schools. Until this
funding was received many local primary schools had not offered
in-term swimming lessons to students for a number of years. In
2013/2014 Port Hedland, Cassia and South Hedland Primary
School participated in the program.
• Annual Community Survey
Highest number of responses received to date (641) highlighting
facilities and services are performing well. Rating of town liveability
increased. Feedback received illustrated areas of improvement.
• Effective communication
Daily posts to Facebook page - achieved 1,146 page likes by 30
June 2014 and signifi cant engagement with community. Engaged
communtiy with e-newsletters, community notices, weekly radio
segments and media releases. Held fi ve Community Conversations.
• Club Development
The Town receives funding from the Department of Sport and
Recreation for the Club Development Offi cer position. This position
works with local sporting groups to strengthen governance, provide
training, assist with areas of concern and to help ensure a strong
local sporting community into the future. Key achievements in
2013/2014 included:
» Five club development workshops / training sessions
» Management of Kidsport funding
» Assisted with the development of fi ve new sporting groups
» Supported state sporting associations involvement in the
region
» Regular newsletters to sporting groups outlining sporting
events, grant and training opportunities
» Regular support and assistance to local sporting groups
• JD Hardie Youth Zone
The JD Hardie Youth Zone experienced a substantial increase
in attendance – by way of youth attending targeted programs
and community hirers. The team continued to deliver a range of
innovative term and school holiday programs. Planning for an
external upgrade of the site commenced.
• The SLAM Basketball Program
With the support of a range of youth agencies and associated
stakeholders, the SLAM has become an established fortnightly
event. Based at the JD Hardie Youth Zone, the program provides
local youth with sport based activity, healthy meals and informal
interaction with youth workers.
• Old Port Hedland Cemetery Restoration Project
Following the completion of the specifi c consultation and
archaeological stages, the project team collated information to
produce concept and master plans of the restoration. Community
engagement continued during the planning, with positive feedback
received form key stakeholders. 2014/15 will see works start.
• Five yearly review of the Disability Access and Inclusion
Plan
The Town of Port Hedland undertook a review and revision of its
DAIP, which resulted in Council endorsement of the DAIP 2013 –
2017 at the September 2013 OCM.
The document articulates the Town’s
commitment to creating a community
that welcomes and includes people of
all abilities. 21

Economic
Our economy
is resilient and
provides choice and
opportunities
22

• Commercial growth
Dome Coffees Pty Ltd received planning approval for the
refurbishment and renovation of the District Medical Quarter
for operation as a café in Port Hedland. The lease agreement
commenced in March 2013 and the café is expected to be open by
early 2015.
• Airport redevelopment
Interim improvement program including $1.2 million terminal
refurbishments and improved bus parking arrangements
commenced and are expected to be completed in late 2014.
Council endorsed a $100 million redevelopment program over 5
years, including new terminal, freight and logistics subdivision,
apron, taxiway and runway expansions, transport confi guration
improvements, improved security and lighting, new operations
building and installation of essential services.
• Great Northern Highway realignment
The Great Northern Highway realignment was delivered by Main
Roads WA and was completed in May 2014, providing a safer road
network between Port & South Hedland and the airport.
• Wallwork Road Bridge
Wallwork Road Bridge has been completed and was opened in
May 2014, providing an uninterrupted road network between Port
and South Hedland.
• Memberships
Continued memberships with Pilbara Regional Council and
committed to becoming a member of the WA Regional Council
Alliance.
• State and Federal Government engagement
The CEO and a Councillor attended the Pilbara Kimberley Joint
Forum in Jakarta in May 2014.
Meetings with Federal and State Ministers and representatives
will continue in 2014/15 to ensure Port Hedland is on the national
agenda.
• Pilbara Regional Council and Pilbara Development
Commission
The Town participated in seven Pilbara Regional Council and regular
Pilbara Development Commission meetings. The Town supported
the WIFI infrastructure at roadside stops project. The Town has
moved to the fi nal stage Business Plan for the Regional Payroll
Project.
• Kingsford Smith Business Park
Pre-sold seven lots and leased one lot to local and national
businesses including Bunnings. Subdivision works ongoing -
scheduled for completion at end of 2014. The Town will investigate
contracting a real estate agent to maximise the sales/lease of lots.
• Catamore Court development
Signed agreement with Megara for the development of Catamore
Court land - Megara to build eight dwellings for the Town in
exchange for the right to build and sell remaining lots.
23

Environment
A city in which
we live in balance
with our unique
surrounds
24
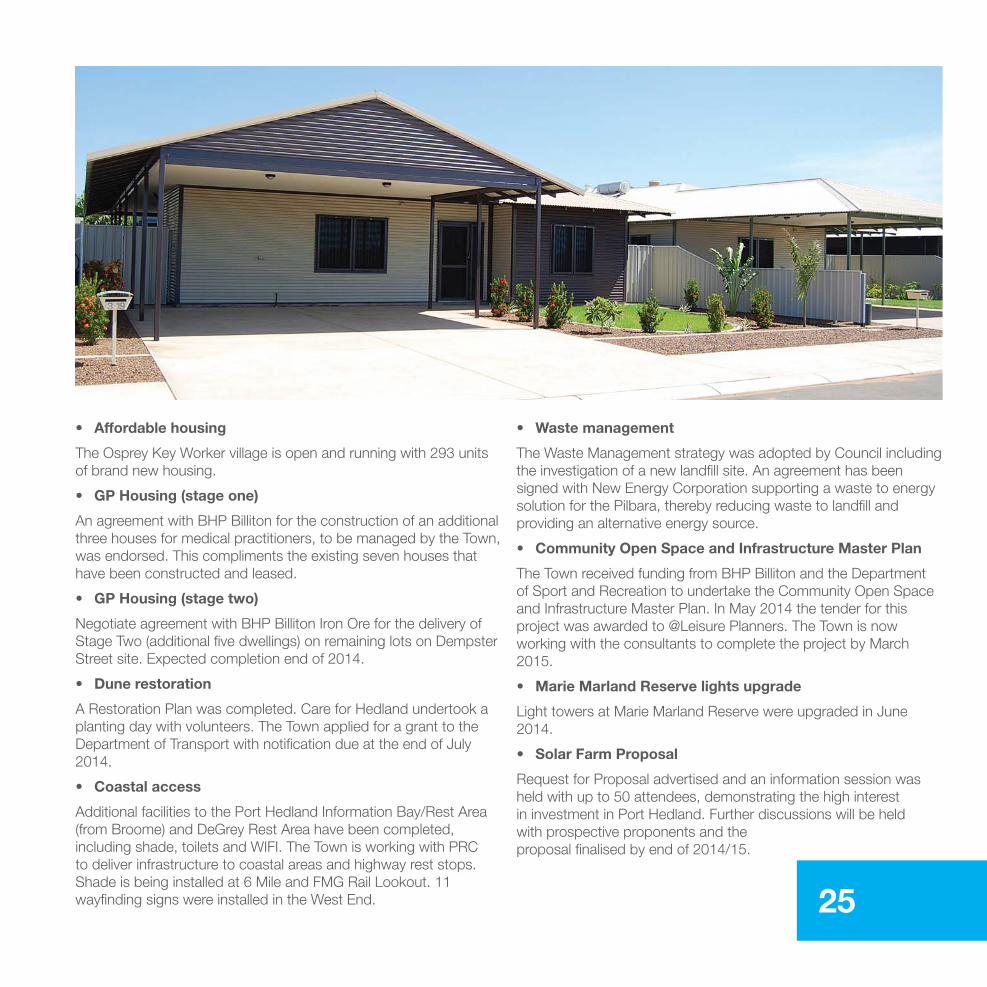
• Affordable housing
The Osprey Key Worker village is open and running with 293 units
of brand new housing.
• GP Housing (stage one)
An agreement with BHP Billiton for the construction of an additional
three houses for medical practitioners, to be managed by the Town,
was endorsed. This compliments the existing seven houses that
have been constructed and leased.
• GP Housing (stage two)
Negotiate agreement with BHP Billiton Iron Ore for the delivery of
Stage Two (additional fi ve dwellings) on remaining lots on Dempster
Street site. Expected completion end of 2014.
• Dune restoration
A Restoration Plan was completed. Care for Hedland undertook a
planting day with volunteers. The Town applied for a grant to the
Department of Transport with notifi cation due at the end of July
2014.
• Coastal access
Additional facilities to the Port Hedland Information Bay/Rest Area
(from Broome) and DeGrey Rest Area have been completed,
including shade, toilets and WIFI. The Town is working with PRC
to deliver infrastructure to coastal areas and highway rest stops.
Shade is being installed at 6 Mile and FMG Rail Lookout. 11
wayfi nding signs were installed in the West End.
• Waste management
The Waste Management strategy was adopted by Council including
the investigation of a new landfi ll site. An agreement has been
signed with New Energy Corporation supporting a waste to energy
solution for the Pilbara, thereby reducing waste to landfi ll and
providing an alternative energy source.
• Community Open Space and Infrastructure Master Plan
The Town received funding from BHP Billiton and the Department
of Sport and Recreation to undertake the Community Open Space
and Infrastructure Master Plan. In May 2014 the tender for this
project was awarded to @Leisure Planners. The Town is now
working with the consultants to complete the project by March
2015.
• Marie Marland Reserve lights upgrade
Light towers at Marie Marland Reserve were upgraded in June
2014.
• Solar Farm Proposal
Request for Proposal advertised and an information session was
held with up to 50 attendees, demonstrating the high interest
in investment in Port Hedland. Further discussions will be held
with prospective proponents and the
proposal fi nalised by end of 2014/15.
25

Local Leadership
We are leaders in
the community,
with a structured
commitment to
transforming Port
Hedland
26

• Integrated planning and reporting framework
The Town developed a 4 year budget to align with the Strategic
Community Plan. The 2014/15 Budget was adopted at the 25 June
2014 Ordinary Council Meeting. The 4 year Budget is in line with
the Long Term Financial Plan that is being developed as part of the
suite of planning documents required for the Integrated Planning
and Reporting Framework.
A review of the Strategic Community Plan and Corporate Business
Plan also commenced and will be presented to Council at the end
of 2014.
• Asset management
Draft asset management plans for roads and buildings have been
prepared, with the Town complying with regulations to determine
fair value of its assets. Improved asset management initiatives are
included in the 2014/15 budget.
• Local Law Review
Council resolved to make a Repeal Local Law in January 2014.
A draft Standing Orders Local Law was adopted by Council. All
remaining Local Laws will be reviewed in 2014/15.
• Rating strategy
A rating strategy was being developed to establish a minimum rate
yield with stable price path for future years. The strategy will be
presented to Council by the end of 2014.
• HR initiatives
New Corporate Induction program developed and rolled out in
March 2014. New organisational culture “Our Team Our Way”
workshops conducted in 2014 with all staff. An OH&S external
audit was completed in March 2014 with a Rectifi cation Action Plan
being developed to roll-out improvements across organisation for
2014-2015.
• Aboriginal Consultation Forums
The Town continued to host the forums throughout the fi nancial
year, with increasing attendance from the local Indigenous
community and key stakeholders. The forums have become an
important two way communication tool between local government
and the community. These will continue on a bi-monthly basis in
2014/15.
• South Hedland CBD Forums
Regular meetings with community, business representatives and
stakeholders have commenced and will continue in 2014/15. They
are well-attended and provide valuable input towards the continued
revitalisation of the South Hedland Town Centre.
• IT upgrades
Number of audits and consolidation of licence agreements saving
hundreds of thousands of dollars.
Upgraded radio network from analog
to digital for Triple J and ABC radio.
Upgrades to printers and associated
infrastructure to ultimately reduce
printing costs. Commenced Business
Continuity Planning.
27

28
Financial Statements
2013-2014
29

page 1
Town of Port Hedland
General Purpose Financial Statements for the year ended 30 June 2014
Contents
1. Statement by Chief Executive Officer
2. Primary Financial Statements:
- Statement of Comprehensive Income (by Nature or Type)- Statement of Comprehensive Income (by Program)- Statement of Financial Position- Statement of Changes in Equity- Statement of Cash Flows- Rate Setting Statement
3. Notes to the Financial Statements
4. Independent Auditor's Report
Overview
(i) These financial statements are General Purpose Financial Statements and cover the consolidated operationsfor Town of Port Hedland.
(ii) All figures presented in these financial statements are presented in Australian Currency.
(iii) These financial statements were authorised for issue by the Council on 09/10/14.Council has the power to amend and reissue the financial statements.
84
Page
56
3
7
10
2
4
8
30

page 2
Town of Port Hedland
General Purpose Financial Statements for the year ended 30 June 2014
Local Government Act 1995
Local Government (Financial Management) Regulations 1996
Statement by Chief Executive Officer
The attached financial report of the Town of Port Hedland being the annual financial report and supporting notesand other information for the financial year ended 30 June 2014 are in my opinion properly drawn up to presentfairly the financial position of the Town of Port Hedland at 30 June 2014 and the results of the operations for thefinancial year then ended in accordance with the Australian Accounting Standards and comply with the provisionsof the Local Government Act 1995 and the regulations under that Act.
Signed on the 9th day of October
Mal Osborne
CHIEF EXECUTIVE OFFICER
2014
31
This statement should be read in conjunction with the accompanying notes. page 3
Town of Port Hedland
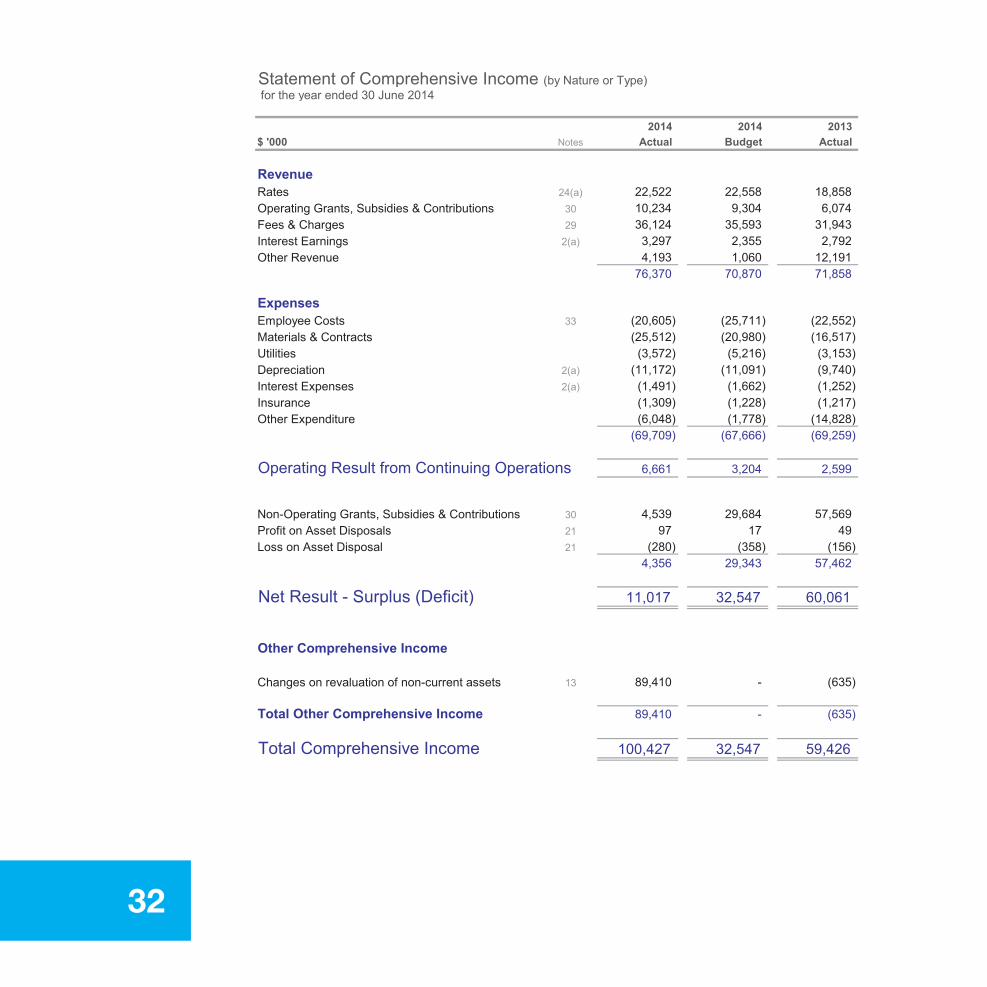
Statement of Comprehensive Income (by Nature or Type) for the year ended 30 June 2014
$ '000
RevenueRatesOperating Grants, Subsidies & ContributionsFees & ChargesInterest EarningsOther Revenue
ExpensesEmployee CostsMaterials & ContractsUtilitiesDepreciationInterest ExpensesInsuranceOther Expenditure
Operating Result from Continuing Operations
Non-Operating Grants, Subsidies & ContributionsProfit on Asset DisposalsLoss on Asset Disposal
Net Result - Surplus (Deficit)
Other Comprehensive Income
Changes on revaluation of non-current assets
Total Other Comprehensive Income
Total Comprehensive Income
Notes Actual
24(a)
(25,512)33 (20,605)
4,193
30
(3,572) (5,216)
32,547
31,9432(a) 3,297 2,355 2,79229 36,124
12,19176,370
100,427
4,356
21 17
3,204
29,68449
57,462
59,426
89,410
- (635)
2(a) (1,491)
(280)21
(1,309)
(69,709)
6,661
(25,711)
1,060
(11,091)
70,870 71,858
(69,259)
2(a)
30
13
(3,153)(20,980) (16,517)
(1,662)
(6,048) (1,778)(1,228)
29,343
32,547
-
(1,252)
2014Budget
2014 2013Actual
22,522 22,558 18,858
974,539
(156)
(635)
60,061
89,410
11,017
(22,552)
(1,217)(14,828)
35,593
(9,740)
10,234 9,304 6,074
(11,172)
(358)
2,599
57,569
(67,666)
32

This statement should be read in conjunction with the accompanying notes. page 4
Town of Port Hedland
Statement of Comprehensive Income (by Program) for the year ended 30 June 2014
$ '000
RevenueGovernanceGeneral Purpose FundingLaw, Order, Public SafetyHealthEducation & WelfareHousingCommunity AmenitiesRecreation & CultureTransportEconomic ServicesOther Property & Services
ExpensesGovernanceGeneral Purpose FundingLaw, Order, Public SafetyHealthEducation & WelfareHousingCommunity AmenitiesRecreation & CultureTransportEconomic ServicesOther Property & Services
Finance CostsGovernanceLaw, Order, Public SafetyEducation & WelfareHousingCommunity AmenitiesRecreation & CultureTransportEconomic ServicesOther Property & Services
Non-Operating Grants, Subsidies, ContributionsRecreation & CultureTransportEconomic Services
Profit/(Loss) on Disposal of AssetsHousingCommunity AmenitiesTransport
Net ResultChanges on revaluation of non-current assets
Total Comprehensive Income
(107)
(19,858)
-
11,017
(68,006)
57,569
(125) -
(1,122)
(15,042)(1,985)
(20,629)
10,941
(16,618)
(2,149)
Actual2014
70,869
414158 82
14,648
48
3,405
(1,931)
19,087
(555)
71,857
Notes
1,023
57
633
252
Actual Budget
27,810
409
307 238
17,750
(3,043)(10,197)
(1,269)
(709)(2,103)
(3,798)
(750)(1,394)
24,391
108
(3,404)(432)
(1,781)
(1,118)
2014
(68,219)(2,080)
(26,577)
(2)
(66,024)
(25,565)
1,093
2013
309
(3,303)
76,371
7,163
(1,364)
(1,808)
29,809
3,40321,833
(589)
103
81
(756)
(635)
32,547
59,426
259
(2,815)
(1,641) (1,252)
(9,621)
351
5,266
3,063
60,061
-
557
13 89,410
7,408
(18,977)
-
100,427 32,547
(76)
(78)
17,731
(13)
(260) (255)(31)
(261)
(13) (14)
49
4,539
(263)
21 (107)
(4)
1,982 2,271
30-
2,557
(3)
2,242
(122)
(183) (341)
(1,491)
(110) -
(78) (96)
-
-
-
33,75221,57527,413
29,684
2(a)
-(1,033) (872)(1,026)
(15) (16)
(3) -
(93) (95)
33

This statement should be read in conjunction with the accompanying notes. page 5
Town of Port Hedland
Statement of Financial Position as at 30 June 2014
$ '000
ASSETSCurrent AssetsCash and Cash EquivalentsInvestmentsTrade and Other ReceivablesInventoriesTotal Current Assets
Non-Current AssetsTrade and Other ReceivablesProperty, Plant and EquipmentInfrastructureTotal Non-Current Assets
TOTAL ASSETS
LIABILITIESCurrent LiabilitiesTrade and Other PayablesBorrowingsProvisionsTotal Current Liabilities
Non-Current LiabilitiesBorrowingsProvisionsTotal Non-Current Liabilities
TOTAL LIABILITIES
Net Assets
EQUITYRetained SurplusReserves - Cash/Investment BackedReserves - Asset Revaluation
Total Equity
9
439,174
27,463
13 853
11,837
2,2891,278
15,43110,3662,632
1,305
25,359
341,637
233,166
3
19
12
300,693
131,142187,636
25,513
401,120
5
ActualNotes
4
108,4716
11,262
71,224
101,2018
823
2013
76,243-
10
Actual
74,559
154
40,944
68,4097,000
32,216
86,681
163,633352,493
225,28167,132
2014
5
243,72512
90,263
300,693
1011
11
22527,688
401,120
38,054
106,456
34

This statement should be read in conjunction with the accompanying notes. page 6
Town of Port Hedland
Statement of Changes in Equity for the year ended 30 June 2014
$ '000
Balance as at 1 July 2012Changes in Accounting Policy
Restated Balance
Net ResultTotal OCI / Asset RevaluationReserve Transfers
Balance as at 30 June 2013
Net ResultTotal OCI / Asset RevaluationReserve Transfers
Balance as at 30 June 2014
1312
Notes
41
12
RetainedSurplus
67,132
202,881-
202,881
60,061(635)
(37,026)
225,281
11,017-
7,427
243,725
Cash /Investment
Backed
37,533-
37,533
--
37,026
74,559
-
AssetRevaluation
Reserve
853-
853
---
853
-
300,693
11,01789,410
-
401,120
89,410-
90,263
-(7,427)
Reserves
TotalEquity
241,267-
241,267
60,061(635)
-
35

This statement should be read in conjunction with the accompanying notes. page 7
Town of Port Hedland
Statement of Cash Flows for the year ended 30 June 2014
$ '000
Cash Flows from Operating ActivitiesReceipts:RatesOperating Grants, Subsidies and ContributionsFees and ChargesInterest EarningsGoods and Services TaxOther Revenue
Payments:Employee CostsMaterials and ContractsUtilitiesInsuranceInterestGoods and Services TaxOther Expenditure
Net Cash provided (or used in) Operating Activities
Cash Flows from Investing ActivitiesReceipts:Non-Operating Grants, Subsidies and ContributionsProceeds from Sale of AssetsPayments:Payments for Purchase of Property, Plant & EquipmentPayments for Construction of InfrastructureAdvances to Community GroupsPayments for Purchase of InvestmentsNet Cash provided (or used in) Investing Activities
Cash Flows from Financing ActivitiesReceipts:Proceeds from Self Supporting LoansProceeds from New DebenturesPayments:Repayment of DebenturesNet Cash provided (or used in) Investing Activities
Net Increase/(Decrease) in Cash & Cash Equivalents
Cash at the beginning of the year
Cash & Cash Equivalents - End of the Year
Additional Information:plus: Investments on hand - end of year
Total Cash, Cash Equivalents & Investments
29,684
(104,919)
14,234
(20,265)
-
(16,982)
37,648
(7,834)
(1,305)2,145
32,840
Actual
2,7915,837
5,155
(8,268)(11,198)
Actual
(43,833)
-
2013
3,382
(10,863)
3,2974,596
(42,860)
1,039
(3,247)
23(a)
(1,662)
(1,828)
-
(5,498)
23(b)
(52,085)
466
32,6272,355
(1,426)
21,881
(876)
8,174
(31,998)
6,100
6,945
197 64
76,714
39,256
Budget
6,074
(1,391)
(4,955)(16,784)
(1,491)
(21,619)(25,628)(58,235)
66,275
(1,229)
12,193
18,504
20142014
(1,217)
22,866
Notes
9,304
-
3,812-
(1,190) (1,228)
(20,191)(9,852)
(3,153)
84,655
4
14(a) 68,409 78,478
77,119
75,409 78,478
(6,786)
(1,009)
76,243
(7,715)
7,000 --
89,34176,243
4,539
(500)(7,000)
819
33,854
76,243
3
3021
2020
14(b) 14,190
8,373
(33,976) (33,111)
354
68
-
(29,037)
36

This statement should be read in conjunction with the accompanying notes. page 8
Town of Port Hedland
Rate Setting Statement (by Program) for the year ended 30 June 2014
$ '000
RevenueGovernanceGeneral Purpose Funding (Excl Rates)Law, Order, Public SafetyHealthEducation and WelfareHousingCommunity AmenitiesRecreation and CultureTransportEconomic ServicesOther Property and Services
ExpensesGovernanceGeneral Purpose FundingLaw, Order, Public SafetyHealthEducation and WelfareHousingCommunity AmenitiesRecreation and CultureTransportEconomic ServicesOther Property and Services
Net Result Excluding RatesAdjustment for Cash Budget Requirements:Non-Cash Expenditure & Revenue(Profit)/Loss on Asset DisposalMovement in Non-Current Deferred Pensioner RatesMovement in Other Non Current Assets / LiabilitiesMovement in Non-Current Employee Benefit ProvisionsLoss in Revaluation SurplusDepreciation on AssetsNet Non-Cash Expenditure & RevenueCapital ExpenditurePurchase Land and BuildingsPurchase Infrastructure AssetsPurchase Plant and EquipmentPurchase Furniture and EquipmentWork in ProgressAdvances to Community GroupsRepayment of DebenturesNet Capital Expenditure
Capital RevenueProceeds from Disposal of AssetsProceeds from New DebenturesSelf-Supporting Loan Principal IncomeNet Capital Revenue
2014 2014 2013Notes Actual Budget Actual
158 82 82414 409 108
7,287 5,252 5,534307 238 252
48 57 103
7,163 7,408 36,8151,023 557 633
5,386 7,536 5,64521,740 45,175 39,355
309 351 25914,648 10,946 21,833
(709) (756) (750)(1,378) (2,119) (1,425)
(589) (432) (555)(1,821) (1,794) (3,419)
58,483 78,011 110,619
(1,934) (1,394) (2,149)
(3,801) (1,989)(2,080) 1,093 (1,122)
(27,602) (26,598) (21,501)(16,742) (19,164) (15,909)
(3,414) (3,075) (1,373)(10,414) (9,983) (19,858)
- - 63511,091 9,740
13 - -
71 - (36)- - 50
2(a) 11,172
(24,994) (11,634)
11,439 11,432 10,496
- -20 (945) - -
20 (3,808) (5,552) (3,179)20 (410) (20)
(69,989) (68,023) (70,050)
21 183 341 107
(11,506) 9,988 40,569
(3,306)
(33,976) (41,389) (6,786)
(500)23(a) (1,305) (1,426) (982)
(2,169)
20 (2,552)
23(b) 3,382
(24,750)
21 819 466 3548,175 6,100
4,269 8,838 6,51823(a) 68 197 64
(43,496) (73,381)
37
This statement should be read in conjunction with the accompanying notes. page 9
Town of Port Hedland
Rate Setting Statement (by Program) (continued) for the year ended 30 June 2014
$ '000
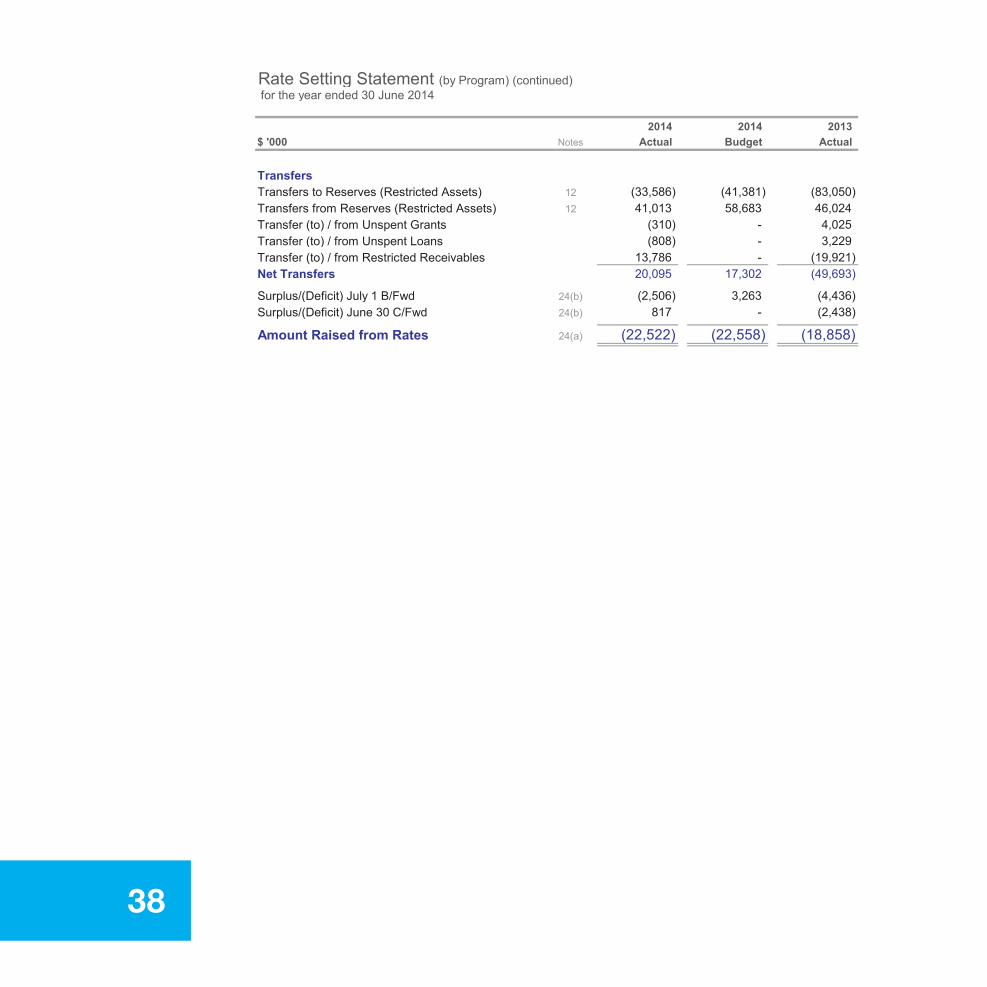
TransfersTransfers to Reserves (Restricted Assets)Transfers from Reserves (Restricted Assets)Transfer (to) / from Unspent GrantsTransfer (to) / from Unspent LoansTransfer (to) / from Restricted ReceivablesNet Transfers
Surplus/(Deficit) July 1 B/FwdSurplus/(Deficit) June 30 C/Fwd
Amount Raised from Rates
Actual
(49,693)
(808) 3,229
24(a) (22,522) (22,558) (18,858)
24(b) (2,506) 3,263
(33,586) (41,381) (83,050)
- (2,438)
12 41,013 58,683 46,024
-
(4,436)24(b) 817
20,095 17,302
4,025
12
(310) -
13,786 - (19,921)
2014 2014 2013Notes Actual Budget
38

page 10
Town of Port Hedland
Notes to the Financial Statements for the year ended 30 June 2014
Contents of the Notes accompanying the Financial Statements
Details
Significant Accounting PoliciesRevenues and ExpensesCash and Cash EquivalentsInvestmentsTrade and Other ReceivablesInventoriesProperty, Plant and EquipmentInfrastructureTrade and Other PayablesLong Term BorrowingsProvisionsReserves - Cash/Investment BackedReserves - Asset RevaluationNotes to the Statement of Cash FlowsContingent Liabilities and Contingent AssetsCapital and Leasing CommitmentsControlled Entities, Associated Entities & Interests in Joint VenturesTrust FundsTotal Assets by Function and ActivityAcquisition of AssetsDisposal of AssetsFinancial RatiosInformation on BorrowingsRating InformationSpecified Area RateService ChargesDiscounts, Incentives, Concessions and Write-offsInterest Charges and InstallmentsFees and ChargesGrants, Subsidies and ContributionsEmployee NumbersCouncillor RemunerationEmployee CostsMajor Land TransactionsTrading Undertakings and Major Trading UndertakingsFinancial Risk ManagementFair Value Measurements"Held for Sale" Non Current Assets & Disposal GroupsInvestment PropertiesIntangible AssetsEquity - Retained Earnings and Reserves AdjustmentsDiscontinued OperationsEvents occurring after the Reporting Period
66
82
75
6774
82
83
8279
82
83
47
65
61
64
59
6565
64
62
61
53
51
50
52
50
26
2827
38
33
29
39
4241
3132
30
36
40
3435
43
37
Page
1
Note
7
43
2929
30
5
11
6
9
14
17
37
2 2028
8 35
30
11
13
46
48
1516
3710
12
25
19
2120
2324
18
22
383945
56
45
39

Town of Port Hedland
Notes to the Financial Statementsfor the year ended 30 June 2014
Note 1. Summary of Significant Accounting Policies
page 11
The principal accounting policies adopted in the preparation of the financial report are set out below. These policies have been consistently applied to all the years presented, unless otherwise stated.
(a) Basis of preparation
The financial report is a general purpose financial statement which has been prepared in accordance with Australian Accounting Standards (as they apply to local governments and not-for-profit entities), other authoritative pronouncements of the Australian Standards Board, Local Government Act 1995 and accompanying regulations. The report has also been prepared on the accrual basis under the convention of historical cost accounting modified, where applicable, by the measurement at fair value of selected non-current assets, financial assets and liabilities.
Critical Accounting Estimates
The preparation of a financial report in conformity with Australian Accounting Standards requires the use of certain critical accounting estimates. The estimates and associated assumptions are based on historical experience and various other factors that are believed to be reasonable under the circumstances. The results of this experience and other factors combine to form the basis of making judgements about carrying values of assets and liabilities not readily apparent from other sources. Actual results may differ from these estimates.
(b) The Local Government Reporting Entity
All Funds through which the Council controls resources to carry on its functions have been included in the financial statements forming part of this financial report. In the process of reporting on the local government as a single unit, all transactions and balances between those funds (for example, loans and transfers between Funds) have been eliminated. All monies held in the Trust Fund are excluded from the financial statements, but a separate statement of those monies appears at Note 18 to this financial report.
(c) Goods and Services Tax
In accordance with recommended practice, revenues, expenses and assets capitalised are stated net of any GST recoverable. Receivables and payables in the Statement of Financial Position are stated inclusive of applicable GST.
(d) Cash and Cash Equivalents
Cash and cash equivalents in the Statement of Financial Position comprise cash at bank and on hand and short-term deposits with an original maturity of three months or less that are readily convertible to known amounts of cash and which are subject to an insignificant risk of changes in value.
For the purposes of the Statement of Cash Flows, cash and cash equivalents consist of cash and cash equivalents as defined above, net of outstanding bank overdrafts. Bank overdrafts are included as short-term borrowings in current liabilities on the Statement of Financial Position.
(e) Trade and Other Receivables
Collectability of trade and other receivables is reviewed on an ongoing basis. Debts which are known to be uncollectible are written off when identified. An allowance for doubtful debts is raised when there is objective evidence that they will not be collectible.
(f) Inventories
(i) Raw materials and stores, work in progress and finished goods
Raw materials and stores, work in progress and finished goods are stated at the lower of cost and net realisable value. Cost comprises direct materials, direct labour and an appropriate proportion of variable and fixed overhead expenditure, the latter being allocated on the basis of normal operating capacity. Costs are assigned to individual items of inventory on the basis of weighted average costs. Net realisable value is the established selling price in the ordinary course of business less the estimated costs of completion and the estimated costs necessary to make the sale. 40

Town of Port Hedland
Notes to the Financial Statementsfor the year ended 30 June 2014
Note 1. Summary of Significant Accounting Policies (continued)
page 12
(ii) Land Held for resale/capitalisation of borrowing costs
Land held for resale is stated at the lower of cost and net realisable value. Cost is assigned by specific identification and includes the cost of acquisition, and development and borrowing costs during development. When development is completed borrowing costs and other holding charges are expensed as incurred. Borrowing costs included in the cost of land held for resale are those costs that would have been avoided if the expenditure on the acquisition and development of the land had not been made. Borrowing costs incurred while active development is interrupted for extended periods are recognised as expenses.
Revenue arising from the sale of property is recognised in the operating statement as at the time of signing a binding contract of sale. Land held for resale is classified as current except where it is held as non-current based on the Council's intentions to release for sale.
(g) Fixed Assets
Initial Recognition
All assets are initially recognised at cost. Cost is determined as the fair value of the assets given as consideration plus costs incidental to the acquisition. For assets acquired at no cost or for nominal consideration, cost is determined as fair value at the date of acquisition. The cost of non-current assets constructed includes the cost of all materials, direct labour and variable and fixed overheads.
Revaluation
Certain asset classes may be revalued on a regular basis such that the carrying values are not materially different from fair value. For infrastructure and other asset classes where no active market exists, fair value is determined to be the current replacement cost of an asset less, where applicable, accumulated depreciation calculated on a basis to reflect the already consumed or expired future economic benefits of the asset.
Increases in the carrying amount arising on revaluation of assets are credited to a revaluation surplus in equity. Decreases that offset previous increases of the same asset are charged against fair
value reserves directly in equity; all other decreases are charged to the statement of comprehensive income.
Any accumulated depreciation at the date of revaluation is eliminated against the gross carrying amount of the asset and the net amount is restated to the revalued amount of the asset.
Those assets carried at a revalue amount, being their fair value at the date of revaluation less any subsequent accumulated depreciation and accumulated impairment losses, are to be revalue with sufficient regularity to ensure the carrying amount does not differ significantly from that determined using fair value at reporting date.
Land under Roads
In Western Australia, all land under roads is Crown land, the responsibility for managing which, is vested in the local government.
Effective as at 1 July 2008, Council elected not to recognise any value for land under roads acquired on or before 30 June 2008. This accords with the treatment available in Australian Accounting Standard AASB 1051 Land Under Roads and the fact that Local Government (Financial Management) Regulation16(a)(i) prohibits local governments from recognising such land as an asset.
Whilst such treatment is inconsistent with the requirements of AASB 1051, Local Government (Financial Management) Regulation 4(2) provides that, in the event of such an inconsistency, the Local Government (Financial Management) Regulations prevail.
Consequently, any land under roads acquired on or after 1 July 2008 is not included as an asset of the Council.
(h) Depreciation of Non-Current Assets
All non-current assets having a limited useful life are separately and systematically depreciated over their useful lives in a manner which reflects the consumption of the future economic benefits embodied in those assets. Assets are depreciated from the date of acquisition or, in respect of internally constructed assets, from the time the asset is completed and held ready for use. 41

Town of Port Hedland
Notes to the Financial Statementsfor the year ended 30 June 2014
Note 1. Summary of Significant Accounting Policies (continued)
page 13
Expenditure on items of equipment under $2,000 are not capitalised but are placed on an "Attractive Items" list for reference and maintenance.
Depreciation is recognised on a straight-line basis, using rates which are reviewed each reporting period. Major depreciation periods are:
Buildings 30 to 50 years
Furniture & Equipment 4 to 10 years
Plant & Equipment 5 to 15 years
Sealed Roads & Streets- Formation Not Depreciated - Pavement 50 years - Seal: Bituminous Seals 20 years Asphalt Surfaces 25 years
Gravel Roads - Formation Not Depreciated - Pavement 50 years - Gravel Sheet 12 years Formed Roads (unsealed) - Formation Not Depreciated - Pavement 50 years
Footpaths - Slab 20 years
Sewerage Piping 100 years
Water Supply Piping & Drainage Systems 75 years
The assets residual value and useful lives are reviewed and adjusted if appropriate, at the end of each reporting period. An asset's carrying amount is written down immediately to its recoverable amount if the asset's carrying amount is greater than its estimated recoverable amount.
Gains and losses on disposals are determined by comparing proceeds with the carrying amount. These gains and losses are included in the Statement of Comprehensive Income. When revalued assets are sold, amounts included in the revaluation surplus relating to that asset are transferred to retained earnings.
(i) Financial Instruments
Initial Recognition and Measurement
Financial assets and financial liabilities are recognised when the Council becomes a part to the contractual provisions to the instrument. For financial assets, this is equivalent to the date that the Council commits itself to either the purchase or sale of the asset (i.e. trade date accounting is adopted).
Financial instruments are initially measured at fair value plus transaction costs, except where the instrument is classified 'at fair value through profit or loss', in which case transaction costs are expensed to profit or loss immediately.
Classification and Subsequent Measurement
Financial instruments are subsequently measured at amortised cost using the effective interest rate method or cost.
Fair value represents the amount for which an asset could be exchanged or a liability settled, between knowledgeable, willing parties. Where available, quoted prices in a active market are used to determine fair value. In other circumstances, valuation techniques are adopted.
Amortised cost is calculated as:
(a) the amount is which the financial asset or financial liability is measured at initial recognition;
(b) less principal repayments; (c) plus or minus the cumulative amortisation of the
difference, if any, between the amount initially recognised and the maturity amount calculated using the effective interest rate method; and
(d) less any reduction for impairment.
The effective interest method used is to allocate interest income or interest expense over the relevant period and is equivalent to the rate that exactly discounts estimated future cash payments or receipts (including fees, transaction costs and other premiums of discounts) through the expected life (or when this cannot be reliably predicted, the contractual term of the financial instrument to the net carrying amount of the financial asset or financial liability. Revisions to expected future cash flows will necessitate an adjustment to the carrying value with a consequential recognition of an income or expense in profit or loss. 42

Town of Port Hedland
Notes to the Financial Statementsfor the year ended 30 June 2014
Note 1. Summary of Significant Accounting Policies (continued)
page 14
(i) Financial assets at fair value through profit or loss
Financial assets at fair value through profit or loss are financial assets held for trading. A financial asset is classified in this category if acquired principally for the purpose of selling in the short term. Derivatives are classified as held for trading unless they are designated as hedges. Assets in this category are classified as current assets.
(ii) Loans and receivables
Loans and receivables are non-derivative financial assets with fixed or determinable payments that are not quoted in an active market. They are included in current assets, except for those with maturities greater than 12 months after the Statement of Financial Position date which are classified as non-current assets. Loans and receivables are included in trade and other receivables in the Statement of Financial Position.
(iii) Held-to-maturity investments
Held-to-maturity investments are non-derivative financial assets with fixed or determinable payments and fixed maturities that the Council's management has the positive intention and ability to hold to maturity. If Council were to sell other than an insignificant amount of held-to-maturity financial assets, the whole category would be tainted and reclassified as available-for-sale. Held-to-maturity financial assets are included in non-current assets, except for those with maturities less than 12 months from the reporting date, which are classified as current assets.
(iv) Available-for-sale financial assets
Available-for-sale financial assets, comprising principally marketable equity securities, are non-derivatives that are either designated in this category or not classified in any of the other categories. They are included in non-current assets unless management intents to dispose of the investment within 12 months of the Statement of Financial Position date. Investments are designated as available-for-sale if they do not have fixed maturities and fixed or determinable payments and management intends to hold them for the medium to long term.
(v) Financial Liabilities
Non-derivative financial liabilities (excluding financial guarantees) are subsequently measured at amortised cost.
Impairment
At the end of each reporting period, the Council assesses whether there is objective evidence that a financial instrument has been impaired. In the case of available-for-sale financial instruments, a prolonged decline in the value of the instrument is considered to determine whether impairment has arisen. Impairment losses recognised in the Statement of Comprehensive Income.
(j) Fair Value Estimation
The fair value of financial assets and financial liabilities must be estimated for recognition and measurement or for disclosure purposes.
The fair value of financial instruments traded in active markets is determined using valuation techniques. Council uses a variety of methods and makes assumptions that are based on market conditions existing at each balance date. Quoted market prices or dealer quotes for similar instruments are used for long-term debt instruments held. Other techniques, such as estimated discounted cash flows, are used to determine fair value for the remaining financial instruments.
The nominal value less estimated credit adjustments of trade receivables and payables are assumed to approximate their fair values. The fair value of financial liabilities for disclosure purposes is estimated by discounting the future contractual cash flows at the current market interest rate that is available to the Council for similar financial instruments.
(k) Provisions
Provisions are recognised when the Council has a present legal or constructive obligation as a result of past events; it is more likely than not that an outflow of resources will be required to settle the obligation and the amount has been reliably estimated. Provisions are not recognised for future operating losses. Where there are a number of similar obligations, the 43
Town of Port Hedland
Notes to the Financial Statementsfor the year ended 30 June 2014
Note 1. Summary of Significant Accounting Policies (continued)
page 15
likelihood that an outflow will be required in settlement is determined by considering the class of obligations as a whole. A provision is recognised even if the likelihood of an outflow with respect to any one item included in the same class of obligations may be small.
(l) Leases
Leases of property, plant and equipment where the Council has substantially all the risks and rewards of ownership are classified as finance leases. Finance leases are capitalised at the lease's inception at the lower of the fair value of the leased property and the present value of the minimum lease payments. The corresponding rental obligations, net of finance charges, are included in other long term payables. Each lease payment is allocated between the liability and finance charges so as to achieve a constant rate on the finance balance outstanding. The interest element of the finance cost is charged to the Statement of Comprehensive Income over the lease period so as to produce a constant periodic rate of interest on the remaining balance of the liability for each period. The property, plant and equipment acquired under finance leases are depreciated over the shorter of the asset's useful life and the lease term. Lease payments under operating leases, where substantially all the risks and benefits remain with the lessor, are charged as expenses in the periods in which they are incurred.
(m) Impairment
In accordance with Australian Accounting Standards the Council's assets, other than inventories, are tested annually for impairment. Where such an indication exists, an estimate of the recoverable amount of the asset is made in accordance with AASB 136 Impairment of Assets and appropriate adjustments made. Assets that are subject to amortisation are reviewed for impairment whenever events or changes in circumstances indicate that the carrying amount may not be recoverable. An impairment loss is recognised for the amount by which the asset's carrying amount exceeds its recoverable amount. The recoverable amount is the higher of an asset's fair value less costs to sell and value in use. Impairment losses are recognised in the Statement of Comprehensive Income.
For non-cash generating assets of the Council such as roads, drains, public buildings and the like, value in use is represented by the asset's written down replacement cost.
(n) Trade and Other Payables
Trade and other payables are carried at amortised cost. They represent liabilities for goods and services provided to the Municipality prior to the end of the financial year that are unpaid and arise when the Municipality becomes obliged to make future payments in respect of the purchase of these goods and services. The amounts are unsecured and are usually paid within 30 days of recognition.
(o) Interest-bearing Loans and Borrowings
All loans and borrowings are initially recognised at the fair value of the consideration received less directly attributable transaction costs.
After initial recognition, interest-bearing loans and borrowings are subsequently measured at amortised cost using the effective interest method. Fees paid of the establishment of loan facilities that are yield related are included as part of the carrying amount of the loans and borrowings.
Borrowings are classified as current liabilities unless the Council has an unconditional right to defer settlement of the liability for at least 12 months after the Statement of Financial Position date. Borrowing costs are recognised as an expense when incurred except where they are directly attributable to the acquisition, construction or production of a qualifying asset. Where this is the case, they are capitalised as part of the cost of the particular asset.
(p) Employee Benefits
The provisions for employee benefits relates to amounts expected to be paid for long service leave, annual leave, wages and salaries and are calculated as follows:
44
Town of Port Hedland
Notes to the Financial Statementsfor the year ended 30 June 2014
Note 1. Summary of Significant Accounting Policies (continued)
page 16
Wages, Salaries, Annual Leave and Long Service Leave (Short-term Benefits)
The provision for employees' benefits wages, salaries, annual leave and long service leave expected to be settled within 12 months represents the amount the Council has a present obligation to pay resulting from employee’s services provided to balance date. The provision has been calculated at nominal amounts based on remuneration rates the Council expects to pay and includes related on-costs.
Long Service Leave (Long-term Benefits)
The liability for long service leave is recognised in the provision for employee benefits and measured as the present value of expected future payments to be made in respect of services provided by employees up to the reporting date using the projected unit credit method. Consideration is given to expected future wage and salary levels, experience of employee departures and periods of service. Expected future payments are discounted using market yields at the reporting date on national government bonds with terms to maturity and currency that match as closely as possible, the estimated future cash outflows.
Where Council does not have the unconditional right to defer settlement beyond 12 months, the liability is recognised as a current liability.
(q) Superannuation
The Council contributes to a number of Superannuation Funds on behalf of their employees. Contributions to defined contribution plans are recognised as an expense as they become payable. Prepaid contributions are recognised as an asset to the extent that a cash refund or a reduction in the future payments is available.
(r) Joint Venture
The municipality's interest in a joint venture has been recognised in the financial statements by including its share of any assets, liabilities, revenues and expenses of the joint venture within the relevant items reported in the Statement of Financial Position and Statement of Comprehensive Income.
Information about the joint venture is set out in Note 17.
(s) Rates, Grants, Donations and Other Contributions
Rates, grants, donations and other contributions are recognised as revenues when the local government obtains control over the assets comprising the contributions. Control over assets acquired from rates is obtained at the commencement of the rating period or, where earlier, upon receipt of the rates.
Where contributions recognised as revenues during the reporting period were obtained on the condition that they be expended in a particular manner or used over a particular period, and those conditions were undischarged as at the reporting date, the nature of and amounts pertaining to those undischarged conditions are disclosed at Note 2(d). That note also discloses the amount of contributions recognised as revenues in a previous reporting period which were obtained in respect of the local government's operation for the current reporting period.
(t) Current and Non-Current Classification
In the determination of whether an asset or liability is current or non-current, consideration is given to the time when each asset or liability is expected to be settled. The asset or liability is classified as current if it is expected to be settled within the next 12 months, being the Council's operation cycle. In the case of liabilities where the Council does not have the unconditional right to defer settlement beyond 12 months, such as vested long service leave, the liability is classified as current even if not expected to be settled within the next 12 months. Inventories held for trading are classified as current even if not expected to be realised in the next 12 months except for land held for resale where it is held as non-current based on the Council's intentions to release for sale.
(u) Rounding Off Figures
All figures shown in this annual financial report , other than a rate in the dollar, are rounded to the nearest thousand dollars.
45

Town of Port Hedland
Notes to the Financial Statementsfor the year ended 30 June 2014
Note 1. Summary of Significant Accounting Policies (continued)
page 17
(v) Comparative Figures
Where required, comparative figures have been adjusted to conform with changes in presentation for the current financial year.
When the Council applies an accounting policy retrospectively, makes a retrospective restatement or reclassifies items in its financial statement, a statement of financial position as at the beginning of the earliest period will be disclosed.
(w) Budget Comparative Figures
Unless otherwise stated, the budget comparative figures shown in this annual financial report relate to the original budget estimate for the relevant item of disclosure.
(x) Investment Property
Investment property, principally comprising freehold office buildings, is held for long-term rental yields. Investment property is carried at fair value, representing open-market value determined annually by external users.
(y) Non-Current Assets (or Disposal Groups) “Held for Sale” & Discontinued Operations
Non-current assets (or disposal groups) are classified as held for sale and stated at the lower of either (i) their carrying amount and (ii) fair value less costs to sell, if their carrying amount will be recovered principally through a sale transaction rather than through continuing use.
The exception to this is plant and motor vehicles which are turned over on a regular basis. Plant and motor vehicles are retained in Non Current Assets under the classification of Property, Plant and Equipment - unless the assets are to be traded in after 30 June and the replacement assets were already purchased and accounted for as at 30 June.
For any assets or disposal groups classified as Non-Current Assets “held for sale”, an impairment loss is recognised at any time when the assets carrying value is greater than its fair value less costs to sell.
Non-current assets “held for sale” are not depreciated or amortised while they are classified as “held for sale”.
Non-current assets classified as “held for sale” are presented separately from the other assets in the balance sheet.
A Discontinued Operation is a component of Council that has been disposed of or is classified as “held for sale” and that represents a separate major line of business or geographical area of operations, is part of a single co-ordinated plan to dispose of such a line of business or area of operations, or is a subsidiary acquired exclusively with a view to resale.
The results of discontinued operations are presented separately on the face of the income statement.
(z) Intangible Assets
Council has not classified any assets as Intangible.
(aa) New Accounting Standards and Interpretations for Application in Future Periods
Certain new (or amended) accounting standards and interpretations have been published that are not mandatory for reporting period ending 30 June 2014.
Council has not adopted any of these standards early.
Council’s assessment of the impact of these new standards and interpretations is set out below.
Applicable to Local Government with implications:
AASB 9 Financial Instruments, associated standards, AASB 2010-7 Amendments to Australian Accounting Standards arising from AASB 9 and AASB 2012-6 Amendments to Australian Accounting Standards – Mandatory Effective Date of AASB 9 and transitional disclosures and AASB 2013-9 Amendments to Australian Accounting Standards – Conceptual Framework, Materiality and Financial Instruments (effective from 1 January 2017)
46

Town of Port Hedland
Notes to the Financial Statementsfor the year ended 30 June 2014
Note 1. Summary of Significant Accounting Policies (continued)
page 18
AASB 9 Financial Instruments addresses the classification, measurement and de-recognition of financial assets and financial liabilities.
The standard is not applicable until 1 January 2015 but is available for early adoption.
When adopted, the standard will affect in particular Council’s accounting for its available-for-sale financial assets, since AASB 9 only permits the recognition of fair value gains and losses in other comprehensive income if they relate to equity investments that are not held for trading.
Fair value gains and losses on available-for-sale debt investments, for example, will therefore have to be recognised directly in profit or loss although there is currently a proposal by the IASB to introduce a Fair value through Other Comprehensive Income category for debt instruments.
There will be no impact on Council’s accounting for financial liabilities, as the new requirements only affect the accounting for financial liabilities that are designated at fair value through profit or loss and Council does not have any such liabilities.
The de-recognition rules have been transferred from AASB 139 Financial Instruments: Recognition and Measurement and have not been changed.
The Council has not yet fully assessed the impact on the reporting financial position and performance on adoption of AASB 9.
Applicable to Local Government but no implications for Council;
AASB 2013-3 Amendments to AASB 136 Recoverable Amount Disclosures for Non-Financial Assets (effective for 30 June 2015 Financial Statements)
There are no changes to reported financial position or performance from AASB 2013 – 3, however additional disclosures may be required.
Applicable to Local Government but not relevant to Council at this stage;
AASB 10 Consolidated Financial Statements, AASB 11 Joint Arrangements, AASB 12 Disclosure of Interests in Other Entities, revised
AASB 127 Separate Financial Statements andAASB 128 Investments in Associates and Joint Ventures and AASB 2011-7 Amendments to Australian Accounting Standards arising from the Consolidation and Joint Arrangements Standards (effective for 30 June 2015 Financial Statements for not-for-profit entities)
This suite of five new and amended standards address the accounting for joint arrangements, consolidated financial statements and associated disclosures.
AASB 10 replaces all of the guidance on control and consolidation in AASB 127 Consolidated and Separate Financial Statements, and Interpretation 12 Consolidation – Special Purpose Entities.
The core principle that a consolidated entity presents a parent and its subsidiaries as if they are a single economic entity remains unchanged, as do the mechanics of consolidation. However, the standard introduces a single definition of control that applies to all entities.
It focuses on the need to have both power and rights or exposure to variable returns.
Power is the current ability to direct the activities that significantly influence returns. Returns must vary and can be positive, negative or both.
Control exists when the investor can use its power to affect the amount of its returns.
There is also new guidance on participating and protective rights and on agent/principal relationships. Council does not expect the new standard to have a significant impact on its composition.
AASB 11 introduces a principles based approach to accounting for joint arrangements.
The focus is no longer on the legal structure of joint arrangements, but rather on how rights and obligations are shared by the parties to the joint arrangement.
Based on the assessment of rights and obligations, a joint arrangement will be classified as either a joint operation or a joint venture.
47

Town of Port Hedland
Notes to the Financial Statementsfor the year ended 30 June 2014
Note 1. Summary of Significant Accounting Policies (continued)
page 19
Joint ventures are accounted for using the equity method, and the choice to proportionately consolidate will no longer be permitted.
Parties to a joint operation will account their share of revenues, expenses, assets and liabilities in much the same way as under the previous standard.
AASB 11 also provides guidance for parties that participate in joint arrangements but do not share joint control.
Council's investment in the joint venture partnership will be classified as a joint venture under the new rules.
As Council already applies the equity method in accounting for this investment, AASB 11 will not have any impact on the amounts recognised in its financial statements.
AASB 12 sets out the required disclosures for entities reporting under the two new standards, AASB 10 and AASB 11, and replaces the disclosure requirements currently found in AASB 127 and AASB 128.
Application of this standard by Council will not affect any of the amounts recognised in the financial statements, but will impact the type of information disclosed in relation to Council's investments.
Amendments to AASB 128 provide clarification that an entity continues to apply the equity method and does not remeasure its retained interest as part of ownership changes where a joint venture becomes an associate, and vice versa.
The amendments also introduce a “partial disposal” concept.
Council is still assessing the impact of these amendments.
Council does not expect to adopt the new standards before their operative date.
They would therefore be first applied in the financial statements for the annual reporting period ending 30 June 2015.
Not applicable to Local Government per se;
There are no other standards that are “not yet effective” and expected to have a material impact on Council in the current or future reporting periods and on foreseeable future transactions.
(ab) Comparative Figures
To ensure comparability with the current reporting period’s figures, some comparative period line items and amounts may have been reclassified or individually reported for the first time within these financial statements and/or the notes.
(ac) Disclaimer
Nothing contained within these statements may be taken to be an admission of any liability to any person under any circumstance.
48

page 20
Town of Port Hedland
Notes to the Financial Statements for the year ended 30 June 2014
Note 2. Operating Revenues and Expenses
$ '000
(a) Net ResultThe Result includes:
(i) Charging as an Expense:
Auditors Remuneration- Audit of the Financial Report- Financial Management Review- Assistance with the finalisation of the annual financial report- Other Services - Disbursements and Grant Acquittals
Bad & Doubtful DebtsRatesGeneral Debtors
DepreciationProperty, Plant & Equipment- Buildings- Furniture and Equipment- Plant and EquipmentInfrastructure- Roads- Drainage- Bridges- Footpaths- Parks & Ovals- Airports- Bus Shelters- Depot- Other
Interest Expenses (Finance Costs)DebenturesOther
Rental Charges- Operating Leases
(ii) Crediting as Revenue:
Interest EarningsInvestments - Reserve FundsInvestments - Other FundsOther Interest Revenue
34
1,433
1,491
-
173
9
5,572
461338
-
11,091
-
694
2,569
1,792
2,35560 18128
146
9161,604
2,792
1,512503
1,252
199 320
1,491
23(a)
1,099
295
-
2014
219131
825
141
-
11,1722,52480
1,662 1,218
9,740
-
1,662
6
-
-
20
20132014
-
Notes Actual Budget Actual
22 28
21927(b)
-
-8 - 5- -
-
2,044 2,191
2,6701,071 776
27(b)
8
-
1,532
--
20
131
50
2,208
2978 51 41
199
-
141
-
2,266
320
2,856
3,297
21
49

page 21
Town of Port Hedland
Notes to the Financial Statements for the year ended 30 June 2014
Note 2. Operating Revenues and Expenses (continued)
(b) Statement of Objectives, Reporting Programs and Nature or Type
REPORTING PROGRAM DESCRIPTIONS
Council operations that are disclosed encompass the following service orientated activities/programs:
COMMUNITY VISION
GOVERNANCE
Objective: To provide a decision making process for the efficient allocation of scarce resources.
GENERAL PURPOSE FUNDING
Objective: To collect revenue to allow for the provision of services.
Activities: Rates, general purpose government grants, and interest revenue.
LAW, ORDER, PUBLIC SAFETY
Objective: To provide services to help ensure a safer community.
Activities: Supervision and enforcement of various local laws relating to fire prevention, animal control and protection of the environment and other aspects of public safety including emergency services.
HEALTH
Objective: To provide an operational framework for good community health.
Activities: Food quality and pest control, and Aboriginal Environment health
EDUCATION AND WELFARE
Objective: To meet the needs of the community in these areas.
In order to discharge its responsibilities to the community, Council has developed a set of operational andfinancial objectives. These objectives have been established both on an overall basis and for each of its broadactivities/programs.
The Town of Port Hedland's vision is to create "a nationally significant, friendly city, where people want to liveand are proud to call home."
Activities: Administration and operation of facilities and services to members of council; other costs that relate to the tasks of assisting elected members and ratepayers on matters which do not concern specific council
Activities: Operation of senior and frail citizens' centres, day care centres and theatre; and assistance toplay groups aged care and other voluntary services.
50

page 22
Town of Port Hedland
Notes to the Financial Statements for the year ended 30 June 2014
Note 2. Operating Revenues and Expenses (continued)
(b) Statement of Objectives, Reporting Programs and Nature or Type (continued)
HOUSING
Objective: Help ensure adequate housing.
Activities: Maintenance of staff and community housing.
COMMUNITY AMENITIES
Objective: To provide services required by the community.
Activities: Rubbish collection services, operation of rubbish disposal sites, litter control, construction and maintenance of urban storm water drains, protection of the environment and administration of town planning schemes, cemeteries and public conveniences.
RECREATION AND CULTURE
Objective: To establish and effectively manage infrastructure and resources which will help the social wellbeing of the community.
Activities: Maintenance of public halls, civic centre, aquatic centre, beaches, recreation centres and various sporting facilities. Provision and maintenance of parks, gardens and playgrounds. Operation of library, museum and other cultural facilities.
TRANSPORT
Objective: To provide safe, effective and efficient transport services to the community.
Activities: Airport operations; construciton and maintenance of streets, roads, bridges; cleaning and lighting ofstreets
ECONOMIC SERVICES
Objective: To help promote the Town and its economic wellbeing.
Activities: The regulation and provision of tourism, area promotion, building control and cattleyards.
OTHER PROPERTY & SERVICES
Objective: To help maintain the Town's assets and carry out repairs and maintenance
Activities: Private works operation, plant repairs and operation costs.
51
page 23
Town of Port Hedland
Notes to the Financial Statements for the year ended 30 June 2014
Note 2. Operating Revenues and Expenses (continued)
(c) Nature or Type Classifications
REVENUE
Rates
All rates levied under the Local Government Act 1995. Includes general, differential, specific area rates, minimum rates, interim rates, back rates, ex-gratia rates, less discounts offered. Excludes administration fees, interest on instalments, interest on arrears, service charges and waste and sewerage rates.
Operating Grants, Subsidies and Contributions
Refer to all amounts received as grants, subsidies and contributions that are not non-operating grants.
Non-Operating Grants, Subsidies and Contributions
Amounts received specifically for the acquisition, construction of new or the upgrading of non-current assets paid to a local government, irrespective of whether these amounts are received as capital grants, subsidies, contributions or donations.
Profit on Asset Disposal
Profit on the disposal of assets including gains on the disposal of long term investments. Losses are disclosed under the expenditure classifications.
Fees and Charges
Revenue (other than service charges) from the use of facilities and charges made for local government services, sewerage rates, rentals, hire charges, fee for service, photocopying charges, licences, sale of goods orinformation, fines, penalties and administration fees.
Service Charges
Service charges imposed under Division 6 of Part 6 of the Local Government Act 1995. Regulation 54 of the LocalGovernment (Financial Management) Regulations identifies the charges which can be raised. These are television and radio rebroadcasting, underground electricity, property surveillance and security and water services. Excludes rubbish removal and charges for the provision of waste services.
Interest Earnings
Interest and other items of a similar nature received from bank and investment accounts, interest on rate instalments, interest on rate arrears and interest on debtors.
Other Revenue
Other revenue, which cannot be classified under the above headings, includes dividends, discounts, rebates, etc.
Town of Port Hedland is required by the Australian Accounting Standards to disclose revenue and expenditure according to its nature or type classification. The following nature or function descriptions are also required by State Government regulations.
52
page 24
Town of Port Hedland
Notes to the Financial Statements for the year ended 30 June 2014
Note 2. Operating Revenues and Expenses (continued)
(c) Nature or Type Classifications (continued)
EXPENDITURE
Employee Costs
All costs associated with the employment of persons such as salaries, wages, allowances, benefits such as vehicle and housing, superannuation, employment expenses, removal expenses, relocation expenses, worker's compensation insurance, training costs, conferences, safety expenses, medical examinations, fringe benefits tax etc.
Material and Contracts
All expenditure on materials, supplies and contracts not classified under other headings. These include supply of goods and materials, legal expenses, consultancy, maintenance agreements, communication expenses, advertising expenses, membership, periodicals, publications, hire expenses, rental, leases, postage and freight etc
Utilities (Gas, Electricity, Water, etc.)
Expenditures made to respective agencies for the provision of power, gas or water. Excludes expenditure incurred for the re-instatement of road works on behalf of these agencies.
Depreciation on Non-Current Assets
Depreciation and amortisation expense raised on all classes of assets.
Loss on Asset Disposal
Loss on the disposal of fixed assets.
Interest Expenses
Interest and other costs of finance paid, including costs of finance for loan debentures, overdraft accommodation and re-financing expenses.
Insurance
All insurance other than worker's compensation and health benefit insurance included as a cost of employment.
Other Expenditure
Statutory fees, taxes, provision of bad debts. Donations and subsidies made to community groups.
53

Not
es to
the
Fina
ncia
l Sta
tem
ents
for t
he y
ear e
nded
30
June
201
4
Not
e 2.
Ope
ratin
g R
even
ues
and
Expe
nses
(con
tinue
d)
$ '0
00
(d) C
ondi
tions
Ove
r Gra
nts,
Sub
sidi
es &
Con
tribu
tions
Gra
nt/S
ubsi
dy/C
ontr
ibut
ion
Law
, Ord
er &
Pub
lic S
afet
yEn
viro
nmen
t Hea
lth -
Dog
Hea
lth P
rogr
amm
e - 0
9/10
(*)
Awar
e G
rant
- SE
MC
- U
pdat
e Em
erge
ncy
Ris
k M
anag
emen
t
Hea
lthEn
viro
nmen
t Hel
p - P
ilbar
a R
egio
ns A
borig
inal
Hea
lth W
orks
hop
(*)
Envi
ronm
enta
l Hea
lth -
Prep
are
EH P
lan
for Y
ande
yarra
(*)
Dep
artm
ent o
f Hea
lth -
Port
Hed
land
CLA
G -
FIM
MW
A 13
/14
Com
mun
ity A
men
ities
Cou
ntry
Loc
al G
over
nmen
t Fun
ding
Rou
nd 1
2/13
- D
rain
age
etc
Build
ing
Safe
ty (F
ire) G
rant
(*)
Rec
reat
ion
& C
ultu
reLa
ndC
orp
- Ska
te P
ark/
Yout
h Sp
ace
(*)
Gov
ernm
ent o
f WA
- NPP
- Fo
resh
ore
Mas
ter P
lan
(*)
Atla
s Iro
n - T
rails
Mas
ter P
lan
(*)
PH E
nhan
cem
ent S
chem
e - F
ores
hore
Par
kR
o yal
ities
for R
egio
ns -
Sth
Hed
land
Lib
rary
&C
omm
unity
Cen
treR
oyal
ities
for R
egio
ns -
Sout
h H
edla
nd B
owls
and
Ten
nis
Clu
bPi
lbar
a D
evel
o pm
ent C
omm
issi
on -
Sout
h H
edla
nd B
owls
and
Ten
nis
Clu
bC
omm
unity
Con
tribu
tion
- Bic
ycle
Pla
n(
)
page 2
Financial Statements 201
4 --
-(6)
2
-35
0
(500
)-
16
-
32
(373
)29
2
(15)
-
(58)
(17)
-50
0-
500
250
665
665
32-
-
Pilb
ara
Dev
elop
men
t Com
mis
sion
-Way
findi
ng S
igna
ge (F
orm
ally
C
oast
al A
cces
s M
anag
ed C
ampe
d)
33 250
(11)
-11
1,50
0(2
,000
)
30
10-
-
--
808
-35
(35)
-8
--
15-
350
-
15
250
44
-
-(8
) -
Bal
ance
1B
alan
ce
Expe
nded
3O
peni
ng
2014
30-J
un-1
320
13R
ecei
ved 2
Bal
ance
1
30-J
un-1
4
Clo
sing
Rec
eive
d 2
Expe
nded
3C
losi
ng
1-Ju
l-12
2013
2014
8 4 - --
3614
(41)
9
10-
(10)
--
-12
12
--
32
(50)
758 8
4517
54

Not
e 2.
Ope
ratin
g R
even
ues
and
Expe
nses
(con
tinue
d)
$ '0
00
(d) C
ondi
tions
Ove
r Gra
nts,
Sub
sidi
es &
Con
tribu
tions
(con
tinue
d)
Rec
reat
ion
& C
ultu
re (c
ontin
ued)
Dep
t of S
port
and
Rec
- C
SRFF
Gra
nt M
aste
r Pla
nnin
gAt
las
Iron
- In
term
Sw
imm
ing
WA
Polic
e Se
rvic
e - T
he S
lam
Cre
atin
g C
omm
uniti
es -
The
Slam
Dep
t of C
orre
ctiv
e Se
rvic
es -
The
Slam
Atla
s Iro
n "C
atch
for y
our t
houg
ht" m
usic
at J
D H
ardi
eD
ept o
f Spo
rt an
d R
ec -
Hed
land
Jun
ior B
aske
tbal
l Pro
gram
FMG
- H
elpi
ng o
ther
s C
omm
unity
Gra
nt -
Scho
ol S
erie
sKi
dspo
rt G
rant
Chi
ldre
n Bo
ok C
ounc
il of
Aus
tC
ontri
butio
ns 7
0533
0 - F
ores
hore
Reh
abilt
atio
nAu
stra
lian
Red
Cro
ss -
The
Slam
Port
Hed
land
Cha
mbe
r of C
omm
erce
- In
Ter
m S
wim
min
g Pr
ogra
mD
ept o
f Spo
rt an
d R
ecre
atio
n - M
arie
Mar
land
Ove
rhea
d Li
ghtin
g
Tran
spor
tR
oads
to R
ecov
ery
Reg
iona
l Roa
ds G
roup
Blac
kspo
t Fun
ding
BHP
- Wal
lwor
k Br
idge
Fe
dera
l Abo
rigin
al R
oad
Gra
nt
page 26
Financial Statements 2014
Clo
sing
Bal
ance
1R
ecei
ved
2Ex
pend
ed 3
Bal
ance
1-
Jul-1
220
1320
1330
-Jun
-13
2014
2014
30-J
un-1
4
Ope
ning
Clo
sing
(6)
- - - -
201-
12 10 9 6 5 5 5 3 2 1 -1
- - - (6) - -
4
(232
)
14
-
22 5
536
44-
-44444
220
-
-(4
4)-
(444
)
5 5
-
Expe
nded
3B
alan
ce 1
Rec
eive
d 2
-60
(3)
571025 512 10
- - - - - - - - -
363
469
(631
)
446
-(2
)
-
883
(674
)41
0
(3)
44
-
232
-25
25
(62) (4)
17
-
(14)
--
--
27-
27
Gar
nduw
a Am
boor
ny W
irnan
Gra
nt In
dige
nous
Spo
rt Pr
ogra
m -
The
Slam
and
Por
t Bou
nd
Atla
s Iro
n - "
Thro
ugh
our e
yes"
- O
ral h
isto
ry o
f Abo
rigin
al
peop
le o
f Por
t Hed
land
890
(354
)
44
(4)
9 12
55

Not
es to
the
Fina
ncia
l Sta
tem
ents
for t
he y
ear e
nded
30
June
201
4
Not
e 2.
Ope
ratin
g R
even
ues
and
Expe
nses
(con
tinue
d)
$ '0
00
(d) C
ondi
tions
Ove
r Gra
nts,
Sub
sidi
es &
Con
tribu
tions
(con
tinue
d)
Oth
er P
rope
rty
& S
ervi
ces
Nor
ther
n Pl
anni
ng -
Stud
ies
to F
acilit
ate
Sout
h H
edla
nd T
ip R
eloc
atio
nN
orth
ern
Plan
ning
- So
uth
Hed
land
Eas
t - P
lann
ing
Sche
me
Amm
endm
ent
Land
Cor
p - P
ort H
edla
nd In
frast
ruct
ure
Cap
acit y
Stu
dyD
epar
tmen
t of H
ousi
ng -
Port
Hed
land
Infra
stru
ctur
e C
apac
ity S
tudy
Tota
l Uns
pent
Gra
nts,
Sub
sidi
es &
Con
trib
utio
ns
12/1
3 AF
RN
otes
:(1
) - G
rant
s/co
ntrib
utio
ns re
cogn
ised
as
reve
nue
in a
pre
viou
s re
porti
ng p
erio
d w
hich
wer
e no
t exp
ende
d at
the
clos
e of
the
prev
ious
per
iod.
(2) -
New
gra
nts/
cont
ribut
ions
whi
ch w
ere
reco
gnis
ed a
s re
venu
es d
urin
g th
e re
porti
ng p
erio
d an
d w
hich
had
not
yet
bee
n fu
lly e
xpen
ded
in th
e m
anne
r spe
cifie
d by
the
con
tribu
tor.
(3) -
Gra
nts/
cont
ribut
ions
whi
ch h
ad b
een
reco
gnis
ed a
s re
venu
es in
a p
revi
ous
repo
rting
per
iod
or re
ceiv
ed in
the
curre
nt re
porti
ng p
erio
d an
d w
hich
wer
e ex
pend
ed in
the
cur
rent
repo
rting
per
iod
in th
e m
anne
r spe
cifie
d by
the
cont
ribut
or.
(4) -
Gra
nts
rece
ived
but
not
exp
ecte
d to
be
fully
exp
ende
d in
the
next
fina
ncia
l yea
r.
(*) -
Gra
nts/
cont
ribut
ions
reco
gnis
ed in
Not
e 2
(c) i
n th
e 20
12/2
013
Fina
ncia
l Sta
tem
ents
whi
ch h
ave
sinc
e be
en in
vest
igat
ed a
nd c
onfir
med
to b
e fu
lly e
xpen
ded.
Gra
nts/
cont
ribut
ions
whi
ch w
ere
not r
eco g
nise
d in
Not
e 2
(c) i
n th
e 20
12/2
013
Fina
ncia
l Sta
tem
ents
whi
ch h
ave
sinc
e be
en in
vest
igat
ed a
nd c
onfir
med
to
hav
e be
en re
ceiv
ed in
a p
rior y
ear a
nd n
ot fu
lly e
xpen
ded.
The
refo
re, t
he c
losi
ng b
alan
ce a
s at
30
June
201
3 ha
s be
en re
vise
d.
Financial Statem
Clo
sing
Bal
ance
1R
ecei
ved
2Ex
pend
ed 3
Bal
ance
1R
ecei
ved 2
Expe
nded
3B
alan
ce
1-Ju
l-12
2013
2013
30-J
un-1
320
1420
1430
-Jun
-14
Ope
ning
Clo
sing
184
9-
110
012
Pilb
ara
Dev
elop
men
t Com
mis
sion
- Po
rt H
edla
nd In
frast
ruct
ure
Ca p
acity
Stu
dy
(172
)-
-
-
(*)
2,70
6(4
02)
5,14
8(5
,240
)
2,30
4
-18
-18
-(1
8)-
2,61
4
-18
-18
-(1
8)-
1,62
31,
372
(692
)
(99) (9)
-18
(9)
56

page 28
Town of Port Hedland
Notes to the Financial Statements for the year ended 30 June 2014
Note 3. Cash and Cash Equivalents
$ '000
Cash on Hand - Municipal: UnrestrictedCash at Bank - Municipal: Restricted GrantsCash at Bank - Municipal: Restricted LoansCash at Bank - Reserves (Restricted)Less: Investments (Restricted)
Total Cash and Cash Equivalents
The following restrictions have been imposedby regulations or other externally imposedrequirements:
Asset Management ReserveUnderground Power ReserveWaste Collection ReserveAirport ReserveUnfinished Works and Committed Works ReserveLeave ReserveDeveloper Contribution Reserve- Car ParkingWaste Management ReserveLights Replacement ReserveDepot Facilities ReserveSouth Hedland Library ReserveSES Shed ReserveWaste Management & Recycling ReserveBHP ReserveCivil Building / Infrastructure ReserveNewcrest ReserveSpoilbank ReserveRoyalties for Regions ReserveCommunity Facilities ReserveDeveloper Contribution Reserve- Public OpenGP Housing ReserveTotal Reserves
Unspent GrantsUnspent LoansTotal Unspent Grants and Loans
Total Restricted Cash
808 -
2014 2013
184
67,132 74,559
194
185
Actual Actual
654
2
2,614 2,304
808 -
4,855 (620)
Notes
68,409
39,608
12 982 -12 876 895
14(a) 76,243
12
4 (7,000) -
92712
12 -
2,304
- 1,258
2(d)
4,750
4,20412
12 - 14
12
16,463 19,060
1212
1212 158 -
23(c)
202
67,132
12 -
70,554
2,614
3,422
76,863
12 -
74,559
2,304
4840,760
12 - 45312 - 35
12 367 232-
12 - 2312 - 17
12 3,494 5,63812 - 8
57

page 29
Town of Port Hedland
Notes to the Financial Statements for the year ended 30 June 2014
Note 4. Investments
$ '000
Financial Assets at Fair Value through Profit and Loss
Movements in Financial Assets at Fair Value through Profit and LossAt beginning of the yearAdditionsDisposalsAt end of the year
Total Investments
Classified as:CurrentNon-CurrentTotal Investments
Note 5. Trade & Other Receivables
Current
RatesSundry DebtorsLoans - Clubs / InstitutionsAccrued IncomeOtherProvision for Doubtful Debts
Total Current Trade & Other Receivables
Non-Current
Rates Outstanding - PensionersLoans - Clubs / Institutions
Total Non-Current Trade & Other Receivables
245 1,45987 68
10,936 30,56576
11,262 32,216
(310) (501)
804
217
7 191,217
408
228
2014
7,000 -
7,000 --
7,000
2013
1,224 823
- -
-
Notes
--
7,000-
Actual2014 2013
Actual
7,000
7,000 -
--
58
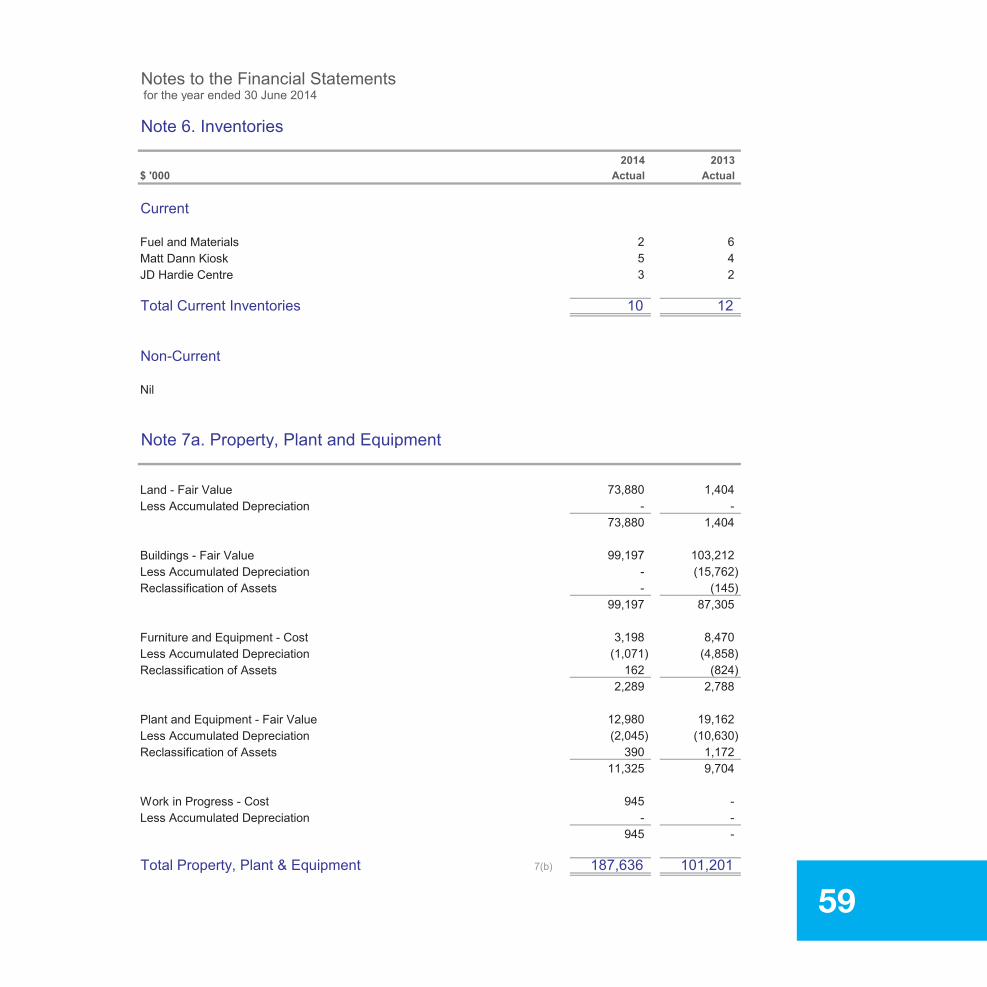
page 30
Town of Port Hedland
Notes to the Financial Statements for the year ended 30 June 2014
Note 6. Inventories
$ '000
Current
Fuel and MaterialsMatt Dann KioskJD Hardie Centre
Total Current Inventories
Non-Current
Nil
Note 7a. Property, Plant and Equipment
Land - Fair ValueLess Accumulated Depreciation
Buildings - Fair ValueLess Accumulated DepreciationReclassification of Assets
Furniture and Equipment - CostLess Accumulated DepreciationReclassification of Assets
Plant and Equipment - Fair ValueLess Accumulated DepreciationReclassification of Assets
Work in Progress - CostLess Accumulated Depreciation
Total Property, Plant & Equipment
Actual
- (145)
162 (824)
390 1,172
Actual
2 6
12
3 2
2013
73,880 1,404
10
2014
5 4
2014 2013
7(b) 101,201
- -1,404
99,197 87,305
99,197
8,470
945
12,980
73,880
103,212- (15,762)
2,289 2,788
19,162
3,198(1,071) (4,858)
(2,045)
-
11,325
--
9,704
(10,630)
945 -
187,636
59

page 31
Town of Port Hedland
Notes to the Financial Statements for the year ended 30 June 2014
Note 7a. Property, Plant and Equipment (continued)
$ '000
Effective from 1 July 2012, the Local Government (Financial Management) Regulations were amended and the measurement of non-current assets at Fair Value became mandatory.
This amendment allowed for a phasing in of fair value in relation to fixed assets over three years as follows:
a) for the financial year ending 30 June 2013, the fair value of all of the assets of the local government that are plant and equipment; and
b) for the financial year ending on 30 June 2014, the fair value of all of the assets of the local government -i) that are plant and equipment; andii) that are
* land and buildings; or* infrastructure
andc) for a financial year ending on and after 30 June 2015, the fair value of all of the assets of the local government.
Thereafter, in accordance with the regulations, earch asset class will be revalued at least every three (3) years.
In 2013, Council commenced the process of adopting Fair Value in accordance with the Regulations.
All assets are initially recognised at cost and subsequently revalued in accorrdance with the mandatory frameworkdetailed above. The assets are to be assigned to a level in the fair value hierachcy as follows:
Level 1 - Unadjusted quoted prices in active markets for identical assets or liabilities that the entity can accessat the measurement date.
Level 2 - Inputs other than quoted prices included within level 1 that are observable for the asset, either directlyor indirectly.
Level 3 - Unobservable inputs for the asset.
In relation to this initial measurement, cost is determined as the fair value of the assets given as consideration pluscosts incidental to the acquisition. For assets acquired at no cost or for nominal consideration, cost is determined asfair value at the date of acquisition.
Individual assets acquired between intial recognition and the next revaluation of the asset class in accordance with the mandatory measurement framework detailed above, are carried at cost less accumulated depreciation as this isdeemed by management to approximate Fair Value. These newly built or acquired assets will be categorised as a Level2 input as depreciation would not be a significant unobservable input. Assets will be subject to subsequent revaluationat the next anniversary date in accordance with the mandatory framework detailed above.
Valuation Process - Plant and EquipmentThe Town's Plant & Equipment was revalued at 30 June 2013 by independent valuers. All of the valuations were made on the basis of open market values of similar assets adjusted for condition and comparability (Level 2 inputs in the fair value hierarchy). Any Plant and Equipment assets acquired after the date of revaluation are recognised at costless accumulated depreciation and are considered Level 2 as detailed above.
414.00 108.00Notes Actual Actual
60

page 32
Town of Port Hedland
Notes to the Financial Statements for the year ended 30 June 2014
Note 7a. Property, Plant and Equipment (continued)
$ '000
Valuation Process - LandAn independent valuer was appointed to carry out a valuation of all Land and Buildings as at 30 June 2014. Land Fair Values have been measured by the Market Approach by Direct Comparison, an accepted valuation methodology under AASB13. Level 2 valuation inputs were utilised, being sales transactions of other properties within the region, and adjusted for differences between key attributes of the properties. The main input is the price per square metre or price per hectare of land area. The Market Approach is deemed a Level 2 input.
Valuation Process - BuildingsWhere there is an active and liquid market as evidenced by sales transactions of similar property types, the MarketApproach by Direct Comparison, Income or Summation methods can be utilised, and is an accepted valuation methodology under AASB13. If a Market Approach is adopted, the building valuation is deemed to be a Level 2 input.
Direct Comparison and Summation methods involve the analysis of sales evidence and comparisons with the subject taking into account matters such as method of construction, size, condition, age, land area and location. The land value is subtracted from the Market Value of the property to measure the asset Fair Value. The Market Approach was adopted on twenty six (26) assets.
The Income approach is applied to income producing properties and includes the capitalisation of net income method and discounted cash flow approach. The capitalisation method involves capitalising the estimated net income of theproperty at an appropriate capitalisation rate (net yield) that has been determined through the analysis of salesevidence. The discounted cash approach involves forecasting the expected net cash flow over a defined period(usually ten years) and discounting the income stream and terminal value at a suitable discount rate to arrive at apresent value. This methodology was not applicable to any Land or Building assets.
Due to the predominantly specialised nature of Local Government Assets, most of the buildings valuations have beenundertaken on a Cost Approach (Depreciated Replacement Cost) to valuation, an accepted valuation methodology under AASB13. The cost approach is deemed a Level 3 Input. Under this approach, the following process has beenadopted:
Where there is no depth of market as determined for the Council assets, the net current value of an asset is the gross current value less accumulated depreciation to reflect the consumed or expired service potential of theasset. Published/available market data for recent projects, and/or published cost guides are utilised todetermine the estimated replacement cost (gross value) of the asset, including allowances for preliminaries and professional fees. This is considered a Level 2 input.
A condition assessment is applied, which is based on factors such as the age of the asset, overall condition asnoted by the Valuer during inspection, economic and/or functional obsolescence. The condition assessment directly translates to the level of depreciation applied.
While the replacement cost of the assets could be supported by market supplied evidence (level 2), the other unobservable inputs (such as estimates of residual value, useful life, and asset condition) were alsorequired (level 3).
- -Notes Actual Actual
61
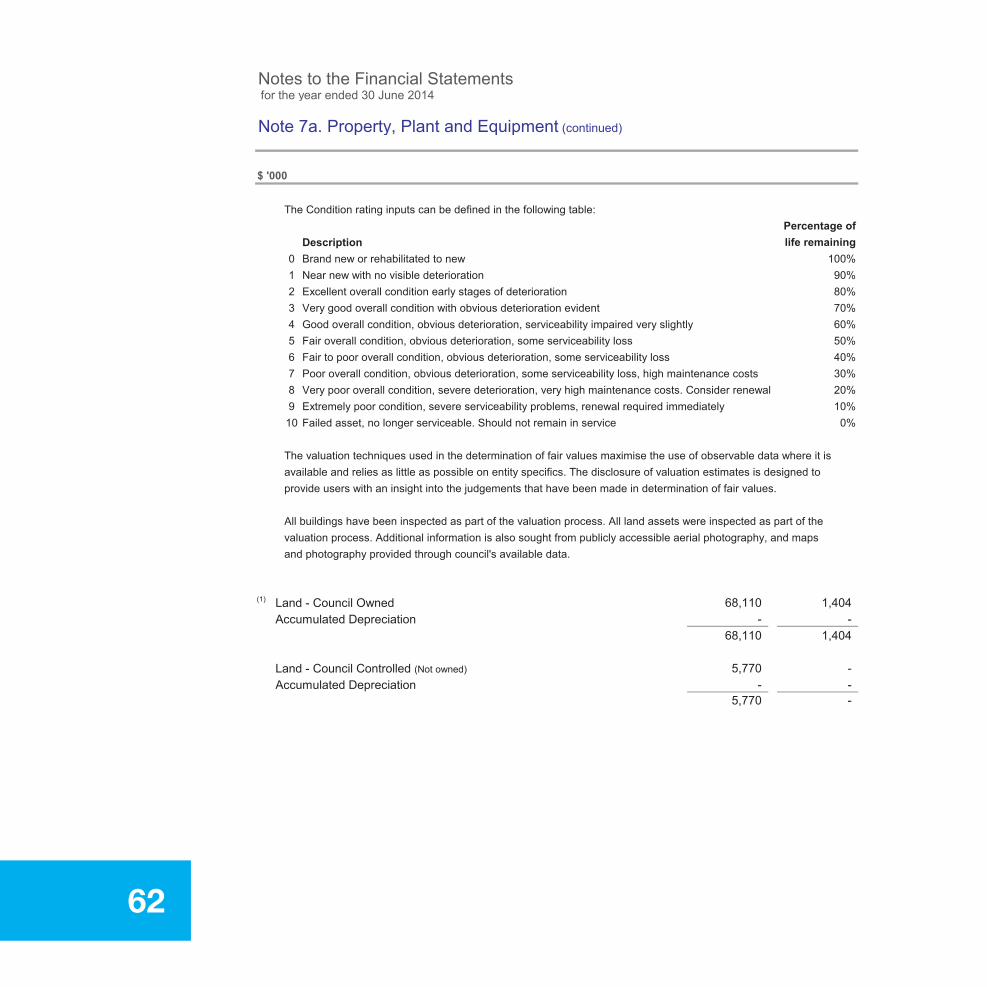
page 33
Town of Port Hedland
Notes to the Financial Statements for the year ended 30 June 2014
Note 7a. Property, Plant and Equipment (continued)
$ '000
The Condition rating inputs can be defined in the following table:
DescriptionBrand new or rehabilitated to newNear new with no visible deteriorationExcellent overall condition early stages of deteriorationVery good overall condition with obvious deterioration evidentGood overall condition, obvious deterioration, serviceability impaired very slightlyFair overall condition, obvious deterioration, some serviceability lossFair to poor overall condition, obvious deterioration, some serviceability lossPoor overall condition, obvious deterioration, some serviceability loss, high maintenance costsVery poor overall condition, severe deterioration, very high maintenance costs. Consider renewalExtremely poor condition, severe serviceability problems, renewal required immediatelyFailed asset, no longer serviceable. Should not remain in service
The valuation techniques used in the determination of fair values maximise the use of observable data where it is available and relies as little as possible on entity specifics. The disclosure of valuation estimates is designed toprovide users with an insight into the judgements that have been made in determination of fair values.
All buildings have been inspected as part of the valuation process. All land assets were inspected as part of thevaluation process. Additional information is also sought from publicly accessible aerial photography, and maps and photography provided through council's available data.
(1) Land - Council OwnedAccumulated Depreciation
Land - Council Controlled (Not owned)Accumulated Depreciation
10
Percentage oflife remaining
100%90%80%70%60%50%40%30%20%10%
0%
45
123
6789
0
- 131,142.00Notes Actual Actual
5,770 -
68,110 1,404- -
68,110 1,404
5,770 -- -
62

Not
es to
the
Fina
ncia
l Sta
tem
ents
for t
he y
ear e
nded
30
June
201
4
Not
e 7b
. Pro
perty
, Pla
nt a
nd E
quip
men
t (co
ntin
ued)
Mov
emen
ts in
Car
ryin
g Am
ount
s
$ '0
00N
otes
Fai
r Val
ue
Fai
r Val
ue
Cos
t F
air V
alue
C
ost
Bala
nce
as a
t 1 J
uly
2013
1,40
487
,305
2,78
89,
704
-10
1,20
1
Addi
tions
- R
enew
al-
513
803,
301
381
4,27
5 -
New
1,68
235
733
050
756
43,
440
Dis
posa
ls(4
70)
--
(532
)-
(1,0
02)
Rev
alua
tion
- Inc
rem
ents
1371
,264
18,6
71-
--
89,9
35.
Impa
irmen
t - (D
ecre
men
ts)
-(5
25)
--
-(5
25)
-D
epre
ciat
ion
2(a)
-(2
,670
)(1
,071
)(2
,045
)-
(5,7
86)
Oth
er M
ovem
ents
-(4
,454
)16
239
0-
(3,9
02)
Prop
erty
, Pla
nt &
Equ
ipm
ent a
t 30
June
201
473
,880
99,1
972,
289
11,3
2594
518
7,63
6
Financial
Wor
k in
Pr
ogre
ss
Tot
al
Lan
d F
urni
ture
and
Eq
uipm
ent
Pla
nt a
nd
Equi
pmen
t B
uild
ings
63
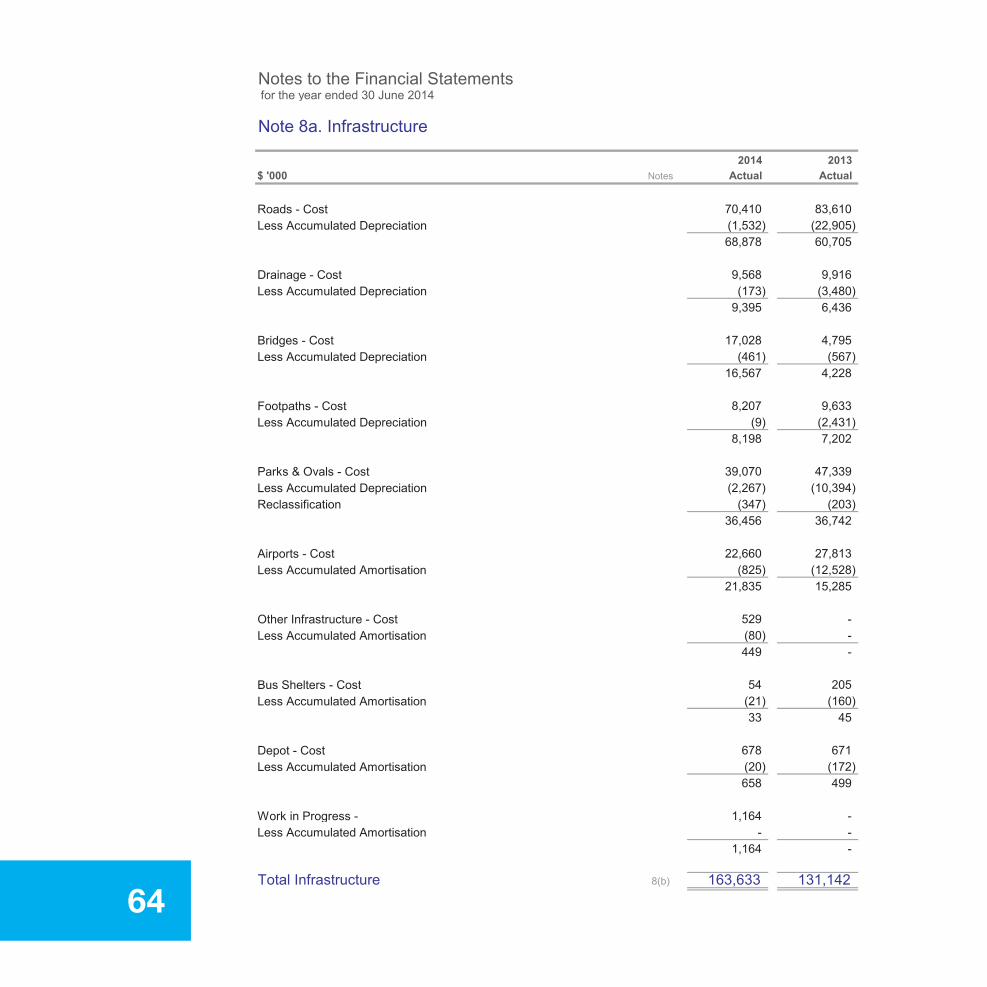
page 35
Town of Port Hedland
Notes to the Financial Statements for the year ended 30 June 2014
Note 8a. Infrastructure
$ '000
Roads - CostLess Accumulated Depreciation
Drainage - CostLess Accumulated Depreciation
Bridges - CostLess Accumulated Depreciation
Footpaths - CostLess Accumulated Depreciation
Parks & Ovals - CostLess Accumulated DepreciationReclassification
Airports - CostLess Accumulated Amortisation
Other Infrastructure - CostLess Accumulated Amortisation
Bus Shelters - CostLess Accumulated Amortisation
Depot - CostLess Accumulated Amortisation
Work in Progress - Less Accumulated Amortisation
Total Infrastructure
2014 2013
678 671
(173) (3,480)
Actual Actual
8,198 7,202
(461) (567)
163,633 131,142
83,610(1,532) (22,905)68,878 60,705
(2,431)
47,339
16,567
8,207
70,410
658 499
17,028 4,795
(825) (12,528)
(347) (203)
(20) (172)
39,070
9,633(9)
(2,267) (10,394)
36,456 36,742
9,568 9,916
4,228
9,395 6,436
(21) (160)
449 -
54 205
(80) -
21,835 15,285
8(b)
Notes
1,164 -- -
1,164 -
529 -
33 45
22,660 27,813
64

Not
es to
the
Fina
ncia
l Sta
tem
ents
for t
he y
ear e
nded
30
June
201
4
Not
e 8b
. Inf
rast
ruct
ure
(con
tinue
d)
Mov
emen
ts in
Car
ryin
g Am
ount
s
$ '0
00N
otes
Cos
t C
ost
Cos
t C
ost
Cos
t C
ost
Cos
t C
ost
Cos
t
-
Bala
nce
as a
t 1 J
uly
2013
60,7
056,
436
4,22
87,
202
36,7
4215
,285
-45
499
-13
1,14
2
Addi
tions
- R
enew
al5,
574
72-
151,
095
19-
--
1,00
27,
777
- N
ew88
23,
064
12,5
0096
11,
233
7,27
615
-10
616
226
,199
Dis
posa
ls-
--
--
--
--
--
Rev
alua
tion
- Inc
rem
ents
13-
--
--
--
--
--
Rev
alua
tion
- (D
ecre
men
ts)
13-
--
--
--
--
--
Impa
irmen
t - (L
osse
s)-
--
--
--
--
--
Impa
irmen
t - R
ever
sals
--
--
--
--
--
-
Dep
reci
atio
n (E
xpen
se)
2(a)
(1,5
32)
(173
)(4
61)
(9)
(2,2
65)
(825
)(8
0)(2
1)(2
0)-
(5,3
86)
Oth
er M
ovem
ents
(rec
lass
ifica
tion)
3,24
9(4
)30
029
(349
)80
514
973
-3,
901
Infr
astr
uctu
re a
t 30
June
201
468
,878
9,39
516
,567
8,19
836
,456
21,8
3544
933
658
1,16
416
3,63
3
Par
ks &
O
vals
page 36
Roa
ds
Dra
inag
e B
ridge
s F
ootp
aths
A
irpor
ts
Tota
l
Financial Statements 2014
Oth
er
Infr
astr
uc-
ture
Bus
Sh
elte
rs
Dep
ot
Wor
k in
Pr
ogre
ss
65
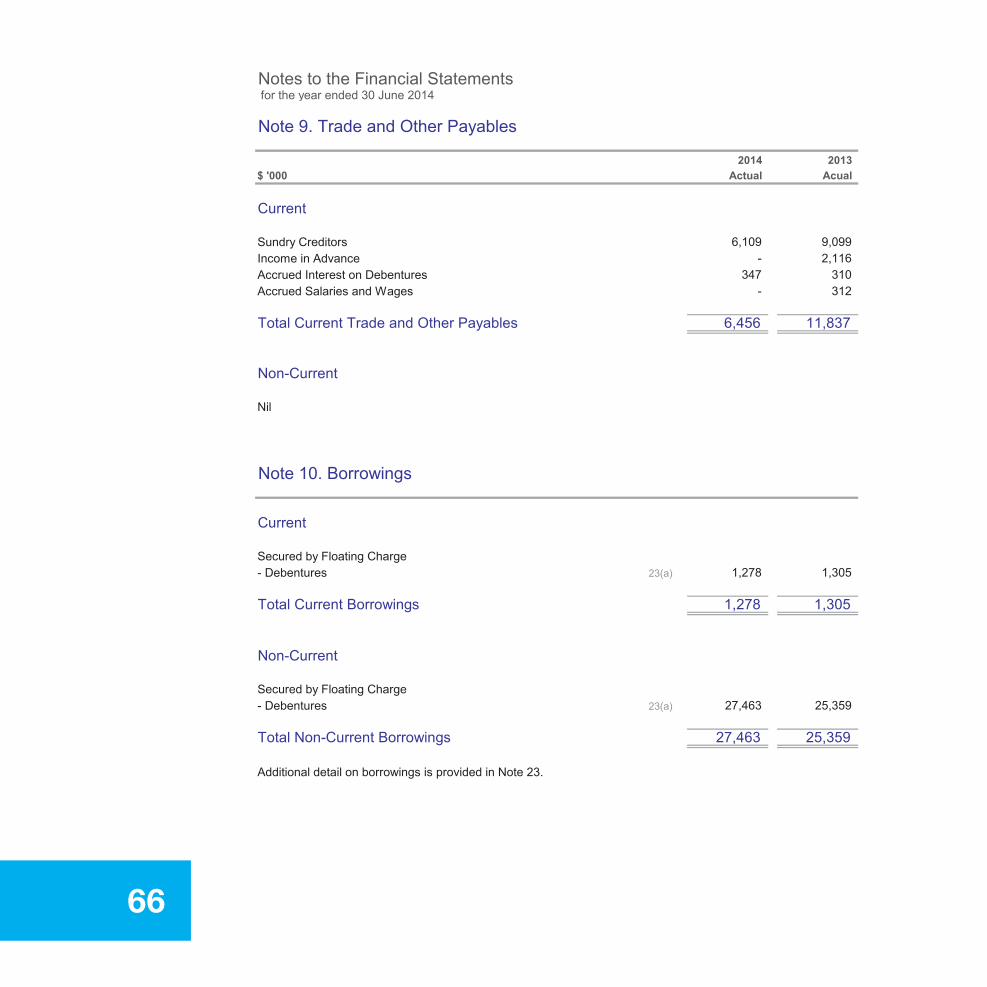
page 37
Town of Port Hedland
Notes to the Financial Statements for the year ended 30 June 2014
Note 9. Trade and Other Payables
$ '000
Current
Sundry CreditorsIncome in AdvanceAccrued Interest on DebenturesAccrued Salaries and Wages
Total Current Trade and Other Payables
Non-Current
Nil
Note 10. Borrowings
Current
Secured by Floating Charge- Debentures
Total Current Borrowings
Non-Current
Secured by Floating Charge- Debentures
Total Non-Current Borrowings
Additional detail on borrowings is provided in Note 23.
1,278
- 312
- 2,116
1,278 1,305
27,463 25,359
27,463 25,359
2014 2013Actual Acual
2013
6,109 9,099
347 310
1,305
6,456 11,837
2014
23(a)
23(a)
66
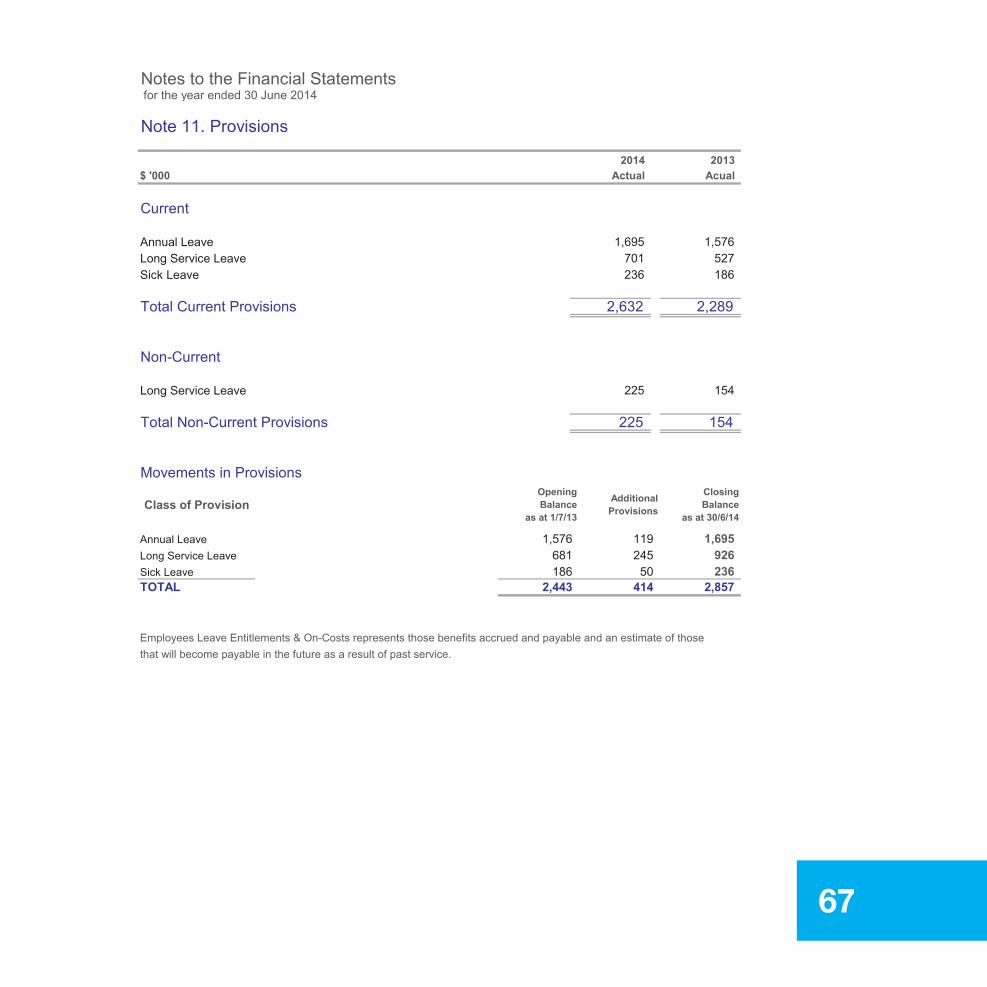
page 38
Town of Port Hedland
Notes to the Financial Statements for the year ended 30 June 2014
Note 11. Provisions
$ '000
Current
Annual LeaveLong Service LeaveSick Leave
Total Current Provisions
Non-Current
Long Service Leave
Total Non-Current Provisions
Movements in Provisions
Employees Leave Entitlements & On-Costs represents those benefits accrued and payable and an estimate of thosethat will become payable in the future as a result of past service.
701 527236 186
154
Actual
1,695 1,576
2,632 2,289
225
Acual2014 2013
225 154
Additional Provisions
ClosingBalance
as at 30/6/14
236
Annual Leave 1,576 119 1,695926
Sick Leave 186 50Long Service Leave 681
Class of ProvisionOpeningBalance
as at 1/7/13
245
TOTAL 2,443 414 2,857
67
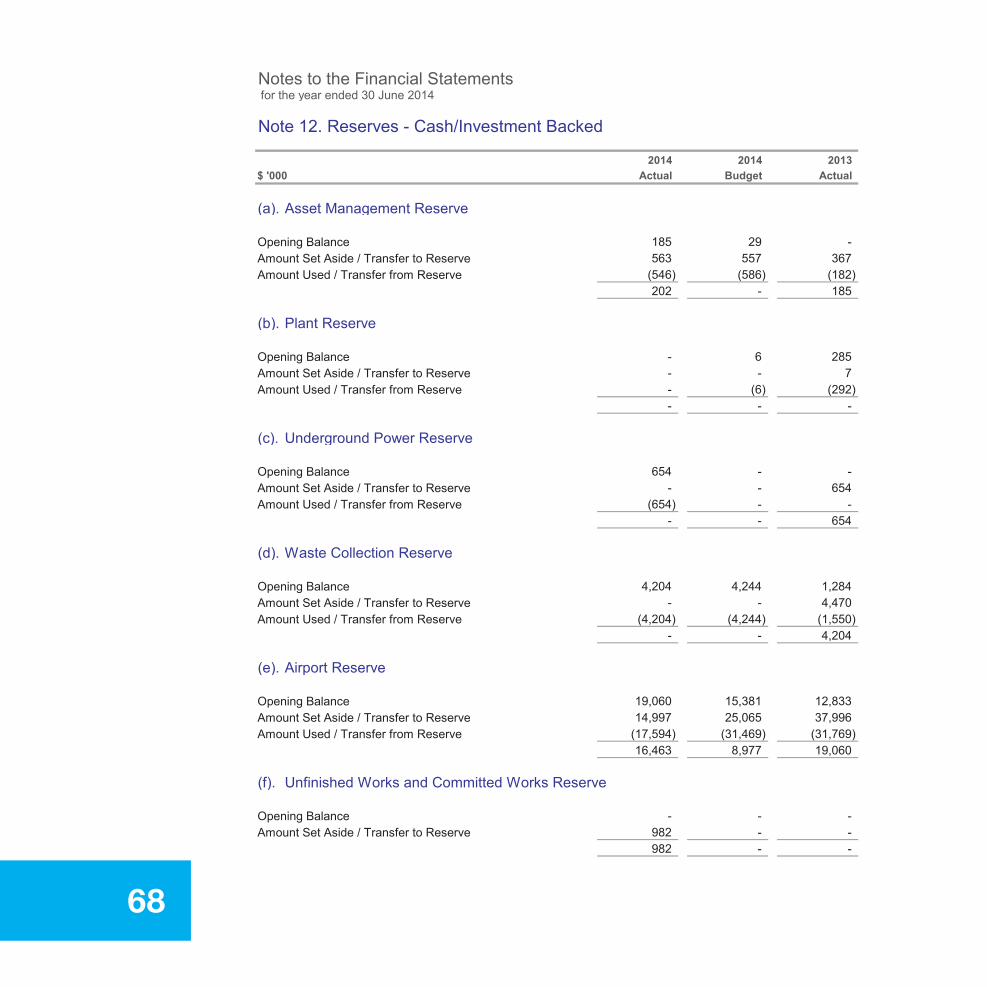
page 39
Town of Port Hedland
Notes to the Financial Statements for the year ended 30 June 2014
Note 12. Reserves - Cash/Investment Backed
$ '000
(a). Asset Management Reserve
Opening BalanceAmount Set Aside / Transfer to ReserveAmount Used / Transfer from Reserve
(b). Plant Reserve
Opening BalanceAmount Set Aside / Transfer to ReserveAmount Used / Transfer from Reserve
(c). Underground Power Reserve
Opening BalanceAmount Set Aside / Transfer to ReserveAmount Used / Transfer from Reserve
(d). Waste Collection Reserve
Opening BalanceAmount Set Aside / Transfer to ReserveAmount Used / Transfer from Reserve
(e). Airport Reserve
Opening BalanceAmount Set Aside / Transfer to ReserveAmount Used / Transfer from Reserve
(f). Unfinished Works and Committed Works Reserve
Opening BalanceAmount Set Aside / Transfer to Reserve
202 - 185
563 557 367
654 - -- - 654
-
(546) (586) (182)
Actual
185 29 -
2014 2014 2013Actual Budget
(6) (292)- - -
- 6 285- - 7
(4,204) (4,244) (1,550)- - 4,204
4,204 4,244 1,284- - 4,470
(654) - -- - 654
(17,594) (31,469) (31,769)16,463 8,977 19,060
19,060 15,381 12,83314,997 25,065 37,996
982 - -
- - -982 - -
68

page 40
Town of Port Hedland
Notes to the Financial Statements for the year ended 30 June 2014
Note 12. Reserves - Cash/Investment Backed (continued)
$ '000
(g). Leave Reserve
Opening BalanceAmount Set Aside / Transfer to ReserveAmount Used / Transfer from Reserve
(h). Developer Contribution Reserve- Car Parking
Opening BalanceAmount Set Aside / Transfer to Reserve
(i). Waste Management Reserve
Opening BalanceAmount Set Aside / Transfer to ReserveAmount Used / Transfer from Reserve
(j). Lights Replacement Reserve
Opening BalanceAmount Used / Transfer from Reserve
(k). Depot Facilities Reserve
Opening BalanceAmount Used / Transfer from Reserve
(l). South Hedland Library Reserve
Opening BalanceAmount Used / Transfer from Reserve
(m).SES Shed Reserve
Opening BalanceAmount Set Aside / Transfer to ReserveAmount Used / Transfer from Reserve
2014 2014 2013Actual Budget Actual
(80)876 854 895
367 260 232
232 256 227135 4 5
-
895 840 949- 14 26
(19) -
- -15,297
23 23 23
(10,547) (11,777) -4,750 2,484 -
(14) (15) -- - 14
14 15
14,261 -
(17) (11) -17 11 17
(23) (23) -- - 23
14
- - 17
(35) (36) -- - 35
35 36 34- - 1
69

page 41
Town of Port Hedland
Notes to the Financial Statements for the year ended 30 June 2014
Note 12. Reserves - Cash/Investment Backed (continued)
$ '000
(n). Waste Management & Recycling Reserve
Opening BalanceAmount Set Aside / Transfer to ReserveAmount Used / Transfer from Reserve
(o). BHP Reserve
Opening BalanceAmount Set Aside / Transfer to ReserveAmount Used / Transfer from Reserve
(p). Civil Building / Infrastructure Reserve
Opening BalanceAmount Set Aside / Transfer to ReserveAmount Used / Transfer from Reserve
(q). Newcrest Reserve
Opening BalanceAmount Used / Transfer from Reserve
(r). Spoilbank Reserve
Opening BalanceAmount Set Aside / Transfer to ReserveAmount Used / Transfer from Reserve
(s). Royalties for Regions Reserve
Opening BalanceAmount Set Aside / Transfer to ReserveAmount Used / Transfer from Reserve
2014 2014 2013
453 460 442- - 11
Budget ActualActual
(2,256) (5,481) (5,942)3,494 724 5,638
5,638 6,083 7,779112 122 3,801
(453) (460) -- - 453
- - 8
- - 2(8) - (85)
8 - 91
40,760 40,510 10,386- 32 30,425
(2) (3) -- - 2
2 3 2
(895) - (2,542)48 - 927
927 - 24916 - 3,220
(1,152) (1,449) (51)39,608 39,093 40,760
70

page 42
Town of Port Hedland
Notes to the Financial Statements for the year ended 30 June 2014
Note 12. Reserves - Cash/Investment Backed (continued)
$ '000
(t). Community Facilities Reserve
Opening BalanceAmount Set Aside / Transfer to ReserveAmount Used / Transfer from Reserve
(u). GP Housing Reserve
Opening BalanceAmount Set Aside / Transfer to ReserveAmount Used / Transfer from Reserve
(v). Developer Contributions Reserve- Public Open
Opening BalanceAmount Set Aside / Transfer to Reserve
Total Reserves
Summary of Reserve Transfers
Transfers to ReservesAsset Management ReservePlant ReserveUnderground Power ReserveWaste Collection ReserveAirport ReserveUnfinished Works and Committed Works ReserveLeave ReserveDeveloper Contribution Reserve- Car ParkingWaste Management ReserveSES Shed ReserveWaste Management & Recycling ReserveBHP ReserveCivil Building / Infrastructure ReserveSpoilbank ReserveRoyalties for Regions ReserveCommunity Facilities ReserveGP Housing ReserveDeveloper Contribution Reserve- Public OpenTotal Transfers to Reserves
2014 2014 2013Actual Budget Actual
67,132 52,435 74,559
1,326 1,326 530- - 1,535
33,586 41,381 83,050158 - -
16 - 3,220
194 37 699
(2,584) (3,123) (1,491)- 6 1,258
1,258 1,803 2,2191,326 1,326 530
563 557 367- - 7
184 37 194
- - 1,535(10) - (2,040)
- - -158 - -158 - -
- 14 26135 4 5
14,997 25,065 37,996982 - -
- - 654- - 4,470
-
112 122 3,801
15,297 14,261 -- - 1
11
32 30,425
- -
- - 2
71

page 43
Town of Port Hedland
Notes to the Financial Statements for the year ended 30 June 2014
Note 12. Reserves - Cash/Investment Backed (continued)
$ '000
Transfers from ReservesAsset Management ReservePlant ReserveUnderground Power ReserveWaste Collection ReserveAirport ReserveLeave ReserveWaste Management ReserveLights Replacement ReserveDepot Facilities ReserveSouth Hedland Library ReserveSES Shed ReserveWaste Management & Recycling ReserveBHP ReserveCivil Building / Infrastructure ReserveNewcrest ReserveSpoilbank ReserveRoyalties for Regions ReserveCommunity Facilities ReserveGP Housing ReserveTotal Transfers from Reserves
Total Net Transfer to/(from) Reserves
Asset Management Reserve- for the ongoing maintenance, refurbishment and development of Council owned assets within the Town of Port Hedland
Plant Reserve- to be used for the purchase of major plant on an ongoing basis.
Underground Power Reserve- being for the installation of Underground Power within the Town of Port Hedland.
Airport Reserve- to fund the ongoing and future operation of the Port Hedland International Airport.
Leave Reserve- to be used to fund annual and long service leave requirements.
2014 2014 2013Actual Budget Actual
(1,152) (1,449) (51)
(2,584) (3,123) (1,491)(895) -
(2) (3) -(85)
-
(5,481) (5,942)
(23) (23) -
(8) -
(2,542)
(7,427) (17,302) 37,026
In accordance with council resolutions in relation to each reserve account, the purpose for which the reserves are set aside are as follows:
(10) - (2,040)
All of the cash backed reserve accounts are supported by money held in financial institutions and match the amounts shown as restricted cash in Note 3 and 4 to this financial report.
(41,013) (58,683) (46,024)
(10,547) (11,777)
(2,256)
(4,204)
(19) - (80)
(4,244) (1,550)
(546) (586) (182)
(17,594)
(292)(654) - -
(31,469) (31,769)
(35) (36) -(453) (460) -
(17) (11) -(14) (15) -
- (6)
72
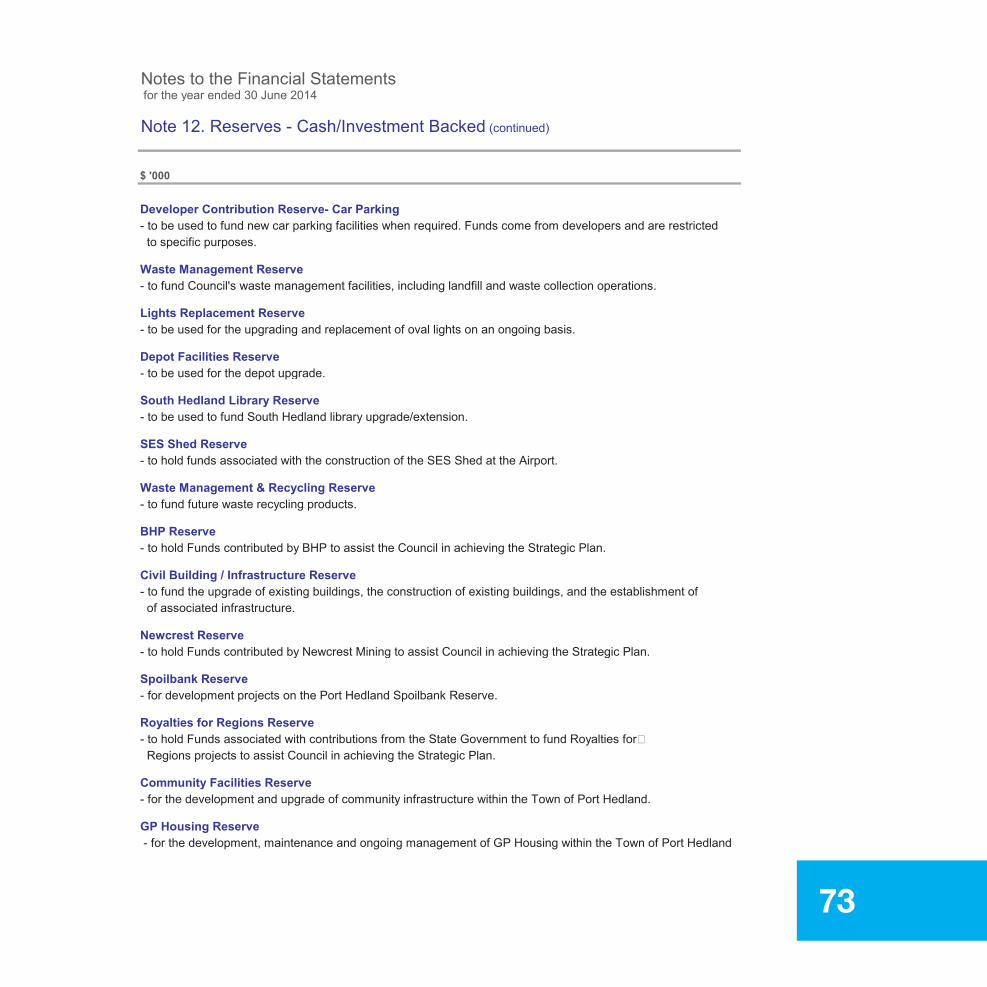
page 44
Town of Port Hedland
Notes to the Financial Statements for the year ended 30 June 2014
Note 12. Reserves - Cash/Investment Backed (continued)
$ '000
Developer Contribution Reserve- Car Parking- to be used to fund new car parking facilities when required. Funds come from developers and are restricted to specific purposes.
Waste Management Reserve- to fund Council's waste management facilities, including landfill and waste collection operations.
Lights Replacement Reserve- to be used for the upgrading and replacement of oval lights on an ongoing basis.
Depot Facilities Reserve- to be used for the depot upgrade.
South Hedland Library Reserve- to be used to fund South Hedland library upgrade/extension.
SES Shed Reserve- to hold funds associated with the construction of the SES Shed at the Airport.
Waste Management & Recycling Reserve- to fund future waste recycling products.
BHP Reserve- to hold Funds contributed by BHP to assist the Council in achieving the Strategic Plan.
Civil Building / Infrastructure Reserve- to fund the upgrade of existing buildings, the construction of existing buildings, and the establishment of of associated infrastructure.
Newcrest Reserve- to hold Funds contributed by Newcrest Mining to assist Council in achieving the Strategic Plan.
Spoilbank Reserve- for development projects on the Port Hedland Spoilbank Reserve.
Royalties for Regions Reserve
Regions projects to assist Council in achieving the Strategic Plan.
Community Facilities Reserve- for the development and upgrade of community infrastructure within the Town of Port Hedland.
GP Housing Reserve - for the development, maintenance and ongoing management of GP Housing within the Town of Port Hedland
1,023.00 557.00 633.00Actual Budget Actual
73

page 45
Town of Port Hedland
Notes to the Financial Statements for the year ended 30 June 2014
Note 13. Reserves - Asset Revaluation
$ '000
Asset revaluation reserves have arisen on revaluation of the following classes of assets:
(a). Land
Opening BalanceRevaluation Increment
(b). Buildings
Opening BalanceRevaluation IncrementRevaluation Decrement
Total Asset Revaluation Reserves
Note 14. Notes to the Statement of Cash flows
$ '000
(a). Reconciliation of Cash
For the purposes of the Statement of Cash Flows, cash includes cash on hand and cash equivalents, net of outstanding bank overdrafts. Cash at the end of the reporting period is reconcilied to the related items inthe Statement of Financial Position as follows:
Cash and Cash Equivalents
Notes
3
Notes
7(b)
7(b)7(b)
71,926 662
18,671191
Actual Budget Actual
90,263
71,264 -
68,409 78,478 76,243
191-
(525) -18,337 191
853
2014 2014 2013
Actual Actual
662 662
2014 2013
74
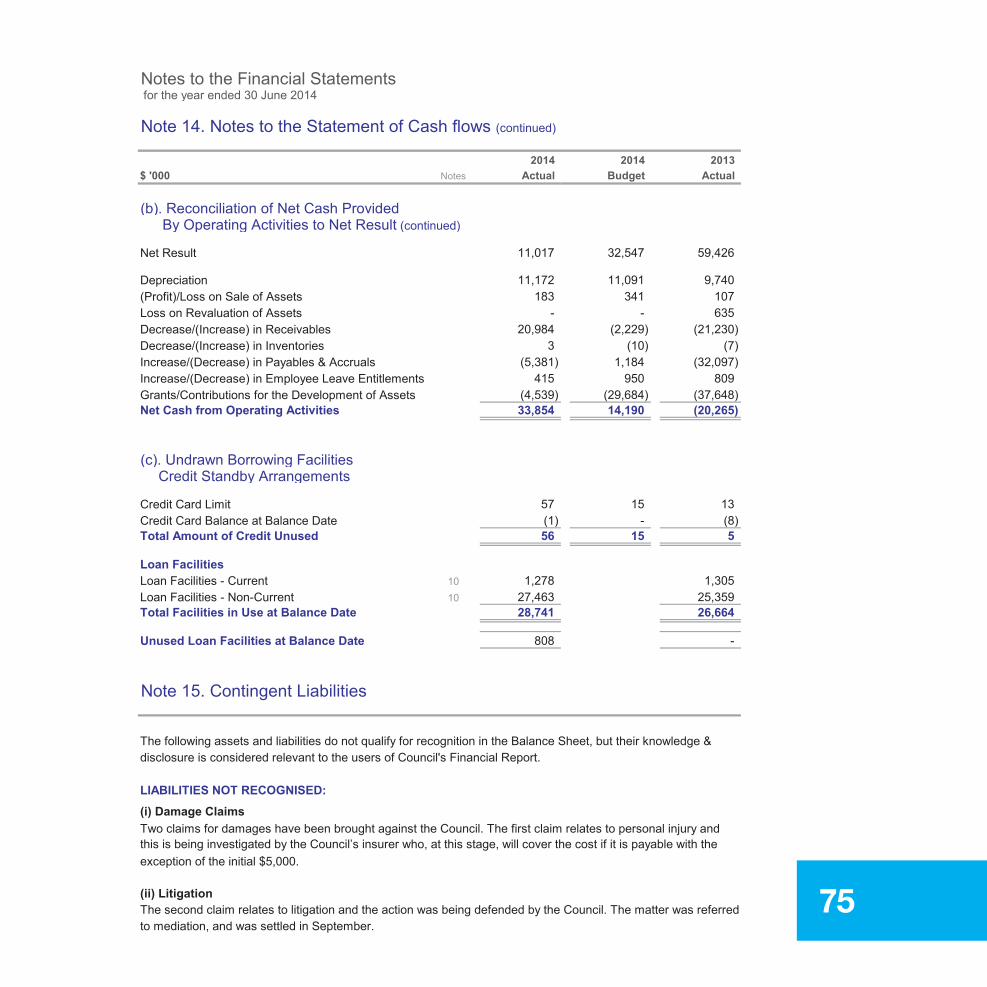
page 46
Town of Port Hedland
Notes to the Financial Statements for the year ended 30 June 2014
Note 14. Notes to the Statement of Cash flows (continued)
$ '000
(b). Reconciliation of Net Cash Provided By Operating Activities to Net Result (continued)
Net Result
Depreciation(Profit)/Loss on Sale of AssetsLoss on Revaluation of AssetsDecrease/(Increase) in ReceivablesDecrease/(Increase) in InventoriesIncrease/(Decrease) in Payables & AccrualsIncrease/(Decrease) in Employee Leave EntitlementsGrants/Contributions for the Development of AssetsNet Cash from Operating Activities
(c). Undrawn Borrowing FacilitiesCredit Standby Arrangements
Credit Card LimitCredit Card Balance at Balance DateTotal Amount of Credit Unused
Loan FacilitiesLoan Facilities - CurrentLoan Facilities - Non-CurrentTotal Facilities in Use at Balance Date
Unused Loan Facilities at Balance Date
Note 15. Contingent Liabilities
The following assets and liabilities do not qualify for recognition in the Balance Sheet, but their knowledge & disclosure is considered relevant to the users of Council's Financial Report.
LIABILITIES NOT RECOGNISED:(i) Damage ClaimsTwo claims for damages have been brought against the Council. The first claim relates to personal injury and this is being investigated by the Council’s insurer who, at this stage, will cover the cost if it is payable with the exception of the initial $5,000.
(ii) LitigationThe second claim relates to litigation and the action was being defended by the Council. The matter was referredto mediation, and was settled in September.
2014 2014 2013Notes Actual Budget Actual
57 15
(4,539) (29,684) (37,648)
(5,381) 1,184 (32,097)
33,854 14,190 (20,265)
56 15 5
1,278
808 -
1,305
28,741 26,66427,463 25,359
(1) - (8)
32,547 59,426
11,172 11,091 9,740
11,017
183 341 107
13
1010
415 950 809
- -
3 (10) (7)20,984 (2,229)
635(21,230)
75
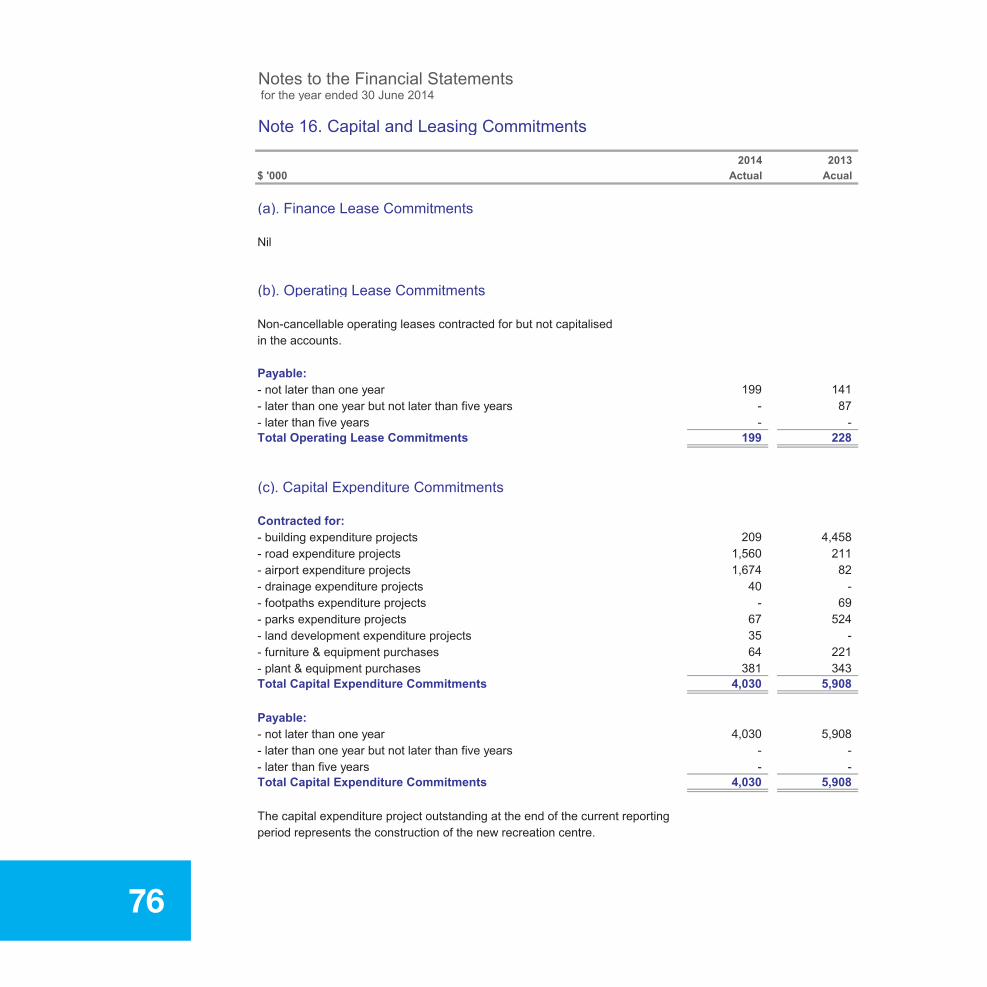
page 47
Town of Port Hedland
Notes to the Financial Statements for the year ended 30 June 2014
Note 16. Capital and Leasing Commitments
$ '000
(a). Finance Lease Commitments
Nil
(b). Operating Lease Commitments
Non-cancellable operating leases contracted for but not capitalisedin the accounts.
Payable:- not later than one year- later than one year but not later than five years- later than five yearsTotal Operating Lease Commitments
(c). Capital Expenditure Commitments
Contracted for:- building expenditure projects- road expenditure projects- airport expenditure projects- drainage expenditure projects- footpaths expenditure projects- parks expenditure projects- land development expenditure projects- furniture & equipment purchases- plant & equipment purchasesTotal Capital Expenditure Commitments
Payable:- not later than one year- later than one year but not later than five years- later than five yearsTotal Capital Expenditure Commitments
The capital expenditure project outstanding at the end of the current reporting period represents the construction of the new recreation centre.
64 22135 -
1,67440 -
4,030
67 524- 69
821,560 211
209 4,458
5,908
- -199 228
381 343
2014 2013Actual Acual
87199 141
-
- -- -
4,030 5,908
4,030 5,908
76

page 48
Town of Port Hedland
Notes to the Financial Statements for the year ended 30 June 2014
Note 17. Controlled Entities, Associated Entities & Interests in Joint Ventures
$ '000
Council's objectives can and in some cases are best met through the use of separate entities & operations.
These operations and entities range from 100% ownership and control through to lower levels of ownershipand control via co-operative arrangements with other Councils, Bodies and other Outside Organisations.
The accounting and reporting for these various entities, operations and arrangements varies in accordancewith accounting standards, depending on the level of Councils (i) interest and (ii) control and the type (form) ofentity/operation, as follows;
Subsidiaries Note 17(a)Operational Arrangements where Councils Control (but not necessarily Interest) exceeds 50%
Associated Entities & Joint Venture Entities Note 17(b)Arrangements in the form of a Separate Entity that deploys the resources of the operation itself.Under Associated Entities, Council significantly influences the operations (but does not controlthem, whilst for JV Entities, Council Jointly Controls the Operations with other parties.
Joint Venture Operations Note 17(c)Arrangements that do not comprise an actual individual entity which can deploy the resourcesof the individual participants. Under JV Operations, Council Jointly Controls the operations withthe Other Parties involved.
Subsidiaries, Associated Entities and Joint Ventures Not Recognised Note 17(d)
(a) Subsidiaries (ie. Entities & Operations controlled by Council)
Council has no interest in any Subsidiaries.
(b) Associated Entities & Joint Venture Entities
Council has no interest in any Associated Entities & Joint Venture Entities.
77
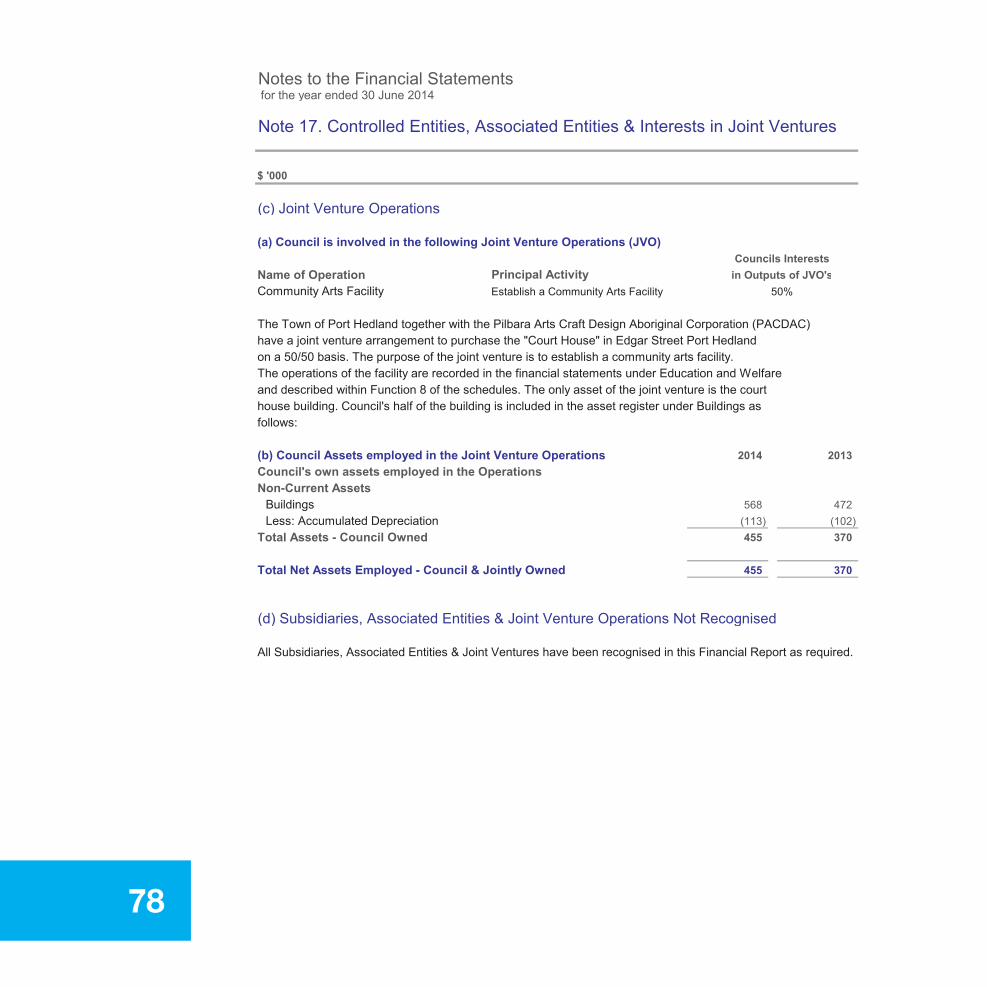
page 49
Town of Port Hedland
Notes to the Financial Statements for the year ended 30 June 2014
Note 17. Controlled Entities, Associated Entities & Interests in Joint Ventures
$ '000
(c) Joint Venture Operations
(a) Council is involved in the following Joint Venture Operations (JVO)
Name of Operation
The Town of Port Hedland together with the Pilbara Arts Craft Design Aboriginal Corporation (PACDAC)have a joint venture arrangement to purchase the "Court House" in Edgar Street Port Hedlandon a 50/50 basis. The purpose of the joint venture is to establish a community arts facility.The operations of the facility are recorded in the financial statements under Education and Welfareand described within Function 8 of the schedules. The only asset of the joint venture is the courthouse building. Council's half of the building is included in the asset register under Buildings asfollows:
(b) Council Assets employed in the Joint Venture OperationsCouncil's own assets employed in the OperationsNon-Current Assets
BuildingsLess: Accumulated Depreciation
Total Assets - Council Owned
Total Net Assets Employed - Council & Jointly Owned
(d) Subsidiaries, Associated Entities & Joint Venture Operations Not Recognised
All Subsidiaries, Associated Entities & Joint Ventures have been recognised in this Financial Report as required.
2014 2013
Councils InterestsPrincipal Activity in Outputs of JVO's
Community Arts Facility Establish a Community Arts Facility 50%
455 370
568 472(113) (102)
455 370
78

page 50
Town of Port Hedland
Notes to the Financial Statements for the year ended 30 June 2014
Note 18. Trust Funds
$ '000
Keep Australia BeautifulBuilding RetentionStaff BondsRanger ServicesCommunity BankDeposits - HallsDeposits - Trailer/Comm BusDeposits - SportsgroundsPOS ReserveBRB LevyBCITF LevyUnclaimed MoneySundryGarden CompetitionMDCC Hire EventsBuilding BondsDAPCyclone George Tech Services Bonds
Black Rock Stakes Donation is not reported above as amount held in trust as at 30 June 2014 is $178.
Note 19. Total Assets Classified by Function and Activity
$ '000
GovernanceGeneral Purpose FundingLaw, Order, Public SafetyHealthEducation & WelfareHousingCommunity AmenitiesRecreation & CultureTransportEconomic ServicesOther Property & ServicesUnallocated
- - 13 6 (6) 3
52 519 (566) 5
37 13 (12) 385 - - 52 - - 2
63 239 (251) 511 - - 1
20 32 (32) 201 4 (4) 1
15 2 (6)1
11
22 - - 221 1 (1) 15 - - 51 - - 12 - - 2
17 140 (130) 27103 - - 10324 73 (81) 16
Actual Actual
1,786 5,610
2014 2013
211,021 167,112
1,250 388
1,964 5,125196 427
10,599 3,633
9,707 6,97598,431 96,371
26,495 15,382
Balance
375 1,029 (1,089) 315
1-Jul-13 Received 30-Jun-14PaidBalanceAmountsAmounts
40,748 7339,357 2,629
439,174 341,63727,620 37,252
79

page 51
Town of Port Hedland
Notes to the Financial Statements for the year ended 30 June 2014
Note 20. Acquisition of Assets
$ '000
By ProgramGovernanceLaw, Order, Public SafetyHealthEducation & WelfareHousingCommunity AmenitiesRecreation & CultureTransportEconomic Services
By ClassProperty, Plant & Equipment- Land- Buildings- Furniture and Equipment- Plant and Equipment- Work in ProgressInfrastructure- Roads- Drainage- Bridges- Footpaths- Parks & Ovals- Airports- Other Infrastructure- Depot- Work in Progress
259
71,95441,691
71,954
15
870 23,899
3,3203,136
41,691
1,682 1,095
17,021
2014 2014Actual Budget
1,164 -
945 -
410 203,808 5,552
106 -
976 1002,328 4,5257,295 11,544
6,456790
12,500 20,850
325-
17183
1,8602,7415,274
31,096195 162
47,246
4815-
2291,2695,541
80

page 52
Town of Port Hedland
Notes to the Financial Statements for the year ended 30 June 2014
Note 21. Disposal of Assets
$ '000
The following assets were disposed of during the year.
Property, Plant & EquipmentLandBuildingsPlant and EquipmentTotal
$ '000
SummaryProfit on Asset DisposalsLoss on Asset DisposalsNet Profit/(Loss) on Disposal of Assets
Actual
-
BudgetActual
470-
532 807 379 466 (153) (341)
- 425
Net Book ValueActual
--15
Budget
- 15- (45)
Sale Price Profit/(Loss)
2014
819 466
2014 2013
(183) (341) (107)
Actual Budget Actual
97 17 49(280) (358) (156)
(183) (341)1,002 807
Budget
81

page 53
Town of Port Hedland
Notes to the Financial Statements for the year ended 30 June 2014
Note 22. Financial Ratios
$ '000
Liquidity Ratio
1. Current Ratio (1)
Current Assets less Restricted Current Assets
Debt Ratio
2. Debt Service Cover Ratio (2)
Principal and Interest Repayments
Coverage Ratio
3. Own Source Revenue Coverage Ratio (3)
Own Source Operating RevenueOperating Expense
Financial Performance Ratio
4. Operating Surplus Ratio (4)
Operating Revenue less Operating ExpenseOwn Source Operating Revenue
Asset Management Ratios
5. Asset Consumption Ratio (5)
Depreciated Replacement Cost of Depreciable AssetsCurrent Replacement Cost of Depreciable Assets
6. Asset Sustainability Ratio (6)
Capital Renewal and Replacement ExpenditureDepreciation Expense
7. Asset Renewal Funding Ratio (7)
NPV of Planned Capital Renewals over 10 yearsNPV of Required Capital Expenditure over 10 years
Notes
(1) This is a modified commercial ratio designed to focus on the liquidity position of the Council that has arisen from past year's transactions.(2) This ratio is the measurement of Council's ability to repay its debt including lease payments.(3) This ratio is the measurement of Council's ability to cover its costs through its own revenue efforts.(4) This ratio is a measure of Council's ability to cover its operational costs and have revenues available for capital funding or other purposes.(5) This ratio measures the extent to which depreciable assets have been consumed by comparing their written down value to their
replacement cost.(6) This ratio indicates whether Council is replacing or renewing existing non-financial assets at the same rate that its overall asset stock
is wearing out.(7) This ratio is a measure of the ability of Council to fund its projected asset renewal / replacements in the future.
11.3519,324 2,796
0.80 0.979,490
Prior Periods2013 2012
n/a n/a351,269 417,779
3.10% 11.90%6,478 66,233
84.70% 107.80%66,233 69,989
Current Liabilities less Liabilities Associated with Restricted Assets
n/a n/a
244.00% 539.50%12,052
> 50%
90-110%
75-95%
1.05 : 1
6.91 : 1
94.63%
9.78%
84.08%
107.88%
Target
> 1.00 : 1
> 2.00 : 1
> 40%
> 1%
- -
Indicator2014
Amounts2014
9,992
n/a
11,172
5.77Operating Surplus before Interest and Depreciation Exp
82

page 54
Town of Port Hedland
Notes to the Financial Statements for the year ended 30 June 2014
Note 22. Financial Ratios (continued)
Purpose of Own Source Revenue Coverage Ratio
Commentary on Result
2013/14 Ratio 94.63%
To assess Council's ability to cover its
costs through its own revenue efforts.
The Department of Local Government and Communities has set a basic standard between 40% and 60%, intermediate standard between 60% and 90% and advanced standard greater
than 90%. The Town has achieved the advanced standard meaning the Town can cover nearly all operating expenses from own source revenue, and is not heavily reliant on external funding.
Purpose of Operating Surplus
Ratio
Commentary on Result
2013/14 Ratio 9.78%
To assess the liquidity position of
the Council that has arisen from past
year's transactions.
The Department of Local Government and Communities has set a minimum standard of 1. The Town meets the standard meaning that it
has sufficient assets that can be quickly converted into cash to meet immediate cash
commitments.
Purpose of Debt Service Cover Ratio
Commentary on Result
2013/14 Ratio 6.91 : 1
To assess Council's ability to repay its
debt including lease payments.
The Department of Local Government and Communties has set a basic standard if the ratio
is greater or equal to two. The Town has achieved an advanced standard as the ratio is
greater than five meaning that the town can easily cover debt servicing obligations.
Purpose of Current Ratio
Commentary on Result
2013/14 Ratio 1.05 : 1
To assess Council's ability to cover its
operational costs and have revenues
available for capital funding or other
purposes.
The Department of Local Government and Communties has set a basic standard between 1% and 15% and an advanced standard greater than 15%. The Town's ratio is relatively healthy
indicating that the Town's operating revenue can easily cover operational costs with a surplus
available for capital funding and other purposes i.e. transfer to Reserves.
0.97 0.80
1.05
0.00.20.40.60.81.01.21.4
2012 2013 2014
Ratio
: 1
1. Current Ratio
11.35
5.77 6.91
0.02.04.06.08.0
10.012.014.0
2012 2013 2014
Ratio
: 1
2. Debt Service Cover Ratio
107.80%
84.70%94.63%
0%20%40%60%80%
100%120%140%
2012 2013 2014
Ratio
%
3. Own Source Revenue Coverage Ratio
11.90%
3.10%
9.78%
0%2%4%6%8%
10%12%14%16%
2012 2013 2014
Ratio
%
4. Operating Surplus Ratio
83
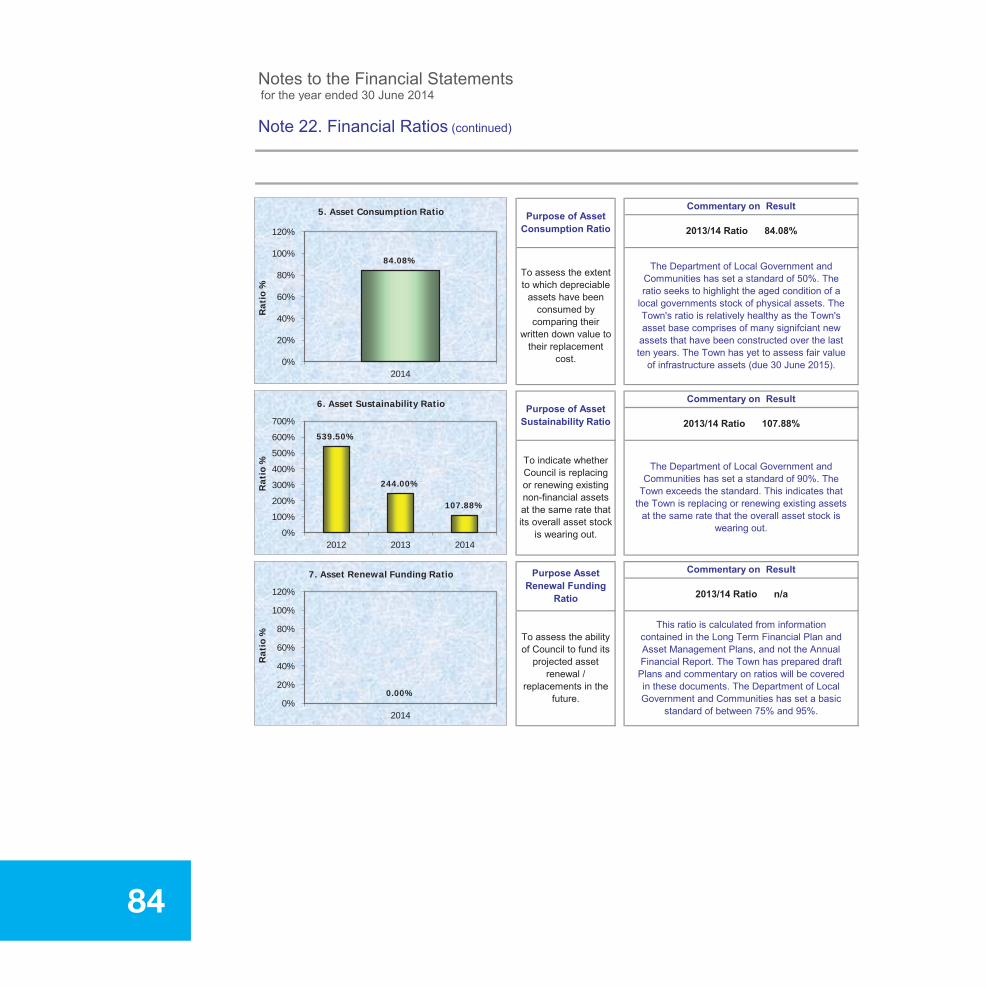
page 55
Town of Port Hedland
Notes to the Financial Statements for the year ended 30 June 2014
Note 22. Financial Ratios (continued)
To assess the ability of Council to fund its
projected asset renewal /
replacements in the future.
This ratio is calculated from information contained in the Long Term Financial Plan and Asset Management Plans, and not the Annual Financial Report. The Town has prepared draft
Plans and commentary on ratios will be covered in these documents. The Department of Local Government and Communities has set a basic
standard of between 75% and 95%.
Purpose of Asset Sustainability Ratio
Commentary on Result
2013/14 Ratio 107.88%
To indicate whether Council is replacing or renewing existing non-financial assets at the same rate that its overall asset stock
is wearing out.
The Department of Local Government and Communities has set a standard of 90%. The
Town exceeds the standard. This indicates that the Town is replacing or renewing existing assets
at the same rate that the overall asset stock is wearing out.
Purpose Asset Renewal Funding
Ratio
Commentary on Result
2013/14 Ratio n/a
Purpose of Asset Consumption Ratio
Commentary on Result
2013/14 Ratio 84.08%
To assess the extent to which depreciable
assets have been consumed by
comparing their written down value to
their replacement cost.
The Department of Local Government and Communities has set a standard of 50%. The ratio seeks to highlight the aged condition of a
local governments stock of physical assets. The Town's ratio is relatively healthy as the Town's asset base comprises of many signifciant new
assets that have been constructed over the last ten years. The Town has yet to assess fair value
of infrastructure assets (due 30 June 2015).
84.08%
0%
20%
40%
60%
80%
100%
120%
2014
Ratio
%
5. Asset Consumption Ratio
539.50%
244.00%
107.88%
0%100%200%300%400%500%600%700%
2012 2013 2014
Ratio
%
6. Asset Sustainability Ratio
0.00%0%
20%
40%
60%
80%
100%
120%
2014
Ratio
%
7. Asset Renewal Funding Ratio
84

Not
es to
the
Fina
ncia
l Sta
tem
ents
for t
he y
ear e
nded
30
June
201
4
Not
e 23
. Inf
orm
atio
n on
Bor
row
ings
$ '0
00
(a).
Deb
entu
re R
epay
men
ts
Gov
erna
nce
- Civ
ic C
entre
Upg
rade
Law
, Ord
er, P
ublic
Saf
ety
- Sta
te E
mer
genc
y Se
rvic
es S
hed
Educ
atio
n &
Wel
fare
- HAC
C H
ousi
ng U
pgra
de- G
P H
ousi
n g L
oan
Hou
sing
- Sta
ff H
ousi
n g- S
taff
Hou
sing
- Sta
ff H
ousi
ng -
Mor
gans
Stre
et- S
taff
Hou
sing
- M
orga
ns S
treet
- Sta
ff H
ousi
n g A
irpor
tC
omm
unity
Am
eniti
es- U
nder
grou
nd P
ower
Rec
reat
ion
& C
ultu
re- A
quat
ic C
entre
Upg
rade
- Sw
imm
ing
Pool
Ext
ensi
on- Y
acht
Clu
b- Y
acht
Clu
b Ad
ditio
nal
- JD
Har
die
Upg
rade
- Mar
quee
Par
k- M
arqu
ee P
ark
Loan
B- M
ulti-
purp
ose
Rec
reat
ion
Cen
tre- S
outh
Hed
land
Bow
ling
Clu
b- J
D H
ardi
e Fa
cilit
y U
pgra
de- W
anan
gkur
a St
adiu
m- J
D H
ardi
e R
oof &
Sec
urit y
Upg
rade
(con
tinue
d on
nex
t pag
e)
page 56
Financial Statements 2014
WAT
C4.
82%
276
57
*W
ATC
6.48
%42
9
47
*W
ATC
6.02
%22
7-
1212
WAT
C5.
22%
4,30
8-
137
WAT
C-
398
*W
ATC
5.21
%-
750
049
350
0-
13W
ATC
5.22
%7,
590
-24
247
-4
280
WAT
C
-77
772,
423
2,42
312
012
2W
ATC
4.63
%1,
446
-45
451,
401
1,40
166
WAT
C6.
71%
321
2575
9
7324
8
10
WAT
C6.
05%
1,46
4
3939
158
195
11
471,
417
1,46
2
22388
4813
74,
171
4,30
1
-67
132 13
227
11
242
7,34
87,
578
394
6.05
%78
4-
2580
5
7474
3
1333
1,89
01,
953
WAT
C6.
75%
1,33
5-
4848
1,28
71,
332
8990
WAT
C6.
78%
1,95
7
89 226
-28
0
4,92
5
2031
7
312
5
20
13 67
-25
25
-50
0-
4.88
%
2,50
0
215
7450
0
WAT
C6.
92%
129
-
71
120
7Ke
ysta
rt5.
58%
60
13W
ATC
6.36
%21
6-
3231
3.67
%65
4-
121
121
533
533
2223
129
129 67
Bor
row
ing
Inst
itutio
n%
Prin
cipa
lIn
tere
st
Rat
e1-
Jul-1
3
WAT
C6.
36%
257
- -
Actu
al
Prin
cipa
l 30
-Jun
-14
Bud
get
Actu
alB
udge
tAc
tual
Bud
get
14
Loan
s
New
184
214
7
3636
221
255
1616
WAT
C4.
73%
1,50
046
WAT
C
WAT
C5.
79%
197
-
*
461,
454
1,45
470
6.04
%1,
228
-39
391,
189-
-73
1,22
6
404
427
2727
-
WAT
C
6060
57-
85

Not
es to
the
Fina
ncia
l Sta
tem
ents
for t
he y
ear e
nded
30
June
201
4
Not
e 23
. Inf
orm
atio
n on
Bor
row
ings
(con
tinue
d)
$ '0
00
(a).
Deb
entu
re R
epay
men
ts (c
ontin
ued)
Tran
spor
t-W
allw
ork
Rd
Brid
ge-F
lood
wat
er P
ump
Econ
omic
Ser
vice
s- P
ort H
edla
nd V
isito
rs C
entre
- Cat
amor
e C
ourt
- JD
Har
die
Land
Pur
chas
e
Fund
ing
of B
orro
win
gsAl
l loa
n re
paym
ents
wer
e fu
nded
by
gene
ral p
urpo
se in
com
e.1
Sel
f- Su
ppor
ting
Loan
* T
hose
loan
s de
note
d w
ith "*
" are
sub
ject
of a
repa
ymen
t agr
eem
ent t
hat s
ecur
ed th
e re
imbu
rsem
ent f
rom
a c
omm
unity
org
anis
atio
n of
all
cost
s as
soci
ated
with
the
loan
.2
WAT
C =
WA
Trea
sury
Cor
pora
tion
Bor
row
ing
Inte
rest
Prin
cipa
lN
ew P
rinci
pal
30-J
un-1
4 In
stitu
tion
Rat
e1-
Jul-1
3Lo
ans
%Ac
tual
Bud
get
Actu
alB
udge
tAc
tual
Bud
get
161,
077
301,
618
WAT
C-
28W
ATC
--
-2
-14
8-
4
-4
-29
6-
8
5.21
%-
WAT
C-
45
657
613
WAT
C4.
96%
-48
4-
1448
483
74
22
-W
ATC
5.79
%1,
618
62
26,6
64
-
34,3
931,
491
3,38
21,
305
28,7
411,
426
1,66
2
86

Not
e 23
. Inf
orm
atio
n on
Bor
row
ings
(con
tinue
d)
$ '0
00
(b).
New
Deb
entu
res
C
atam
ore
Cou
rtW
allw
ork
Rd
Brid
geC
ivic
Cen
tre U
pgra
deSH
Bow
ls a
nd T
enni
s C
lub
JD H
ardi
e Se
curit
y U
pgra
deJD
Har
die
Land
Pur
chas
eFl
oodw
ater
Ref
urbi
shm
ent
$ '0
00
(c).
Uns
pent
Deb
entu
res
Wal
lwor
k R
d Br
idge
Civ
ic C
entre
Upg
rade
SH B
owls
and
Ten
nis
Clu
bJD
Har
die
Secu
rity
Upg
rade
Cat
amor
e C
ourt
(d).
Ove
rdra
ft
The
Tow
n of
Por
t Hed
land
doe
s no
t hav
e an
ove
rdra
ft fa
cilit
y.
Financial Statements 2014
150
300
108
26/0
2/20
14
Bal
ance
Expe
nded3,
632
247
30/0
5/20
14-
500
(253
)(3
92)
26/0
2/20
14-
280
(130
)
Bor
row
edD
urin
gB
orro
wed
Bal
ance
Year
Year
808
280
150
5.21
%13
05.
21%
392
500
30-J
un-1
41-
Jul-1
3D
urin
g
20
2,10
42,
574
-3,
382
(2,5
74)
-80
8(1
,618
)15
0
290
4.96
%18
148
430
348
485
0W
ATC
Cou
ncil
20
15/0
5/20
14-
484
(181
)30
3
-
295
4.88
%25
350
024
7
500
500
WAT
CC
ounc
il
Dat
e
1,86
8
280
280
1,61
81,
095
WAT
C
WAT
C
500
5,00
0W
ATC
Cou
ncil
2031
750
0
5.21
%1,
025
Actu
alIn
tere
st
1,61
8
Bud
get
Bud
get
Amou
nt B
orro
wed
Tota
l
26/0
2/20
14-
1,61
8
%
108
Rat
eU
nspe
nt
3,38
28,
175
Actu
al
Inst
itutio
nLo
anTe
rmTy
pe(Y
ears
)&
Cha
rges
A
mou
nt U
sed
Bal
ance -
20
Cou
ncil
2017
7
Cou
ncil
page 58
Inte
rest
87

Not
es to
the
Fina
ncia
l Sta
tem
ents
for t
he y
ear e
nded
30
June
201
4
Not
e 24
(a).
Rat
ing
Info
rmat
ion
(201
3/14
Fin
anci
al Y
ear)
$ '0
00R
ate
Type
Diff
eren
tial G
ener
al R
ate
GR
V - R
esid
entia
lG
RV
- Com
mer
cial
GR
V - I
ndus
trial
GR
V - S
hopp
ing
Cen
treG
RV
- Mas
s Ac
com
mod
atio
nU
V - M
inin
g Im
prov
edU
V - M
inin
g Va
cant
UV
- Pas
tora
lU
V - O
ther
UV
- Oth
er V
acan
tSu
b-To
tal
Min
imum
Rat
esG
RV
- Res
iden
tial
GR
V - C
omm
erci
alG
RV
- Ind
ustri
alU
V - M
inin
g Im
prov
edU
V - M
inin
g Va
cant
UV
- Pas
tora
lU
V - O
ther
UV
- Oth
er V
acan
tSu
b-To
tal
Con
cess
ions
Tota
ls
page 59
Financial Statements 2014
1,16
59
-10
--
1010
--
10
297
-
206
-9
1,88
612
2-
1,16
52
42
--
--
2
1,16
546
5854
--
547170
--
70
511
--
811,
175
949,
015
595
27
Not
es
1,12
51,
124
-2
2-
1,16
5
(108
)
22,5
58
Min
imum
$
(109
)
22,5
22
967
11,4
18-
-1,
124
22,6
661,
125
--
22,6
31
--
22
21,
165
2
5492
7
1,16
51,
165
-
272
--
297
212
297
1,16
561
71-
-
-29
725
554
-
-21
,542
--
9493
-93
-59
5
3030
--
30-
-
-59
559
5-
5,58
350
3,32
420
,542
119
843
21,5
0614
.902
71
200
30
122
122
131,
567
206
-0
20,5
421,
000
13.1
282
-20
6-
-12
2
-85
382
9
3,46
53,
148
--
3,14
860
360
3-
-60
3
206
-
622
642
--
642
1,58
71,
560
--
1,56
0
490
-
3.35
074,
918
-
(16)
403.
3847
167
24,5
0282
952
2
9.92
1219
31,7
303,
148
205
112
6.94
962
8,68
260
3-
-3.
3507
327
46,5
441,
560
261
39.6
198
6.46
0739
.619
7
385,
356
12,9
1213
Bud
get
Tota
lR
even
ue
Bud
get
Rev
enue
Rat
eR
ate
829
13,4
4712
,912
1,00
0-
13,9
12
761,
236
490
7010
570
-49
051
1,62
164
2(2
0)(1
)
Rat
e in
$To
tal
Prop
ertie
sVa
lue
Rev
enue
Rat
esR
ates
Rev
enue
Rat
eIn
terim
Num
ber o
fR
atea
ble
Rat
eIn
terim
Bud
get
Bac
kB
ack
Bud
get
88
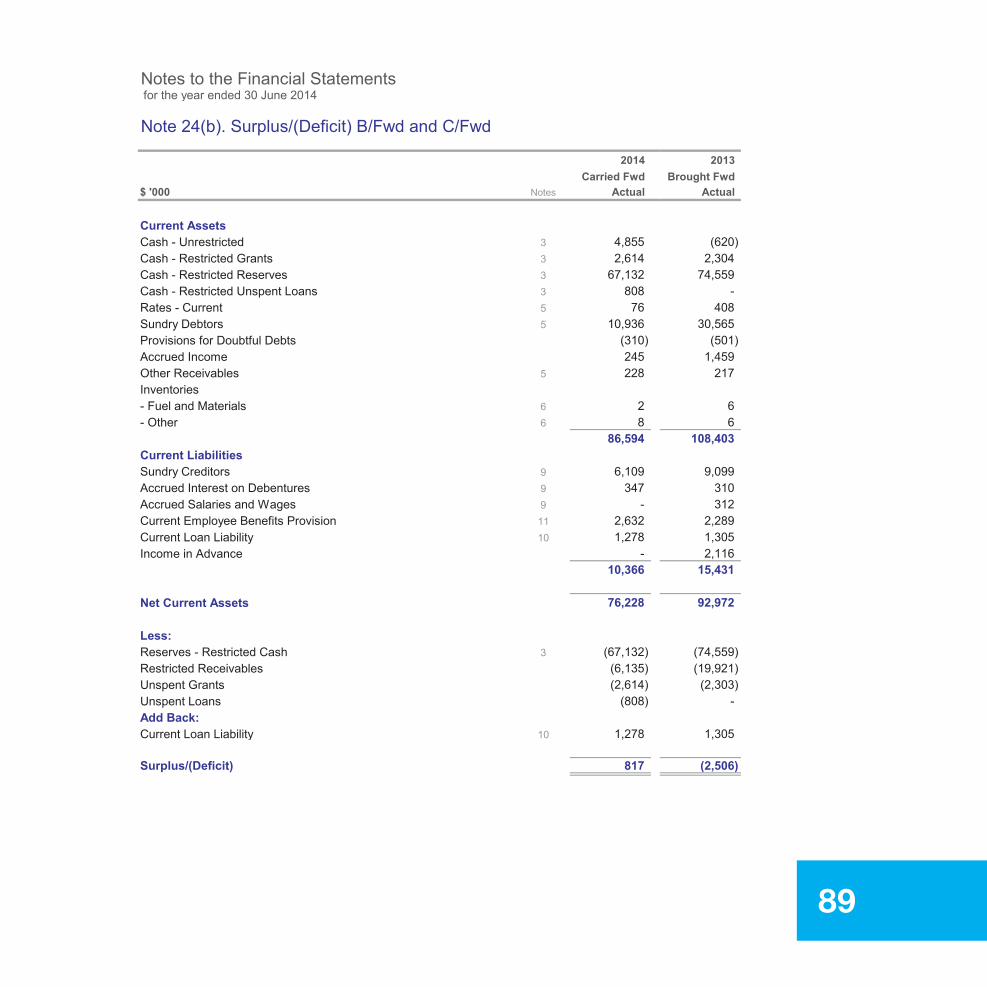
page 60
Town of Port Hedland
Notes to the Financial Statements for the year ended 30 June 2014
Note 24(b). Surplus/(Deficit) B/Fwd and C/Fwd
$ '000
Current AssetsCash - UnrestrictedCash - Restricted GrantsCash - Restricted ReservesCash - Restricted Unspent LoansRates - CurrentSundry DebtorsProvisions for Doubtful DebtsAccrued IncomeOther ReceivablesInventories - Fuel and Materials- Other
Current LiabilitiesSundry CreditorsAccrued Interest on DebenturesAccrued Salaries and WagesCurrent Employee Benefits ProvisionCurrent Loan LiabilityIncome in Advance
Net Current Assets
Less:Reserves - Restricted CashRestricted ReceivablesUnspent GrantsUnspent LoansAdd Back:Current Loan Liability
Surplus/(Deficit)
66
9
5
3
-
6,109 9,099
108,403
10,936
(620)
40830,565
67,1322,614
217
(310)
8 6
3
3355
2,304
2014Carried Fwd
Actual
4,855
(501)
76
6
228
Brought Fwd
74,559
-
2013
808
ActualNotes
1,459
2
10 1,278 1,305
245
2,632 2,28910 1,278
86,594
(6,135) (19,921)(2,614) (2,303)
(808) -
347 310
1,305
99
- 2,116
312
3
11
(74,559)(67,132)
10,366
76,228 92,972
15,431
817 (2,506)
89

page 61
Town of Port Hedland
Notes to the Financial Statements for the year ended 30 June 2014
Note 25. Specified Area Rate (2013/14 Financial Year)
$ '000
Note 26. Service Charges (2013/14 Financial Year)
The Town of Port Hedland partnered with Horizon Power and the State Government through Royalties forRegions to install underground power to the residents within the Town of Port Hedland, specifically South Hedland and Wedgefield. The Town of Port Hedland contrubuted 25% of the project costs.
The Town has imposed a service charge under section 6.38 of the Local Government Act 1995 to collect thecharges associated with installing underground power to each property within the project area.
Charges - service charges are imposed as follows:Connection Charge - $1,027.58kVA Charge - $137.58
The Town of Port Hedland provides the following rebates per property as follows:
1. Seniors and Pensioners - 0.05 (Eligibility as per the Rates and Charges (Rebates and Deferment) Act 1992)
2. Not for Profit Organisations - 0.05 (Those receiving Rates Concessions or Rate Exemptions as per Policy)
3. Small Businesses - 0.05 (Must have less than 20 employees and turnover of less than $2m per annum)
Payment Options:
1. One payment due on 29 October 2012
2. Five payments over five years due on the date that the first instalment for rates is due and payable in each year
Properties opting for option 2 will be subject to a nominal interest charge equal to the cost to the Council of borrowing the funds to support payments by instalment.
The Town has not imposed Specified Area Rates.
90

page 62
Town of Port Hedland
Notes to the Financial Statements for the year ended 30 June 2014
Note 27. Discounts, Incentives, Concessions & Write-offs (2013/14 Financial Year)
$ '000
(a) Discounts
The Town of Port Hedland does not offer any discount for early payment of rates.
$ '000
(b). Write-Offs
Lot 270 Great Northern Highway, Port HedlandLot 185 Maddigan Road, Pippingarra
Sundry Debtors
(c). Waivers
31100
Rate Debtors
1088834181888787
21111
1661
Budget
350
170106
TotalCost / Value
1 1
Cost / Value
100
11
1350
Sundry Debtors with nil amounts shown above all had debts under $500 written off.
The Town of Port Hedland did not provide any waivers during the 2013/14 financial year.
BudgetType Disc % TotalCost / Value Cost / Value
Notes
31
17010621111
1661
A803135A804113
2(a)
79297231797666748216450210648310626571051037
11
1
91
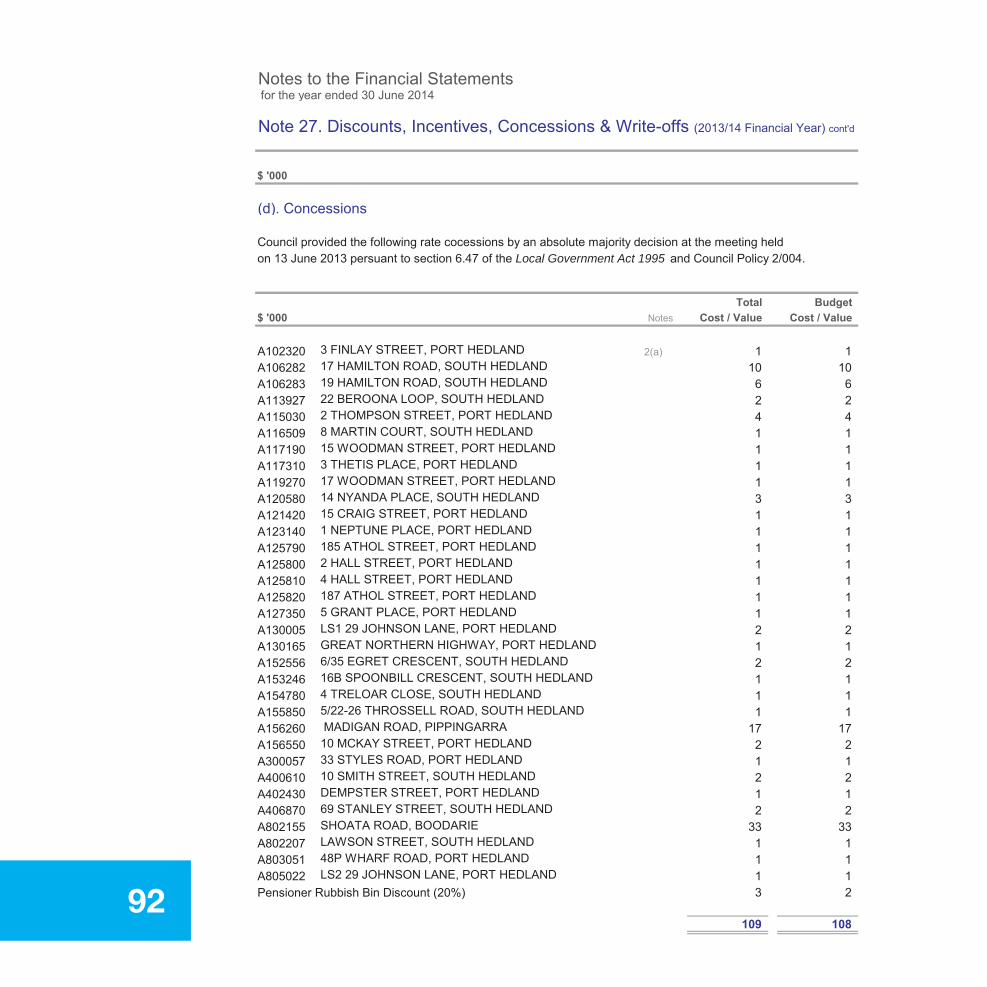
page 63
Town of Port Hedland
Notes to the Financial Statements for the year ended 30 June 2014
Note 27. Discounts, Incentives, Concessions & Write-offs (2013/14 Financial Year) cont'd
$ '000
(d). Concessions
Council provided the following rate cocessions by an absolute majority decision at the meeting heldon 13 June 2013 persuant to section 6.47 of the Local Government Act 1995 and Council Policy 2/004.
$ '000
A102320 3 FINLAY STREET, PORT HEDLAND 2(a)A106282 17 HAMILTON ROAD, SOUTH HEDLANDA106283 19 HAMILTON ROAD, SOUTH HEDLANDA113927 22 BEROONA LOOP, SOUTH HEDLANDA115030 2 THOMPSON STREET, PORT HEDLANDA116509 8 MARTIN COURT, SOUTH HEDLANDA117190 15 WOODMAN STREET, PORT HEDLANDA117310 3 THETIS PLACE, PORT HEDLANDA119270 17 WOODMAN STREET, PORT HEDLANDA120580 14 NYANDA PLACE, SOUTH HEDLANDA121420 15 CRAIG STREET, PORT HEDLANDA123140 1 NEPTUNE PLACE, PORT HEDLANDA125790 185 ATHOL STREET, PORT HEDLANDA125800 2 HALL STREET, PORT HEDLANDA125810 4 HALL STREET, PORT HEDLANDA125820 187 ATHOL STREET, PORT HEDLANDA127350 5 GRANT PLACE, PORT HEDLANDA130005 LS1 29 JOHNSON LANE, PORT HEDLANDA130165 GREAT NORTHERN HIGHWAY, PORT HEDLANDA152556 6/35 EGRET CRESCENT, SOUTH HEDLANDA153246 16B SPOONBILL CRESCENT, SOUTH HEDLANDA154780 4 TRELOAR CLOSE, SOUTH HEDLANDA155850 5/22-26 THROSSELL ROAD, SOUTH HEDLANDA156260 MADIGAN ROAD, PIPPINGARRAA156550 10 MCKAY STREET, PORT HEDLANDA300057 33 STYLES ROAD, PORT HEDLANDA400610 10 SMITH STREET, SOUTH HEDLANDA402430 DEMPSTER STREET, PORT HEDLANDA406870 69 STANLEY STREET, SOUTH HEDLANDA802155 SHOATA ROAD, BOODARIEA802207 LAWSON STREET, SOUTH HEDLANDA803051 48P WHARF ROAD, PORT HEDLANDA805022 LS2 29 JOHNSON LANE, PORT HEDLANDPensioner Rubbish Bin Discount (20%)
111121211
10
12
111121
1
2
Notes
11
1106
3
11113111
Type Disc % Total Budget
31
109
17212
117212
Cost / Value Cost / Value
11
11
1
21
1
624111
12
331112
Cost / Value Cost / Value
33
108
Total Budget
4
92

page 64
Town of Port Hedland
Notes to the Financial Statements for the year ended 30 June 2014
Note 28. Interest Charges and Instalments (2013/14 Financial Year)
$ '000
Interest on Unpaid RatesInterest on Instalments PlanCharges on Instalment Plan
Two separate option plans are available to ratepayers for payment of rates:
Option 1 - Full Payment:The full amount of rates and charges including arrears to be paid on or before Monday 23 September 2013 - 35 days after the date of service.
Option 2 - 4 Instalments:First instalment to be received on or before Monday 23 September 2013 including all arrears and a quarter of the current rates and service charges. Second instalment due on or before 2 December 2013, third instalment due on or before 10 February 2014 and the fourth instalment due on or before 10 April 2014.
The cost of the instalment plan comprises of simple interest of 5.5% calculated from the date the first instalment is due, together with an administration fee of $13.20 each for the three subsequent instalment notices.
Ratepayers can also register to be considered for an alternative payment arrangement. An administration charge of $65.80 applies.
Eligible Pensioners may opt to defer the payment of their Rates.
Note 29. Fees & Charges
$ '000
GovernanceGeneral Purpose FundingLaw, Order, Public SafetyHealthEducation and WelfareHousingCommunity AmenitiesRecreation and CultureTransportEconomic ServicesOther Property and Services
2013
2
4 266 -
13,252 9,781 10,693246
75
145
65
Actual
-
81 77
193114 120
115171
Charge Revenue
Actual Budget
11.00% - 197 100
Revenue
605.50% - 98
Interest
An interest rate of 11% is charged on all rate payments that are late.
2014
Admin. BudgetedRate %
360
11
210
2014
3,087 2,572- - 138
-
579 713 58018,563 17,527 17,637
6,916
36,124 35,593 31,943
13.20
2
50
93
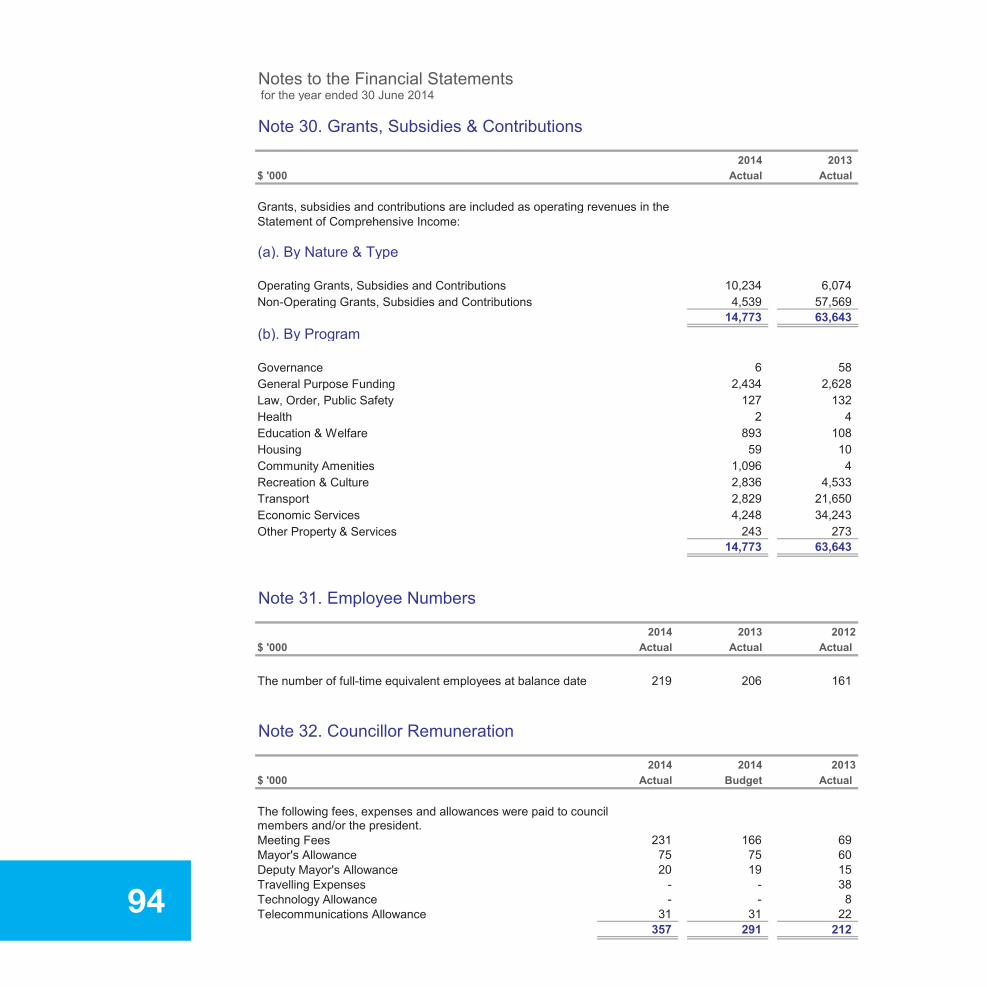
page 65
Town of Port Hedland
Notes to the Financial Statements for the year ended 30 June 2014
Note 30. Grants, Subsidies & Contributions
$ '000
Grants, subsidies and contributions are included as operating revenues in the Statement of Comprehensive Income:
(a). By Nature & Type
Operating Grants, Subsidies and ContributionsNon-Operating Grants, Subsidies and Contributions
(b). By Program
GovernanceGeneral Purpose FundingLaw, Order, Public SafetyHealthEducation & WelfareHousingCommunity AmenitiesRecreation & CultureTransportEconomic ServicesOther Property & Services
Note 31. Employee Numbers
$ '000
The number of full-time equivalent employees at balance date
Note 32. Councillor Remuneration
$ '000
The following fees, expenses and allowances were paid to council members and/or the president.Meeting FeesMayor's AllowanceDeputy Mayor's AllowanceTravelling ExpensesTechnology AllowanceTelecommunications Allowance
591,096
6,074
14,773
Actual2014
219
-31
-
Actual
69
Actual
2014 2013
243 273
4,533
57,56914,773 63,643
6
Actual Actual
10,234
75 60
2,836
291
2,829
2014 2014
161206
Budget Actual
Actual
2013
75
212357
231 166
34,243
2,628
2893
4108104
127 132
4,539
2013 2012
15- 38
21,650
582,434
4,248
8-
63,643
22
20 19
3194

page 66
Town of Port Hedland
Notes to the Financial Statements for the year ended 30 June 2014
Note 33. Employee Costs
$ '000
Wages and SalariesEmployee Leave EntitlementsSuperannuationWorkers' Compensation InsuranceProtective Clothing & UniformsMembers Allowances & ExpensesFringe Benefits TaxConferences, Training and TravelOtherTotal Employee Costsless: Capitalised Costs
$ '000
Employee RemunerationSet out below, in bands of $10,000 is the number of employees entitled to an annual salary of 100,000 or more.
DetailsLG Administration Regulations 19 B
170,000 - 179,999180,000 - 189,999
1
-
190,000 - 199,999
150,000 - 159,999140,000 - 149,999
8110,000 - 119,999
20,605
120,000 - 129,999 66
200,000 +
212
Actual
16,558
250
2,124
-
1,737
-
-5
6
-2
- 809- 13,206
100,000 - 109,999
10
2014 2013
1014
-
130,000 - 139,999
-
91
Actual
266282252
609- 84
5
11
2-1
Budget
160,000 - 169,999
-
- 345
415
2014
Salary Range 2014 2013
25,711 22,552-
Actual Actual
20,605 25,711 22,552
8 - 13- 200
5,908
95
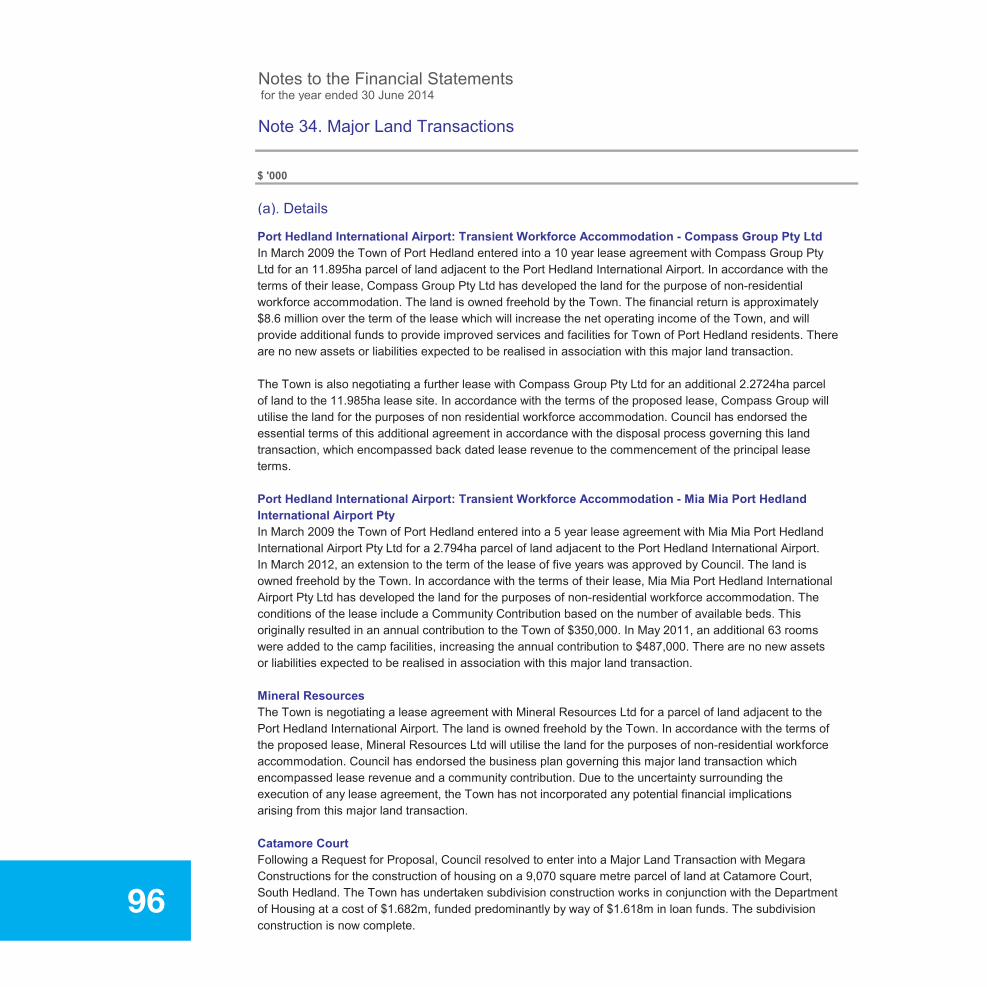
page 67
Town of Port Hedland
Notes to the Financial Statements for the year ended 30 June 2014
Note 34. Major Land Transactions
$ '000
(a). Details
Port Hedland International Airport: Transient Workforce Accommodation - Compass Group Pty LtdIn March 2009 the Town of Port Hedland entered into a 10 year lease agreement with Compass Group Pty Ltd for an 11.895ha parcel of land adjacent to the Port Hedland International Airport. In accordance with the terms of their lease, Compass Group Pty Ltd has developed the land for the purpose of non-residential workforce accommodation. The land is owned freehold by the Town. The financial return is approximately $8.6 million over the term of the lease which will increase the net operating income of the Town, and will provide additional funds to provide improved services and facilities for Town of Port Hedland residents. There are no new assets or liabilities expected to be realised in association with this major land transaction.
The Town is also negotiating a further lease with Compass Group Pty Ltd for an additional 2.2724ha parcel of land to the 11.985ha lease site. In accordance with the terms of the proposed lease, Compass Group will utilise the land for the purposes of non residential workforce accommodation. Council has endorsed the essential terms of this additional agreement in accordance with the disposal process governing this land transaction, which encompassed back dated lease revenue to the commencement of the principal lease terms.
Port Hedland International Airport: Transient Workforce Accommodation - Mia Mia Port Hedland International Airport Pty In March 2009 the Town of Port Hedland entered into a 5 year lease agreement with Mia Mia Port Hedland International Airport Pty Ltd for a 2.794ha parcel of land adjacent to the Port Hedland International Airport. In March 2012, an extension to the term of the lease of five years was approved by Council. The land is owned freehold by the Town. In accordance with the terms of their lease, Mia Mia Port Hedland International Airport Pty Ltd has developed the land for the purposes of non-residential workforce accommodation. The conditions of the lease include a Community Contribution based on the number of available beds. This originally resulted in an annual contribution to the Town of $350,000. In May 2011, an additional 63 rooms were added to the camp facilities, increasing the annual contribution to $487,000. There are no new assets or liabilities expected to be realised in association with this major land transaction.
Mineral ResourcesThe Town is negotiating a lease agreement with Mineral Resources Ltd for a parcel of land adjacent to the Port Hedland International Airport. The land is owned freehold by the Town. In accordance with the terms of the proposed lease, Mineral Resources Ltd will utilise the land for the purposes of non-residential workforce accommodation. Council has endorsed the business plan governing this major land transaction which encompassed lease revenue and a community contribution. Due to the uncertainty surrounding the execution of any lease agreement, the Town has not incorporated any potential financial implications arising from this major land transaction.
Catamore CourtFollowing a Request for Proposal, Council resolved to enter into a Major Land Transaction with Megara Constructions for the construction of housing on a 9,070 square metre parcel of land at Catamore Court, South Hedland. The Town has undertaken subdivision construction works in conjunction with the Department of Housing at a cost of $1.682m, funded predominantly by way of $1.618m in loan funds. The subdivision construction is now complete.
96

page 68
Town of Port Hedland
Notes to the Financial Statements for the year ended 30 June 2014
Note 34. Major Land Transactions (continued)
$ '000
Catamore Court (continued)The proposal from Megara involves the construction of 12 single family homes to be sold to the general public, and a 8 unit group dwelling that will be retained by the Town for staff housing. Construction of housing is contingent upon the presale of a minimum of 12 of the lots (with Lot 201 to be further subdivided) that will not remain with the Town. Proceeds from the sale of those lots will be held in the Town's Trust Account, and utilised to pay Megara for the construction of the staff houses. 5 of the minimum 12 lots have been presold. Recognised in the 2014/15 Budget are land sales of $2.977m and corresponding acquisition of housing of $2.977m.
General Practitioner HousingDuring 2010/11, the Town of Port Hedland undertook a General Practitioner (GP) housing project in conjunction with BHP Billiton and State Government. The total scope of the project provided for a maximum yield of 23 lots. Stage 1 of this project resulted in the construction of seven residential premises for accommodation GP's. The Town funded its $1.5m contribution by way of a loan. The Town owns the land and the houses.
Following an Expressions of Interest process, the Town allocated four houses to Pilbara Medical Holdings, and three to Kinetic Health on a lease term of three years. For the purposes of cash flow projections, the Town has assumed that a lease of some form, albeit with potentially amended parties and terms, will be entered into at the end of the current lease.
In October 2013, the Town endorsed the Business Case for Stage 2 of the GP Housing Project. The proposal would see the construction of a further 3 houses within the subdivision, to be fully funded and managed by BHP Billiton Iron Ore, with the completed assets gifted to the Town. It is anticpated that the handover will occur during the 2014/15 financial year, as such a non cash contribution and corresponding non cash asset acquisition of $1.75m has been incorporated into the 2014/15 Budget.
The Town will be responsible for the ongoing maintenance and asset management of the houses. Following completion of construction, the Town will run an Expressions of Interest process as per Stage 1, to allocate houses to medical practices within the Town area.
JD Hardie LandThe Town is currently in the process of obtaining control of an 8,600 square metre parcel of land adjacent to the JD Hardie Centre in South Hedland, in accordance with the Government Land Policy Manual - Policy No. 04.0105, commonly referred to as the 5% Policy. It is the Town's intention to secure control of the land at a cost of $150k, and then develop the land for the purposes of expanding the Town's staff housing stock. In September 2013, the Town issued a Request for Proposal for the development of the land, however until such time as control of the land is secured, the RFP cannot be pursued further.
The 2014/15 Budget includes estimates for the acqusition of the land at $150k, wholly funded by way of a loan. No further estimates relating to housing construction, or sale of any part of the land have been included in future years.
97

page 69
Town of Port Hedland
Notes to the Financial Statements for the year ended 30 June 2014
Note 34. Major Land Transactions (continued)
$ '000
Kingsford Smith Business ParkSet out below are details of Major Land Transactions relating to the area of land between Wallwork Road and the Port Hedland International Airport, formally known as Kingsford Smith Business Park. A number of sales of land within this subdivision with fall below the threshold for a major land transaction. The Town is currently preparing a marketing and disposal strategy for the balance of the lots.
As at 30 June 2014, the Town had already entered into or substantially commenced a number of major land transactions relating to this area, however the subdivision has not yet been completed. It is anticipated that other major land transactions will be undertaken in the future, however any such proposed transactions will require the approval of Council. Aside from the transactions identified below, no additional revenue sources from major land transactions have been incorporated into cash flow projections.
- BHP Billiton Iron Ore In June 2012, the Town entered into a private treaty arrangement with BHP Billiton Iron Ore (BHP) to facilitate the subdivision of a portion of an area of land previously known as Precinct 3, now formally known as Kingsford Smith Business Park. Under the arrangement, BHP is required to construct a 40 lot subdivision, 38 lots of which would be retained by the Town. Lot 34 of the development has been sold to BHPB, with the intention that they would utilise the site for a warehouse facility. Should BHPB wish to dispose of the site, the Town holds the first right of refusal. Lot 35 is the subject of a lease agreement between the Town and BHP. The term of the lease is 10 years. In accordance with the terms of the lease, it was proposed that BHP would utilise the land for the purposes of non-residential workforce accommodation, up to 4000 beds.
The Town estimates that at the completion of subdivision construction works, the Town will recognise an asset estimated to be worth some $60m. It is anticipated that the handover will occur during the 2014/15 financial year, as such a non cash contribution and corresponding non cash asset acquisition (Real Estate Inventory) has been incorporated into the 2014/15 Budget. The Town will then have a number of fully serviced lots within the Kingsford Smith Business Park, available for sale or lease. Proceeds from the sale of Lot 34 have been allocated by the Town to the Spoilbank Marina Project. Any lease or sale proceeds from subdivision lots created other than Lots 34 and 35, are planned to be allocated from Municipal to the Airport Reserve up to an existing commitment of $40m, to help fund the proposed Airport Redevelopment Capital Works program. Any associated rates revenue generated as a result of sale or lease will remain within normal Municipal operations, as will any interest earned on the investment of any such proceeds.
- Ausco ModularThe Town is negotiating a lease agreement with Ausco Modular for a 4.5ha parcel of land, Lot 36, within Kingsford Smith Business Park. In accordance with the proposed lease, Ausco Modular will utilise the land for the purposes of non-residential workforce accommodation. Council has endorsed the business plan governing this major land transaction, which encompassed lease revenue and a community contribution. Due to the uncertainty surrounding the execution of an lease agreement, the Town has not incorporated any potential financial implications arising from this major land transaction. However, it is anticipated that the Town will realise additional rates revenue, lease revenue, and a voluntary community contribution. Any lease revenue resulting from this transaction will be transferred to the Airport Reserve.
98

page 70
Town of Port Hedland
Notes to the Financial Statements for the year ended 30 June 2014
Note 34. Major Land Transactions (continued)
$ '000
- BunningsIn May 2013, the Town entered into a private treaty arrangement with bunnings Properties Pty Ltd for the sale of part Lot 12 in the Kingsford Smith Business Park at a value of $2.695m. Settlement of the Sale Contract is contingent upon completion of the subdivision works, and servicing of the lot. The estimated timing for completion of works is February 2015. The sale proceeds and a corresponding transfer to the Airport Reserve have been recognised in the 2014/15 financial year. The sale of the land to Bunnings will cause the land to change from non-rateable to rateable. As the land has not yet been valued by the Office of the Valuer-General, no estimates for additional rates revenue have been incorporated into outward year projections. There are no new assets or liabilities expected to be realised in association with this major land transaction. However, the sale of land will trigger a profit/loss on disposal of asset.
$ '000
(b). Current Year Transactions
Operating IncomePort Hedand International Airport - Compass Group Pty LtdLease RevenueRatesPort Hedland International Airort - Mia Mia Port Hedland International Airport Pty LtdLease RevenueRatesMineral ResourcesLease RevenueCatamore CourtNilGeneral Practitioner HousingLease Revenue - Pilbara Medical HoldingsLease Revenue - Kinetic HealthJD Hardie LandNilKingsford Smith Business Park - BHP Billiton Iron Ore
Lease RevenueRates
- Ausco ModularNil
- BunningsNil
190
173
748
2014Actual
-
-
-
-
Actual2013
820
8206,599
1,122
220
-
-
93
-
4,053
-
-
- -
-
-
-
-
-
-
-
99

page 71
Town of Port Hedland
Notes to the Financial Statements for the year ended 30 June 2014
Note 34. Major Land Transactions (continued)
$ '000
(b). Current Year Transactions (continued)
Operating ExpensePort Heldand International Airport - Compass Group Pty LtdNilPort Hedland International Airort - Mia Mia Port Hedland International Airport Pty LtNilMineral ResourcesNilCatamore CourtNilGeneral Practitioner HousingProperty InsuranceUtility ChargesBuilding MaintenaceJD Hardie LandNilKingsford Smith Business Park - BHP Billiton Iron Ore
Nil - Ausco Modular
Nil - Bunnings
Nil
Total 6,569
-(30)
820
-
-
-
-
-
--
-
-
(14)
-
-
2014
-
-
(3)
-
Actual Actual
--
-
-
(13)
2013
-
100

page 72
Town of Port Hedland
Notes to the Financial Statements for the year ended 30 June 2014
Note 34. Major Land Transactions (continued)
$ '000
(b). Current Year Transactions (continued)
Capital IncomePort Heldand International Airport - Compass Group Pty LtdNilPort Hedland International Airort - Mia Mia Port Hedland International Airport Pty LtNilMineral ResourcesNilCatamore CourtLoan BorrowingsProceeds from Sale of LandGeneral Practitioner HousingNilJD Hardie LandNilKingsford Smith Business Park - BHP Billiton Iron Ore
Nil - Ausco Modular
Nil - Bunnings
Nil
Capital ExpenditurePort Heldand International Airport - Compass Group Pty LtdNilPort Hedland International Airort - Mia Mia Port Hedland International Airport Pty LtNilMineral ResourcesNilCatamore CourtLand Development CostsGeneral Practitioner HousingProject Management ExpensesJD Hardie LandNilKingsford Smith Business Park - BHP Billiton Iron Ore
Land development Costs - Ausco Modular
Nil - Bunnings
Nil
Total
-
-
Actual
(10) -
-
--
-
-
-
-
-
-
-
-
-
-
--
Actual
-
-
-
-
-
-
-250
-
-
-
-
-
-
(5)
-
2014 2013
(1,878)
1,868-
1,618
(1,682)
(191)
-
-
-
101

page 73
Town of Port Hedland
Notes to the Financial Statements for the year ended 30 June 2014
Note 34. Major Land Transactions (continued)
$ '000
(c). Expected Future Cash Flows
Cash InflowsPort Heldand International Airport - Compass Group Pty LtdRates Lease RevenuePort Hedland International Airort - Mia Mia Rates Lease RevenueCommunity ContributionMineral ResourcesNilCatamore CourtLand SalesGeneral Practitioner HousingLease Revenue - Pilbara Medical HoldingsLease Revenue - Kinetic HealthJD Hardie LandLoan BorrowingsKingsford Smith Business Park - BHP Billiton Iron Ore
Lease RevenueRates
- Ausco ModularNil
- BunningsLand Sales
7,1546,126
986
-
2,695
8511,141
-
-
252
-
-
-
-
-
-
-
3,1683,430
793660
1,948
-
2,977
245185
150
15,415
--
32,652
7721,008
193
3,795
12494
-
4,026240 265
-
-
810298
3,909
213203167487
-
-
163487
-
-
171487
-
2016/17 2017/18 Total2014/15
12,496 6,876
2015/16
735983
184159487
-
2,977
12191
150
3,685229
-
2,695
102

page 74
Town of Port Hedland
Notes to the Financial Statements for the year ended 30 June 2014
Note 34. Major Land Transactions (continued)
$ '000
(c). Expected Future Cash Flows (continued)
Cash Outflows (continued)Port Heldand International Airport - Compass Group Pty LtdNilPort Hedland International Airort - Mia MiaNilMineral ResourcesNilCatamore CourtAcquisition of HousingGeneral Practitioner HousingMaterials and ContractsUtilitiesDepreciationInterestInsuranceLoan RepaymentsJD Hardie LandAcquisition of LandKingsford Smith Business Park - BHP Billiton Iron Ore
Nil - Ausco Modular
Nil - Bunnings
Nil
Net Cash Flows
Note 35. Trading and Major Trading Undertakings
- -
-
(60)(209)
(150)
-
(30)(134)
-
-
-
2014/15 2015/16 2016/17 2017/18 Total
(61)(16)(56)
-
-
-
-
-
-
-
(2,977)
(195)(123)(544)(258)
-
-
(32)(141)
-
-
-
-
-
(49)(31)
(138)(63)(15)(53)
-
-
(50)
-
-
-
(50)
6,798 28,136
(4,516)-
No trading or major trading activities were undertaken in 2013/14.
(349)
5,777
(356)
-
(49)
(150)
(66)(15)(51)
-(3,465)
9,031
(131)(68)(14)
-
-
-
(2,977)
-
-
-
-
(346)
6,530
(46)(30)
103

page 75
Town of Port Hedland
Notes to the Financial Statements for the year ended 30 June 2014
Note 36. Financial Risk Management
$ '000
Council's activities expose it to a variety of financial risks including (1) price risk, (2) credit risk, (3) liquidity riskand (4) interest rate risk.
The Council's overall risk management program focuses on the unpredictability of financial markets and seeksto minimise potential adverse effects on the financial performance of the Council.
Council does not engage in transactions expressed in foreign currencies and is therefore not subject to foreigncurrency risk.
Financial risk management is carried out by Council's Finance Section under policies approved by the Council.
The Town held the following financial instruments at balance date.
Financial AssetsCash and Cash EquivalentsReceivables (Current & Non-Current)Financial Assets at Fair Value through Profit or Loss
Financial LiabilitiesPayables (Current & Non-Current)Borrowings (Current & Non-Current)
Fair Value is determined as follows:
- Cash & Cash Equivalents, Receivables, Payables - are estimated to be the carrying value which approximates market value.
- Borrowings & Held to Maturity Investments - estimated future cash flows discounted by the current market interest rates applicable to assets & liabilities with similar risk profiles.
- Financial Assets classified (i) "at fair value through profit & loss" or (ii) Available for Sale - based on quoted market prices at the reporting date or independent valuation.
Notes
354
910
2014
35,653 38,501
Carrying Value
12,839 33,039
109,282
2013
11,837
35,197 38,501
87,895 109,282
2014 2013
28,741
7,000 -
68,409 76,243 75,409 76,243
26,6646,456 6,912 11,837
28,741 26,664
156,34868,100
Fair Value
33,039-
12,486
104

page 76
Town of Port Hedland
Notes to the Financial Statements for the year ended 30 June 2014
Note 36. Financial Risk Management (continued)
$ '000
(a). Cash & Cash Equivalents, Financial assets "at Fair Value through the Profit & Loss", "Available-for-sale" financial assets & "Held-to-maturity" Investments
Council's objective is to maximise its return on cash & investments whilst maintaining an adequate level ofliquidity and preserving capital.
Council's Finance Section manages the Cash & Investments portfolio.
Council has an Investment Policy which complies with the relevant legislation. The policy is regularly reviewed by Council and an Investment Report is tabled before Council on a monthly basis setting out the make-up andperformance of the portfolio.
The major risk associated with Investments is price risk - the risk that the capital value of Investments mayfluctuate due to changes in market prices, whether there changes are caused by factors specific to individualfinancial instruments or their issuers or are caused by factors affecting similar instruments traded in a market.
Cash & Investments are also subject to interest rate risk - the risk that movements in interest rates could affectreturns and income.
A further risk associated with Cash & Investments is credit risk - the risk that the investment counterparty willnot complete their obligations particular to a financial instrument, resulting in a financial loss to Council - be it ofa capital or income nature.
Council manages these risks by diversifying its portfolio and only purchasing investments with high credit ratingsor capital guarantees in accordance with investment restrictions prescribed in the Local Government (FinancialManagement) Regulations 1996 .
Impact of a 10% (1) movement in price of investments Equity Statement of Comprehensive Income (2)
Impact of a 1% (1) movement in interest rates on cash and investments Equity Statement of Comprehensive Income
Notes:1. Sensitivity percentages based on management's expectations of future possible market movements. (Price movements calculated on investments subject to fair value adjustments. Interest rate movements calculated on cash, cash equivalents and managed funds.)
2. Maximum impact.
385
700700
-
385
-
30-Jun-1330-Jun-14
754754
105

page 77
Town of Port Hedland
Notes to the Financial Statements for the year ended 30 June 2014
Note 36. Financial Risk Management (continued)
$ '000
(b). Receivables
Council's major receivables comprise (i) Rates & Annual charges and (ii) User Charges & Fees.
The major risk associated with these receivables is credit risk - the risk that debts due and payable to Councilmay not be repaid.
Council manages this risk by monitoring outstanding debt and employing stringent debt recovery procedures.It also encourages ratepayers to pay their rates by the due date through incentives.
Credit risk on rates and annual charges is minimised by the ability of Council to secure a charge over the landrelating to the debts - that is, the land can be sold to recover the debt. Council is also able to charge intereston overdue rates & annual charges at higher than market rates which further encourages the payment of debt.
The level of outstanding receivables is reported to Council monthly and benchmarks are set and monitored foracceptable collection performance.
Council makes suitable provision for doubtful receivables as required and carries out credit checks on mostnon-rate debtors.
There are no material receivables that have been subjected to a re-negotiation of repayment terms.
A profile of Council's receivables credit risk at balance date follows:
Percentage of Rates and Annual Charges Current Overdue
Percentage of Other Receivables Current Overdue 32.00% 17.00%
% %
0.00%
68.00% 83.00%
90.00%100.00% 10.00%
30-Jun-14 30-Jun-13
106

page 78
Town of Port Hedland
Notes to the Financial Statements for the year ended 30 June 2014
Note 36. Financial Risk Management (continued)
$ '000
(c). Payables & Borrowings
Payables & Borrowings are both subject to liquidity risk - the risk that insufficient funds may be on hand to meetpayment obligations as and when they fall due.
Council manages this risk by monitoring its cash flow requirements and liquidity levels and maintaining anadequate cash buffer.
Payment terms can be extended & overdraft facilities drawn upon in extenuating circumstances.
The contractual undiscounted cash outflows (ie. principal and interest) of Council's Payables & Borrowings areset out in the Liquidity Table below:
$ '000
PayablesBorrowings
PayablesBorrowings
Borrowings are also subject to interest rate risk - the risk that movements in interest rates could adverselyaffect funding costs & debt servicing requirements. Council manages this risk by borrowing long term andfixing the interest rate on a basis that is most suitable for the circumstance. Council officers regularyreview interest rate movements to determine if it would be advantageous to refinance or renegotiatepart, or all of the loan portfolio.
The following interest rates were applicable to the Council's Borrowings at balance date:
Bank Loans - Fixed
Notes:1. The interest rate risk applicable to Variable Rate Bank Loan is not considered significant.
2014
2013
1 year 1 & 5 years 5 years cash flows
2,8366,912 - - 6,912
within between after contractualDue Due Due Total
13,142 4,998 20,361 38,501
14,613 27,313 44,762
11,837 - - 11,837 11,8371,305
9,748 14,613 27,313 51,674 35,19728,741
30-Jun-13BalanceWeighted
30-Jun-14
interest interest
Weighted
4,998 20,361 26,664 26,66438,501
6,456
Balance
Carryingvalues
28,741 26,66428,741 5.48% 26,664
$rate %5.66%
average average
rate % $
107

page 79
Town of Port Hedland
Notes to the Financial Statements for the year ended 30 June 2014
Note 37. Fair Value Measurements
$ '000
The fair value of assets and liabilities must be estimated in accordance with various Accounting Standards foreither recognition and measurement requirements or for disclosure purposes.
AASB 13 requires disclosure of fair value measurements by level of the following fair value measurementhierarchy:
Level 1: Quoted prices (unadjusted) in active markets for identical assets or liabilities,
Level 2: Inputs other than quoted prices included within Level 1 that are observable for the asset or liability either directly or indirectly,
Level 3: Inputs for the asset or liability that are not based on observable market data (unobservable inputs).
(1) The following table presents all assets and liabilities that have been measured & recognised at fair values:
2014
Property, Plant & EquipmentLandBuildingsPlant and EquipmentTotal Property, Plant & Equipment
of latest prices in observable unobservableValuation active mkts inputs inputs
Fair Value Measurement using:Level 1 Level 2 Level 3 Total
Date Quoted Significant Significant
30/06/14 - 8,159 91,561 99,72030/06/13 - 11,325 - 11,325
30/06/14 - 73,880 - 73,880
- 93,364 91,561 184,925
108

page 80
Town of Port Hedland
Notes to the Financial Statements for the year ended 30 June 2014
Note 37. Fair Value Measurements (continued)
$ '000
(2) Transfers between Level 1 & Level 2 Fair Value Hierarchies
During the year, there were no transfers between Level 1 and Lervel 2 Fair Value hierarchies for recurring fairvalue measurements.
(3) Valuation techniques used to derive Level 2 and Level 3 Fair Values
Where Council is unable to derive Fair Valuations using quoted market prices of identical assets(ie. Level 1 inputs) Council instead utilises a spread of both observable inputs (Level 2 inputs) andunobservable inputs (Level 3 inputs).
The Fair Valuation techniques Council has employed while utilising Level 2 and Level 3 inputs are as follows:
Property, Plant & EquipmentValuation Process - Plant and EquipmentThe Town's Plant & Equipment was revalued at 30 June 2013 by independent valuers. All of the valuations were made on the basis of open market values of similar assets adjusted for condition and comparability (Level 2 inputs in the fair value hierarchy). Any Plant and Equipment assets acquired after the date of revaluation are recognised at cost less accumulated depreciation and are considered Level 2 as detailed above.
Valuation Process - LandAn independent valuer was appointed to carry out a valuation of all Land and Buildings as at 30 June 2014. Land Fair Values have been measured by the Market Approach by Direct Comparison, an accepted valuation methodology under AASB13. Level 2 valuation inputs were utilised, being sales transactions of other properties within the region, and adjusted for differences between key attributes of the properties. The main input is the price per square metre or price per hectare of land area. The Market Approach is deemed a Level 2 input.
Valuation Process - BuildingsWhere there is an active and liquid market as evidenced by sales transactions of similar property types, the Market Approach by Direct Comparison, Income or Summation methods can be utilised, and is an accepted valuation methodology under AASB13. If a Market Approach is adopted, the building valuation is deemed to be a Level 2 input.
Direct Comparison and Summation methods involve the analysis of sales evidence and comparisons with the subject taking into account matters such as method of construction, size, condition, age, land area and location. The land value is subtracted from the Market Value of the property to measure the asset Fair Value. The Market Approach was adopted on twenty six (26) assets.
109
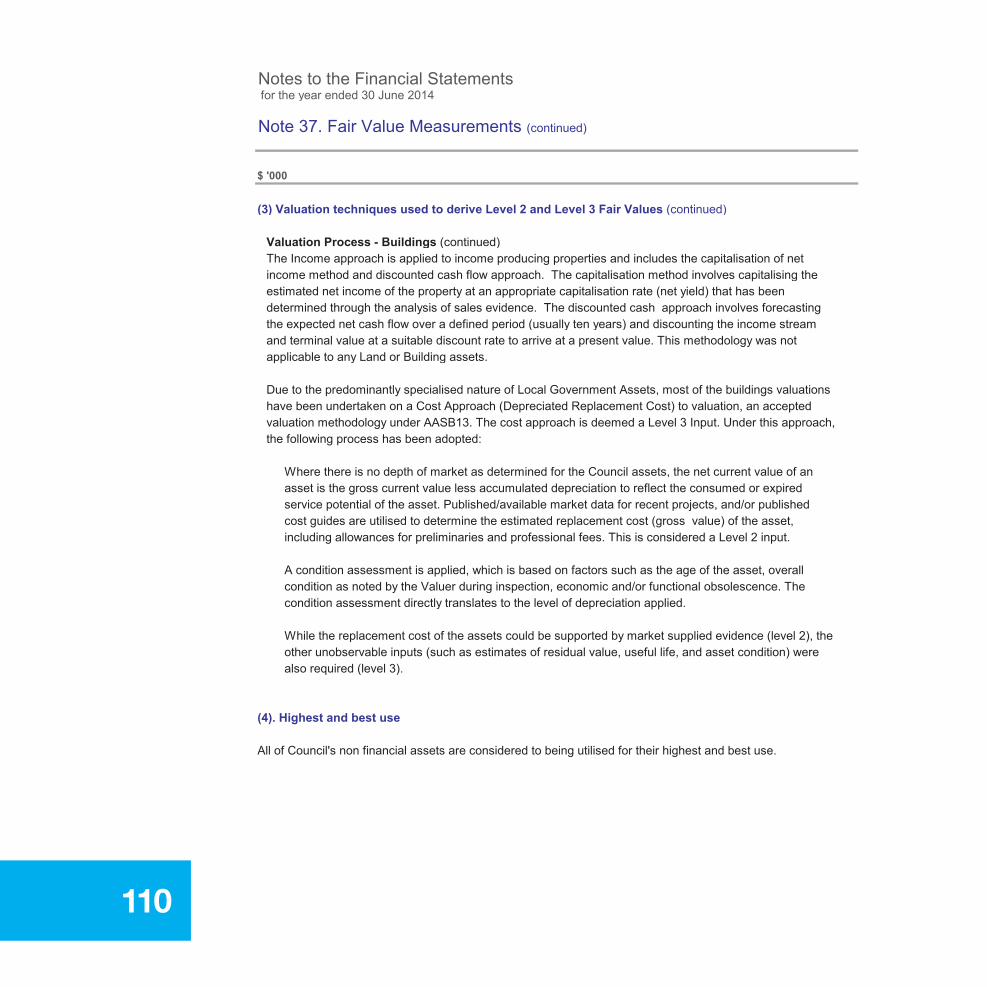
page 81
Town of Port Hedland
Notes to the Financial Statements for the year ended 30 June 2014
Note 37. Fair Value Measurements (continued)
$ '000
(3) Valuation techniques used to derive Level 2 and Level 3 Fair Values (continued)
Valuation Process - Buildings (continued)The Income approach is applied to income producing properties and includes the capitalisation of net income method and discounted cash flow approach. The capitalisation method involves capitalising the estimated net income of the property at an appropriate capitalisation rate (net yield) that has been determined through the analysis of sales evidence. The discounted cash approach involves forecasting the expected net cash flow over a defined period (usually ten years) and discounting the income stream and terminal value at a suitable discount rate to arrive at a present value. This methodology was not applicable to any Land or Building assets.
Due to the predominantly specialised nature of Local Government Assets, most of the buildings valuations have been undertaken on a Cost Approach (Depreciated Replacement Cost) to valuation, an accepted valuation methodology under AASB13. The cost approach is deemed a Level 3 Input. Under this approach, the following process has been adopted:
Where there is no depth of market as determined for the Council assets, the net current value of an asset is the gross current value less accumulated depreciation to reflect the consumed or expired service potential of the asset. Published/available market data for recent projects, and/or published cost guides are utilised to determine the estimated replacement cost (gross value) of the asset, including allowances for preliminaries and professional fees. This is considered a Level 2 input.
A condition assessment is applied, which is based on factors such as the age of the asset, overall condition as noted by the Valuer during inspection, economic and/or functional obsolescence. The condition assessment directly translates to the level of depreciation applied.
While the replacement cost of the assets could be supported by market supplied evidence (level 2), the other unobservable inputs (such as estimates of residual value, useful life, and asset condition) werealso required (level 3).
(4). Highest and best use
All of Council's non financial assets are considered to being utilised for their highest and best use.
110

page 82
Town of Port Hedland
Notes to the Financial Statements for the year ended 30 June 2014
Note 38. "Held for Sale" Non Current Assets & Disposal Groups
$ '000
Council did not classify any Non Current Assets or Disposal Groups as "Held for Sale".
Note 39. Investment Properties
Council has not classified any Land or Buildings as "Investment Properties"
Note 40. Intangible Assets
Intangible Assets represent identifiable non-monetary asset without physical substance.
The Easements registered to Town of Port Hedland at 30th June 2014 mainly provide right of access for the purpose of water, sewerage, storm water and similar activities. For most of the easements, the access is for Government Agencies like Water Corporation, State Energy Commission and other similar agencies.
The Town is of the view that due to the nature of the easements which mainly provide access only, it is not able to put a value to these easements which will provide future economic benefits to the organisation.
Note 41. Equity - Retained Earnings and Reserves Adjustments
$ '000
(a). Correction of Error/s relating to a Previous Reporting Period
Correction of errors disclosed in this year's financial statements:
2013 Carried Forward Surplus as per 2013 Annual Financial Report2013 Brought Forward Surplus as per 2014 Annual Financial ReportSelf Supporting Loan Principal Income as per Rate Setting Statement
(b). Voluntary Changes in Accounting Policies
Council made no voluntary changes in any accounting policies during the year.
2014
(2,506)(68)
Actual Actual
2013
(2,438)
111
page 83
Town of Port Hedland
Notes to the Financial Statements for the year ended 30 June 2014
Note 42. Discontinued Operations
$ '000
Council has not classified any of its Operations as "Discontinued".
Note 43. Events occurring after the Reporting Period
Events that occur between the end of the reporting period (ending 30 June 2014) and the date when the financialstatements are "authorised for issue" have been taken into account in preparing these statements.
Council has adopted the date of receipt of the Auditors' Report as the applicable "authorised for issue" daterelating to these General Purpose Financial Statements.
Events that occur after the Reporting Period represent one of two types:
(i) Events that provide evidence of conditions that existed at the Reporting Period
These financial statements (and the figures therein) incorporate all "adjusting events" that provided evidence ofconditions that existed at 30 June 2014.
(ii) Events that provide evidence of conditions that arose after the Reporting Period
These financial statements (& figures therein) do not incorporate any "non-adjusting events" that have occurredafter 30 June 2014 and which are only indicative of conditions that arose after 30 June 2014.
Council is unaware of any material or significant "non-adjusting events" that should be disclosed.
Actual Actual 2014 2013
112
10 Kings Park Road West Perth WA 6005 PO Box 570 West Perth WA 6872 T +61 8 9480 2000 F +61 8 9322 7787 E [email protected] W www.grantthornton.com.au
Grant Thornton Audit Pty Ltd ACN 130 913 594 a subsidiary or related entity of Grant Thornton Australia Ltd ABN 41 127 556 389 ‘Grant Thornton’ refers to the brand under which the Grant Thornton member firms provide assurance, tax and advisory services to their clients and/or refers to one or more member firms, as the context requires. Grant Thornton Australia Ltd is a member firm of Grant Thornton International Ltd (GTIL). GTIL and the member firms are not a worldwide partnership. GTIL and each member firm is a separate legal entity. Services are delivered by the member firms. GTIL does not provide services to clients. GTIL and its member firms are not agents of, and do not obligate one another and are not liable for one another’s acts or omissions. In the Australian context only, the use of the term ‘Grant Thornton’ may refer to Grant Thornton Australia Limited ABN 41 127 556 389 and its Australian subsidiaries and related entities. GTIL is not an Australian related entity to Grant Thornton Australia Limited. Liability limited by a scheme approved under Professional Standards Legislation. Liability is limited in those States where a current scheme applies.
Independent Auditor’s Report To the Ratepayers of Town of Port Hedland We have audited the accompanying financial report of Town of Port Hedland (“the Town”) which comprises the statement of financial position as at 30 June 2014, the statement of comprehensive income, statement of changes in equity and statement of cash flows for the year then ended, notes comprising a summary of significant accounting policies and other explanatory information and the Chief Executive Officer’s statement.
Council’s responsibility for the financial report The Council of the Town is responsible for the preparation and fair presentation of the financial report in accordance with Australian Accounting Standards (including the Australian Accounting Interpretations) and the Local Government Act 1995 Part 6. This responsibility includes establishing and maintaining internal control relevant to the preparation and fair presentation of the financial report that is free from material misstatement, whether due to fraud or error; selecting and applying appropriate accounting policies; and making accounting estimates that are reasonable in the circumstances.
Auditor’s responsibility Our responsibility is to express an opinion on the financial report based on our audit. We conducted our audit in accordance with Australian Auditing Standards. These Auditing Standards require that we comply with relevant ethical requirements relating to audit engagements and plan and perform the audit to obtain reasonable assurance whether the financial report is free from material misstatement.
An audit involves performing procedures to obtain audit evidence about the amounts and disclosures in the financial report. The procedures selected depend on the auditor’s judgement, including the assessment of the risks of material misstatement of the financial report, whether due to fraud or error. In making those risk assessments, the auditor considers internal control relevant to the Town’s preparation and fair presentation of the financial report in order to design audit procedures that are appropriate in the circumstances, but not for the purpose of expressing an opinion on the effectiveness of the entity’s internal control. An audit also includes evaluating the appropriateness of accounting policies used and the reasonableness of accounting estimates made by the Town, as well as evaluating the overall presentation of the financial report.
page 84
113

We performed the procedures to assess whether in all material respects the financial report presents fairly, in accordance with the Local Government Act 1995 Part 6 and Australian Accounting Standards (including the Australian Accounting Interpretations), a view which is consistent with our understanding of the Town’s financial position and of its performance.
We believe that the audit evidence we have obtained is sufficient and appropriate to provide a basis for our audit opinion.
Independence In conducting our audit, we followed applicable independence requirements of Australian professional ethical pronouncements.
Auditor’s opinion In our opinion, the financial report of the Town of Port Hedland: (i) gives a true and fair view of the Town of Port Hedland’s financial position as at 30
June 2014 and of its performance for the financial year ended 30 June 2014; (ii) complies with Australian Accounting Standards (including the Australian
Accounting Interpretations); and (iii) is prepared in accordance with the requirements of the Local Government Act 1995
Part 6 (as amended) and Regulations under that Act. Statutory Compliance I did not, during the course of my audit, become aware of any instance where the Council did not comply with the requirements of the Local Government Act 1995 and Local Government (Financial Management) Regulations 1996 as they relate to financial statements.
GRANT THORNTON AUDIT PTY LTD Chartered Accountants
M J Hillgrove Partner - Audit & Assurance Perth, 9 October 2014
page 85
114

115
Town of Port Hedland
Civic and Administration Centre
A 13 McGregor Street, PO Box 41, Port Hedland WA 6721
P (08) 9158 9300
W www.porthedland.wa.gov.au
Like us on Facebook www.facebook.com/townofporthedland