Dr. Sanjay Dahasahasra - AWWA India 1...Challenges in Transforming Intermittent Water Supply to 24x7...
77
Challenges in Transforming Intermittent Water Supply to 24x7 Continuous Supply - A Case Study of the Aurangabad City FORMER MEMBER SECRETARY Maharashtra Jeevan Pradhikaran, Mumbai PAST PRESIDENT Indian Water works Association NETWORK AND 24/7 SYSTEM SPECIALIST World Bank MD Dahasahasra Waternet Solutions Dr. Sanjay Dahasahasra Dr Mukund Mahajan Professor Visvesvaraya National Institute of Technology, Nagpur
Transcript of Dr. Sanjay Dahasahasra - AWWA India 1...Challenges in Transforming Intermittent Water Supply to 24x7...

Challenges in Transforming Intermittent
Water Supply to 24x7 Continuous Supply
- A Case Study of the Aurangabad City
FORMER MEMBER SECRETARY Maharashtra Jeevan Pradhikaran, MumbaiPAST PRESIDENT Indian Water works Association
NETWORK AND 24/7 SYSTEM SPECIALIST World Bank
MD Dahasahasra Waternet Solutions
Dr. Sanjay Dahasahasra
Dr Mukund MahajanProfessor Visvesvaraya National Institute of Technology, Nagpur

Why No 24x7 Water Supply in India?
Prerequisites
for 24x7 Supply
Developed Countries(24x7 Supply)
India(Intermittent Supply)
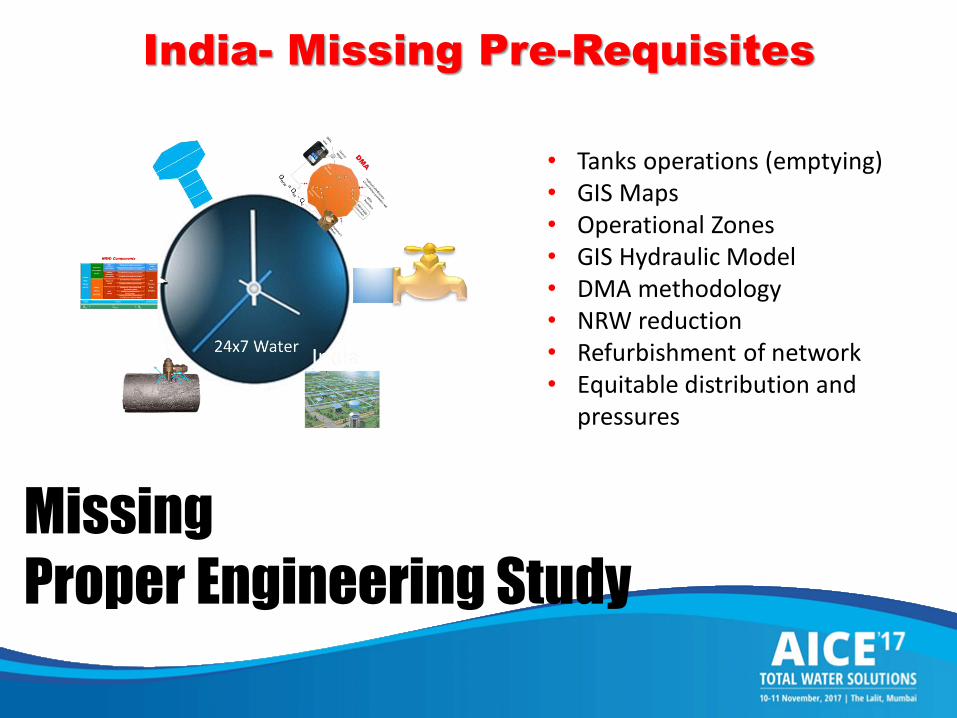
Missing
Proper Engineering Study
• Tanks operations (emptying)• GIS Maps• Operational Zones• GIS Hydraulic Model• DMA methodology• NRW reduction• Refurbishment of network • Equitable distribution and
pressures
India- Missing Pre-Requisites

Contents of Presentation
Overview of water supply in India
Difficulties and challenges of Urban Water Sector
Objectives
Challenges in Aurangabad
GIS Hydraulic model
Equitable distribution of water
O&M of 24x7 water supply
24x7
Water
1
2
3
4
5
6
7

Replication missing
No attempt for PPP
Smart City

Utility Life > 29 years
Meters (Negligeble)
Coverage 49%
Supply Hours < 3
NRW 50%
Challenges of Urban Water in India
Source: HPEC GoI

Managing Burden on the Infrastructure
Source: HPEC GoI
Smart Cities Mission
Aurangabad
Challenges in Urban India
100 Cities in the list of smart cities
High NRW
Few Supply Hours
Low LPCD
No Meters
Water Shortage

Smart city encompass six important sectors that need to work in unison to achieve a common goal of making a city more livable, sustainable and efficient for its residents.
What is smart city?
Source: www.waterworld.com
Key ‘smart” sectors
smart energy
smart integration
smart public services
smart mobility
smart buildings
smart water

Smart City Smart Water 24x7 Continuous
Water
Efficient Water
Distribution Management

• Water supply round the clock to all areas of the city;
• Equitable flow and pressure;
• Technology of 24/7 water supply, suitable to India;
• Reduction of non-revenue water and
• Refurbishment and expansion of transmission and distribution
network.
System of 24/7 water supply for Aurangabad City

• Discusses use of advanced technologies of GIS
• Simulation of pipe network system using WaterGEMS
• Suggest the modifications required to rebuild the system
⁃ Scenario Management
⁃ Boundary of operational zones
⁃ Active Topology tool- to create boundary of DMA
⁃ Darwin Designer for optimization of pipe network;
⁃ Darwin Calibrator
⁃ Identify the probable leaking pipes
⁃ Criticality tool- locations of isolating valves
⁃ Step Tests required for determining NRW in DMAs.

Aurangabad City
▪ Admini. HQ of Marathwada,
▪ Tourism Capital of Maharashtra,
▪ Fastest growing city,
▪ Population- 1.2 Million (2011)

Challenges of the Existing Water Supply of Aurangabad
Nath Sagar
MBR
WTP
26 Kms
10.95 Kms
Total Length of Distribution System = 1061 Kms
Aurangabad City
Intake
• Shortage of Water: 50 LPCD
• Losses = 22%
• Old Pumping Machinery: 1974 and 1991
Bulk Water
Jayakwadi Dam

Challenges of the Existing Water Supply of Aurangabad
Nath Sagar
MBR
WTP
26 Kms
10.95 Kms
Total Length of Distribution System = 1061 Kms
Aurangabad City
Intake
Distribution System
Jayakwadi Dam
• Uneven Terrain:
• Level difference, in
the range of 525 m to
840 m

There is a water loss
Old GI and Non-metallic pipes
Joints of AC pipes loosen

Aurangabad: Old AC Pipes
Length (Kms) of Existing Pipelines
561
259
53 478
373
0
100
200
300
400
500
600
AC CI RCC MS GI DI PVC
Tampering of Pipelines
Water collection
during supply
PVC pipes have been punctured
Water is collected
in pits
Pumps are used to suck water
Outside dirt enters
in PVC pipeline
People suffer a lot due to low pressure
1
2
3 4
5
6

Nath Sagar
MBR
WTP
26 Kms
10.95 Kms
Total Length of Distribution System = 1061 Kms
Aurangabad City
Intake
Jayakwadi Dam
LocationNRW (%)
From To
Head work MBR 10.96
MBR ESR 7.04
ESR Consumer 39.67
Total 58%
Aurangabad: High NRW
Head Work
MBR
WTP

Dirt
Contamination due to Intermittent Supply
Empty Pipeline
Dirt
Ho
w D
ise
ase
Sp
rea
ds?
Vacuum
When empty, pipeline
creates a back siphoning
effect that sucks in
contaminants
Challenges in Distribution System

Intermittent Supply HoursChallenges in Distribution System
Water with low Pressure
45 Minutes once in 2
days
Common Man Says..
We Build-Neglect and Rebuild

Service Tank
DMA-1 DMA-2 DMA-3
Large Number of Valves
Challenges in Distribution System
No. of valves = 2646No. of valvemen = 123

Service Tank
DMA-1 DMA-2 DMA-3
Large Number of Valves
Challenges in Distribution System

Tanks Remain Empty or Overflowing
t
iq
Getting
EmptyOverflowing
t
iqLSL
FSL
t
iq
No
t D
esir
able
Store water in non-peak
hours and release in
peak hours
How engineers
manage ?
Improper Operation Zones
Challenges in Distribution System

Standard India Maharashtra Aurangabad
100% 49% 48.03% 85%
135 LPCD 132 LPCD 75 LPCD 61
100% Negligible 14.9 0%
20% 50% 37% 58%
24 Hours 3 Hours 1.7 HoursOnce in 3 days- 45 minutes
100% NA 95.17% 95%
80% NA 93.63% 30%
100% 30-35% 54.46% 27%
90% NA 38.06% 67%
Source: World Bank Study, 2011

Solutions Proposed
How We proceeded?
Converting to 24x7 Water Supply System?

Present W.S.
Technical
GISIllegal
Connections
Hyd. ModelRehabilitation
of network
DMA
Pressure Management
Leakage Management
Metering Bulk + Consumer
OrganizationO&M to
Sustain 24x7
CommercialVolumetric
Pricing
PolicyManagement
Contracts
Budget Adequate
24x7 Water Supply
Redu-ction
of NRW
5 Important Measures
The Strategies

24x7 Continuous Supply System
Y
All DMAs tackled? Tackle all
DMAs
N
Intermittent Supply System
Base Drawing
Prepare Hydraulic Model
Scenario of zones and DMAs
Install meters and PRVs
Water Audit
Tackle leakiest DMA
Leak repair, Rehabilitate pipes
Implementation Steps
Basic principle ▪Save water by plugging leaks.
▪The saved water is then used to increase the supply hours.
Design Stage
Construction and O&M Stage

24x7 Continuous
water supply
NRW reduction
GIS based Hydraulic
Model
Answer is..
How can we overcome challenges of our current Water Supply Systems?
Drawings required

Digital Globe Satellite:
▪ Pan sharpened
▪ 0.5 m Resolution
Satellite Image of a city
GIS Hydraulic
Model
GIS
Bentley
WaterGEMS
Map Creation

24/7 Water Supply
Leakage Control
Pipe Rehabilitation
Replacing Consumer Pipe
DMA Creation
Water Audit
Reforms- Not Possible- Without
GIS Based Hydraulic Model
GIS Based Hydraulic Model
Operation Zone Creation
Intermittent System

GIS Based Hydraulic Model
Source: Haestead methods- advanced water distribution modelling and management
Definition
Network Modelling
Actual water supply system
Computer software
process of creating a representation
using
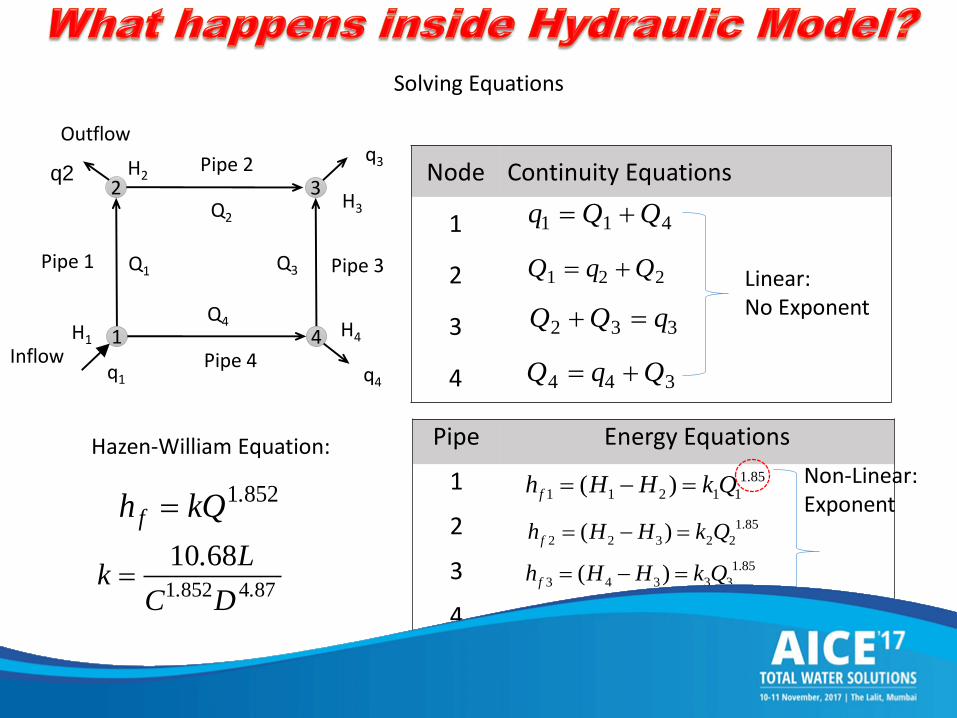
Node Continuity Equations
1
2
3
4
Pipe Energy Equations
1
2
3
4
1 1 4q Q Q
1 2 2Q q Q
2 3 3Q Q q
4 4 3Q q Q
1.85
4 1 4 4 4( )fh H H k Q
1.85
1 1 2 1 1( )fh H H k Q
1.85
2 2 3 2 2( )fh H H k Q
1.85
3 4 3 3 3( )fh H H k Q
2
1
3
4Inflow
q1 q4
q3q2
Pipe 1
Outflow
Pipe 2
Pipe 3
Pipe 4
Q4
Q1
Q2
Q3
H1
H2
H3
H4
1 852.fh kQ
1 852 4 87
10 68. .
. Lk
C D
Hazen-William Equation:
Solving Equations
Linear: No Exponent
Non-Linear: Exponent

Node Continuity Equations
1
2
3
4
Pipe Energy Equations
1
2
3
4
1 1 4q Q Q
1 2 2Q q Q
2 3 3Q Q q
4 4 3Q q Q
1.85
4 1 4 4 4( )fh H H k Q
1.85
1 1 2 1 1( )fh H H k Q
1.85
2 2 3 2 2( )fh H H k Q
1.85
3 4 3 3 3( )fh H H k Q
1 852.fh kQ
Solving Equations
Linear: No Exponent
Non-Linear: Exponent
No Solution

1 1 4q Q Q 1.85
1 1 2 1 1( )fh H H k Q
Co
nve
rgen
ce
Met
ho
ds
Hardy-
Cross
Method
Linear
Theory
Method
Global
Gradient
Method
Newton-
Raphson
Method
No
n-Lin
ear
Solution
Scientist
Global Gradient Method

How we created
GIS based Hydraulic Model
of Aurangabad City?

Remodelling of Aurangabad
Distribution Pipe Network

Remodeling of Aurangabad
Distribution Pipe Network
Use existing pipe
network?
Construct a new pipe network?
Or

Construct a new pipe network?
Use existing pipe
network?
▪ Discard old and leaking AC, PVC pipes
▪ Existing pipes with exact maps and database are used
▪ For 100% coverage new pipes are designed
Rationale We thought
Remodeling of Aurangabad Distribution Pipe Network
We had to discard 80% existing pipes

Discarding Old and leaking Non-metallic Pipes
Sr. No.
Diameter (mm)
MaterialLength (km)
1 80 to 400 AC 561
2 80 to 750 CI 259
3 80 to 450 RCC 53
4 200 to 1400 MS 47
5 50 to 100 GI 8
6 150 to 600 DI 37
7 63 to 250 PVC 3
967
Diameter (mm)
Existing (Km)
CI DI Total
100 5.7 10.8 26.5
150 24.8 9.6 34.4
200 12.0 3.1 15.1
250 4.6 1.2 5.8
300 5.1 1.9 7.0
350 0.9 0.0 0.9
400 0.1 0.0 0.1
450 0.0 0.0 0.0
500 0.7 0.0 0.7
600 0.0 0.0 0.0
Grand Total
54 27 91
Before After
Dis
card
ed

Model of Existing and New
Pipelines
3D stereo paired
satellite image
Create shape files of roads, buildings, WTP, tanks, water bodies etc
Identify places where pipelines are not supposed to be laid
Show new pipes for 100% coverage
Creation of GIS Based Hydraulic
Model

Stereo 1
Stereo 2
Convergence Angle
Demand to nodes
Elevations to Nodes
Prepare operational
zonesWe purchased this image for Aurangabad

335
335
GIS Hydraulic
Model
GIS
Bentley
WaterGEMS

Aurangabad: Growth by Land Use Pattern
Real World
Land Usage
Elevation
Buildings
Population Density
Roads

GIS Hydraulic
Model
GIS
Bentley
WaterGEMS
Load Builder
Theissen Polygon
GIS P.D. Layer

Pipes served by existing tanksPipes unserved by any tanks

Creating Operational Zones
of Aurangabad using GIS
based Hydraulic Model

Source: Water Loss management, Bentley
WTP
Source
MBR
Operational
Zone
Boundary
DMA Boundary
Trunk Main
DMA-1
DMA-2DMA-3 ESR-1
City Boundary
ESR-2
ESR-3
What is Operational Zone?

Using this demand compute tank capacity using mass curve method
Is tank getting empty?
Modify boundary of the zone
Find the demand of nodes which fall within this boundary
Y
Tentatively fix boundary of zone for ESR
Modified boundary is correct
Is tank getting overflow?
Lower demand or pumping hours
Increase demand or modify pumping
hours
N
N
Y

Scenarios in Aurangabad
Existing: 26
New: 45Total
Scenarios: 71
One scenario per operational
zone

DMA Creation in Aurangabad
How Active Topology of WaterGEMS helped?

DMA
inlet
District Meter
Customer’s House
DMA Boundary
Customer’s Meter
Hydraulically discrete-Closed Valves painted in red
Pipe
Network
Qnrw = Qin - Qc
What is DMA?
500 to 3000 Customers

Active Topology- Creating DMAs
PD_1PD_2
PD_3PD_4
DMA Creation in Aurangabad
▪ Inactive pipes- grey colour,
▪ Active pipes- 4 colours,
▪ Only active elements are evaluated
▪ DMAs Pd_1, Pd_2, Pd_3 and Pd_4 are marked,
Pundalik Nagar DMAs

Steady State Method
Present Demand Future Demand
Is Velocity
1.8 m/s and Pressure
17 m
Sizes Adequate
N
Y
Modify Size of pipe
Steady State AnalysisChecking Adequacy of Pipe Size
Modify Size of pipe

What is Darwin Designer?
Darwin Designer
Genetic Algorith
m
Optimise Pipe
Network
2.8 million years ago
Homo heidelbergensis
50,000 years ago
50,000 to 100,000 years ago
Homo sapiensHomo habilis
Darwin’s Principle
of Evolution
Fittest to survive

What happens inside Darwin Designer?
100 100 150 100 200 200
100 200 200100 150 200
A B
CrossoverMutation
Objective Function: Minimise
cost
Constraints
Pool of Solution
s- A.. B..C
Checks for
Fitness
Set of optimal
solutions
Design using GIS based Hydraulic Model

Equitable Flow and Pressure
Exclusive inlet to each DMA
▪ Ensures equal pressure and flow to all DMAs▪ Pundlik Nagar OZ for design
A tank supplying water to different DMAs by separate inlets
PN_2
PN_1
PN_3
PN_4

Inflow = Outflow
t
iq
FCV-1
FCV-2
Qin
Qout

t
iq
Getting
EmptyOverflowing
t
iq
LSL
FSL
t
iq
Inflow = Outflow
t
iq
Inflow < Outflow Inflow > Outflow

Inflow = Outflow
t
iq
FCV-1
FCV-2
• Float on top: FCV closes flow
• Float at bottom: FCV opens flow
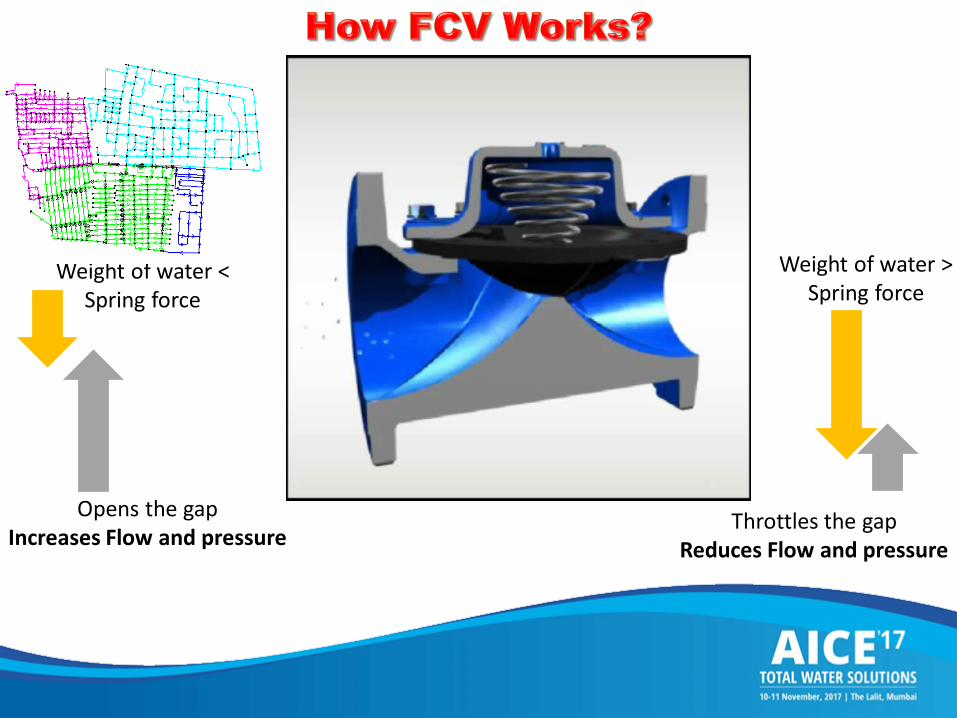
Opens the gapIncreases Flow and pressure
Weight of water < Spring force
Throttles the gapReduces Flow and pressure
Weight of water > Spring force

O&M PlanningNRW Reduction for Converting to 24x7 Water Supply System?
Tools Used:
▪ Criticality
▪ Darwin Calibrator

Optimise Number of Isolation Valves
Aurangabad- Pundalik Nagar
User
Use of Criticality
Objectives:
• Place isolation valves optimally
• Segmentation
• Preparation of STEP test

“Criticality” – A Tool for Step Test of NRW Reduction Strategy
2
31
4
5
6
7
8
9
14
10
11
13
SN Section Controlling ISO valves1 S1 1, 3, 4, 18, 19, 202 S2 2, 3, 4, 5, 18, 20 243 S3 15, 21, 24, 324 S4 7, 13, 14, 15, 25, 31, 325 S5 5, 7, 25, 296 S6 5, 33, 347 S7 16, 17, 26, 348 S8 6, 16, 17, 22, 269 S9 22, 27, 28
10 S10 6, 27, 28 3711 S11 8, 9, 30 3612 S12 9, 10, 11, 12, 3013 S13 2, 9, 10, 11, 12, 3014 S14 2, 8, 10, 11, 12, 13, 31, 35
Total 24 sections are formed
12
Aurangabad- “Pundalik Nagar”

Step Test- To Compute NRW
▪ Systematic closure of section valves
▪ Measure flow at entry point of DMA
▪ Open valves in reverse way
▪ Again measure flow
Inflow is known
Measure consumer’s consumption at
mid-night
NRW = Supply - Consumption
Aurangabad- “Pundalik Nagar”

Aurangabad

High levels
• Poorly managed water utility
• Detrimental to financial viability
• Quality of water
Water that has been produced
Non revenue water(NRW)
“Lost” before it reaches
the customer
NRW is a good indicator for water utility performance
Water put into distribution system - Toatl water billed x 100
Water put into distribution systemNRW

Source: (1) MOUD, June 2012(2) Journal of Mechanical and Civil Engineering, 2013(3) AMRUT PPT
31
57 5850.9
30
69.563.6
31.3
42.6
55.3 52.7
37.5
5057.8
23.720.4
50
NR
W (
%)
Our Goal▪We must attempt to reduce NRW

System
Input
Volume
(m3/Yr)
Authorized
Consumption
(m3/Yr)
Revenue
Water
(m3/Yr)
Non
Revenue
Water
(m3/Yr)
BilledAuthorized
Consumption
UnbilledAuthorized
Consumption
ApparentLosses
RealLosses
Water
Losses
(m3/Yr)
Billed Metered Consumption
Unbilled Unmetered Consumption
Unauthorised Consumption
Customer Meter Inaccuracies
Leakage on Transmission andDistribution Mains
Billed Unmetered Consumption
Unbilled Metered Consumption
Leakage on Service Connectionsup to point of Customer Meter
Leakage and Overflows at Storage Tanks
Source: International Water Association (IWA)
Input Losses Consumption
Qin = Qnrw + Qc

Darwin Calibrator Helps to Locate Leaking Pipe
PUJ-441
PUJ-1PUJ-12
PUP-12
Flow Meter
Pressure Gauge
Tank
Flow Meter

Leak Detection- A Cumbersome Job

Darwin Calibrator Helps to Locate Leaking Pipe
PUJ-441
PUJ-1PUJ-12
PUP-12
PUP-12
Flow Meter
Pressure Gauge
Time (hour)
Observed Inflows: PUP-
12(MLD)
Observed Pressures
PUJ-1 (m)
PUJ-12 (m)
PUJ-441 (m)
0 2.60 12 12.74 25.71
1 2.60 11 12.74 25.71
2 3.60 10 12.74 25.71
3 16.79 8 5.21 12.61
4 16.39 10 11.19 15.52
5 31.97 11 12.59 16.45
6 32.96 10.53 11.12 19.85
7 32.96 10.53 11.12 19.85
8 32.96 10.53 11.12 19.85
9 32.96 10.53 11.12 19.85
10 24.97 10.96 11.59 21.45
11 4.20 11.55 12.23 23.67
12 4.20 11.55 12.23 23.67
13 4.20 11.55 12.23 23.67
14 4.20 11.55 12.23 23.67
15 4.20 11.55 12.23 23.67
16 4.20 11.55 12.23 23.67
17 24.97 10.96 11.59 21.45
18 32.96 10.53 11.12 19.85
19 32.96 10.53 11.12 19.85
20 32.96 10.53 11.12 19.85
21 32.96 10.53 11.12 19.85
22 16.98 11.28 11.93 22.65
23 5.79 11.53 12.21 23.61

Node
Original Emitter
Coefficient (L/s/(m H2O)^n)
Adjusted Emitter
Coefficient (L/s/(m H2O)^n)
PUJ-437 0 0.4
PUJ-193 0 0.4
PUJ-58 0 0.4
PUJ-397 0 0.4
PUJ-249 0 0.4
PUJ-99 0 0.4
PUJ-237 0 0.4
PUJ-414 0 0.3
PUJ-405 0 0.3
PUJ-438 0 0.3
Darwin Calibrator Helps to Locate Leaking Pipe
Leaking Nodes

Reduce NRW
DPR of PPP Project
Appoint Operator
Manage DMAs
24x7 Water Supply

• Jamshedpur with 573,000 inhabitants provided 25% of its residents with continuous water supply in 2009.
• Navi Mumbai, with more than 1m inhabitants, has achieved continuous supply for about half its population as of January 2009.
• Badlapur, city in the Mumbai Metropolitan Area with a population of 140,000, had achieved continuous supply in 3 out of 10 operating zones, covering 30% of its population.
• Thiruvananthapuram, with a population of 745,000 in 2001, is probably the largest Indian city that enjoys continuous water supply.
• Recently, Malkapur town, Jalochi urban agglomeration in Maharashtra have achieved the hallmark of 100% continuous water supply.
• In Amravati city 1.36 Lakhs people are getting benefit of continuous water supply.
• It is heartening to mention here that the Malkapur and Amravati city administrations get National Urban Water Award for this outstanding work.
74

GIS MapGIS
Hydraulic Model
Enough No. of tanks
and zones
Rehabilitation of distribution
pipes
Replacement of GI HSC by MDPE HSC
DMAMeteringPressure
Management
Reduction of NRW
Sustainable Utility
Improved service delivery
24x7

Aw
ard
s in
Ad
van
ce D
istr
ibu
tio
n
Mo
del
ing
21 Oct 2008, Best Engineer Award, at the hands of Hon. Governer, Maharashtra
15 Mar 2008, “24/7 Water Supply”, National Urban Water Award 2008, at Hydrabad, India
29 Mar 2008 , “24/7 Water Supply”, BE Excellence Award 2008, at Baltimore, USA
13 Oct 2009, “Disaster Management” , BE Excellence Award 2009, at Charlotte, USA
22 May 2006 , “Disaster Management” BE Excellence Award 2006, at Charlotte, USA
11th Dec. 2009, Prestressed Concrete Award at, Mangalore, Design and Research, I.E.


![[XLS] · Web viewAhmadnagar-Aaykar Bhavan Ahmednagar Cantonment, Aurangabad - 431001 Aurangabad-Incomtax Office Aurangabad Jeevan Suman Tower Centre CIDCO, Aurangabad - 431001 Aurangabad](https://static.fdocuments.net/doc/165x107/5ae325147f8b9a097a8dc871/xls-viewahmadnagar-aaykar-bhavan-ahmednagar-cantonment-aurangabad-431001-aurangabad-incomtax.jpg)