

Dr Ian Charest, workshop Edinburgh.pdf · Raizada et al. 2010 Kriegeskorte et al. 2008...
66
Representational similarity analysis Dr Ian Charest, Edinburgh, April 2019
Transcript of Dr Ian Charest, workshop Edinburgh.pdf · Raizada et al. 2010 Kriegeskorte et al. 2008...

Representational similarity analysis
Dr Ian Charest,
Edinburgh, April 2019

univariate regional-mean activation studies
Pattern across voxels
Pattern across subjects
Pattern across stimuli
Mur et al. 2012.(single-image regional average activation)
Haxby et al. 2001. (distinct category-average patterns)
Kanwisher et al.1997 (face area)
Raizada et al. 2010
Kriegeskorte et al. 2008(single-image patterns cluster by category)
A space for neuroimaging studies
Cross-subject correlation studies (e.g. social neuroscience)
Charest & Kriegeskorte, 2015

univariate regional-mean activation studies
Pattern across voxels
Pattern across subjects
Pattern across stimuli
A space for neuroimaging studies

univariate regional-mean activation studies
Pattern across voxels
Pattern across subjects
Pattern across stimuli
A space for neuroimaging studies
Classical MVPA

univariate regional-mean activation studies
Pattern across voxels
Pattern across subjects
Pattern across stimuli
A space for neuroimaging studies
RSA
Classical MVPA

representational pattern(e.g. voxels, neurons, model units)
stimulus(e.g. images, sounds, other
experimental conditions)
d iss
imila
r i ty
activ
i ty
behaviour(e.g. dissimilarity judgments)
computational modelrepresentation
(e.g. face-detector model)
stimulus description(e.g. pixel-based dissimilarity)
brain representation(e.g. fMRI pattern dissimilarities)
Charest et al. 2014, 2015, Kriegeskorte & Kievit 2013, see also: Edelman et al. 1998, Laakso & Cottrell 2000, Op de Beeck et al. 2001, Haxby et al. 2001, Aguirre 2007, Kriegeskorte et al. 2008
Representational similarity analysis
representational dissimilarity
representational dissimilarity matrices(RDMs)
Why investigate representational geometries?

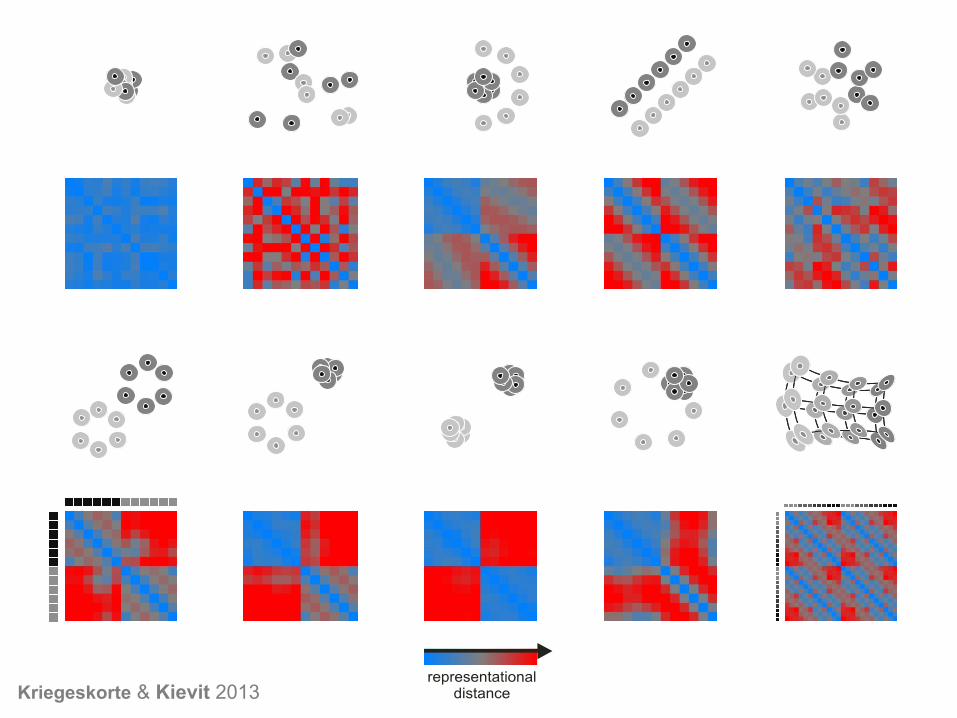
Representational geometryThe geometry of the points in a high-dimensional response pattern space, which are thought to represent particular stimuli.
neuron 1 neuron 3
neuron 2
neuron 1 neuron 3
neuron 2
same geometry→ same information→ same format
downstream neuronscan read out the same information from these codes
slide kindly provided by N. Kriegeskorte

Kriegeskorte & Kievit 2013
category information
...for nonlinear readout
...for linear readout
...inherently categorical
Kriegeskorte & Kievit 2013

How can we best measure representational distances?
dist
data
disttrue
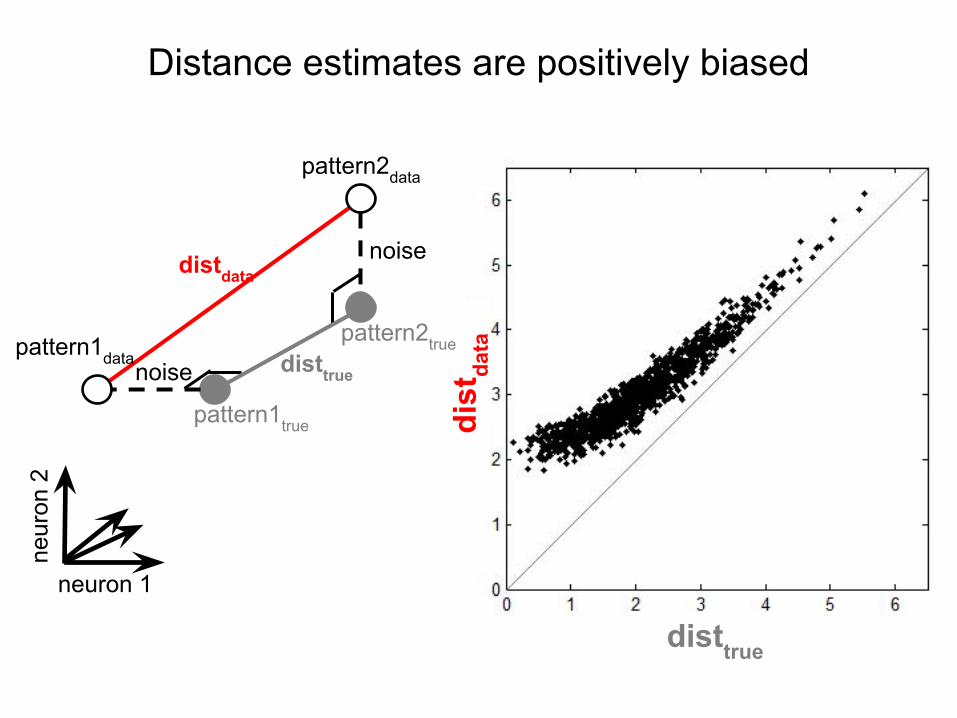
Distance estimates are positively biased
disttrue
pattern1true
pattern1data
pattern2data
distdata
noise
noise
neuron 1
neur
on 2
pattern2true

Distances are positively biased– just like training-set decoding accuracies!

Euclidean distance
Straight-line distance between two patterns in Euclidean space
Image from Alex WaltherRSA workshop 2015

Correlation distance
1 – correlation
Correlation = cosine of the angle between normalised patterns
Image from Alex WaltherRSA workshop 2015

Linear discriminant contrast (LDc)
The default distance measure used in the RSA toolbox (based on the Euclidean distance).
It has two desired properties:
1. Multivariately noise normalised
2. Cross-validated

Noise normalisation
Noise normalisation of the fMRI response patterns increases the reliability of the estimated pattern distances.
Univariate: Divide each voxel’s beta weight by its standard deviation → t value
Multivariate: Multiply each pattern with the inverse of the (square-rooted) covariance matrix → Mahalanobis distance
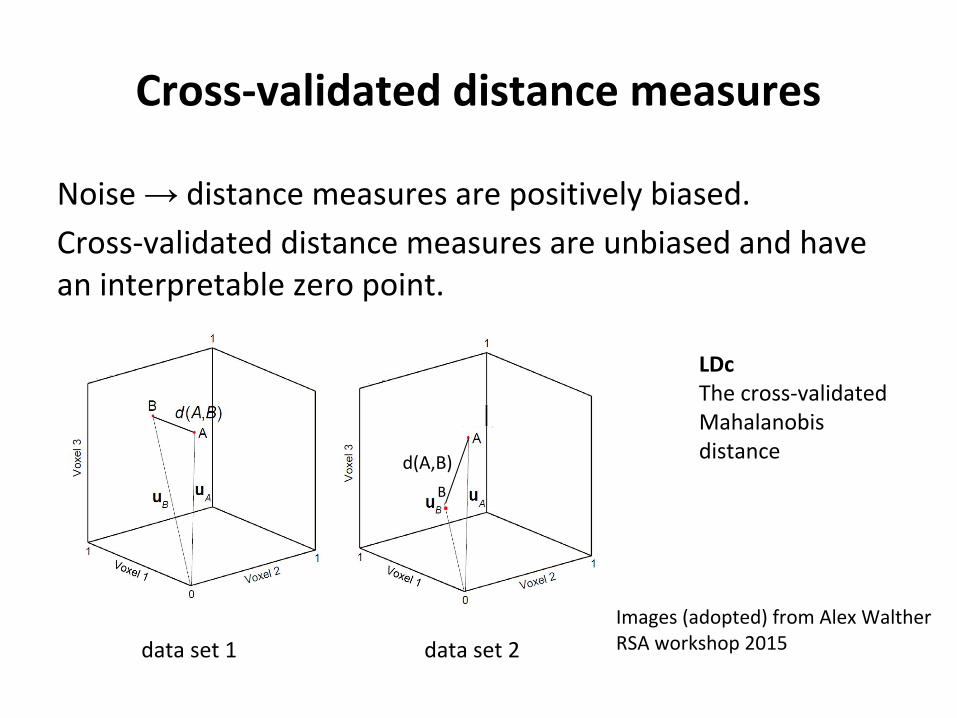
Cross-validated distance measures
Noise → distance measures are positively biased.
Cross-validated distance measures are unbiased and have an interpretable zero point.
data set 1 data set 2
Images (adopted) from Alex WaltherRSA workshop 2015
.d(A,B)
B
LDcThe cross-validated Mahalanobis distance

stim
uli
stimuli000000000000
stim
uli
stimuli000000000000
activitypatterns
experimentalstimuli ...
... ...
brain model
?
representational distance matrix
(RDM)
dissimilarity(e.g. 1-correlation across space)
The representational similarity trick
!

stim
uli
stimuli000000000000
stim
uli
stimuli000000000000
activitypatterns
experimentalstimuli ...
... ...
subject 1 subject 2
?
representational distance matrix
(RDM)
The representational similarity trick
!
dissimilarity(e.g. 1-correlation across space)

stim
uli
stimuli000000000000
stim
uli
stimuli000000000000
activitypatterns
experimentalstimuli ...
... ...
brain behaviour
?
representational distance matrix
(RDM)
The representational similarity trick
!
dissimilarity(e.g. 1-correlation across space)

stim
uli
stimuli000000000000
stim
uli
stimuli000000000000
activitypatterns
experimentalstimuli ...
... ...
region 1 region 2
?
representational distance matrix
(RDM)
The representational similarity trick
!
dissimilarity(e.g. 1-correlation across space)

stim
uli
stimuli000000000000
stim
uli
stimuli000000000000
activitypatterns
experimentalstimuli ...
... ...
fMRI cell recording
?
representational distance matrix
(RDM)
The representational similarity trick
!
dissimilarity(e.g. 1-correlation across space)

stim
uli
stimuli000000000000
stim
uli
stimuli000000000000
activitypatterns
experimentalstimuli ...
... ...
fMRI MEG
?
representational distance matrix
(RDM)
The representational similarity trick
!
dissimilarity(e.g. 1-correlation across space)

The RSA trick
Kriegeskorte, 2008

stim
uli
stimuli000000000000
stim
uli
stimuli000000000000
activitypatterns
experimentalstimuli ...
... ...
subject1 subject 2
?
representational distance matrix
(RDM)
dissimilarity(e.g. 1-correlation across space)
Comparing brain RDMs between people
!

…
…
…
…
animate
bodies
faces
places
objects
inanimate
Charest et al. 2014 PNAS
Stimuli
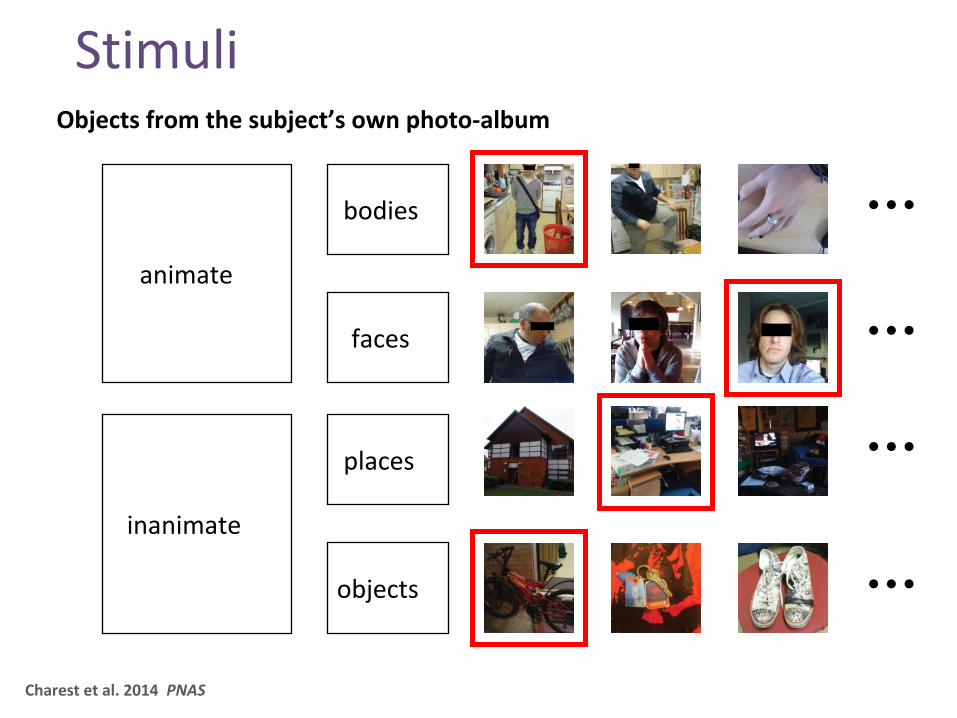
Objects from the subject’s own photo-album
animate
bodies
faces
inanimate
places
objects
…
…
…
…
Charest et al. 2014 PNAS
Stimuli

bodies
faces
places
objects
subject 1(hIT)
Representational Dissimilarity Matrix (RDM)
0
100
dis
sim
ilari
ty
[ p
erce
nti
le o
f d
ista
nce
]
Charest et al. 2014 PNAS

Multi-dimensional scaling
faces
places
objects
bodies

…
subject 1
day 1 day 2
subject 2
correlation
within-subject (ws)
between-subject (bs)
subject similarity matrixday 2
day
1
s 1
s 2
s 3
s 4
s 5
s 20
s 1 s 2 s 3 s 4 s 5 s 20…
individuation index ( ws - bs )
✔
✔
?Charest et al. 2014 PNAS
Comparing brain RDMs between people

Representational geometries in human inferior temporal cortex
Neurotypicals ASC

GLMdenoise improves MVPA analyses
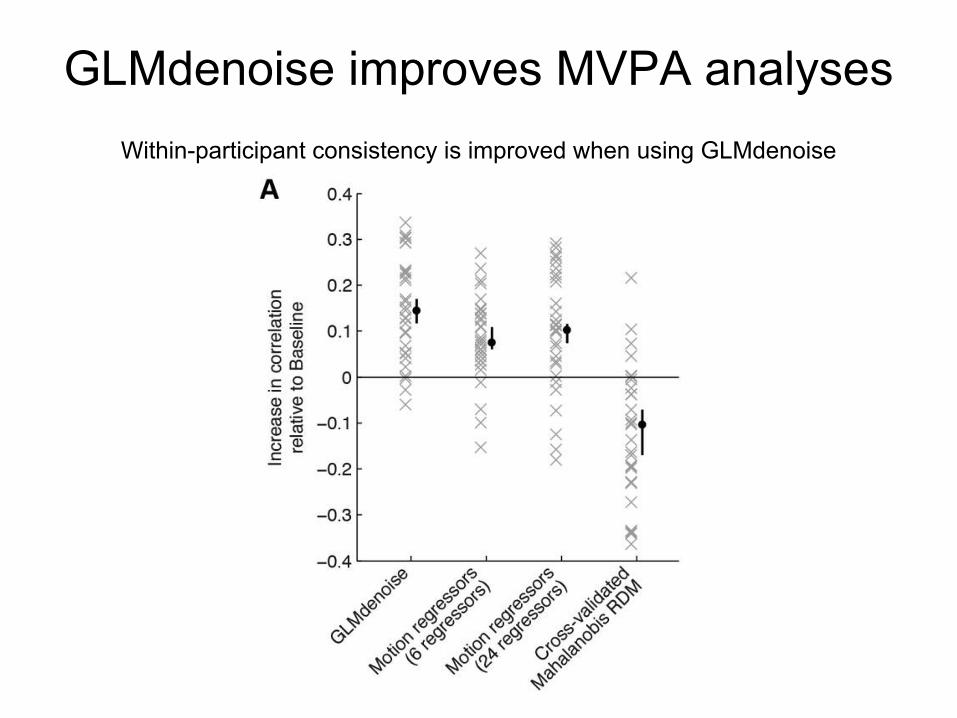
GLMdenoise improves MVPA analysesWithin-participant consistency is improved when using GLMdenoise

GLMdenoise improves MVPA analysesBetween-participants consistency is improved when using GLMdenoise

stim
uli
stimuli00000000000
stim
uli
stimuli00000000000
activitypatterns
experimentalstimuli ...
... ...
brain model
?
representational distance matrix
(RDM)
Relating brain and model RDMs
!
dissimilarity(e.g. 1-correlation across space)
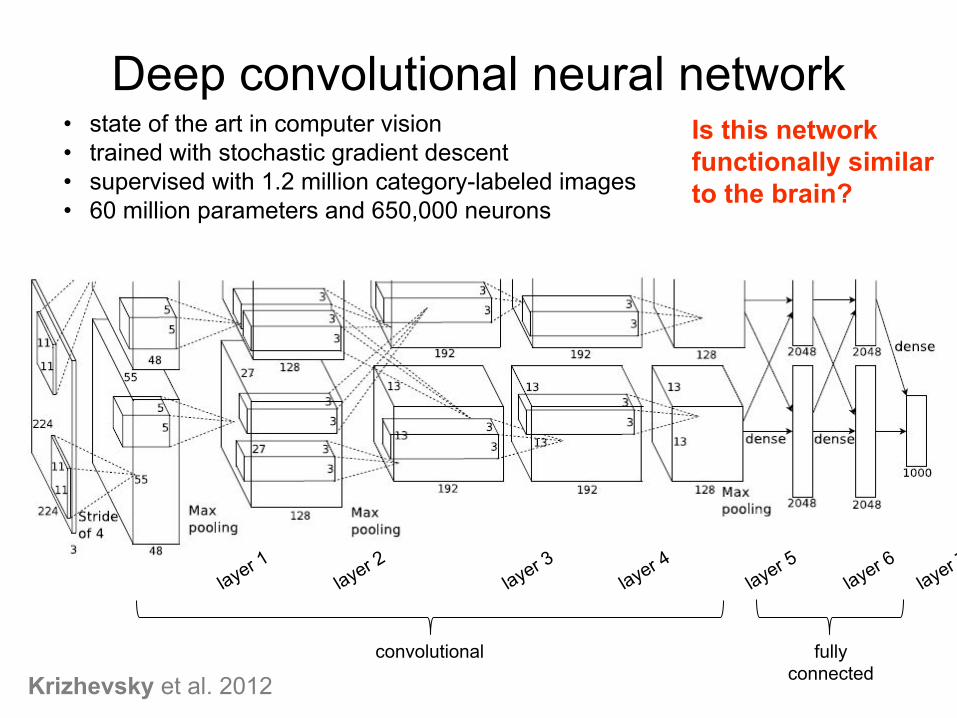
Deep convolutional neural network
Krizhevsky et al. 2012
layer 1
convolutional
layer 2layer 3
layer 4layer 5
layer 6layer 7
fullyconnected
• state of the art in computer vision• trained with stochastic gradient descent • supervised with 1.2 million category-labeled images• 60 million parameters and 650,000 neurons
Is this networkfunctionally similarto the brain?

layer 1
convolutional
layer 2layer 3
layer 4layer 5
layer 6layer 7
fullyconnected
SVMdiscriminants
weightedcombinationof fully connected layersand SVM discriminants
face, anim
all categories
accuracyof human IT
dissimilarity matrixprediction
[group-average of Kendall’s τa]
highest accuracy anymodel can achieve
other subjects’ averageas model
accuracy above chancep<0.001(subjects and stimulias fixed effects)
SE(stimulus bootstrap)
Khaligh-Razavi & Kriegeskorte (2014), Nili et al. 2014 (RSA Toolbox)

layer 1
convolutional
layer 2layer 3
layer 4layer 5
layer 6layer 7
fullyconnected
SVMdiscriminants
weightedcombinationof fully connected layersand SVM discriminants
face, anim
all categories
accuracyof human IT
dissimilarity matrixprediction
[group-average of Kendall’s τa]
highest accuracy anymodel can achieve
other subjects’ averageas model
accuracy above chancep<0.001(subjects and stimulias fixed effects)
SE(stimulus bootstrap)
model comparison(stimulus bootstrap)
Khaligh-Razavi & Kriegeskorte (2014), Nili et al. 2014 (RSA Toolbox)
stim
uli
stimuli000000000000
stim
uli
stimuli000000000000
activitypatterns
experimentalstimuli ...
... ...
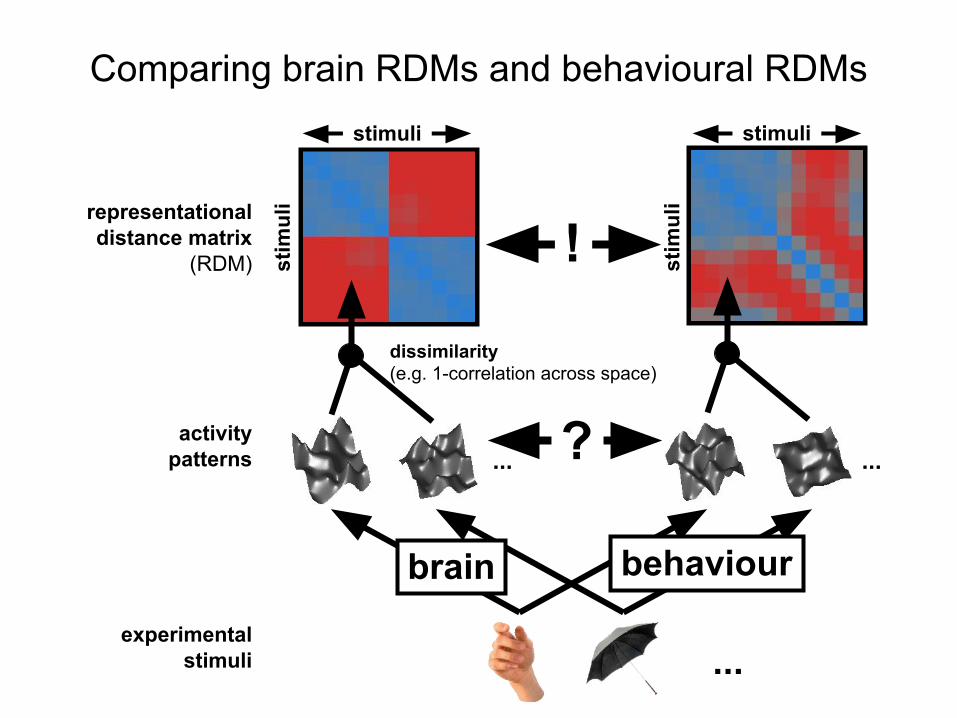
brain behaviour
?
representational distance matrix
(RDM)
dissimilarity(e.g. 1-correlation across space)
Comparing brain RDMs and behavioural RDMs
!

http://meadows-research.com
MEADOWS
@meadowsresearch

bodies
faces
places
objects
unfamiliarimages
0
100
dissimilarity
[per
cent
ile o
f Euc
lidea
n di
stan
ce]
Judgment RDMunfamiliar

Similarity Judgements
bodies
faces
places
objects
unfamiliar

hIT
faces places objectsbodies


…
subject 1
brain behaviour
subject 2
correlation
within-subject (ws)
between-subject (bs)
subject similarity matrixday 2
day
1
s 1
s 2
s 3
s 4
s 5
s 20
s 1 s 2 s 3 s 4 s 5 s 20…
individuation index ( ws - bs )
✔
✔
?Charest et al. 2014 PNAS
Comparing brain RDMs and behavioural RDMs


Representational Dissimilarity Matrix (RDM)
... experimental stimuli
representational pattern (population coderepresentation)
0
100
diss
imila
rity
[ per
cent
ile o
f dis
tanc
e ]
compute the dissimilarity(e.g. 1 – correlation)
0
0
0
0
human inferior temporal(hIT)
Charest et al. 2014 PNAS
voxe
ls
RSA

Representational Dissimilarity Matrix (RDM)
... experimental stimuli
representational pattern (population coderepresentation)
0
100
diss
imila
rity
[ per
cent
ile o
f dis
tanc
e ]
compute the dissimilarity(e.g. 1 – correlation)
0
0
0
0
EEG activity-patternat time t
EEG
Cha
nnel
am
plitu
des
RSA
linear discriminant analysis

RSA

EEG contains rich topographic information from which you can distinguish mental states

bodies
faces
places
objects
EEG contains rich topographic information from which you can distinguish mental states

bodies
faces
places
objects

Object familiarity decoding from EEG activity patterns
unfamiliar objects
familiar objects
signifiant above-chance decoding

Object familiarity decoding from EEG activity patterns

Object familiarity decoding from EEG activity patterns

stim
uli
stimuli000000000000
stim
uli
stimuli000000000000
activitypatterns
experimentalstimuli ...
... ...
fMRI MEG
?
representational distance matrix
(RDM)
dissimilarity(e.g. 1-correlation across space)
!
Comparing RDMs between measurement modalities

Similarity based fusion of M/EEEg and fMRI
Cichy et al. 2014, 2016

Similarity based fusion of M/EEEg and fMRI
Cichy et al. 2014, 2016

The spatio-temporal dynamics of personally meaningful objects

The spatio-temporal dynamics of personally meaningful objects

Cichy et al. 2014 Nature Neuroscience

Key insightsA1 Representational geometries encapsulate the content and
format of brain representations.
A2 Representational geometries can be characterised by representational dissimilarity matrices (RDMs).
A3 RDMs can easily be compared between brains and models, individuals and species, different brain regions, different measurement modalities, and brain and behaviour.
A4 We can statistically compare multiple computational/theoretical models and assess whether they fully explain the measured brain response patterns.


