DR. DANA JOHNSON
28
9/4/2018 1 DR. DANA JOHNSON, Michigan Tech Houghton, MI, USA [email protected] Thursday, 30 August 2018 Paris, France DANA M. JOHNSON, PhD, CSQP, CQE, CQA, CMQ/OE, CSSGB, CPA, CMA Professor, Supply Chain and Engineering Management School of Business and Economics Affiliated Professor, Mechanical Engineering‐ Engineering Mechanics, College of Engineering Michigan Technological University, Houghton, MI USA 15 years automotive industry and consulting 22 years higher education 2
Transcript of DR. DANA JOHNSON

9/4/2018
1
DR. DANA JOHNSON, Michigan TechHoughton, MI, [email protected], 30 August 2018Paris, France
DANA M. JOHNSON, PhD, CSQP, CQE, CQA, CMQ/OE, CSSGB, CPA, CMAProfessor, Supply Chain and Engineering ManagementSchool of Business and EconomicsAffiliated Professor, Mechanical Engineering‐Engineering Mechanics, College of EngineeringMichigan Technological University, Houghton, MI USA 15 years automotive industry and consulting 22 years higher education
2

9/4/2018
2
Present Dr. Roberta S. Russell, Professor, Virginia Tech, Blacksburg, VA, USA
Dr. Quinton Nottingham, Associate Professor, Virginia Tech, Blacksburg, VA, USA
Past Dr. Sheneeta White, Associate Professor, University of St. Thomas, St. Paul, Minneapolis, USA
3
4
Rural outpatient medical clinics

9/4/2018
3
Different constructs of psychometric variables included administrative process, patient flow,
nurse/assistant, care provider, and patient safety and healthwith multiple dimensions. Demographic
variables included gender and age. Wait time considered time in the waiting and exam rooms. Predictive, multivariate modeling, using multiple
methods, uncovered interesting findings on the true drivers of overall patient satisfaction.
5
Patient experience encompasses the range of interactions that patients have with the health care system, including their care from health plans, and from doctors, nurses, and staff in
hospitals, physician practices, and other health care facilities. The terms patient satisfaction
and patient experience are often used interchangeably, but they are not the same thing.
(AHRQ, https://www.ahrq.gov/cahps/about‐cahps/index.html)
6

9/4/2018
4
8
Health Care Research Marketing Research
Service Quality/Outcomes

9/4/2018
5
800 employees, 2nd largest employer in region
Over 120,000 outpatient visits yearly
From not‐for‐profit to profit ownership in late 2013
Focus is on outpatient medical clinics serving a rural community with two universities located in the region.
9About Portage Health, https://www.portagehealth.org/Accessed August 1, 2018
Portage Health, Patient‐Centered Medical Home http://www.portagehealth.org/pcmh/, accessed 3/22/201310

9/4/2018
6
11
Service Quality (Parasuraman, et al 1985; Brady & Cronin, 2001)
Measure satisfaction (Souteriou & Hadjincola, 1999) and difficulty to
evaluate service (Murdick, et al, 1990; Fisk, et al
1993)
Patient satisfaction and quality outcomes
influence care (Badri et al 2008; Carter et al, 2012)
Wait time affects patient satisfaction (Soares & Farhangmehr, 2015)
Wait time consequences in ED (Alijani, et al, 2015)
Lack of research regarding waiting time, care quality and patient satisfaction for outpatient clinics, different specialties in rural regions.
Johnson, D., Nottingham, Q., and Russell, R.(2018) Impact of Waiting Time on Patients’ Perception on Overall Care Quality, 2018 Production and Operations Management Society Annual Conference, Houston, TX.
12
Uncover statistically significant differences
between clinics and years
Predictors of patient
satisfaction
Interpersonal service quality
Administrative service quality
Voice of customer & business
analytics fact based
decision‐making
Metrics to gain competitive advantage
Extend understanding of
factors that impact
Johnson, D.M., Russell, R., and Nottingham, Q. (2016) Multi‐Year SEM Model Predicting the Impact of Behavior Attributes on Overall Patient Satisfaction, presented at Production and Operations Management Society Conference, Orlando, FL. Invited presentation.

9/4/2018
7
Healthcare providers embrace a patient‐centric approach to actively engage patient in decisions regarding care (Delnoij, et al., 2006).
Patient satisfaction affects healthcare firms financially through referrals and reimbursements (Ferrand et al., 2016)
Driven by the US Affordable Care Act, Medicare/Medicaid reimbursements are partially tied to patient satisfaction measures (Tefera et al., 2016)
Analysis of post‐consumption evaluations is one way to learn what impacts patient experience (Panchapakesan et al., 2015; Schulingkamp and Latham, 2015)
Patient involvement and patient experience in quality improvement (Wiig, et al., 2013)
Developing area of research regarding service quality and patient experience for outpatient clinics in a rural setting.
13Nottingham, Q., Johnson, D.M., and Russell, R.S. (2017) Psychometric Attributes Impact on Patient Experience: Are There Differences Between Medical Clinics? presented at 48th Annual Meeting of Decision Sciences Institute, Washington, DC. Invited presentation.
14
Some service quality models lack linkage to
patient experience
Understanding differences between various clinic types
Limitations on impact of
integrated use of response
variables and demographics
Lack of generalizability of
studies
Some theoretical models lack
applicability to practitioner
issues
Limited studies focusing on patient satisfaction in rural setting
Nottingham, Q., Johnson, D.M., and Russell, R.S. (2017) Psychometric Attributes Impact on Patient Experience: Are There Differences Between Medical Clinics? presented at 48th Annual Meeting of Decision Sciences Institute, Washington, DC. Invited presentation.

9/4/2018
8
15
Longer than 15 minutes – 94%
patient dissatisfaction (Eilers, 2004)
Wait time was measured from check in until seeing provider (Hill and Joonas,
2005; McMullen and Netland, 2013)
Wait less, patient
satisfaction up (Camacho et al,
2006)
Wait time negative impact on satisfaction (Bielen and
Demoulin, 2007)
Wait time up, dissatisfaction
increases (Hensley and Sulek, 2007)
ED & specialty clinics (Alijani et al, 2015)
Lengthy wait has significant impact on patient satisfaction
(Soares and Farhangmehr,2015)
Johnson, D., Nottingham, Q., and Russell, R.(2018) Impact of Waiting Time on Patients’ Perception on Overall Care Quality, 2018 Production and Operations Management Society Annual Conference, Houston, TX.
16
Much of the research on patient wait times was completed prior to ACA and pay for performance initiatives
Much of the research on patient wait times is for emergency care in hospitals
Varying definitions of ‘wait time’ make generalizations of prior research difficult
Research today uses CMS survey questions for comparison
Different types of medical facilities (clinics vs hospitals)
Different types of medical/clinic specialties
Johnson, D., Nottingham, Q., and Russell, R.(2018) Impact of Waiting Time on Patients’ Perception on Overall Care Quality, 2018 Production and Operations Management Society Annual Conference, Houston, TX.

9/4/2018
9
17
Author(s) Related Research Findings Psychometric Dimension(s)
Kupfer and Bond, 2012 Closing gap between patient’s expectations OPS
Bowling et al., 2013 Patient experiences in delivery of service transaction informs care provider about emotional and human features
CP
Hendriks et al., 2009 Patient experiences identified as key indicator for evaluating and improving internal processes
AP, PF, PSH, CP
Suhonen et al., 2012; Mainz 2003; Larsson and Wilde‐Larsson, 2010
Patient experiences identified as key indicator for evaluating and improving overall quality of care
AP, PF, PSH, CP, NA, OPS
Badri et al., 2009; Carter et al., 2010
Patient satisfaction and quality outcomes are influenced by care quality
CP
Venkataraman, 2015; Price et al., 2014
Drivers of patient satisfaction does not require cost and quality trade‐off as the service quality attributes are not costly to modify
AP, PF, PSH
Price et al., 2014 Care quality results in better patient experiences and improved overall satisfaction
CP
Ferrand et al., 2016 Prior research lacks a theoretical underpinning to link satisfaction attributes to healthcare system practices
All
Key: Administrative Processes (AP); Patient Flow (PF); Patient Safety and Health (PSH); Care Provider (CP); Nurse/Assistant (NA); Overall Patient Satisfaction (OPS)
Nottingham, Q., Johnson, D.M., and Russell, R. (2018) “Multi‐year SEM model predicting the impact of behavior attributes on overall patient satisfaction,” International Journal of Quality and Reliability Management, forthcoming.
18
Basic statistics and regression (Russell, et al., 2015)
Conjointmethodology employed (Carman, 2000)
Factor analysis (Johnson and Russell, 2015; Tucker, 2002; Kilbourne et. al., 2004)
AHP to determine best healthcare service quality performance based on SERVQUAL –case study of healthcare in Turkey (Büyüközhan, et al., 2011)
Outpatient clinic in Southern California using a questionnaire based on SERVPERF, analysis and modeling included CFA, OLS, and optimization (Souteriou and Chase, 2000)
Service quality using PCA and fuzzy set theory based decision model to calculate overall quality and effectiveness (Büyüközhan, et. al. 2011; Wu, et al., 2004)
Structural equation model of service quality, (Ancarani, et. al. 2011; Johnson and Russell, 2015; Marley et. al. 2004; Scotti, et. al. 2007; Cengiz and Kirkbir, 2007 ; Choi, et al., 2004)
Nottingham, Q., Johnson, D.M., and Russell, R.S. (2017) Psychometric Attributes Impact on Patient Experience: Are There Differences Between Medical Clinics? presented at 48th Annual Meeting of Decision Sciences Institute, Washington, DC. Invited presentation.

9/4/2018
10
Emphasis on process and interpersonal quality as opposed to technical quality
Psychometric service quality variables impact on overall patient satisfaction
Analysis of age, gender, clinic type, provider type, and medical specialty
Opportunity to understand impact of waiting times on patient perceptions of care quality and likelihood of recommending care provider and practice
Patient Centered Outcomes Research (PCOM) which identify areas to improve process quality and increase patient satisfaction
Multi‐year study – fiscal years 2012, 2013, 2014 Rural healthcare setting of multiple outpatient clinics and
physician offices
19
20
The use of psychometric variables categorized as follows:
Interpersonal service quality refers to degree and quality of interaction between the customer and service provider, including trust, communication and manner or attitude; which is generally the primary focus of patients (Panchapakesan et al., 2015; Kupfer and Bond, 2012; Mann et al., 2016). Also referred to as process quality.
Administrative service quality facilitates core services by adding value to the customer’s experience (McDougall and Levesque, 1994; Dagger et. al. 2007). Also referred to as process quality.
Technical service quality, generally patients lack the professional expertise to evaluate clinical quality, and care providers may not view the patient’s evaluation as valid (Nash, 2015). Panchapakesan et al., (2015) indicate that patients often take for granted the technical service quality.
Nottingham, Q., Johnson, D.M., and Russell, R.S. (2017) Psychometric Attributes Impact on Patient Experience: Are There Differences Between Medical Clinics? presented at 48th Annual Meeting of Decision Sciences Institute, Washington, DC. Invited presentation.
9/4/2018
11
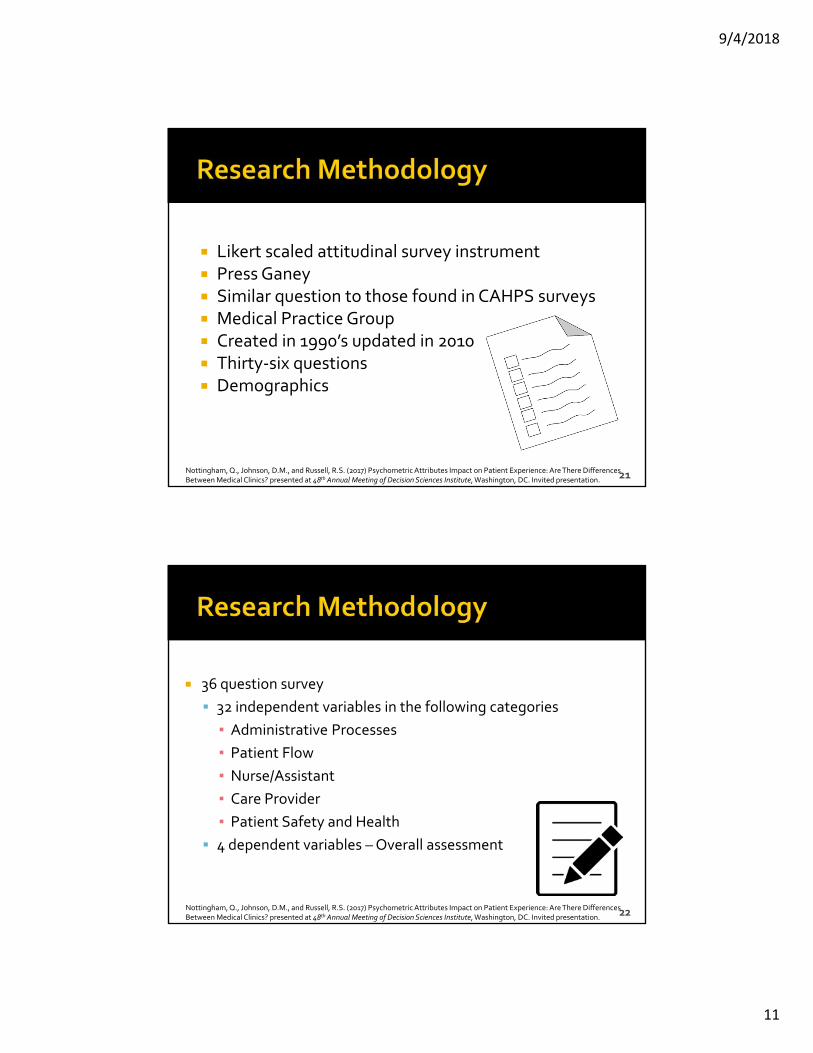
Likert scaled attitudinal survey instrument Press Ganey Similar question to those found in CAHPS surveys Medical Practice Group Created in 1990’s updated in 2010 Thirty‐six questions Demographics
21Nottingham, Q., Johnson, D.M., and Russell, R.S. (2017) Psychometric Attributes Impact on Patient Experience: Are There Differences Between Medical Clinics? presented at 48th Annual Meeting of Decision Sciences Institute, Washington, DC. Invited presentation.
36 question survey
32 independent variables in the following categories
▪ Administrative Processes
▪ Patient Flow
▪ Nurse/Assistant
▪ Care Provider
▪ Patient Safety and Health
4 dependent variables –Overall assessment
22Nottingham, Q., Johnson, D.M., and Russell, R.S. (2017) Psychometric Attributes Impact on Patient Experience: Are There Differences Between Medical Clinics? presented at 48th Annual Meeting of Decision Sciences Institute, Washington, DC. Invited presentation.

9/4/2018
12
Administrative Processes (a1‐ a7) – helpfulness, promptness, courtesy, convenience, ease of reaching the clinic by phone and ease of scheduling appointments [Russell, et al, 2015; Baker, et al, 2008]
Patient Flow (v1‐v7) – speed of registration; wait times in waiting room, in exam room, and at clinic; information about delays; comfort and pleasantness of waiting room and exam room [Russell, et al, 2015; Litvak, 2009; Villa, et al, 2009; Cassady‐Smith, et al, 2007]
Nurse/Assistant (n1‐n2) – friendliness, courtesy, concern of nurse/assistant [Russell, et al, 2015]
Care Provider (cp1‐cp10) ‐ friendliness, courtesy, concern of care provider; explanations, information, instructions, clear language; time with patient; patient confidence; recommend [Russell, et al, 2015]
Patient Safety and Health (i1‐i6) – cleanliness, safety, security, privacy, sensitivity to patient needs, pain control [Russell, et al, 2015]
23Nottingham, Q., Johnson, D.M., and Russell, R.S. (2017) Psychometric Attributes Impact on Patient Experience: Are There Differences Between Medical Clinics? presented at 48th Annual Meeting of Decision Sciences Institute, Washington, DC. Invited presentation.
Does service quality impact overall patient
satisfaction?
Does it vary by clinic type?
Does it vary by year?
Are there differences based on gender, age group, clinic type, or
physician?
Does waiting time have an impact?
24
Nottingham, Q., Johnson, D.M., and Russell, R.S. (2017) Psychometric Attributes Impact on Patient Experience: Are There Differences Between Medical Clinics? presented at 48th Annual Meeting of Decision Sciences Institute, Washington, DC. Invited presentation.
Johnson, D., Nottingham, Q., and Russell, R.(2018) Impact of Waiting Time on Patients’ Perception on Overall Care Quality, 2018 Production and Operations Management Society Annual Conference, Houston, TX.

9/4/2018
13
Descriptive statistics
ANOM for equality of means
Student’s t‐test
ANOVA F‐test
Tukey’s HSD
Contingency table analysis
Welch’s test
Pearson chi‐square test
Somers’ D
Multiple regression
Confirmatory factor analysis
Structural equation modeling
(SEM)
Logistic regression
Ordinal logistic regression
25
26Russell, R.S., Johnson, D.M., and White, S.W. (2015) “Patient perceptions of quality: analyzing patient satisfaction surveys,” International Journal of Operations and Production Management, Vol. 35. No. 8, pp. 1‐26.
9/4/2018
14
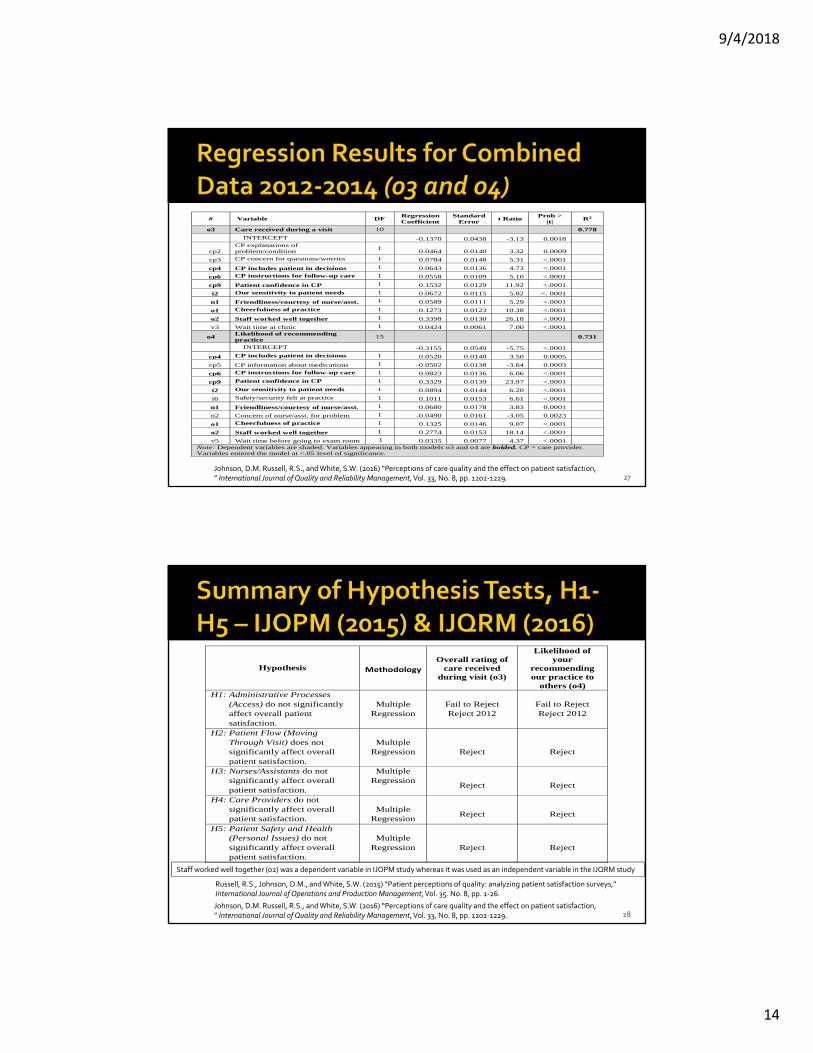
27
# Variable DF Regression Coefficient
Standard Error
t Ratio Prob >
|t| R2
o3 Care received during a visit 10 0.778 INTERCEPT -0.1370 0.0438 -3.13 0.0018
cp2 CP explanations of problem/condition
1 0.0464 0.0140 3.32 0.0009
cp3 CP concern for questions/worries 1 0.0784 0.0148 5.31 <.0001
cp4 CP includes patient in decisions 1 0.0643 0.0136 4.73 <.0001
cp6 CP instructions for follow-up care 1 0.0558 0.0109 5.10 <.0001
cp9 Patient confidence in CP 1 0.1532 0.0129 11.92 <.0001
i2 Our sensitivity to patient needs 1 0.0672 0.0115 5.82 <. 0001
n1 Friendliness/courtesy of nurse/asst. 1 0.0589 0.0111 5.29 <.0001
o1 Cheerfulness of practice 1 0.1273 0.0123 10.38 <.0001
o2 Staff worked well together 1 0.3398 0.0130 26.18 <.0001
v3 Wait time at clinic 1 0.0424 0.0061 7.00 <.0001
o4 Likelihood of recommending practice
15 0.731
INTERCEPT -0.3155 0.0549 -5.75 <.0001
cp4 CP includes patient in decisions 1 0.0520 0.0148 3.50 0.0005
cp5 CP information about medications 1 -0.0502 0.0138 -3.64 0.0003
cp6 CP instructions for follow-up care 1 0.0823 0.0136 6.06 <.0001
cp9 Patient confidence in CP 1 0.3329 0.0139 23.97 <.0001
i2 Our sensitivity to patient needs 1 0.0894 0.0144 6.20 <.0001
i6 Safety/security felt at practice 1 0.1011 0.0153 6.61 <.0001
n1 Friendliness/courtesy of nurse/asst. 1 0.0680 0.0178 3.83 0.0001
n2 Concern of nurse/asst. for problem 1 -0.0490 0.0161 -3.05 0.0023
o1 Cheerfulness of practice 1 0.1325 0.0146 9.07 <.0001
o2 Staff worked well together 1 0.2774 0.0153 18.14 <.0001
v5 Wait time before going to exam room 1 0.0335 0.0077 4.37 <.0001
Note: Dependent variables are shaded. Variables appearing in both models o3 and o4 are bolded. CP = care provider. Variables entered the model at <.05 level of significance.
Johnson, D.M. Russell, R.S., and White, S.W. (2016) “Perceptions of care quality and the effect on patient satisfaction,” International Journal of Quality and Reliability Management, Vol. 33, No. 8, pp. 1202‐1229.
28Johnson, D.M. Russell, R.S., and White, S.W. (2016) “Perceptions of care quality and the effect on patient satisfaction,” International Journal of Quality and Reliability Management, Vol. 33, No. 8, pp. 1202‐1229.
Hypothesis
Methodology
Overall rating of care received
during visit (o3)
Likelihood of your
recommending our practice to
others (o4) H1: Administrative Processes
(Access) do not significantly affect overall patient satisfaction.
Multiple
Regression
Fail to Reject Reject 2012
Fail to Reject Reject 2012
H2: Patient Flow (Moving Through Visit) does not significantly affect overall patient satisfaction.
Multiple
Regression
Reject
Reject
H3: Nurses/Assistants do not significantly affect overall patient satisfaction.
Multiple Regression
Reject
Reject
H4: Care Providers do not significantly affect overall patient satisfaction.
Multiple
Regression
Reject
Reject
H5: Patient Safety and Health (Personal Issues) do not significantly affect overall patient satisfaction.
Multiple
Regression
Reject
Reject
Russell, R.S., Johnson, D.M., and White, S.W. (2015) “Patient perceptions of quality: analyzing patient satisfaction surveys,” International Journal of Operations and Production Management, Vol. 35. No. 8, pp. 1‐26.
Staff worked well together (o2) was a dependent variable in IJOPM study whereas it was used as an independent variable in the IJQRM study
9/4/2018
15
29Johnson, D.M. Russell, R.S., and White, S.W. (2016) “Perceptions of care quality and the effect on patient satisfaction,” International Journal of Quality and Reliability Management, Vol. 33, No. 8, pp. 1202‐1229.
Russell, R.S., Johnson, D.M., and White, S.W. (2015) “Patient perceptions of quality: analyzing patient satisfaction surveys,” International Journal of Operations and Production Management, Vol. 35. No. 8, pp. 1‐26.
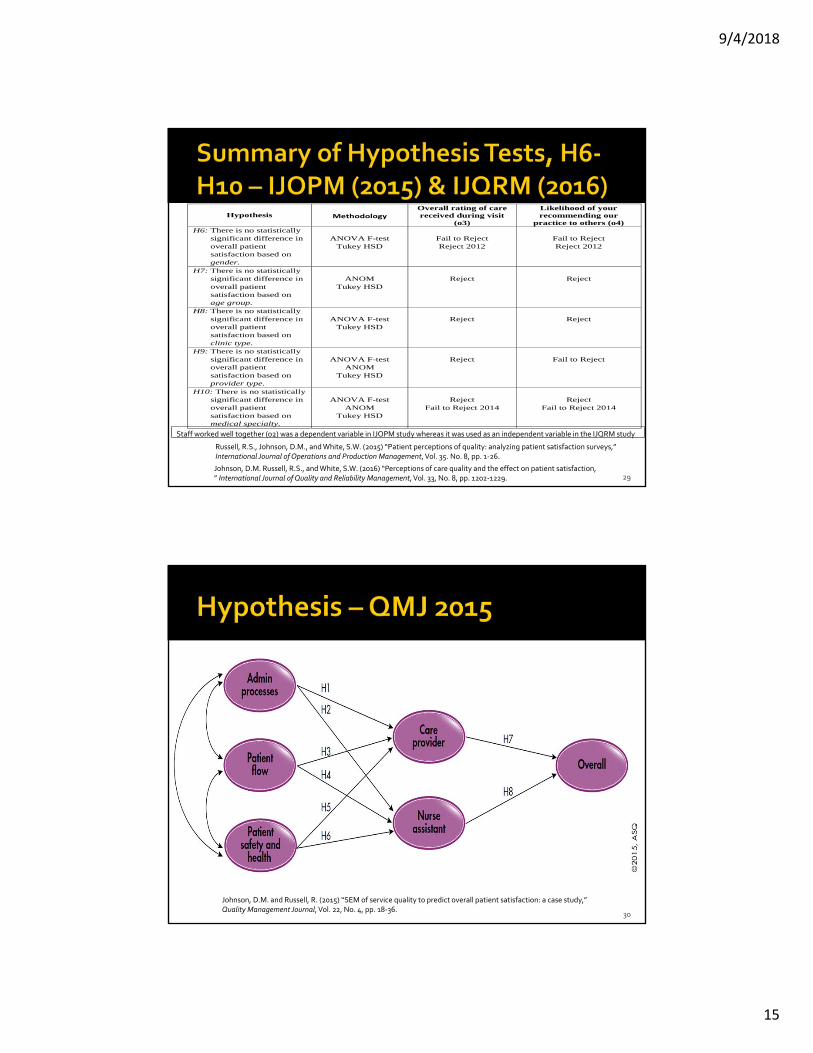
Hypothesis
Methodology Overall rating of care received during visit
(o3)
Likelihood of your recommending our
practice to others (o4) H6: There is no statistically
significant difference in overall patient satisfaction based on gender.
ANOVA F-test
Tukey HSD
Fail to Reject Reject 2012
Fail to Reject Reject 2012
H7: There is no statistically significant difference in overall patient satisfaction based on age group.
ANOM
Tukey HSD
Reject
Reject
H8: There is no statistically significant difference in overall patient satisfaction based on clinic type.
ANOVA F-test
Tukey HSD
Reject
Reject
H9: There is no statistically significant difference in overall patient satisfaction based on provider type.
ANOVA F-test
ANOM Tukey HSD
Reject
Fail to Reject
H10: There is no statistically significant difference in overall patient satisfaction based on medical specialty.
ANOVA F-test
ANOM Tukey HSD
Reject
Fail to Reject 2014
Reject
Fail to Reject 2014
Staff worked well together (o2) was a dependent variable in IJOPM study whereas it was used as an independent variable in the IJQRM study
30
Johnson, D.M. and Russell, R. (2015) “SEM of service quality to predict overall patient satisfaction: a case study,” Quality Management Journal, Vol. 22, No. 4, pp. 18‐36.

9/4/2018
16
31Johnson, D.M. and Russell, R. (2015) “SEM of service quality to predict overall patient satisfaction: a case study,” Quality Management Journal, Vol. 22, No. 4, pp. 18‐36.
32Johnson, D.M. and Russell, R. (2015) “SEM of service quality to predict overall patient satisfaction: a case study,” Quality Management Journal, Vol. 22, No. 4, pp. 18‐36.

9/4/2018
17
33Johnson, D.M. and Russell, R. (2015) “SEM of service quality to predict overall patient satisfaction: a case study,” Quality Management Journal, Vol. 22, No. 4, pp. 18‐36.
34
Nottingham, Q., Johnson, D.M., and Russell, R. (2018) “Multi‐year SEM model predicting the impact of behavior attributes on overall patient satisfaction, ” International Journal of Quality and Reliability Management, forthcoming.

9/4/2018
18
35
Path Standardized Regression Weights p Result
Administrative Process --> Care Provider -0.014 0.691 H1 is not supported
Administrative Process --> Nurse Assistant 0.226 *** H2 is supported
Patient Flow --> Care Provider 0.106 0.002 H3 is supported
Patient Flow --> Nurse Assistant 0.102 0.004 H4 is supported
Patient Safety and Health --> Care Provider 0.691 *** H5 is supported
Patient Safety and Health --> Nurse Assistant 0.529 *** H6 is supported
Care Provider -- > Overall 0.66 *** H7 is supported
Nurse Assistant --> Overall 0.331 *** H8 is supported
*** Indicates p < 0.001
Nottingham, Q., Johnson, D.M., and Russell, R. (2018) “Multi‐year SEM model predicting the impact of behavior attributes on overall patient satisfaction, ” International Journal of Quality and Reliability Management, forthcoming.
36
Baseline Comparisons
Model NFI RFI IFI TLI CFI
Delta1 rho1 Delta2 rho2
Default model 0.922 0.915 0.925 0.919 0.925
Saturated model 1 1 1
Independence model 0 0 0 0 0
RMSEA
0.069
Parsimony-Adjusted Measures
Model PRATIO PNFI PCFI
Default model 0.92 0.848 0.851
Saturated model 0 0 0
Independence model 1 0 0
Nottingham, Q., Johnson, D.M., and Russell, R. (2018) “Multi‐year SEM model predicting the impact of behavior attributes on overall patient satisfaction, ” International Journal of Quality and Reliability Management, forthcoming.

9/4/2018
19
37
Nottingham, Q., Johnson, D.M., and Russell, R.S. (2018) “Effect of waiting time on patient perceptions of care quality,” Quality Management Journal, Special Issue on Health Care Quality Management, Vol. 25, No. 1, pp. 1‐14.
Independent Variables (IV) Type
waitrm Time spent in the waiting room (self-reported) Continuous
gender Male / Female Nominal
v2 Degree to which you were informed about any delays Ordinal
v5 Length of wait before going to an exam room Ordinal
cp8 Amount of time the care provider spent with you Ordinal
Dependent Variables (DV)
o3 Overall rating of quality of care received during visit Ordinal
o4 Likelihood of your recommending our practice to others Ordinal
cp10 Likelihood of your recommending this care provider to others.
Ordinal
Control Variables (CV)
itclinic Medical clinic type Nominal
38
Nottingham, Q., Johnson, D.M., and Russell, R.S. (2018) “Effect of waiting time on patient perceptions of care quality,” Quality Management Journal, Special Issue on Health Care Quality Management, Vol. 25, No. 1, pp. 1‐14.
9/4/2018
20
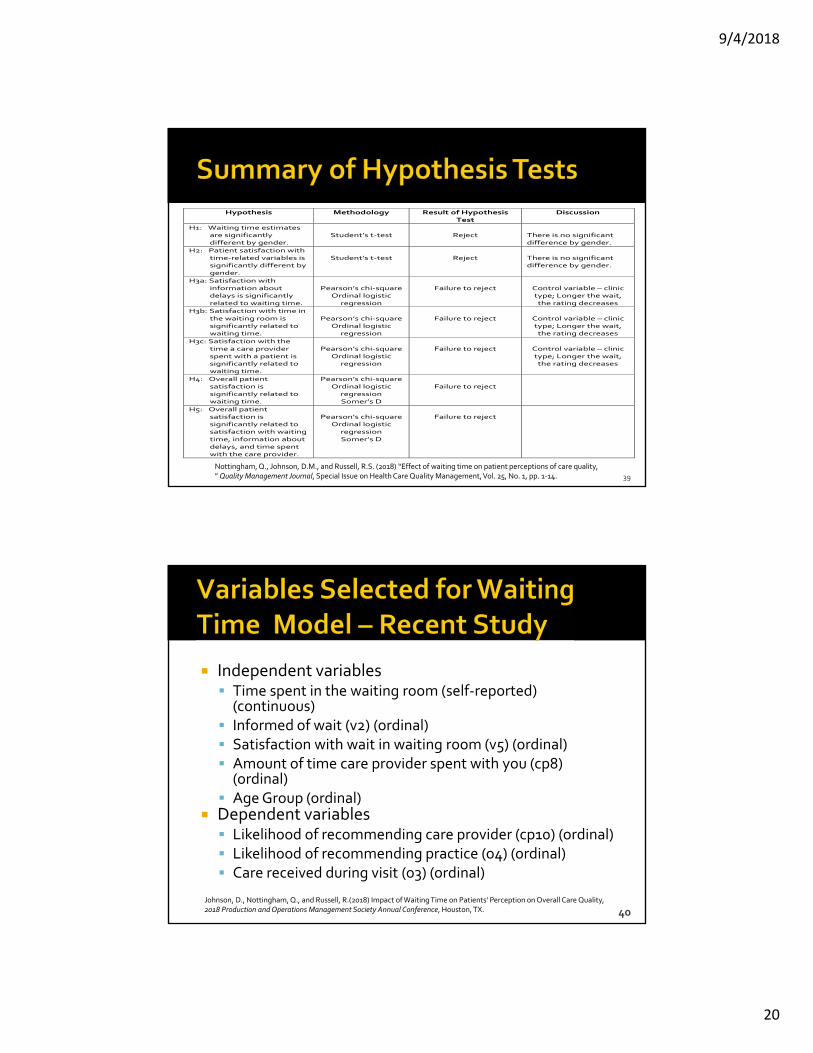
39
Hypothesis Methodology Result of Hypothesis Test
Discussion
H1: Waiting time estimates are significantly different by gender.
Student’s t‐test
Reject
There is no significant difference by gender.
H2: Patient satisfaction with time‐related variables is significantly different by gender.
Student’s t‐test
Reject
There is no significant difference by gender.
H3a: Satisfaction with information about delays is significantly related to waiting time.
Pearson’s chi‐square
Ordinal logistic regression
Failure to reject
Control variable – clinic type; Longer the wait, the rating decreases
H3b: Satisfaction with time in the waiting room is significantly related to waiting time.
Pearson’s chi‐square
Ordinal logistic regression
Failure to reject
Control variable – clinic type; Longer the wait, the rating decreases
H3c: Satisfaction with the time a care provider spent with a patient is significantly related to waiting time.
Pearson’s chi‐square
Ordinal logistic regression
Failure to reject
Control variable – clinic type; Longer the wait, the rating decreases
H4: Overall patient satisfaction is significantly related to waiting time.
Pearson’s chi‐square Ordinal logistic
regression Somer’s D
Failure to reject
H5: Overall patient satisfaction is significantly related to satisfaction with waiting time, information about delays, and time spent with the care provider.
Pearson’s chi‐square
Ordinal logistic regression Somer’s D
Failure to reject
Nottingham, Q., Johnson, D.M., and Russell, R.S. (2018) “Effect of waiting time on patient perceptions of care quality,” Quality Management Journal, Special Issue on Health Care Quality Management, Vol. 25, No. 1, pp. 1‐14.
Independent variables Time spent in the waiting room (self‐reported) (continuous)
Informed of wait (v2) (ordinal) Satisfaction with wait in waiting room (v5) (ordinal) Amount of time care provider spent with you (cp8) (ordinal)
Age Group (ordinal) Dependent variables Likelihood of recommending care provider (cp10) (ordinal) Likelihood of recommending practice (o4) (ordinal) Care received during visit (o3) (ordinal)
40Johnson, D., Nottingham, Q., and Russell, R.(2018) Impact of Waiting Time on Patients’ Perception on Overall Care Quality, 2018 Production and Operations Management Society Annual Conference, Houston, TX.

9/4/2018
21
41
PatientDemographics
• Age Group
Waiting Time
• Estimate of time in waiting room (waitrm)
Satisfaction with time‐related variables
• Satisfaction with information about delays (v2)• Satisfaction with time in waiting room (v5)• Satisfaction with time care provider spent with you
(cp8)
Overall Satisfaction
• Likelihood of recommending care provide (cp10)• Likelihood of recommending practice (o4)• Overall satisfaction with quality of care(o3)
H1
H2
H3
H4
Johnson, D., Nottingham, Q., and Russell, R.(2018) Impact of Waiting Time on Patients’ Perception on Overall Care Quality, 2018 Production and Operations Management Society Annual Conference, Houston, TX.
42Johnson, D., Nottingham, Q., and Russell, R.(2018) Impact of Waiting Time on Patients’ Perception on Overall Care Quality, 2018 Production and Operations Management Society Annual Conference, Houston, TX.
Hypothesis Methodology Result of Hypothesis Test/Discussion
H1: Waiting time estimates are significantly different by age group.
Tukey’s HSD
Fail to reject There is a significant different between 75+
and 55‐64 and 65‐74. Reject
There is no significant different for patients under 75.
H2: Patient satisfaction with time‐related variables is significantly different by age group.
Ordinal Logistic
Regression
Reject Satisfaction with time care provider spent with you (cp8): No significant difference
between age groups Fail to reject
Satisfaction with information about delays (v5): Only significant difference between
patients of ages 55‐64 and 65‐74. Fail to reject
Satisfaction with waiting time (v2): Significant difference between patients of ages 35‐44 & 45‐54; significant difference between patients of ages 55‐64 & 65‐74.
H3: Satisfaction with time‐related variables is significantly related to wait time.
Ordinal Logistic
Regression Pearson’s Chi
Square
Fail to reject The variable “time spent in the waiting
room” is not significant in predicting overall patient satisfaction (03, 04, and cp10). Time‐related variables play a bigger role than in predicting overall patient satisfaction than
”time spent in the waiting room.”
H4: Overall patient satisfaction is significantly related to satisfaction with waiting time, information about delays, and time spent with the care provider.
Ordinal Logistic
Regression Contingency Table Analysis Somer’s D
Fail to reject The variable “time spent in the waiting
room” is not significant in predicting overall patient satisfaction (03, 04, and cp10).
Therefore, the time‐related variables play a bigger role than in predicting overall patient satisfaction than ”time spent in the waiting
room.”

9/4/2018
22
Individual questions versus factors and difference in models Administrative process had no to minimal impact on overall
patient satisfaction in all models in single and multi‐years; as individual variables or as a latent variable.
When using SEM, demographic variables as moderators uncovered no relationships. Similar regression weights for SEM models between 2012 and consolidated models. Patient safety and health psychometric variables had greatest weights through mediators affecting overall patient satisfaction.
Express Care and OBGYN poorer scores Smaller clinics and smaller medical clinic types proved to have
higher patient satisfaction. When using multi year data, there were more differences
found between different clinic types (see slide 29 psychometric)
43
In all waiting time related models gender did not impact overall patient satisfaction. When waiting time was factored in, differences were uncovered indicating males were less tolerant of delays and did impact satisfaction. This was uncovered when post‐hoc analysis occurred using probability grids. Evidence in prior studies had indicated gender differences (Abro and Jalbani, 2012: Qin et al., 2017)
In all models, there were statistically significant differences in agewith more favorable impressions from older age groups (Over 55).
The longer patients waited in the waiting room with the presence of medical clinic as a control variable, the rating given decreases.
In the waiting time related models, although some of the relationships changed along with gender and age analyzed individually, there was no difference in outcomes as no new statistically significant relationships were found.
When age and gender were analyzed simultaneously in time related models, there were no additional findings.
44
9/4/2018
23
Change in ownership and executive management impeded the continuous improvement and enhanced management decision making that was initially intended.
Additional analytics beyond what the survey vendor provided in the way of summary reports.
Previous studies had mixed results in evaluating the effect of waiting time on patient satisfaction. This study uncovered some nuances in the relationship.
Waiting time affects patient referrals of the practice more than that of the care provider.
Average times are not sufficient in evaluating the effect of waiting; a distribution of times produces better results.
45
Initial studies used the null hypothesis and later studies used the alternate hypothesis – caution in analysis.
Survey biases and nonrespondents Lowest average for a question was 4.5 out of 5.0 Mail survey impacts response rate in certain age groups
Women and older patients tend to respond to surveys at a higher rate
Rural population Competition Generalizability
46
9/4/2018
24
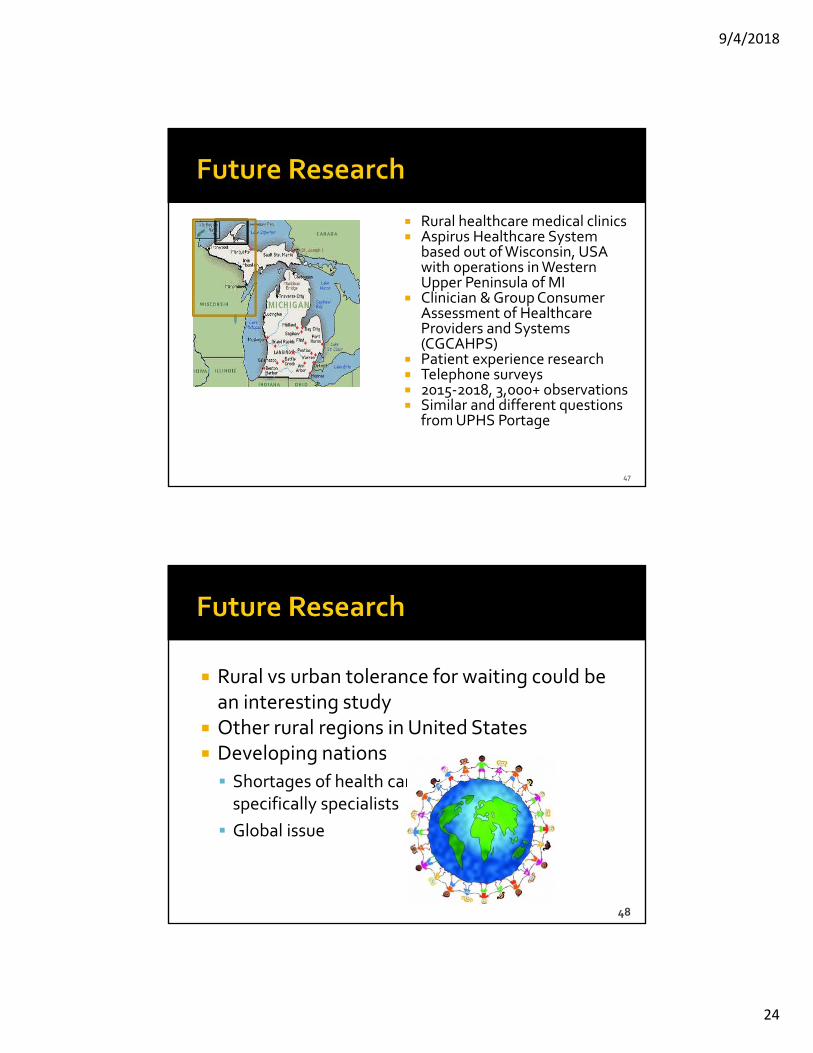
Rural healthcare medical clinics Aspirus Healthcare System
based out of Wisconsin, USA with operations in Western Upper Peninsula of MI
Clinician & Group Consumer Assessment of Healthcare Providers and Systems (CGCAHPS)
Patient experience research Telephone surveys 2015‐2018, 3,000+ observations Similar and different questions
from UPHS Portage
47
Rural vs urban tolerance for waiting could be an interesting study
Other rural regions in United States Developing nations
Shortages of health care professionals –specifically specialists
Global issue
48

9/4/2018
25
We are grateful to Portage Health and Press Ganey for
providing us with access to their survey results and
allowing us to extend the work already completed by Press
Ganey. We would like to thank the following individuals:
James Bogan, U.P. Health Systems Regional President;
Elizabeth MacInnes, Vice President‐Quality Management
and Lisa Kaarto, both from U.P. Health Systems ‐ Portage
49
50

9/4/2018
26
Abro, Z . And A. A. Jalbani. 2012. Health care facilities and patients’ satisfaction: a case study of Civil Hospital Karachi.Intedisciplinary Journal of Contemporary Research in Business. Vol 4, No. 1, p. 781.
Alijani, G. S., O. Kwun, A. Omar, and J. Williams. 2015. The effect of emergency waiting time on patient satisfaction. Journal of Management Information and Decision Sciences, 18, no. 2: 1‐16.
Ancarani, A., Di Mauro, C., and Giammanco, M.D. (2011) "Patient satisfaction, managers' climate orientation and organizational climate," International Journal of Operations & Production Management, Vol. 31, No. 3, pp. 224 – 250.
Badri, M. A. and Attia, S. (2008), "Testing not‐so‐obvious models of healthcare quality," International Journal of Health Care Quality Assurance, Vol. 21, No. 2, pp. 159‐174.
Baker, C., Akgün, H.S. and Al Assaf, A.F. (2008), “The role of expectations in patient assessments of hospital care: an example from a university hospital network, Turkey”, International Journal of Health Care Quality Assurance,Vol. 21 No. 4, pp. 343‐55.
Bielen, F. and N. Demoulin. 2007. Waiting time influence on the satisfaction‐loyalty relationships in services. Managing Service Quality, 17, no. 2: 174‐193.
Bowling, A., Rowe, G. and McKee, M. (2013), “Patients’ experiences of their healthcare in relation to their expectations and satisfaction: a population survey”, Journal of the Royal Society of Medicine, Vol. 106, No. 4, pp. 143‐149.
Brady, M.K. and Cronin, J.J. Jr (2001), "Some new thoughts on conceptualizing perceived service quality: a hierarchical approach," Journal of Marketing, Vol. 65, pp. 34‐49.
Büyüközkan, G., Çifçi, G., and Guleryuz, S. (2011), “Strategic analysis of healthcare service quality using fuzzy AHP methodology,” Expert Systems Applications, Vol. 38, No. 8, pp. 9407‐9424.
Camacho, F., R. Anderson, A. Safrit, A.S. Jones, and P. Hoffman. 2006. The relationship between patient’s perceived waiting time and office‐based practice satisfaction. North Carolina Medical Journal, 67, no. 6: 409‐413.
Carman, J.M. (2000), “Patient perception of service quality: combining the dimensions,” Journal of Management in Medicine, Vol. 14, No. 4, 337‐352.
Carter, R.E., Lonial, S.C., and Raju, P.S. (2010), “Impact of quality management on hospital performance: an empirical examination,” Quality Management Journal, Vol. 17, No. 4, pp. 8‐24.
Cassidy‐Smith, T.N., Baumann B.M., and Boudreaux, E.D. (2007), “The disconfirmation paradigm: throughput times and emergency department patient satisfaction,” Journal of Emergency Medicine,Vol. 32, No. 1, pp. 7‐13.
51
Cengiz, E. and Kirkbir, F. (2007), “Customer perceived value: the development of a multiple item scale in hospitals,” Problems and Perspectives in Management, Vol. 5, no. 3, pp. 252‐265.
Center for Medicaid and Medicare Services, National Health Expenditures, https://www.cms.gov/research‐statistics‐data‐and‐systems/statistics‐trends‐and‐reports/nationalhealthexpenddata/nationalhealthaccountshistorical.html, accessed 2/23/2017
Choi, K.S., W.H. Cho, S. Lee, H. Lee, and C. Kim (2004), "The relationships among quality, value, satisfaction and behavioralintention in health care provider choice: A South Korean study," Journal of Business Research, Vol. 57, pp. 913‐21.
Dagger, T.S., J.C. Sweeney, and L.W. Johnson (2007), "A hierarchical model of health service quality: scale development and investigation of an integrated model," Journal of Service Research, 10 (2), 123‐42.
Delnoij, D.M.J, ten Asbroek, G., Arah, O.A., de Koning, J.S., Stam, P., Pol, A., Vriens, B., Schmidt. P., and Klazinga, N.S. (2006),“Made in the USA: the import of American Consumer Assessment of Health Plan Surveys (CAHPS®) into the Dutch social insurance system,” European Journal of Public Health, Vol. 16, No. 6, 652–659.
Eilers, G.M. 2004. Improving patient satisfaction with waiting time. Journal of American College Health 53, no. 1: 41‐43. Ferrand, Y.B., Siemens, J., Weathers, D., Fredendall, L.D., Choi, Y., Pirrallo, R.G., and Binter, M. (2016), “Patient satisfaction with
healthcare services: a critical review,” Quality Management Journal, Vol. 23, Iss. 4, pp. 6‐22. Fisk, R. P., Brown, S. W., & Bitner, M. J. (1993). Tracking the evolution of the services marketing literature. Journal of Retailing, 69(1),
61‐103 Hendriks, M. Spreeuwenberg, P., Rademakers, J., and Delnoij, D. (2009), “Dutch healthcare reform: did it result in performance
improvement of health plans? A comparison of consumer experiences over time,” BMC Health Services Research, Vol. 9, No. 1, pp. 167‐175.
Hensley, R.L. and J. Sulek. 2007. Customer satisfaction with waits in multi‐stage services.Managing Service Quality 17, no. 2: 152‐173.
Hill, C.J. and K. Joonas. 2005. The impact of unacceptable wait time on health care patients’ attitudes and actions. Health Marketing Quarterly, 23, no. 2: 69‐87.
Johnson, D.M. and Russell, R.S. (2015), “SEM of service quality to predict overall patient satisfaction in medical clinics: a case study,” Quality Management Journal, 22(4), pp. 18‐36
52
9/4/2018
27
Kilbourne, W.E., J.A. Duffy, M. Duffy, and G. Giarchi (2004), “The applicability of SERVQUAL in cross‐national measurements of health care,” Journal of Services Marketing, 18(7), 524‐533
Kupfer, J.M. and Bond, E.U. (2012), “Patient satisfaction and patient‐centered care, necessary but not equal”, Journal of the American Medical Association, Vol. 308, No. 2, pp.139‐140.
Litvak, E. (Ed.) (2009), Managing Patient Flow in Hospitals: Strategies and Solutions, 2nd ed., Joint Commission Resources, Oakbrook Terrace, IL.
Mann, R.K., Siddiqui, Z., Kurbanova, N., and Qayyum, R. (2016), “Effect of HCAHPS® reporting on patient satisfaction with physician communication,” Journal of Hospital Medicine, Vol. 11, No. 2, pp. 105‐110.
Marley, K., Collier, D., and Goldstein, S. (2004), “The role of clinical and process quality in achieving patient satisfaction in hospitals,” Decision Sciences, Vol. 35, No. 3, pp. 349‐369.
McDougall, G.H.G. and T.J. Levesque (1994), "A revised view of service quality dimensions: an empirical investigation," Journal of Professional Services Marketing, 11 (1), 189‐209.
McMullen, M. and P.A. Netland. 2013. Wait time as a driver of overall patient satisfaction in an ophthalmology clinic. Clinical Ophthalmology 7: 1655‐1660.
Murdick, R.G., Render, B. and Russell, R.S. (1990), Service Operations Management, Allyn and Bacon, Boston, MA. Nash, I.S. (2015), “Why physicians hate “patient satisfaction” but shouldn't,” Annals of Internal Medicine, Vol. 163, No.
10, pp. 792‐793. Panchapakesan, P., Sai, L.P. and Rajendran, C. (2015), “Customer satisfaction in Indian hospitals: moderators and
mediators,” Quality Management Journal, Vol. 22, No. 1, pp. 10‐29. Parasuraman, A., V.A. Zeithaml, and Barry, L.L. (1985), "A conceptual model of service quality and its implications for
future research," Journal of Marketing, Vol. 49, 41‐50. Press Ganey Associates, Inc. 2009. Keeping me waiting: medical practice wait time and patient satisfaction. Pulse
report 2009: medical practice‐patient perspectives on American health care. Price, R.A., Elliott, M.N., Zaslavsky, A.M., hays, R.D., Lehrman, W.G., Rybowski, L., Edgman‐Levitan, S., and Clearly,
P.D. (2014) “Examining the role of patient experience surveys in measuring healthcare quality,” Medical Care Research and Review, Vol. 71, No. 5, pp. 522‐554.
Qin, H., K. Boonme, B. George, and V. Prybutok. 2017. The moderating effect of gender in urgent care service satisfaction. Quality Management Journal. Vol. 24, No. 3, pp. 20‐30.
53
Russell, R.S., D.M. Johnson, and S.W. White. 2015. Patient perceptions of quality: analyzing patient satisfaction surveys. International Journal of Operations & Production Management, 35, no. 8: 1158‐1181.
Schulingkamp, R.C. and Latham, J.R. (2015), “Healthcare performance excellence: a comparison of Baldrige award recipients andcompetitors,” Quality Management Journal, Vol. 22, No. 3, pp. 6‐22.
Scotti, D., Harmon, J., Behson, S., Messina, D. (2007), “Links among high‐performance work environment, service quality and customer satisfaction: An extension to the healthcare sector,” Journal of Healthcare Management, Vol. 52, No. 2, pp. 109‐124.
Soares, A.M. and M. Farhangmehr. 2015. Understanding patient satisfaction in a hospital emergency department. International Review on Public and Nonprofit Marketing, 12: 1‐15.
Soteriou, A.C. and Chase, R.B. (2000), "A robust optimization approach for improving service quality," Manufacturing & Service Operations Management, Vol. 2, No. 3, 264‐86.
Suhonen, R., Papastavrou, E., Efstathiou, G., Tsangari, H., Jarosova, D., Leino‐Kilpi, H, Patiraki, E., Karlou, C., Balogh, Z., and Merkouris, A. (2012), “Patient satisfaction as an outcome of individualised nursing care,” Scandinavian Journal of Caring Sciences, Vol. 26, No. 2, pp. 372‐380.
Tefera, L., Lehrman, W.G., and Conway, P. (2016), “Measurement of the patient experience: clarifying facts, myths, and approaches”, Journal of the American Medical Association, Vol. 315, No. 20, pp. 2167‐2168.
Tucker, J.L. (2002), "The moderators of patient satisfaction," Journal of Management in Medicine, 16 (1), 48‐66. Venkataraman, S., (2015), “Cost‐quality tradeoff in healthcare: does it affect patient experience?” Quality Management Journal,
Vol. 22, No. 3, pp. 38‐45.Villa, S., Barbieri, M., and Lega, F. (2009). “Restructuring patient flow logistics around patient care needs: implications and practicalities from three critical cases,” Health Care Management Science, Vol. 12, No. 2, pp. 155‐165.
Villa, S., Barbieri, M., and Lega, F. (2009). “Restructuring patient flow logistics around patient care needs: implications and practicalities from three critical cases,” Health Care Management Science, Vol. 12, No. 2, pp. 155‐165.
Wiig, S, Storm, M., Aase, K., Gjestsen, T., Solheim, M., Harthug, S, Roberts, G., Fulop, N. and QUASER team (2013), “Investigating the use of patient involvement and patient experience in quality improvement in Norway: rhetoric or reality?”, BMC Health Service Research, 13, 1‐13.
Wu, W.Y., S.W. Hsiao, and H.P. Kuo (2004), "Fuzzy set theory based decision model for determining market position and developingstrategy for hospital service quality," Total Quality Management, 15 (4), 439‐56.
54
9/4/2018
28
Johnson, D., Nottingham, Q., and Russell, R.(2018) Impact of Waiting Time on Patients’ Perception on Overall Care Quality, 2018 Production and Operations Management Society Annual Conference, Houston, TX.
Nottingham, Q., Johnson, D.M., and Russell, R.S. (2017) Psychometric Attributes Impact on Patient Experience: Are There Differences Between Medical Clinics? presented at 48th Annual Meeting of Decision Sciences Institute, Washington, DC. Invited presentation.
Nottingham, Q., Johnson, D.M., and Russell, R.S. (2017) Multi‐Year Model Predicting Patient Satisfaction Based on Wait Time, presented at 2017 Production and Operations Management Society Conference, Seattle, WA. Invited presentation.
Johnson, D.M., Russell, R., and Nottingham, Q. (2016) Multi‐Year SEM Model Predicting the Impact of Behavior Attributes on Overall Patient Satisfaction, presented at Production and Operations Management Society Conference, Orlando, FL. Invited presentation.
White, S., Russell, R., and Johnson, D.M. (2016) A Decision Support System Analyzing Patient Satisfaction Surveys, presented at Production and Operations Management Society Conference, Orlando, FL.
Johnson, D.M., Russell, R., and White, S. (2015) Multi‐Year Multivariate Modeling of Service Quality and Patient Satisfaction, presented at Production and Operations Management Society, Washington, DC.
Johnson, D.M., Russell, R., and White, S. (2014) Modeling Healthcare Service Quality to Predict Patient Satisfaction: A Case Study, presented at Decision Sciences Institute Conference, Tampa, FL.
Johnson, D.M., Russell, R., and White, S. (2014) Analyzing Patient Satisfaction Surveys for Process Improvement, presented at 2014 Production and Operations Management Society (POMS) Conference, Atlanta, GA.
Johnson, D.M. and Russell, R. (2013) Patient perceptions of quality, presented at 2013 Production and Operations Management Society (POMS) Conference, Denver, CO.
55
Nottingham, Q., Johnson, D.M., and Russell, R. (2018) “Multi‐year SEM model predicting the impact of behavior attributes on overall patient satisfaction,” International Journal of Quality and Reliability Management, forthcoming.
Nottingham, Q., Johnson, D.M., and Russell, R.S. (2018) “Effect of waiting time on patient perceptions of care quality,” Quality Management Journal, Special Issue on Health Care Quality Management, Vol. 25, No. 1, pp. 1‐14.
Johnson, D.M. Russell, R.S., and White, S.W. (2016) “Perceptions of care quality and the effect on patient satisfaction,” International Journal of Quality and Reliability Management, Vol. 33, No. 8, pp. 1202‐1229.
Johnson, D.M. and Russell, R. (2015) “SEM of service quality to predict overall patient satisfaction: a case study,” Quality Management Journal, Vol. 22, No. 4, pp. 18‐36. 2016 ASQ Gryna Award for the largest single contribution to the extension of understanding and knowledge of the philosophy, principles, or methods of quality management.
Russell, R.S., Johnson, D.M., and White, S.W. (2015) “Patient perceptions of quality: analyzing patient satisfaction surveys,” International Journal of Operations and Production Management, Vol. 35. No. 8, pp. 1‐26.
56