Dr. Awad S. Hanna - PINP · productivity losses related to change orders, acceleration and...
18
Professor, Chair of Construction Engineering and Management Program University of Wisconsin- Madison Professor, Chair of Construction Engineering and Management Program University of Wisconsin- Madison Dr. Awad S. Hanna Dr. Awad S. Hanna
Transcript of Dr. Awad S. Hanna - PINP · productivity losses related to change orders, acceleration and...

Professor, Chair of Construction Engineering and Management ProgramUniversity of Wisconsin-Madison
Professor, Chair of Construction Engineering and Management ProgramUniversity of Wisconsin-Madison
Dr. Awad S. HannaDr. Awad S. Hanna

PLANNED PLANNED SCHEDULE SCHEDULE COMPRESSIONCOMPRESSION

BiographyBiographyAwad S. Hanna, Ph.D., P.E
Awad S. Hanna is a professor and chair of the construction engineering and management program at the University of Wisconsin-Madison, department of Civil and Environmental Engineering. Dr.Hanna holds M. S. and Ph.D. degrees from Penn State University and he is a register professional engineer in the U S and Canada. Awad has been an active construction practitioner, educator and researcher for over 30 years. He has taught construction management courses at Penn State University, Memorial University, Canada, and University of Wisconsin-Madison. Dr. Hanna has conducted several research projects for the New Horizon Foundation and the Electrical Contracting Foundation including landmark studies on the cumulative impact of change orders on electrical/mechanical labor productivity, schedule compression and acceleration, impact of stacking of trades on labor productivity, performance evaluation for electrical supervisors, and craftsmen, and productivity factors in electrical construction. Dr. Hanna has conducted research for other national organizations including the National Highway Research Program, and the Mechanical Contracting Foundation, and the Construction Industry Institute. Dr. Hanna has taught more than 300 successful seminars and workshops in more than 35 states on topics such as change orders impacts, project scheduling, estimating, labor productivity, construction delay claims.
Dr. Hanna is also a national consultant representing and assisting many contractors and owners in productivity losses related to change orders, acceleration and compression, delay, and trade stacking.
Awad S. Hanna, Ph.D., P.EAwad S. Hanna is a professor and chair of the construction engineering and management program at the University of Wisconsin-Madison, department of Civil and Environmental Engineering. Dr.Hanna holds M. S. and Ph.D. degrees from Penn State University and he is a register professional engineer in the U S and Canada. Awad has been an active construction practitioner, educator and researcher for over 30 years. He has taught construction management courses at Penn State University, Memorial University, Canada, and University of Wisconsin-Madison. Dr. Hanna has conducted several research projects for the New Horizon Foundation and the Electrical Contracting Foundation including landmark studies on the cumulative impact of change orders on electrical/mechanical labor productivity, schedule compression and acceleration, impact of stacking of trades on labor productivity, performance evaluation for electrical supervisors, and craftsmen, and productivity factors in electrical construction. Dr. Hanna has conducted research for other national organizations including the National Highway Research Program, and the Mechanical Contracting Foundation, and the Construction Industry Institute. Dr. Hanna has taught more than 300 successful seminars and workshops in more than 35 states on topics such as change orders impacts, project scheduling, estimating, labor productivity, construction delay claims.
Dr. Hanna is also a national consultant representing and assisting many contractors and owners in productivity losses related to change orders, acceleration and compression, delay, and trade stacking.

Face ChallengesFace Challenges
* Declining Productivity and Profit* Increased demand on accelerated
schedule
* Declining Productivity and Profit* Increased demand on accelerated
schedule

Productivity GapProductivity Gap

Profitability is Declining in ConstructionProfitability is Declining in Construction

Old New Old New Old New Old New Old New Old New Old New Old New1000 * 14 * * * 12 * * 17 * * N/A 30 * *2000 * 18 * * * 15 * * 19 * * N/A 34 * *4000 30 23 6 10 29 20 5 10 21 21 5 11 41 39 10 96000 38 27 7 13 36 24 6 13 26 22 * 15 52 42 11 98000 45 30 8 15 43 26 7 15 31 24 * 18 62 45 12 1010000 52 32 9 18 49 29 8 18 36 24 7 20 70 47 13 1012000 58 35 10 20 54 31 * 20 40 25 * 23 78 48 * 1114000 63 37 11 21 59 33 * 22 43 26 9 25 85 50 * 1116000 68 39 12 23 64 35 * 24 46 26 * 28 92 51 17 1218000 73 40 13 25 68 36 * 26 49 27 * 30 98 52 * 1320000 78 42 14 27 72 38 12 27 52 27 11 32 104 54 20 1422000 82 43 15 28 76 39 * 29 55 28 * 34 110 55 * 1524000 86 45 16 30 80 41 * 31 58 28 * 36 115 56 23 1626000 90 46 17 31 84 42 * 32 61 29 13 38 120 56 * 1728000 94 48 18 33 88 43 * 34 64 29 * 40 125 57 * 1930000 98 49 19 34 92 45 16 35 67 29 15 42 130 58 26 2035000 106 52 * 37 100 47 18 39 72 30 17 46 143 60 29 2440000 114 54 24 40 107 50 20 42 77 31 19 51 155 62 32 2845000 122 57 * 43 114 52 22 46 82 31 21 55 166 63 35 3350000 130 59 29 46 121 54 24 49 87 32 23 59 176 64 38 3855000 138 61 * 49 128 57 26 52 92 32 25 62 186 66 41 4360000 146 63 34 51 135 59 28 55 97 33 27 66 195 67 44 5065000 153 65 * 54 142 60 30 57 102 33 * 70 204 68 47 5670000 160 67 39 56 149 62 32 60 107 34 * 73 213 69 50 6475000 167 69 * 59 155 64 34 63 112 34 * 76 222 70 * 7180000 173 71 44 61 160 66 36 65 116 35 * 80 230 71 56 8085000 179 72 * 63 165 67 38 68 120 35 * 83 238 71 * 8890000 185 74 49 65 170 69 40 70 124 35 * 86 246 72 62 9795000 190 75 * 68 175 70 42 73 128 36 * 89 253 73 * 107
100000 195 77 54 70 180 72 44 75 132 36 * 92 260 74 68 117
DurationPeakProject
Size (Manhours)
Duration Peak PeakIndustry Average Commercial Industrial Institutional
Duration Peak Duration
Normal Project Duration: Comparison Table (Hanna, 2002)
Normal Project Duration: Comparison Table (Hanna, 2002)
©

Schedule CompressionSchedule Compression
”A reduction from the normal experienced time or optimal time typical for the type and size of project being planned within a given set of circumstance” (CII 1990)
”A reduction from the normal experienced time or optimal time typical for the type and size of project being planned within a given set of circumstance” (CII 1990)

Schedule Compression & Acceleration
Schedule Compression & Acceleration
Compressed Time
C
A
B
Compressed Work HoursOriginally Planned Work HoursCompressed Work Hours With Inefficiencies
Time
Man
-hou
rs
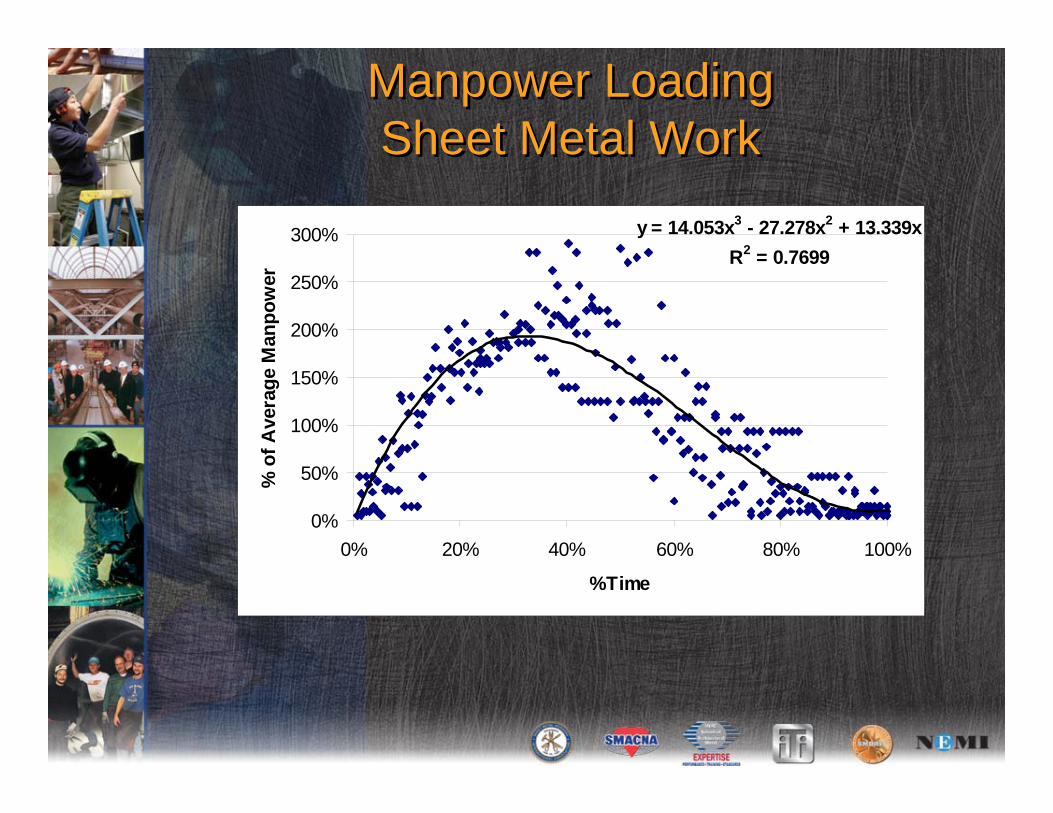
Manpower LoadingSheet Metal Work
Manpower LoadingSheet Metal Work
C y = 14.053x3 - 27.278x2 + 13.339xR2 = 0.7699
0%
50%
100%
150%
200%
250%
300%
0% 20% 40% 60% 80% 100%
%Time
% o
f Ave
rage
Man
pow
er
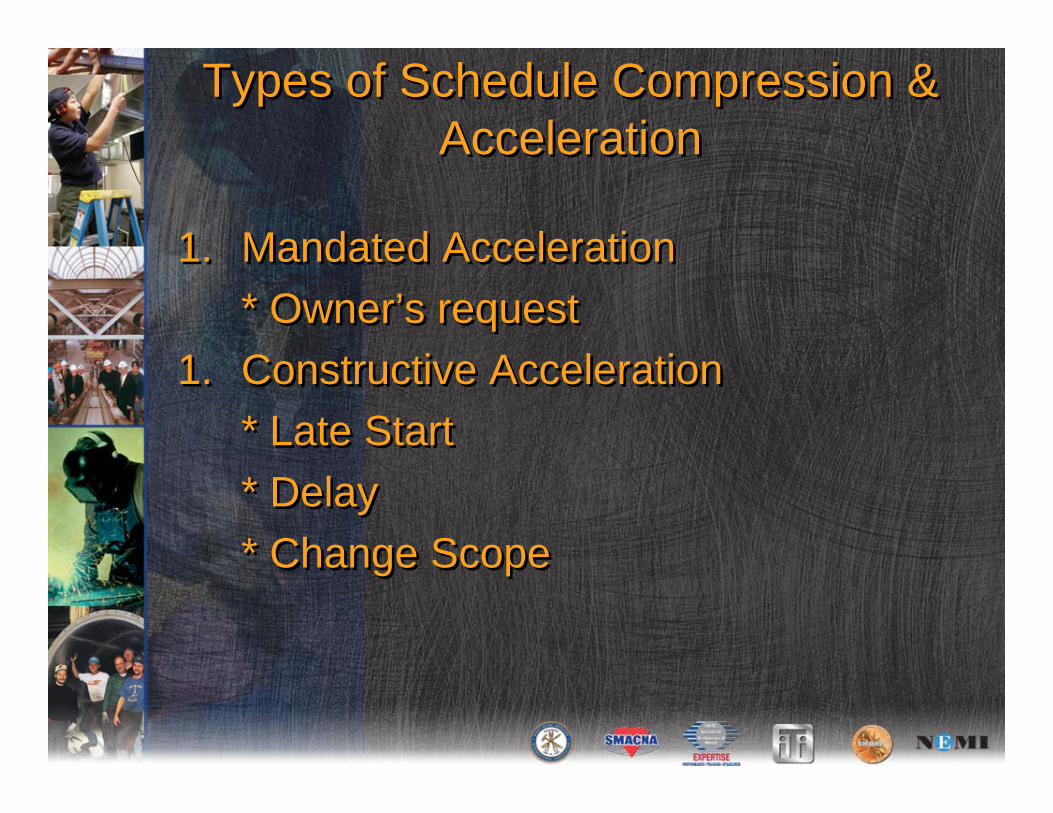
Types of Schedule Compression & Acceleration
Types of Schedule Compression & Acceleration
1. Mandated Acceleration* Owner’s request
1. Constructive Acceleration* Late Start* Delay* Change Scope
1. Mandated Acceleration* Owner’s request
1. Constructive Acceleration* Late Start* Delay* Change Scope

Cc
Cn
Tc Tn
Additional cost due to inefficiency
Additional costto compress schedule
Cost
Duration
Why Schedule Compression is a Problem
C c: Cost at crashingC n: Cost at normalT c: Time at crashingT n: Time at normal

Overtime Impact (Hanna, 2006)Overtime Impact (Hanna, 2006)
Compressed Time
C
A
B
Time
0%
5%
10%
15%
20%
25%
30%
0% 5% 10% 15% 20% 25% 30% 35% 40% 45% 50%
% Over Time
Prod
uctiv
ity L
oss

1. Effect of OvertimeEffect of overtime on Productivity 50- and 60- Hour
Work-Weeks
1. Effect of OvertimeEffect of overtime on Productivity 50- and 60- Hour
Work-Weeks
1.1
1.05
0.95
1
0.9
0.85
0.8
0.75
0.65
0.7
0.55
0.6
0.5
1 2 3 4 5 6 7 8 9 10 11 12 13 14
Prod
uctiv
ity
Weeks
60 Hour Week
50 Hour Week
Figure is based on information from Scheduled Overtime Effect on Construction Projects, The Business Roundtable(1980)

1. Effect of Overtime (Cont.)Scheduled Overtime:
1. Effect of Overtime (Cont.)Scheduled Overtime:
Productivity Rate Actual Hour Hours GainedNumber of Output Over 40 HoursOvertime 40 Hour 50 Hour 60 Hour 50 Hour 60 Hour 50 Hour 60
Hour Work Weeks Week Week Week Week Week Week
Week
1-2 1.00 0.926 0.90 46.3 54.0 6.3 14.03-4 1.00 0.90 0.86 45.0 51.6 5.0 11.65-6 1.00 0.87 0.80 43.5 48.0 3.5 8.07-8 1.00 0.80 0.71 40.0 42.6 0.0 2.69-10 1.00 0.752 0.66 37.6 39.6 -2.4 -0.411 & up 1.00 0.75 36 -2.50
Scheduled Overtime Productivity Decreases in Terms of Hours per Week for 50 and 60-Hour Weeks (The Business Roundtable 1980)

AP: Actual Manpower at Peak
0%
5%
10%
15%
20%
25%
30%
35%
40%
45%
1.7 1.9 2.1 2.3 2.5 2.7 2.9 3.1 3.3 3.5 3.7
Peak over Average Ratio
Prod
uctiv
ity L
oss
AP:50AP:40AP:30AP:20AP:10AP:5
AP: Actual Manpower at Peak
0%
5%
10%
15%
20%
25%
30%
35%
40%
45%
1.7 1.9 2.1 2.3 2.5 2.7 2.9 3.1 3.3 3.5 3.7
Peak over Average Ratio
Prod
uctiv
ity L
oss
AP:50AP:40AP:30AP:20AP:10AP:5
Applicable Range• Peak/Avg. Ratio
: 1.7~3.8• Actual Peak
: 4 ~ 50• Project Size
: 700 ~208,000 Manhrs
Overmanning Impact (Hanna, 2006)

Shift Work Impact (Hanna, 2006)
-0.15
-0.1
-0.05
0
0.05
0.1
0.15
0.2
0% 5% 10% 15% 20% 25% 30% 35% 40% 45% 50%
% Shift Work
Effi
cien
cy L
oss
-0.15
-0.1
-0.05
0
0.05
0.1
0.15
0.2
0% 5% 10% 15% 20% 25% 30% 35% 40% 45% 50%
% Shift Work
Effi
cien
cy L
oss Applicable Range
• % Shift Work : 2%~53%
• Project Size: 3,000 ~ 550,000
Manhrs

Concepts included in the Planned Schedule Compression Concept File
Project Category Concept
Organization Provide Employees with Incentives Staff the Project with the Most Efficient Crews Avoid Interrupting Crews During Peak Productivity Times Provide Proactive Schedule Management during Compression Periods Participative Management Detailed Project Planning Reduction of Task Scope to Milestone Activities Increase the Supervisor to Worker Ratio Use CPM Scheduling Techniques for Project Control Include Anticipated Weather Delays in Work Schedule
Materials Employ a Just-in-Time Material Delivery Plan Establish a Special Material Handling Crew for the Project Establish a Special Material Cleanup Crew for the Project Assign a Material Coordinator to the Project Establish a Clear Zone in the Material Lay-Down Area Improve Vendor Performance by Establishing a Vendor Management System
Equipment and Tools Develop a Project Tool Management Program Increase the Inventory of Spare Parts, Tools, Etc.
Information Complete a Constructability Analysis of the Plans Prior to Construction Labor Place the Crew on Overtime
Add Additional Staff to the Project Add a Second Shift Change to Special Shifts
Support Services Use a Set-up Crew Construction Methods Schedule Tasks in Repetition
Create More Detailed Subcontractor Schedules Look for Short Cuts in the Process Plan for and Use Modular and Preassembled Components Brief the Crew Prior to Work Operations


![[Awad s. hanna]_concrete_formwork_systems_(civil_a(book_zz.org)](https://static.fdocuments.net/doc/165x107/58e5cef21a28ab1d608b4571/awad-s-hannaconcreteformworksystemscivilabookzzorg.jpg)