Assessment of Seasonal Winter Temperature Forecast Errors ...
Upload
department-of-housing-and-public-works-queenslandCategory
view
219download
1
Dr. Andrew Watkins ([email protected])MCV Climate Week 17 November 2015
Improved Seasonal Forecast Service
Climate Outlooks now and in the future
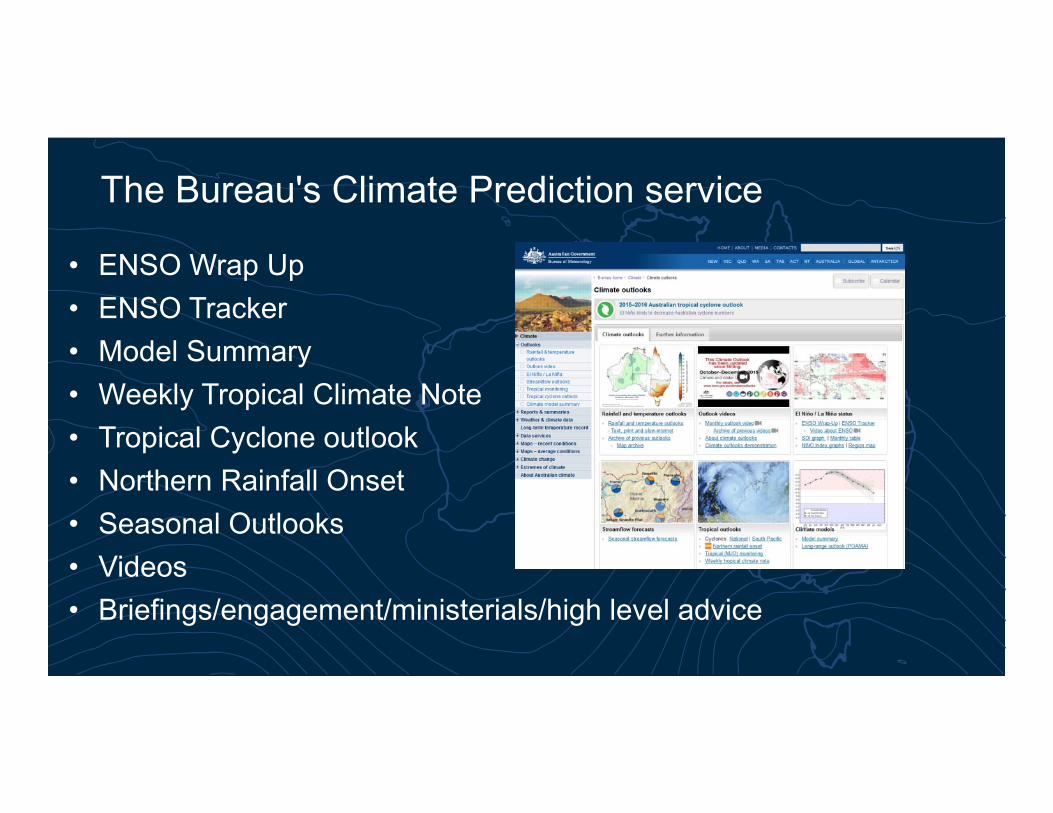
The Bureau's Climate Prediction service
• ENSO Wrap Up• ENSO Tracker• Model Summary• Weekly Tropical Climate Note• Tropical Cyclone outlook• Northern Rainfall Onset• Seasonal Outlooks• Videos• Briefings/engagement/ministerials/high level advice
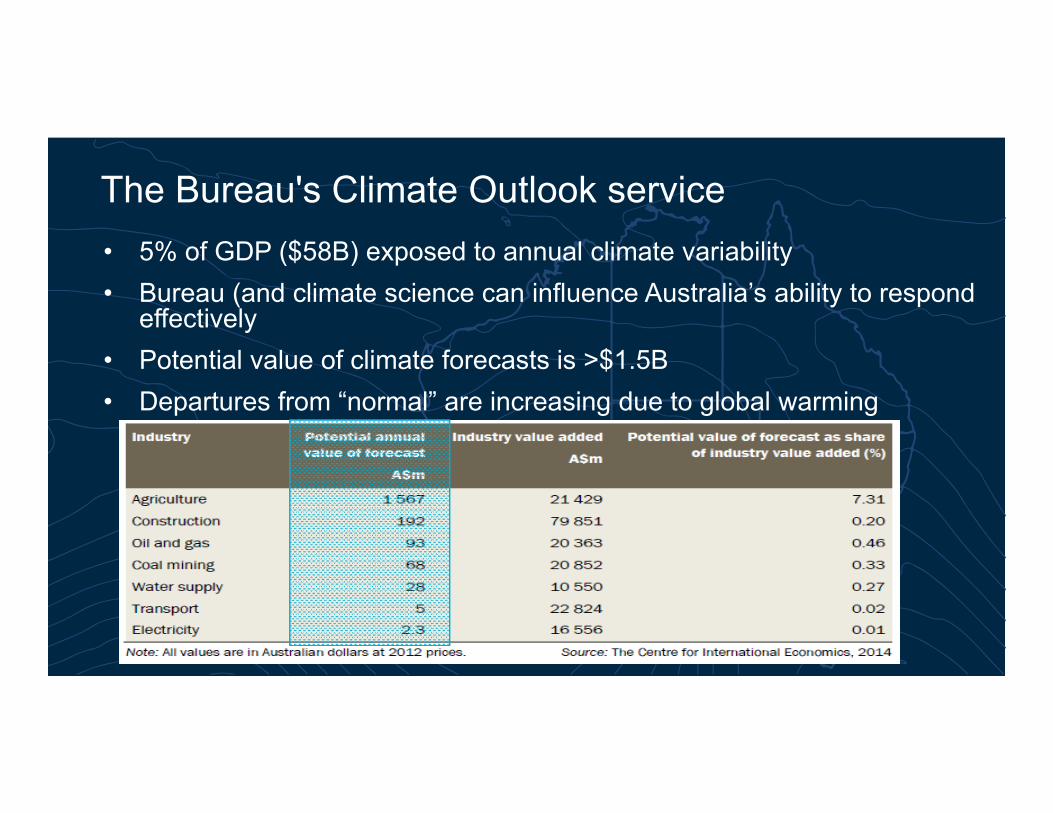
• 5% of GDP ($58B) exposed to annual climate variability • Bureau (and climate science can influence Australia’s ability to respond
effectively • Potential value of climate forecasts is >$1.5B• Departures from “normal” are increasing due to global warming
The Bureau's Climate Outlook service
1996
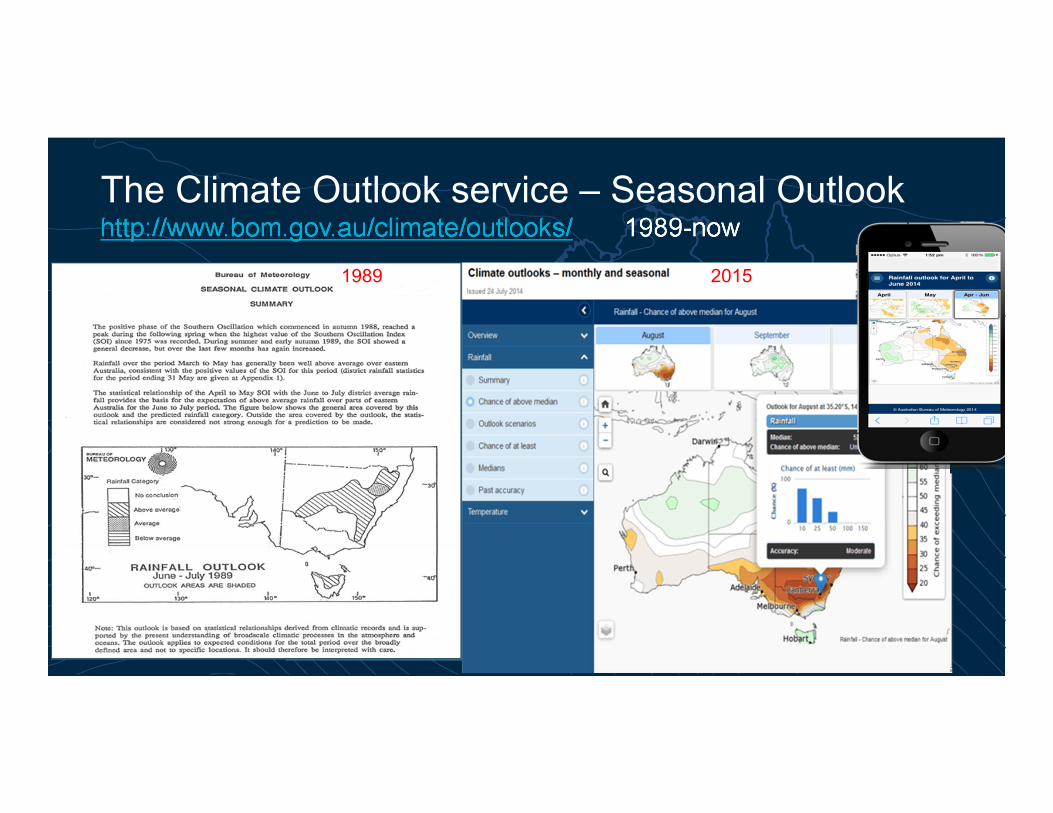
The Climate Outlook service – Seasonal Outlookhttp://www.bom.gov.au/climate/outlooks/ 1989-now
1989 2015
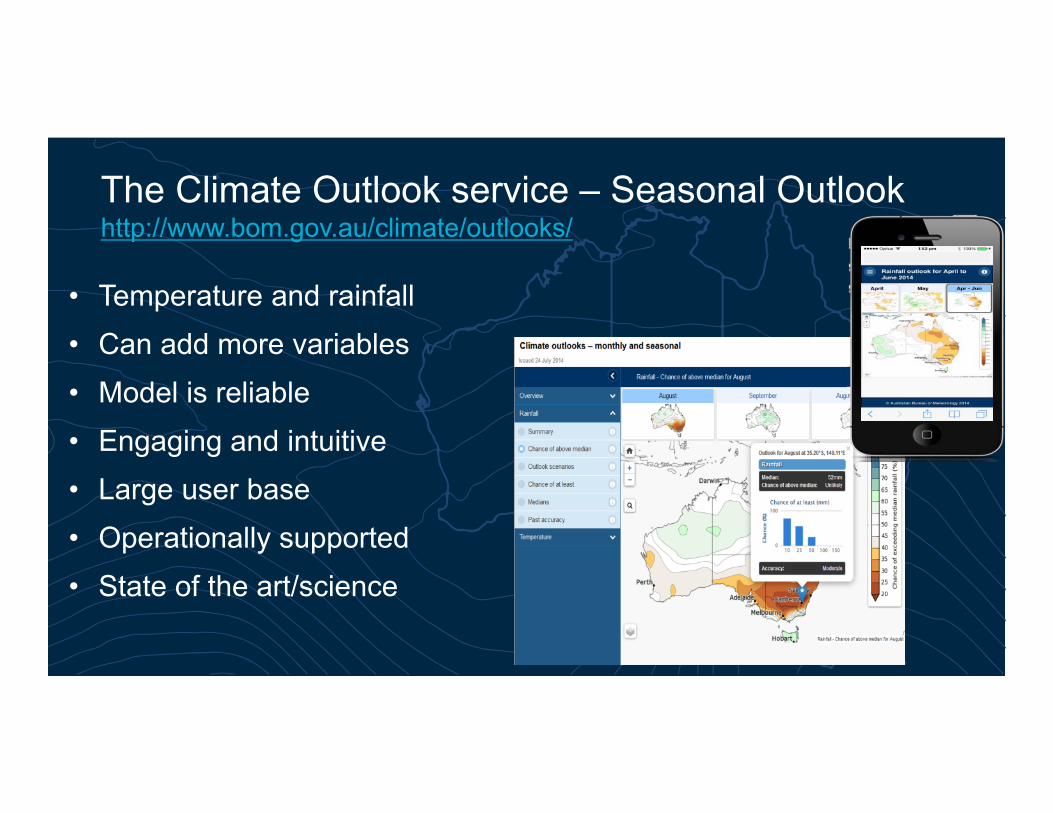
The Climate Outlook service – Seasonal Outlookhttp://www.bom.gov.au/climate/outlooks/
• Temperature and rainfall• Can add more variables • Model is reliable• Engaging and intuitive• Large user base• Operationally supported• State of the art/science
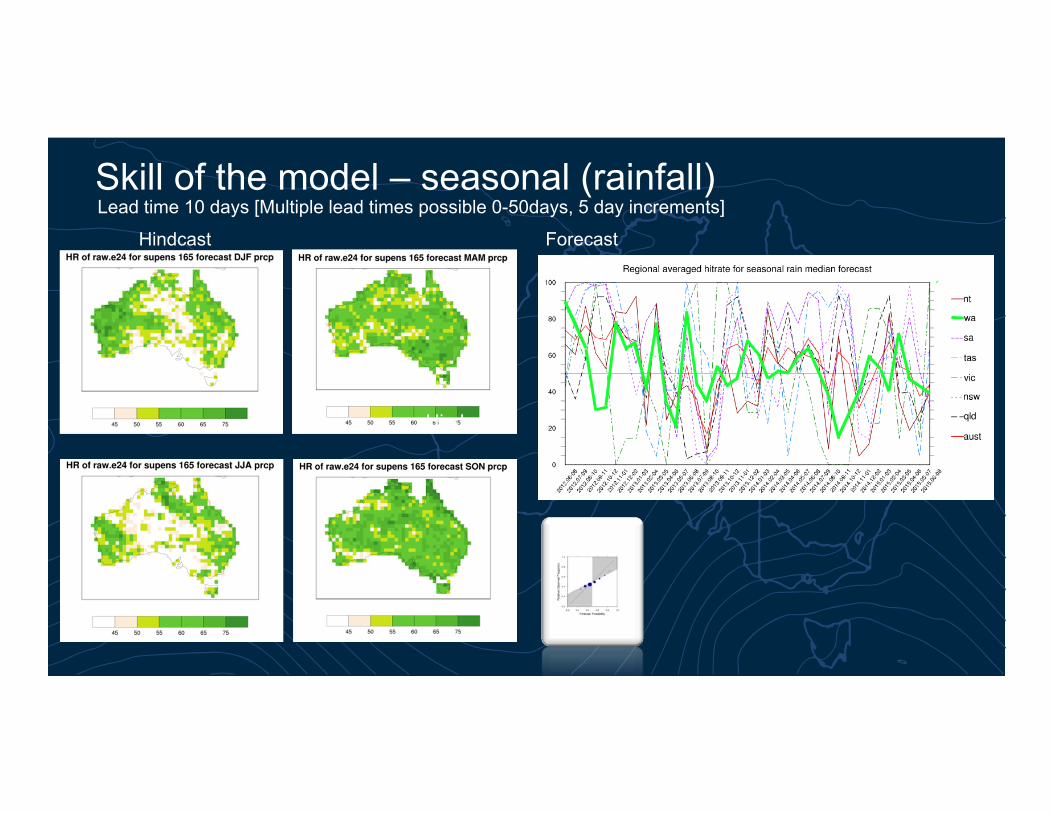
Skill of the model – seasonal (rainfall)Lead time 10 days [Multiple lead times possible 0-50days, 5 day increments]
Hindcast Forecast
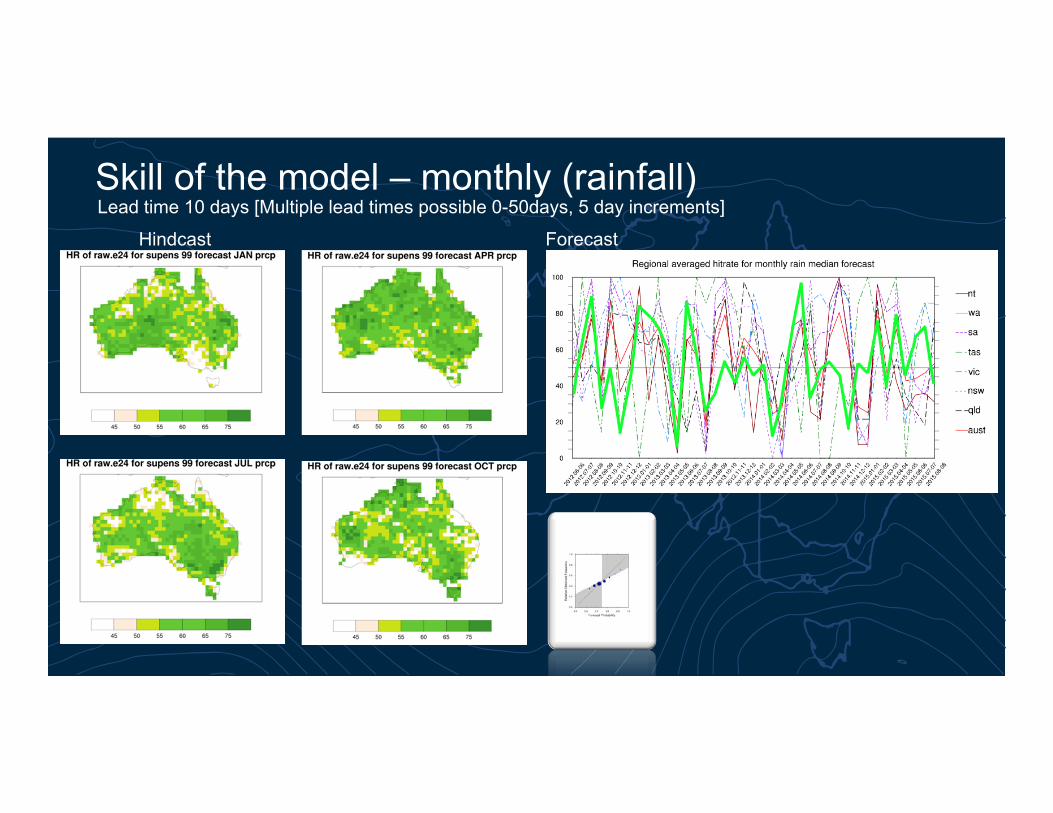
Skill of the model – monthly (rainfall)Lead time 10 days [Multiple lead times possible 0-50days, 5 day increments]
Hindcast Forecast
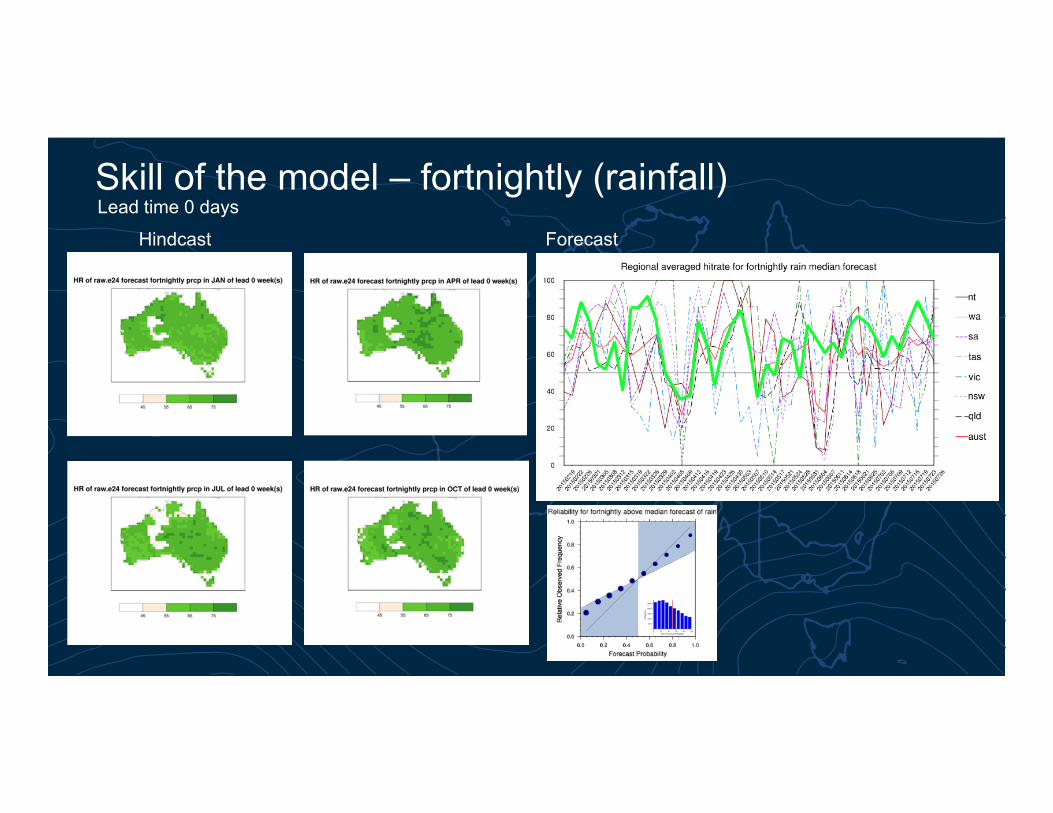
Skill of the model – fortnightly (rainfall)Lead time 0 days
Hindcast Forecast
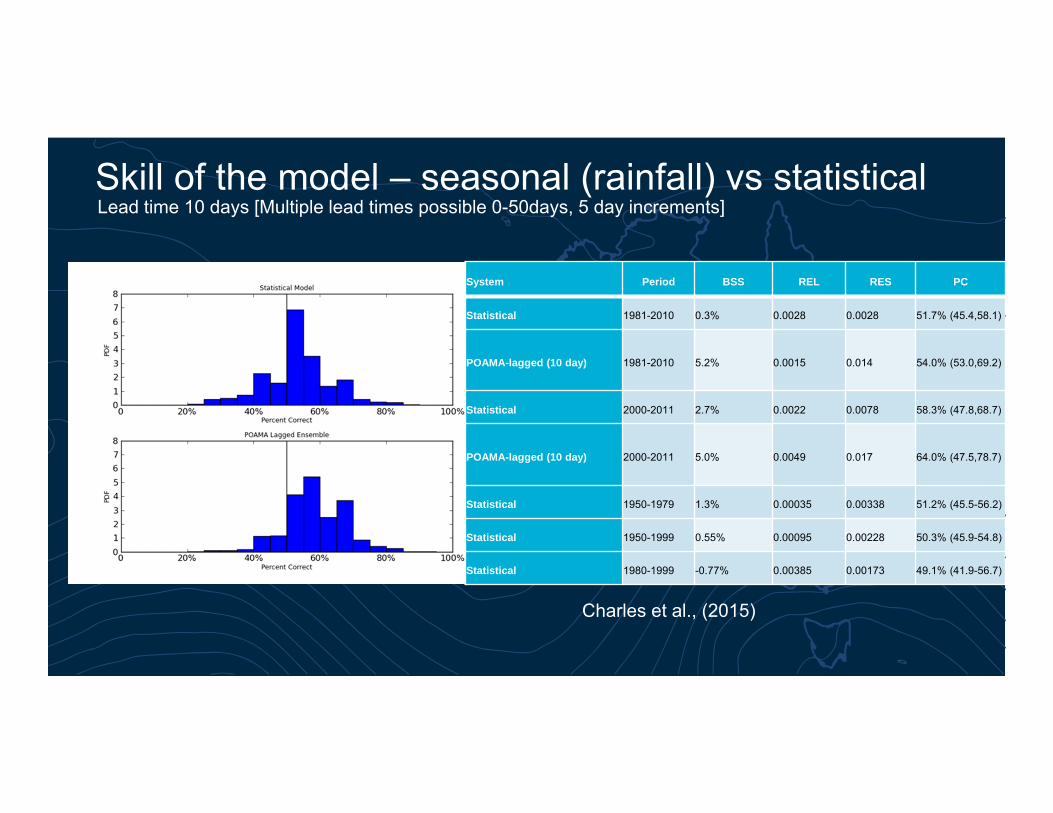
Skill of the model – seasonal (rainfall) vs statisticalLead time 10 days [Multiple lead times possible 0-50days, 5 day increments]
System Period BSS REL RES PC
Statistical 1981-2010 0.3% 0.0028 0.0028 51.7% (45.4,58.1)
POAMA-lagged (10 day) 1981-2010 5.2% 0.0015 0.014 54.0% (53.0,69.2)
Statistical 2000-2011 2.7% 0.0022 0.0078 58.3% (47.8,68.7)
POAMA-lagged (10 day) 2000-2011 5.0% 0.0049 0.017 64.0% (47.5,78.7)
Statistical 1950-1979 1.3% 0.00035 0.00338 51.2% (45.5-56.2)
Statistical 1950-1999 0.55% 0.00095 0.00228 50.3% (45.9-54.8)
Statistical 1980-1999 -0.77% 0.00385 0.00173 49.1% (41.9-56.7)
Charles et al., (2015)
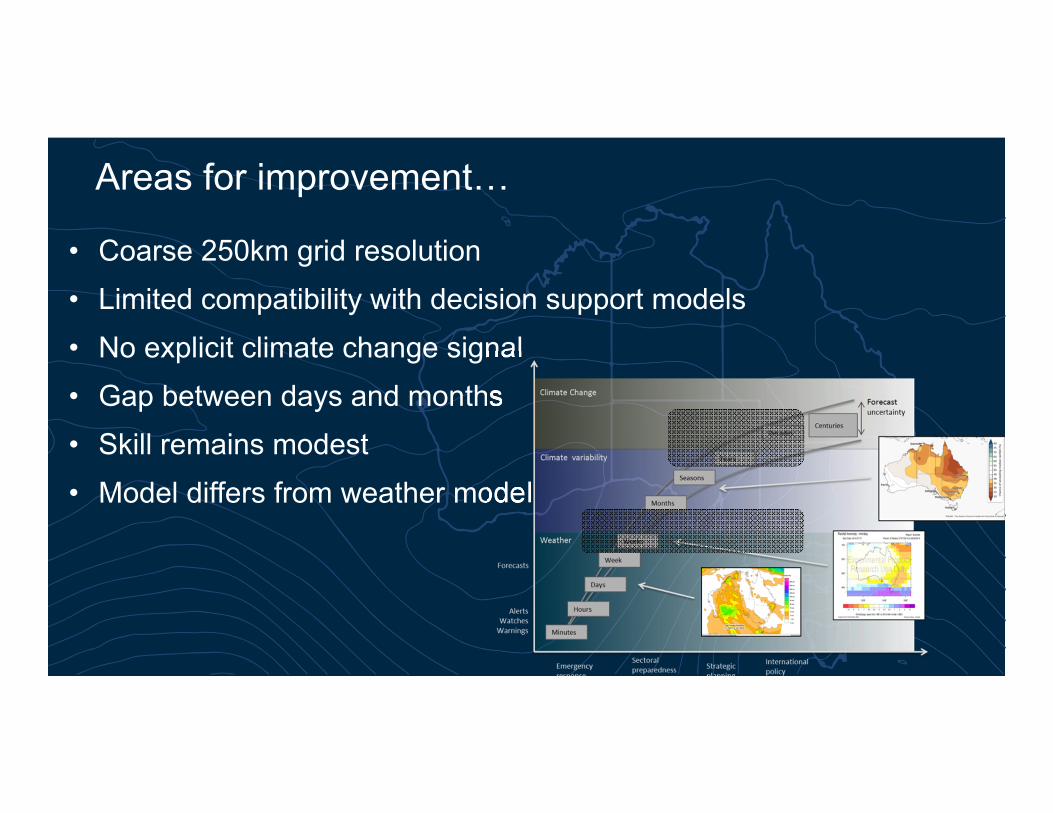
Areas for improvement…
• Coarse 250km grid resolution• Limited compatibility with decision support models• No explicit climate change signal• Gap between days and months• Skill remains modest• Model differs from weather model
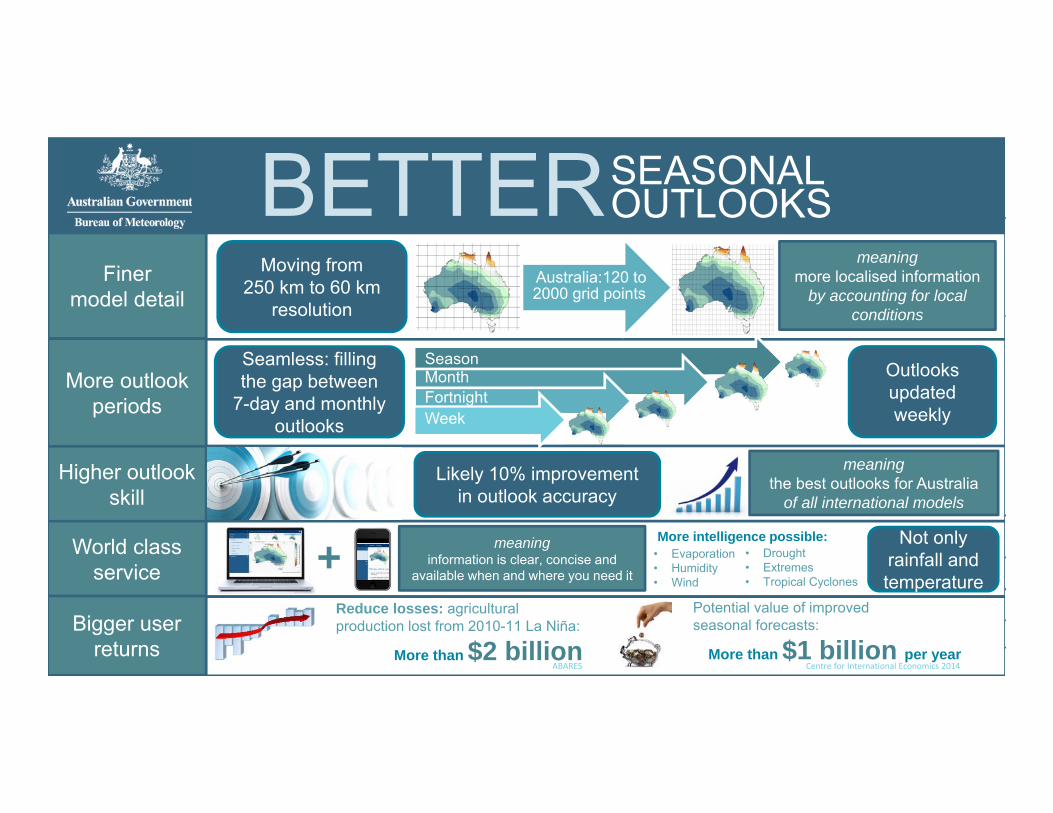
SEASONAL OUTLOOKSBETTER
Finermodel detail
More outlook periods
Higher outlookskill
World classservice
Bigger userreturns
Moving from 250 km to 60 km
resolution
meaningmore localised information
by accounting for local conditions
Australia:120 to2000 grid points
Seamless: filling the gap between
7-day and monthly outlooks
Outlooks updated weekly
Season MonthFortnightWeek
Likely 10% improvement in outlook accuracy
meaningthe best outlooks for Australia
of all international models
meaninginformation is clear, concise and
available when and where you need it+ Not only rainfall and temperature
More intelligence possible:• Evaporation• Humidity• Wind
• Drought• Extremes• Tropical Cyclones
Reduce losses: agricultural production lost from 2010-11 La Niña:
More than $2 billion
Potential value of improved seasonal forecasts:
More than $1 billion per yearABARES Centre for International Economics 2014
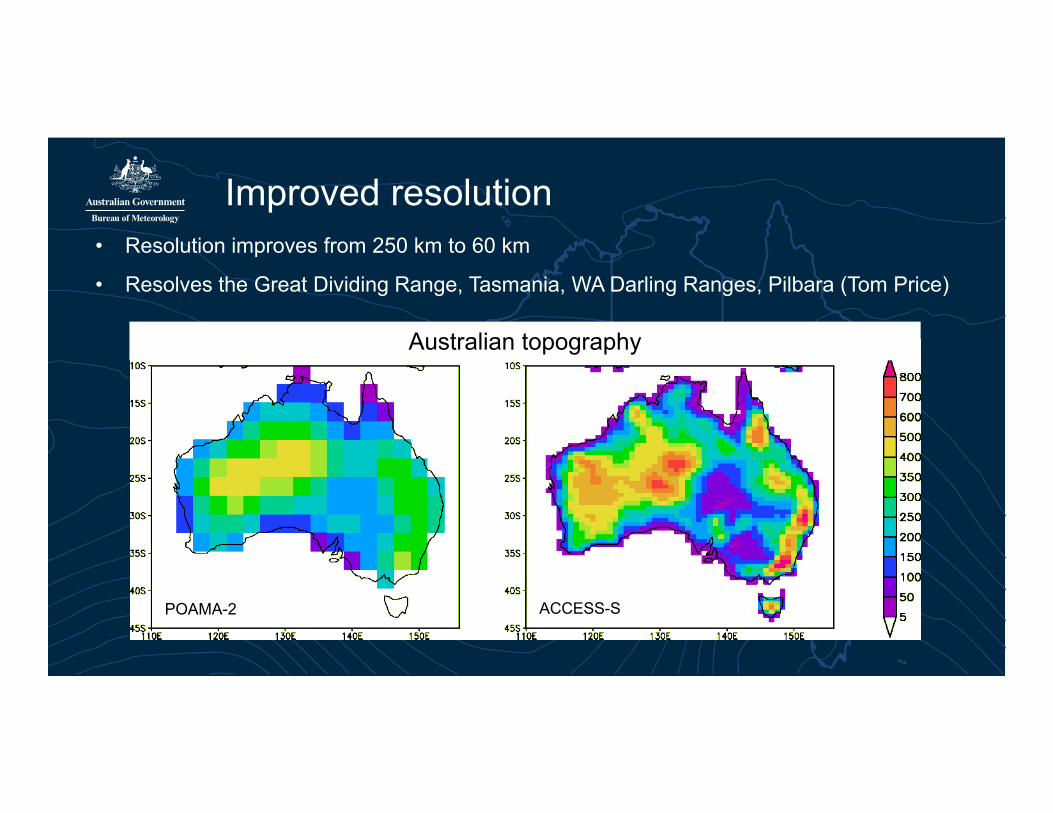
Improved resolution
POAMA-2 ACCESS-S
Australian topography
• Resolution improves from 250 km to 60 km
• Resolves the Great Dividing Range, Tasmania, WA Darling Ranges, Pilbara (Tom Price)
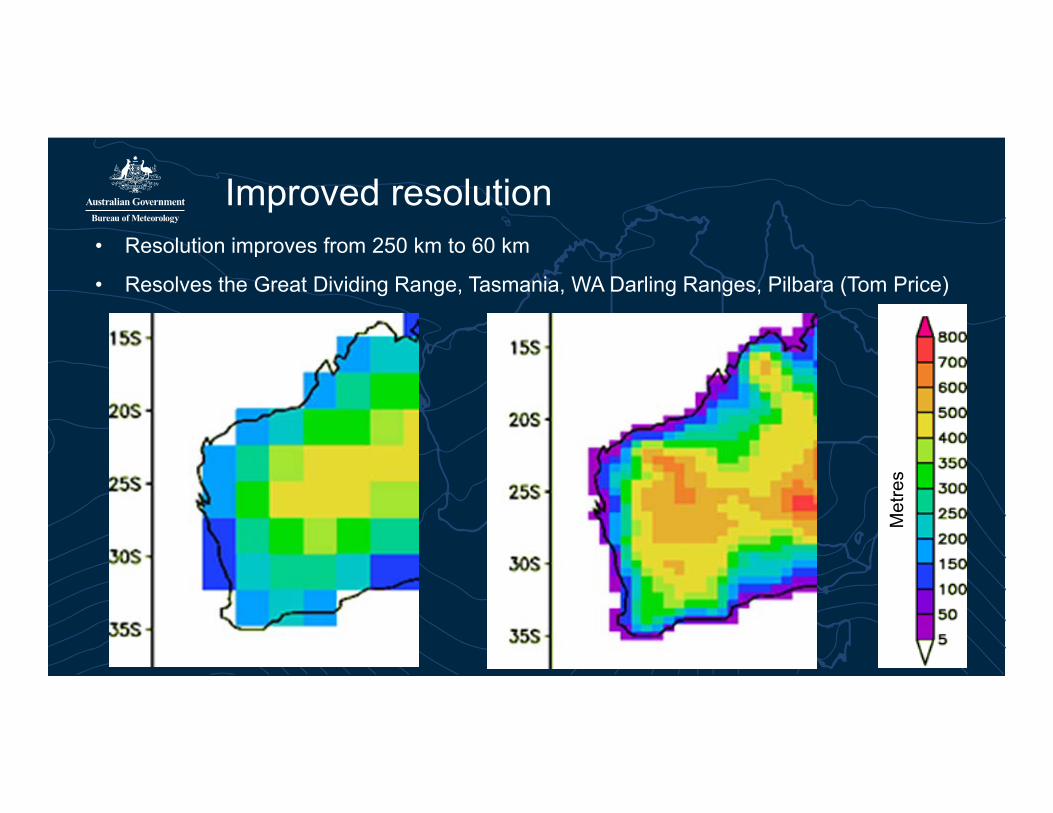
Improved resolution• Resolution improves from 250 km to 60 km
• Resolves the Great Dividing Range, Tasmania, WA Darling Ranges, Pilbara (Tom Price)
Met
ress
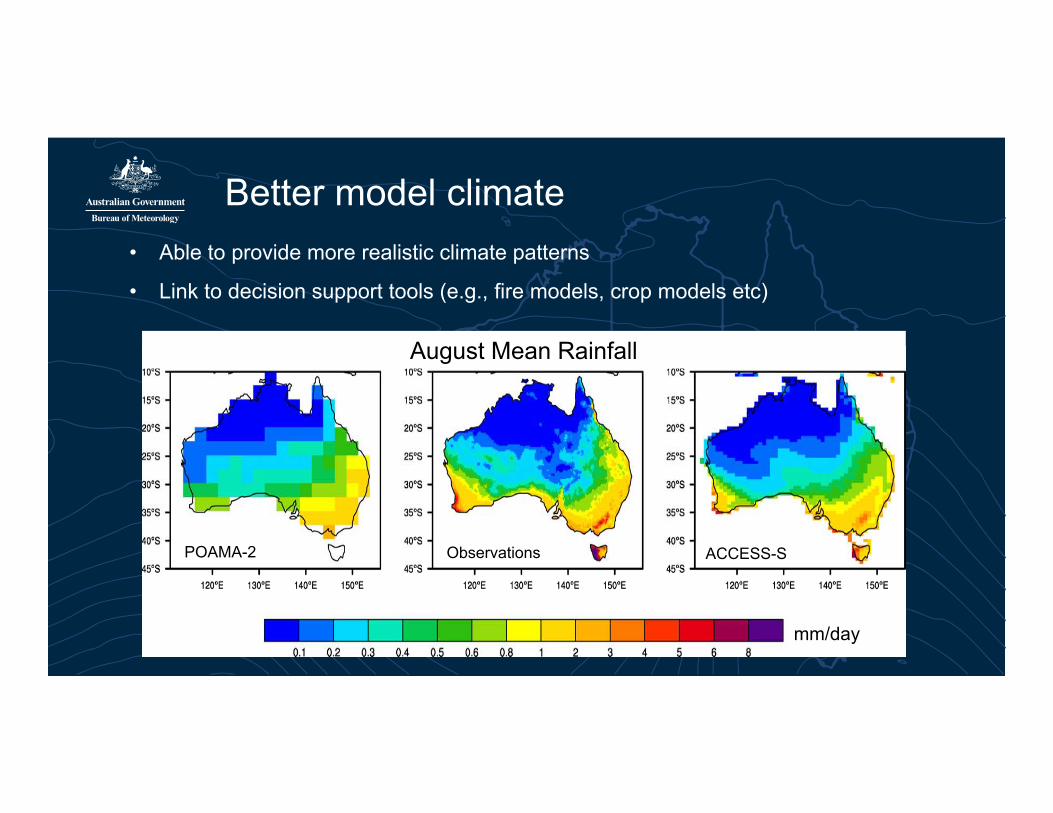
Better model climate• Able to provide more realistic climate patterns
• Link to decision support tools (e.g., fire models, crop models etc)
August Mean Rainfall
POAMA-2 Observations ACCESS-S
mm/dayy
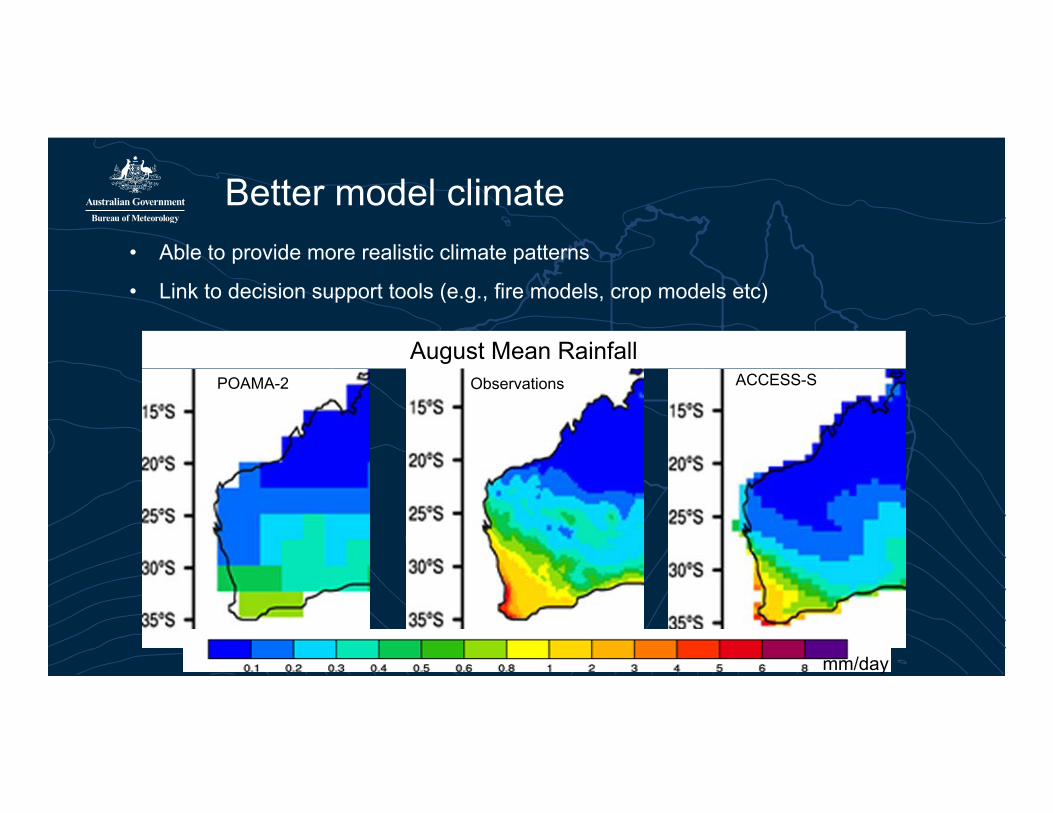
Better model climate• Able to provide more realistic climate patterns
• Link to decision support tools (e.g., fire models, crop models etc)
August Mean RainfallPOAMA-2 Observations ACCESS-S
mm/day
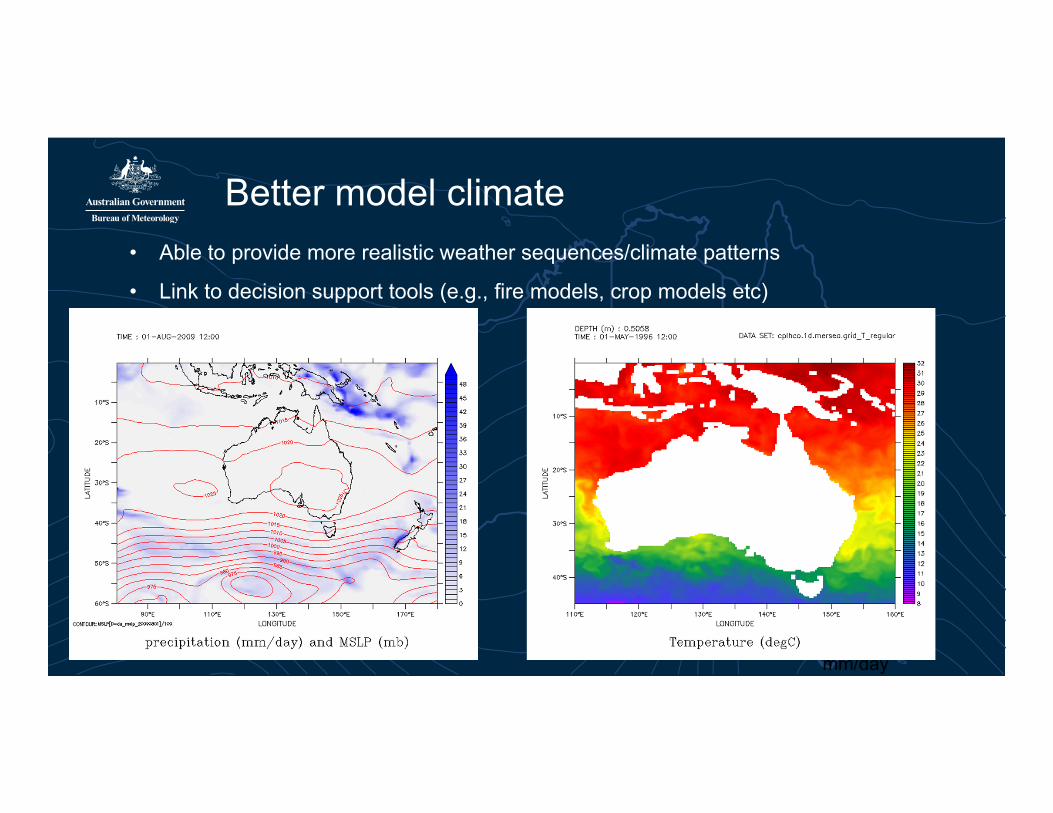
Better model climate• Able to provide more realistic weather sequences/climate patterns
• Link to decision support tools (e.g., fire models, crop models etc)
mm/day
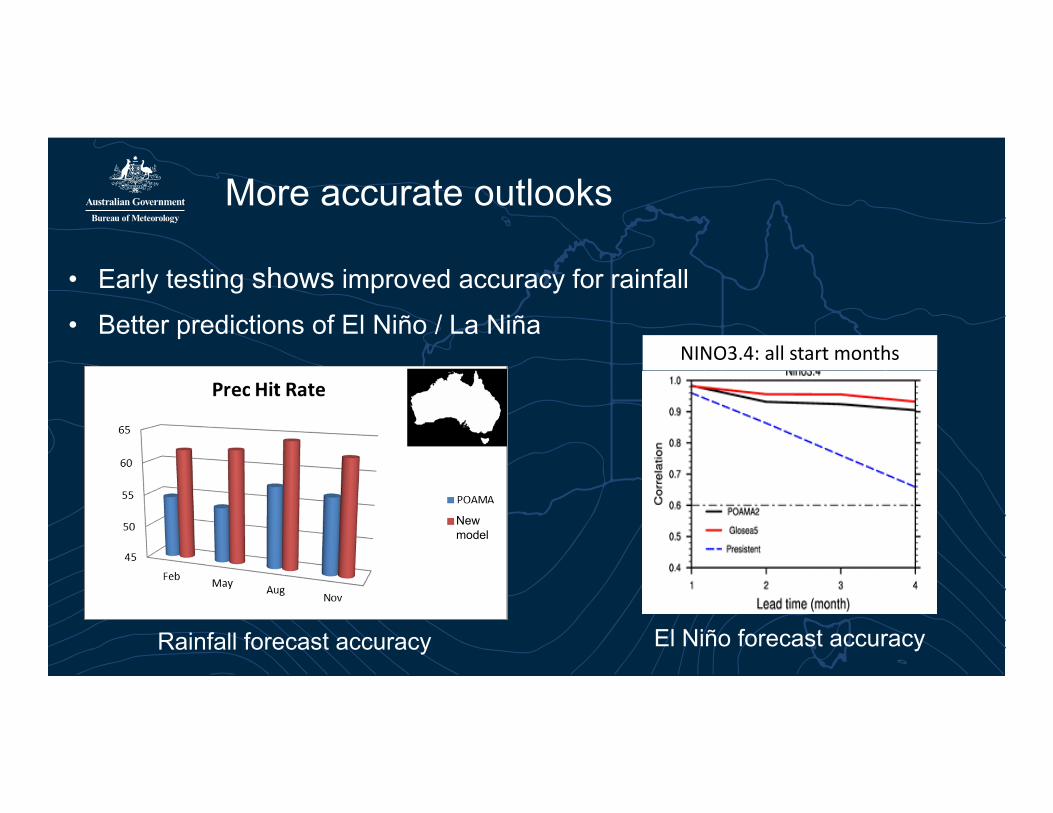
More accurate outlooks
• Early testing shows improved accuracy for rainfall
• Better predictions of El Niño / La NiñaNINO3.4: all start months
El Niño forecast accuracyRainfall forecast accuracy
New model
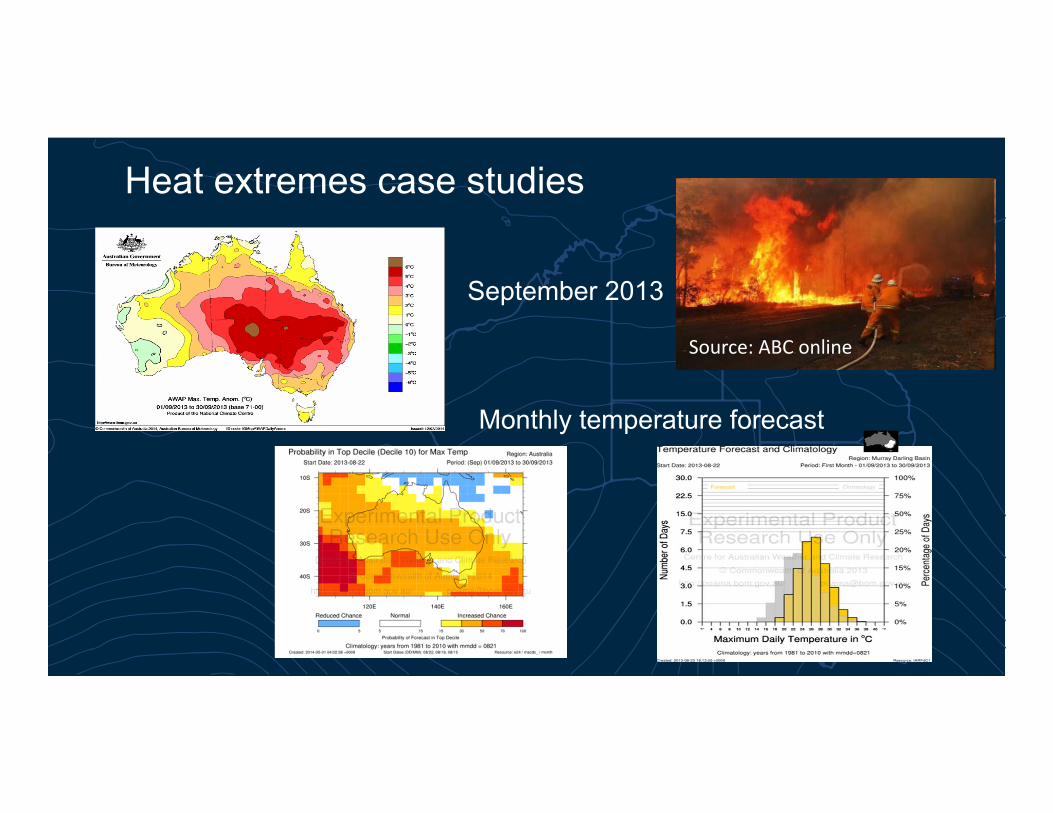
Heat extremes case studies
September 2013
Monthly temperature forecast
Source: ABC online
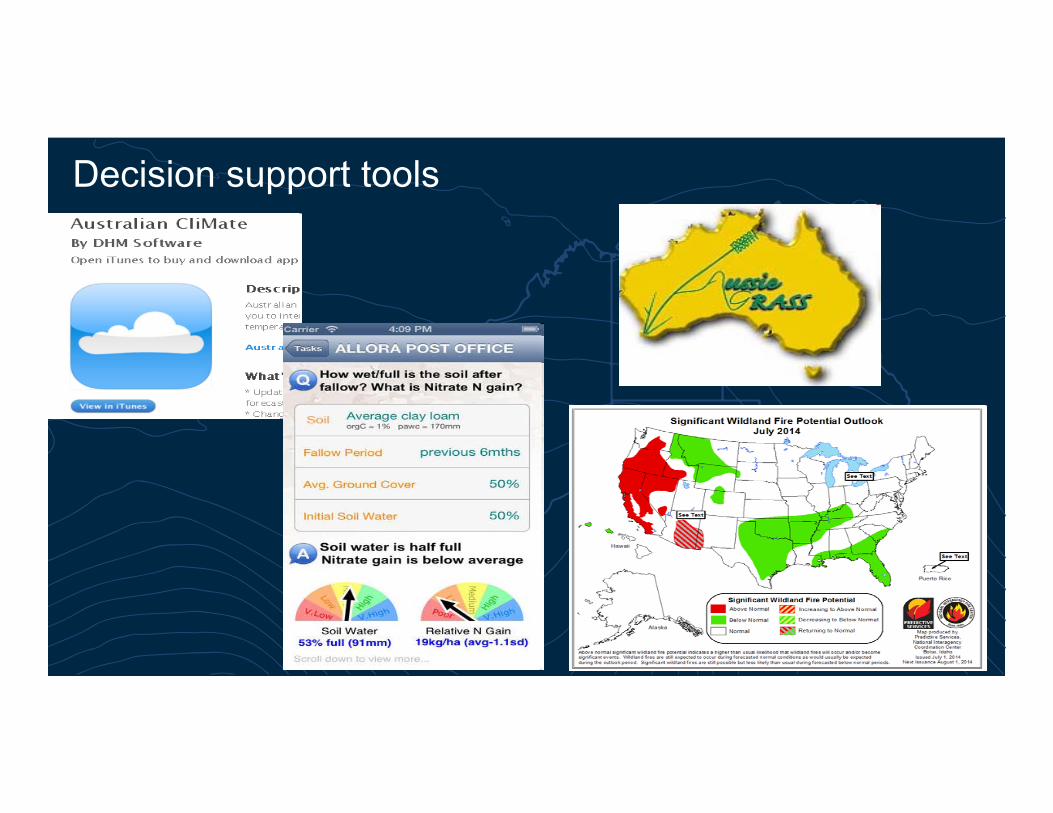
Decision support tools
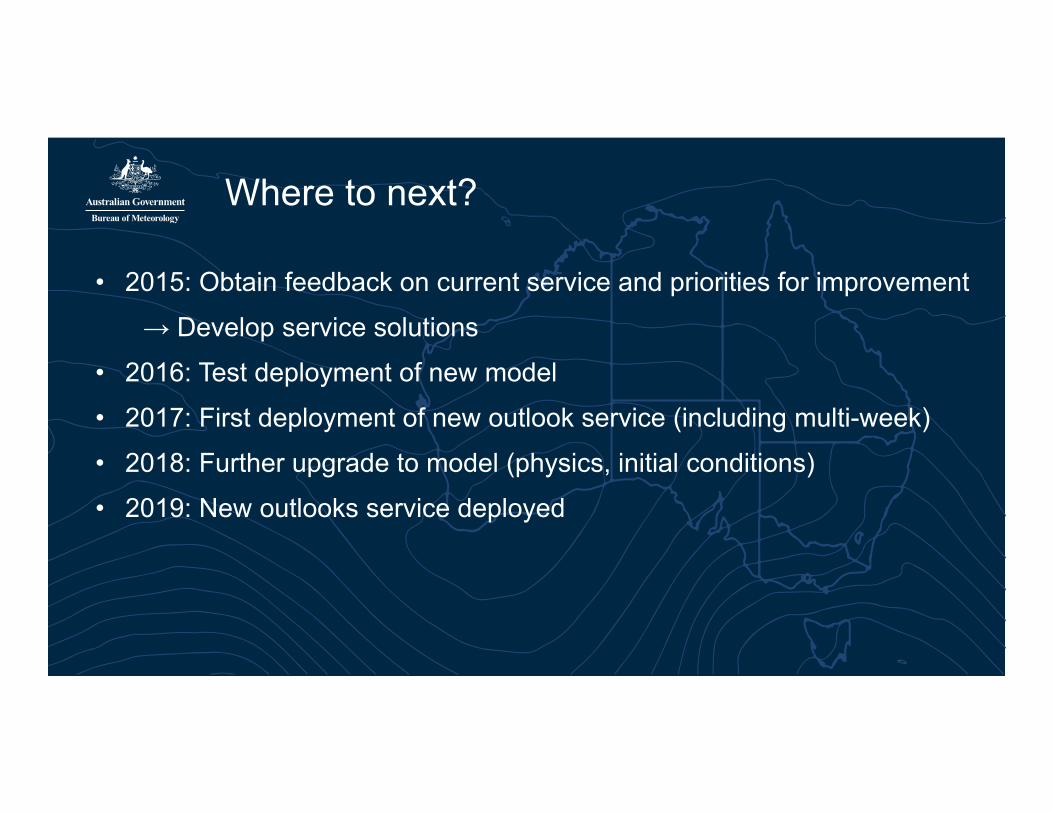
Where to next?
• 2015: Obtain feedback on current service and priorities for improvement
→ Develop service solutions
• 2016: Test deployment of new model
• 2017: First deployment of new outlook service (including multi-week)
• 2018: Further upgrade to model (physics, initial conditions)
• 2019: New outlooks service deployed
Thank you
Questions?