Downloaded from on November 11 ...bmjopen.bmj.com/content/bmjopen/6/5/e011291.full.pdf · Shuko...
10
Association between relocation and changes in cardiometabolic risk factors: a longitudinal study in tsunami survivors of the 2011 Great East Japan Earthquake Shuko Takahashi, 1,2 Motoyuki Nakamura, 3 Yuki Yonekura, 2 Kozo Tanno, 2 Kiyomi Sakata, 2 Akira Ogawa, 4 Seiichiro Kobayashi 5 To cite: Takahashi S, Nakamura M, Yonekura Y, et al. Association between relocation and changes in cardiometabolic risk factors: a longitudinal study in tsunami survivors of the 2011 Great East Japan Earthquake. BMJ Open 2016;6:e011291. doi:10.1136/bmjopen-2016- 011291 ▸ Prepublication history and additional material is available. To view please visit the journal (http://dx.doi.org/ 10.1136/bmjopen-2016- 011291). Received 27 January 2016 Revised 19 April 2016 Accepted 26 April 2016 For numbered affiliations see end of article. Correspondence to Dr Shuko Takahashi; [email protected] ABSTRACT Objectives: The aim of this study is to determine changes in atherosclerotic cardiovascular risk factors with and without serious disaster-related mental and socioeconomic problems represented by relocation (REL). Design: A longitudinal survey. Setting: Multiphasic health check-ups for the general population affected by the 2011 Great East Japan Earthquake and Tsunami. Participants: A total 6528 disaster survivors in heavily tsunami-damaged municipalities were recruited. Two sequential surveys were conducted and the data were analysed. Main outcome measures: Multiphasic health check-ups including investigation of lifestyle and psychological and socioeconomic measures were performed in two sequential phases (8 and 18 months) after the disaster for tsunami survivors with REL (n=3160) and without REL (n=3368). Longitudinal changes in cardiometabolic risk factors between the two phases were compared in the REL and non-REL groups. Results: In sex/age-adjusted analysis, we found increases in body weight and waist circumference between the two phases that were significantly greater in the REL group than in the non-REL group (body weight:+0.31 (0.23∼0.39) versus −0.24 (−0.32∼−0.16) kg, p<0.001; waist circumference:+0.58 (0.48∼0.68) versus+0.05 (−0.05∼0.15) cm, p<0.001)). A decrease in serum HDLC levels was found and again was significantly greater in the REL group than in the non-REL group (−0.65 (−0.96∼−0.34) versus −0.09 (−0.39∼0.21) mg/dL, p=0.009). In addition, deterioration in physical activity, mental health and socioeconomic status was more prevalent in the REL group than in the non-REL group (all p<0.001). Conclusions: This study suggests that relocation after the devastating tsunami was related to weight gain and decreasing HDLC among survivors, and this change was associated with prolonged psychological distress and socioeconomic problems after the disaster. INTRODUCTION A 9.0 magnitude earthquake, named the 2011 Great East Japan Earthquake, and a subsequent catastrophic tsunami struck the northeast region of Honshu, Japan on 11 March 2011. The devastating tsunami struck coastal towns and cities and destroyed a large number of local communities (see online supplementary figure S1). In Iwate prefec- ture, one of the most heavily damaged areas, about 5800 residents drowned or went missing on the day the tsunami struck. 1 Tsunami survivors whose homes were severely damaged were forced to evacuate to commu- nity centres or crowded school gymnasiums soon after the disaster. Even several years after the disaster, the local government has placed restrictions on where survivors can rebuild houses in order to protect against future tsunami events. Some survivors could Strengths and limitations of this study ▪ In this longitudinal survey, changes in cardiome- tabolic risk factors were determined in the general population affected by the 2011 Japan disaster. ▪ Several types of self-reported questionnaire con- cerning lifestyle and psychological and socio- economic parameters were used. ▪ The survey was performed in two sequential phases (8 and 18 months) after the disaster. ▪ Sex-adjusted and age-adjusted changes between the two phases were compared in participants with relocation (n=3160) and those without relocation (n=3368). ▪ It was not determined in this study whether there was any overall increase in the incidence of atherosclerotic cardiovascular incidents during the study period. Takahashi S, et al. BMJ Open 2016;6:e011291. doi:10.1136/bmjopen-2016-011291 1 Open Access Research on 21 May 2018 by guest. Protected by copyright. http://bmjopen.bmj.com/ BMJ Open: first published as 10.1136/bmjopen-2016-011291 on 12 May 2016. Downloaded from
Transcript of Downloaded from on November 11 ...bmjopen.bmj.com/content/bmjopen/6/5/e011291.full.pdf · Shuko...
Association between relocation andchanges in cardiometabolic risk factors:a longitudinal study in tsunamisurvivors of the 2011 Great East JapanEarthquake
Shuko Takahashi,1,2 Motoyuki Nakamura,3 Yuki Yonekura,2 Kozo Tanno,2
Kiyomi Sakata,2 Akira Ogawa,4 Seiichiro Kobayashi5
To cite: Takahashi S,Nakamura M, Yonekura Y,et al. Association betweenrelocation and changes incardiometabolic risk factors:a longitudinal study intsunami survivors of the2011 Great East JapanEarthquake. BMJ Open2016;6:e011291.doi:10.1136/bmjopen-2016-011291
▸ Prepublication history andadditional material isavailable. To view please visitthe journal (http://dx.doi.org/10.1136/bmjopen-2016-011291).
Received 27 January 2016Revised 19 April 2016Accepted 26 April 2016
For numbered affiliations seeend of article.
Correspondence toDr Shuko Takahashi;[email protected]
ABSTRACTObjectives: The aim of this study is to determinechanges in atherosclerotic cardiovascular risk factorswith and without serious disaster-related mental andsocioeconomic problems represented by relocation(REL).Design: A longitudinal survey.Setting: Multiphasic health check-ups for the generalpopulation affected by the 2011 Great East JapanEarthquake and Tsunami.Participants: A total 6528 disaster survivors inheavily tsunami-damaged municipalities were recruited.Two sequential surveys were conducted and the datawere analysed.Main outcome measures: Multiphasic healthcheck-ups including investigation of lifestyle andpsychological and socioeconomic measures wereperformed in two sequential phases (8 and 18 months)after the disaster for tsunami survivors with REL(n=3160) and without REL (n=3368). Longitudinalchanges in cardiometabolic risk factors between thetwo phases were compared in the REL and non-RELgroups.Results: In sex/age-adjusted analysis, we foundincreases in body weight and waist circumferencebetween the two phases that were significantly greaterin the REL group than in the non-REL group (bodyweight:+0.31 (0.23∼0.39) versus −0.24(−0.32∼−0.16) kg, p<0.001; waist circumference:+0.58(0.48∼0.68) versus+0.05 (−0.05∼0.15) cm, p<0.001)).A decrease in serum HDLC levels was found and againwas significantly greater in the REL group than in thenon-REL group (−0.65 (−0.96∼−0.34) versus −0.09(−0.39∼0.21) mg/dL, p=0.009). In addition,deterioration in physical activity, mental health andsocioeconomic status was more prevalent in the RELgroup than in the non-REL group (all p<0.001).Conclusions: This study suggests that relocation afterthe devastating tsunami was related to weight gain anddecreasing HDLC among survivors, and this changewas associated with prolonged psychological distressand socioeconomic problems after the disaster.
INTRODUCTIONA 9.0 magnitude earthquake, named the2011 Great East Japan Earthquake, and asubsequent catastrophic tsunami struck thenortheast region of Honshu, Japan on 11March 2011. The devastating tsunami struckcoastal towns and cities and destroyed a largenumber of local communities (see onlinesupplementary figure S1). In Iwate prefec-ture, one of the most heavily damaged areas,about 5800 residents drowned or wentmissing on the day the tsunami struck.1
Tsunami survivors whose homes were severelydamaged were forced to evacuate to commu-nity centres or crowded school gymnasiumssoon after the disaster. Even several yearsafter the disaster, the local government hasplaced restrictions on where survivors canrebuild houses in order to protect againstfuture tsunami events. Some survivors could
Strengths and limitations of this study
▪ In this longitudinal survey, changes in cardiome-tabolic risk factors were determined in thegeneral population affected by the 2011 Japandisaster.
▪ Several types of self-reported questionnaire con-cerning lifestyle and psychological and socio-economic parameters were used.
▪ The survey was performed in two sequentialphases (8 and 18 months) after the disaster.
▪ Sex-adjusted and age-adjusted changes betweenthe two phases were compared in participantswith relocation (n=3160) and those withoutrelocation (n=3368).
▪ It was not determined in this study whetherthere was any overall increase in the incidence ofatherosclerotic cardiovascular incidents duringthe study period.
Takahashi S, et al. BMJ Open 2016;6:e011291. doi:10.1136/bmjopen-2016-011291 1
Open Access Research
on 21 May 2018 by guest. P
rotected by copyright.http://bm
jopen.bmj.com
/B
MJ O
pen: first published as 10.1136/bmjopen-2016-011291 on 12 M
ay 2016. Dow
nloaded from

not afford to build new houses, so they were forced tomove into small temporary housing (see online supple-mentary figure S2–3) and suffered psychological andsocioeconomic problems.2 Those survivors had to moveto different residences several times in the aftermathperiod. On the other hand, residents whose homes werenot destroyed by the tsunami could continue with theirusual lifestyle after the disaster. These survivors did nothave to relocate during the postdisaster period.Previous studies have shown an increase in the inci-
dence of several types of cardiovascular diseases afternatural disasters,3–5 and several studies have shownincreased numbers of patients with acute myocardialinfarction, sudden cardiac death, heart failure andstroke in the present disaster area.6–9 However, thedetailed mechanisms underlying the increased post-tsunami incidence of these atherosclerotic cardiovascu-lar events have not yet been fully determined. Severalreports have suggested that one of the reasons for thisincreased incidence in disaster areas may be worsening
atherosclerotic cardiovascular risk profiles combinedwith postdisaster psychological distress.10–12
Therefore, the purpose of this study was to determinethe longitudinal changes in several atherosclerotic car-diovascular risk factors after the disaster amongcommunity-dwelling adults with and without seriousdisaster-related mental and socioeconomic problemsrepresented by relocation (REL).
MATERIALS AND METHODSStudy participantsAdult participants were recruited from the generalpopulation in the heavily tsunami-damaged cities ofYamada, Otsuchi and Rikuzentakata near the seacoast ofthe southern part of Iwate Prefecture (figure 1).13 Thiscohort study project was named RIAS (Research projectfor prospective Investigation of health problems AmongSurvivors of the 2011 Great East Japan Earthquake andTsunami), and the purpose of this study and the
Figure 1 Map of the study area. The black square shows the study area along the Pacific Ocean coast that was affected by the
tsunami. The municipalities included in our study were Yamada, Otsuchi and Rikuzentakata. The epicentre of the earthquake is
marked as a dot.
2 Takahashi S, et al. BMJ Open 2016;6:e011291. doi:10.1136/bmjopen-2016-011291
Open Access
on 21 May 2018 by guest. P
rotected by copyright.http://bm
jopen.bmj.com
/B
MJ O
pen: first published as 10.1136/bmjopen-2016-011291 on 12 M
ay 2016. Dow
nloaded from

detailed methods of subject recruitment were reportedin our previous paper.14
In brief, after a public announcement, we sent outnotifications of the health survey and several types ofstructural questionnaire (lifestyle, mental health andsocioeconomic status) to all residents aged 18 years orolder (12 772 people in Yamada, 11 411 in Otsuchi and18 648 in Rikuzentakata: total 42 831). After this, a totalof 10 558 residents attended the study site, and 10 196participants (participation rate of about 24%) finallyagreed to participate after giving written informedconsent (figure 2). The initial survey consisted ofanthropometric, clinical and physiological measures,and self-reported questionnaires were given during thepostdisaster phase (mean period of 8 months after thedisaster=phase 1) in the three municipalities.The second postdisaster survey employed similar study
items (anthropometric, clinical and physiological mea-sures, and self-reported questionnaires) and was con-ducted in the same districts in 2012 (mean period of18 months after the disaster=phase 2). At the phase 2examination, 2689 participants who participated in thephase 1 survey did not attend. After excluding personswho did not completely respond to the follow-up ques-tionnaires (n=979), we finally analysed data from 6528participants (2499 males and 4029 females). The rightsand welfare of participants in this study were protectedby the ethical guidelines outlined in the Declaration ofHelsinki. The research plan was deliberated andapproved by the Ethics Committee of Iwate MedicalUniversity (approval no. H23–69).
Anthropometric data and blood pressureBody weight (kg) was measured using digital scales(AD-6400, A&D Co., Tokyo, Japan; BWB-200, Tanita Co.,
Tokyo, Japan) with an accuracy of ±0.1 kg and with parti-cipants wearing light clothing and no shoes. Height wasmeasured using digital scales (AD-6121A, A&D Co.,Tokyo, Japan; YG200D, Yagami INC, Nagoya, Japan).Body mass index (BMI; kg/m2) was calculated by divid-ing body weight (kg) by height (m)2. Waist circumfer-ence was measured standing up using tape measurelines.Experienced research staff measured systemic blood
pressure using an automatic digital device (BP-103i II,Omron Colin Co, Tokyo, Japan) with the subject seatedafter at least 5 min of rest. Each measurement was per-formed twice, and mean values for systolic blood pressure(SBP; mm Hg) and diastolic BP (DBP; mm Hg) were cal-culated. Mean values were used for statistical analysis.
Biochemical analysesBlood samples were drawn from the antecubital vein whileparticipants were seated. The samples were transported toa laboratory (Iwate Health Service Association) and wereanalysed on the same day. We determined serum levels oftotal cholesterol (TC; mg/dL), high-density lipoproteincholesterol (HDLC; mg/dL), low-density lipoprotein chol-esterol (LDLC; mg/dL) and triglyceride (TG; mg/dL).Serum TC levels were determined by an enzymatic assay,and serum concentrations of HDLC and LDLC weredetermined by a direct quantitative assay. The quality ofTC and HDLC measurements was controlled by the pro-gramme of the Centers for Disease Control in the USA.Serum TG concentration was determined by an enzymecolorimetric assay. We examined serum creatinine levelsusing an enzymatic assay. All of the above biochemicaldata were determined by using an automated analyser(Hitachi 7700, Tokyo, Japan). Non-high-density lipopro-tein cholesterol (non-HDLC; mg/dL) was calculated by
Figure 2 Flow chart of the study phase and the procedure used to select participants for the study. The survey in 2011
(phase 1) was conducted 6 months after the disaster (from September to December 2011). The original cohort consisted of
10 196 participants in phase 1. The next survey (phase 2) was carried out 18 months after the disaster (from September to
December 2012). The average period between phase 1 and phase 2 was 11 months. We excluded a total of 2689 persons who
did not participate in the phase 2 survey and 979 persons who lacked at least one variable used for analysis. We finally used
data from 6528 participants for analysis.
Takahashi S, et al. BMJ Open 2016;6:e011291. doi:10.1136/bmjopen-2016-011291 3
Open Access
on 21 May 2018 by guest. P
rotected by copyright.http://bm
jopen.bmj.com
/B
MJ O
pen: first published as 10.1136/bmjopen-2016-011291 on 12 M
ay 2016. Dow
nloaded from
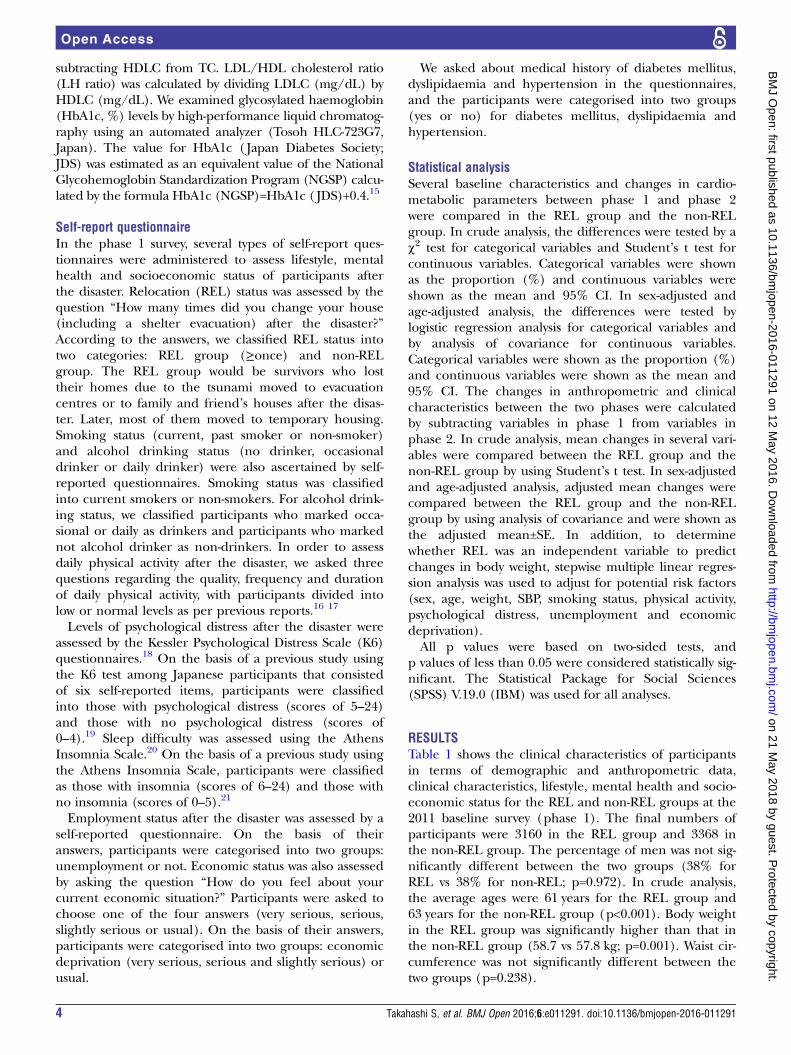
subtracting HDLC from TC. LDL/HDL cholesterol ratio(LH ratio) was calculated by dividing LDLC (mg/dL) byHDLC (mg/dL). We examined glycosylated haemoglobin(HbA1c, %) levels by high-performance liquid chromatog-raphy using an automated analyzer (Tosoh HLC-723G7,Japan). The value for HbA1c ( Japan Diabetes Society;JDS) was estimated as an equivalent value of the NationalGlycohemoglobin Standardization Program (NGSP) calcu-lated by the formula HbA1c (NGSP)=HbA1c ( JDS)+0.4.15
Self-report questionnaireIn the phase 1 survey, several types of self-report ques-tionnaires were administered to assess lifestyle, mentalhealth and socioeconomic status of participants afterthe disaster. Relocation (REL) status was assessed by thequestion “How many times did you change your house(including a shelter evacuation) after the disaster?”According to the answers, we classified REL status intotwo categories: REL group (≥once) and non-RELgroup. The REL group would be survivors who losttheir homes due to the tsunami moved to evacuationcentres or to family and friend’s houses after the disas-ter. Later, most of them moved to temporary housing.Smoking status (current, past smoker or non-smoker)and alcohol drinking status (no drinker, occasionaldrinker or daily drinker) were also ascertained by self-reported questionnaires. Smoking status was classifiedinto current smokers or non-smokers. For alcohol drink-ing status, we classified participants who marked occa-sional or daily as drinkers and participants who markednot alcohol drinker as non-drinkers. In order to assessdaily physical activity after the disaster, we asked threequestions regarding the quality, frequency and durationof daily physical activity, with participants divided intolow or normal levels as per previous reports.16 17
Levels of psychological distress after the disaster wereassessed by the Kessler Psychological Distress Scale (K6)questionnaires.18 On the basis of a previous study usingthe K6 test among Japanese participants that consistedof six self-reported items, participants were classifiedinto those with psychological distress (scores of 5–24)and those with no psychological distress (scores of0–4).19 Sleep difficulty was assessed using the AthensInsomnia Scale.20 On the basis of a previous study usingthe Athens Insomnia Scale, participants were classifiedas those with insomnia (scores of 6–24) and those withno insomnia (scores of 0–5).21
Employment status after the disaster was assessed by aself-reported questionnaire. On the basis of theiranswers, participants were categorised into two groups:unemployment or not. Economic status was also assessedby asking the question “How do you feel about yourcurrent economic situation?” Participants were asked tochoose one of the four answers (very serious, serious,slightly serious or usual). On the basis of their answers,participants were categorised into two groups: economicdeprivation (very serious, serious and slightly serious) orusual.
We asked about medical history of diabetes mellitus,dyslipidaemia and hypertension in the questionnaires,and the participants were categorised into two groups(yes or no) for diabetes mellitus, dyslipidaemia andhypertension.
Statistical analysisSeveral baseline characteristics and changes in cardio-metabolic parameters between phase 1 and phase 2were compared in the REL group and the non-RELgroup. In crude analysis, the differences were tested by aχ2 test for categorical variables and Student’s t test forcontinuous variables. Categorical variables were shownas the proportion (%) and continuous variables wereshown as the mean and 95% CI. In sex-adjusted andage-adjusted analysis, the differences were tested bylogistic regression analysis for categorical variables andby analysis of covariance for continuous variables.Categorical variables were shown as the proportion (%)and continuous variables were shown as the mean and95% CI. The changes in anthropometric and clinicalcharacteristics between the two phases were calculatedby subtracting variables in phase 1 from variables inphase 2. In crude analysis, mean changes in several vari-ables were compared between the REL group and thenon-REL group by using Student’s t test. In sex-adjustedand age-adjusted analysis, adjusted mean changes werecompared between the REL group and the non-RELgroup by using analysis of covariance and were shown asthe adjusted mean±SE. In addition, to determinewhether REL was an independent variable to predictchanges in body weight, stepwise multiple linear regres-sion analysis was used to adjust for potential risk factors(sex, age, weight, SBP, smoking status, physical activity,psychological distress, unemployment and economicdeprivation).All p values were based on two-sided tests, and
p values of less than 0.05 were considered statistically sig-nificant. The Statistical Package for Social Sciences(SPSS) V.19.0 (IBM) was used for all analyses.
RESULTSTable 1 shows the clinical characteristics of participantsin terms of demographic and anthropometric data,clinical characteristics, lifestyle, mental health and socio-economic status for the REL and non-REL groups at the2011 baseline survey (phase 1). The final numbers ofparticipants were 3160 in the REL group and 3368 inthe non-REL group. The percentage of men was not sig-nificantly different between the two groups (38% forREL vs 38% for non-REL; p=0.972). In crude analysis,the average ages were 61 years for the REL group and63 years for the non-REL group (p<0.001). Body weightin the REL group was significantly higher than that inthe non-REL group (58.7 vs 57.8 kg; p=0.001). Waist cir-cumference was not significantly different between thetwo groups (p=0.238).
4 Takahashi S, et al. BMJ Open 2016;6:e011291. doi:10.1136/bmjopen-2016-011291
Open Access
on 21 May 2018 by guest. P
rotected by copyright.http://bm
jopen.bmj.com
/B
MJ O
pen: first published as 10.1136/bmjopen-2016-011291 on 12 M
ay 2016. Dow
nloaded from

Table 1 Comparison of baseline characteristics of the 2011 baseline survey (phase 1) between the REL group and the non-REL group
Crude Adjusted
REL (N=3160) non-REL (N=3368) p Value REL (N=3160) non-REL (N=3368) p Value
Demographic data
Sex (male) 38% 38% 0.972
Age (years) 61.2 (60.7–61.7) 63.4 (62.9–63.8) <0.001
Anthropometric data
Body weight (kg) 58.7 (58.3–59.1) 57.8 (57.4–58.1) 0.001 59.9 (59.6–60.3) 59.4 (59.1–59.7) 0.016
Waist circumference (cm) 83.1 (82.8–83.5) 82.9 (82.6–83.2) 0.238 83.6 (83.3–83.9) 83.2 (82.9–83.5) 0.073
Clinical data
SBP (mm Hg) 125.3 (124.7–125.9) 127.4 (126.8–128.1) <0.001 126.1 (125.5–126.7) 127.4 (126.8–128.0) 0.003
DBP (mm Hg) 74.0 (73.6–74.3) 74.5 (74.2–74.9) 0.030 74.5 (74.1–74.9) 74.9 (74.5–75.3) 0.108
TC (mg/dL) 205.9 (204.7–207.1) 204.4 (203.2–205.6) 0.084 204.4 (203.1–205.6) 202.9 (201.8–204.1) 0.099
HDLC (mg/dL) 63.9 (63.3–64.5) 63.7 (63.1–64.3) 0.666 62.9 (62.3–63.5) 63.0 (62.4–63.6) 0.822
LDLC (mg/dL) 118.9 (117.9–120.0) 117.5 (116.4–118.5) 0.049 118.0 (117.0–119.1) 116.4 (115.4–117.4) 0.029
non-HDLC (mg/dL) 142.0 (140.7–143.2) 140.7 (139.5–141.9) 0.136 141.5 (140.2–142.7) 140.0 (138.7–141.2) 0.089
LH ratio 2.01 (1.98–2.04) 1.99 (1.96–2.02) 0.329 2.03 (2.00–2.06) 2.00 (1.97–2.03) 0.155
TG (mg/dL) 140.0 (136.9–143.0) 137.2 (134.3–140.0) 0.188 142.9 (139.9–145.9) 140.3 (137.3–143.2) 0.215
HbA1c (%) 5.67 (5.65–5.69) 5.68 (5.66–5.70) 0.528 5.69 (5.67–5.71) 5.68 (5.66–5.70) 0.483
Creatinine (mg/dL) 0.70 (0.70–0.71) 0.71 (0.70–0.72) 0.330 0.71 (0.70–0.72) 0.73 (0.73–0.74) 0.798
Lifestyle
Current smokers 16% 12% <0.001 12% 10% 0.051
Drinkers 33% 31% 0.199 33% 33% 0.608
Low physical activity 70% 62% <0.001 69% 61% <0.001
Mental health
Psychological distress 47% 37% <0.001 46% 36% <0.001
Insomnia 38% 27% <0.001 36% 25% <0.001
Socioeconomic status
Unemployment 24% 14% <0.001 23% 14% <0.001
Economic deprivation 59% 43% <0.001 59% 44% <0.001
Medical history
Diabetes mellitus 8% 6% 0.061 7% 6% 0.008
Dyslipidaemia 14% 13% 0.061 12% 10% 0.043
Hypertension 34% 34% 0.219 32% 29% 0.017
In the crude analysis, categorical variables are shown as proportion (%) and continuous variables are shown as mean and 95% CI.In sex-adjusted and age-adjusted analysis, categorical variables are shown as adjusted proportion (%) and continuous variables are shown as adjusted mean and 95% CI.DBP, diastolic blood pressure; HbA1c, glycosylated haemoglobin; HDLC, high-density lipoprotein cholesterol; LDLC, low-density lipoprotein cholesterol; LH ratio, LDL/HDL cholesterol ratio;non-HDLC, non-high-density lipoprotein cholesterol; non-REL group, non-relocation group; REL group, relocation group; SBP, systolic blood pressure; TC, total cholesterol; TG, triglyceride.
TakahashiS,etal.BMJOpen
2016;6:e011291.doi:10.1136/bmjopen-2016-011291
5
OpenAccess
on 21 May 2018 by guest. Protected by copyright. http://bmjopen.bmj.com/ BMJ Open: first published as 10.1136/bmjopen-2016-011291 on 12 May 2016. Downloaded from

In sex/age-adjusted analysis, systemic blood pressurewas significantly lower in the REL group than in thenon-REL group (SBP, p=0.003; DBP, p=0.108). For thelipid panel, although there were no significant differ-ences in baseline levels of TC, HDLC, non-HDLC, LHratio and TG between the two groups, serum LDLC inthe REL group was significantly higher than that in thenon-REL group (p=0.029). Serum levels of HbA1c andcreatinine were comparable between the two groups.Although the adjusted proportion of current smokers
in the REL group was higher than that in the non-RELgroup (12% vs 10%; p=0.051), there was no significantdifference in the proportion of drinkers between thetwo groups (table 1). Daily physical activity assessed bythe self-reported questionnaires was predominantlylower in the REL group (69% vs 61%; p<0.001). Thepercentage of participants with psychological distress wassignificantly higher in the REL group than in thenon-REL group (K6 score higher than 5 points: 46% vs36%: p<0.001). Similarly, the frequency of insomnia(Athens Insomnia Scale ≥6 points) was significantlyhigher in the REL group (36% vs 25%; p<0.001). Theprevalence of unemployment or economic deprivationwas significantly higher in the REL group (unemploy-ment: 23% vs 14%, p<0.001; deprivation: 59% vs 44%,p<0.001).Although proportions of participants with a medical
history of diabetes mellitus, dyslipidaemia and hyperten-sion were not significantly different between the RELgroup and the non-REL group in crude analysis,adjusted proportions were higher in the REL groupthan in the non-REL group (diabetes mellitus, p=0.008;dyslipidaemia, p=0.043; hypertension, p=0.017).Table 2 shows a comparison of crude and sex/
age-adjusted mean changes in anthropometric measure-ments and clinical characteristics between phase 1 andphase 2 for the REL and non-REL groups. The differencesin crude changes in body weight (+0.35 vs—0.21 kg;p<0.001) and waist circumference (+0.57 vs+0.04 cm;p<0.001) were significantly greater in the REL group thanin the non-REL group. After adjustment for sex and age,these differences remained robust (body weight:+0.31 kgin REL vs −0.24 kg in non-REL, p<0.001; waist circumfer-ence:+0.58 cm in REL versus+0.05 cm in non-REL,p<0.001; table 2, figure 3A, B).When multivariate regression analysis was performed
to determine whether REL was an independent variableto predict changes in body weight between phases 1 and2, this factor was the most powerful predictor forchanges in body weight even after controlling for severalconfounding factors (table 3).For other changes in the metabolic risk profile, the
only significant difference between the two groups wasin crude HDLC levels (−0.75 in REL vs −0.17 mg/dL innon-REL, p=0.007; table 2). The significance was appar-ent after sex/age-adjusted analysis (−0.65 mg/dL inREL vs −0.09 mg/dL in non-REL, p=0.009; figure 3C).However, other clinical parameters such as blood
Table
2Comparisonofcrudeandsex/age-adjustedmeanchangesin
anthropometric
andclinicalcharacteristicsbetweentheRELgroupandthenon-R
ELgroup
Crude
Adjusted
REL(N
=3160)
non-R
EL(N
=3368)
pValue
REL(N
=3160)
non-R
EL(N
=3368)
pValue
Anthropometric
data
Bodyweight(kg)
0.35(0.26to
0.44)
−0.21(−0.28to
−0.14)
<0.001
0.31(0.23to
0.39)
−0.24(−0.32to
−0.16)
<0.001
Waistcircumference(cm)
0.57(0.46to
0.68)
0.04(−0.31to
−0.13)
<0.001
0.58(0.48to
0.68)
0.05(−0.05to
0.15)
<0.001
Clinicaldata
SBP(m
mHg)
−1.14(−1.62to
−0.66)
−1.54(−0.31to
−0.13)
0.255
−1.23(−1.73to
−0.73)
−1.60(−2.08to
−1.11)
0.294
DBP(m
mHg)
−0.85(−1.13to
−0.57)
−1.02(−0.31to
−0.13)
0.373
−0.88(−1.17to
−0.60)
−1.05(−1.33to
−0.78)
0.389
TC
(mg/dL)
−3.47(−4.43to
−2.52)
−2.65(−0.31to
−0.13)
0.207
−3.50(−4.44to
−2.57)
−2.76(−3.66to
−1.85)
0.255
HDLC
(mg/dL)
−0.75(−1.06to
−0.44)
−0.17(−0.31to
−0.13)
0.007
−0.65(−0.96to
−0.34)
−0.09(−0.39to
0.21)
0.009
LDLC
(mg/dL)
2.12(1.29to
2.95)
2.57(−0.31to
−0.13)
0.431
2.01(1.21to
2.82)
2.41(1.63to
3.19)
0.483
Non-H
DLC
(mg/dL)
−2.72(−3.65to
−1.79)
−2.48(−0.31to
−0.13)
0.703
−2.85(−3.76to
−1.94)
−2.67(−3.55to
−1.79)
0.775
LH
ratio
0.06(0.04to
0.08)
0.05(−0.31to
−0.13)
0.202
0.06(0.04to
0.07)
0.04(0.03to
0.06)
0.186
TG
(mg/dL)
3.04(0.13to
5.96)
0.51(−0.31to
−0.13)
0.207
2.24(−0.62to
5.10)
−0.27(−3.05to
2.51)
0.211
HbA1c(%
)0.04(0.02to
0.05)
0.04(−0.31to
−0.13)
0.908
0.03(0.02to
0.05)
0.04(0.02to
0.05)
0.987
Resultswere
shownasmeanand95%
CIin
thecrudeanalysis,andadjustedmeanand95%
CIin
thesex-adjustedandage-adjustedanalysis.
DBP,diastolic
bloodpressure;HbA1c,glycosylatedhaemoglobin;HDLC,high-densitylipoprotein
cholesterol;LDLC,low-densitylipoprotein
cholesterol;LH
ratio,LDL/HDLcholesterolratio;
non-H
DLC,non-high-densitylipoprotein
cholesterol;non-R
EL,non-relocationgroup;REL,relocationgroup;SBP,systolic
bloodpressure;TC,totalcholesterol;TG,triglyceride.
6 Takahashi S, et al. BMJ Open 2016;6:e011291. doi:10.1136/bmjopen-2016-011291
Open Access
on 21 May 2018 by guest. P
rotected by copyright.http://bm
jopen.bmj.com
/B
MJ O
pen: first published as 10.1136/bmjopen-2016-011291 on 12 M
ay 2016. Dow
nloaded from

pressure and serum HbA1c did not differ significantlybetween the two phases (table 2).
DISCUSSIONThe present study demonstrated that even more than1 year after the devastating natural disaster, cardiometa-bolic risk factors such as body weight/waist circumfer-ence were increasing with deteriorating serum lipidprofiles, especially HDLC, among survivors who hadexperienced serious disaster-related property damage asreferenced by REL. These survivors had lost their homesbecause of the tsunami and had been forced to live intemporary housing (see online supplementary figureS2–3). In such cases, it is possible that those people hadalso lost family members, relatives and/or friends, prop-erty and jobs, and were more likely to be experiencinglong-term psychological distress. To the best of ourknowledge, this study is the first to determine longitu-dinal changes in several ACV risk factors combined withlifestyle and psychological and socioeconomic para-meters in survivors of the devastating tsunami.
Previous studiesSeveral previous studies have shown short-term changesin anthropometric parameters, blood pressure, heartrate, lipids and glycaemic index after natural disasters inrelatively small numbers of people in specific popula-tions such as patients with hypertension,22–24 those withdiabetes,25 factory workers26 and disaster evacuees.27
However, there have been few studies in which the long-term impacts of a devastating tsunami on these para-meters were examined in a large number of participantsselected from the general population. Moreover, in pre-vious studies, the impact of psychological distress andsocioeconomic problems caused by the disaster wasrarely incorporated into the analysis.In fact, Tsubokura et al27 showed that in evacuees
living in temporary housing (n=200) in Fukushima pre-fecture, body weight, BMI, waist circumference andHbA1c were significantly increased but serum HDLCwas decreased at 6 months after the disaster comparedto those observed before the disaster. Although ourresults are partially consistent with results of that study,there were no control participants (non-evacuees) and
Figure 3 Comparison of sex-adjusted and age-adjusted mean changes in body weight (3A), waist circumference (3B) and
serum HDLC level (3C) between phase 1 and phase 2 surveys for the REL and non-REL groups. Adjusted mean and 95% CI.
HDLC, high-density lipoprotein cholesterol; REL, relocation group; non-REL, non-relocation group.
Table 3 Multiple linear regression analysis of variables for examining mean change in body weight between phase 1 and
phase 2 (stepwise selection methods)
Model 1 Model 2 Model 3
Variable β (SE) p Value β (SE) p Value β (SE) p Value
REL vs non-REL (2012) 0.55 (0.06) <0.001 0.55 (0.06) <0.001 0.56 (0.06) <0.001
Sex −0.31 (0.06) <0.001 −0.22 (0.07) 0.001 −0.30 (0.06) <0.001
Age (2011) −0.01 (0.00) 0.031 Not included Not included
Body weight (2011) −0.01 (0.00) 0.038 Not included
SBP (2011) −0.01 (0.00) <0.001 −0.01 (0.00) <0.001
Current smokers vs not current smokers (2011) Not included
Low physical activity vs normal physical activity
(2011)
Not included
Psychological distress vs no psychological
distress (2011)
Not included
Unemployment vs not unemployment (2011) −0.17 (0.07) 0.023
Economic deprivation vs usual (2011) Not included
β: Partial regression coefficients.p Values were calculated by multiple linear regression analysis.non-REL group, non-relocation group; REL group, relocation group; SBP, systolic blood pressure.
Takahashi S, et al. BMJ Open 2016;6:e011291. doi:10.1136/bmjopen-2016-011291 7
Open Access
on 21 May 2018 by guest. P
rotected by copyright.http://bm
jopen.bmj.com
/B
MJ O
pen: first published as 10.1136/bmjopen-2016-011291 on 12 M
ay 2016. Dow
nloaded from

no psychological or socioeconomic survey in that study.Therefore, the interpretation of changes in the cardio-metabolic risk factors in Tsubokura’s report may havelimitations. In Italy, factory workers who experienced acatastrophic earthquake showed significant increases inbody weight and serum levels of TC and TG 2 monthsafter the disaster compared to those of unexposed parti-cipantts.26 This increase in body weight after the disasteris comparable with our results, but serum levels of TCand TG were not significantly changed in our studyperiod. The major differences between our study andthe previous study were the timing of the study and thedegree/type of disaster. In the Italian study, dataobtained before and 2 months after the earthquake werecompared, whereas changes in metabolic profile from 8to 18 months after the earthquake and subsequenttsunami were investigated in our study. In terms of ourstudy, it may be plausible that even more than 1 yearafter the complex disaster, body weight/waist circumfer-ence and lipid levels would have deteriorated consist-ently in adults in the general population whoexperienced tsunami-related evacuation.Subjects in our study who suffered earthquake
damage only without serious tsunami damage (non-RELgroup) showed no changes in metabolic profiles duringthe study period. This group also seemed to experiencesignificantly better conditions for lifestyle, mental healthand socioeconomic status compared to those for theREL participants. Thus, this study suggests thatthe mental and socioeconomic problems caused by thetsunami may lead to a continuous deterioration in cardi-ometabolic risks and impaired health status. The extentof psychological and social disruption caused by themajor tsunami in the affected population may thus begreater than that caused by the earthquake itself.
Mental health and socioeconomic statusWhile previous studies have shown worsening mentalhealth after catastrophic disasters,28 29 few studies havefocused on postdisaster psychological distress as repre-sented by disaster-related REL. Yokoyama et al14 showeda relationship between the extent of REL and thedegree of deterioration in mental health problems. Inour study, there was a significant difference in meanbody weight and waist circumference changes duringthe two study phases between the REL group and thenon-REL group. The percentage of participants with psy-chological distress as evaluated by the K6 score was sig-nificantly higher in the REL group than in the non-RELgroup. In addition, as shown in table 1, participants withREL were more likely to have lost jobs and were morelikely to have experienced a serious economic crisis. Itmay therefore be possible that disaster-related mentaldistress and socioeconomic problems worsen metabolicrisk factors indirectly by motivating harmful behaviourssuch as cigarette smoking and physical inactivity. In addi-tion, several recent studies have suggested that indivi-duals with higher psychological stress were more likely
to exhibit less healthy dietary behaviours with higherbody weight30 31 and higher cardiometabolic risk.32
Weight gain and HDLCThis study showed significant weight gain and increasedwaist circumference together with decreased levels ofserum HDLC during the convalescent phase after thedisaster in the REL group. There are several possiblecauses for the decreased serum HDLC level includingphysical inactivity, smoking, weight gain, elevated TG,end-stage renal disease and type 2 diabetes mellitus.33
Our results showed significant differences in bodyweight and waist circumference changes and in physicalactivity patterns and smoking status between the RELgroup and the non-REL group. Thus, it is likely thatthese factors contributed to the decrease in serumHDLC levels in the REL group. The possible mechan-isms for decreased HDLC in the REL group are consid-ered to be as follows. Increased visceral fat increases freefatty acid levels, elevates serum levels of TG and very low-density lipoprotein, and impairs bioactivity of cholesterolester transfer protein and hepatic lipase. Our study alsoshowed lower physical activity levels in participants inthe REL group. Physical training has been reported toimprove lipoprotein lipase activity and insulin resistancewith decreases in cholesterol ester transfer protein activ-ity and serum TG. Inversely, physical inactivity maydecrease the serum level of HDLC. In addition, the per-centage of current smokers was higher in the RELgroup. Chelland Campbell et al34 suggested that cigar-ette smoking stimulates the sympathetic nervous systemand thus activates free fatty acid release. This promotesan increase in circulation of very low-density lipoproteinand LDLC and thus causes lower serum HDLC levels.
LimitationsThis study had several limitations. First, since the initial(phase 1) survey began several months after the disaster,atherosclerotic cardiovascular risk factors including life-style and socioeconomic state before the prior disastercould not be determined. Therefore, it is possible thatthese results were already in a trajectory of worseningbody weight gain, increased waist circumference anddecreased HDLC levels. However, as shown in table 1,there were close relationships between REL and severaldisaster-related unhealthy conditions including smoking,physical inactivity, psychological distress and socio-economic deprivations. In view of these, we believe thatREL in this study might be a general marker of a clusterof disaster-related health strains, and that it might alsobe associated with observed results. Second, although weassessed mental health status using the standard K6questionnaires only, it is not clear whether K6 scoring isthe best method for determining mental status after thistype of major disaster. Of course, there is no doubt thatour participants were living in extremely stressful circum-stances after the disaster, but we may have needed addi-tional, more detailed mental tests. Third, we were
8 Takahashi S, et al. BMJ Open 2016;6:e011291. doi:10.1136/bmjopen-2016-011291
Open Access
on 21 May 2018 by guest. P
rotected by copyright.http://bm
jopen.bmj.com
/B
MJ O
pen: first published as 10.1136/bmjopen-2016-011291 on 12 M
ay 2016. Dow
nloaded from

unable to adjust for use of medications, especially psy-chotropic and antihyperlipidaemic drugs, which haveimplications for cardiometabolic risk factors. In add-ition, caloric intake, level of income, job status and edu-cational level of the participants before the disaster werenot determined. We could not completely exclude thepossibility that these unmeasured variables might causea certain bias in the present results. Fourth, we couldnot determine whether there was any increase in theincidence of diabetes mellitus, hypertension or athero-sclerotic cardiovascular events during this study period.We need to investigate the relationships between thesedisorders and changes in atherosclerotic cardiovascularrisk profiles. Fifth, our participants may not be represen-tative of the general population because three-fourths ofthe residents did not attend the initial survey in 2011.Those who did not participate in our survey might haveserious diseases and be under medical care or theymight have been busy mostly due to postdisaster settings.On the other hand, those who took part in our surveytended to be conscious of their health. Finally, one-fourth of the participants (approximately 26%) in theinitial survey did not participate in the phase 2 survey.We therefore compared several anthropometric mea-surements and clinical parameters in the phase 1 surveybetween non-participants (n=2689) and participants(n=6528) (see online supplementary Table S1). In sex/age-adjusted analysis, systemic blood pressure was signifi-cantly higher in the non-participants than in the partici-pants, and the adjusted proportion of current smokerswas higher in the non-participants than in the partici-pants. These results suggest that the non-participantsmay be unhealthier after the phase 1 study than the par-ticipants of the phase 2 study. This bias may thus haveled to an underestimation in our results.
CONCLUSIONDuring the convalescent phase more than 1 year afterthe disaster, we found that REL was related to weightgain and decreasing HDLC after the disaster. In thelight of these findings, we believe that long-term vigi-lance for changes in atherosclerotic cardiovascular riskfactors and events is warranted after any future devastat-ing disasters.
Author affiliations1Department of International Health, Nagasaki University Graduate School ofBiomedical Sciences, Sakamoto, Nagasaki, Japan2Department of Hygiene and Preventive Medicine, Iwate Medical University,School of Medicine, Shiwa-gun, Iwate, Japan3Division of Cardioangiology, Department of Internal Medicine, Iwate MedicalUniversity, School of Medicine, Morioka, Iwate, Japan4Iwate Medical University, Morioka, Iwate, Japan5Department of Plastic and Reconstructive Surgery, Iwate Medical University,School of Medicine, Morioka, Iwate, Japan
Acknowledgements The authors would like to thank the participants in thestudy as well as their fellow healthcare workers. They also thank Drs. MikihitoIshiki, Masahiro Ueno, Makoto Koshiyama, Kazuyoshi Itai, Masaki Osawa,
Toru Kuribayashi, Ryohei Sasaki, Nobuyuki Takanashi and Yukari Yokoyamafor their useful advice.
Contributors ST was involved in the analysis of data, interpretation of dataand drafting of the manuscript. MN was involved in the study concept anddesign, interpretation of data and the critical revision of the manuscript. YYand KT helped the statistical analyses and participated in the data collection,database design and manuscript review. KS and AO participated in the studydesign, database design and manuscript review. SK is the chairperson of theRIAS Study and was involved in the study concept and design, criticalrevision of the manuscript and acquisition of funding.
Funding The study was supported by a Health Labour Sciences Research Grantfrom the Ministry of Health, Labour, and Welfare of Japan (H23-Tokubetsu-Shitei-002; H24-kenki-sitei-001).
Competing interests None declared.
Patient consent Obtained.
Ethics approval The Ethics Committee of Iwate Medical University (approvalno. H23-69).
Provenance and peer review Not commissioned; externally peer reviewed.
Data sharing statement No additional data are available.
Open Access This is an Open Access article distributed in accordance withthe Creative Commons Attribution Non Commercial (CC BY-NC 4.0) license,which permits others to distribute, remix, adapt, build upon this work non-commercially, and license their derivative works on different terms, providedthe original work is properly cited and the use is non-commercial. See: http://creativecommons.org/licenses/by-nc/4.0/
REFERENCES1. The National Police Agency, Japan. Damage Situation and Police
Countermeasures associated with 2011Tohoku district—off thePacific Ocean Earthquake. 2015. [updated 10 December 2015; cited3 January 2016]. https://www.npa.go.jp/archive/keibi/biki/higaijokyo_e.pdf
2. Matsubara C, Murakami H, Imai K, et al. Prevalence and risk factorsfor depressive reaction among resident survivors after the tsunamifollowing the Great East Japan Earthquake, March 11, 2011. PLoSONE 2014;9:e109240.
3. Kloner RA, Leor J, Poole WK, et al. Population-based analysis of theeffect of the Northridge Earthquake on cardiac death in Los AngelesCounty, California. J Am Coll Cardiol 1997;30:1174–80.
4. Leor J, Poole WK, Kloner RA. Sudden cardiac death triggered by anearthquake. N Engl J Med 1996;334:413–19.
5. Watanabe H, Kodama M, Okura Y, et al. Impact of earthquakes onTakotsubo cardiomyopathy. JAMA 2005;294:305–7.
6. Tanaka F, Makita S, Ito T, et al. Relationship between the seismicscale of the 2011 northeast Japan earthquake and the incidence ofacute myocardial infarction: a population-based study. Am Heart J2015;169:861–9.
7. Niiyama M, Tanaka F, Nakajima S, et al. Population-based incidenceof sudden cardiac and unexpected death before and after the 2011earthquake and tsunami in Iwate, northeast Japan. J Am HeartAssoc 2014;3:e000798.
8. Nakamura M, Tanaka F, Nakajima S, et al. Comparison of theincidence of acute decompensated heart failure before and after themajor tsunami in Northeast Japan. Am J Cardiol 2012;110:1856–60.
9. Omama S, Yoshida Y, Ogasawara K, et al. Influence of the greatEast Japan earthquake and tsunami 2011 on occurrence ofcerebrovascular diseases in Iwate, Japan. Stroke 2013;44:1518–24.
10. Nakagawa I, Nakamura K, Oyama M, et al. Long-term effects of theNiigata-Chuetsu earthquake in Japan on acute myocardial infarctionmortality: an analysis of death certificate data. Heart 2009;95:2009–13.
11. Peters MN, Katz MJ, Moscona JC, et al. Effect of Hurricane Katrinaon chronobiology at onset of acute myocardial infarction during thesubsequent three years. Am J Cardiol 2013;111:800–3.
12. Dimsdale JE. Psychological stress and cardiovascular disease.J Am Coll Cardiol 2008;51:1237–46.
13. Japan Science and Technology Agency. The Great East JapanEarthquake information from official websites [Internet]. 2011. (cited12 Octpber 2014). http://www.jst.go.jp/saigai.html
14. Yokoyama Y, Otsuka K, Kawakami N, et al. Mental health andrelated factors after the Great East Japan earthquake and tsunami.PLoS ONE 2014;9:e102497.
Takahashi S, et al. BMJ Open 2016;6:e011291. doi:10.1136/bmjopen-2016-011291 9
Open Access
on 21 May 2018 by guest. P
rotected by copyright.http://bm
jopen.bmj.com
/B
MJ O
pen: first published as 10.1136/bmjopen-2016-011291 on 12 M
ay 2016. Dow
nloaded from
15. Seino Y, Nanjo K, Tajima N, et al. Report of the committee on theclassification and diagnostic criteria of diabetes mellitus. J DiabetesInvestig 2010;1:212–28.
16. Ministry of health, labor and welfare, Japan. Exercise guidelines forgood health 2006. 2006. http://www.mhlw.go.jp/bunya/kenkou/undou02/pdf/data.pdf (accessed 3 Aug 2015).
17. Murakami H, Yoshimura E, Ishikawa-Takata K, et al. Validity andreproducibility of a physical activity questionnaire used for healthsurveying among victims of the Great East Japan Earthquake. NihonKoshu Eisei Zasshi 2013;60:222–30.
18. Kessler RC, Barker PR, Colpe LJ, et al. Screening for seriousmental illness in the general population. Arch Gen Psychiatry2003;60:184–9.
19. Sakurai K, Nishi A, Kondo K, et al. Screening performance of K6/K10 and other screening instruments for mood and anxiety disordersin Japan. Psychiatry Clin Neurosci. 2011;65:434–41.
20. Soldatos CR, Dikeos DG, Paparrigopoulos TJ. Athens InsomniaScale: Validation of an instrument based on ICD-10 criteria.J Psychosom Res 2000;48:555–60.
21. Okajima I, Nakajima S, Kobayashi M, et al. Development andvalidation of the Japanese version of the Athens Insomnia Scale.Psychiatry Clin Neurosci 2013;67:420–5.
22. Kario K, Matsuo T, Kobayashi H, et al. Earthquake-inducedpotentiation of acute risk factors in hypertensive elderly patients:possible triggering of cardiovascular events after a majorearthquake. J Am Coll Cardiol 1997;29:926–33. [published OnlineFirst: 1 April 1997].
23. Minami J, Kawano Y, Ishimitsu T, et al. Effect of the Hanshin-Awajiearthquake on home blood pressure in patients with essentialhypertension. Am J Hypertens 1997;10:222–5.
24. Satoh M, Kikuya M, Ohkubo T, et al. Acute and subacute effects ofthe great East Japan earthquake on home blood pressure values.Hypertension 2011;58:e193–4.
25. Ogawa S, Ishiki M, Nako K, et al. Effects of the Great East JapanEarthquake and huge tsunami on glycaemic control and bloodpressure in patients with diabetes mellitus. BMJ Open 2012;2:e000830.
26. Trevisan M, Celentano E, Meucci C, et al. Short-term effect ofnatural disasters on coronary heart disease risk factors.Arteriosclerosis 1986;6:491–4.
27. Tsubokura M, Takita M, Matsumura T, et al. Changes in metabolicprofiles after the Great East Japan Earthquake: a retrospectiveobservational study. BMC Public Health 2013;13:267.
28. Galea S, Nandi A, Vlahov D. The epidemiology of post-traumaticstress disorder after disasters. Epidemiol Rev 2005;27:78–91.
29. Van Griensven F, Chakkraband ML, Thienkrua W, et al. Mentalhealth problems among adults in tsunami-affected areas in southernThailand. JAMA 2006;296:537–48.
30. Moore CJ, Cunningham SA. Social position, psychological stress,and obesity: a systematic review. J Acad Nutr Diet2012;112:518–26.
31. Harding JL, Backholer K, Williams ED, et al. Psychosocial stress ispositively associated with body mass index gain over 5 years:evidence from the longitudinal AusDiab study. Obesity (SilverSpring) 2014;22:277–86.
32. Winning A, Glymour MM, McCormick MC, et al. Psychologicaldistress across the life course and cardiometabolic risk: findingsfrom the 1958 British Birth Cohort Study. J Am Coll Cardiol2015;66:1577–86.
33. Hayden MR, Tyagi SC. Isolated low high density lipoprotein-cholesterol (HDL-C): implications of global risk reduction. Case reportand systematic scientific review. Cardiovasc Diabetol 2005;4:1.
34. Chelland Campbell S, Moffatt RJ, Stamford BA. Smoking andsmoking cessation—the relationship between cardiovasculardisease and lipoprotein metabolism: a review. Atherosclerosis2008;201:225–35.
10 Takahashi S, et al. BMJ Open 2016;6:e011291. doi:10.1136/bmjopen-2016-011291
Open Access
on 21 May 2018 by guest. P
rotected by copyright.http://bm
jopen.bmj.com
/B
MJ O
pen: first published as 10.1136/bmjopen-2016-011291 on 12 M
ay 2016. Dow
nloaded from