Download final project report
199
The VINGA Project Final Report 30 Nov 2011 Edition 04.00 Project ID: VINGA Final Report D2011-019555
Transcript of Download final project report

The VINGA Project Final Report
30 Nov 2011 Edition 04.00
Project ID: VINGA Final Report D2011-019555

Project ID: VINGA Final Report Edition: 04.00 30 Nov 2011
Page 2 of 103
Authoring Prepared By Name Organisation Date Niclas Wiklander LFV-VINGA Project Manager 20 Dec 2011 Erwan Cadot Airbus 20 Dec 2011 Tom Maier Airbus 20 Dec 2011 Ulrika Ziverts Novair 20 Dec 2011 Andreas Linnér Novair 20 Dec 2011 Rikard Eklund Novair 20 Dec 2011 Henrik Ekstrand Novair 20 Dec 2011 Annika Hilmersson Swedavia 20 Dec 2011 Deborah Mitchell Chalmers University 20 Dec 2011
Document History Version Effective Date Page(s) Affected Reason for and Extent of
Change(s) 00.01 16 Nov 2011 All Initial version 00.02 19 Nov 2011 All Revised version 00.03 20 Nov 2011 All Revised version 00.04 23 Nov 2011 All Revised version 01.00 25 Nov 2011 All Version for the
Acceptance meeting 02.00 09 Dec 2011 All Final version 03.00 20 Dec 2011 All Final version – including
SJU comments 04.00 02 Jan 2012 49,50,51 Final version – including
SJU comments and three changes

Nomenclature ACMS Aircraft Condition Monitoring System AGL Above Ground Level AIP Aeronautical Information Package AIRE Atlantic Interoperability Initiative to Reduce Emissions ARINC Aeronautical Radio, Incorporated AMAN Arrival Manager AMC Acceptable Means of Compliance ANSP Air Navigation Service Providers AP Auto Pilot APU Auxiliary Power Unit APV Approach Procedure with Vertical guidance ATC Air Traffic Control ATCC Air Traffic Control Centres ATCO Air Traffic Control Operator ATM Air Traffic Management ATS Air Traffic Services Baro-VNAV Barometric Vertical Navigation CAA Civil Aviation Authority CCD Continuous Climb Departure CDO Constant Descent Operation CFIT Controlled Flight Into Terrain CFMU Central Flow Management Unit CO2 Carbon dioxide CTA Controlled Time of Arrival CTOT Calculated Take off Time DA Decision Altitude DAR Digital ACMS Recorder dB(A) Decibel (A weighting) DME Distance Measuring Equipment EASA European Aviation Safety Agency ETA Estimated Time of Arrival FAA Federal Aviation Administration FAF Final Approach Fix FAP Final Approach Point FD Flight Director FDM Flight Data Monitoring FDR Flight Data Recorder FIR Flight Information Region FL Flight Level (altitude in feet/100) FMGS Flight Management Guidance System FRAS Free Route Airspace Sweden FT Feet (0,3048 m) FTE Flight Technical Error FRT Fixed Radius Transition GHG Green House Gases GLS GNSS Landing System GNSS Global Navigation Satellite System G/S Glide Slope i4D Initial Four Dimensional IAF Initial Approach Fix IAP Instrument Approach Procedure IATA International Air Transport Association ICAO International Civil Aviation Organisation ILS Instrument Landing System INM Integrated Noise Model INS Inertial Navigation System IRS Inertial Reference System ISA International Standard Atmosphere KIAS Indicated Airspeed in Knots LNAV Lateral Navigation MF Metering Fix MLS Microwave Landing System MTOM Maximum Take-off Mass

Project ID: VINGA Final Report Edition: 04.00 30 Nov 2011
Page 4 of 103
MSA Minimum Sector/Safe Altitude (obstacle clearance of 984 ft) MSL Mean Sea Level ND Navigation Display NDB Navigation Data Base NM Nautical Mile (1852 m) NPA Non-Precision Approach NVR Novair (ICAO code) PBN Performance Based Navigation PEP Performance Engineer’s Program PFD Primary Flight Display P-RNAV Precision RNAV (RNAV 1) QAR Quick Access Recorder RF Radius to Fix RNAV Area Navigation RNP Required Navigation Performance RNP AR Required Navigation Performance Authorisation Required R/T Radiotelephony RTA Required Time of Arrival RWY Runway SID Standard Instrument Departure Procedure SES Single European Sky SESAR Single European Sky ATM Research Programme SJU SESAR Joint Undertaking SOP Standard Operating Procedure SQL Structured Query Language SSR Secondary Surveillance Radar STAR Standard Terminal Arrival Route TMA Terminal Manoeuvring Area TMC Terminal Control ToD Top of Descent TWR Air Traffic Control Tower UIR Upper Information Region WGS84 World Geodetic System 1984 WP Work Package XTK Cross Track 4D Four Dimensional

Project ID: VINGA Final Report Edition: 04.00 30 Nov 2011
Page 5 of 103
Table of Contents NOMENCLATURE .............................................................................................................................................. 3
EXECUTIVE SUMMARY .................................................................................................................................... 8
1 INTRODUCTION ........................................................................................................................................ 10 1.1 THE VINGA CONSORTIUM ................................................................................................................... 10
2 HIGH-LEVEL OBJECTIVES AND CONCEPTS OF THE VINGA PROJECT .................................. 15 2.1 LINKAGE BETWEEN VINGA AND THE SESAR PROGRAMME .............................................................. 16 2.2 RNP OPERATION.................................................................................................................................. 16 2.3 VINGA IN THE CONTEXT OF PBN ........................................................................................................ 18
3 OVERVIEW OF THE VALIDATION ENVIRONMENT ......................................................................... 19 3.1 GÖTEBORG LANDVETTER AIRPORT ..................................................................................................... 19 3.2 AIRSPACE STRUCTURE AND TRAFFIC FLOWS IN THE TMA .................................................................. 19 3.3 AIRSPACE STRUCTURE IN THE EN-ROUTE PHASE ................................................................................ 23
3.3.1 Free Route Airspace Sweden (FRAS) .................................................................................... 24 3.4 THE ATM GROUND SYSTEM ................................................................................................................. 25 3.5 VALIDATION AIRCRAFT .......................................................................................................................... 25
4 PRE-VALIDATION ACTIVITIES REGARDING IAP DESIGN ............................................................ 26
4.1 INTRODUCTION TO THE RNP CONCEPT ............................................................................................... 26 4.2 RNP AR APPROACH PROCEDURES ..................................................................................................... 28
4.2.1 Characteristics of RNP AR approaches.................................................................................. 29 4.2.2 RNP procedure design, validation and application ............................................................... 29 4.2.3 Statistical meteorological data for Göteborg Landvetter Airport ......................................... 30 4.2.4 RNP procedures and the airport environmental permit ........................................................ 30 4.2.5 Outcome of the RNP procedure application process ........................................................... 31
4.3 PREPARATION OF RNP TRANSITION TO ILS........................................................................................ 31 4.3.1 Design of RNP Transition to ILS .............................................................................................. 31 4.3.2 Dialogue with the Swedish CAA .............................................................................................. 32 4.3.3 Validation of RNP Transition to ILS ......................................................................................... 32 4.3.4 Planned number of flights - RNP Transition to ILS ............................................................... 33
5 EXECUTION PHASE OF THE VINGA PROJECT ............................................................................... 34 5.1 DEFINITION OF A VINGA FLIGHT .......................................................................................................... 34
6 ATM PERSPECTIVE OF VINGA ............................................................................................................ 35 6.1 ATM – PREPARATION .......................................................................................................................... 35
6.1.1 Workshops .................................................................................................................................. 35 6.1.2 Agreements and operational procedures ............................................................................... 36 6.1.3 ATM ground system upgrades ................................................................................................. 36 6.1.4 Preparation of tools for the ATM analysis part....................................................................... 37
6.2 EXECUTION OF THE VALIDATION FLIGHTS – ATM PERSPECTIVE ......................................................... 37 6.2.1 En-route phase ........................................................................................................................... 38
6.2.1.1 Direct routing for arriving flights ............................................................................................................ 38 6.2.1.2 CDO ......................................................................................................................................................... 39
6.2.2 Inbound ATC clearance via a RNP STAR and RNP AR approach .................................... 39 6.2.3 RNP STARs and RNP AR approaches in the TMA .............................................................. 41 6.2.4 RNP Transition to ILS ................................................................................................................ 41 6.2.5 Surface operation ....................................................................................................................... 41 6.2.6 Departure segment .................................................................................................................... 42
6.3 RESULTS OF IMPLEMENTATION FROM AN ATM PERSPECTIVE ............................................................. 43 6.3.1 Questionnaires and feedback from ATCOs ........................................................................... 43 6.3.2 Web track – a footprint .............................................................................................................. 44 6.3.3 Number of flights – RNP AR approaches ............................................................................... 44
Project ID: VINGA Final Report Edition: 04.00 30 Nov 2011
Page 6 of 103
6.3.4 Usage of RNP AR approaches during the validation period ................................................ 45 6.3.5 Reasons for not using RNP AR approaches .......................................................................... 46 6.3.6 CDO – ATM offering an undisturbed descent ........................................................................ 48 6.3.7 RNP implementation and its impact on the workload of the ATCOs .................................. 49
6.4 DIRECT ROUTING .................................................................................................................................. 51
7 AIRSPACE USER PERSPECTIVE OF VINGA .................................................................................... 52 7.1 RNP AR APPROACH OPERATION ......................................................................................................... 52
7.1.1 Introduction ................................................................................................................................. 52 7.1.2 RNP AR Execution ..................................................................................................................... 52
7.2 RNP TRANSITION TO ILS ..................................................................................................................... 54 7.2.1 Flight crew response to this concept of operation ................................................................. 56 7.2.2 Additional observations ............................................................................................................. 57 7.2.3 Recommendations to SESAR WP 9.09 .................................................................................. 57
7.3 MONITORING OF ONBOARD FMGS RTA FUNCTION ............................................................................ 58 7.3.1 i4D Concept of Operation ......................................................................................................... 58 7.3.2 Parameters of interest ............................................................................................................... 58 7.3.3 Monitoring scenarios.................................................................................................................. 58 7.3.4 How these monitoring flights were conducted ....................................................................... 58 7.3.5 Flight crew response to this concept of operation ................................................................. 59
7.4 DIRECT ROUTING .................................................................................................................................. 59 7.5 CDO ..................................................................................................................................................... 59
7.5.1 Logics of the FMGS in terms of CDO...................................................................................... 60 7.5.2 CDO operation in the context of VINGA ................................................................................. 61
7.6 SURFACE OPERATION ........................................................................................................................... 61 7.7 DEPARTURE PHASE .............................................................................................................................. 62 7.8 DATA COLLECTION ................................................................................................................................ 62
7.8.1 Flight Data Recorder Collection ............................................................................................... 62 7.8.2 Data processing ......................................................................................................................... 62
8 ARRIVAL PHASE – FLIGHT ANALYSIS AND RESULTS ................................................................ 63 8.1 FUEL EFFICIENCY ASSESSMENT ........................................................................................................... 63
8.1.1 Scope ........................................................................................................................................... 63 8.1.2 Data .............................................................................................................................................. 63 8.1.3 Method ......................................................................................................................................... 64
8.1.3.1 Overview .................................................................................................................................................. 64 8.1.3.2 Calculation of fuel consumption for theoretically optimal flight ........................................................ 64 8.1.3.3 Comparison between actual flight and theoretically optimal flight ................................................... 65 8.1.3.4 Flow chart ................................................................................................................................................ 68
8.1.4 Results ......................................................................................................................................... 69 8.1.4.1 RWY21 ..................................................................................................................................................... 70 8.1.4.2 RWY03 ..................................................................................................................................................... 71
8.1.5 Method analysis ......................................................................................................................... 71 8.1.5.1 General .................................................................................................................................................... 71 8.1.5.2 Plots of best and worst VINGA flights.................................................................................................. 72 8.1.5.3 Using aircraft manufacturer performance software ........................................................................... 73 8.1.5.4 Error sources ........................................................................................................................................... 74
8.1.6 Conclusions................................................................................................................................. 74 8.2 AIRCRAFT NOISE ................................................................................................................................... 75
8.2.1 Noise measuring tool ................................................................................................................. 75 8.2.2 Simulated aircraft noise-in the approach ................................................................................ 75 8.2.3 Interaction between the airport and its neighbours ............................................................... 79
8.3 TRACK ADHERENCE-RNP .................................................................................................................... 79 8.4 MONITORING OF AIRCRAFT RTA CAPABILITIES .................................................................................... 80
9 DEPARTURE PHASE OPTIMISATION – EFFECTS ON FUEL AND NOISE ................................. 81 9.1.1 Introduction ................................................................................................................................. 81 9.1.2 Data .............................................................................................................................................. 82

Project ID: VINGA Final Report Edition: 04.00 30 Nov 2011
Page 7 of 103
9.1.3 Aircraft performance and noise modelling .............................................................................. 82 9.1.4 Method ......................................................................................................................................... 83
9.1.4.1 Method - evaluation of removing SID speed constraints .................................................................. 83 9.1.4.2 Method – calculation of fuel savings from early SID deviations....................................................... 84
9.1.5 Results ......................................................................................................................................... 85 9.1.5.1 Evaluation of removing SID speed constraints .................................................................................. 85
9.1.6 Calculation of fuel savings from early SID deviations ........................................................... 87 9.1.7 Track adherence during turn .................................................................................................... 89 9.1.8 Conclusions................................................................................................................................. 90
10 FUEL EFFICIENCY BEST PRACTICES ........................................................................................... 91
11 COMMUNICATION AND DISSEMINATION EVENT ....................................................................... 92 11.1 COMMUNICATION STRATEGY ................................................................................................................ 92 11.2 VINGA EVENT ...................................................................................................................................... 92 11.3 OTHER CHANNELS OF COMMUNICATION .............................................................................................. 97 11.4 POST VINGA - COMMUNICATION ......................................................................................................... 97
12 CONCLUSIONS ..................................................................................................................................... 98 12.1 RNP AR APPROACHES ........................................................................................................................ 98
12.1.1 RNP Transition to ILS ................................................................................................................ 99 12.1.2 Surface phase ........................................................................................................................... 100 12.1.3 The departure phase ............................................................................................................... 100
13 WAY FORWARD AND RECOMMENDATIONS ............................................................................. 101 13.1 FINAL WORDS ...................................................................................................................................... 102
Appendix 1: The 4 RNP AR approaches developed in the frame of the VINGA project. Appendix 2: Ekstrand H., Ziverts U., RNP AR procedure design based on meteorological history, 2nd edition, Novair Flight Operations Department, June, 2010. Appendix 3: Quovadis, Goteborg RNP AR and RNP-ILS procedures-VINGA Project-Novair-A321 Aircraft, 1st edition, April 2011. Appendix 4: LFV, RNP AR Questionnaire for ATCOs, 2010. Appendix 5: Novair, Checklist VINGA Monitoring of RTA functions, 3rd edition, October 2011. Appendix 6: Ekstrand H. et al. A new method for measuring energy intensity during commercial flight missions, ISABE-2011-1403, 2011. Appendix 7: Mitchell D., Ekstrand H., A CO2 versus noise trade-off study for the evaluation of current air traffic departure procedures, SESAR Innovation Days, December 2011. Appendix 8: VINGA dissemination event leaflet, May 2011.

Project ID: VINGA Final Report Edition: 04.00 30 Nov 2011
Page 8 of 103
Executive Summary The high-level objective of the VINGA project was to demonstrate the potential of reduced CO2 emissions and noise from the en-route phase of the arriving flight into Göteborg Landvetter Airport, Sweden, through the approach, landing, and surface phase until parking on the gate, by using a state-of-the-art validation aircraft and by using best practice. The validation activities then continued in the departure phase, until the aircraft left Swedish airspace. The VINGA validation project therefore contained all components included in the ‘traditional’ Gate-to-Gate concept, only in a slightly different order. The overall objectives were still the same as a traditional Gate-to-Gate concept; however, by using the same site for the validation activities for both the departure and arrival phase, there were efficiency gains to be achieved, which was very attractive for a project of this magnitude. The VINGA project was an AIRE II initiative that started on the 1st of September 2010 and terminated on the 30th of November 2011.
Special attention was given to the arrival phase of the VINGA project, because it included the challenge of handling aircraft with different navigation capabilities and usage of newly developed RNP STARs and RNP AR approaches. In addition, for the first time in Europe, a RNP Transition to ILS procedure was flown; therefore, the project demonstrated the full potential of the PBN concept, which is viewed as important from a European perspective, in order to accelerate the implementation rate of this concept. This statement is closely linked to ICAO Assembly Resolution A36-23, and the slightly revised resolution A37-11 from November 2010, Performance Based Navigation (PBN) global goals. In the Assembly Resolution, ICAO urges all of its member states to implement RNAV, RNP ATS routes and approach procedures in accordance with the ICAO PBN concept laid down in the Performance Based Navigation Manual (Document 9613). It also resolves its member states on the “implementation of approach procedures with vertical guidance (APV) (Baro-VNAV and/or augmented GNSS, including LNAV only minima) for all instrument runway ends, either as the primary approach or as a back-up for precision approaches by 2016 with intermediate milestones as follows: 30% by 2010, 70% by 2014”.
In parallel to the validation activities in the arrival phase, the VINGA project also included activities in the surface and departure phases. During the departure phase of the project, any possible delay was absorbed at the stand, with engines shut down, followed by well-coordinated taxing to the RWY between the ATCOs and the flight crews. The departure phase also included validation activities that involved removal of speed constraints in the SID structure, and evaluation of its impact from a CO2 emission versus noise perspective. All validation flights have been optimised by using best practise in terms of fuel saving initiatives, such as idle reverse thrust on landing, followed by single engine taxiing. All these activities were already implemented in the SOP of Novair prior to the VINGA validation flights, but will result in savings compared to traditional airline operations, which do not focus on these activities
The VINGA project has involved changes to the ATM system of a relatively complex nature. Furthermore, this has occurred during a relatively short time frame. The changes have been possible to implement by close collaboration between dedicated and knowledgeable partners. These types of changes and the associated endeavours could never have been achieved by any single ANSP, airport, Airspace User or industry partner. Each partner has its own unique skills and relationships to, for example the relevant authorities, which means that profound changes can be created when working in partnership.
The analysis part of the VINGA project included both the arrival and departure phases of flight, which have been treated separately. The analysis of the arrivals phase included calculation of the fuel efficiency, track adherence during RNP operations and airborne capabilities to meet a CTA. The analysis part of the departure phase covered the CO2 vs. noise emissions trade-off study, also in addition to a study on aircraft capabilities to follow the SID with different speeds (track adherence).
The key results of the VINGA project show that the implementation of RNP STARs and RNP AR approaches has a potential of fuel savings in the magnitude of 22-90 kg (70-285 kg CO2) per flight, depending on RWY in use, compared to the traditional P-RNAV STAR structure followed by an ILS approach. This corresponds to fuel savings in the magnitude of 3-11% per flight, measured from a given distance, corresponding to a radius of 200 NM from the airport reference point. The savings
Project ID: VINGA Final Report Edition: 04.00 30 Nov 2011
Page 9 of 103
have been achieved by flight path shortening and by allowing the validation aircraft to leave the en-route phase at an optimum ToD, followed by an unconstrained CDO.
The VINGA project also show that implementation of RNP STARs followed by RNP AR approaches does not include any major differences for the ATM system in comparison with implementing any other closed procedure.
The analysis of speed constraint removal in the departure phase showed that 55 kg of fuel (165 kg CO2) per flight could be saved with negligible changes to the noise contours in respect of the Swedish environmental legislation.
A close dialogue and collaboration with the relevant CAA is the vital key for the success of a project of this magnitude. Development and changes requires close collaboration between ANSPs, Airspace Users, industry, airports and regulatory authorities, whereby the latter must be included in any process at an early stage and have an active role to play. It is also important that the regulatory bodies actively encourage and support various projects regarding development of new solutions. The importance of sharing project information between the project members and authorities at an early stage has been a key finding of the VINGA project. This is to assess if the proposed changes are in line with the views of the authorities on the issues, and if there are different views, to find a solution.

Project ID: VINGA Final Report Edition: 04.00 30 Nov 2011
Page 10 of 103
1 Introduction This final report is prepared by the VINGA project on the subject of flight trial validation solutions for the reduction of CO2 emissions, for the execution of the SESAR programme. On the 15th of January 2010, the SJU issued a call for tender regarding the provision of flight trial validation solutions for the reduction of CO2 emissions in the SESAR programme (reference SJU/LC/0039-CFP). This call for tender was part of the AIRE II initiative, which is a Trans-Atlantic joint effort to reduce the environmental footprint of aviation.
A pan-European Consortium was created, called VINGA, which responded to the call for tender, and was subsequently appointed by the SJU to execute the proposed project. The project had its kick-off meeting with the SJU on the 1st of September 2010.
This final report will describe the key achievements of the VINGA project; the obstacles and issues that have arisen throughout the lifecycle of the project and recommendations for the future. The intent is that this final report should be easy to read and understand, and additional information is presented in the appendices at the end of this report.
The overall objective of the VINGA project was to carry out pre-operational validation of ATM concepts that will demonstrate the potential of reduced CO2 emissions and noise from the en-route phase of the arriving flight, through the approach, landing, surface and departure phases, until the en-route phase of the departing flight. The purpose was to use best practise, combined with current state-of-the-art technology, to gain maximum environmental efficiency. All VINGA validation activities took place on flights that arrived into and departed from Göteborg Landvetter Airport, Sweden.
Please note that the city of Göteborg is called Gothenburg on an international basis; however, Göteborg is used throughout this report for consistency.
1.1 The VINGA Consortium The Consortium and the project are called VINGA (Validation and Improvement of Next Generation Airspace). This abbreviation is used consistently throughout the report. The Consortium is coordinated and managed by LFV.
The following independent legal entities are part of the VINGA Consortium:
LFV,
Göteborg Landvetter Airport (through is mother company Swedavia),
Quovadis,
Novair,
Airbus is an associate to Quovadis and contributes as an Expert Advisor to the VINGA project.
During the lifecycle of the project, a cooperation agreement was set up between the VINGA member Novair and the Department of Applied Mechanics at Chalmers University, located in Göteborg, Sweden. The department has six different research divisions conducting world-leading research, usually in close collaboration with national and international industries. Research topics encompass both fundamental and applied research questions. The VINGA project has been collaborating with the Division of Fluid Dynamics, which has two research groups; applied Fluid Dynamics and Turbo machinery and Aero acoustics, where the latter one has been involved in the VINGA project.
Chalmers University have an ATM research area, with specific expertise in assessing the environmental impact of air traffic operations in both the arrival and departure phases of flight.
Chalmers University has supported the project with the development of the analysis tool for the departure phase of the VINGA project, and been of assistance in theoretical discussions regarding the arrival analysis.

Project ID: VINGA Final Report Edition: 04.00 30 Nov 2011
Page 11 of 103
These modifications to the original VINGA proposal have continuously been addressed to the SJU, and been subsequently approved.
A prerequisite to conduct a project of this magnitude is that participation is required of all relevant stakeholders, in this case an airport, an ANSP, industry (including academia) and an airspace user.
The structure and the main areas of responsibility in the project are illustrated in Figure 1.
Figure 1: Structure and main areas of responsibility within the VINGA project.
All different stakeholders within the project have different objectives with the project, but share the view and ambition of working in partnership with the common goal of validating efficient flight operation, by making best use of existing technology and best application of the present regulations.
Below, some more in-depth information about each member of the project will be given.
Göteborg Landvetter Airport
Göteborg Landvetter Airport (www.swedavia.com/en/Goteborg) is western Sweden’s international airport and the second largest airport in the country. The airport is one of 11 airports, owned and operated by Swedavia. A total of approximately 4 million passengers pass through the airport annually, where 75% of all passengers are departing on international flights. The airport offers nearly 100 non-stop routes, about 50 of these are scheduled with 25 airlines and the rest are charter flights. The airport opened in 1977.
Earlier, the airport was operated by LFV. On the 3rd of December 2009, the Swedish Parliament decided in accordance with a proposal from the government, to divide the LFV Group and create a limited liability company encompassing the airports. Such a division of the LFV Group was logical considering the different business aspects of the airports and the ATC Services. The new company Swedavia started operations on the 1st of April 2010.

Project ID: VINGA Final Report Edition: 04.00 30 Nov 2011
Page 12 of 103
Swedavia is responsible for Airport infrastructure, this includes the infrastructure and services needed for the airplane to land and depart at an airport and load/unload its cargo and passengers. Examples of such infrastructure are runways and terminals, baggage sorting facilities and energy to the airplane. Ground handling is the collective name for the services required when an aircraft is handled at an airport. Ground handling also includes checking in passengers. In order to provide the above mentioned services Swedavia employs approximately 2 600 people.
LFV
LFV (www.lfv.se) is a Government Board & Business Enterprise and responsible for the air navigation services in Sweden for both civil air traffic and military. Other responsibilities of LFV are aviation safety standards, the supervision of civil aviation planning and the long-term assessment of the role and capacity of the air transport system. Training and development of human resources is another area that falls under LFV responsibility.
In order to provide the above-mentioned services LFV employs approximately 1 400 people of whom 80% have professional, operational and technical roles. LFV also maintains a technologically advanced system for airport operations, air traffic services and aviation safety activities.
The team comprises experts in the ATM field including:
Operational procedures and analyses,
Planning and execution of flight trial activities,
ATM systems and architecture,
ATM/ATC simulations,
ATM strategy,
Human factors,
Civil and military coordination,
Safety.
LFV has long experience in supporting various EUROCONTROL programmes and European Commission (EC) funded ATM Projects such as:
SESAR Definition phase, operational concept, architecture and technology,
OATA validation,
NEAN/NUP/NEAP ADS-B development,
Cassis Project,
NORACON is a cooperative organisation of ANSPs through which LFV acts to reach the goals for SESAR. Avinor (Norway), EANS (Estonia), Finavia (Finland), IAA (Ireland), Isavia (Iceland), Naviair (Denmark) and Austrocontrol (Austria) are also part of NORACON. LFV leads the work of NORACON and represents the largest investment. Being part of NORACON is a good basis for living up to the vision of being a leading supplier of air navigation services in Europe.
ATC services at the airport comprise of TWR and TMC, (hereafter known as “ATS Landvetter”). The tower provides ATC services and the main tasks of the TMC is to provide radar approach services to all traffic flying into and out of Göteborg Landvetter Airport and Gothenburg City Airport. Both TMC and TWR are manned 24 hours a day.
Quovadis
Quovadis (www.quovadisway.com) is a Flight Operations services company, wholly owned by Airbus, dedicated to PBN consulting. Quovadis provides a full range of services to safely improve operations, efficiency, aircraft utilisation optimisation, environmental performance, access to challenging airports and airspace capacity. Over the last years, Airbus has been supportive of the PBN initiative the launch of Quovadis was the natural step to further develop this activity to better support its customers whether they have Airbus aircraft or others.
Project ID: VINGA Final Report Edition: 04.00 30 Nov 2011
Page 13 of 103
Quovadis offers the highest level of expertise in commercial aircraft operations and Performance Based Navigation. The personnel at Quovadis are composed of highly experienced flight crews, performance engineers, project managers and terrain analysts. Quovadis has also access to the best systems and simulators in the world to validate new procedures in any kind of aircraft.
Quovadis also works in close cooperation with the French Civil Aviation University (ENAC) and CGX Aero in SYS, a specialist in aeronautical and geographical information systems
Quovadis is a fully integrated Airbus Subsidiary. This close and permanent relationship with the worldwide benchmark aircraft manufacturer ensures a full mastery of Performance Based Navigation (PBN) solutions.
Novair
Novair (www.novair.se) is an affiliate of Apollo, which is Sweden’s third largest tour operator. Novair has been a wholly-owned subsidiary of the Swiss travel group Kuoni as of January 1st 2001.
The Scandinavian part of the group is called Kuoni Scandinavia and, apart from Novair, includes Apollo and Kuoni in Sweden, Norway and Denmark. Kuoni Scandinavia has almost 900 employees and a total of 750 000 travellers to destinations worldwide. Kuoni Scandinavia, along with the tour operators Apollo and Kuoni and the airline company Novair, are the travel group with the biggest growth rate on the Scandinavian market.
Novair flies in the summer time to traditional destinations around the Mediterranean Sea, in the winter time, Novair operates to primarily to the Canary Islands and Egypt, but also flies long haul routes to India and Kenya.
All of Scandinavia is Novair’s home market and their biggest departure airports are Stockholm, Oslo, Göteborg and Copenhagen. Novair also has some direct flights from a substantial number of rural airports.
The aircraft fleet is comprised of three Airbus A321-231 planes.
Novair is participating in the SESAR project as Airspace User Expert.
Airbus
Airbus (www.airbus.com) is a leading aircraft manufacturer whose customer focus, commercial know‐how, technological leadership and manufacturing efficiency have propelled it to the forefront of the industry, capturing about half of all commercial airliner orders. Airbus has sold over 11 000 aircraft to more than 300 customers and has delivered over 7 000 aircraft since entry into service of the first A300B in 1974. Airbus has put in place a policy of integrated environmental efficiency overarching the whole product life cycle from aircraft design, manufacturing, supply chain, operation till aircraft end‐of‐ life revalorisation, In an aerospace industry first, Airbus has received International Organisation for Standardisation (ISO) 14001 environmental certification that covers the entirety of the company’s 16 production sites, as well as all of its airliner products throughout their lifecycle. Please refer to Airbus’ latest Environmental Social and Economic Report, which can be made available on request. Dedicated to helping airlines enhancing the profitability of their fleets, Airbus also delivers a wide range of customer services in all areas of support, tailored to the needs of individual operators all over the world. This includes especially services related to fuel efficiency measures, regularly disseminated at the occasion of Airbus Global Operators Conference and experience exchanged in the Airbus e‐Forum FAIR‐OPS. Airbus is specifically engaged in the European Air Traffic Management research initiative, SESAR, where Airbus ensured the Project Management of the Definition Phase and became a member of the SESAR Partnership for the Development Phase, where it now leads the airborne activities (WP9) and contributes to other work packages with high relevance to aircraft design. As partner to the highly successful AIRE I MINT project, Airbus enabled the first European noise‐abatement‐driven RNP AR approach at Stockholm in summer 2009, by providing latest version of the Flight Management System and by contributing with fly ability analysis.
Chalmers
Chalmers University of Technology (www.chalmers.se), often shortened to Chalmers, is a Swedish university located in Göteborg that focuses on research and education in technology, natural science and architecture.

Project ID: VINGA Final Report Edition: 04.00 30 Nov 2011
Page 14 of 103
The University was founded in 1829 following a donation by William Chalmers (1748–1811), a director of the Swedish East India Company, whose ships sailed across the world to supply Europe with goods from the East. He donated some of his fortune for the establishment of an "industrial school". Chalmers was run as a private institution until 1937, when the institute became a state-owned university. In 1994, the school once again became a private institution, owned by a foundation.
Approximately 40% of Sweden's graduate engineers and architects are educated at Chalmers. Each year, around 250 post graduate degrees are awarded as well as 850 graduate degrees. About 1 000 post-graduate students attend programmes at the university and many students are taking Master of Science engineering programmes and the Master of Architecture programme. From 2007, all Master's programmes are taught in English for both national and international students.
Project ID: VINGA Final Report Edition: 04.00 30 Nov 2011
Page 15 of 103
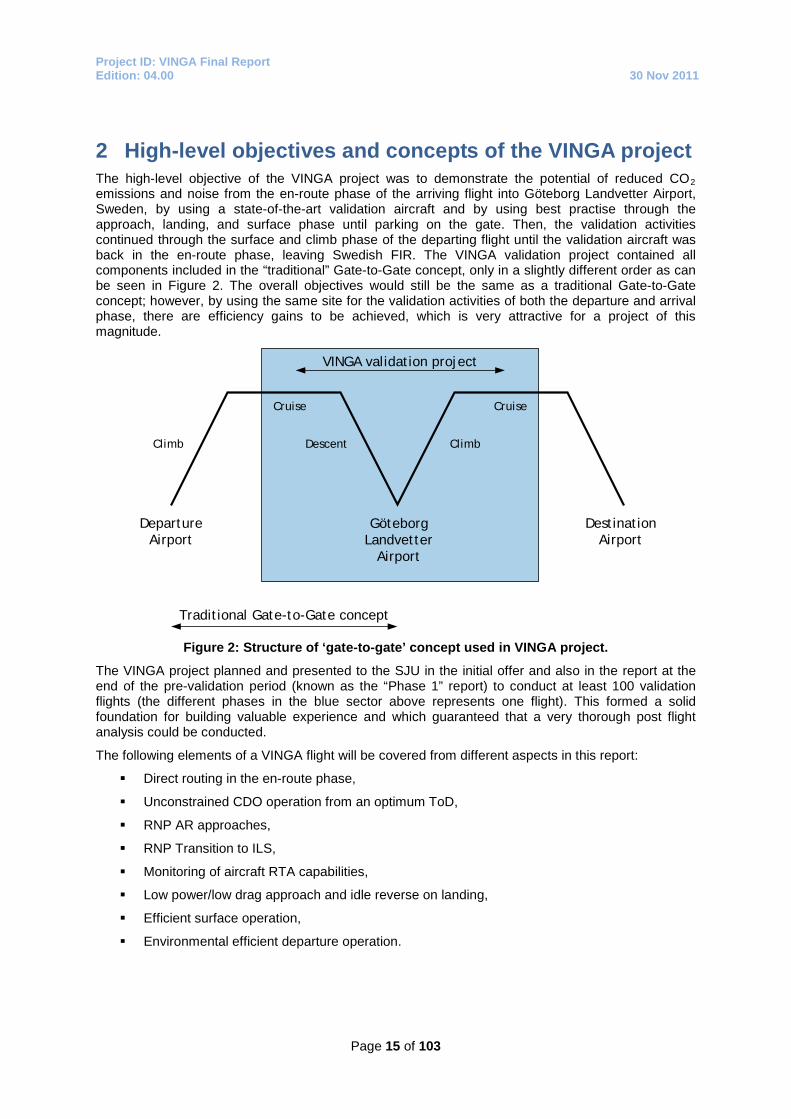
2 High-level objectives and concepts of the VINGA project The high-level objective of the VINGA project was to demonstrate the potential of reduced CO2 emissions and noise from the en-route phase of the arriving flight into Göteborg Landvetter Airport, Sweden, by using a state-of-the-art validation aircraft and by using best practise through the approach, landing, and surface phase until parking on the gate. Then, the validation activities continued through the surface and climb phase of the departing flight until the validation aircraft was back in the en-route phase, leaving Swedish FIR. The VINGA validation project contained all components included in the “traditional” Gate-to-Gate concept, only in a slightly different order as can be seen in Figure 2. The overall objectives would still be the same as a traditional Gate-to-Gate concept; however, by using the same site for the validation activities of both the departure and arrival phase, there are efficiency gains to be achieved, which is very attractive for a project of this magnitude.
DepartureAirport
GöteborgLandvetter
Airport
Traditional Gate-to-Gate concept
VINGA validation project
Climb
Cruise
Descent Climb
Cruise
DestinationAirport
Figure 2: Structure of ‘gate-to-gate’ concept used in VINGA project.
The VINGA project planned and presented to the SJU in the initial offer and also in the report at the end of the pre-validation period (known as the “Phase 1” report) to conduct at least 100 validation flights (the different phases in the blue sector above represents one flight). This formed a solid foundation for building valuable experience and which guaranteed that a very thorough post flight analysis could be conducted.
The following elements of a VINGA flight will be covered from different aspects in this report:
Direct routing in the en-route phase,
Unconstrained CDO operation from an optimum ToD,
RNP AR approaches,
RNP Transition to ILS,
Monitoring of aircraft RTA capabilities,
Low power/low drag approach and idle reverse on landing,
Efficient surface operation,
Environmental efficient departure operation.

Project ID: VINGA Final Report Edition: 04.00 30 Nov 2011
Page 16 of 103
This report will focus on the following areas:
Implementation of RNP AR approaches from an ATM perspective,
RNP Transition to ILS,
Environmental analysis of the arriving and departing flights.
To enable these activities, newly designed arrival and approach procedures have been used, comprising both RNP AR approach procedures, and for the first time in Europe, a RNP Transition to ILS approach. In addition, environmental analysis methods and tools have been developed in order to accurately measure the impact of these changes.
The validation flights were conducted with state-of-the-art Airbus A321 aircraft operated by Novair, representing a typical single-aisle aircraft, commonly operated in European airspace.
The flight trials included new ATM operating procedures with the objective of obtaining a large number of successful validation flights, which is vital for the successful implementation of PBN operations in the day-to-day operation. This is especially true from a near-term perspective when there will be traffic scenarios including aircraft with different navigation capabilities, i.e. a mixed-mode environment. All validation activities took place on normal revenue flights with either no specially trained ATCOs or flight crews, in order to achieve as realistic outcomes from these activities as possible.
2.1 Linkage between VINGA and the SESAR Programme The VINGA project was in an early stage of the project, appointed two SESAR “Mirror Projects” in WP 9, dealing with development of new airborne functionalities for the future SES:
9.01, Airborne Initial 4D Trajectory Management and 9.09, RNP Transition to xLS (x = G, I, M) by the SJU.
The high level objective of this appointment and other amongst other AIRE II projects as well, was to identify projects where a natural synergy was easily identified between AIRE II and SESAR, to ensure that relevant information and experiences gained in the AIRE II projects were fed into the SESAR programme in a timely and efficient manner. As previously stated, the objectives with the AIRE II activities are to use today’s best practise and state-of-the-art equipment to gain environmental benefits in a short term perspective. The long term goal is to gradually integrate new ATM technology into the future SES; therefore operational experiences can be of great value in the development phase of prototypes and new equipment, which is the case of the SESAR programme. The VINGA project has continuously been feeding back information in the two projects, mentioned above.
2.2 RNP Operation One of the cornerstones of future aircraft navigation concepts is the implementation of PBN. This has been identified by key organisations such as the ICAO, FAA, Eurocontrol and finally the SESAR programme. The PBN concept is the broad term used to describe the technologies that allow aircraft to fly flexible, accurate, three-dimensional flight paths using onboard equipment and capabilities. PBN specifies aircraft RNAV system performance requirements in terms of accuracy, integrity, availability, continuity and functionality needed for the proposed operations in the context of a particular airspace concept. The PBN concept represents a shift from ground-based to onboard performance-based navigation. Performance requirements are determined by navigation specifications, which also determine the choice of navigation sensors and equipment that may be used by the airspace user to meet the performance requirements.
PBN offers a number of advantages over the traditional method of developing airspace and obstacle clearance criteria:

Project ID: VINGA Final Report Edition: 04.00 30 Nov 2011
Page 17 of 103
Reduces need to maintain sensor-specific routes and procedures, and their associated costs.
Avoids need for development of sensor-specific operations with each new evolution of navigation systems, which would be cost-prohibitive.
Allows more efficient use of airspace (route placement, fuel efficiency, noise abatement).
Clarifies the way in which RNAV systems are used.
Facilitates the operational approval process for operators by providing a limited set of navigation specifications intended for global use.
Within an airspace concept, PBN requirements will be affected by the communication, surveillance and ATM environment, as well as the navigation aid infrastructure and the functional and operational capabilities needed to meet the ATM application.
In general, the different concepts can be illustrated as shown in Figure 3.
RNAV with or without RNP PBN navigation Conventional navigation
Figure 3: Different navigation concepts.
There is a close connection between the proposed VINGA project and the ICAO Assembly Resolution A36-23, and the slightly revised resolution A37-11 from November 2010, Performance Based Navigation (PBN) global goals. In the Assembly Resolution, ICAO urges all of its member states to implement RNAV, RNP ATS routes and approach procedures in accordance with the ICAO PBN concept laid down in the Performance Based Navigation Manual (Document 9613). It also resolves its member states on the “implementation of approach procedures with vertical guidance (APV) (Baro-VNAV and/or augmented GNSS, including LNAV only minima) for all instrument runway ends, either as the primary approach or as a back-up for precision approaches by 2016 with intermediate milestones as follows: 30% by 2010, 70% by 2014”.
The purpose of this Assembly Resolution is primarily related to flight safety and efficient operations. The first aspect is connected to the reduction of accidents associated with CFIT at airports with NPA, and the latter aspect is connected to minimising the environmental footprint of aviation.
The greatest environmental efficiency in the TMA, regarding introduction of the PBN concept, will be achieved with the implementation of RNP AR approach procedures. RNP AR approach operations generate a possibility of greater environmental benefit compared with straight-in RNP operations, due to the possibility of flight path shortening. The application of RNP AR to TMA and approach operations provides an opportunity to utilise modern aircraft capability and performance to improve safety, efficiency and capacity. Safety is improved when RNP AR procedures replace visual procedures or NPA, and efficiency is improved through more repeatable and optimum flight paths, whereby the latter corresponds to track mileage shortening and avoidance of over flying noise-sensitive communities. Airport capacity can be improved by de-conflicting traffic during instrument conditions. In general, RNP AR approach procedures are expected to be developed throughout Europe to not only address specific operational needs or requirements, but also to enable benefits to the broadest segment of the RNP AR aircraft population possible.
It is of utmost importance that the pace of change in the European Air Traffic Structure is accelerated regarding the implementation of PBN. This is the shared responsibility of all stakeholders involved: ANSPs, regulators, airports, manufacturers and Airspace Users.

Project ID: VINGA Final Report Edition: 04.00 30 Nov 2011
Page 18 of 103
2.3 VINGA in the context of PBN An essential part of the VINGA project is to utilise PBN to the greatest extent possible. In particular, it takes advantage of onboard aircraft performance monitoring and alerting capabilities, associated with RNP operation.
The VINGA project takes advantage of two aspects of the RNP concept:
RNP AR operation: This concept of operation includes unique aircraft capabilities that require aircraft and flight crew authorisation similar to ILS CAT II/III operations. All RNP AR procedures have reduced lateral obstacle evaluation areas and vertical obstacle clearance surfaces, which are based on the aircraft and flight crew performance requirements. A critical component of RNP is the ability of the aircraft navigation system to monitor its achieved navigation performance, and to identify to the flight crew whether the operational requirement is met during flight. These unique characteristics will be used from an environmental perspective in VINGA, to obtain flight path shortening and mitigate noise from aircraft over-flying urban locations.
RNP Transition to ILS: Keeping the advantages associated with precision approach (guidance, attractive weather minima, routine operation) for the last straight part of the approach, it also offers the possibility to benefit from the RNP advantages (flexible and repeatable trajectory, onboard performance monitoring and alerting capability, guided operation by the FMGS) to join the ILS beam.
This operation is not yet defined at regulation level and the VINGA project provides the opportunity to validate the concept in Europe. This concept is identified as an enabler for the future, via SESAR project 9.09, denoted “RNP Transition to xLS”.

Project ID: VINGA Final Report Edition: 04.00 30 Nov 2011
Page 19 of 103
3 Overview of the validation environment Göteborg is the second largest city in Sweden and the fifth-largest city in the Nordic region. Located on the west coast of Sweden, the city has a population of around 520 000 people, and a total of approximately 950 000 inhabitants in the metropolitan area.
Göteborg is served by Göteborg Landvetter Airport, located 30 km southeast of the city centre. It is the second largest airport in Sweden.
3.1 Göteborg Landvetter Airport Göteborg Landvetter Airport (ICAO code ESGG/IATA code GOT) represents a typical small-medium European airport with a long single RWY operation (3 300 m), with approximately 230 movements per day. Due to its location on the Swedish west coast, prevailing winds from the southwest favour operations on RWY21, which is used for approximately 70% of all the movements at the airport. The airport has surface movement radar as well as ILS category I & II capability. Figure 4 shows an aerial view of the airport and RWY.
Figure 4: Aerial view of Göteborg Landvetter Airport and surrounding area.
3.2 Airspace structure and traffic flows in the TMA The traffic flow within the Göteborg TMA is dominated by inbound and outbound traffic to/from Göteborg Landvetter Airport. The majority of traffic consists of medium-sized jet aircraft, i.e. with a MTOM between 7 000 – 136 000 kg. In addition, some turboprop and heavy jet traffic also operates from the airport. Figure 5 shows the structure of the Göteborg TMA.
LFV is the ANSP responsible for all traffic within Göteborg TMA, and the local facilities and its staff unit is named ATS Landvetter. Most of the ATCO´s fulfil the requirements to work both at the TMA radar services and tower services. Göteborg TMA is typically divided into two sectors (West and East). It is standard operating procedures to use an additional ATCO for managing arriving aircraft inbound Göteborg Landvetter Airport in order to decrease workload for ATCOs in sector West or East (commonly known as a “Director”) when the traffic intensity increases.

Project ID: VINGA Final Report Edition: 04.00 30 Nov 2011
Page 20 of 103
Figure 5: Structure of the Göteborg TMA.
The existing SID and STAR structure at Göteborg Landvetter Airport consists of routes based on P-RNAV, which was implemented in January 2009. The P-RNAV navigation is based on either GNSS or DME/DME. Currently, approximately 70% of all traffic operating into the airport is P-RNAV approved. The remaining 30% of non-P-RNAV operations can be attributed to mainly one operator, which is non-P-RNAV approved. This particular operator is in the process of a fleet renewal programme, and the share of P-RNAV approved aircraft operating into the airport will significantly increase in the next few years.

Project ID: VINGA Final Report Edition: 04.00 30 Nov 2011
Page 21 of 103
The STAR system is divided into two parts, a closed STAR system used primarily during night and low/medium density traffic, and an open STAR system, used during medium to high density traffic situations.
The generic difference between the two STAR concepts can be illustrated as in Figure 6.
Closed path design
Open path design Figure 6: Open and Closed STARs.
The closed STARs all start at designated TMA entry points and terminate at the FAP, i.e. interception of the G/S on the ILS. The open STARs terminate at the IAF, from where tactical radar intervention will take place.
Visual approaches are not allowed at Göteborg Landvetter Airport, to minimise the effects of non-uniform aircraft behaviour.
The SID system is also divided into two parts; one system for non P-RNAV approved aircraft and one for approved aircraft. The SID system was designed to concentrate the flight paths of departing aircraft into narrow corridors for noise-abatement purposes; this is closely associated with the airport’s environmental permit, which regulates air traffic operations at and in the vicinity of the airport.
Göteborg City Airport (ICAO code ESGP/IATA code GSE) is located 40 kilometres west-north-west of Göteborg Landvetter Airport. The airport has a large share of general aviation, but also many low-cost carriers and business aviation, which generate approximately 10 000 movements on an annual basis.
After a very long process, which involved the local communities and the environmental authorities, Göteborg City Airport was required to implement a closed P-RNAV STAR/SID system, based on GNSS. This system was implemented in the spring of 2011. Due to the close location of both airports, its ATS structure interacts and generates one overall system in Göteborg TMA. The implementation of the STAR/SID system at Göteborg City Airport has generated much greater predictability for both flight crews and ATCOs compared with previous operations where all traffic was guided via tactical radar intervention by ATC. The Swedish CAA required that the new SID/STAR system would be implemented on a trial basis of approximately 1 year. A trial period was required before this STAR/SID structure could be permanently implemented so that LFV could evaluate if the new traffic situation had any negative impacts on overall flight safety. This requirement would later have an impact on the VINGA project, which is covered in Section 4.2.5. This requirement from the Swedish CAA was quite unexpected, since P-RNAV operation had taken place in Göteborg TMA for approximately two years at that time, and the number of movements into Göteborg City Airport is quite modest.
An example of the STAR structure to Göteborg Landvetter Airport and Göteborg City Airport is illustrated in Figure 7, showing the different P-RNAV STARs when RWY19 is used at Göteborg City Airport and RWY21 is used at Göteborg Landvetter Airport.

Project ID: VINGA Final Report Edition: 04.00 30 Nov 2011
Page 22 of 103
Figure 7: Example of the P-RNAV structure in Göteborg TMA.
In the northern part of the Göteborg TMA there is a smaller civilian airport (Trollhättan Airport), with small numbers of domestic traffic operating to the Swedish capital. In addition, an Air Force base is located in Såtenäs, known as Skaraborg Wing F7. It is the home of three divisions of Gripen fighters, and all training of the Swedish Air Force pilots. During normal operations all traffic in the northern part of Göteborg TMA is handled by ATCOs located at the Air Force base. The activities in the northern part of the TMA had limited impact on the VINGA project.

Project ID: VINGA Final Report Edition: 04.00 30 Nov 2011
Page 23 of 103
3.3 Airspace structure in the en-route phase The airspace of southern Sweden is mainly served by LFV´s ATCC in Malmö. Their premises are located in Malmö Sturup Airport, shown in Figure 8. All of the VINGA validation flights operated in airspace controlled by Malmö ATCC.
Figure 8: Malmö ATCC.
Approximately 400 ATCOs work at Malmö ATCC, and they are responsible for providing air navigation services in 11 airspace sectors, as illustrated in Figure 9 below. The majority of over-flights controlled by Malmö ATCC consist of intercontinental traffic between Europe and Asia. In addition, there are a large number of intra-European over-flights to/from the Nordic region.
In an en-route to en-route project, such as the VINGA project, the ATCCs working in the en-route phase also play a vital part of the project. Without their participation, optimisation of the VINGA flights could not have taken place.

Project ID: VINGA Final Report Edition: 04.00 30 Nov 2011
Page 24 of 103
Figure 9: En-route sectors controlled by Malmö ATCC.
3.3.1 Free Route Airspace Sweden (FRAS) In May, 2011, the fourth and final phase of FRAS was implemented in Sweden UIR. Subsequently all flights with a planned trajectory above FL285 during some part of the flight in Sweden UIR were qualified to file an ATC flight plan on the shortest trajectory possible within Swedish airspace.
Prior to the implementation of Free Route Airspace, most aircraft were already given the possibility to fly the shortest distance in Swedish airspace; however, before the implementation of FRAS phase 4 the Airspace Users operating to/from, e.g. Göteborg Landvetter Airport, were forced to plan their flight routes according to the published fixed ATS structure. Consequently, these aircraft had to carry fuel to cater for this scenario. With the introduction of the FRAS concept, the aircraft are now able to depart with slightly less fuel on board, and the reduced mass of the aircraft leads to a slightly reduced fuel consumption during the flight. Although the saving on each flight is relatively small, the total saving with approximately 950 000 flights (in Sweden UIR) on a yearly basis becomes quite substantial with consequently positive environmental effects.
At the beginning of 2011, Sweden and Denmark took a step towards a united airspace. Parts of both countries ANSP parent companies, LFV and Naviair, respectively, were integrated into the joint enterprise, Nordic Unified Air Traffic Control, commonly known in its abbreviated form as NUAC.
NUAC will be the Nordic region's largest ANSP, when the Danish-Swedish company assumes operation of three ATCCs (Malmö, Stockholm and Copenhagen), which is scheduled to take place in 2012. The ATCC will continue to be owned by their parent companies, and its staff will be on leave of absence, to work for NUAC.

Project ID: VINGA Final Report Edition: 04.00 30 Nov 2011
Page 25 of 103
The Danish-Swedish airspace block will cover a total surface are of 783 000 km2, of which 625 000 km2 is made up of Swedish airspace. This airspace block is the first step toward a planned larger Northern European airspace block.
The Free Route Airspace concept in Danish-Swedish airspace was implemented by the national ANSPs Naviair and LFV on the 17th of November, 2011 in the unified Danish-Swedish airspace (DK/SE FAB).
According to estimations made by Naviair and LFV, they indicate that the Free Route Airspace concept corresponds to an average saving of 1,3% (fuel and flying time) for the Airspace Users that operate in Danish and Swedish airspace.
3.4 The ATM ground system The Eurocat 2000 E S ATM system was developed by Thales Group, and has been used by LFV at Göteborg Landvetter Airport since May 2007. It is an integrated part of the ATCC system, used in Malmö. The system is fully electronic, which means that information can be transferred between various ATC units without any verbal coordination. This thus enhances flight safety and increases capacity.
In January 2012, a new version of a Thales ground system is planned to be used in daily operation, called COOPANS (Cooperation between ANSPs and Thales). This is a joint development of the ATM systems in Ireland, Austria, Croatia Sweden and Denmark.
3.5 Validation aircraft Novair uses Airbus A321 aircraft for its operation, shown in Figure 10. The A321 is a state-of-the-art medium range aircraft with a maximum range of approximately 4 900 km. In the Novair configuration it accommodates 211 passengers. The Novair aircraft were manufactured in 2004 and 2005 and are powered by IAE V2533 engines. The A321 uses a fly-by-wire flight control system and possesses a fully glass cockpit.
Figure 10: Novair A321.
The Novair A321 is equipped with the latest version of the FMGS, known as Release 1A, which is a prerequisite for conducting e.g. RNP AR approach operations with the Thales FMGS system.

Project ID: VINGA Final Report Edition: 04.00 30 Nov 2011
Page 26 of 103
4 Pre-validation activities regarding IAP design The VINGA project had its kick-off meeting with the SJU on the 1st of September, 2010, which was the official starting date of the project. That meeting took place at Göteborg Landvetter Airport, and all VINGA partners were represented. During the fall of 2010, a number of pre-validation activities were required within the VINGA project. Some of these activities were handled collaboratively between the partners and others were addressed by individual partners. Note that a close collaboration between all VINGA partners has continuously existed throughout the project. The partners have been located at two primary locations, Toulouse and Göteborg. Various methods have been used for efficient coordination and cooperation, primarily via internet-based solutions, but face-to-face meetings have also taken place at both locations. An internal interim project review with the SJU took place on 15th of December 2010, which represented the formal end of the pre-validation phase; this milestone had to be passed to move onto the execution phase of the project.
The key aspects of the pre-validation activities regarding procedure design and its outcome are discussed below.
4.1 Introduction to the RNP concept As previously stated Section 2.2, the PBN concept represents a shift from ground-based to onboard performance-based navigation. The difference between RNAV and RNP operation is the requirement of onboard monitoring and alerting. In general, the performance monitoring and alerting capabilities may be provided in different forms depending on the system installation, architecture and configurations, including:
Display and indication of both the required and the estimated navigation system performance,
Monitoring of the system performance and alerting the flight crew when RNP requirements are not met, and
Cross track deviation displays scaled to RNP, in conjunction with separate monitoring and
alerting for navigation integrity. The inability to achieve the required lateral navigation accuracy may be due to navigation errors related to aircraft tracking and positioning. The three main errors in the context of onboard performance monitoring and alerting are Path Definition Error (PDE), Flight Technical Error (FTE), and Navigation System Error (NSE).The Total System Error (TSE) is defined as follows and shown in a simplified manner in Figure 11 :
( ) ( ) ( )2PDE2NSE2FTETSE ++=

Project ID: VINGA Final Report Edition: 04.00 30 Nov 2011
Page 27 of 103
Figure 11: Navigation Error Components associated with RNP operation.
PDE occurs when the path defined in the RNAV system does not correspond to the desired
path, i.e. the path expected to be flown over the ground. The PDE is in general a small contributor to the TSE, provided there is no systematic error such as NDB coding error or error due to inadequate geodesic reference (other than WGS84).
The FTE is a characteristic of the flight crew performance using FD or the AP guidance performance in the steering of the aircraft on the FMGS defined flight path.
The NSE is the error made by the navigation system in the computation of the aircraft
position. The NSE has a circular statistical distribution around the aircraft true position. From this circular distribution, it is possible to derive a cross-track component of the NSE, which is relevant for the RNP lateral navigation.
The lateral track error of the FTE, known as Cross Track Error, commonly abbreviated XTK, will be discussed later on in this report. It is of particular interest for RNP AR operation. Table 1 is an extract from the ICAO PBN Manual Document 9613, illustrating the effect of onboard performance monitoring and alerting on TSE in regard of RNAV and RNP operation.
( ) ( ) ( ) ( ) ( )2NSE2FTE2PDE2NSE2FTETSE +≈++=

Project ID: VINGA Final Report Edition: 04.00 30 Nov 2011
Page 28 of 103
Error Source RNAV Specifications
RNP specifications
RNP X specification not requiring RF or FRT
RNP X specification requiring RF or FRT
NSE (monitoring and alerting)
NSE only observed by pilot cross-checks; no alerting on position error.
Alerting on position accuracy and integrity.
FTE (monitoring)
Managed by onboard system or crew procedure.
Managed by onboard system or crew procedure.
PDE (monitoring )
Generally negligible; the desired path is not defined on fly-by, fly-over, and conditional turns.
Generally negligible; path defined on RF and FRT.
NET EFFECT ON TSE
TSE distribution not bounded. In addition, the wide variation in turn performance results in need for extra protection on turns.
TSE distribution bounded, but extra protection of the route needed on turns;
TSE distribution bounded; no extra protection of the route needed on turns if turns defined by RF or FRT.
Table 1: The effect of onboard aircraft performance monitoring and alerting on TSE in regard of RNAV and RNP operation.
E.g., if the NSE is exceeding the applicable RNP value, it will generate a warning in the cockpit, followed by standardised cockpit procedures. The PBN concept covers different performance criteria’s of the airborne equipment. The least demanding procedures are straight-in RNAV approaches with or without a specified RNP value. The next step on the PBN performance scale is RNP AR approach procedures, also known as curved approaches, based on GNSS technology. In Europe, there is a very limited number of RNP AR approaches at the moment. The first procedure introduced was designed for Innsbruck Airport in Austria, based on local regulations. The second RNP AR approach in Europe was published at Stockholm Arlanda Airport during 2009, based on ICAO documentation, discussed below. This was the procedure that was used during the AIRE I project MINT.
4.2 RNP AR approach procedures A vital part of the VINGA project was the design, development and implementation of new RNP STARs from the relevant TMA point to the IAF of the RNP AR approaches. For this report, the arrival phase i.e. from the TMA entry point until the IAF will be denoted RNP STAR in accordance with Swedish AIP.
The Swedish legislation stipulates that it is the airport that owns all ATS routes (SIDs and STARs) and IAPs. Therefore, it is the responsibility of the airport to discuss any changes in the flight paths with all relevant authorities.
Swedavia used LFV as a subcontractor for the design of the new RNP STARs and RNP AR approach procedures, in close collaboration with the other VINGA partners.
ICAO document 9905 (Required Navigation Performance Authorisation Required (RNP AR) Procedure Design Manual), is the applicable design document, first published by ICAO on the 15th of October 2009.

Project ID: VINGA Final Report Edition: 04.00 30 Nov 2011
Page 29 of 103
4.2.1 Characteristics of RNP AR approaches There are some unique characteristics of RNP AR approaches that differ from standard straight in RNAV approaches:
RNP values ≤ 0.3 NM and/or,
Curved flight path (using RF legs) before and after the FAP,
Lateral protection areas limited to 2 x RNP value without any additional buffer. The vertical protection is reduced after the FAP due to a specific Vertical Error Budget.
RF legs are a standardised part of the ARINC 424 Path and Terminator concept regarding coding of procedures, contained in the NDB. It represents a path with a constant radius turn between two NDB fixes, lines tangent to the arc and a centre fix, as illustrated in Figure 12 below:
Figure 12: Definition of a RF leg.
4.2.2 RNP procedure design, validation and application Prior to starting the development of new RNP STARs and RNP AR approach procedures, all relevant stakeholders met on several occasions to discuss different possibilities regarding the geographical drawings of the future RNP paths. Of particular importance was the location of surrounding noise-sensitive communities; discussions took place about how to achieve track mile savings and how to mitigate the noise exposure associated with particular routes. Areas of converging traffic, such as where the SIDs is located, were also of particular interest. In total, four different RNP STARs and RNP AR approach procedures were developed, intended to be used in the VINGA project, shown in Table 2. Please refer to Appendix 1 for more details.
Procedure RWY TMA Entry Point
RNP STAR IAP
1 03 KOVUX KOVUX 1Q RNAV(RNP) Z RYW03
2 21 OSNAK OSNAK 1Q RNAV(RNP) Z RWY21
3 03 LOBBI LOBBI 1Q RNAV(RNP) Y RWY03
4 21 LOBBI LOBBI 1X RNAV(RNP) Y RWY21
Table 2: The developed RNP AR approaches.

Project ID: VINGA Final Report Edition: 04.00 30 Nov 2011
Page 30 of 103
The aim of the procedure design was to optimise the use of ICAO Document 9905 (RNP AR Procedure Design Manual). By using document 9905 in the best possible manner for the development of new IAPs, aircraft RNP capability will be used to greatest extent possible, and a substantial increase in energy efficiency will be achieved, and less (aerodynamic) noise will be generated for each and every approach. If this IAP design philosophy would be implemented systematically in a large scale, as seen from a European and global perspective, a substantial improvement will be achieved.
It was of particular interest to create STARs and IAPs with either few or no constraints at all. Note that ‘constraints’ in this context means either altitude or speed constraints. This was to allow the aircraft to fly unconstrained in order to gain maximum environmental efficiency. A requirement was that this could be achieved without any negative impact on the overall flight safety.
Göteborg Landvetter Airport is located in a non-demanding environment, without any obstacles in the vicinity of the airport. The RNP AR approach concept was originally designed to be used in a demanding environment, such as in mountainous terrain. The usage of the RNP AR concept can also be used for other purposes, such as flight path shortening and/or avoiding over flying residential areas, i.e. to relieve some communities from over-flying aircraft. All of the procedures developed in the VINGA project generate flight path shortening compared to the existing closed P-RNAV STARs, but also relieve some of the communities around the airport. It was also decided to use RNP 0,3 for the IAPs, since there is no obstacles close to the airport.
One of the strategies employed to optimise the use of ICAO Document 9905 was to use historical meteorological data in a statistical manner in order to avoid using standard tail wind components at various altitudes. This is a design option given in ICAO Document 9905. During the development of the RNP AR approach procedures, however, it was found that only Procedure 4 would actually need historical meteorological data to avoid speed constraints in a part of the procedure concerning a RF leg, and the other procedures could be designed unconstrained, due to the size of the radius in the RF legs.
When the procedure design was finalised, traditional safety cases were conducted. An application that could be integrated into the Swedish AIP was sent to the Swedish CAA.
4.2.3 Statistical meteorological data for Göteborg Landvetter Airport
ICAO document 9905 gives two possibilities how to calculate the aircraft ground speed, either by using an assumed tailwind scenario, e.g. 50 knots tail wind from 3 000 ft down to 1 500 feet or by using statistical winds. Historically, most procedure designers have used assumed winds for turn calculations. If e.g. this 50 knots wind scenario is used for tight aircraft turn calculations, most aircraft have to fly the approach in a dirty configuration, i.e. with flaps and slats extended for an extended period of time, to keep the ground speed low and comply with the speed restrictions. This will generate more noise from the over flying aircraft and is more fuel demanding.
The material containing the statistical analysis of the historical meteorological data for Göteborg Landvetter airport, provided to the procedure designers, was created by Novair.
Meteorological data from weather balloons, sent up twice per day from Göteborg Landvetter airport (World Meteorological Organisation Station 02526), for a ten year period was imported into a database to simplify analysis. This data contained, among other things, wind and temperature at many different altitudes. Based on the procedure altitudes during the turn, and based on the surface wind to assess runway in use, statistical winds and temperatures could be produced for the two runways.
Please see Appendix 2 for more details.
4.2.4 RNP procedures and the airport environmental permit Each Swedish Airport with a RWY longer than 1 200 meters requires an environmental permit. The Swedish environmental legislation does not permit any changes to the existing permit. Making changes to the environmental permit is a long process and the verdict of the environmental court to

Project ID: VINGA Final Report Edition: 04.00 30 Nov 2011
Page 31 of 103
the proposed changes can be unpredictable. There is, however, a possibility to make smaller adjustments to the permit, by applying for a change at the County of the Administrative Board (regional environmental authority). This process is much faster, approximately eight weeks long. This possibility was used in the VINGA project.
The application to the County of the Administrative Board contained the geographical paths of the planned RNP AR procedures, the estimated number of flights, and expected environmental benefits. This application was preceded by a dialogue between the Authorities and Göteborg Landvetter Airport.
Note that in addition to gaining approval from the County of the Administrative Board, adjustments to the permit must also be approved by the Swedish CAA.
4.2.5 Outcome of the RNP procedure application process The County of the Administrative Board gave approval in early 2011 to use all relevant RNP procedures for a limited period of time (until the 30th September 2011), to gain operational experience and the opportunity to evaluate possible environmental benefits.
In February 2011 the Swedish CAA gave approval to publish two of the produced RNP STARs and RNP AR approaches in the Swedish AIP, for traffic arriving from the south-south-east to RWY21 and RWY03. Somewhat unexpectedly, however, the Swedish CAA put a time constraint on the usage of the initial two RNP procedures, equivalent to the time limit set by the County of the Administrative Board.
A publication of the RNP procedures from the south-west to RYW03 was denied at that time. The main reason for this decision was the newly implemented SID/STAR structure at Göteborg City Airport, mentioned in Section 3.2. This implementation included an evaluation period, as previously discussed, which did not allow for any further changes in this airspace during this period, according to the Swedish CAA.
A fourth RNP procedure was designed, and ready to be published, for traffic to RYW21, arriving from the south-west. This procedure was denied due to differences in interpretation of the ICAO Document 9905 between the VINGA project and the Swedish CAA.
4.3 Preparation of RNP Transition to ILS RNP Transition to ILS is a new type of airspace operation in Europe. Therefore, the preparation of the validation flights was given special attention in order to develop the most appropriate solution for all the stakeholders. This started from the design phase up to the validation phase, which was conducted in Airbus simulator facilities in Toulouse, France, with Airbus expert pilots and participation of Novair flight crews.
4.3.1 Design of RNP Transition to ILS There are no ICAO guidelines for the procedure design of RNP Transition to ILS approaches available at this time. The solution for RNP Transition to ILS was designed by LFV in collaboration with Quovadis/Airbus as an overlay “RNP AR STAR” to the current P-RNAV STAR OSNAK 1S, which is illustrated in Figure 13 below.
The RNP AR STAR joined the ILS procedure at the FAP for RWY21. The STAR included a RF leg between the waypoints GG490 and GG410 (see below) and the RNP AR STAR was based on RNP 0,3.
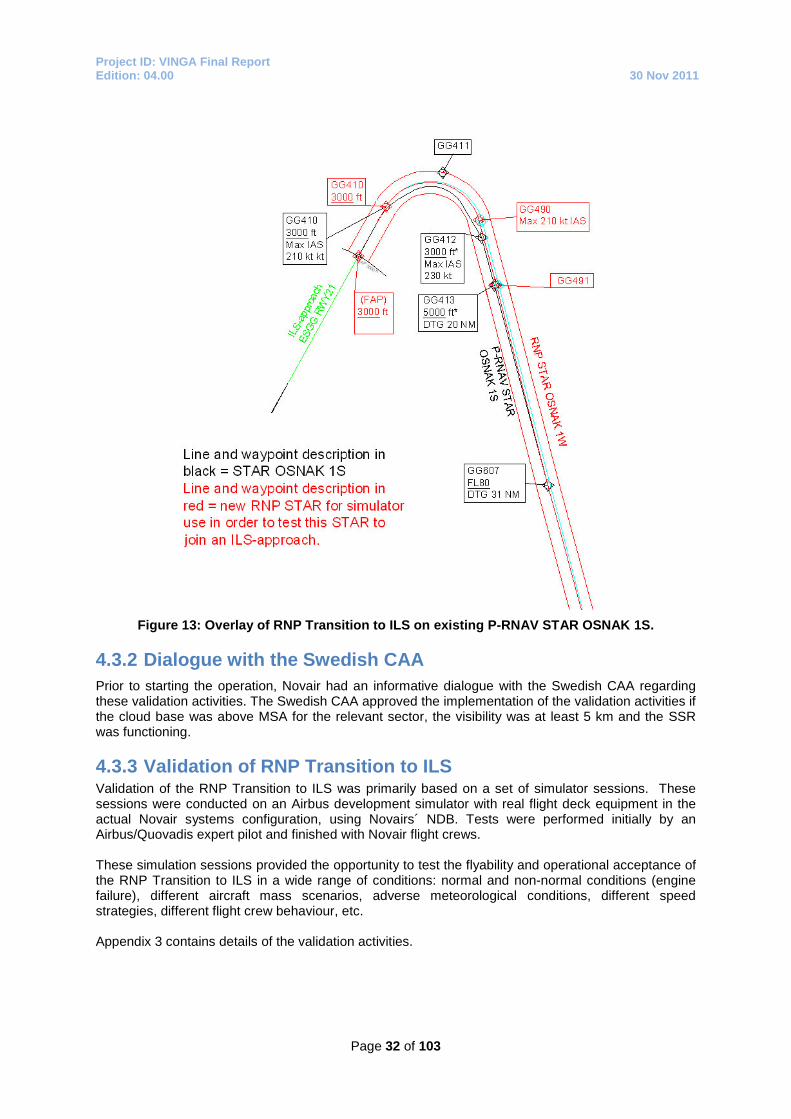
Project ID: VINGA Final Report Edition: 04.00 30 Nov 2011
Page 32 of 103
Figure 13: Overlay of RNP Transition to ILS on existing P-RNAV STAR OSNAK 1S.
4.3.2 Dialogue with the Swedish CAA Prior to starting the operation, Novair had an informative dialogue with the Swedish CAA regarding these validation activities. The Swedish CAA approved the implementation of the validation activities if the cloud base was above MSA for the relevant sector, the visibility was at least 5 km and the SSR was functioning.
4.3.3 Validation of RNP Transition to ILS Validation of the RNP Transition to ILS was primarily based on a set of simulator sessions. These sessions were conducted on an Airbus development simulator with real flight deck equipment in the actual Novair systems configuration, using Novairs´ NDB. Tests were performed initially by an Airbus/Quovadis expert pilot and finished with Novair flight crews. These simulation sessions provided the opportunity to test the flyability and operational acceptance of the RNP Transition to ILS in a wide range of conditions: normal and non-normal conditions (engine failure), different aircraft mass scenarios, adverse meteorological conditions, different speed strategies, different flight crew behaviour, etc. Appendix 3 contains details of the validation activities.

Project ID: VINGA Final Report Edition: 04.00 30 Nov 2011
Page 33 of 103
4.3.4 Planned number of flights - RNP Transition to ILS A total of ten validation flights, concerning RNP Transition to ILS were planned to be conducted in the project. A prerequisite to conduct this operation was that RWY21 was in use with the validation flight arriving from the south-south-east, sufficient meteorological conditions were present, designated flight crews were working and the traffic situation permitted this operation. Since the RNP Transition to ILS trajectory was designed as an overlay procedure to the existing P-RNAV STAR, no intervention was required by the ATCOs. Due to the prerequisites, a limited number of validation flights were planned.

Project ID: VINGA Final Report Edition: 04.00 30 Nov 2011
Page 34 of 103
5 Execution phase of the VINGA project The execution phase of the VINGA project started on the 7th of April 2011, with flights conducting RNP Transition to ILS.
In the middle of May 2011, flights covering the validation scenario from en-route to en-route commenced, including the RNP AR approach operation. All RNP AR approach operations were terminated on the 30th of September 2011, due to lack of permits from the CAA and the environmental authorities to continue the RNP operation (as discussed in Section 4). During this period, all arriving Novair flights came from eastern Mediterranean destination airports, typically in Greece and Turkey. This meant that most validation flights were entering and leaving Swedish airspace via Polish airspace.
Validation flights during the departure phase and monitoring of aircraft RTA capabilities have been on-going and continued until the end of November 2011.
Schematically, the VINGA project can be illustrated as in Figure 14 below.
Figure 14: The life cycle of the VINGA project.
5.1 Definition of a VINGA flight The definition of a successful VINGA-flight inbound Göteborg Landvetter Airport was as follows:
A flight including direct routing towards the TMA entry point, expected inbound clearance before ToD, coordination from ATC for the aircraft to conduct a CDO from ToD, a RNP STAR followed by a RNP AR approach. In addition, the Airspace User used best practice. If these criteria’s were not fulfilled, the flight was not a VINGA flight. 10% of the VINGA flights received limited interference from ATC, primarily speed control, which could affect the optimum CDO, but this also shows that the RNP procedures can be used during more dense periods.
In addition to the RNP STARs and RNP AR approaches 11 RNP Transition to ILS flight were conducted. The purpose was to validate the technical solution. These flights are treated separately.

Project ID: VINGA Final Report Edition: 04.00 30 Nov 2011
Page 35 of 103
6 ATM perspective of VINGA From an ATM perspective, the high-level objective of the VINGA project was to give arriving flights direct routing towards the TMA entry point from an as early stage as possible. This would be followed by an unconstrained CDO from ToD and finalised with an RNP AR approach. During the surface operation, the aim was that the ATCO should be aware of the different elements of using best practise in this part of the flight, such as single-engine taxi, absorbing any delay at the gate, etc. During the departure segment the ATCO should use existing tools in the most effective manner, allowing optimum speed, and using direct routing in combination with a CCD.
Another important aspect of the VINGA project, from an ATM perspective, was to gain a valuable knowledge of how ATCOs experience the implementation of new technology in the day-to-day operation. The aim was that these flights should not be treated by the ATCOs as validation flights, i.e. they should be handled by existing personnel and existing ground supporting tools as any normal flight, without any special treatment. The VINGA ATM perspective was evaluated in cooperation with the participating ATCOs.
In total, more than one hundred ATCOs were affected by the VINGA validation flights; almost all ATCOs at ATS Landvetter and ATCOs in three different en-route sectors of the ATCC in Malmö. Much of the focus was initially put on assessing the changes needed, in terms of equipment upgrades, education, legal aspects and tools for the evaluation of the project.
It was quickly realised that the major difference for the ATCOs involved in the VINGA project, compared to the traditional operation, was the implementation of RNP STARs and RNP AR approaches. This was due to the implementation of new technology, a new set of operational rules, new flight trajectories, new letter of agreements, etc. In contrast, aspects such as direct routing, CDO operation, etc, were found to be more or less standard operating procedures from an ATM perspective. The detailed description of the preparation, the execution of flights and analysis part of this report will therefore focus on the outcome of primarily the RNP AR approach activities.
6.1 ATM – Preparation The Project Management team was very much aware that the proposed changes could be viewed as incentives that would complicate the day-to-day operations to some extent for the involved ATCOs. Focus was therefore given on involvement, dialogue and information. The latter one was very important for all involved personnel to ensure they understood the motives and objectives of the project.
6.1.1 Workshops Workshops were arranged with local ATCOs from ATS Landvetter, where flight crews from Novair, based in Göteborg participated as well. The purpose was to disseminate information about the planned activities, with the aim of using existing technology to gain maximum possible environmental benefits. It was also a good opportunity for these different parties to meet, exchange ideas and get in depth information about each other’s working environment, prior to the start of the validation activities.
During these workshops, discussions were held about the new rules and radio phraseology to be used during the validation activities. A key objective was also to actively involve all personnel in the project. It was of vital importance to ensure that all ATCOs felt that they had an important role to play and that their opinions in matters were taken into account and the planned activities were not forced up on them from the project.
Members from the VINGA project (including the airport, airline operator and ATS Landvetter) visited the ATCC in Malmö and interacted with approximately 80 ATCOs, working in the en-route sectors. They were informed about the project, but the most important aspect was to collect ideas about how to develop written agreements and operational procedures such as vocabulary to be used.
It was decided to give ATCOs the possibility to fly on validation flights, and observe from the cockpit, in order to gain a more in depth understanding about the project, from an airborne perspective.

Project ID: VINGA Final Report Edition: 04.00 30 Nov 2011
Page 36 of 103
6.1.2 Agreements and operational procedures The objective was to ensure the procedures for the validation flights were kept as similar as possible to the normal day-to-day operations, regarding coordination and handover of traffic from one ATC sector to another, etc.
Based on feedback from ATCOs and flight crews it was decided that the flight crew had to actively request a RNP AR approach procedure from ATC, i.e. it was not initiated by the controlling ATCO. It was thoroughly discussed amongst the ATCOs how they should know if they should give the candidate flight a RNP AR approach clearance or not. The ATCOs knew that all Novair flights were possible candidate flights, if flying into Göteborg Landvetter Airport, but there were certain constraints that had to be taken into account, such as weather conditions. Initially it was decided to use the remarks section of the ICAO ATC flight plan, clearly indicating “VINGA” there, but there was always a potential risk if Novair missed inserting it or if the ATCO did not see it. After some time, it was decided that the RNP AR approach clearance should only be given if actively requested by the flight crew.
In addition, it was decided in an early stage of the project that the Eurocat 2000 E system had to be used to greatest extent possible for seamless coordination between all ATC sectors.
6.1.3 ATM ground system upgrades The software of the Eurocat 2000 E system was upgraded prior to the execution of the validation flights. This was done by implementing an extended centreline to both RWY ends, which would support the ATCO in tactical decision making. The RNP STARs and RNP AR approaches were also implemented in the system, together with the existing STAR and ILS structure. It was realised that this presentation would be a tool for the ATCO to handle sequencing and separation in a mixed-mode operation more easily, i.e. with traffic using the P-RNAV STAR and ILS structure. It would also improve the situational awareness, when multiple ATCOs were involved in the process. It was decided that both the ILS and RNP AR approaches should have lateral marks every 2 NM, and markings indicating the distance 20 NM from the RWY threshold in the RNP STARs. In addition, the IAF for the RNP AR approaches was integrated, easily illustrated to the ATCO, shown in Figure 15 below.

Project ID: VINGA Final Report Edition: 04.00 30 Nov 2011
Page 37 of 103
Figure 15: RNP AR approach to RWY21 as presented in the Eurocat 2000 E system.
6.1.4 Preparation of tools for the ATM analysis part An important aspect of the planned follow up to the VINGA project was to gain knowledge about how ATCOs experienced the implementation of new technology. A structured feedback system was developed, based on the following elements:
A questionnaire was developed (see Appendix 4), after each validation flight; the ATCO was required to fill out the questionnaire, with the flight in fresh memory.
The operational requirements stipulated that the VINGA Project Manager was easily accessible for questions and clarifications of any issue that arose.
The VINGA Project Manager was also an active ATCO at ATS Landvetter, which made it easy to exchange ideas between the Project Manager and the other ATCOs.
A direct communication link was set up between the VINGA Project Manager and Malmö ATCC, for quick feedback on their experiences.
After the termination of the project, it was decided to collect feedback from ATCOs that had either experienced something unexpected and/or had gained a lot of experience regarding validation flights.
6.2 Execution of the validation flights – ATM perspective Prior to the execution of validation flights, new ATM agreements were published in the Operation Manual for both ATS Landvetter and ATCC Malmö. All ATCOs was given a thorough overview of its content in connection with briefings, held at the two premises.

Project ID: VINGA Final Report Edition: 04.00 30 Nov 2011
Page 38 of 103
6.2.1 En-route phase The ATM activities in the en-route phase for arriving flights composed of three main activities, giving flight crew inbound clearance via a RNP AR approach, direct routing and enabling of CDO from ToD.
6.2.1.1 Direct routing for arriving flights All the VINGA validation flights comprised flights through three en-route sectors in Swedish FIR, managed by Malmö ATCC. The validation flights allowed the ATCO to give direct routing towards the Göteborg TMA entry points OSNAK (RWY21) and KOVUX (RWY03). These waypoints are the designated starting points for the RNP STARs to the IAF of the two RNP AR approaches. This arrangement was slightly different compared with the traditional operational agreements between Malmö ATCC and ATS Landvetter. The en-route structure of the Swedish airspace is designed to allow direct routing; the Eurocat 2000 E system has functionalities for medium term conflict detection. Regarding direct routing towards one of the TMA entry points (KOVUX), a verbal coordination was normally required between the ATCOs; in the frame of the VINGA project, it was decided that this coordination could take place without any verbal coordination, i.e. via silent coordination.
During periods of low-density traffic, direct routing could occasionally already be given from inside the adjacent Polish FIR, after coordination between Malmö and Warsaw ATCCs.
By giving direct routing towards the TMA entry point, the validation aircraft could fly as efficiently as possible towards the destination. In order to initialise the validation activities, the flight crew requested a RNP STAR and RNP AR approach clearance to Göteborg Landvetter Airport on initial contact with Malmö ATCC in en-route sector 8 as illustrated in Figure 16 below. This was close to the Swedish FIR boundary, during the en-route phase (characteristically flown at FL340 or FL360 by the arriving validation flight); this is typically 40-45 minutes before landing, prior to the ToD, which occurred 25-30 minutes before landing in sector 2 or 8. The controlling ATCO informed the flight crew if a validation flight was expected to be feasible when approaching Göteborg TMA. The phraseology used stated: ”You can plan/expect OSNAK1X/KOVUX1Q”.

Project ID: VINGA Final Report Edition: 04.00 30 Nov 2011
Page 39 of 103
Figure 16: A simplified illustration of all sectors affected during the validation period.
If RNP operation was considered feasible, the responsible en-route ATCO updated the Eurocat 2000 E system via the electronic strip system or telephoned his colleague in the sector that gave the inbound clearance to Göteborg Landvetter Airport.
6.2.1.2 CDO It was very important that the flight crew knew the intended track, to be able to programme the planned route into the aircraft FMGS, and then allowing them to conduct a CDO from the ToD. It was the responsibility of Malmö ATCC to facilitate this service to the validation flights. Depending on RWY in use at Göteborg Landvetter Airport, aircraft mass, meteorological conditions etc. the ToD varied from day-to-day. Malmö ATCC typically used phraseology such as “at pilot discretion, descend to FL100”or “when ready, descend to FL100”. By using this concept, the VINGA validation flights could leave the en-route segment at an optimum point, even if the inbound clearance was given in an adjacent sector, further along the trajectory, as discussed below. The ToD was typically over the northern part of the province Scania (Skåne).
6.2.2 Inbound ATC clearance via a RNP STAR and RNP AR approach
The en-route sector adjacent to Göteborg TMA gave the validation flight the ATC inbound clearance. The phraseology used was as follows and similar to other clearances given, e.g. “Navigator 344, cleared Landvetter via OSNAK 1X (RNAV approach) RWY21” (Navigator is the telephony designator

Project ID: VINGA Final Report Edition: 04.00 30 Nov 2011
Page 40 of 103
(call sign) of Novair in accordance with ICAO Annex 10, chapter 5.2.1.7.2.1). The ATCO updated the Eurocat 2000 E system by choosing the designated STAR. This generated a so called Flight-leg, when the aircraft was handed over to the adjacent ATC sector, shown in Figure 17. The ATCO uses a one push system to easily see the ATS route, that the aircraft has been cleared to follow.
Figure 17: The FLEG as shown in the Eurocat 2000 E system. The figure shows the Flight-leg
for a departing Novair flight (NVR151).
The cleared trajectory will be highlighted on the monitoring screen for the overtaking ATCO. By also addressing, e.g. O1X in a text message, as shown in Figure 18 below, the information was automatically distributed in the ATM system.

Project ID: VINGA Final Report Edition: 04.00 30 Nov 2011
Page 41 of 103
Figure 18: Aircraft label in Eurocat 2000 E
This allowed the ATCO in the TMA to easily see that the validation flight planned to execute a RNP AR approach. This operational procedure was chosen, since the RNP STAR paths deviated from the standard paths, concerning P-RNAV STAR operation. This means that the validation flight, prior to being controlled by the ATCO in the TMA, had two indications that it would fly a RNP AR approach, via the Flight-Leg and via the text message in the Eurocat 2000 E system.
6.2.3 RNP STARs and RNP AR approaches in the TMA From a TMA perspective, the implementation of the RNP STARs and the RNP AR approaches would facilitate new flight paths, and thus the possibility of new geographical conflict areas with, for example, departing traffic on SIDs. A key objective was that these new VINGA procedures would have a minimum impact on the overall operation in the TMA. There were geographical differences in the RNP STARs compared to the P-RNAV STARs.
Another focus area was to minimise tactical intervention of arriving traffic, i.e. allow the aircraft to fly unconstrained to the greatest possible extent. This aspect was closely linked to the workshops held, where special focus was given to the ATCOs prior to the execution of the project, in order to gain an in depth understanding of what effects, e.g. speed constraints, could have on the aircraft from an environmental efficiency perspective.
6.2.4 RNP Transition to ILS Since the RNP Transition to ILS instrument procedure was an overlay trajectory to the existing P-RNAV STAR, no involvement from the ATCOs was required; the flight was treated as a normal P-RNAV flight.
6.2.5 Surface operation The main involvement from ATCOs in terms of the surface operation was to actively work with the flight crews when restrictions in the airspace structure occurred, primarily when the departing aircraft

Project ID: VINGA Final Report Edition: 04.00 30 Nov 2011
Page 42 of 103
had a CTOT. Since a lot of the Novair flights were departing to Greek destination, with a lot of traffic in Hellenic airspace during the summer of 2011, there were a significant amount of time constraints given for the VINGA flights by the CFMU unit of Eurocontrol.
6.2.6 Departure segment The departure phase of the VINGA validation flights covered aspects such as direct routing, free speed during climb out, removal of speed constraints in some of the SID structure, and it effects on emissions and aircraft-generated noise. The departing VINGA flights received direct routing via a waypoint on the FIR border of Swedish-Polish airspace at earliest possible stage in flight. This direct routing was latest granted by the first en-route sector, in silent coordination via the Eurocat 2000 E system. Depending on the density of traffic, further direct routing could be given in an early stage of the VINGA flights, which is based on agreements between Malmö ATCC and Warsaw ATCC, e.g. resulting in direct routing towards the Polish-Czech boarder, as illustrated in Figure 19 below. There is one important aspect that needs to be addressed concerning ATCOs and the possibility to offer the most efficient flight path during climb. The challenge is to have the knowledge about how to prioritise between a descending aircraft and a climbing aircraft on converging tracks, which will affect the lateral or vertical separation minima’s stipulated. A possibility is to slightly extend the flight path of the climbing aircraft, to be able to offer a CCD. After discussions between Airspace Users and ATS Landvetter, the general recommendation was as follows: If flight safety permits, the ATCO should try to prioritise an unrestricted descent, i.e. a CDO. A slight extension of the flight path for the departing flights was accepted, in order to facilitate CCD, which is more efficient than keeping the initial lateral flight path, with an intermediate level off. This concept was not specified in any regulation, but is a good example of good coordination between the ground and the airborne side for the overall best result, based on knowledge, education and involvement of the ATCOs. The speed constraints applied to some SIDs during the departure segment were evaluated as part of the VINGA project; this was an important part of the project. The purpose of this activity was to evaluate the environmental benefits in terms of reduced CO2 emissions that could be gained from optimising the SID structure, but also to clearly identify any possible negative noise aspects from the changed procedures. Close collaboration was required between the active ATCOs and the flight crews, when these actions were conducted. The validation started with a phone call from the flight crew to the Project Manager or directly to the ATC tower facilities at Göteborg Landvetter Airport. The flight crew described the intended plan and what effect it would have on aircraft behaviour after departure. If the traffic situation permitted these activities, it was granted by the ATCO in conjunction with the take-off clearance. The results of this environmental analysis will be covered in Section 9.
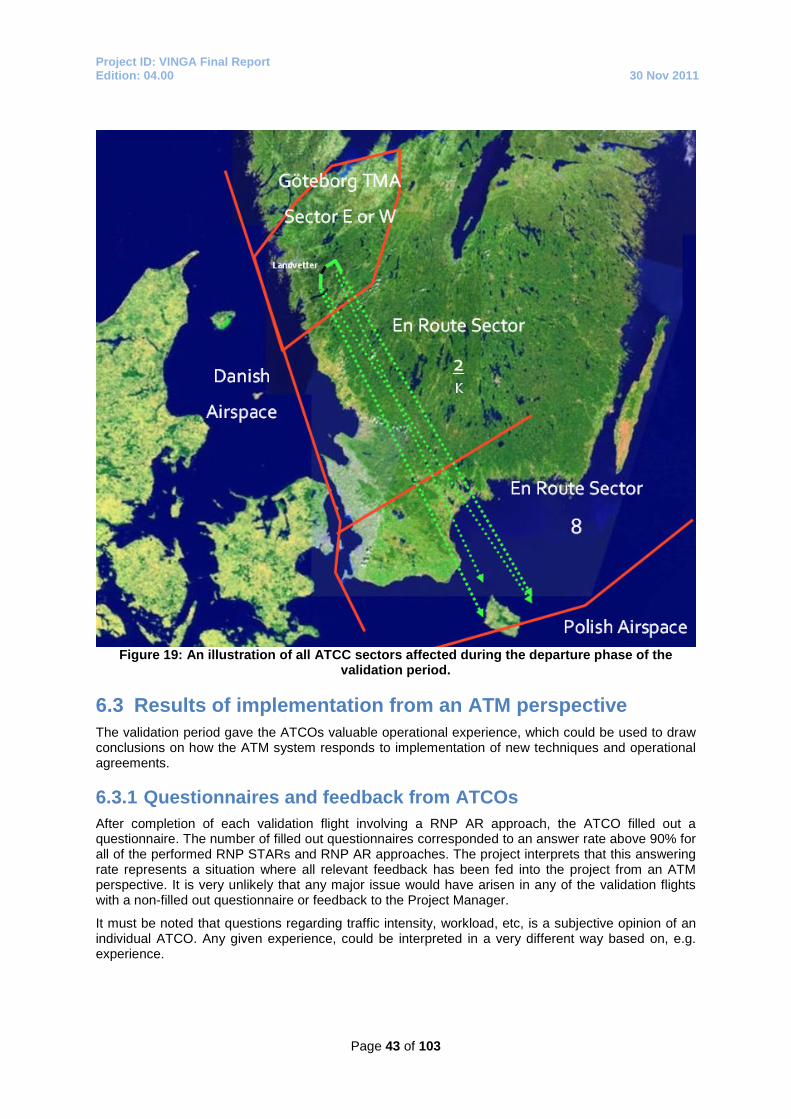
Project ID: VINGA Final Report Edition: 04.00 30 Nov 2011
Page 43 of 103
Figure 19: An illustration of all ATCC sectors affected during the departure phase of the
validation period.
6.3 Results of implementation from an ATM perspective The validation period gave the ATCOs valuable operational experience, which could be used to draw conclusions on how the ATM system responds to implementation of new techniques and operational agreements.
6.3.1 Questionnaires and feedback from ATCOs After completion of each validation flight involving a RNP AR approach, the ATCO filled out a questionnaire. The number of filled out questionnaires corresponded to an answer rate above 90% for all of the performed RNP STARs and RNP AR approaches. The project interprets that this answering rate represents a situation where all relevant feedback has been fed into the project from an ATM perspective. It is very unlikely that any major issue would have arisen in any of the validation flights with a non-filled out questionnaire or feedback to the Project Manager.
It must be noted that questions regarding traffic intensity, workload, etc, is a subjective opinion of an individual ATCO. Any given experience, could be interpreted in a very different way based on, e.g. experience.
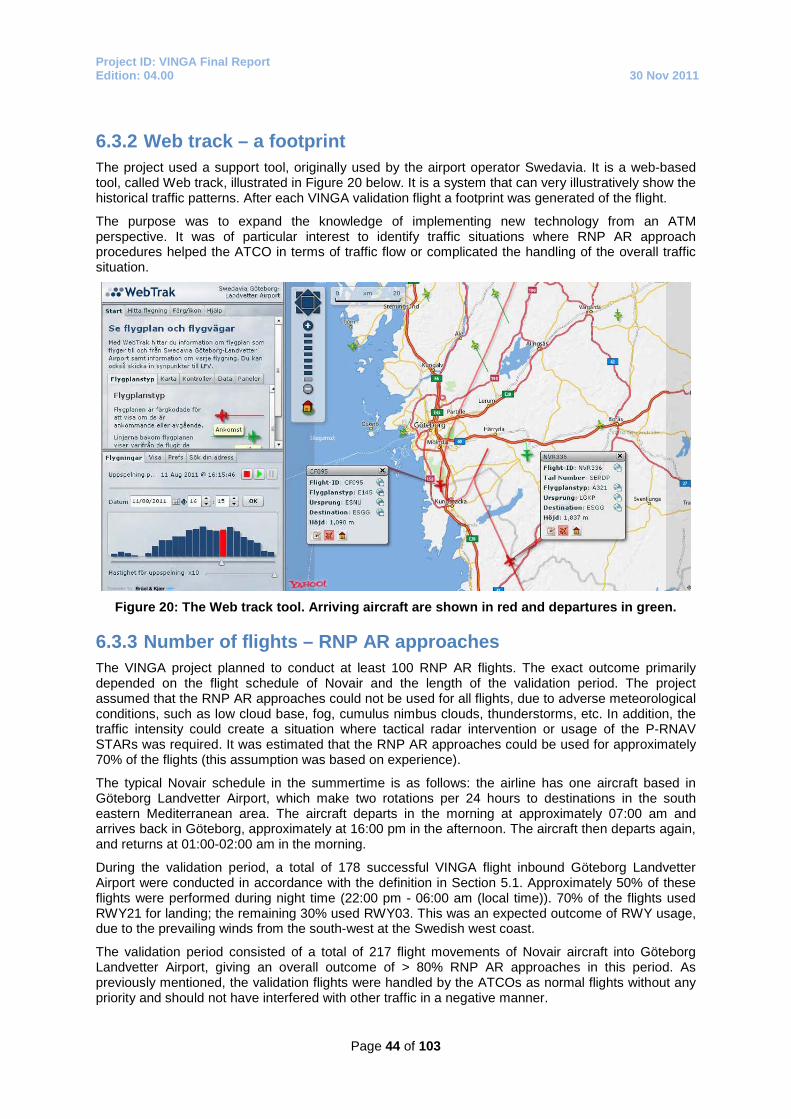
Project ID: VINGA Final Report Edition: 04.00 30 Nov 2011
Page 44 of 103
6.3.2 Web track – a footprint The project used a support tool, originally used by the airport operator Swedavia. It is a web-based tool, called Web track, illustrated in Figure 20 below. It is a system that can very illustratively show the historical traffic patterns. After each VINGA validation flight a footprint was generated of the flight.
The purpose was to expand the knowledge of implementing new technology from an ATM perspective. It was of particular interest to identify traffic situations where RNP AR approach procedures helped the ATCO in terms of traffic flow or complicated the handling of the overall traffic situation.
Figure 20: The Web track tool. Arriving aircraft are shown in red and departures in green.
6.3.3 Number of flights – RNP AR approaches The VINGA project planned to conduct at least 100 RNP AR flights. The exact outcome primarily depended on the flight schedule of Novair and the length of the validation period. The project assumed that the RNP AR approaches could not be used for all flights, due to adverse meteorological conditions, such as low cloud base, fog, cumulus nimbus clouds, thunderstorms, etc. In addition, the traffic intensity could create a situation where tactical radar intervention or usage of the P-RNAV STARs was required. It was estimated that the RNP AR approaches could be used for approximately 70% of the flights (this assumption was based on experience).
The typical Novair schedule in the summertime is as follows: the airline has one aircraft based in Göteborg Landvetter Airport, which make two rotations per 24 hours to destinations in the south eastern Mediterranean area. The aircraft departs in the morning at approximately 07:00 am and arrives back in Göteborg, approximately at 16:00 pm in the afternoon. The aircraft then departs again, and returns at 01:00-02:00 am in the morning.
During the validation period, a total of 178 successful VINGA flight inbound Göteborg Landvetter Airport were conducted in accordance with the definition in Section 5.1. Approximately 50% of these flights were performed during night time (22:00 pm - 06:00 am (local time)). 70% of the flights used RWY21 for landing; the remaining 30% used RWY03. This was an expected outcome of RWY usage, due to the prevailing winds from the south-west at the Swedish west coast.
The validation period consisted of a total of 217 flight movements of Novair aircraft into Göteborg Landvetter Airport, giving an overall outcome of > 80% RNP AR approaches in this period. As previously mentioned, the validation flights were handled by the ATCOs as normal flights without any priority and should not have interfered with other traffic in a negative manner.

Project ID: VINGA Final Report Edition: 04.00 30 Nov 2011
Page 45 of 103
6.3.4 Usage of RNP AR approaches during the validation period It was of particular interest to investigate in detail why some of the flights were not using the RNP AR procedures; to better understand the operational limitations and possibly propose changes in the current operational environment. Of all arriving flights included in the VINGA validation period, the RNP AR approaches were used in 82% of the cases, as illustrated in Figure 21.
Proportion of RNP AR approaches (Number of flights 217)
RNP AR
Not RNP AR
0%
20%
40%
60%
80%
100%
All flights during validation of RNP AR
prop
ortio
n
Figure 21: Proportion of RNP AR approaches.
The RNP AR approaches were executed in different traffic scenarios. During night time, the validation flight often arrived alone, which made it straightforward for the ATCOs to handle the validation aircraft. During day time, the traffic intensity typically varies, depending on the time. The use of RNP AR approaches during more dense traffic periods requires strategic forward planning from the ATCOs, in order to predict the future lateral separations in the final part of the flight between aircraft arriving from different directions and following different trajectories/procedures. A traffic situation is illustrated in Figure 22 below, which shows an arriving Novair flight on the RNP STAR, just about to start the RNP AR approach to RWY21 in red, with another aircraft in the approach phase as well, flying a P-RNAV STAR followed by an ILS approach.

Project ID: VINGA Final Report Edition: 04.00 30 Nov 2011
Page 46 of 103
Figure 22: A traffic situation during daytime with multiple arriving aircraft. NVR438 is
conducting a RNP STAR and RNP AR approach.
6.3.5 Reasons for not using RNP AR approaches 18% of the intended flights which potentially could have executed a RNP AR approach used an ILS approach instead. In many of these cases the flight crew did not request a RNP AR approach, in some cases the request was rejected by ATC and in some cases the flight crew was given an inbound clearance via a RNP STAR but ATC changed strategy to tactical radar intervention, similar to any other operation in the TMA. In the cases when the planned VINGA flight was cancelled, it occurred at various stages throughout the descent, but predominantly around the Göteborg TMA border. No RNP AR approach clearance has been cancelled after the IAF, i.e. all flights has successfully flown the IAP without any intervention from ATC.

Project ID: VINGA Final Report Edition: 04.00 30 Nov 2011
Page 47 of 103
Reason - not RNP AR during validation period (39 out of 217 flights)
0
5
10
15
20
25
30
Weather minima CB - activity Traffic ATC Airspace Other Figure 23: Reasons for not using RNP AR approaches.
Weather phenomena and traffic intensity inside the TMA was the main contributing factor for not using the RNP AR procedures during the validation period.
The operational criteria for using the RNP AR procedures were a cloud base of at least 340 ft above ground and a visibility of at least 800 metres. The validation period was primarily in a period which traditionally has good weather conditions; however, occasionally unexpected periods of significantly bad weather occurred during the summer of 2011, which had a negative impact on the validation flights, forcing these flights to use the ILS. From an ATM perspective these flight have never received any changed trajectory since the pilot never requested a RNP STAR followed by a RNP AR approach.
Traffic density was the second most common reason for not using a RNP AR approach procedure. This was a result of a high level of simultaneous inbound traffic, which caused the ATCO to cancel a planned RNP AR operation. The ATCO changed strategy to tactical radar intervention, followed by an ILS approach, in the same way as the current system when the ATCO change from usage of closed P-RNAV STAR to radar vectoring.
A traffic situation is illustrated in Figure 24 below, which shows an intended RNP AR approach that was changed to tactical radar vectoring due to other traffic. The red trajectory shows the Novair aircraft. The lack of a supporting ground tool was apparent in these situations. It is relatively difficult for the ATCO to allow traffic to continue on the planned RNP AR approach, without penalising other arriving traffic. The challenge for ATC is to guarantee that adequate lateral separation will be achieved with the other traffic when flying along the extended centreline in the final part of the flight. Therefore it is natural that situations like the one below will be solved with the usage of tactical radar vectoring.
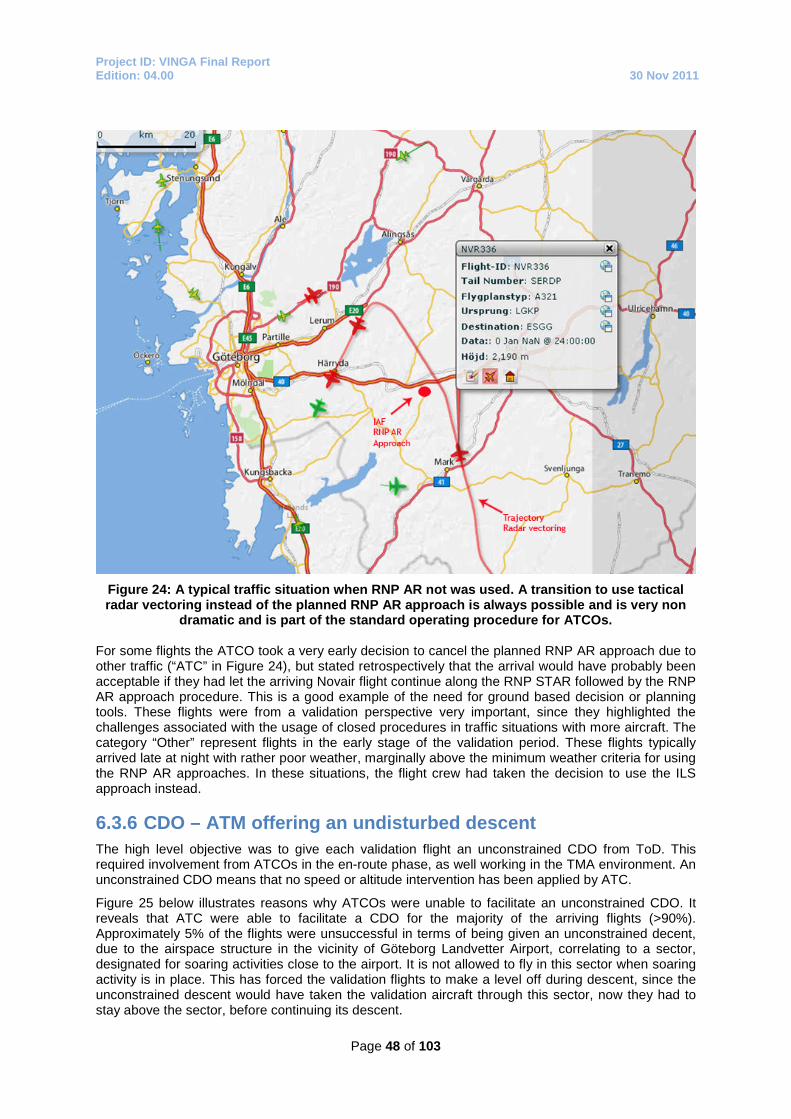
Project ID: VINGA Final Report Edition: 04.00 30 Nov 2011
Page 48 of 103
Figure 24: A typical traffic situation when RNP AR not was used. A transition to use tactical radar vectoring instead of the planned RNP AR approach is always possible and is very non
dramatic and is part of the standard operating procedure for ATCOs. For some flights the ATCO took a very early decision to cancel the planned RNP AR approach due to other traffic (“ATC” in Figure 24), but stated retrospectively that the arrival would have probably been acceptable if they had let the arriving Novair flight continue along the RNP STAR followed by the RNP AR approach procedure. This is a good example of the need for ground based decision or planning tools. These flights were from a validation perspective very important, since they highlighted the challenges associated with the usage of closed procedures in traffic situations with more aircraft. The category “Other” represent flights in the early stage of the validation period. These flights typically arrived late at night with rather poor weather, marginally above the minimum weather criteria for using the RNP AR approaches. In these situations, the flight crew had taken the decision to use the ILS approach instead.
6.3.6 CDO – ATM offering an undisturbed descent The high level objective was to give each validation flight an unconstrained CDO from ToD. This required involvement from ATCOs in the en-route phase, as well working in the TMA environment. An unconstrained CDO means that no speed or altitude intervention has been applied by ATC.
Figure 25 below illustrates reasons why ATCOs were unable to facilitate an unconstrained CDO. It reveals that ATC were able to facilitate a CDO for the majority of the arriving flights (>90%). Approximately 5% of the flights were unsuccessful in terms of being given an unconstrained decent, due to the airspace structure in the vicinity of Göteborg Landvetter Airport, correlating to a sector, designated for soaring activities close to the airport. It is not allowed to fly in this sector when soaring activity is in place. This has forced the validation flights to make a level off during descent, since the unconstrained descent would have taken the validation aircraft through this sector, now they had to stay above the sector, before continuing its descent.

Project ID: VINGA Final Report Edition: 04.00 30 Nov 2011
Page 49 of 103
The remaining 5% of the validation flights received tactical intervention via speed control instructions from ATC. The speed constraints were issued in order to achieve the minimum required lateral separation between the validation flight and the other traffic in the arrival sequence. This was primarily used inside the TMA, but was used on remote occasions in the en-route phase for separation purposes.
ATM offering undisturbed descent
90%
5%5%
undisturbed
disturbed -airspace
disturbed - speed
Figure 25: The outcome of undisturbed vs. disturbed CDO.
6.3.7 RNP implementation and its impact on the workload of the ATCOs
The questionnaire results and verbal feedback suggested that the ATCOs believe that the usage of RNP AR approaches in a mixed-mode environment was not problematic. The results indicated, however, that making a correct early decision if the traffic situation allowed an aircraft to stay on a closed path procedure, such as an RNP STAR followed by a RNP AR approach all the way until landing, could impact workload. These kinds of scenarios; involving different aircraft on closed STAR procedures has been a natural part of the ATCOs working environment since January 2009, with the implementation of P-RNAV STARs into Göteborg Landvetter Airport.
The ATCOs have been introduced to new flight paths based on new technology, new procedures, new bilateral agreements and new phraseology during the implementation phase of RNP operations therefore it was a natural thing to expect that some kind of impact would occur.
The ATCOs used the questionnaires to indicate how they had experienced the usage of the RNP operations in respect of workload. The ATCOs graded the workload associated with RNP operation on a 5 unit scale, where a grading of 1 indicated no impact and a grading of 5 indicated a situation with major impact on the workload. Figure 26 below, illustrates the outcome of this survey.

Project ID: VINGA Final Report Edition: 04.00 30 Nov 2011
Page 50 of 103
RNP AR approaches - impact on workload
0
20
40
60
80
100
1 2 3 4 5
1 - no impact, 5 - high impact
perc
enta
ge o
f flig
hts
Figure 26: Impact on ATCO workload with introduction of RNP operation.
For the vast majority of the flights, ATCOs indicated that RNP AR operation did not affect their workload. For approximately 60% of the flights, the ATCOs indicated that this had "no impact" and for approximately 30% of the flights, they indicated that it had "some impact" on the workload.
For 17 flights (about 10% of flights), the ATCOs stated that it had affected the workload moderately or quite extensively (3 or 4 on the relative 5 unit scale). These flights were of course of certain interest.
It was identified by the VINGA project that these cases with high grading were closely linked to two main reasons: either the ATCO stated that the reason for the perceived impact on the workload was related to a traffic situation with numerous aircraft in Göteborg TMA, or lack of experience that made it a little bit more challenging to determine the sequence of the arriving aircraft when the RNP AR approach consists of a curved final.
Numerous aircraft
A typical solution to decrease workload during traffic scenarios with numerous aircraft involved was to use a Director; an additional ATCO with the task to control the arrival flow in the latter part of the approach. This is a standard method to decrease workload during periods with numerous inbound aircraft. Figure 27 below, illustrates a traffic situation where the ATCO stated a perceived high impact on workload (4 out of five on the relative 5 unit scale). The ATCO had to monitor a Novair aircraft on the RNP STAR followed by the RNP AR approach to RWY21 in combination with other traffic on the closed P-RNAV STAR procedures.
The ATCO had to make a decision whether the required lateral separation criteria on the extended centreline would be met or not. The aircraft on the RNP STAR followed by a RNP AR approach is controlled by means of using speed control. The ATCO stated that the workload decreased by using a Director.
It is of utmost importance to understand that the ATCOs always have the option to change strategy and revert to tactical radar vectoring if they are not comfortable with the usage of closed procedures. Increased workload in specific traffic situations is not unique for RNP AR; this can occur in the same way with P-RNAV STARs. The solution is the same; change of strategy and/or using a Director.
Lack of experience
Due to the limited number of flights during the validation period, most ATCOs only handled a few VINGA flights each. In the feedback received it was clear that workload was affected when dealing with the first VINGA flight and that workload decreased when they got more familiar with the procedures. This must be considered as a normal effect of implementing new procedures regardless of technology; P-RNAV or RNP AR.

Project ID: VINGA Final Report Edition: 04.00 30 Nov 2011
Page 51 of 103
Figure 27: A mixed mode scenario, involving multiple aircraft with different navigation
capabilities.
Figure 27 is a very good example of a situation where the ATCOs had confidence in the airborne RNP technology and its capabilities. The track adherence by the aircraft is extremely accurate, which is of importance when the ATCO takes the tactical decision of allowing an aircraft to continue its intended RNP AR operation during periods with a higher density of traffic. Due to this high navigation accuracy in combination with a RF leg, the ATCO gets maximum predictability of the intended track. In addition, the existing support tools in Eurocat gave ATCO a clear view on how many NM each aircraft is from touchdown.
Before the validation period there were discussions whether introduction of a new level of navigational capability (RNP AR approaches) could complicate dealing with arriving aircraft, referred to as “mixed mode operations”. There has been no indication that this has been the case. This is of course a strong indication that well thought out solutions can take care of problems associated with mixed mode operations.
6.4 Direct routing The Eurocat 2000 E system, together with the operational agreements in place, were designed to enable a very high usage of direct routing within the airspace of the ATCC or with adjacent organisations, such as ATS Landvetter. Almost all traffic was given direct routing. This is also confirmed by flight data obtained in the VINGA project.
The project used a new agreement between Malmö ATCC and ATS Landvetter for one direct routing. Without verbal coordination the agreement allowed the aircraft to fly direct to one of the TMA entry points for the RNP AR approaches (KOVUX). The project did not receive any negative feedback from the ATCOs indicating that it will not be possible to implement the direct routing concept in the future for all traffic.

Project ID: VINGA Final Report Edition: 04.00 30 Nov 2011
Page 52 of 103
7 Airspace User perspective of VINGA The VINGA project has included various initiatives in different domains for Novair, and the airline has been actively working throughout the whole life cycle of the project. Novair worked in close cooperation with the other VINGA members assisting with the set up of the different validation scenarios and the execution phase of the validation flights. Novair settled all arrangements with the Swedish CAA, regarding the flight operational authorisation requirements, to conduct RNP operation. A prerequisite to settle these arrangements included software upgrades of the aircraft FMGS, flight crew education in various subjects, and internal set up of various monitoring systems. Novair has been acting in a supporting way during the development of the new procedures, and has been working with LFV and the other project members in the design of the RNP AR procedures, including a large study of statistical meteorological data, which was used during the development phase of the RNP AR approaches, as previously discussed (see Appendix 2). Throughout the lifecycle of the project, Novair ensured that all relevant flight data was collected for the flight efficiency analysis work and RNP related parameters. Novair has conducted the post flight data analysis for the arrival phase, exploiting the recorded data of the validation flights and comparing it against a baseline. This has included an analysis of different fuel efficiency parameters. Novair has been working together with Chalmers University as previously stated in some domains, and Chalmers have carried out the flight data analysis for the departure phase.
7.1 RNP AR approach operation
7.1.1 Introduction For an operator to conduct RNP AR approach operations, there are special requirements to be fulfilled. These requirements can be compared to the special requirement, which needs to be fulfilled to fly ILS precision approaches in low visibility, known as CAT II and CAT III approaches as previously mentioned.
These specific RNP AR operation requirements cover various areas, as for example:
Aircraft eligibility: Novair fleet was updated with an RNP AR package to conduct RNP AR operations down to RNP ≥ 0.3 NM. This package was certified by EASA in 2009.
Flight crew knowledge and training: Specific activities were conducted to ensure that flight crews were properly trained in this operation. This included flight crew preparation, ground school and simulator training.
Validation of the approach procedures: Simulator sessions took place prior to the validation activities, to confirm that the NDB was properly coded in accordance with ARINC 424 requirements and flight crew acceptance of the procedures.
Novair conducted an operational approval process for RNP AR operation with the Swedish CAA. It provided an opportunity to detail the proposed solution. For example, regarding aircraft certification aspects, a meeting was arranged with representatives from Airbus, Novair and the Swedish CAA, to present the way Airbus aircraft had been certified for RNP AR operation by EASA and presented deltas with the new AMC 20-26 regulation.
7.1.2 RNP AR Execution The flight crews of Novair have gained a great amount of experience in RNP AR operation during the VINGA lifecycle. The RNP AR operation has run smoothly and some initial matters of minor importance were raised during the initial part of the project. Prior to flying the RNP AR approaches,

Project ID: VINGA Final Report Edition: 04.00 30 Nov 2011
Page 53 of 103
i.e. in the en-route phase, there is a small amount of extra tasks in the cockpit, but it is not seen as demanding by the flight crews in comparison to normal ILS CAT I operation. The additional tasks in the cockpit are in parity with the additional preparations of ILS CAT II/III operation; both these types of operation require special preparation, approval and training. It is fair to say that the introduction of RNP AR procedures shifts some of the workload for the flight crew to an earlier stage during the flight mission.
A special RNP AR checklist was developed, that was used by the flights crews, when conducting RNP AR approaches. Since Novair had solid previous experience in flying closed P-RNAV STARs into Göteborg Landvetter Airport, the transition to closed RNP operation was very smooth.
In Figure 28 below, the ND is illustrated, showing the RNP AR approach along the green trajectory, compared to a P-RNAV STAR followed by ILS to RWY21.
Figure 28: RNP AR approach to RWY21.
The PFD illustrated in Figure 29, shows the presentation to the flight crew, after passage of the FAP.

Project ID: VINGA Final Report Edition: 04.00 30 Nov 2011
Page 54 of 103
Figure 29: The PFD during RNP AR approach operation.
7.2 RNP Transition to ILS Implementation of RNP Transition to ILS, as seen from an airborne perspective was uneventful. This was achieved by maintaining as close similarities as possible to the existing operations. The coding of the new trajectory kept the existing ILS approach adding a RNP AR STAR. The onboard system automatically proposes a combination of the two trajectories without discontinuity. There was no impact on the Novair aircraft configuration in terms of FMGS software upgrades, etc.
Refer to Appendix 3 for more details about the validation of the procedure, including simulator sessions.
From a cockpit view, the RNP Transition to ILS can be illustrated as follows. In Figure 30, the initial part of the RNP AR STAR OSNAK1W is shown. In Figure 31, the IAP is shown to RWY21. Figure 32 shows the intended flight path, as illustrated on the ND.

Project ID: VINGA Final Report Edition: 04.00 30 Nov 2011
Page 55 of 103
Figure 30: Initial part of the RNP AR STAR OSNAK 1W.
Figure 31: Final part of the RNP AR STAR OSNAK 1W and ILS RWY21.

Project ID: VINGA Final Report Edition: 04.00 30 Nov 2011
Page 56 of 103
Figure 32: RNP STAR OSNAK 1W as shown on the ND.
In total, 11 different RNP Transition to ILS flights were flown. One of these flights is shown in Figure 33 below, as shown in the Web track system.
Figure 33: RNP Transition to ILS.
7.2.1 Flight crew response to this concept of operation The flight crew response and feedback can be categorised into three main areas, which are summarised below: 1. The RNP Transition to ILS procedure is, for the flight crew, fully transparent with the existing P-
RNAV STAR OSNAK 1S followed by ILS RWY21.

Project ID: VINGA Final Report Edition: 04.00 30 Nov 2011
Page 57 of 103
This feedback indicates that an implementation of overlays to existing procedures is beneficial as a first step to introduce new and more efficient procedures in terms of avoiding additional workload and to allow for a seamless transition. Note: For a fully optimised procedure in terms of fuel saving and reduced emissions and to be able to take full advantage of the benefits in combining a RNP-segment with a precision-segment (ILS), the RNP Transition to ILS procedure in the VINGA project requires some refining both in terms of track mile shortening and vertical constraints. This is described in more detail in the document “NVR-AU 9.09.D1 Part II” provided to SESAR project 9.09.
2. Using the normal SOP without any additional considerations has been sufficient to ensure a safe
flight throughout the procedure. This feedback is of course of highest importance and vital for the continuation of the trials. It is also a confirmation that keeping the RNP Transition to ILS SOP as close as possible to the normal SOP will avoid additional workload and reduce the risks of misunderstandings and/or misinterpretations.
3. Procedure and flight guidance wise, only minor (< RNP 0.3 NM) deviations in terms of lateral FTE
(XTK) have been observed during the approaches flown. This feedback confirms the procedure, both operationally and per design, performs well within limits and as expected from the pre-validation.
7.2.2 Additional observations 1. Active monitoring
Regarding the RNP segment of the approach, monitoring of any deviations (XTK) from the intended track is under the responsibility of the flight crew, i.e. the flight crews have to actively monitor the ND for deviations during the procedure (no audio warnings are provided).
This has in all aspects not been an issue for the flight crews as every flight phase requires some prioritisation regarding which flight parameters are vital at that moment. For the RNP-segment some parameters are more vital than others and for the ILS-segment other parameters require additional attention.
2. Strategic selection
The engagement of the ILS flight guidance mode must be performed by the flight crew with a strategic selection (pushing the “APPR”-button). No automatic “switch” from RNP to ILS has been provided.
It is apparent from the feedback this “switch” from one approach strategy to another has not introduced any additional workload for the flight crews. This strategic selection is exactly the same procedure as when conducting, for example, a closed P-RNAV STAR followed by an ILS.
7.2.3 Recommendations to SESAR WP 9.09 The conclusion of the RNP Transition to ILS flight trials within the VINGA project clearly indicated that the procedure can be fully implemented in the daily operation without any additional procedures and/or additional flight crew workload. Further, with a solid pre-validation, consistency with existing arrival and approach procedures and transparency with existing operational procedures, Novair believes it is possible to introduce similar procedures at any airport with the same prerequisites.
Additionally, a document (“NVR-AU 9.09.D1 Part II “) containing the preliminary results and conclusions (in-line with the conclusions above), has already been provided to SESAR WP 9.09. This document describes the operational aspects (e.g. flight guidance modes, operating procedures, etc.) in a more detailed manner.

Project ID: VINGA Final Report Edition: 04.00 30 Nov 2011
Page 58 of 103
7.3 Monitoring of onboard FMGS RTA function i4D is seen as an enabler in the future SES concept of operation. In the frame of VINGA, Novair monitored current aircraft capabilities to conduct i4D operation; of particular interest was how differences in actual metrological conditions compared with forecasted conditions would affect the guidance quality and behaviour of the FMGS. The MF was the TMA entry point into Göteborg TMA (e.g. OSNAK, KOVUX etc.), if the TMA entry point was crossed above FL100, otherwise, a Pilot-defined Waypoint, 10 NM prior to the TMA was used, to make sure that the MF was be above FL100. These activities were conducted in close collaboration with the VINGA Expert Advisor Airbus. The overall objective was to gain more knowledge of normal i4D operation, which is considered to be very helpful in future work.
7.3.1 i4D Concept of Operation A brief introduction to the i4D concept of Operation is given below. i4D is a concept where the aircraft arrives at a MF at a certain time to enable ATC to build a sequence in the traffic flow. This is planned to be used in the arrival phase in conjunction with a ground supporting tool, such as an AMAN. ATC uses the nomenclature CTA which is equivalent to the FMGS onboard function RTA. To be able to use the RTA function, the ETA has to be known, and based on this, an applicable RTA is chosen. Today’s FMGS version will try to meet its CTA with an accuracy of ± 30 seconds in the arrival phase. In the future, this will be done with ± 10 seconds accuracy (95% probability). To be able to reach this goal, SESAR project 9.01 is developing new FMGS functionalities for this purpose.
7.3.2 Parameters of interest Below, are a few parameters that have been of interest in the frame of VINGA:
Speed variations during the RTA flights,
Thrust variation during the RTA flights, Max vs. min RTA speed during the RTA flights, Passenger comfort, Vertical profile adherence, Need for speed brakes? RTA missed/made?
7.3.3 Monitoring scenarios There are three different scenarios that will be applicable:
RTA = ETA RTA < ETA (accelerate towards the MF) RTA > ETA (slow down towards the MF)
7.3.4 How these monitoring flights were conducted This exercise started approximately one hour prior to landing, i.e. in the latter part of the en-route phase, without any verbal coordination between ATCOs and the flight crews, since Novair was only monitoring the airborne RTA capabilities. A checklist form was available (refer to Appendix 5), which clearly stated, step by step, how the exercise should be performed. Figure 34 below, illustrates how this RTA is presented to the flight crew.
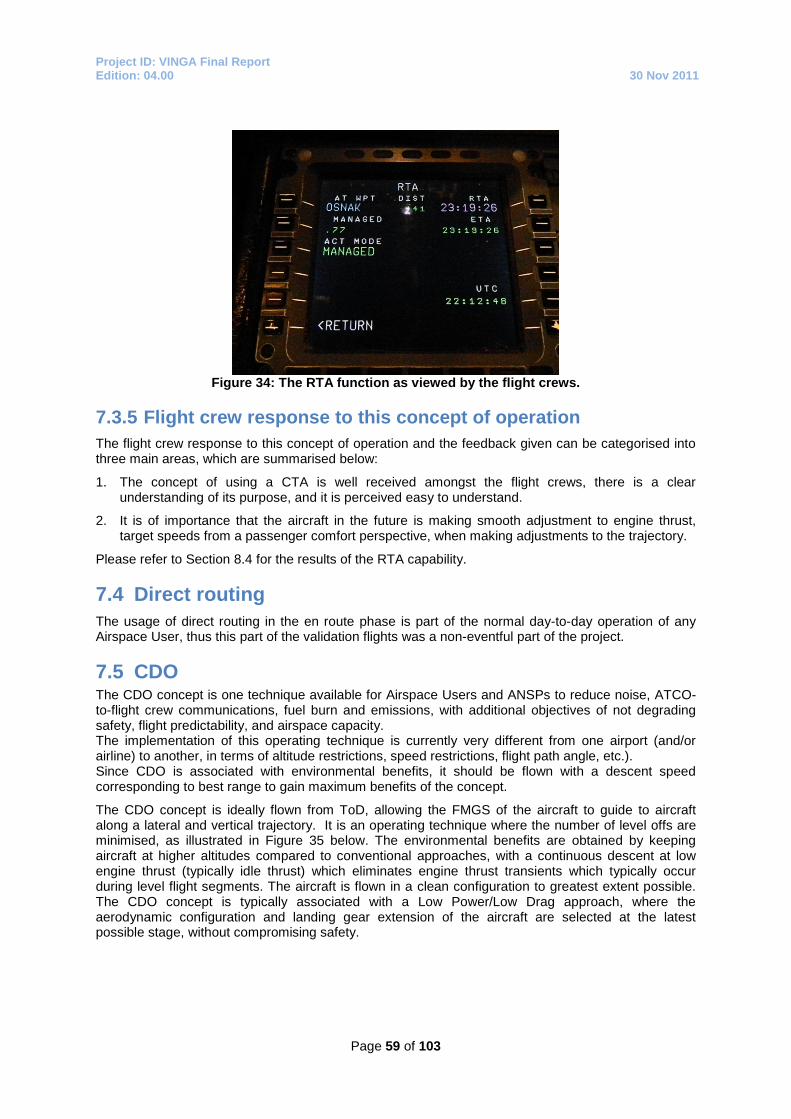
Project ID: VINGA Final Report Edition: 04.00 30 Nov 2011
Page 59 of 103
Figure 34: The RTA function as viewed by the flight crews.
7.3.5 Flight crew response to this concept of operation The flight crew response to this concept of operation and the feedback given can be categorised into three main areas, which are summarised below:
1. The concept of using a CTA is well received amongst the flight crews, there is a clear understanding of its purpose, and it is perceived easy to understand.
2. It is of importance that the aircraft in the future is making smooth adjustment to engine thrust, target speeds from a passenger comfort perspective, when making adjustments to the trajectory.
Please refer to Section 8.4 for the results of the RTA capability.
7.4 Direct routing The usage of direct routing in the en route phase is part of the normal day-to-day operation of any Airspace User, thus this part of the validation flights was a non-eventful part of the project.
7.5 CDO The CDO concept is one technique available for Airspace Users and ANSPs to reduce noise, ATCO-to-flight crew communications, fuel burn and emissions, with additional objectives of not degrading safety, flight predictability, and airspace capacity. The implementation of this operating technique is currently very different from one airport (and/or airline) to another, in terms of altitude restrictions, speed restrictions, flight path angle, etc.). Since CDO is associated with environmental benefits, it should be flown with a descent speed corresponding to best range to gain maximum benefits of the concept.
The CDO concept is ideally flown from ToD, allowing the FMGS of the aircraft to guide to aircraft along a lateral and vertical trajectory. It is an operating technique where the number of level offs are minimised, as illustrated in Figure 35 below. The environmental benefits are obtained by keeping aircraft at higher altitudes compared to conventional approaches, with a continuous descent at low engine thrust (typically idle thrust) which eliminates engine thrust transients which typically occur during level flight segments. The aircraft is flown in a clean configuration to greatest extent possible. The CDO concept is typically associated with a Low Power/Low Drag approach, where the aerodynamic configuration and landing gear extension of the aircraft are selected at the latest possible stage, without compromising safety.

Project ID: VINGA Final Report Edition: 04.00 30 Nov 2011
Page 60 of 103
Conventional approach
(Step down)
CDO
Start of CDO
E.g. ILS Interception
RWY
Figure 35: The CDO concept.
7.5.1 Logics of the FMGS in terms of CDO As an introduction to the vertical profile computation in the Airbus aircraft, it is important to note that the FMGS always defines an optimised vertical profile backwards, typically from the RWY threshold, to the last waypoint of the cruise phase -identified as the ToD – taking into account any speed and/or altitude restrictions inserted in the flight plan (usually published in the AIP procedure). A deceleration point (called “DECEL” point) is also defined and represents the start of the deceleration of the aircraft towards the approach speed (VAPP). This point determines the transition between the descent and approach flight phases in the FMGS, as shown in Figure 36.
ToD
RWY CRUISE DESCENT APPROACH
(DECEL)
Descent profile computation backward from RWY threshold
Figure 36: Computation of the vertical profile, made by the FMGS.
With this backward method, the first step is the computation of the approach profile by the FMGS. This phase consists of:
A Final approach profile computed from the RWY threshold to the FAF/FAP. It is often determined with a fixed flight path angle, corresponding to the final slope defined in the procedure (typically 3°).
An Intermediate approach profile from the FAF/FAP to the deceleration point, where the aircraft is expected to start its deceleration. On the current Airbus FMGS, this deceleration is performed using idle thrust on a level segment, which may be a single segment or several successive steps, depending on the existence of altitude or speed restrictions in the procedure.
The approach profile is built using the assumption that the aircraft will decelerate from the descent speed (either the typical speed limit of 250 KIAS below FL100 or the latest speed restriction) to final approach speed (VAPP), from the DECEL point down to 1 000 ft AGL.

Project ID: VINGA Final Report Edition: 04.00 30 Nov 2011
Page 61 of 103
7.5.2 CDO operation in the context of VINGA CDO operation in the context of VINGA has focussed on allowing the validation aircraft to descend from an optimum ToD in the en-route phase of the flight. The FMGS of the aircraft is able to guide to the aircraft along a lateral and vertical trajectory.
There are some general criteria that must be fulfilled for the FMGS to be able to make an optimum CDO:
The flight path needs to be a closed trajectory, i.e. without any discontinuities. If these criteria is not fulfilled, the FMGS can not calculate a ToD, since it does not know the remaining distance to fly. This requirement was fulfilled in VINGA, since the procedures were closed.
There should be a minimum number of constraints in the trajectory, such as speed or altitude constraints in, e.g. the STAR structure. This requirement was fulfilled in the VINGA project, since there were no constraints present in the procedures used.
The optimum ToD point varies from day-to-day, due to different meteorological conditions, aircraft mass, etc. This requirement was fulfilled, since unconstrained descents were given by Malmö ATCC and ATS Landvetter to the validation flights.
In Figure 37 below, some of the vertical profiles of the VINGA validation flights using the RNP AR approach to RWY21 are illustrated.
Figure 37: Vertical profiles of some of the RNP AR approaches to RWY21.
Different strategies was used by the flight crews to fly these approaches, were the vertical profile on many of the flights were fine-tuned by the flight crew to use a sloped deceleration segment.
7.6 Surface operation The surface operation, contained various initiatives from the Airspace User, such as using single engine taxing, absorb any delay at the parking stand, minimum usage of the aircraft APU etc. A lot of these activities are part of the SOP for Novair; therefore it had minimum impact on the operation in terms of additional workload for the flight crews etc.

Project ID: VINGA Final Report Edition: 04.00 30 Nov 2011
Page 62 of 103
Single engine taxing is done with close adherence to the recommendations made by the airframe and engine manufactures. Special considerations have to be given to stipulated warm-up and cool-down periods for the engines.
7.7 Departure phase The departure phase of the VINGA flights contained various ingredients, where a lot of the activities were already integrated in the SOP of Novair. The high level objective has been to use best practise in terms of environmental efficiency, including optimum usage of take-off flaps, air condition packs selected off at take-off, usage of a low thrust reduction altitude and acceleration towards most efficient climb speed as possible etc. All these activities will end up in savings compared to traditional airline operation, not focusing on these activities; some of the results are covered in Section 10. These activities ran very smoothly, since the flight crews were so used to them.
Focus was also on looking at the effects of flying a SID as efficiently as possible; this was done by removing this speed constraint programmed in the NDB, allowing the aircraft to fly unconstrained. This is an easy manoeuvre for the flight crew to perform. The results of these activities are shown in Section 9.1.7.
7.8 Data collection
7.8.1 Flight Data Recorder Collection After each validation flight, Novair collected Flight Data from the aircraft by usage of DAR data. This DAR frame was developed during the AIRE I project MINT for Novair, and synergy effects was drawn from that previous AIRE work.
Novair uses a software developed by Aerobytes, a “third party” FDM program, which is a software hosted by the Flight Safety department of Novair. The program has the capability of processing and analysing aircraft performance data, which can be used e.g. for fuel monitoring and lateral deviation during PBN.
Flight data statistics in graphs and reports can be generated from the software, which supports also data conversion into commercial spread sheet format (e.g. Excel) and automatic report function, making automatic flight data transfer possible. In conjunction with the previous AIRE project MINT, Novair tailored and integrated a DAR frame on the A321’s in cooperation with Airbus and Aerobytes. This DAR frame has further been customised and was used for the VINGA project.
7.8.2 Data processing Aircraft flight data is recorded and stored in binary format on the aircraft according to the aircraft Logical Frame Layout. The FDM provider decodes the binary data into engineering units for analysis in the FDM software.
Depending on the Airbus Logical Frame Layout, the Flight Data Interface Management Unit can either record flight data through the Flight Data Interface Unit, with the FDR or QAR, or via the Data Management Unit, using a DAR. The advantage of using a DAR is the feasibility to modify the parameter recorded and customise the output data.

Project ID: VINGA Final Report Edition: 04.00 30 Nov 2011
Page 63 of 103
8 Arrival phase – flight analysis and results This chapter contains the different analyses performed for the arrival phase of the flight. First, the fuel efficiency assessment is presented in Section 8.1. This section describes the methodology used to assess the fuel efficiency of the different arrivals and it also presents the results of this analysis. Section 8.2 follows with an assessment of the aircraft noise aspects of the arrivals. Section 8.3 looks into the track adherence of the RNP AR approaches and finally, Section 8.4 presents the results from the monitoring of the aircraft RTA capabilities.
8.1 Fuel efficiency assessment In order to compare the results of different validation activities or between different concepts of operation, it is of importance that the assessments are performed consistently using the same methodology. Previously, different international projects have used different methods to measure fuel efficiency and thus a common standardisation is highly needed An assessment method has been developed in the VINGA project for measuring fuel efficiency in the arrival phase. This method has been used to assess the VINGA validation flights, and is based on a white paper, written by Novair and Chalmers (Appendix 6).
8.1.1 Scope The aim of the fuel efficiency analysis covering the arrival phase was to assess the difference in fuel consumption of the newly introduced RNP STARs followed by RNP AR approaches compared with the traditional P-RNAV STARs followed by an ILS approach. There were three key questions to be addressed:
1. How large is the fuel saving associated with flying the RNP AR arrivals compared with the ILS arrivals for both RWY ends?
2. How much of the savings were related to lateral aspects (i.e. flight path shortening)?
3. How much of the savings were related to vertical aspects?
A methodology for assessing this was developed and implemented by Novair, based on FDR for the actual flights and the use of the Airbus performance software, the Performance Engineer’s Program (PEP).
8.1.2 Data Data was extracted from the aircraft quick access DAR. Due to the manual effort associated with the localisation and extraction of the flight data in combination with the time budget available, it was not possible to analyse all VINGA flights above the minimum 100 flights agreed; therefore, data for a total of 103 VINGA RNP STARs-RNP AR approaches was extracted.
The purpose of the data collection was to retrieve detailed flight information for two types of flights, VINGA and non VINGA, and to perform a relative comparison of these flights. The intention was to have at least 100 flights in each group, all operated under similar conditions (during the summer period, with the same individual aircraft). Due to the fact that some parameters, vital for the analysis, were not available in the DAR frame used onboard the aircraft during the summer 2010, all flights had to be extracted from the operation during the summer 2011. Due to the high number of VINGA arrivals conducted during this time period, and due to the fact that data from some flights were missing, only 48 non VINGA P-RNAV-ILS arrivals were located and could be extracted.
Of the VINGA arrivals, 61 were to RWY21 (via the OSNAK 1X STAR) and 42 were to RWY03 (via the KOVUX 1Q STAR). Of the non VINGA arrivals, 35 were to RWY21 (via the OSNAK 1S STAR) and 13 were to RWY03 (via the KOVUX 1L STAR). The flights were conducted in the time period: 2011-05-11 until 2011-10-06. All flights were flown with the same individual aircraft (SE-RDP).

Project ID: VINGA Final Report Edition: 04.00 30 Nov 2011
Page 64 of 103
The flight data contained detailed information about the last 45 minute of the flights, with parameters such as aircraft’s position, altitude, speed, mass, fuel flow, engine anti-ice selection and meteorological conditions. The parameters were recorded eight times per second.
The extracted flight data was imported into an SQL Server database to facilitate processing.
The ToD was identified for each flight by plotting the vertical profile of the flight in Microsoft Excel and visually determining where the ToD was located. Thereafter, the ToD was set to the first row of data after this point where the altitude and power output from the engines started to continuously reduce and the vertical speed of the aircraft started to continuously increase. The reason for this quite tedious method of identifying the ToD was the importance for the calculations to have a correct ToD and the challenge of programmatically identifying this correctly in all cases. In addition, from time to time, flights arriving to Göteborg Landvetter Airport are instructed by ATC to step down 1 000 feet due to crossing traffic before ToD (usually between 260 and 190 NM before touchdown). It is not obvious if the ToD should be set at the first or to the second descent point for these flights. These flights are not representative of a true VINGA flight and would need special handing when being processed, and were therefore excluded from the data analysis. Of the extracted flights, 9 of the VINGA arrivals and 6 of the non VINGA arrivals were excluded from the analysis due to this reason. Additionally, 1 non VINGA flight was excluded due to the fact that it had not followed the P-RNAV STAR but appeared to have been flown in a right hand circuit for RWY21 for unknown reasons.
After exclusion of the unsuitable flights, the data analysed consisted of 94 VINGA arrivals (57 to RWY21 and 37 to RWY03) and 41 non VINGA arrivals (29 to RWY21 and 12 to RWY03).
8.1.3 Method
8.1.3.1 Overview In order to compare the fuel efficiency of the VINGA RNP STARs followed by RNP AR approaches with the non VINGA P-RNAV arrivals followed by ILS approaches, the Airbus PEP program was used to calculate the difference between each actual flight flown and the theoretically optimal flight under the same conditions. The average difference in fuel consumption between the actual and the theoretically optimal flight was then calculated for the VINGA and non VINGA flights for both RWYs. These averages were compared to conclude on the procedures’ relative difference in efficiency.
8.1.3.2 Calculation of fuel consumption for theoretically optimal flight The In Flight Performance (IFP) module within PEP was used to calculate the fuel consumption of the theoretically optimal flight. IFP takes aerodynamic data, engine data, atmospheric data and flight conditions (cruising altitude, aircraft mass, Cost Index etc.) as inputs. The fuel consumption of the theoretically optimal flight was calculated using the IFP in the following way.
First, a descent calculation was made based on the following parameters:
Descent from the actual cruising altitude (FL at ToD corrected for local atmospheric pressure at the landing airport) to 2 700 ft MSL,
Actual aircraft mass at ToD,
Actual aircraft air conditioning setting,
Actual aircraft engine anti ice setting,
Actual aircraft centre of gravity (CG) at ToD,
Actual average ISA deviation during the descent,
Actual winds during the descent, divided into 10 different altitude segments,
Fuel consumption factor for the aircraft individual,
Cost Index 0.

Project ID: VINGA Final Report Edition: 04.00 30 Nov 2011
Page 65 of 103
The distance and fuel consumption for the descent segment were stored. After that, a cruise calculation was made based on the following parameters:
Actual cruising altitude (FL at ToD corrected for local atmospheric pressure at the landing airport),
Distance of cruise segment equal to 200 NM – (the descent distance from the descent calculation + distance from 2 700 ft MSL to the RWY threshold),
Actual aircraft mass at 200 NM before touchdown,
Actual aircraft air conditioning setting,
Actual aircraft anti ice setting,
Actual aircraft centre of gravity (CG) at 200 NM before touchdown,
Actual average ISA deviation between 200 NM before touchdown and ToD,
Actual average wind between 200 NM before touchdown and ToD,
Fuel consumption factor for the aircraft individual,
Cost Index 0.
The distance and fuel consumption for the cruise segment were stored.
For all flights where the aircraft engine anti ice was selected at some point during the descent, the descent calculation was divided into several calculations; one for each segment defined by engine anti ice being switched on or off.
The total fuel consumption for the theoretically optimal flight from 200 NM down to 2 700 ft MSL was calculated by adding the fuel consumption of the descent segment (or descent segments if engine anti ice was used) and the cruise segment.
The rationale for ending the descent calculation at 2 700 ft MSL was to remove the effect of wind when being on the glide slope (which is a 3° geometrical segment) and also to remove the effect of flight crew handling at the last part of the approach (selection of flaps and landing gear). For the approaches evaluated in this analysis, 2 700 ft MSL is an altitude where the aircraft is on the glide slope. Therefore, theoretically the aircraft should always be at the same distance from the runway threshold when being at 2 700 ft MSL.
The IFP module of the PEP does not support the specification of a realistic deceleration segment in the descent calculation. In the calculations performed, 250 KIAS was used from FL100 all the way down to 2 700 ft MSL. This is not a realistic speed scheme since deceleration in reality is started well before intercepting the glide slope. However, since both flights samples (i.e. VINGA and non VINGA) were compared against the same PEP model and then the respective results compared relatively, the evaluation of fuel efficiency difference between the VINGA and non VINGA arrivals were not be affected by this.
8.1.3.3 Comparison between actual flight and theoretically optimal flight To be able assess not only the total fuel efficiency, but also the fuel efficiency related to lateral and vertical aspects, different scenarios had to be used when comparing the actual flight with the theoretically optimal flight. The following three scenarios were used:
1. Fuel consumption and distance flown for the actual flight from the point where the flight crosses a circle with the radius 200 NM centred over the destination airport down to 2 700 ft MSL, compared to the fuel consumption from 200 NM from touch down to 2 700 ft MSL as calculated for the ideal flight by the PEP in accordance with section 8.1.3.2. The difference between these two fuel consumptions is hereafter called “DeltaFuel_Circle”, and illustrated in Figure 38.
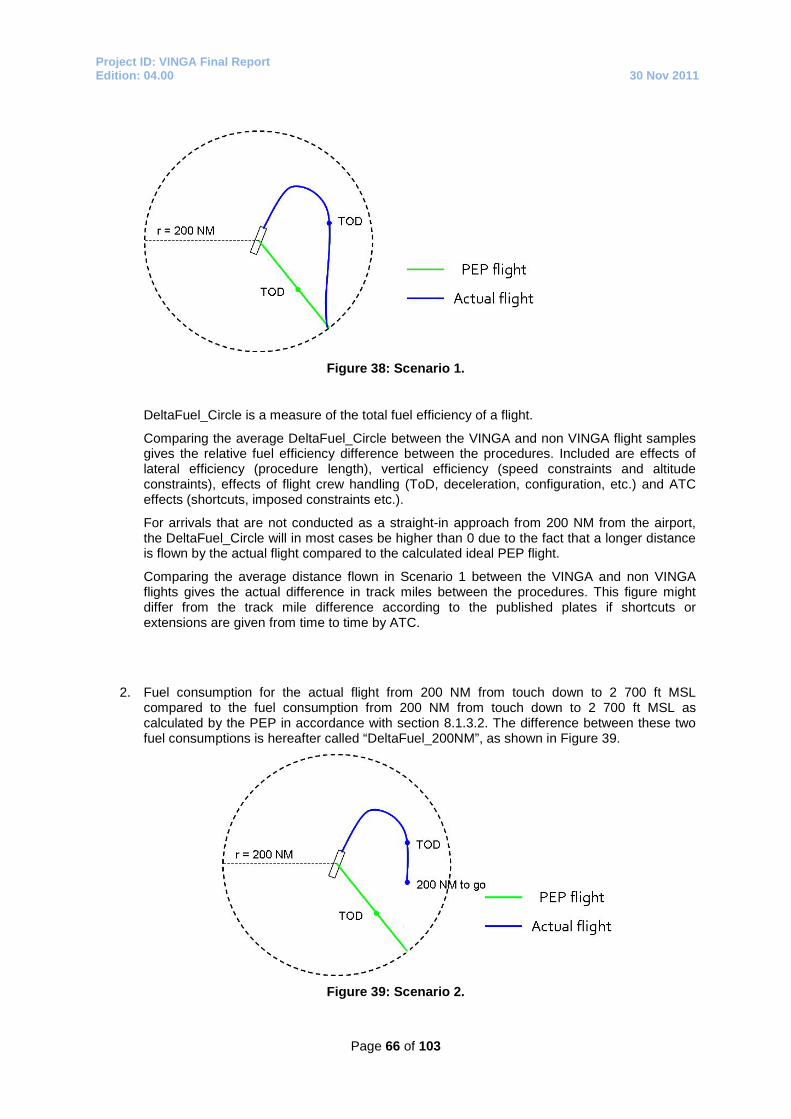
Project ID: VINGA Final Report Edition: 04.00 30 Nov 2011
Page 66 of 103
Figure 38: Scenario 1.
DeltaFuel_Circle is a measure of the total fuel efficiency of a flight.
Comparing the average DeltaFuel_Circle between the VINGA and non VINGA flight samples gives the relative fuel efficiency difference between the procedures. Included are effects of lateral efficiency (procedure length), vertical efficiency (speed constraints and altitude constraints), effects of flight crew handling (ToD, deceleration, configuration, etc.) and ATC effects (shortcuts, imposed constraints etc.).
For arrivals that are not conducted as a straight-in approach from 200 NM from the airport, the DeltaFuel_Circle will in most cases be higher than 0 due to the fact that a longer distance is flown by the actual flight compared to the calculated ideal PEP flight.
Comparing the average distance flown in Scenario 1 between the VINGA and non VINGA flights gives the actual difference in track miles between the procedures. This figure might differ from the track mile difference according to the published plates if shortcuts or extensions are given from time to time by ATC.
2. Fuel consumption for the actual flight from 200 NM from touch down to 2 700 ft MSL compared to the fuel consumption from 200 NM from touch down to 2 700 ft MSL as calculated by the PEP in accordance with section 8.1.3.2. The difference between these two fuel consumptions is hereafter called “DeltaFuel_200NM”, as shown in Figure 39.
Figure 39: Scenario 2.

Project ID: VINGA Final Report Edition: 04.00 30 Nov 2011
Page 67 of 103
DeltaFuel_200NM is a measure of vertical efficiency and speed management of a flight.
Comparing the average DeltaFuel_200NM between the VINGA and non VINGA flights reveals the vertical fuel efficiency difference between the procedures (speed constraints and altitude constraints), effects of flight crew handling (ToD, deceleration, configuration, etc.) and ATC effects such as imposed speed or altitude constraints.
Comparing the difference between the average DeltaFuel_Circle and average DeltaFuel_200NM for the VINGA and non VINGA flights gives the fuel efficiency difference between the procedures caused by track mile difference (i.e. lateral inefficiencies).
If the theoretically optimal flight calculated by the PEP was really the most optimal flight possible to fly, DeltaFuel_Circle should theoretically always be 0 or higher. However, due to the fact that the descent calculations are made using a higher speed than used in reality (250 KIAS until 2 700 ft MSL), the true optimal ToD is actually located earlier than the ToD calculated by the PEP. This results in DeltaFuel_200NM being lower than 0 for flights leaving the ToD earlier than the PEP calculated ToD. In these cases, the actual descent fuel will be higher than the descent fuel calculated by PEP (since the flight is in descent for a longer period of time) but the actual cruise fuel will be lower than the cruise fuel calculated by PEP.
3. Fuel consumption for the actual flight from the point where optimum ToD is located according to the PEP, down to 2 700 ft MSL, compared to the fuel consumption from the ToD to 2 700 ft MSL for the PEP flight calculated in accordance with section 8.1.3.2. The difference between these two fuel consumptions is hereafter called “DeltaFuel_OptimumToD”, as shown in Figure 42.
Figure 40: Scenario 3.
DeltaFuel_OptimumToD is a measure of how close the vertical profile of the actual flight matches the PEP calculated vertical profile. By definition, the DeltaFuel_OptimumToD will therefore theoretically always be 0 or higher.
In addition to the delta fuel measures, an index for each of these three scenarios was also calculated and stored. The index was calculated as the fuel consumption of the actual flight divided by the fuel consumption of the theoretically optimal flight as calculated by the PEP. Using the indexes for comparison gives the result as a percentage whilst the delta fuel measures give the results in kilograms.

Project ID: VINGA Final Report Edition: 04.00 30 Nov 2011
Page 68 of 103
8.1.3.4 Flow chart Figure 41 and 42 below graphically illustrate the step-by-step method used to assess the difference in fuel efficiency between two arrival procedures.
1. DAR flight data is imported into a SQL Server database.
2. TOD is identified and updated manually.
3. Calculate the descent segment using the PEP.
4. Calculate the cruise segment using the PEP.
5. Calculate the DeltaFuel measures and update the database.
6. Assess the difference in fuel efficiency between two different procedures.
Figure 41: The preparatory steps to be able to compare the efficiency of two different
procedures.

Project ID: VINGA Final Report Edition: 04.00 30 Nov 2011
Page 69 of 103
Figure 42: Assessing the difference in fuel efficiency between the RNP AR approach to RWY21
and the P-RNAV arrival to RWY21.
8.1.4 Results The fuel efficiency of the VINGA RNP AR arrivals OSNAK 1X to RWY21 and KOVUX 1Q to RWY03 was compared to their corresponding non VINGA P-RNAV arrivals (OSNAK1S and KOVUX1L) followed by an ILS approach. The difference in fuel efficiency was identified by comparing the average difference between the actual flights and their theoretically optimal flight between the two types of arrivals, i.e. by comparing the average DeltaFuel_Circle for the VINGA arrivals to RWY21 with the average DeltaFuel_Circle for the non VINGA arrivals to RWY21 (and the same method for arrivals to RWY03).
For the VINGA arrival compared to the non VINGA arrival, the total fuel saving measured was 90 kg for RWY21 and 22 kg for RWY03. This corresponds to fuel savings of 11% for RYW21 and 3% for RYW03 measured from the point where the aircraft passes the 200 NM radius circle, centred over the airport reference point.
Table 3 presents details on the comparison between the arrivals for the two runways. The numbers displayed are the figures for the non VINGA flights subtracted from the VINGA flights, hence the savings achieved by the VINGA arrivals compared with the non VINGA arrivals.

Project ID: VINGA Final Report Edition: 04.00 30 Nov 2011
Page 70 of 103
Del
taFu
el_C
ircle
Del
taFu
el_2
00N
M
Del
taFu
el_C
ircle
- D
elta
Fuel
_200
NM
Act
ual f
light
pat
h sh
orte
ning
Flig
ht p
ath
shor
teni
ng a
ccor
ding
to p
late
s
Fuel
sav
ing
due
actu
al fl
ight
pat
h sh
orte
ning
1
RWY21
OSNAK 1S- OSNAK 1X
90 kg 19 kg 71 kg 10,9 nm 11,6 nm 66 kg
RWY03
KOVUX 1L-KOVUX 1Q
22 kg 6 kg 16 kg 2,5 nm 3,0 nm 15 kg
Table 3: Comparison between the RNP AR and P-RNAV arrivals.
As discussed in section 8.1.3.3, DeltaFuel_Circle represents the total fuel saving whilst, a little simplified, DeltaFuel_200nm represents the vertical fuel saving when comparing the two approaches. Subtracting DeltaFuel_200nm from DeltaFuel_Circle should give the lateral fuel saving due to flight path shortening.
8.1.4.1 RWY21 As illustrated in Table 3, for RWY21, 90 kg of fuel was the total saving when comparing the two approaches, of which 19 kg was related to the vertical aspects and 71 kg to flight path shortening.
The actual flight path shortening was 10.9 NM, compared to a flight path shortening according to the plates of 11.6 NM. The difference is related to shortcuts given by ATC. Subtracting DeltaFuel_200NM from DeltaFuel_Circle gives us 71 kg of fuel savings due to flight path shortening. To assess the reasonableness of this figure, the theoretical fuel saving related to a 10.9 NM shorter cruise segment was calculated based on the average fuel consumption per NM for the actual flights. Multiplying the average fuel consumption per NM in the latter part of the cruise segment with 10.9 NM resulted in 66 kg. Consequently, there is a difference of 5 kg between the fuel saving due flight path shortening calculated this way, and the one given by subtracting DeltaFuel_200NM from DeltaFuel_Circle.
OSNAK 1X, the VINGA arrival, does not contain any speed constraints whilst OSNAK 1S, the non VINGA arrival for RWY21, contains a speed constraint of maximum 230 KIAS at approximately 20 NM from the runway threshold. That will result in a slightly earlier ToD compared to a free speed scenario (i.e. no speed constraints). Most of the fuel saving related to the vertical aspects is believed to be related to this speed constraint. In addition, there is also a speed constraint of 210 KIAS at 3 NM 1 Calculated fuel saving for the actual flight path shortening based on average fuel consumption before ToD

Project ID: VINGA Final Report Edition: 04.00 30 Nov 2011
Page 71 of 103
before the FAP. However, this constraint is less penalising due to the fact that deceleration towards a speed below 210 KIAS usually has already started by this point in order to intercept the G/S with an appropriate speed.
8.1.4.2 RWY03 As can be seen in Table 3 for RWY03, 22 kg of fuel was the total saving when comparing the two approaches, of which 6 kg was related to the vertical aspects and 16 kg to flight path shortening.
The actual flight path shortening was 2.5 NM, compared to a flight path shortening according to the instrument approach procedures of 3.0 NM. The difference is related to shortcuts given by ATC. Subtracting DeltaFuel_200NM from DeltaFuel_Circle gives us 16 kg of fuel savings due to flight path shortening. To assess the reasonableness of this figure, the theoretical fuel saving related to a 2.5 NM shorter cruise segment was calculated based on the average fuel consumption per NM for the actual flights. Multiplying the average fuel consumption per NM in the latter part of the cruise segment with 2.5 NM resulted in 15 kg. Consequently, there is a difference of 1 kg between the fuel saving due flight path shortening calculated this way, and the one given by subtracting DeltaFuel_200NM from DeltaFuel_Circle.
KOVUX 1Q, the VINGA arrival, does not contain any speed constraints while KOVUX 1L, the non VINGA arrival for RWY03, contains a speed constraint of maximum 210 KIAS at approximately 3 NM before the FAP. This speed constraint is not really restraining though; the G/S is usually intercepted with approximately 180 KIAS and therefore most flights would be at 210 KIAS or less at 3 NM before the FAP, even in a free speed scenario. It might affect the figure of fuel saving due to vertical aspects slightly, but should not be a large contributing factor.
Since there is no large difference between the KOVUX 1Q and KOVUX 1L arrivals regarding vertical constraints, the vertical fuel saving should not be significant when comparing the two approaches. The fuel saving due to vertical aspects is substantially lower for RWY03 (6 kg) compared to RWY21 (19 kg) which is in line with this expectation. However, there was still 6 kg in difference. One factor that potentially could contribute to this figure is flight crew handling and ATC influences. Depending on how an arrival is flown, e.g. when the descent is initiated, the speed used during descent, when the aircraft is configured etc., greatly affects the fuel consumption of the arrival. In a large sample of flights, these effects should be similar in the two samples compared. But with a limited number of flights, which is especially the case for the non VINGA arrivals to RWY03 (there were only 12 such flights in the material analysed), the effect of a couple of far from optimal descents could influence the result. Another factor that may have favoured the VINGA flights in the vertical aspects is that there has been a focus on these flights, both from an ATC and flight crew perspective.
8.1.5 Method analysis
8.1.5.1 General The results of the fuel efficiency analysis of the arrival phase appear to be reasonable. The numbers are in line with what can be expected, both with regards to fuel efficiency due to flight path shortening and due to vertical aspects.
Of the three measures DeltaFuel_Circle, DeltaFuel_200NM and DeltaFuel_OptimumToD, the first two have proven most useful. They are easy to understand and they provide enough information to draw conclusions on total fuel saving, fuel saving due to flight path shortening and fuel saving due to vertical aspects (included in this are procedure speed and altitude constraints, flight crew handling and ATC influence). It is not clear at this stage how the measure DeltaFuel_OptimumToD should be used in the best manner. It gives an indication on how well the flight has followed the vertical profile calculated by the PEP. In a case where the PEP vertical profile really is the optimal vertical profile, this measure would probably be more interesting than in this study where there is a slight misalignment between the PEP optimal and what is actually optimal due to inaccuracies regarding speed scheme in the last part of the approach.

Project ID: VINGA Final Report Edition: 04.00 30 Nov 2011
Page 72 of 103
8.1.5.2 Plots of best and worst VINGA flights In this section, the best and worst VINGA arrivals, from an efficiency perspective, to RWY21 have been plotted to zoom in and look at the flights behind the numbers.
Best VINGA arrival RWY21
05000
10000150002000025000300003500040000
0 20 40 60 80 100 120 140
Distance from touch down (nm)
Altit
ude
(ft)
Actual flightPEP flight
Figure 43: Vertical profile of the most fuel efficient arrival to RWY21.
In Figure 43, the vertical profile of the VINGA arrival into RWY21 with the lowest Delta_Fuel_Circle (24 kg) has been plotted together with the PEP vertical profile. As seen, the ToD for the actual flight is positioned slightly before the ToD of the PEP flight. During the whole descent, there is a very good match between the actual vertical profile and the PEP vertical profile.
Worst VINGA arrival RWY21
05000
10000150002000025000300003500040000
0 20 40 60 80 100 120 140
Distance from touch down (nm)
Altit
ude
(ft)
Actual flightPEP flight
Figure 44: Vertical profile of the least fuel efficient VINGA arrival to RWY21.
Figure 49 illustrates the VINGA arrival into RWY21 with the highest Delta_Fuel_Circle (132 kg). This flight initiates the descent after the ToD of the PEP flight. In the beginning of the descent, the actual flight is above the PEP vertical profile but then the actual flight descends below the PEP vertical profile and ends up flying level for approximately 9 NM at the end.

Project ID: VINGA Final Report Edition: 04.00 30 Nov 2011
Page 73 of 103
Best VINGA arrival RWY21
0
1000
2000
3000
4000
5000
6000
0 50 100
Distance from touch down (nm)
Fuel
flow
(kg/
h)
0500010000150002000025000300003500040000
Altit
ude
(ft)
Fuel flowAltitude
Figure 45: Fuel flow vs. altitude during descent for the most fuel efficient arrival to RWY21.
Figure 45 displays the engine fuel flow versus altitude from ToD to 2 700 ft MSL for the VINGA arrival to RWY 21 with the lowest DeltaFuel_Circle. The blue line represents the fuel flow and should be read against the left Y-axis. The pink line represents the altitude and should be read against the right Y-axis. As can be seen, most of the descent is flown with idle thrust. Just before glide slope intercept, there is a slight increase of thrust.
Worst VINGA arrival RWY21
0
1000
2000
3000
4000
5000
6000
0 50 100
Distance from touch down (nm)
Fuel
flow
(kg/
h)
0500010000150002000025000300003500040000
Altit
ude
(ft)
Fuel flowAltitude
Figure 46: Fuel flow vs. altitude during descent of the least fuel efficient VINGA arrival to
RYW21.
In Figure 46, the fuel flow from ToD to 2 700 ft MSL is plotted for the VINGA arrival with the highest DeltaFuel_Circle. Looking at the chart, it is clear that the non-optimal vertical profile is very penalising fuel wise.
Looking at the charts displaying vertical profile and fuel flow for the best and the worst flight, they are in line with what can be expected for a good and a bad flight.
8.1.5.3 Using aircraft manufacturer performance software Comparing each actual flight against the “theoretically optimal” flight under the same conditions, using the aircraft manufacturer performance software, and then comparing different types of flights relatively

Project ID: VINGA Final Report Edition: 04.00 30 Nov 2011
Page 74 of 103
based on their difference from the “optimum” appears to be a good way to measure. The other obvious way is to normalise the data for each flight to remove the effect of different conditions (aircraft mass, winds, temperature, engine anti ice selection etc.) and then compare the flights directly. Normalisation is not always trivial. The accuracy of the performance tools is usually quite good and hence leaving the normalisation to the performance models in these tools will probably result in higher accuracy than if linear normalisation is implemented for the different conditions.
As described earlier, the IFP module of the PEP does not allow for defining a realistic deceleration segment and hence 250 KIAS from FL100 all the way down to 2 700 ft MSL was used. This is not a problem when the comparison is relative between flights that were all processed against the same model. However, if evaluating the absolute results, i.e. how many kilograms of fuel or how many percent worse than the true optimum a flight was, it is important that the model used to calculate the optimum is as realistic as possible. In the PEP, the OFP module gives the option for the user to define each segment of the flight in detail. If that module had been used, the theoretically optimal flight would have been closer to reality and the absolute values could have been used. The IFP was chosen for the analysis in the VINGA project due to the given budget of time. Using the OFP when implementing the analysis method would have taken considerably more time. As previously explained, when only comparing flights relatively based on the same model, the slight misalignment of the calculated optimal flight to the actual optimal flight does not affect the results. It becomes important though if comparing flights processed by different tools (flights from different companies e.g.) that either the different models used in those calculations are very accurate or that they have the same errors.
8.1.5.4 Error sources All models are associated with inaccuracies and sources of error. It is not trivial to estimate how large the inaccuracies are in the results. However, this section lists the main sources of inaccuracies and errors identified.
The flight data contains inaccuracies for different reasons. There are inaccuracies in sensors, aircraft mass is something that is calculated based on standard values for passenger and hand luggage mass, there can problems with the recording of parameters resulting in incorrect values or sampling frequencies etc.
In the IFP module in the PEP, it is not possible to enter several temperature ISA deviations during the descent segment. Therefore, an average ISA deviation for the whole descent segment was used.
When calculating the cruise segment in the IFP module in the PEP, the aircraft mass at the start of the cruise segment must be entered. In the calculations made, the aircraft mass at the end of the cruise segment should equal the mass of the actual flight at its ToD. Since there is no easy way in the IFP to calculate backwards and get the mass at the start of the cruise segment based on the mass at the end of the same segment, the mass of the actual flight at the same distance from touch down as the start of the cruise segment in the PEP was used.
The descent calculations were ended at 2 700 ft MSL to remove the effect of wind on the glide slope and also to remove the effect of flight crew handling during the last part of the approach. 2 700 ft MSL is located at the top of the G/S and should therefore theoretically be located at the same distance from the runway threshold. In practice, the distance can vary slightly depending on temperature and if the aircraft is not spot on the glide slope.
Aerodynamic deterioration was not taken into account in the calculations. However, since all arrivals were flow with the same aircraft individual during a 6 month period, the effect of this should be negligible.
Statistically speaking, there material of flights analysed was quite small. The larger the material, the more reliable the results should be.
8.1.6 Conclusions The largest fuel savings when flying the RNP STAR followed by the RNP AR approach instead of the P-RNAV STAR followed by an ILS was to RWY21. The total fuel saving in that case was 90 kg of

Project ID: VINGA Final Report Edition: 04.00 30 Nov 2011
Page 75 of 103
which 19 kg were related to vertical aspects and the rest to flight path shortening. The total fuel saving when flying the RNP STAR followed by the RNP AR approach instead of the P-RNAV STAR and the ILS to RWY03 was in that case was 22 kg of which 6 kg were related to vertical aspects and the rest to flight path shortening.
The method implemented and used for the analysis appears to be relevant and produced realistic results. If a tool should be developed, based on a similar method, to be used as a standard way of measuring fuel efficiency, it is important that the performance model used for calculating the theoretically optimal flights is as accurate as possible, or that at least everyone uses models with the same assumptions.
8.2 Aircraft noise
8.2.1 Noise measuring tool The acoustic department of Swedavia uses a commercial noise tool developed by the FAA, called INM 7.0b. INM is a standard widely used by many organisations to assess community noise around airports. The core calculation modules of INM are based on the standard document AIR1845 produced by the Society of Automotive Engineers (SAE) Aviation Noise Committee (A-21) and are also compliant with other international standards documents including European Civil Aviation Conference (ECAC) Document 29 and ICAO Circular 205.
INM is a computer model that evaluates aircraft noise impacts in the vicinity of airports. It uses Noise-Power-Distance data to estimate noise accounting for specific operation mode, thrust setting, and source-receiver geometry, acoustic directivity and other environmental factors. The INM can output either noise contours for an area or noise level at pre-selected locations. The noise output can be exposure based, maximum level based, or time based.
8.2.2 Simulated aircraft noise-in the approach The existing noise mitigation activities at Göteborg Landvetter Airport, concentrates noise from arriving aircraft in a very narrow track along the ILS beam. This concentration is further reinforced by the constraint that visual approach is not allowed into the airport. Noise levels exceeding 70 dB (A) are in general only occurring along the extended centrelines of RWY03 and 21.
A reference noise boundary index, used in Sweden, indicates a location suitable for residential living, stringently associated to the possible exposure of noise levels at or below 70 dB (A) three times per day. Noise contours from the Airbus 321 were developed during the pre-validation phase, and they clearly indicated that no new residents in the vicinity of the airport were exposed to any noise, exceeding 70 dB (A). However, it is a fact that residents may find themselves disturbed by noise below the standard reference. Although the numbers of disturbed neighbours are few, residents who are not affected in the existing P-RNAV-ILS structure will be over flown by aircraft, conducting RNP STAR-RNP AR approaches.
By locating the RNP AR approaches in areas, with more sparsely populated areas, a possibility to relief other frequently over flown communities in the existing P-RNAV structure are created. An aircraft using one of the RNP AR approach is an aircraft which does not affect the people living underneath the area where the aircraft are usually flown. This is illustrated in Figure 47 below, were the RNP AR approach to RWY21 is shown in relation to the P-RNAV STAR and the location of populated areas in the vicinity of the airport.

Project ID: VINGA Final Report Edition: 04.00 30 Nov 2011
Page 76 of 103
Figure 47: The reduction of over flown neighbours with the introduction of the RNP AR
approach to RWY21, arriving from the south-east.
Since the number of flights in the context of VINGA has been limited, it is very hard to measure these effects in a quality manner, and was never a part of the scoop of the VINGA project. The possibility to be able to relief different communities is interpreted by the VINGA project as a very important incentive in the dialogue with different municipals around the airport. The potential risk is otherwise that any future discussions about RNP implementation will only focus on the new people that may be affected by these procedures.
The different noise contours, based on INM, for the RNP AR approach to RWY03 is shown in Figure 48 and RWY21 in Figure 49.
Populated areas

Project ID: VINGA Final Report Edition: 04.00 30 Nov 2011
Page 77 of 103
Figure 48: Noise contour RNP AR approach RWY03.

Project ID: VINGA Final Report Edition: 04.00 30 Nov 2011
Page 78 of 103
Figure 49: Noise contour RNP AR approach RWY21.

Project ID: VINGA Final Report Edition: 04.00 30 Nov 2011
Page 79 of 103
8.2.3 Interaction between the airport and its neighbours Göteborg Landvetter Airport has developed a system for neighbours, to communicate with the airport. Via the airport internet homepage, the neighbours can obtain information on how to get in contact with the airport, either via mail, telephone or using the Web track solution to get information about a specific flight. There have been a few occasional complaints regarding the activities conducted in the VINGA project. This small number of complaints can most likely be explained as follows:
The RNP AR approach tracks are deliberately located in areas, were few residences are located. As previously stated; the noise contours from the Airbus 321 clearly indicated that no new residents in the vicinity of the airport were exposed to any noise, exceeding 70 dB (A).
During the validation period, Novair had two arriving flights per day, this is a small number and if the noise exposure has been perceived as annoying, the frequencies of over flying aircraft is so low, that it can be vied as acceptable levels.
The airport neighbours has had the possibility to gain information about the project via different forums, thus they have been aware of the limited number of flights.
It is important to highlight the fact that most flights occurred in the summer of 2011, this is a very sensitive period in Sweden, because a lot of its inhabitants spend time outdoors. This means that the VINGA validation flights occurred during the most noise sensitive period of the year. Based on this, the VINGA project has drawn the conclusion that the frequencies of flights in combination with its geographical drawings are acceptable.
8.3 Track adherence-RNP An important aspect of RNP AR operation is to monitor how well the aircraft has been able to maintain its intended track.
As discussed in Section 4.1, RNP operation is associated with different navigation errors, such as a TSE consisting of a PDE, a FTE and a NSE.
Evaluation of NSE and FTE was performed during certification by the aircraft manufacturer to ensure compliance with the relevant regulation.
An automatic monitoring and alerting of NSE is available onboard the aircraft through the ‘GPS PRIMARY’ status.
FTE is monitored by the flight crew through XTK on ND for the lateral component.
As an example the last 6 minutes of 25 RNP AR approaches to RWY 21 are illustrated in Figure 50 below.
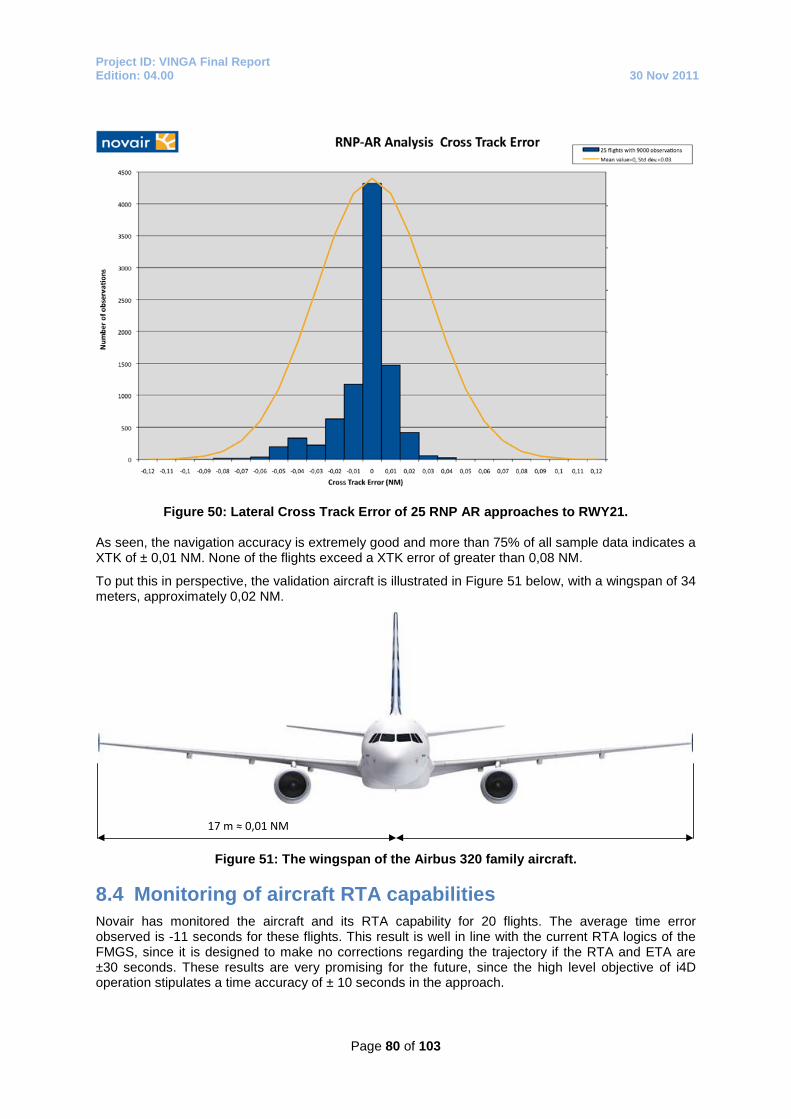
Project ID: VINGA Final Report Edition: 04.00 30 Nov 2011
Page 80 of 103
Figure 50: Lateral Cross Track Error of 25 RNP AR approaches to RWY21.
As seen, the navigation accuracy is extremely good and more than 75% of all sample data indicates a XTK of ± 0,01 NM. None of the flights exceed a XTK error of greater than 0,08 NM.
To put this in perspective, the validation aircraft is illustrated in Figure 51 below, with a wingspan of 34 meters, approximately 0,02 NM.
17 m ≈ 0,01 NM
Figure 51: The wingspan of the Airbus 320 family aircraft.
8.4 Monitoring of aircraft RTA capabilities Novair has monitored the aircraft and its RTA capability for 20 flights. The average time error observed is -11 seconds for these flights. This result is well in line with the current RTA logics of the FMGS, since it is designed to make no corrections regarding the trajectory if the RTA and ETA are ±30 seconds. These results are very promising for the future, since the high level objective of i4D operation stipulates a time accuracy of ± 10 seconds in the approach.

Project ID: VINGA Final Report Edition: 04.00 30 Nov 2011
Page 81 of 103
9 Departure phase optimisation – effects on fuel and noise
9.1.1 Introduction The air traffic departure procedures currently in use at Göteborg Landvetter Airport were evaluated to identify ways to reduce the CO2 emissions during the departure phase of flight. The effect of changing current departure procedures on noise exposure was also considered.
The majority of aircraft operating from Gothenburg Landvetter Airport are RNAV-capable and depart along published P-RNAV SIDs. Figure 52 shows the published P-RNAV SIDs for RWY03 (left) and RWY21 (right). The P-RNAV SIDs consists of a pre-defined set of virtual waypoints that are programmed into the aircraft’s navigational guidance system. Some of these waypoints have associated speed and altitude constraints that must be obeyed unless ATC provide additional clearance.
Figure 52: P-RNAV SID layout for RWY03 (left) and RWY21 (right).
Until recently, minimising the noise exposure to local communities has been the primary environmental objective when designing the ATM departure procedures at Göteborg Landvetter Airport. This has led to the design of SIDs that create minimum noise disturbance, but that are, in some cases, very fuel-inefficient. Furthermore, many of the speed and altitude restrictions in place are based on the performance and navigation capabilities of an older generation of aircraft built during the 1970s, such as the MD-80. These restrictions do not cater for the modern aircraft types that constitute the majority of operations at Göteborg Landvetter Airport, such as the Airbus A320 family and Boeing 737.
For example, some of the departure routes at Göteborg Landvetter Airport that contain sharp turns in the low altitude region contain a 210 KIAS speed constraint to prevent the aircraft from flying off-course during strong wind conditions. The result is that the majority of commercial aircraft must climb

Project ID: VINGA Final Report Edition: 04.00 30 Nov 2011
Page 82 of 103
for several track miles with slats extended in an unclean aerodynamic configuration. This generates increased lift and drag, which causes increased fuel burn and thus CO2 emissions. It is thus desirable from an environmental perspective to minimise the use of speed constraints.
The turn-related speed constraints applied to the SIDs at Göteborg Landvetter Airport are based on recommendations in the ICAO procedure design manual, PANS-OPS, Document 8168. It is fair to say that the total operational performance envelope of the aircraft is seldom used, thus generating a situation where the full benefit of the aircraft performance is not used.
In addition, the current environmental legislations in Sweden do not allow aircraft to deviate from a SID for a direct routing until they have climbed to a minimum altitude of 6 000 ft AGL for noise abatement purposes. This is based on the requirement that residential areas must not be exposed to traffic noise above 70 dB(A) LAmax outside the home (LAmax: the highest A weighted noise level recorded during a noise event). However, with the introduction of quieter high-bypass turbofan engines in recent years, it is anticipated that aircraft with these engines could deviate from a SID below 6 000 ft AGL and still comply with the current noise restrictions. This would facilitate flight path shortening and thus a reduction in CO2 emissions. In some cases, an early deviation from the SID would reduce noise exposure for communities based near to the existing SID route. This would require a change to the current environmental permit towards a differential structure based on the specific noise characteristics of different aircraft types.
The VINGA project has therefore considered the environmental benefits that could be achieved with the following changes to existing departure procedures:
Evaluate the environmental benefit of removing published speed constraints along SIDs.
Assess the environmental benefit that could be achieved by allowing aircraft with modern, low-noise aero engines to deviate from a SID below the current minimum altitude of 6000 ft AGL for a direct routing to the next waypoint.
9.1.2 Data Data has been extracted from the aircraft quick access FDR for a total of 18 sample Novair A321 flights during the period January to July 2011. Data was collected for flights departing from RWY21 and 03 along the TOPLA 1J and TOPLA 1M southern SIDs. The flight data contained information about the aircraft’s position, altitude, speed, engine rotational speed, fuel flow and flap settings, updated eight times per second for the duration of the flight. In addition, Take-Off Data Calculation (ToDC) information was provided by Novair, which contained information about the characteristic take-off parameters and the meteorological conditions.
The purpose of the data collection was to gain an insight into the typical take-off settings used by Novair A321 aircraft and to understand how these parameters are influenced by factors such as time of day, weather conditions, etc. Although the sample flights do not provide an exhaustive overview of all possible take-off configurations, thrusts, masses, etc., they provide sufficient evidence to model typical take-off parameters for the Novair A321.
9.1.3 Aircraft performance and noise modelling The Airbus Performance Engineer’s Program (PEP) was used to simulate the performance of the A321-231 aircraft during departure. The Operational Flight Path (OFP) tool within PEP was used to simulate a departure based on information in the sample FDR data. OFP uses information about the aircraft take-off configuration (e.g. mass, flap and slat settings, thrust selected), environmental conditions (wind, temperature, pressure and RYW conditions) and vertical climb profile as inputs. OFP also allows the lateral path followed by the aircraft to be defined (i.e. the SID layout), accounting for any turns in the track.
The Airbus Noise Level Calculation program (NLC) within PEP was used to predict the noise exposure from the A321 aircraft for each departure procedure modelled. NLC was used to calculate the aircraft noise emissions at specific points along the departure trajectory and also calculate iso-level noise contours.

Project ID: VINGA Final Report Edition: 04.00 30 Nov 2011
Page 83 of 103
The noise metric selected for the analysis was the maximum instantaneous A-Weighted noise level, LAmax. This is the noise in decibels weighted to the response of the human ear. LAmax is the noise metric used by the Swedish Environmental Agency as guidance for ATM procedure development.
9.1.4 Method In order to assess the effect of removing or reducing existing speed and altitude constraints applied to SIDs at Göteborg Landvetter Airport, an actual Novair A321 flight was simulated using the PEP software (based on the sample FDR data received – see Figure 53) and PEP was then used to make deviations from the actual flight by changing the speed and altitude constraints applied. The effects on fuel consumption and noise exposure were then assessed.
The sample Novair A231 flight modelled in PEP departed on a typical Scandinavian winter day with a mass in the upper region of the MTOM for an A321. This flight is considered to represent a worst case scenario with respect to noise exposure for an A321 departing with TOGA thrust (full take-off thrust) due to the reduced climb rate achieved by a heavy-loaded aircraft. Figure 53 shows the fit of the Airbus PEP model (blue line) to the sample flight data (green line) for the entire climb phase.
Figure 53: Airbus PEP model fit (blue line) to aircraft flight data (green line) for sample Novair
A321 climb profile.
9.1.4.1 Method - evaluation of removing SID speed constraints The TOPLA 1M SID at Göteborg Landvetter Airport is an example of a SID carrying a turn-related speed constraint of 210 KIAS. The layout of the TOPLA 1M SID is shown in Figure 54. The effect of varying and completely removing the 210 KIAS speed constraint along the TOPLA 1M SID was investigated. The sample Novair A321 flight modelled with the Airbus PEP program was used as a basis for the study.

Project ID: VINGA Final Report Edition: 04.00 30 Nov 2011
Page 84 of 103
Figure 54: Published southern P-RNAV SIDs from Runway 03 at Göteborg Landvetter Airport.
Five scenarios were considered, each based on a real ATM departure procedure where different levels of speed constraint apply. The PEP model of the A321 aircraft (shown in Figure 53) was modified to include the speed restrictions in each scenario. The five speed constraint scenarios are described below:
A speed constraint of 205 KIAS is applied to a ground distance of 10 NM.
A speed constraint of 210 KIAS is applied to a ground distance of 10 NM (speed constraint applied on TOPLA 1M today).
A speed constraint of 220 KIAS is applied to a ground distance of 10 NM.
No turn-related speed constraint is applied. The standard 250 KIAS speed constraint is applied until the aircraft reaches FL100.
No speed constraints apply during the climb phase, which simulates when a ‘Free Speed’ instruction is granted by ATC. Free Speed removes the 250 KIAS speed constraint below FL 100. Free Speed is regularly granted by ATC at Göteborg Landvetter Airport during quiet periods. The aircraft accelerates to a climb speed of 304 KIAS, which is based on the selected Cost Index of the mission, inserted in the aircraft FMGS.
In each scenario the total aircraft fuel consumption was calculated to a radius of 200 NM from the airport, which incorporates the entire climb phase and a short segment of cruise. The total CO2 emitted for each scenario was derived using the linear relationship between fuel usage and CO2 emissions, where 1 kg of JET A1 fuel corresponds to 3.16 kg of CO2.
9.1.4.2 Method – calculation of fuel savings from early SID deviations Analysis was carried out to investigate the potential fuel savings that could be achieved if early deviations were permitted for A321 aircraft departing on the TOPLA SID. As stated in Section 9.1.1, aircraft are not permitted to deviate from a SID for a direct routing until the noise exposure on the
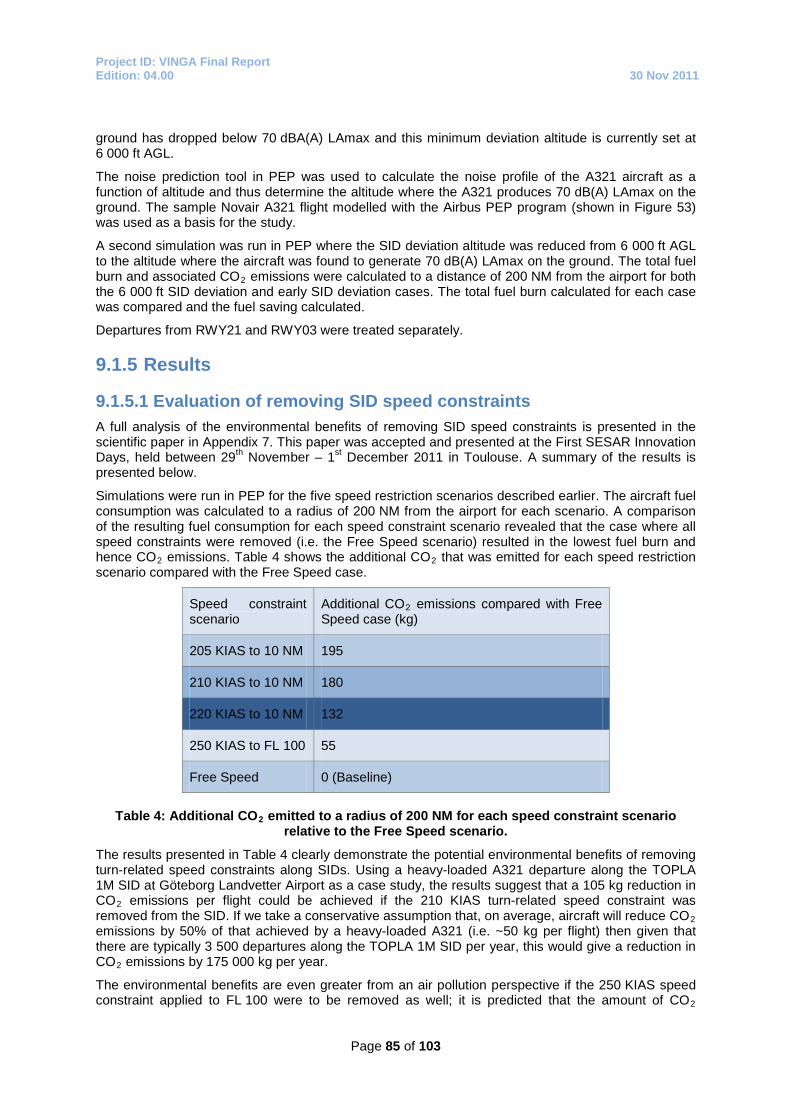
Project ID: VINGA Final Report Edition: 04.00 30 Nov 2011
Page 85 of 103
ground has dropped below 70 dBA(A) LAmax and this minimum deviation altitude is currently set at 6 000 ft AGL.
The noise prediction tool in PEP was used to calculate the noise profile of the A321 aircraft as a function of altitude and thus determine the altitude where the A321 produces 70 dB(A) LAmax on the ground. The sample Novair A321 flight modelled with the Airbus PEP program (shown in Figure 53) was used as a basis for the study.
A second simulation was run in PEP where the SID deviation altitude was reduced from 6 000 ft AGL to the altitude where the aircraft was found to generate 70 dB(A) LAmax on the ground. The total fuel burn and associated CO2 emissions were calculated to a distance of 200 NM from the airport for both the 6 000 ft SID deviation and early SID deviation cases. The total fuel burn calculated for each case was compared and the fuel saving calculated.
Departures from RWY21 and RWY03 were treated separately.
9.1.5 Results
9.1.5.1 Evaluation of removing SID speed constraints A full analysis of the environmental benefits of removing SID speed constraints is presented in the scientific paper in Appendix 7. This paper was accepted and presented at the First SESAR Innovation Days, held between 29th November – 1st December 2011 in Toulouse. A summary of the results is presented below.
Simulations were run in PEP for the five speed restriction scenarios described earlier. The aircraft fuel consumption was calculated to a radius of 200 NM from the airport for each scenario. A comparison of the resulting fuel consumption for each speed constraint scenario revealed that the case where all speed constraints were removed (i.e. the Free Speed scenario) resulted in the lowest fuel burn and hence CO2 emissions. Table 4 shows the additional CO2 that was emitted for each speed restriction scenario compared with the Free Speed case.
Speed constraint scenario
Additional CO2 emissions compared with Free Speed case (kg)
205 KIAS to 10 NM 195
210 KIAS to 10 NM 180
220 KIAS to 10 NM 132
250 KIAS to FL 100 55
Free Speed 0 (Baseline)
Table 4: Additional CO2 emitted to a radius of 200 NM for each speed constraint scenario
relative to the Free Speed scenario.
The results presented in Table 4 clearly demonstrate the potential environmental benefits of removing turn-related speed constraints along SIDs. Using a heavy-loaded A321 departure along the TOPLA 1M SID at Göteborg Landvetter Airport as a case study, the results suggest that a 105 kg reduction in CO2 emissions per flight could be achieved if the 210 KIAS turn-related speed constraint was removed from the SID. If we take a conservative assumption that, on average, aircraft will reduce CO2 emissions by 50% of that achieved by a heavy-loaded A321 (i.e. ~50 kg per flight) then given that there are typically 3 500 departures along the TOPLA 1M SID per year, this would give a reduction in CO2 emissions by 175 000 kg per year.
The environmental benefits are even greater from an air pollution perspective if the 250 KIAS speed constraint applied to FL 100 were to be removed as well; it is predicted that the amount of CO2

Project ID: VINGA Final Report Edition: 04.00 30 Nov 2011
Page 86 of 103
emitted by a heavy-loaded A321 would be reduced by 180 kg per flight compared with the present day situation.
Naturally any discussion of removing existing speed constraints must also consider the implications for noise exposure on the ground and aircraft operational capabilities. Figur 57 shows the LAmax noise contours along the TOPLA 1M SID for the five speed constraint scenarios considered. Contour levels are shown at 75 dB(A), 70 dB(A), 65 dB(A) and 60 dB(A). The SID centreline is shown in red and the positions of the waypoints are marked.
Figure 55: Geographical representation of the TOPLA 1M SID (shown in red with virtual
waypoints indicated) with LAmax noise contours overlaid for five speed constraint scenarios. Contours are at levels of 75 dB(A), 70 dB(A), 65 dB(A) and 60 dB(A).
The noise contours shown in Figure 55 reveal that the reduction or removal of speed constraints in the departure phase generally comes at a cost of increased noise emissions below 70 dB(A); the 75 dB(A) noise contour is not affected by the removal of speed constraints along the SID. The aircraft following a Free Speed departure procedure generates a 60 dB(A) contour that covers a geographical area approximately 18 km2 larger than that produced by an aircraft governed by a 210 KIAS speed restriction to a ground distance of 10 NM.

Project ID: VINGA Final Report Edition: 04.00 30 Nov 2011
Page 87 of 103
The Swedish Parliament has established LAmax of 70 dB(A) as a benchmark for classifying noise disturbance; aircraft are legally required to remain within ±1 NM of a published SID centreline until the LAmax perceived on the ground has reduced below 70 dB(A). Therefore, it may be argued that whilst the removal of speed constraints does increase noise exposure, the increase is within an acceptable audible limit (i.e. below 70 dB(A)).
9.1.6 Calculation of fuel savings from early SID deviations This section presents the results of a fuel burn analysis of early SID deviations at Göteborg Landvetter Airport.
Figure 56 shows how the LAmax noise varies as a function of altitude for a generic A321 aircraft departure (i.e. not based on the characteristics of specific FDR data). This is simply to give an indication of how the aircraft noise varies with altitude. The blue lines show the noise profile as a function of ground distance for an aircraft that departed with maximum take-off (TOGA) engine thrust (solid blue line) and minimum take-off engine thrust (dashed blue line). The green lines show the equivalent climb profiles of the aircraft as a function of ground distance.
Figure 56: A321 LAmax noise profile as a function of ground distance for two engine thrust
settings: maximum take-off thrust (solid blue line) and minimum take-off thrust (dashed blue line). The associated climb profiles are shown in green for the two take-off thrust scenarios.
Figure 56 reveals that, regardless of the engine take-off thrust setting, the A321 creates 70 dB(A) LAmax at approximately 3 000 ft AGL. This is half of the current minimum SID deviation altitude of 6 000 ft AGL. Figure 56 also shows that the engine take-off thrust setting affects the distribution of noise on the ground; at any given ground distance along the departure route, an aircraft that takes off with minimum thrust produces a higher noise exposure compared with an aircraft that takes off with maximum TOGA thrust. It should be noted, however, that the fuel consumption used for a TOGA take-off is higher than that for a reduced thrust take-off.
A parameter study was carried out to investigate the effect of initial flight conditions on the altitude where the A321 creates 70 dB(A) LAmax. A detailed description of the study and results are included
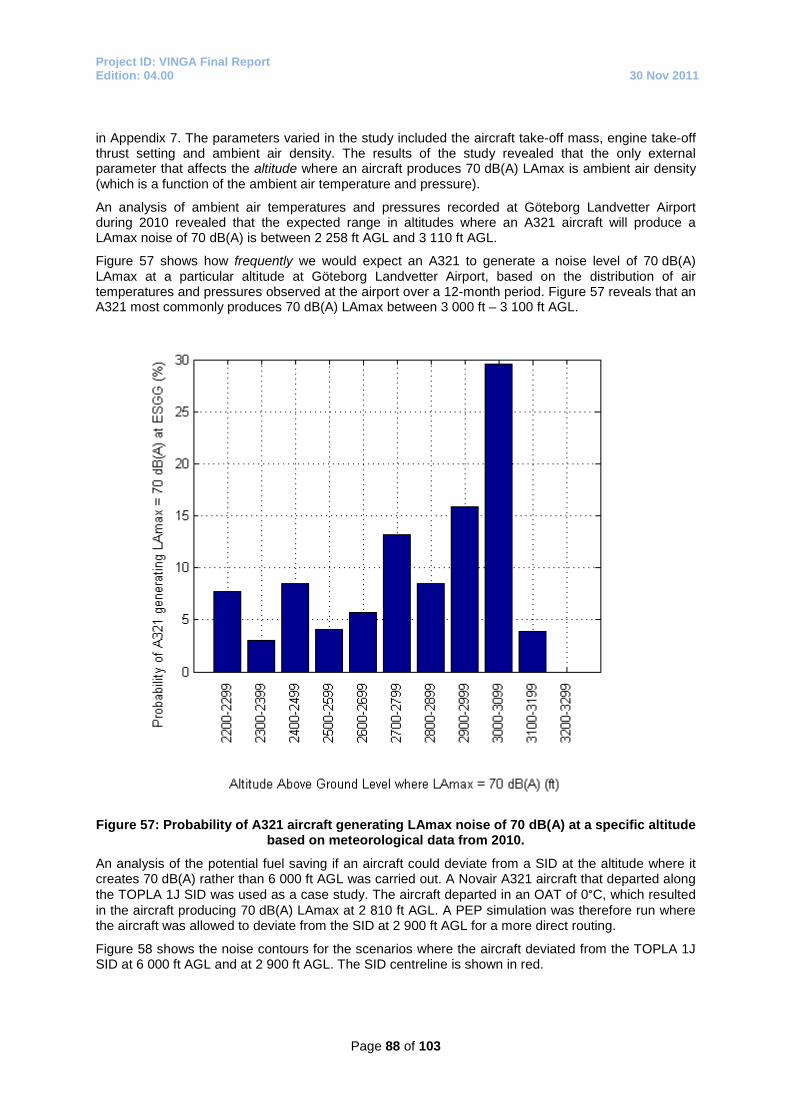
Project ID: VINGA Final Report Edition: 04.00 30 Nov 2011
Page 88 of 103
in Appendix 7. The parameters varied in the study included the aircraft take-off mass, engine take-off thrust setting and ambient air density. The results of the study revealed that the only external parameter that affects the altitude where an aircraft produces 70 dB(A) LAmax is ambient air density (which is a function of the ambient air temperature and pressure).
An analysis of ambient air temperatures and pressures recorded at Göteborg Landvetter Airport during 2010 revealed that the expected range in altitudes where an A321 aircraft will produce a LAmax noise of 70 dB(A) is between 2 258 ft AGL and 3 110 ft AGL.
Figure 57 shows how frequently we would expect an A321 to generate a noise level of 70 dB(A) LAmax at a particular altitude at Göteborg Landvetter Airport, based on the distribution of air temperatures and pressures observed at the airport over a 12-month period. Figure 57 reveals that an A321 most commonly produces 70 dB(A) LAmax between 3 000 ft – 3 100 ft AGL.
Figure 57: Probability of A321 aircraft generating LAmax noise of 70 dB(A) at a specific altitude
based on meteorological data from 2010.
An analysis of the potential fuel saving if an aircraft could deviate from a SID at the altitude where it creates 70 dB(A) rather than 6 000 ft AGL was carried out. A Novair A321 aircraft that departed along the TOPLA 1J SID was used as a case study. The aircraft departed in an OAT of 0°C, which resulted in the aircraft producing 70 dB(A) LAmax at 2 810 ft AGL. A PEP simulation was therefore run where the aircraft was allowed to deviate from the SID at 2 900 ft AGL for a more direct routing.
Figure 58 shows the noise contours for the scenarios where the aircraft deviated from the TOPLA 1J SID at 6 000 ft AGL and at 2 900 ft AGL. The SID centreline is shown in red.

Project ID: VINGA Final Report Edition: 04.00 30 Nov 2011
Page 89 of 103
Figure 58: Noise contours generated by A321 aircraft that deviated from the TOPLA 1J SID at
6 000 ft AGL and 2 900 ft AGL.
The difference in aircraft fuel consumption was calculated to a radius of 200 NM from the airport. The aircraft which was allowed to deviate from the SID at 2 900 ft AGL only consumed 7 kg less fuel than the aircraft which deviated from the SID at 6 000 ft AGL. This is because the TOPLA SID is already quite direct for aircraft bound for southern Europe and North Africa.
The results did show, however, that SIDs such as the north-easterly LABAN SID used for aircraft heading to Stockholm Arlanda Airport, would benefit to a greater extent from early SID deviations. Aircraft using the LABAN SID must remain on the SID until climbing through 10 000 ft AGL and the lateral efficiency of the SID is quite poor (i.e. it makes a large deviation around a noise-sensitive area). If aircraft using this SID could deviate around 3 000 ft AGL rather than 10 000 ft AGL, the potential fuel saving is in the order of 18 kg per flight. This equates to a reduction of approximately 54 kg of CO2 emissions per flight.
9.1.7 Track adherence during turn The VINGA flights that departed along the TOPLA 1M SID flow with a higher KIAS compared to the normal procedure. Of particular importance was to monitor track adherence along the RNAV route. All NVR flights, which have been using the SID during 2011, are shown in Figure 59. The RNAV corridor is ± 1 NM, since it is a P-RNAV SID. The red tracks represent non-VINGA flights, and the blue tracks represent the VINGA flights. As seen, there are no differences observed, and the scale is shown in the lower left corner.
SID deviation at 2 900 ft AGL
75 dB(A) 70 dB(A) 65 dB(A) 60 dB(A)
Aircraft creates
maximum DBA of 70 dB(A) at this location.
Actual SID deviation at 6 000 ft AGL

Project ID: VINGA Final Report Edition: 04.00 30 Nov 2011
Page 90 of 103
Figure 59: Blue tracks – departures with no speed restriction. Red tracks – departures with
speed restrictions.
9.1.8 Conclusions The results of the two studies presented reveal that removing the existing speed restrictions along the SIDs at Göteborg Landvetter Airport has the potential to save the most fuel and hence result in the largest reductions in CO2 emissions. If the 210 KIAS speed constraints are removed, there is a potential to reduce CO2 emissions by up to 105 kg per flight for a heavy A321. An even greater reduction in CO2 emissions could be achieved if the 250 KIAS speed constraint to FL100 is removed – this has the potential to reduce CO2 emissions by up to 185 kg per flight for a heavy A321 aircraft. A removal of speed restriction will not affect track adherence.
The removal of turn-related speed constraints would require either deviation from the current PANS-OPS guidance based on a local safety validation case or an alternative interpretation of the recommendations. Possible solutions for how this may be achieved include use of statistical winds rather than worst-case tail winds when designing the SID procedure; removal of turn-related speed constraints for aircraft capable of banking at least 30°; demonstrate that modern aircraft equipped with GNSS navigation can remain within the required ±1 NM from the SID centreline without the need for turn-related speed constraints.
The results indicate that the A321 generates 70 dB(A) LAmax on the ground between 2 258 ft AGL and 3 110 ft AGL at Göteborg Landvetter Airport. Based on the observed ambient air temperature and pressure conditions at Göteborg Landvetter Airport, the most common altitude band where the aircraft produces 70 dB(A) LAmax is between 3 000 ft – 3 100 ft AGL. This suggests that the current 6 000 ft AGL minimum SID deviation altitude is overly conservative for modern aircraft such as the A321.
The potential fuel savings if aircraft could deviate at ~3 000 ft AGL on the southern TOPLA 1J SID for a direct routing is only in the order of 6 – 7 kg per flight because the SID is already quite direct. However, there is the potential to facilitate greater fuel savings (~18 kg) on the north-easterly LABAN SID if aircraft are allowed to deviate early.

Project ID: VINGA Final Report Edition: 04.00 30 Nov 2011
Page 91 of 103
10 Fuel efficiency best practices There are many initiatives that can be adopted in the daily flight operations to achieve fuel efficient operations. Such initiatives include landing with partial flaps, single engine taxi, idle reverse at landing etc. These best practices are not new or controversial and are adopted by many operators. Idle reverse at landing is even required by many airports due to noise aspects and should more or less be classified as normal operations.
This section lists the fuel savings related to a number of general fuel efficiency “best practices”. These best practices have been used for the VINGA flights. However, they have also been used for the non VINGA flights since these best practices are adopted in Novair’s day to day operations since several years. Hence, the fuel savings listed here should be seen as potential fuel savings achievable by using best practices compared to not using them and not the fuel saving of the VINGA flights compared to the non VINGA flights.
The figures given in Table 5 below are taken from the Airbus “Getting to grips with A320 Family performance retention and fuel saving”, issue 2, January 2008.
Best practice Approximate fuel saving
Landing with CONF3 instead of CONF FULL 8 kg
Use of idle reverse instead of full reverse 15 kg
Single engine taxi instead of two engine taxi 5,8 kg per minute
Ground power instead of APU usage on ground 2,2 kg per minute
Air Conditioning Packs off compared to Packs On during takeoff
3 kg
Using 800 ft acceleration altitude instead of 1500 ft 24 kg
Table 5: Additional general fuel savings, based on best practices.

Project ID: VINGA Final Report Edition: 04.00 30 Nov 2011
Page 92 of 103
11 Communication and dissemination event
11.1 Communication strategy The main communication messages from the VINGA project were based upon following communications platform:
Environmental aspect, carbon emissions and noise, Interaction and cooperation with aircraft manufactures, ANSPs, airline industry and airports, ICAO recommendation of RNP implementation, Pioneer technique, RNP Transition to ILS.
Communications strategy was to always mention SESAR and all parties involved regarding external communication and distribute all external communication material to all parties involved The impact from the communication campaign about VINGA was significant. There was a considerable interest in how far the aviation has actually come in their environmental efforts from various sectors of society – industry, politicians, our partners and the media. The message the project aimed to convey was that VINGA is one way for the aviation industry to reduce its environmental impact by using different methods to reduce carbon dioxide emission and trying to optimise fuel efficiency in all aspects of aviation, trying to also reduce aviation noise for those who live in the vicinity of the airport showing that together – air traffic management, airport, aircraft manufacturers and airlines – this is possible.
11.2 VINGA event A dissemination event was arranged on the 24th of May, 2011 at Göteborg Landvetter Airport. The event was organised and hosted by Göteborg Landvetter Airport, with participation of each VINGA member. The planning of the event started in the fall of 2010, with internal discussions about its context, time of event, target audience and purpose. The project developed common press material and fact sheets. The dissemination event was divided into two parts; a lecture part, were each VINGA partner, SJU and the Project Management gave their view on various aspects of the project, the current situation and the future. One strong message was sent to the audience, we need to work in partnership and we need to integrate best possible technique in the day-to-day operation to minimise the environmental footprint of aviation. The second part of the event consisted of a demonstration flight, were all different phases of the VINGA project were included. It was a flight that lasted approximately 40 minutes, and departed towards the south, along the Swedish West coast, before returning towards Göteborg Landvetter Airport. The flight included a RNP AR approach to RWY21. The guests of the event included national politicians, the environmental authorities, Airspace Users, the ATM sector, aviation industry representatives and media. Without a doubt, this message reached national, local and trade media in Sweden, international media (mainly aviation media) and local authorities/politicians near the airport. Over ten days, the campaign achieved a total media impact of almost € 90 000 measured in advertising value equivalent. Two months after the event there was a large article about the project in the most prestigious Swedish newspaper Svenska Dagbladet.
The broad representation of different media also showed that there were many different approaches to the media, ranging from the local press that could report on the new routes which means less noise and emission for the residents of the region to international trade magazines with a broader perspective on aviation environmental issues and how project VINGA reduce the environmental impact of aviation.

Project ID: VINGA Final Report Edition: 04.00 30 Nov 2011
Page 93 of 103
The event itself was perceived to be professionally arranged, with a high level of expertise gathered. Below, in Figure 60, Figure 61 and Figure 62 are three collages shown, with multiple pictures from the VINGA dissemination event. There was an information leaflet produced for the dissemination event, please refer to Appendix 8.

Project ID: VINGA Final Report Edition: 04.00 30 Nov 2011
Page 94 of 103
Figure 60: The VINGA dissemination event.

Project ID: VINGA Final Report Edition: 04.00 30 Nov 2011
Page 95 of 103
Figure 61: The VINGA dissemination event.

Project ID: VINGA Final Report Edition: 04.00 30 Nov 2011
Page 96 of 103
Figure 62: The VINGA dissemination event.

Project ID: VINGA Final Report Edition: 04.00 30 Nov 2011
Page 97 of 103
11.3 Other channels of communication The airport is involved in a process to apply for a new environmental permit. In such a process it is mandatory to hold consultations with all affected municipalities, regional environmental authorities and the Swedish Environmental Protection Agency. For Göteborg Landvetter Airport it is eleven municipalities. The project leader for VINGA participated in these consultations and described the airport's RNP AR flights. This is a very important forum for information, because it might have a significant impact on how environmental authorities agree to approve the use of new procedures in the long term perspective. For those municipalities where the procedures affect new people or relive certain areas, the airport has specifically pointed out that the will come back for another dialogue after the project.
Göteborg Landvetter Airport has continuously informed the surrounding communities about the project, using its information leaflet.
Novair has used an on board information movie about the VINGA project, shown to all passengers during 2011 (http://www.youtube.com/watch?v=k7asV8-yW0g).
PBN summit Seattle September 2011 (hosted by General Electric). A Swedish delegation was invited to make a presentation about PBN implementation in Sweden, as shown in Figure 63. VINGA Project Manager held a presentation about implementation of RNP AR approaches in the context of VINGA. The RNP Transition to ILS validation flights was also presented.
Figure 63: The PBN Summit, 2011.
LFV, Swedavia, Novair and SAS participated in a meeting at the Swedish Ministry of Enterprise, Energy and Communication about environmental initiatives in the aviation industry. The positive environmental effects of implementing PBN in the framework of VINGA and the Green Connection project were presented by the Project Manager of VINGA.
11.4 Post VINGA - communication The VINGA project has had communication meetings at the end of the project, in order to go through results and to reach consensus. There is a big responsibility on every stakeholder to spread the findings in the project.

Project ID: VINGA Final Report Edition: 04.00 30 Nov 2011
Page 98 of 103
12 Conclusions The project has included several components which to a varying extent have affected the ATM system. The major difference in the frame of the VINGA project was the usage of RNP AR approaches in the day-to-day operations.
12.1 RNP AR approaches As a result of the introduction of RNP AR approaches, the project believes that implementation of RNP technology does not involve significant changes in relation to the existing ATM system.
It has been shown that the RNP technology is mature from an airborne perspective; focus will be on developing suitable ground system tools, to manage a mixed mode operational environment, with different needs, seen from an Airspace Users perspective.
For a large proportion of the VINGA flights, ATCOs have not experienced that the RNP flights affected their workload in a negative manner. This indicates that the preparation was good and that the operational agreements that were set up during the pre-validation phase of the project have been working properly. It is of vital importance to use efficient operational agreements that not adversely affect the workload of the ATCOs. The project shows that RNP STARs and RNP AR approaches can be implemented in an operational environment that already has closed procedures (e.g. P-RNAV STARs). Operational agreements can be arranges in a manner that not increases verbal coordination and allows the flight crews to perform a CDO from ToD.
ATCOs need to be educated about the differences between existing technology, e.g. RNAV and RNP operation, such as the unique characteristics of airborne functionalities such as onboard alerting concerning navigation, Baro-VNAV functionalities and changes in phraseology etc. Viewed from a pragmatic point, it could be stated that the RNP AR approach operation is similar to managing traffic along any other closed procedure from a ATCOs perspective. However, implementation of RNP STARs and RNP AR approaches can create new geographical drawings and a curved flight path instead of a long straight track at the final part of the approach. This requires a good presentation on the radar screen, so that the ATCO know where the flight will be and the remaining distance.
To use closed procedures regardless if it RNAV or RNP during periods with more dense traffic is challenging for the ATM system. To use closed procedures in an environmental efficient manner, requires that the ATCO, in an early stage of the arrival phase, can determine the future sequence on the extended centre line of the RWY. Typical questions that arise are associated with statement such as: What is the remaining distance? What will the separation be on final? Is there any gaps needed in the arrival sequence to enable any departures in between?
The usage of tactical radar vectoring is a powerful tool when it comes to the final sequencing of arriving traffic close to the airport. The only tool available when using closed procedures is typically speed adjustments. The high rate of RNP AR approaches flown in the VINGA project in a variety of traffic situations, in combination with an overall assessment of the feedback given, from the involved ATCOs, indicates that the introduction of RNP AR approaches is mature. The impacts on the day-to-day operations were minor given that the implementation of RNP procedures meant both new geographical flight paths and new technology. The extreme lateral navigation accuracy in the RNP technique gave ATCOs maximum predictability in their planning and confidence when they decided to use the procedures.
If the aim is to increase the usage of RNP AR approaches even during high density traffic situations, the conclusion is that ATCOs most probably need some kind of a technical support tool such as an AMAN, suitable in an i4D environment.
For the foreseeable future, Airspace Users will have different navigation capabilities. Although RNP AR approaches can be available, there will be Airspace Users that need to use other procedures, such as RNAV routes for example. It is therefore important that the en-route sectors have efficient operational procedures to allocate the best possible approach procedure, for each and every flight. In the short term perspective, the ATM system can be based on a request from the flight crew to perform

Project ID: VINGA Final Report Edition: 04.00 30 Nov 2011
Page 99 of 103
a certain approach. In a more long term perspective the ATM system probably need a technical system that can inform the ATCO about every aircraft’s capabilities and requests.
In Figure 64 below, are all Novair flights conducting the RNP AR approach to RWY21 during the VINGA project are shown. All flights were given direct routing towards the TMA entry point, were all radar tracks converged into one common trajectory. This is a good example, why the ATCOs at ATS Landvetter had confidence in the RNP technology.
Figure 64: All arriving RNP AR approaches to RYW21 during the VINGA project. High
navigational accuracy gives the ATCO confidence.
12.1.1 RNP Transition to ILS The validations of RNP Transition to ILS were very fruitful. The implementation from an airborne and ground perspective was very smooth. The validation activities did not raised any blocking point for this new type of operations: RNP Transition to ILS with a RF leg.
As expected, advantages of both operations were gathered: guidance on a fixed and repeatable trajectory along the RNP segment including a RF transition to join an ILS beam allowing the aircraft to reach a more attractive minimum descent altitude, as seen from a meteorological point of view.
In addition to the demonstration of the interest of RNP Transition to ILS concept for an airport like Göteborg; VINGA was a great opportunity to open the door for the next step concerning approach procedure improvement. VINGA gathered in a single project: on one hand the optimisation of approach trajectories through RNP AR with associated track miles and fuel saving; and on the other hand the possibility to combine RNP and ILS for a smooth transition. Thus it is the first step before a RNP Transition to ILS with the full benefits of RNP AR concept with an optimised trajectory and high performances for various considerations; track miles saving, avoidance of noise sensitive area; traffic management etc.
For instance the possibility to reduce the length of the ILS segment by joining it smoothly on an RNP trajectory seems to be very promising for track miles savings.
The VINGA validations demonstrated the feasibility of RNP Transition ILS in Göteborg TMA. Next steps need to be supported by the development of regulatory material (like an ICAO document) for

Project ID: VINGA Final Report Edition: 04.00 30 Nov 2011
Page 100 of 103
this new operation in order to establish more advanced RNP transition operation within the perimeter of a regulatory context. (For example there is currently a lack of regulatory support for RNP Transition to ILS procedure design).
12.1.2 Surface phase A good coordination between ATCOs and flights crews is a prerequisite for efficient surface operation. This has worked well for the VINGA validation flights. This is not a major challenge on an airport of the size of Göteborg Landvetter Airport.
12.1.3 The departure phase Every departure phase is an opportunity to minimise the environmental impact of that flight. An optimised departure phase consists of development of new technology, design of SIDs and education of flight crews and ATCOs.
During the validation period some departing aircraft have flown with different speed in the early part of the flight. This had no impact on the ATM system. This could be implemented for all departing flights. With the introduction of the FRAS concept in Swedish airspace, Airspace Users can file their ATC flight plan in the most fuel-optimal way towards the FIR border of Swedish airspace. Tactical direct routing has been coordinated silently through the Eurocat 2000 E system between en-route and TMA ATCOs.
To be able to handle conflicting departing and arriving aircraft in the most fuel efficient manner, requires knowledge of the ATCOs in these domains. This has been addressed during the VINGA project with a very good overall result.

Project ID: VINGA Final Report Edition: 04.00 30 Nov 2011
Page 101 of 103
13 Way forward and recommendations The VINGA project has involved changes of the ATM system in a relatively complex nature; in addition, this has occurred during a relatively short time frame. The changes made, have been possible to conduct, by close collaboration between dedicated and knowledgeable partners. These types of changes and the associated endeavours could never have been achieved by any single ANSP, an airport, an Airspace User or an industry partner. Each partner has its own unique skills and relationships to e.g. the relevant authorities which mean that you can create profound changes, when working in partnership.
There have been several issues throughout the lifecycle of the project, where the project members have had discussions with the Swedish CAA, e.g. on issues concerning interpretation of ICAO guidelines, as an incentive for environmental benefits, use of IAPs for validation purposes and different views on the level of complexity when introducing new flight paths in the TMA.
To be able to move forward, a close dialogue and collaboration with the CAA is the vital key for further success. Development and changes requires close collaboration between ANSPs, Airspace Users, industry, airports and regulatory authorities, the latter must be included in any process at an early stage and have an active role to play. It is also important that the regulatory bodies actively encourage and support various projects regarding development of new solutions. It is an opinion of the VINGA project that it is important that the project members and the authorities, at an early stage, are able to share the content of a project, to assess if the proposed changes are in line with how the authorities view the issues, and if there is different views, find a solution.
A first step in this direction was taken during October 2011, when different national stakeholders had an initial meeting with the Swedish CAA at their premises. The purpose was to discuss the industry’s view on development and validation of new incentives, promoting environmentally efficient flying. The wish and need of larger involvement of the CAA and closer collaboration was highlighted. The outcome of this meeting was that further meetings will be held, the next meeting is scheduled for the middle of December 2011.
Development and implementation of new technology requires large investments in hardware and human resources. To give all involved stakeholders a confidence in potential participation in candidate projects, it may require involvement from the CAA as early as possible in the process, to clearly indicate if the chosen path is not accepted from an authority point of view. This would generate an optimum process for all parties involved. It is the view of the VINGA project that the current Swedish legislation is not adopted to efficiently conduct validation project, for easy implementation in the day-to-day operation, where obvious environmental benefits can easily be achieved. From a Swedish perspective, the airports have a vital role to play in implementation of new ATS routes close to the airport. Göteborg Landvetter Airport was responsible for the communication activities in the frame of the VINGA project. The project believes that this is an appropriate method in a project like this was. An airport is always exposed to risks, when changing the flight paths in the vicinity of the airport. Based on this, it is of vital importance that the airport uses every possibility to have a dialogue with surrounding municipalities. Göteborg Landvetter Airport strongly believes that VINGA has generated interest among many people to learn more about what the airport is doing for the environment. In addition, they have received feedback indicating that there is an even growing interest from local politicians to gain more insight in the different activities, where the airport is involved in environmental activities.
Göteborg Landvetter Airport will now arrange meetings (scheduled for the middle/end of January 2012) with the municipalities that were affected by the validation flights in the VINGA project. This includes both the municipalities where residents may have been affected by the RNP AR approaches, but also the municipality where residents were relived in terms of noise by RNP AR approaches. This dialogue will give guidance how the airport should act in the short term, in terms of permission for continuedhuse.

Project ID: VINGA Final Report Edition: 04.00 30 Nov 2011
Page 102 of 103
To permanently implement the newly developed routes, requires a modification of the current environmental permit. The airport is currently involved in an application process for a new environmental permit. One possibility is that RNP STARs followed by RNP AR approaches is included in the application for a new environmental permit. However, it is important to note that there are always unpredictable variables in an environmental process. Eleven municipalities around the airport, environmental authorities and neighbours are a part of the process and will have their saying if the airport proposal on a future system is acceptable. So, even if the ambition exist, there can never be guaranteed that the result is as desired from all parties.
Thanks to the VINGA project, Göteborg Landvetter Airport now have the knowledge needed, to best describe the environmental effects regarding implementation of RNP AR procedures, both in terms of noise and emissions for all relevant stakeholders.
Concerning the departure phase, the VINGA project has clearly shown that optimisation of the SID design is of vital importance, the result will be feed into national projects such as the Eco-fly project, with the high level objective to find optimised solutions for the future. The VINGA project has identified that an overview of the ICAO documentation regarding procedure design could be beneficial.
The VINGA project has shown that there are significant environmental benefits to be gained in the implementation of optimised PBN solutions, including best usage of the ICAO recommendations. In addition, using best practise throughout all phases of flight, and increased awareness amongst all stakeholders is vital for the best overall result.
It is the belief of the VINGA project that the achievements and associated results that have been accomplished by working in partnership will be of use for other airport operators, ANSPs, aviation industry and Airspace Users throughout Europe.
13.1 Final words The VINGA project would like to thank SJU for giving us the opportunity to execute the project. The Project Management would like to thank all involved personnel, for investing time and effort into this project. A special acknowledgement will be given to all ATCOs in Malmö ATCC, ATS Landvetter and participating Novair pilots for their knowledge, enthusiasm and commitment, which has contributed to the positive outcome of the project.

Project ID: VINGA Final Report Edition: 04.00 30 Nov 2011
Page 103 of 103
Figure 65: The Vinga lighthouse.
Above in Figure 65, is the famous lighthouse on the island of Vinga, in the archipelago, just west of Göteborg, Sweden. It is a common symbol, closely associated with the city. Göteborg is the biggest seaport of Scandinavia; many vessels have over the years navigated by the use of this lighthouse, representing the old fashioned way of navigation. In the VINGA project, the lighthouse was an inspirational symbol for the project.

VINGA-Final Report Appendix 1
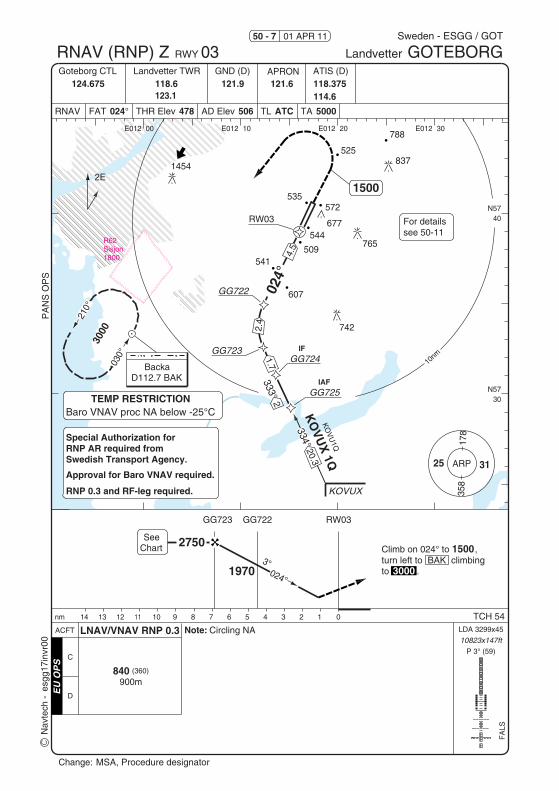
GG725
GG724GG723
GG722
KOVUX
10823x147ft
837
Sisjon1800
788
1454
677544
607
535
509
BackaD112.7 BAK
030°
210°
541
525
572
765
742
R62
RW03
20.3
334°
2333°
1.74.
5
2E
178
358
ARP
Change:
RWY 03P
AN
S O
PS
Nav
tech
-
GOTEBORGLandvetter
Sweden - ESGG / GOT01 APR 11
Goteborg CTL ATIS (D)GND (D)Landvetter TWR APRON
RNAV FAT ° THR Elev AD Elev TL TA
10nm
N5730
N5740
E012 00 E012 10 E012 20 E012 30
01234567891011121314nm
RW03GG722GG723
024°
3°
SeeChart Climb on 024° to ,
turn left to BAK climbingto .
Baro VNAV proc NA below -25°C
KO
VU
1Q
LDA 3299x45
P 3° (59)
FA
LS
TCH 54
2.4
For details
RNAV (RNP) Z
see 50-11
MSA, Procedure designator
3000
1500
IAF
024°
25
IF
50 - 7
124.675 118.6 121.9 121.6 118.375114.6123.1
024 478 506 ATC 5000
31
2750
1970
1500
3000
TEMP RESTRICTION
Special Authorization forRNP AR required from
Approval for Baro VNAV required.
RNP 0.3 and RF-leg required.
KO
VU
X 1QSwedish Transport Agency.
EU
OP
S
(360)
900m
Circling NAACFT
C
D
esgg
17in
vr00
840
Note:LNAV/VNAV RNP 0.3

GG650
GG495
GG496
GG497
GG498
OS
NA
K
10823x147ft
837
Sisjon1800
788
1454
677544
607
535
509
BackaD112.7 BAK
030°
541
525
572
765
742
R62
178
358
ARP10nm
Baro VNAV proc NA below -25°C
16.7337°
2
290° 4.1
3.4
4.3
OS
NA
1X
Change:
RWYP
AN
S O
PS
Nav
tech
-
GOTEBORGLandvetter
Sweden - ESGG / GOT01 APR 11
Goteborg CTL ATIS (D)GND (D)Landvetter TWR APRON
RNAV FAT ° THR Elev AD Elev TL TA
2E
LDA 3299x45
P 3° (56)
FA
LS
TCH 50
Climb on 204° to ,turn right to BAK climbingto .
3
N5730
N5740
E012 00 E012 10 E012 20 E012 30 E012 40
0 1 2 3 4 5 6 7 8 9 10 11 12 13 nm
GG498 GG497
204°
SeeChart
3°
RW21
RW21
21
For details
RNAV (RNP) Z
see 50-11
Renumbered, Procedure designator, MSA
3000
1500
204°
25 31
TEMP RESTRICTION
Special Authorization forRNP AR required from
Approval for Baro VNAV required.
RNP 0.3 and RF-leg required.
IAF
IF
OS
NA
K 1X
50 - 9
124.675 118.6 121.9 121.6 118.375114.6123.1
204 506 506 ATC 5000
1500
3000
2880
1500
Swedish Transport Agency.
EU
OP
S
(340)
800m
Circling NAACFT
C
D
esgg
19in
vr00
840
Note:LNAV/VNAV RNP 0.3

10823x147ft
GG753
GG752
GG751
GG750
LOBBI
837
Sisjon1800
788
1454
677544
607
535
509
BackaD112.7 BAK
030°
210°
541
525
572
765
742
R62
RW03
3.5
178
358
ARP10nm
Baro VNAV proc NA below -25°CFor detailssee 50-11
Change:
RWY 03P
AN
S O
PS
Nav
tech
-
GOTEBORGLandvetter
Sweden - ESGG / GOT01 APR 11
Goteborg CTL ATIS (D)GND (D)Landvetter TWR APRON
RNAV FAT ° THR Elev AD Elev TL TA
New
01234567891011121314nm
RW03GG750GG751
024°
3°See
ChartClimb on 024° to ,turn left to BAK climbingto .
LDA 3299x45
P 3° (59)
FA
LS
TCH 54
RNAV (RNP) Y
2E
N5730
N5740
E011 50 E012 00 E012 10 E012 20 E012 30
064°
051°
052°2.9
22.1
2
LOBI1Q
3000
1500
024°
25 31
TEMP RESTRICTION
Special Authorization forRNP AR required from
Approval for Baro VNAV required.
RNP 0.3 and RF-leg required.
Swedish Transport Agency.
50 - 8
124.675 118.6 121.9 121.6 118.375114.6123.1
024 478 506 ATC 5000
2240
1640
1500
3000
IAF
IF
LOBBI 1Q
EU
OP
S
(360)
900m
Circling NAACFT
C
D
esgg
18in
vr00
to be used by NOVAIR A321 only
840
Note:LNAV/VNAV RNP 0.3
TEST PROCEDURE

GG991
GG990
GG499
10823x147ft
LOBBI
837
Sisjon1800
788
1454
677544
607
535
509
030°
210°
541
525
572
765
742
R62
RW21
178
358
ARP
10nm
Baro VNAV proc NA below -25°C
For detailssee 50-11
2E
BackaD112.7 BAK
Change:
PA
NS
OP
SN
avte
ch -
GOTEBORGLandvetter
Sweden - ESGG / GOT
Goteborg CTL ATIS (D)GND (D)Landvetter TWR APRON
RNAV FAT ° THR Elev AD Elev TL TA
New
LDA 3299x45
P 3° (56)
FA
LS
TCH 50
Climb on 204° to ,turn right to BAK climbingto .
0 1 2 3 4 5 6 7 8 9 10 11 12 13 nm
GG499
204°
SeeChart
3°
RW21
MAX 225kt
045°
22.1
LOB
I1X
26.8
025°
402
5°
7.1
8.8
N5740
N5750
E011 50 E012 00 E012 10 E012 30
01 APR 11
RNAV (RNP) Y RWY 21
3000
25 31
TEMP RESTRICTION
Special Authorization forRNP AR required from
Approval for Baro VNAV required.
RNP 0.3 and RF-leg required.
Swedish Transport Agency.
150020
4°
IAF
124.675 118.6 121.9 121.6 118.375114.6123.1
204 506 506 ATC 5000
1500
3000
2830
IF
LOB
BI 1
X
50 - 10
EU
OP
S
(340)
800m
Circling NAACFT
C
D
esgg
20in
vr00
to be used by NOVAIR A321 only
840
Note:LNAV/VNAV RNP 0.3
TEST PROCEDURE

VINGA-Final Report Appendix 2

RNP AR procedure design based on meteorological history
Novair Flight Operations, 2010-06-07 Ulrika Ziverts Henrik Ekstrand
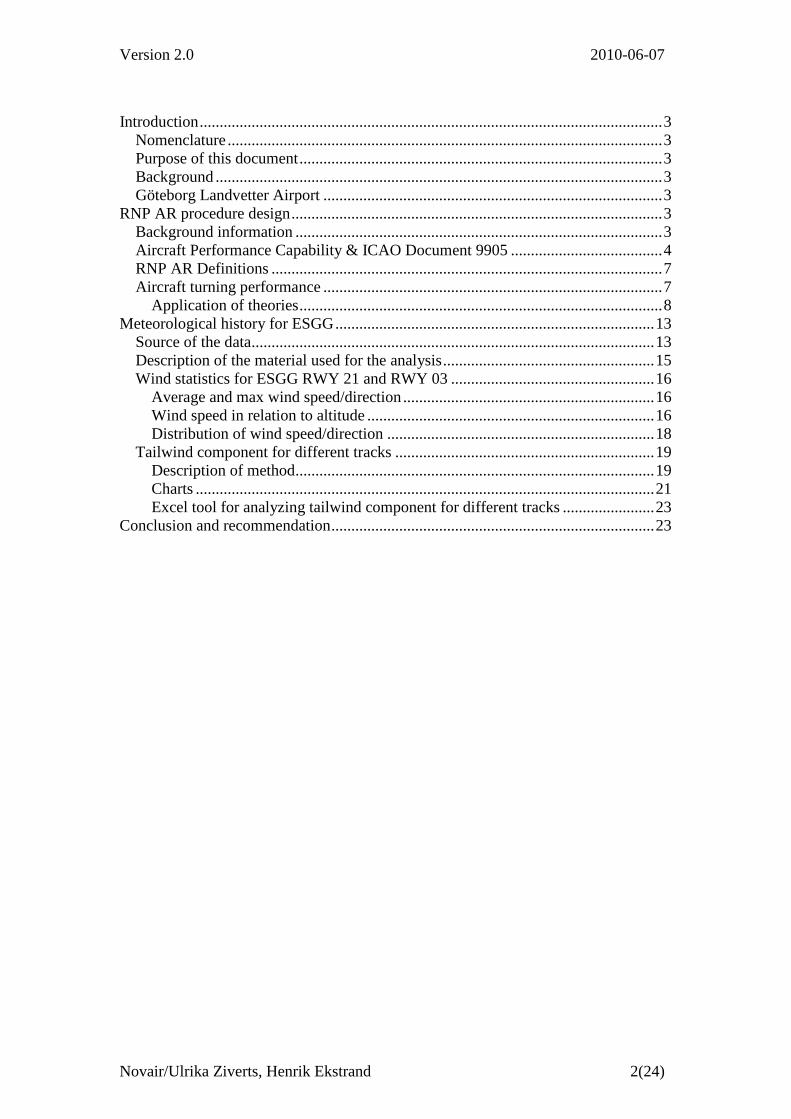
Version 2.0 2010-06-07
Novair/Ulrika Ziverts, Henrik Ekstrand 2(24)
Introduction .................................................................................................................... 3
Nomenclature ............................................................................................................. 3 Purpose of this document ........................................................................................... 3 Background ................................................................................................................ 3 Göteborg Landvetter Airport ..................................................................................... 3
RNP AR procedure design ............................................................................................. 3 Background information ............................................................................................ 3 Aircraft Performance Capability & ICAO Document 9905 ...................................... 4 RNP AR Definitions .................................................................................................. 7 Aircraft turning performance ..................................................................................... 7
Application of theories ........................................................................................... 8 Meteorological history for ESGG ................................................................................ 13
Source of the data ..................................................................................................... 13 Description of the material used for the analysis ..................................................... 15 Wind statistics for ESGG RWY 21 and RWY 03 ................................................... 16
Average and max wind speed/direction ............................................................... 16 Wind speed in relation to altitude ........................................................................ 16 Distribution of wind speed/direction ................................................................... 18
Tailwind component for different tracks ................................................................. 19 Description of method .......................................................................................... 19 Charts ................................................................................................................... 21 Excel tool for analyzing tailwind component for different tracks ....................... 23
Conclusion and recommendation ................................................................................. 23

Version 2.0 2010-06-07
Novair/Ulrika Ziverts, Henrik Ekstrand 3(24)
Introduction
Nomenclature ANSP Air Navigation Service Provider AP Auto Pilot ATM Air Traffic Management CO2 Carbon Dioxide FAA Federal Aviation Authorities FD Flight Director FRT Fixed Radius Transition ICAO International Civil Aviation Organisation MSL Mean Sea Level PBN Performance Based Navigation RNAV Area Navigation RNP Required Navigation Performance RWY Runway SESAR Single European Sky ATM Research Program
Purpose of this document The purpose of this document is to act as a support tool in the use of meteorological history (statistical winds) in the design of RNP AR procedures in general and in particular, the design of the RNP AR procedures Göteborg Landvetter Airport. Recommendations will be given at the end for specific wind values (direction and velocity) for the different approaches.
Background Novair has been involved in implementation of new RNP AR technology in Sweden. Some valuable experience has been gained in this new area of navigation. One of the key issues identified, is the need of efficient procedure design.
Göteborg Landvetter Airport The Göteborg Landvetter Airport (IATA code GOT/ICAO code ESGG) represents a typical small-medium European airport with a long single runway operation. Due to its location on the Swedish west coast, prevailing winds from the southwest are favouring operation on runway 21, which is used for approximately 80 % of all movements at the airport.
RNP AR procedure design
Background information ICAO document 9905 (Required Navigation Performance Authorization Required (RNP AR) Procedure Design Manual), is the applicable design document, first published by ICAO on the 15th of October 2009. By using document 9905 in the best possible manner for the development of new instrument approach procedures, aircraft RNP capability will be used to greatest extent possible, and a substantial increase in energy efficiency will be achieved, and less (aerodynamic) noise will be generated for

Version 2.0 2010-06-07
Novair/Ulrika Ziverts, Henrik Ekstrand 4(24)
each and every approach. If this approach design philosophy would be implemented systematically in a large scale, as seen from a European and global perspective, a substantial improvement will be achieved.
The RNP AR procedures are especially characterized by a curved flight path conducted with constant radius of the turn(s) with reference to ground, also known as RF legs, where RF stands for Radius Fix; the procedure designer has to calculate the turn radius based on the aircraft ground speed.
Section 3.2.2 of the ICAO document 9905 gives two possibilities how to calculate the aircraft ground speed, either by using an assumed 50 knots tail wind scenario down to 1500 feet or by using statistical winds. Historically, most procedure designers have used assumed winds for turn calculations. If this 50 knots wind scenario is used for tight aircraft turn calculations, most aircraft has to fly the approach in a dirty configuration, i.e. with flaps and slats extended for an extended period of time, to keep the ground speed low and comply with the speed restrictions. This will generate more noise from the over flying aircraft and is more fuel demanding. A lot of the savings being achieved with implementation of any new technology regarding the approach phase can easily be eaten up by inefficient approach procedure design. It is very important that the design of the instrument approaches procedures is optimised and based on more realistic assumptions, i.e. local historical wind statistics.
It is of utmost importance that the notion of ‘wind-optimised’ RNP procedures is introduced at an early stage in the just starting PBN implementation phase throughout Europe and the rest of the world. This will, from the very beginning on, attract the attention of ANSPs to take full advantage of latent optimisation potential previewed in the regulations. By avoiding the usage of over-conservative assumptions, additional track mile savings can be obtained, which will cumulate to impressive fuel and CO2 savings over the years when the procedure is applied for ten-thousands of approaches.
This document will explain one particularly case, where historical meteorological data has been collected, how this data can be interpreted and implemented in the design of RNP AR procedures, and thoroughly cover aircraft performance characteristics in conjunction with the airborne safety nets required to conduct these approaches.
Aircraft Performance Capability & ICAO Document 9905 One of the pillar stones in the future navigation of aircraft is the implementation of PBN. This is identified by key organisations such as the ICAO, FAA, Eurocontrol and the SESAR program. The PBN concept is the broad term used to describe the technologies that allow aircraft to fly flexible, accurate, three dimensional flight paths using onboard equipment and capabilities. PBN specifies aircraft RNAV system performance requirements in terms of accuracy, integrity, availability, continuity and functionality needed for the proposed operations in the context of a particular airspace concept. The PBN concept represents a shift from ground based to on board performance-based navigation. Performance requirements are identified in navigation specifications, which also identify the choice of navigation sensors and equipment that may be used by the airspace user to meet the performance requirements.
Simplified, it can be stated that the big difference between RNAV and RNP operation is the requirement of onboard monitoring and alerting. In general, the performance monitoring and alerting capabilities may be provided in different forms depending on the system installation, architecture and configurations, including:

Version 2.0 2010-06-07
Novair/Ulrika Ziverts, Henrik Ekstrand 5(24)
display and indication of both the required and the estimated navigation system performance;
monitoring of the system performance and alerting the crew when RNP requirements are not met; and
cross track deviation displays scaled to RNP, in conjunction with separate monitoring and alerting for navigation integrity.
The inability to achieve the required lateral navigation accuracy may be due to navigation errors related to aircraft tracking and positioning. The three main errors in the context of on-board performance monitoring and alerting are Path Definition Error (PDE), Flight Technical Error (FTE), and Navigation System Error (NSE).The Total System Error (TSE) is defined as follows:
PDE occurs when the path defined in the RNAV system does not correspond
to the desired path, i.e. the path expected to be flown over the ground. The PDE has been demonstrated negligible, provided there is no systematic error such as navigation database coding error or error due to inadequate geodesic reference (other than WGS84).
The FTE is a characteristic of the pilot performance using FD or the AP guidance performance in the steering of the aircraft on the FMGS defined flight path.
The NSE is the error made by the navigation system in the computation of the aircraft position. The NSE has a circular statistical distribution around the aircraft true position. From this circular distribution, it is possible to derive a cross-track component of the NSE, which is relevant for the RNP lateral navigation.
( ) ( ) ( )222 PDENSEFTETSE ++=
( ) ( ) ( ) ( ) ( )22222 NSEFTEPDENSEFTETSE +≈++=

Version 2.0 2010-06-07
Novair/Ulrika Ziverts, Henrik Ekstrand 6(24)
The following table is an extract from the ICAO PBN Manual Document 9613, illustrating the effect of on-board performance monitoring and alerting on TSE in regard of RNAV and RNP operation. Error Source RNAV
Specifications RNP specifications
RNP X specification not requiring RF or FRT
RNP X specification requiring RF or FRT
NSE (monitoring and alerting)
NSE only observed by pilot cross-checks; no alerting on position error.
Alerting on position accuracy and integrity.
FTE (monitoring)
Managed by on-board system or crew procedure.
Managed by on-board system or crew procedure.
PDE (monitoring )
Generally negligible; the desired path is not defined on fly-by, fly-over, and conditional turns.
Generally negligible; path defined on RF and FRT.
NET EFFECT ON TSE
TSE distribution not bounded. In addition, the wide variation in turn performance results in need for extra protection on turns.
TSE distribution bounded, but extra protection of the route needed on turns;
TSE distribution bounded; no extra protection of the route needed on turns if turns defined by RF or FRT.
E.g., if the Navigation System Error (NSE) is exceeding the applicable RNP value, it will generate a warning in the cockpit, followed by standardised cockpit procedures. The PBN concept covers different performance criteria’s of the airborne equipment. The least demanding procedures are straight-in RNAV approaches with or without a specified RNP value. The next step on the PBN performance scale is RNP AR procedures, also known as curved approaches, based on GNSS technology, where ICAO document 9905, “Required Navigation Performance Authorization Required (RNP AR) Procedure Design Manual” is the applicable approach design document. In Europe, there is a very limited number of RNP AR approaches at the moment. The first procedure introduced was designed for Innsbruck Airport in Austria, based on local regulations. The second RNP AR approach in Europe was published at Stockholm Arlanda airport during 2009, based on ICAO document 9905. This was the procedure that was used during the AIRE I project MINT. The beauty of RNP AR technology is the possibility for flight track shortening and/or over flying noise sensitive areas.

Version 2.0 2010-06-07
Novair/Ulrika Ziverts, Henrik Ekstrand 7(24)
RNP AR Definitions The general definitions of RNP AR approaches are as follows: RNP values ≤ 0.3 NM and/or Curved flight path before and after the Final Approach Point (FAP).
Protections areas laterally limited to 2·RNP value without any additional buffer.
These procedures are always designed to be flown with barometric vertical navigation, (baro-VNAV) capability.
Since the curved flight path is conducted with constant radius of the turn(s), also known as RF legs, where RF stands for Radius Fix, the procedure designer has to calculate the turn radius based on ground speed. The ground speed is the true airspeed of the aircraft plus a tailwind. Please note that the tailwind can be negative, i.e. being a headwind.
Aircraft turning performance The following section will illustrate the theory behind aircraft performance during turning flight and putting it into content with the ICAO document 9 905, special attentions will be put on the Airbus aircraft family capability during turning flight. The figure below illustrates a turning aircraft as seen from behind. There are two forces affecting the aircraft performance during turn, Lift and Weight.

Version 2.0 2010-06-07
Novair/Ulrika Ziverts, Henrik Ekstrand 8(24)
φ yLL
xL
mgW =
The following definitions are used:
RadiusRmgweightAircraftW
componentliftHorizontalL
componentliftVerticalLLiftL
anglebank
x
y
===
==
−=
)(
φ
By assuming steady level flight, the following equations are valid by the use of Newton’s second law:
)3(tan
tan
tansincos
sincos)2(&)1(
)2(sinsin
)1(coscos
2
22
2
2
φ
φ
φφφ
φφ
φφ
φφ
gRV
gRV
gV
gLVLR
VRL
gLm
RVmLL
LL
mgLLL
L
xx
yy
=
=
⇔==
⇒==⇒
==⇒=
==⇒=
Application of theories Bank-angle margin in procedure design For a given radius (R) and a maximum bank-angle (Φ), there is a maximum speed (V). This speed is True Airspeed (TAS) + wind, i.e. ground speed.
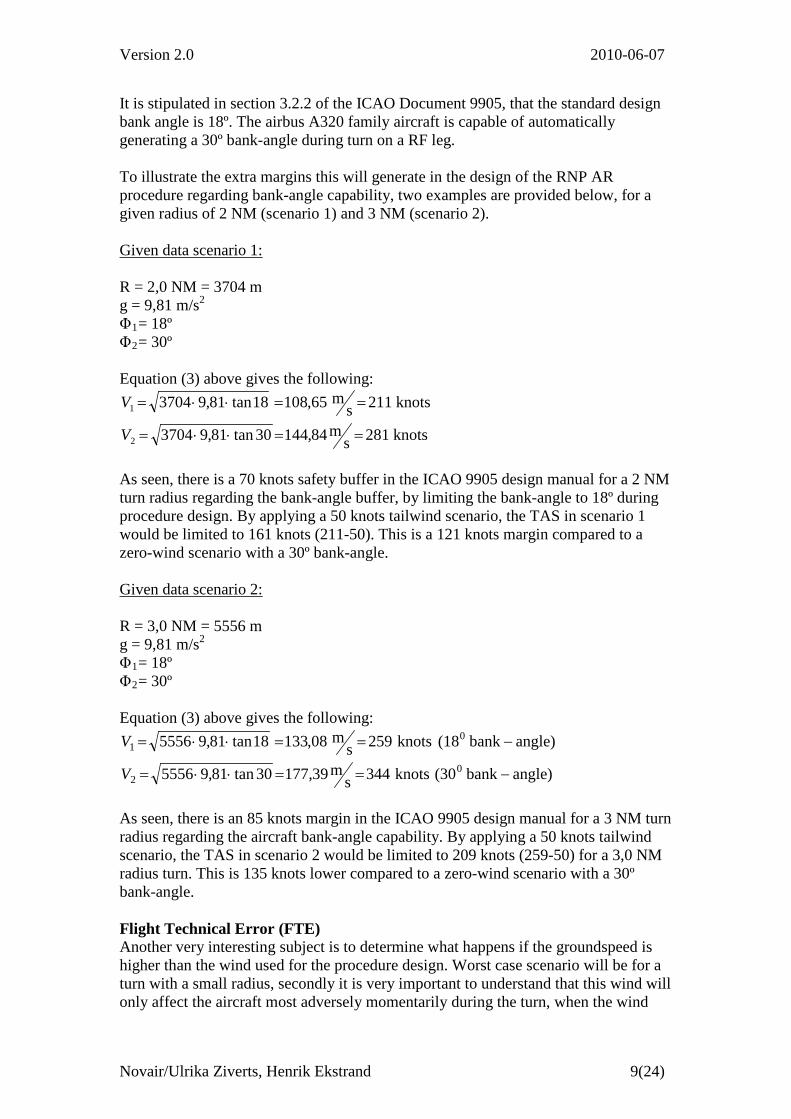
Version 2.0 2010-06-07
Novair/Ulrika Ziverts, Henrik Ekstrand 9(24)
It is stipulated in section 3.2.2 of the ICAO Document 9905, that the standard design bank angle is 18º. The airbus A320 family aircraft is capable of automatically generating a 30º bank-angle during turn on a RF leg. To illustrate the extra margins this will generate in the design of the RNP AR procedure regarding bank-angle capability, two examples are provided below, for a given radius of 2 NM (scenario 1) and 3 NM (scenario 2). Given data scenario 1: R = 2,0 NM = 3704 m g = 9,81 m/s2
Φ1= 18º Φ2= 30º Equation (3) above gives the following:
knots281sm84,14430tan81,93704
knots211sm65,10818tan81,93704
2
1
==⋅⋅=
==⋅⋅=
V
V
As seen, there is a 70 knots safety buffer in the ICAO 9905 design manual for a 2 NM turn radius regarding the bank-angle buffer, by limiting the bank-angle to 18º during procedure design. By applying a 50 knots tailwind scenario, the TAS in scenario 1 would be limited to 161 knots (211-50). This is a 121 knots margin compared to a zero-wind scenario with a 30º bank-angle. Given data scenario 2: R = 3,0 NM = 5556 m g = 9,81 m/s2
Φ1= 18º Φ2= 30º Equation (3) above gives the following:
)anglebank(30knots344sm39,17730tan81,95556
)anglebank(18 knots259sm08,13318tan81,95556
02
01
−==⋅⋅=
−==⋅⋅=
V
V
As seen, there is an 85 knots margin in the ICAO 9905 design manual for a 3 NM turn radius regarding the aircraft bank-angle capability. By applying a 50 knots tailwind scenario, the TAS in scenario 2 would be limited to 209 knots (259-50) for a 3,0 NM radius turn. This is 135 knots lower compared to a zero-wind scenario with a 30º bank-angle. Flight Technical Error (FTE) Another very interesting subject is to determine what happens if the groundspeed is higher than the wind used for the procedure design. Worst case scenario will be for a turn with a small radius, secondly it is very important to understand that this wind will only affect the aircraft most adversely momentarily during the turn, when the wind

Version 2.0 2010-06-07
Novair/Ulrika Ziverts, Henrik Ekstrand 10(24)
component is coming in a direction of 180º from the flight path trajectory (i.e. pure tailwind). By using a 50 knots tailwind scenario, the wind is constantly changing direction along the flight path. This scenario does not correspond very well to a typical real life scenario. The figures below, illustrates these scenarios:
Left hand circuit ESGG, 50 knops tailwind
2NM
2NM
Left hand circuit ESGG, statistical winds

Version 2.0 2010-06-07
Novair/Ulrika Ziverts, Henrik Ekstrand 11(24)
The RNP value for limited RNP AR approaches is set to 0,3 NM. Assume that a turn is calculated with a radius of 2 NM and a given speed V. The following two scenarios will show what margins are included in the design procedure of the procedure. In addition, it is very important to understand that the obstacle clearance is based on two times the applicable RNP value.
Scenario 3 will show the difference in speed ΔV to conduct a turn with a radius of 2 NM plus the given RNP value (0,3 NM) and a bank-angle of 18º, i.e. which speed will generate a turn with a given radius of 2,3 NM.
R
R + RNP
R + 2RNP
Scenario 4 will show the aircraft capability to handle a scenario with a very strong wind, i.e. a bank-angle of 30° will be used to perform a turn with a radius of 2,3 NM.

Version 2.0 2010-06-07
Novair/Ulrika Ziverts, Henrik Ekstrand 12(24)
Given data scenario 3: R = 2,3 NM = 4260 m g = 9,81 m/s2
Φ3= 18º angle)-bank(18knots227s
m53,11618tan81,94260 03 ==⋅⋅=V
Previously, in scenario 1, it was shown that V1 = 211 knots, thus to maintain an RNP value of 0,3 NM, a wind error of ΔV = 16 knots (227-211) can be accepted to maintain a radius of 2,3 NM for a given bank-angle of 18°. Given data scenario 4: R = 2,3 NM = 4260 m g = 9,81 m/s2
Φ3= 30º angle)-bank(30knots302s
m33,15530tan81,94260 04 ==⋅⋅=V
To maintain a given RNP value of 0,3 NM in a turn with a radius of 2,0 NM, i.e. to keep a radius of 2,3 NM and taking the aircraft bank-angle capability into account, a wind error of 91 knots (302-211) can be accepted. Scenario 3 & 4 can be summarised as follows:
Bank angle Radius [NM]
Ground speed [knots]
ΔV (wind error) [knots]
18° 2,0 211 N/A
18 ° 2,3 227 16
30 ° 2,3 302 91

Version 2.0 2010-06-07
Novair/Ulrika Ziverts, Henrik Ekstrand 13(24)
Meteorological history for ESGG
Source of the data The meteorological data and statistics presented in this document are based on 10 years of weather balloon data (soundings) from Göteborg Landvetter Airport, conducted by the Swedish Meteorological and Hydrological Institute (SMHI). This data is available to the public on the University of Wyoming web site and can be downloaded in the form of text files.
Weather balloons are sent up daily, providing on average 54 recordings each, between the surface and approximately 21000 meters altitude. The following is an extract from one of the downloaded files and shows the layout of the data and which parameters are available:

Version 2.0 2010-06-07
Novair/Ulrika Ziverts, Henrik Ekstrand 14(24)
In the text files, following the meteorological data for each recorded altitude, there is a section containing some general information on the specific sounding. The following is an example of the general information associated with each sounding:
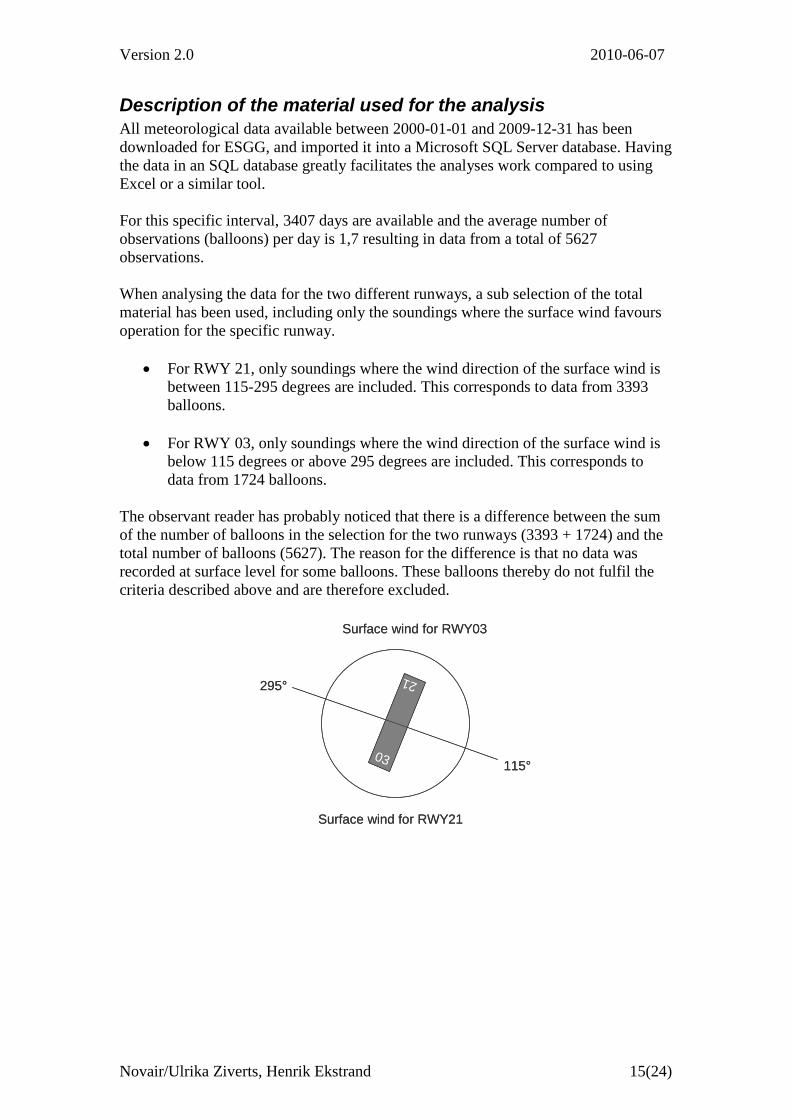
Version 2.0 2010-06-07
Novair/Ulrika Ziverts, Henrik Ekstrand 15(24)
Description of the material used for the analysis All meteorological data available between 2000-01-01 and 2009-12-31 has been downloaded for ESGG, and imported it into a Microsoft SQL Server database. Having the data in an SQL database greatly facilitates the analyses work compared to using Excel or a similar tool. For this specific interval, 3407 days are available and the average number of observations (balloons) per day is 1,7 resulting in data from a total of 5627 observations. When analysing the data for the two different runways, a sub selection of the total material has been used, including only the soundings where the surface wind favours operation for the specific runway.
• For RWY 21, only soundings where the wind direction of the surface wind is between 115-295 degrees are included. This corresponds to data from 3393 balloons.
• For RWY 03, only soundings where the wind direction of the surface wind is
below 115 degrees or above 295 degrees are included. This corresponds to data from 1724 balloons.
The observant reader has probably noticed that there is a difference between the sum of the number of balloons in the selection for the two runways (3393 + 1724) and the total number of balloons (5627). The reason for the difference is that no data was recorded at surface level for some balloons. These balloons thereby do not fulfil the criteria described above and are therefore excluded.
03
21
115°
295°
Surface wind for RWY21
Surface wind for RWY03
03
21
115°
295°
Surface wind for RWY21
Surface wind for RWY03

Version 2.0 2010-06-07
Novair/Ulrika Ziverts, Henrik Ekstrand 16(24)
Wind statistics for ESGG RWY 21 and RWY 03
Average and max wind speed/direction Below, is the collected data presented, in accordance with the previous assumptions. ESGG RWY 03 (elevation 164 m)
MSL (m) MSL (ft) Average wind direction (deg)
Average wind direction speed (knots)
Max wind (deg/knots) No of records
164-316 538-1038 120 6 270/42 4057 317-469 1038-1538 129 16 315/43 1241 469-621 1538-2038 129 18 270/56 1127 622-774 2038-2538 134 18 100/51 1594 774-926 2538-3038 131 16 106/55 1559 926-1078 3038-3538 128 17 274/67 871 1079-1231 3538-4038 140 17 275/71 862 1231-1382 4538-5038 157 17 275/71 1217 1382-1536 5038-5538 146 15 280/73 1718 1536-1688 5538-6038 151 15 164/49 1143 ESGG RWY 21 (elevation 164 m)
MSL (m) MSL (ft) Average wind direction (deg)
Average wind speed (knots)
Max wind (deg/knots) No of records
164-316 538-1038 209 8 245/45 6727 317-469 1038-1538 218 18 275/52 2220 469-621 1538-2038 226 21 210/54 2142 622-774 2038-2538 232 21 280/61 3294 774-926 2538-3038 230 19 270/71 2793 926-1078 3038-3538 235 21 275/69 1699 1079-1231 3538-4038 233 21 234/69 1753 1231-1382 4538-5038 235 22 235/75 2465 1382-1536 5038-5538 233 20 270/66 3444 1536-1688 5538-6038 228 19 294/71 1954
Wind speed in relation to altitude As seen in the tables above, there is a distinct increase in the average wind speed from the surface to an altitude of 1000 - 1500 ft MSL. Above that altitude, the average wind speed is approximately constant up to 6000 ft MSL. The below charts, displaying the distribution of wind speed in relation to altitude for RWY 21 and RWY 03, supports these figures. Each dot in the charts represents the average wind speed at the corresponding altitude when the surface wind favours operation for the respective runway.

Version 2.0 2010-06-07
Novair/Ulrika Ziverts, Henrik Ekstrand 17(24)
Wind speed in relation to altitude RWY21
05
101520253035404550
0 500 1000 1500 2000 2500 3000
Altitude MSL (m)
Aver
age
win
d sp
eed
(kt)
Wind speed in relation to altitude RWY03
05
101520253035404550
0 500 1000 1500 2000 2500 3000
Altitude MSL (m)
Aver
age
win
d sp
eed
(kt)

Version 2.0 2010-06-07
Novair/Ulrika Ziverts, Henrik Ekstrand 18(24)
Distribution of wind speed/direction The following figures illustrate the distribution of wind speed/direction in the material for the respective runways. Each wind reading between 2 500 – 3 500 ft MSL is represented by a blue dot in the chart. On the horizontal x-axis, wind direction is displayed and on the vertical y-axis, wind speed. The red dot represents the average condition.
Wind speed/direction at 2500-3500 ft MSLSurface wind for RWY21
0
10
20
30
40
50
60
70
80
0 50 100 150 200 250 300 350
Wind direction (deg)
Win
d sp
eed
(kt)
Distribution Average
As expected, when the surface wind favours operation on RWY 21, the most common wind direction is from the south-east (the most densely blue area in the chart), due to prevailing south westerly winds on the Swedish west coast. In addition, the figure displays that there occasionally are north-easterly winds. However, when there are north-easterly winds, the wind speed is a lot lower than when it blows from the south-west.
Wind speed/direction at 2500-3500 ft MSLSurface wind for RWY03
0
10
20
30
40
50
60
70
80
0 50 100 150 200 250 300 350
Wind direction (deg)
Win
d sp
eed
(kt)
Distribution Average

Version 2.0 2010-06-07
Novair/Ulrika Ziverts, Henrik Ekstrand 19(24)
When the surface winds favour operation on RWY 03, the wind at 2500-3500 ft MSL usually blows from the sector north to north-east. Comparing this chart with the chart for RWY 21, it can be noted that the distribution of wind speed is “flatter” than for RWY 21, which is more shaped like a peak. The conclusion that can be drawn from this is that when there are very strong winds, the surface wind usually favours operation on RWY 21 and the wind direction at 2500-3500 ft MSL is usually south-easterly to easterly.
Tailwind component for different tracks
Description of method The tailwind component is of interest when looking at historical winds for procedure design. To be able to analyze this aspect in the very large material of individual wind readings, we have processed the data and created two tables 1(one for RWY 21 and one for RWY 03) where we have calculated the tailwind component for each wind reading in the material for all 360 possible tracks. Consequently, the tables contain all individual wind readings for the respective runway, and for each wind reading; 360 rows, each representing one track. For each row, the effective tailwind component for that specific track is stored, together with the original wind speed and wind direction (for traceability purposes). The below picture is a small extract from this table, showing the calculated tailwind component for track 001 for some of the wind recordings in the material.
To calculate the tailwind component for a specific track and a specific wind, some basic trigonometry is applied. The following figure illustrates the applicable theory:
1 In a database, information is stored in tables. A table consists of columns and rows and can be compared with information stored in an Excel work sheet.

Version 2.0 2010-06-07
Novair/Ulrika Ziverts, Henrik Ekstrand 20(24)
WΘ
VspeedWind ,
CWV
TWV
TΘ
090+ΘT
0180−ΘW
0180−Θ−Θ TW
trackAircraft
The following nomenclature is used:
componentCrosswindV
componentTailwindVdirectionWind
trackAircraft
CW
TW
W
T
=
==Θ
=Θ
By using trigonometric functions and some basic algebra the following equation applies:
( ) ( )00 180cos180cos −Θ−Θ⋅=⇒−Θ−Θ= TWTWTWTW VVV
V
What the above equation states is that the tailwind component for a specific wind is given by multiplying the wind speed with cosine for the wind angle of incidence - 180°. Based on the two tables containing the tailwind component for each wind reading and possible track, the information has been processed one step further. The result is a list where, for each track and tailwind component, the number of times this combination
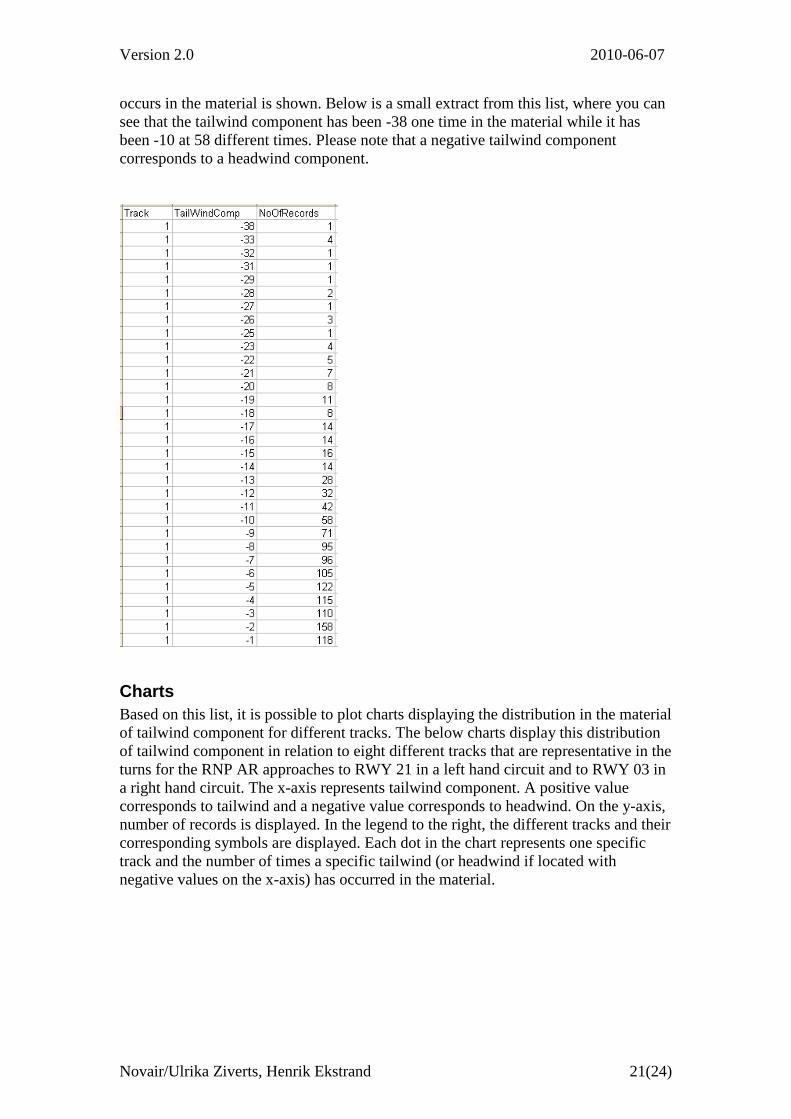
Version 2.0 2010-06-07
Novair/Ulrika Ziverts, Henrik Ekstrand 21(24)
occurs in the material is shown. Below is a small extract from this list, where you can see that the tailwind component has been -38 one time in the material while it has been -10 at 58 different times. Please note that a negative tailwind component corresponds to a headwind component.
Charts Based on this list, it is possible to plot charts displaying the distribution in the material of tailwind component for different tracks. The below charts display this distribution of tailwind component in relation to eight different tracks that are representative in the turns for the RNP AR approaches to RWY 21 in a left hand circuit and to RWY 03 in a right hand circuit. The x-axis represents tailwind component. A positive value corresponds to tailwind and a negative value corresponds to headwind. On the y-axis, number of records is displayed. In the legend to the right, the different tracks and their corresponding symbols are displayed. Each dot in the chart represents one specific track and the number of times a specific tailwind (or headwind if located with negative values on the x-axis) has occurred in the material.

Version 2.0 2010-06-07
Novair/Ulrika Ziverts, Henrik Ekstrand 22(24)
Tailwind component at 2500-3500 ft MSL for different tracksSurface wind for RWY21 Gör om med nya siffror
0
50
100
150
200
250
300
-80 -60 -40 -20 0 20 40 60
Tailwind component (kt)
No
of re
cord
s
Track 270Track 260Track 250Track 240Track 230Track 220Track 210Track 200
As can be seen in the chart for RWY 21, the most common tailwind component for the displayed tracks is around -15 (the peak of the distribution). Since it is a negative value, it actually corresponds to 15 knots headwind. This corresponds well to the prevailing wind scenario, with winds out of the south-west. There are some dots to the right of 0 on the x-axis. These dots represent tailwind on the corresponding tracks. As seen, the further to the right you get in the chart the less frequent is the occurrence in the collected meteorological material. E.g. for a track of 270º, a tailwind component of 10 knots has occurred at 8 times during 10 years.

Version 2.0 2010-06-07
Novair/Ulrika Ziverts, Henrik Ekstrand 23(24)
Tailwind component at 2500-3500 ft MSL for different tracksSurface wind for RWY03 gör om med nya siffror
0
20
40
60
80
100
120
140
160
-60 -40 -20 0 20 40 60
Tailwind component (kt)
No
of re
cord
s
Track 330Track 340Track 350Track 360Track 010Track 020Track 040
As expected, when the surface winds favour RWY 03, it is much more common with a tailwind component during the tracks of the last turn on to the final.
Excel tool for analyzing tailwind component for different tracks The Excel file “TailWindCompTool.xsl” contains the processed data on tailwind component for different tracks for both runways at ESGG. The idea of this excel file is to make it simple to analyse and create charts for different scenarios. The information for the two runways can be found on the tabs “TW RWY21” and “TW RWY03”. The tabs “TW RWY21 Chart” and “TW RWY03 Chart” contain charts similar to the two charts above but display the distribution for the track selected through the auto filter on the corresponding tab containing the data.
Conclusion and recommendation Based on the discussions previously in this document, it can be questioned if wind has to be considered for the RNP AR 0.3 procedure design at all. The safety margins are in the magnitude of approximately 90 knots regarding ground speed error. In addition, RNP AR approval requires that there is an onboard alerting system and associated procedures. However, at present, there are only two options where the wind must be taken into account. Novair therefore encourages the use of statistical wind data for the procedure design of the new RNP AR procedures to ESGG. Our recommendation is that the average wind for the respective runway is used i.e.:
• For RWY 03: 135 º /17 knots • For RWY 21: 230 º /20 knots

Version 2.0 2010-06-07
Novair/Ulrika Ziverts, Henrik Ekstrand 24(24)
There are safety nets included in the procedure design. These are related to the 18º bank angle limitation, the possibility to allow the FTE to increase to the RNP value. Last but not least, there is a requirement for onboard alerting and monitoring, if the required RNP value is exceeded. If the actual wind is greater than the wind speed used for the procedure design, there is a 91 knots safety margin in the aircraft performance capability for a turn with a 2 NM radius and a FTE is taken into account. This will cover all relevant wind scenarios with a great margin. In addition, the aircraft will only be exposed to the maximum tailwind momentarily. Please note that the safety margin is even greater if the turn radius is increased. If statistical winds can prevent speed constraints from being applied to a RNP AR procedure, fuel savings will be obtained; typically the magnitude will be in the order of 50 -75 kg per approach, corresponding to 160 – 240 kg of CO2. In addition, noise will be minimised, since the aircraft is not forced to fly the approach at extended periods in a non optimised aircraft configuration, with flaps and slats extended. The overall potential is tremendous, when the RNP AR approaches are implemented and used for thousands of times.

VINGA-Final Report Appendix 3

Ref: QVS110308002
Date: April, 4th 2011
Version: 1 Revision: 0
Page 1 of 23
QUOVADIS Société par Actions Simplifiée Unipersonnelle Au capital de 2 000 000 € Inscrite sous le N° 511 007 312 RCS TOULOUSE Dont le siège social est 17, Av. Didier Daurat – BP 10051 Immeuble Socrate 31702 Blagnac Cedex ‐ France
280
GOTEBORG RNP AR and RNP‐ILS procedures
VINGA project ‐ NOVAIR
A321 Aircraft
QUOVADIS
17, avenue Didier Daurat – BP 10051 immeuble Socrate
31702 Blagnac Cedex, France.
Tel: +33 5 67 31 00 00
Fax: +33 5 67 31 00 05

VINGA - GOTEBORG RNP AR / RNP-ILS
Ref: QVS110308002
Date: April, 4th 2011
Version: 1 Revision: 1
Page 2 of 23
QUOVADIS Société par Actions Simplifiée Unipersonnelle Au capital de 2 000 000 € Inscrite sous le N° 511 007 312 RCS TOULOUSE Dont le siège social est 17, Av. Didier Daurat – BP 10051 Immeuble Socrate 31702 Blagnac Cedex – France
©QUOVADIS PROPRIETARY AND CONFIDENTIAL INFORMATION. Shall not be disclosed to any other party than permitted recipient.
TABLE OF CONTENTS
TABLE OF CONTENTS .......................................................................................................................................... 2
1 PURPOSE ................................................................................................................................................... 4
2 VALIDATION SCENARIO .............................................................................................................................. 4
2.1 SCOPE ............................................................................................................................................................. 4 2.1.1 Procedures ............................................................................................................................................... 4 2.1.2 Aircraft ..................................................................................................................................................... 4 2.1.3 Environmental Conditions ........................................................................................................................ 4
2.1.3.1 Wind : .............................................................................................................................................................. 4 2.1.3.2 Temperature ................................................................................................................................................... 5
2.1.4 Weight ..................................................................................................................................................... 5 2.1.5 Navigation Database Base (NDB) ............................................................................................................ 5 2.1.6 Engine failure ........................................................................................................................................... 5
3 VALIDATION OUTPUTS / RECOMMENDATIONS .......................................................................................... 5
3.1.1 NDB Coding .............................................................................................................................................. 5 3.1.2 Flyability ................................................................................................................................................... 5 3.1.3 Remark/recommendation ........................................................................................................................ 6
3.1.3.1 APP RNAV(RNP) y RWY 03 ............................................................................................................................... 6 3.1.3.2 APP RNAV(RNP) y RWY 21 ............................................................................................................................... 7 3.1.3.3 STAR OSNAK 1W + APP ILS 21 ......................................................................................................................... 8
4 CONCLUSION ............................................................................................................................................. 9
APPENDIX I. ACRONYMS .............................................................................................................................. 10
APPENDIX II. PROCEDURES CHARTS ............................................................................................................... 11
APPENDIX III. STAR OSNAK1W TO ILS21 TRANSITION: SIMULATOR PARAMETERS ...................................... 17
APPENDIX IV. APP RNAV(RNP) Y RWY 21 : BANK ANGLE ............................................................................. 18
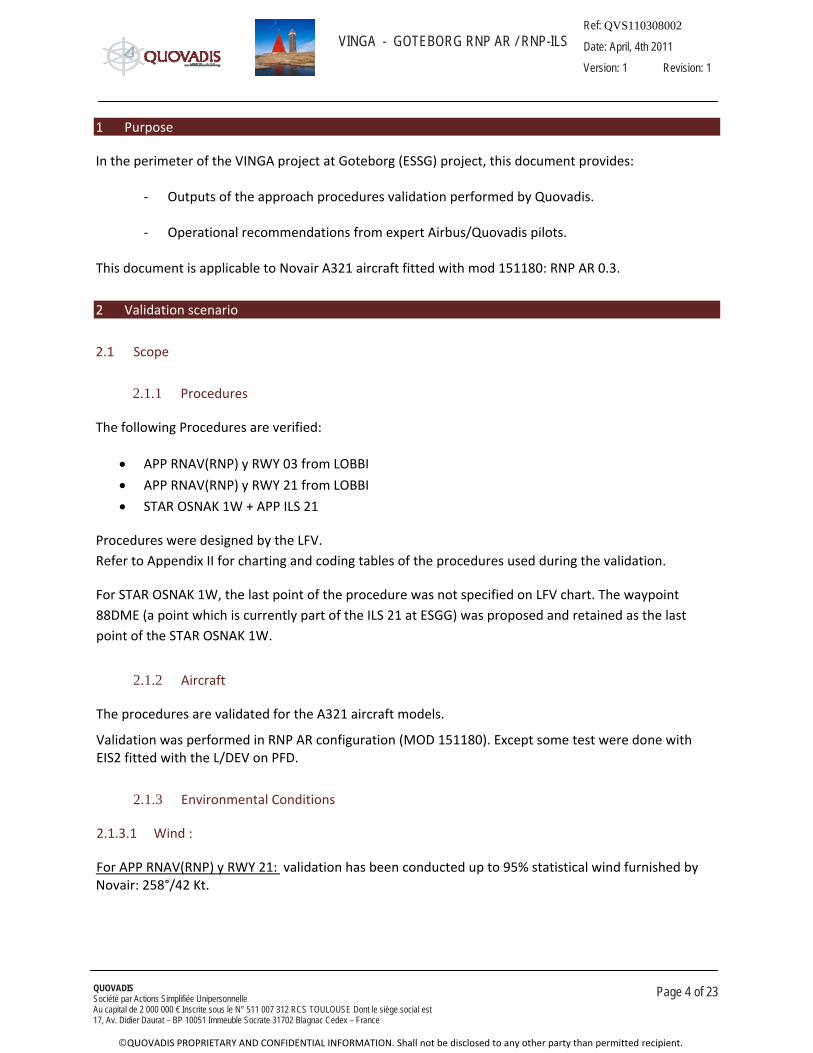
VINGA - GOTEBORG RNP AR / RNP-ILS
Ref: QVS110308002
Date: April, 4th 2011
Version: 1 Revision: 1
Page 4 of 23
QUOVADIS Société par Actions Simplifiée Unipersonnelle Au capital de 2 000 000 € Inscrite sous le N° 511 007 312 RCS TOULOUSE Dont le siège social est 17, Av. Didier Daurat – BP 10051 Immeuble Socrate 31702 Blagnac Cedex – France
©QUOVADIS PROPRIETARY AND CONFIDENTIAL INFORMATION. Shall not be disclosed to any other party than permitted recipient.
1 Purpose
In the perimeter of the VINGA project at Goteborg (ESSG) project, this document provides:
‐ Outputs of the approach procedures validation performed by Quovadis.
‐ Operational recommendations from expert Airbus/Quovadis pilots.
This document is applicable to Novair A321 aircraft fitted with mod 151180: RNP AR 0.3.
2 Validation scenario
2.1 Scope
2.1.1 Procedures
The following Procedures are verified:
• APP RNAV(RNP) y RWY 03 from LOBBI
• APP RNAV(RNP) y RWY 21 from LOBBI
• STAR OSNAK 1W + APP ILS 21
Procedures were designed by the LFV. Refer to Appendix II for charting and coding tables of the procedures used during the validation.
For STAR OSNAK 1W, the last point of the procedure was not specified on LFV chart. The waypoint 88DME (a point which is currently part of the ILS 21 at ESGG) was proposed and retained as the last point of the STAR OSNAK 1W.
2.1.2 Aircraft
The procedures are validated for the A321 aircraft models.
Validation was performed in RNP AR configuration (MOD 151180). Except some test were done with EIS2 fitted with the L/DEV on PFD.
2.1.3 Environmental Conditions
2.1.3.1 Wind :
For APP RNAV(RNP) y RWY 21: validation has been conducted up to 95% statistical wind furnished by Novair: 258°/42 Kt.

VINGA - GOTEBORG RNP AR / RNP-ILS
Ref: QVS110308002
Date: April, 4th 2011
Version: 1 Revision: 1
Page 5 of 23
QUOVADIS Société par Actions Simplifiée Unipersonnelle Au capital de 2 000 000 € Inscrite sous le N° 511 007 312 RCS TOULOUSE Dont le siège social est 17, Av. Didier Daurat – BP 10051 Immeuble Socrate 31702 Blagnac Cedex – France
©QUOVADIS PROPRIETARY AND CONFIDENTIAL INFORMATION. Shall not be disclosed to any other party than permitted recipient.
For APP RNAV(RNP) y RWY 03: validation has been conducted up : 300°/40 Kt. (300° has been retained as the most constraining direction for the turn and 40kt based on 95% statistical wind furnished by Novair for track between 225° and 294°). Note: Aircraft is less sensitive to wind effect on large turn radius.
For STAR OSNAK 1W: validation has been conducted up to a wind intensity of 30Kts (tailwind component for IAS at 210 Kt and bank angle of 20°). Various wind direction were tested to evaluate in particular impact on early LOC guidance mode arming.
2.1.3.2 Temperature
For STAR OSNAK 1W + APP ILS, temperature down to ISA‐40° was tested to evaluate impact on G/S guidance mode capture.
2.1.4 Weight
Weight up to 75T were tested, in line with Novair operations.
2.1.5 Navigation Database Base (NDB)
Novair extra cycle NOV 1110102 was used for the validation.
A pre check of the NDB was done based on pdf extract of the NDB.
2.1.6 Engine failure
One Engine Inoperative scenarios were tested in adverse conditions (maximum wind; during turn; engine inoperative opposite to the turn center).
Note: According to limitations, in case of One Engine Inoperative, the use of autopilot is currently not allowed on A321 to perform Non Precision Approaches. In this case continuation in manual flight (FD ON) is advised.
3 Validation outputs / recommendations
3.1.1 NDB Coding
NDB coding is satisfactory for the 3 procedures.
3.1.2 Flyability
The flyability is satisfactory for the 3 procedures.

VINGA - GOTEBORG RNP AR / RNP-ILS
Ref: QVS110308002
Date: April, 4th 2011
Version: 1 Revision: 1
Page 6 of 23
QUOVADIS Société par Actions Simplifiée Unipersonnelle Au capital de 2 000 000 € Inscrite sous le N° 511 007 312 RCS TOULOUSE Dont le siège social est 17, Av. Didier Daurat – BP 10051 Immeuble Socrate 31702 Blagnac Cedex – France
©QUOVADIS PROPRIETARY AND CONFIDENTIAL INFORMATION. Shall not be disclosed to any other party than permitted recipient.
3.1.3 Remark/recommendation
3.1.3.1 APP RNAV(RNP) y RWY 03
Charting:
‐ There is an altitude information of 1640ft at GG750. As this altitude is not a constraint (not included in the coding table), Quovadis recommends to remove it from the chart as it may be misleading for the pilot. Note : FMS trajectory was predicted at 1640ft during the validation.
‐ The procedure includes a TF‐TF transition (at GG752). Quovadis recommends to use an RF leg for the transition because:
o TF‐TF is a fly‐by transition without fixed trajectory. For example the trajectory during the transition is dependant of aircraft speed.
o RF is required at Aircraft level to fly the procedure. It is the opportunity to take the full capability requested at aircraft level to optimize this part of the trajectory.
‐ The length of the turn (RF leg) is missing between GG751 and GG750.

VINGA - GOTEBORG RNP AR / RNP-ILS
Ref: QVS110308002
Date: April, 4th 2011
Version: 1 Revision: 1
Page 7 of 23
QUOVADIS Société par Actions Simplifiée Unipersonnelle Au capital de 2 000 000 € Inscrite sous le N° 511 007 312 RCS TOULOUSE Dont le siège social est 17, Av. Didier Daurat – BP 10051 Immeuble Socrate 31702 Blagnac Cedex – France
©QUOVADIS PROPRIETARY AND CONFIDENTIAL INFORMATION. Shall not be disclosed to any other party than permitted recipient.
3.1.3.2 APP RNAV(RNP) y RWY 21
Bank angle:
‐ In normal operation with the maximum wind; an average bank angle of 18° with a peak value of ~24° is observed during the turn. This bank angle excursion above 20° is fully acceptable considering:
o satisfactory guidance (XTK below 0.1 NM); o Autopilot has a guidance margin up to 30°; o ESGG is a non challenging environment.
In case of very adverse conditions, the speed may be reduced before turn. Note : bank angle is linked to the speed constraint at GG990 Note: Bank angle in descent favors vertical performance. Refer to Appendix IV to see evolution of the bank angle during the turn in different scenarios A non normal operation (engine out) scenario is presented.

VINGA - GOTEBORG RNP AR / RNP-ILS
Ref: QVS110308002
Date: April, 4th 2011
Version: 1 Revision: 1
Page 8 of 23
QUOVADIS Société par Actions Simplifiée Unipersonnelle Au capital de 2 000 000 € Inscrite sous le N° 511 007 312 RCS TOULOUSE Dont le siège social est 17, Av. Didier Daurat – BP 10051 Immeuble Socrate 31702 Blagnac Cedex – France
©QUOVADIS PROPRIETARY AND CONFIDENTIAL INFORMATION. Shall not be disclosed to any other party than permitted recipient.
Speed constraint 225 Kt at GG990:
‐ The speed constraint: o Allows to limit he max bank angle (with maximum wind) o Does not impact the speed schedule to configure the aircraft for the approach, and
the turn can be flown in clean configuration reducing fuel burn and noise.(Green dot speed <225Kt up to 77T)
o 225kt at GG990 may lead to a high energy situation during final segment. The speed constraint impacts the bank angle, Speed Limit and DECEL. Stabilization at 1000ft is more complex with the speed constraint.
GG990 has to be crossed at less than 225kt to meet stabilization at 1000ft.
3.1.3.3 STAR OSNAK 1W + APP ILS 21
Speed constraint 210Kt at GG490:
‐ Speed constraint will force early deployment of conf1. (for gross weight above 66T). ‐ No specific energy management caution due to the speed constraint.
LOC* capture:
‐ Whenever the LOC mode is armed (from early arming even before the turn to late arming after the turn); the LOC* engagement and guidance relatively to the flight plan trajectory is satisfactory. The maximum cross‐track reached, when LOC* is engaged, in adverse conditions was 0.18. This is fully compatible with RNP value of 0.3 of the STAR OSNAK 1 W.
Note: Enhanced Loc capture function (FMS1 R1A) does not impact the operation. Note: Refer to annex III for simulator outputs (including max XTK) following various tests.
G/S* capture:
‐ There is a level flight at 3000ft before glide slope final descent capture. G/S* capture, G/S engagement and associated guidance are satisfactory (including wind effect and delta ISA).
Operational recommendations:
‐ Timing to press ILS pushbutton on EFIS control panel has no impact on current Novair EIS1 configuration. Quovadis recommends keeping current ILS approach SOP.
Note: In case of EIS2 or future EIS1 with L/DEV on PFD function .Quovadis recommendation is that PF displays the ILS scale as per current SOP and PNF displays the L/DEV scale until the last third of the turn.
‐ Quovadis recommends to arm LOC mode (APPR or LOC pushbutton on FCU) not before the last third of the turn.
‐ Quovadis recommends the de‐selection of Navaids for position computation for RNP AR procedures (APP RNAV(RNP) y RWY 03 and APP RNAV(RNP) y RWY 21) as per Airbus SOP.
‐ Quovadis does not recommend the de‐selection of Navaids for position computation for
RNP AR with RF leg to ILS transition (STAR OSNAK1W to ILS21).

VINGA - GOTEBORG RNP AR / RNP-ILS
Ref: QVS110308002
Date: April, 4th 2011
Version: 1 Revision: 1
Page 9 of 23
QUOVADIS Société par Actions Simplifiée Unipersonnelle Au capital de 2 000 000 € Inscrite sous le N° 511 007 312 RCS TOULOUSE Dont le siège social est 17, Av. Didier Daurat – BP 10051 Immeuble Socrate 31702 Blagnac Cedex – France
©QUOVADIS PROPRIETARY AND CONFIDENTIAL INFORMATION. Shall not be disclosed to any other party than permitted recipient.
4 Conclusion
Quovadis has successfully validated in the Novair A321 configuration:
o APP RNAV(RNP) y RWY 03 from LOBBI o APP RNAV(RNP) y RWY 21 from LOBBI o STAR OSNAK 1W + APP ILS 21
APP RNAV(RNP) y RWY 03: Quovadis proposes some charting recommendations.(see §3.1.31)
APP RNAV(RNP) y RWY 21: Bank angle during the turn is fully acceptable according to specific environment and procedure design goal.
STAR OSNAK 1W: precision guidance modes engagement and behavior is fully satisfactory. Quovadis proposes some operational recommendations:
‐ To keep current SOP for the timing to press ILS push button.
‐ To arm LOC mode not before the last third of the turn.
‐ To keep Navaids for position computation for RNP AR with RF leg to ILS transition.

VINGA - GOTEBORG RNP AR / RNP-ILS
Ref: QVS110308002
Date: April, 4th 2011
Version: 1 Revision: 1
Page 10 of 23
QUOVADIS Société par Actions Simplifiée Unipersonnelle Au capital de 2 000 000 € Inscrite sous le N° 511 007 312 RCS TOULOUSE Dont le siège social est 17, Av. Didier Daurat – BP 10051 Immeuble Socrate 31702 Blagnac Cedex – France
©QUOVADIS PROPRIETARY AND CONFIDENTIAL INFORMATION. Shall not be disclosed to any other party than permitted recipient.
Appendix I. Acronyms
EFIS Electronic Flight Instrument System EIS Electronic Instrument System FCU Flight Control Unit FMS Flight Management System L/DEV Lateral DEViation NDB Navigation DataBase PFD Primary Flight Display RF Radius to Fix RNAV Area of Navigation RNP Required Navigation Performance RWY Runway SOP Standard Operating Procedure STAR Standard Terminal Arrival Routes TF Transition to Fix

VINGA - GOTEBORG RNP AR / RNP-ILS
Ref: QVS110308002
Date: April, 4th 2011
Version: 1 Revision: 1
Page 11 of 23
QUOVADIS Société par Actions Simplifiée Unipersonnelle Au capital de 2 000 000 € Inscrite sous le N° 511 007 312 RCS TOULOUSE Dont le siège social est 17, Av. Didier Daurat – BP 10051 Immeuble Socrate 31702 Blagnac Cedex – France
©QUOVADIS PROPRIETARY AND CONFIDENTIAL INFORMATION. Shall not be disclosed to any other party than permitted recipient.
Appendix II. Procedures charts
RNVAV(RNP) y RWY 03 chart

VINGA - GOTEBORG RNP AR / RNP-ILS
Ref: QVS110308002
Date: April, 4th 2011
Version: 1 Revision: 1
Page 12 of 23
QUOVADIS Société par Actions Simplifiée Unipersonnelle Au capital de 2 000 000 € Inscrite sous le N° 511 007 312 RCS TOULOUSE Dont le siège social est 17, Av. Didier Daurat – BP 10051 Immeuble Socrate 31702 Blagnac Cedex – France
©QUOVADIS PROPRIETARY AND CONFIDENTIAL INFORMATION. Shall not be disclosed to any other party than permitted recipient.
RNAV(RNP) y 03 coding table

VINGA - GOTEBORG RNP AR / RNP-ILS
Ref: QVS110308002
Date: April, 4th 2011
Version: 1 Revision: 1
Page 13 of 23
QUOVADIS Société par Actions Simplifiée Unipersonnelle Au capital de 2 000 000 € Inscrite sous le N° 511 007 312 RCS TOULOUSE Dont le siège social est 17, Av. Didier Daurat – BP 10051 Immeuble Socrate 31702 Blagnac Cedex – France
©QUOVADIS PROPRIETARY AND CONFIDENTIAL INFORMATION. Shall not be disclosed to any other party than permitted recipient.
RNAV(RNP) y 21 procedure chart

VINGA - GOTEBORG RNP AR / RNP-ILS
Ref: QVS110308002
Date: April, 4th 2011
Version: 1 Revision: 1
Page 14 of 23
QUOVADIS Société par Actions Simplifiée Unipersonnelle Au capital de 2 000 000 € Inscrite sous le N° 511 007 312 RCS TOULOUSE Dont le siège social est 17, Av. Didier Daurat – BP 10051 Immeuble Socrate 31702 Blagnac Cedex – France
©QUOVADIS PROPRIETARY AND CONFIDENTIAL INFORMATION. Shall not be disclosed to any other party than permitted recipient.

VINGA - GOTEBORG RNP AR / RNP-ILS
Ref: QVS110308002
Date: April, 4th 2011
Version: 1 Revision: 1
Page 15 of 23
QUOVADIS Société par Actions Simplifiée Unipersonnelle Au capital de 2 000 000 € Inscrite sous le N° 511 007 312 RCS TOULOUSE Dont le siège social est 17, Av. Didier Daurat – BP 10051 Immeuble Socrate 31702 Blagnac Cedex – France
©QUOVADIS PROPRIETARY AND CONFIDENTIAL INFORMATION. Shall not be disclosed to any other party than permitted recipient.
STAR OSNAK1W procedure chart
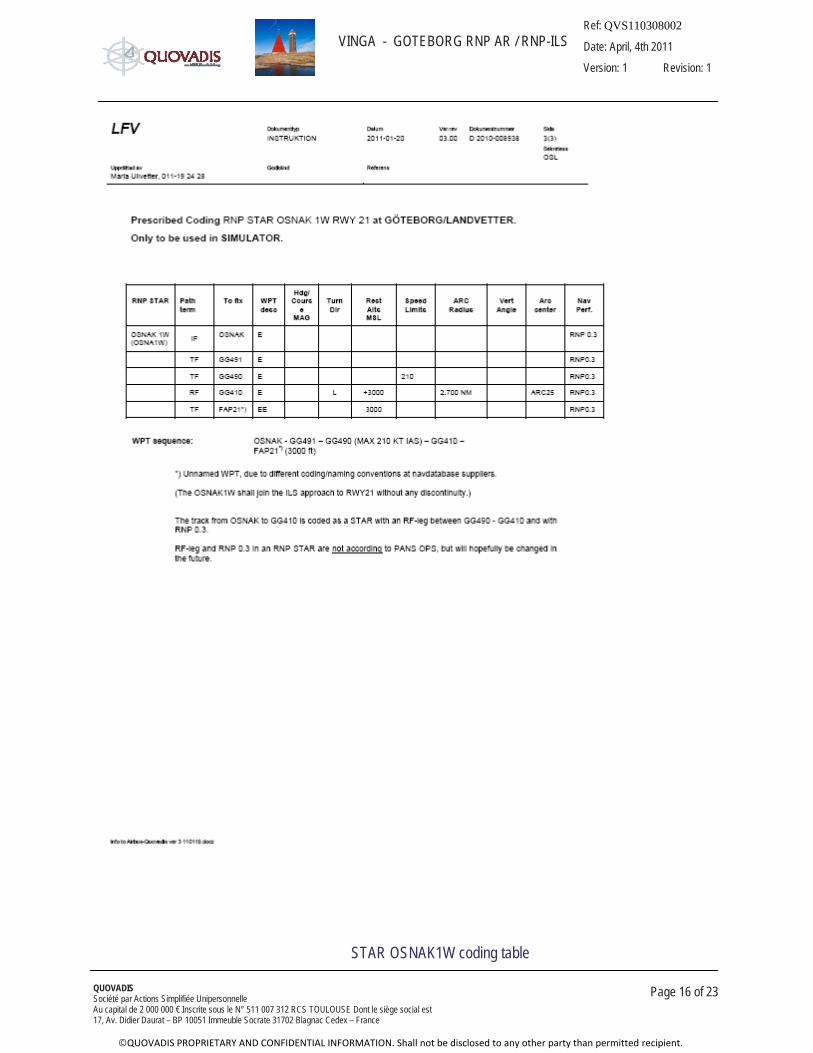
VINGA - GOTEBORG RNP AR / RNP-ILS
Ref: QVS110308002
Date: April, 4th 2011
Version: 1 Revision: 1
Page 16 of 23
STAR OSNAK1W coding table
QUOVADIS Société par Actions Simplifiée Unipersonnelle Au capital de 2 000 000 € Inscrite sous le N° 511 007 312 RCS TOULOUSE Dont le siège social est 17, Av. Didier Daurat – BP 10051 Immeuble Socrate 31702 Blagnac Cedex – France
©QUOVADIS PROPRIETARY AND CONFIDENTIAL INFORMATION. Shall not be disclosed to any other party than permitted recipient.

Ref: QVS110308002
Date: April, 4th 2011
Version: 1 Revision: 0
Page 17 of 23
QUOVADIS Société par Actions Simplifiée Unipersonnelle Au capital de 2 000 000 € Inscrite sous le N° 511 007 312 RCS TOULOUSE Dont le siège social est 17, Av. Didier Daurat – BP 10051 Immeuble Socrate 31702 Blagnac Cedex ‐ France
Appendix III. STAR OSNAK1W to ILS21 transition: simulator parameters
Example of significant parameters observed during STAR OSNAK1W transition to ILS:
App n°
Wind (°/kt) ΔISA (°) APPR FCU Slats/Flaps conf (in RF)
Speed (kts) (in RF)
max XTK … at LOC* at HDG (°) TRK (°) G/S* at Alt (ft)
A 0/0 0 before GG490 0 managed (210) 0,15 GG410 ‐ 0,2Nm GG410 ‐ 2,2Nm 255 255 88DME ‐ 0,4Nm 2998
B 115/30 0 just after GG490
1 selected 210 0,18 GG410 ‐ 0,6Nm GG410 ‐ 2,7Nm 263 267 / /
C 295/30 0 before GG490 1 selected 210 >managed (189)
0,11 GG410 GG410 ‐ 1,7Nm 249 243 88DME ‐ 0,4Nm 2997
D 180/30 ‐40 just after GG490
0 managed (212) 0,11 GG410 GG410 ‐ 1,7Nm 237 245 NL ‐ 3,2Nm 3004
E 115/30 0 before GG490 1 selected 210 >managed (200)
0,18 GG410 ‐ 0,5Nm GG410 ‐ 2,7Nm 262 267 88DME ‐ 0,4Nm 3019
F 115/30 0 88DME ‐ 0,8Nm 1 selected 210 0,02 GG410 ‐ 0,8Nm 88DME ‐ 0,6Nm 193 203 88DME ‐ 0,3Nm 2993
G
(EO) 180/30 0 before GG490 1 selected 210 0,13 GG410 ‐ 0,2Nm GG410 ‐ 2,2Nm 248 256 88DME ‐ 0,3Nm 3018

Ref: QVS110308002
Date: April, 4th 2011
Version: 1 Revision: 0
Page 18 of 23
QUOVADIS Société par Actions Simplifiée Unipersonnelle Au capital de 2 000 000 € Inscrite sous le N° 511 007 312 RCS TOULOUSE Dont le siège social est 17, Av. Didier Daurat – BP 10051 Immeuble Socrate 31702 Blagnac Cedex ‐ France
Appendix IV. APP RNAV(RNP) y RWY 21 : bank angle
Evolution of the bank angle during the turn (between GG990 and GG499) is presented for the following scenario:
APP Speed Wind Engine out
A Managed 258°/42kt No
B Selected 225 kt 258°/42kt No
C Selected 225 kt 258°/42kt Yes
D Managed 258°/40kt No
E Managed 258°/24kt No

Ref: QVS110308002
Date: April, 4th 2011
Version: 1 Revision: 0
Page 19 of 23
QUOVADIS Société par Actions Simplifiée Unipersonnelle Au capital de 2 000 000 € Inscrite sous le N° 511 007 312 RCS TOULOUSE Dont le siège social est 17, Av. Didier Daurat – BP 10051 Immeuble Socrate 31702 Blagnac Cedex ‐ France
APP RNAV(RNP) y 21 bank angle during the turn : scenario A

Ref: QVS110308002
Date: April, 4th 2011
Version: 1 Revision: 0
Page 20 of 23
QUOVADIS Société par Actions Simplifiée Unipersonnelle Au capital de 2 000 000 € Inscrite sous le N° 511 007 312 RCS TOULOUSE Dont le siège social est 17, Av. Didier Daurat – BP 10051 Immeuble Socrate 31702 Blagnac Cedex ‐ France
APP RNAV(RNP) y 21 bank angle during the turn : scenario B

Ref: QVS110308002
Date: April, 4th 2011
Version: 1 Revision: 0
Page 21 of 23
QUOVADIS Société par Actions Simplifiée Unipersonnelle Au capital de 2 000 000 € Inscrite sous le N° 511 007 312 RCS TOULOUSE Dont le siège social est 17, Av. Didier Daurat – BP 10051 Immeuble Socrate 31702 Blagnac Cedex ‐ France
APP RNAV(RNP) y 21 bank angle during the turn : scenario C

Ref: QVS110308002
Date: April, 4th 2011
Version: 1 Revision: 0
Page 22 of 23
QUOVADIS Société par Actions Simplifiée Unipersonnelle Au capital de 2 000 000 € Inscrite sous le N° 511 007 312 RCS TOULOUSE Dont le siège social est 17, Av. Didier Daurat – BP 10051 Immeuble Socrate 31702 Blagnac Cedex ‐ France
APP RNAV(RNP) y 21 bank angle during the turn : scenario D

Ref: QVS110308002
Date: April, 4th 2011
Version: 1 Revision: 0
Page 23 of 23
QUOVADIS Société par Actions Simplifiée Unipersonnelle Au capital de 2 000 000 € Inscrite sous le N° 511 007 312 RCS TOULOUSE Dont le siège social est 17, Av. Didier Daurat – BP 10051 Immeuble Socrate 31702 Blagnac Cedex ‐ France
APP RNAV(RNP) y 21 bank angle during the turn : scenario E

VINGA-Final Report Appendix 4

RNP AR uppföljning av flygningar - TMC
1. Datum och tid (UTC):___________________
2. Callsign:_____________________________
3. Trafikintensitet (1 låg - 5 hög):__________
4. Fullföljdes OSNAK1X alternativt KOVUX1Q? OSNAK1X KOVUX1Q NEJ
5. Om flygningen fullföljdes, Erbjöds en ostörd plané (ex. Trappning av höjd, fartrestriktioner?) JA NEJ
Pilots egen begäran
Annan ankommande trafik
Konfliktande start
Annan konfliktande trafik
Väder (ex. cb)
Annan orsak, ange:_____________________________________
Om nej, eventuell kommentar:________________________________________________________________________
10. Signatur:___________________________
7. Om flygningen avbröts, ange orsak (kan vara flera):
9. Övrigt. Särskilda reflektioner eller kommentarer (använd gärna baksidan):
8. Påverkade flygningen din arbetsbelastning (1 inget - 5 mycket):
Bilaga till OMA 51/10
Handläggare: Niclas WiklanderLogg för uppföljning av RNP-inflygningar på TMC eller då TMC/TWR är ihopslaget. Frågorna berör vad som hände i ditt ansvarsområde för novair-flygning som klarerats på OSNAK1X eller KOVUX1QLägg ifylld logg i Niclas postfack
6. Om flygningen fullföljdes, skapades försening av annan trafik: JA NEJ
Om ja, eventuell kommentar:________________________________________________________________________

VINGA-Final Report Appendix 5

H Ekstrand 2011-10-20 version 01.03
Checklist VINGA Monitoring of RTA functions
Date (YY-MM-DD)
Flight number
Dep Arr Rwy in use at ESGG
TMA entry point and assigned STAR
NVR ESGG
Start approximately 1 hour before landing and complete the first step prior to Top of Descent (ToD).
Make sure you are on a direct track or very close to a direct track towards the TMA entry point. Check that you will cross the TMA entry point at FL100 or above, otherwise create a pilot-defined waypoint 10 NM prior to the TMA border (e.g. OSNAK/-10).
Y/N
Have you updated the winds via ACARS and printed the winds, for the remaining part (en-route and descent)? Updated forecasted winds are available at approximately 04.00, 10.00, 16.00, 22.00Z in the flight planning system.
Y/N
Have you inserted the latest ATIS information via ACARS?
Y/N
Confirm that you haven’t changed the planned descent speed.
Y/N
What is your ETA at the TMA border or the pilot-defined waypoint?
AA.BB.CC Z
Insert a RTA at the TMA entry point or the pilot-defined waypoint, and write it down to the right.
DD.EE.FF Z
Please not the time when you start RTA operation. GG.HH.II Z
Remember not to accept any short cuts towards a waypoint inside the TMA after start of the RTA operation!
During descent
Is the aircraft behaving satisfactory from a passenger comfort perspective? Typical comfort aspects could be changes between idle thrust and thrust transients.
Y/N in N, Please explain
Is engine-anti ice being used? If yes, approximately between which FL’s?
Y/N if Y, when?
Is wing-anti ice being used? If yes, approximately between which FL’s?
Y/N if Y, when?
Have you changed any parameters on the PERF page during descent because of a new ATIS (QNH/Wind/Temp)? If so, did this affect the trajectory?
Y/N if Y, approximately at what altitude? What happened with the trajectory?

H Ekstrand 2011-10-20 version 01.03
Did you get an unconstrained descent from ATC? Y/N if N, please explain what happened.
Did you get scratch pad message such as MORE DRAG/TIME ERROR AT OSNAK or the pilot-defined waypoint?
Y/N if Y, please clarify.
At the Metering Fix
Record your actual MF passage via the clock. JJ.KK.LL Z
General impression of RTA operation
What is your experience of this operation, could you give any suggestions/recommendations, based on your experience?
Please insert this form in the Flight Envelope, mark the envelope with “VINGA RTA”

VINGA-Final Report Appendix 6

1
ISABE-2011-1403
Copyright 2011 by Henrik Ekstrand. Published by the American Institute of Aeronautics and Astronautics Inc., with permission.
A new method for measuring energy intensity during commercial flight missions
By
Henrik Ekstrand Division of Fluid Dynamics
Department of Applied Mechanics Chalmers University of Technology
SE-412 96 Gothenburg, Sweden [email protected]
Ulrika Ziverts
SESAR Project Manager Nova Airlines AB
SE-104 31 Stockholm, Sweden [email protected]
Deborah Mitchell Division of Fluid Dynamics
Department of Applied Mechanics Chalmers University of Technology
SE-412 96 Gothenburg, Sweden [email protected]
Abstract
All parts of a flight mission have to be improved to minimize fuel consumptions. Here the final part of the flight mission for ordinary commercial flights is studied. A new energy intensity parameter is proposed that could be suitable to make comparisons between different final flight procedures. It is shown that energy efficiency improvements can be gained via the implementation of new navigation technologies in the order of 30%, but is highly affected by the number of passengers on board.
Nomenclature aSL Speed of sound at sea level D Drag FH Flight Hours FIR Flight Information Region FL Flight Level (altitude in feet/100) FN Net thrust g Gravity constant KCAS Knots Calibrated Air Speed L Lift M Mach number m Mass mFUEL Mass of fuel NM Nautical Mile (1852 m) RNAV Area Navigation RNP Required Navigation Performance RNP AR RNP Authorization Required SFC Specific Fuel Consumption T Ambient static temperature TSL Temperature at sea level W Weight (mg) Θ Temperature Ratio (T/TSL)
Introduction
Air traffic contributes to approximately 2% of the global anthropogenic carbon dioxide (CO2) generation1 and is now perceived as one of the fastest growing transport sectors2. Passenger traffic is expected to grow by 4,6% per year until 20363. The aviation sector thus threatens to become a substantial and ever increasing contributor to Greenhouse Gas (GHG) emissions. Pollutant emissions from combustion processes have become of great public concern due to their impact on health and the environment. The past decade has witnessed rapid changes both in the regulations for controlling aero engine emissions and in the technologies used to meet these regulations. The very stringent environmental goals introduced by the Advisory Council for Aeronautics Research in Europe (ACARE)4 in their vision for the year 2020 have been widely accepted by the aviation industry. This includes the European Commission in their “Clean Sky” project5 and the European Air Traffic Management (ATM) modernization program SESAR6, which strives for further improvements in energy efficiency. In parallel, some airlines, airports and Air Navigation Service Providers (ANSPs) are actively working with fuel saving initiatives throughout the world, to minimize their environmental impact7. From a high level perspective, there is interest within, for example, SESAR and the International Civil Aviation Organization (ICAO) and its technical bodies, to develop CO2 or GHG emissions standards for commercial aviation8. However, to date there have been no widely accepted solutions for how to develop such emissions standards. This is because of

2
the difficulty in choosing a suitable metric to assess the energy efficiency of a single flight. In addition, on a national basis or even from a local perspective, there is a strong need amongst most stakeholders to introduce alternative methods of operational behaviour in order to reduce the environmental impact and drive down airline Direct Operating Costs (DOC). Previously, different international projects9 have used different methods to measure energy efficiency and thus a common standardisation is highly needed. Great care has to be observed to make a proper measure of the energy efficiency; this is especially true in the descent phase. The purpose of this paper, therefore, is to discuss different options to measure the energy efficiency during the latter part of a civil flight mission, from the en route phase through to the final descent. These phases of flight have been selected as they represent phases where significant differences can be observed regarding efficiency. Reasons why inefficiencies are being generated are discussed. In addition, the introduction of new state-of-the-art instrument approach procedures and their impact on the environmental are discussed. Aviation Fuel characteristics
Different jet fuels are being used throughout the world; in the United States, Jet A fuel is the standard, whereas Jet A-1 is the standard specification fuel used in the rest of the world10. The Specific Energy for these fuel types, based on the Lower Heating Value (LHV) are typically at least 43,0 MJ/kg11,12. The combustion of jet fuel generates pollutants, and of particular interest is the emission of CO2. There is a linear relationship between fuel usage and CO2 emissions, where 1 kg of JET A1 corresponds to 3.16 kg of CO2
13.
Computation of the flight trajectory
There are a large number of different flight trajectories that can be strategically chosen to be flown by an airline. Different airlines have different basic business needs, and different business objectives at different times of the day or season. This means that many airlines are deviating from the flight trajectory associated with minimum fuel consumption, which corresponds to flying the aircraft according to the speed generating best range, R, at the optimum cruising altitude. For example, it may be desirable to fly lower than the optimal altitude from a fuel efficiency perspective at a corresponding high True Air Speed, V, in order to reduce the flight time, since T is higher at lower altitudes.
The most general method of considering the range performance of an aircraft is in terms of Specific Range (SR) also known as fuel mileage, i.e. the distance travelled per unit of fuel used. SR is an instantaneous property of the aircraft-aero engine combination and is usually presented as a function of aircraft mass, speed, altitude and ambient temperature. By examining the equation for SR in the en route phase and assuming steady level flight, i.e. L = W and FN = D, the following equation applies:
D
LM
WSFC
a
dm
dRSR SL
Θ
=−= (1)
If the aircraft is equipped with a modern Flight Management System (FMS), it computes the trajectory and associated economy speeds, known as Econ Mach/Speed to be flown throughout the flight mission and the associated recommended cruising altitudes. Aircraft speed characteristics are typically expressed in V or M, but modern aircraft are operated according to Calibrated Air Speed, VC and M
14. This computed trajectory is based on the Cost Index, CI, which is defined as the ratio of time costs (CTIME) to fuel costs (CFUEL) in the realization phase of the flight mission. The CI is usually expressed in kg/min by European aircraft manufacturers and can be written as
FUEL
TIME
C
CCI = (2)
The purpose with the CI concept is to minimize the total costs for that specific flight mission. A low CI represents a situation with a very high fuel price in the denominator of (2) above, where the aircraft is flown close to a maximum range trajectory scenario (where CI = 0 represents maximum R). The relationship between CI, and Econ Mach in the en route phase is7
( )dM
SRd
SR
MaCI SL
Θ−=
2
2
)( (3)
This can be illustrated as in Figure 1, where the relationship between SR and CI is shown for a given altitude.

3
Figure 1. Relationship between SR and CI for a given altitude.
A constant Econ Mach/Speed schedule is typically chosen in the descent phase by the FMS. Econ Descent Mach is typically equal to the final Econ Cruise Mach. At the cross over altitude, the aircraft switches from Econ Mach to Econ Descent Speed, this is normally a fixed VC speed schedule depending on the chosen CI. Typically the VC segment can be expressed as:
CIVC ⋅= β (4)
where β is an arbitrary constant. At CI = 0, the VC is usually the minimum speed, which is programmed in the guidance module of the FMS. A higher CI typically generates a different trajectory, with a later Top of Descent (ToD) if the aircraft is operated at the same final cruising altitude. There are limitations of the CI theory and the calculated trajectory proposed by the FMS7. For the descent phase, there is usually a minimum speed of 250 KCAS below the cross over altitude, if flying the vertical path proposed by the FMS. This is primarily related to an old legacy ATM rule, and for most aircraft, optimum R and its associated speed are much lower than this speed. In addition, the speed associated with best R is a variable VC. Measurement of aircraft energy efficiency In general, there are three main sources available for aircraft fuel efficiency improvements, which can be divided into different subgroups, these are:
• Aircraft improvements � Airframe improvements � Aero engine improvements
• Operational improvements � ATM related improvements
• Airline related improvements
� Flight technical improvements by the airline
� Increased payload
Aircraft improvements A commonly cited figure of a 70% improvement in fuel efficiency can be linked to some of the aircraft manufactures15,16, since the introduction of the turbojet aero engine approximately 50 years ago in civil aviation. These improvements are linked to technology improvements, such as the turbo fan aero engine, improved aerodynamics and introduction of light mass material of the airframe.
Operational improvements Operational improvements can be ATM related, such as the introduction of new airways; allowing direct routing in the en route phase, e.g. within Sweden FIR17, Lisbon FIR/UIR18 and Maastricht Upper Aero Control Centre (MUAC)19; Reduced Vertical Separation Minima (RVSM); Performance Based Navigation (PBN) related initiatives, typically associated with new departure- and arrival routes, approach procedures that are based on satellite navigation technology. These improvements can be related to both the lateral and vertical components of an aircraft’s trajectory, where the latter is typically associated with altitude and/or speed constraints, forcing the aircraft to deviate from its optimum trajectory, resulting in excess energy usage.
Airline related improvements Flight technical improvements are related to changed behaviour in the daily flight operation of an airline. The difference in energy usage between airlines who focus on these matters and those who do not, are in the magnitude of 5%20,21. There are several metrics currently used by the airlines and aircraft manufacturers to define the efficiency of a flight. It is useful to consider the efficiency of a flight in terms of the number of available seats or passengers on board. The number of seats available on board the aircraft multiplied with the traversed distance is commonly defined as Available Seat Kilometres (ASK). The actual number of seats occupied by passengers (PAX) on board the aircraft multiplied with the traversed distance is defined as Revenue Passengers Kilometres (RPK). The ratio between RPK over ASK is commonly defined as Cabin Factor (CF) or Load Factor (LF). Increasing the LF leads to improved fuel consumption on a Passenger-Kilometre basis. It is therefore of interest to the airlines to operate flights with high LFs to maximize revenue.

4
According to the Association of European Airlines22 (AEA) representing 36 major airlines of Europe, the average LF of it member airlines is in the order of 75%, meaning that 25% of all seats are empty. According to European Low Fares Airlines Association23 (ELFAA), they are reporting a LF at 80%. It is common amongst the airframe manufactures to state energy efficiency in its product portfolio in terms of fuel consumed per ASK for a reference flight mission. The number of seats available is typically the standard cabin layout. By using fuel used per ASK, the parameter indicates the technical level of the aircraft system, without any passenger statistics being involved. Although this metric may be sufficient at a manufacturing level, this may not be an appropriate metric for use by the airlines, as the number of passengers on board an individual flight is not accounted for. Note that for airfreight operations, similar acronyms are being used: Available Ton Kilometres (ATK) and Revenue Ton Kilometres (RTK).
Strategic Energy Efficiency Metrics In general, efficiency is a measureable concept, quantitatively determined by the ratio of actual output to maximal possible output. The challenge within the aviation industry is to determine the relevant parameters to define this concept for aircraft operations. Historically, a segregated view on efficiency amongst the stakeholders has been observed where there is a trade-off between environmental efficiency and maintaining air traffic capacity. When performing a literature review8,9,24,25 in the subject of energy efficiency parameters, it is clearly identified that energy efficiency is measured differently by, for example, airframe manufactures, airlines, various projects, etc. The following typical key parameters have been identified:
• Fuel used;
• CO2 emitted;
• Fuel used per ASK;
• Fuel used per RPK;
• CO2 emitted per ASK
• CO2 emitted per RPK. It is proposed by Lee et al.26 to introduce an Energy intensity index, EI. It is defined as the fuel energy needed in order to produce one unit of mobility, or Energy used /RPK, according to:
−⋅
⋅=
==
kmseat
MJ
PAX
LHVm
ASKLF
usedEnergy
RPK
usedEnergyE
FUEL
I
distance
(5)
Figure 2 shows four alternative trajectories for a typical medium-sized, single-aisle aircraft in the latter part of a flight mission. The trajectory is shown between a given reference distance from the destination airport and a metering fix close to the airport, thus representing different flights flown along the same given lateral trajectory. It can be seen from Figure 2 that there is a range in cruising altitude and also the ToD for the different missions. Several key metrics can be used to express the efficiency of the flights, and these metrics are shown in Table 1, including ASK, RPK and EI. These metrics are valid for an unconstrained descent with respect to 250 KCAS below FL100 (typically used as an ATM speed constraint around most airports). Each mission is represented by a different colour in Table 1, which can be matched with the corresponding trajectory in Figure 2.
Figure 2. Different flight trajectories flown to a common
metering fix.
It is clear from Table 1 that selecting different energy efficiency metrics can result in very different perspectives on which trajectory is most efficient. For example, if only the ASK parameter is considered, all flights appear to have the same efficiency; however, if EI is used, the reference flight can be considered as the most efficient. Note that since there is a linear relationship between fuel used and CO2 emissions, they are relatively equivalent.

5
Trajectory flown
Time [min]
Fuel used/CO2 emitted
ASK [seat-km]
RPK [seat-km]
EI
[MJ/seat-km]
A→B→C 100% 100% 100% 100% Reference
A→B 34,3% 67,4% 40,9% 40,9% 163,6%
B→C 65,7% 32,6% 59,1% 59,1% 55,1%
A→D→C 88,2% 115,0% 100% 100% 115,0%
A→D 43,0% 93,0% 54,0% 54,0% 172,1%
D→C 45,2% 22,0% 46,0% 46,0% 47,8%
E→F→C 87,2% 138,4% 100% 100% 138,4%
E→F 47,9% 119,1% 61,4% 61,4% 193,7%
F→C 39,3% 19,4% 38,6% 38,6% 50,3%
A→B→C 100,6% 97,4% 100% 75,0% 129,8%
A→B 36,0% 65,3% 41,8% 31,4% 208,1%
B→C 64,6% 32,1% 58,2% 43,6% 73,5%
Table 1. Aircraft descent parameters.
The reference trajectory is A→B→C (shown in green), flown with a low CI and a LF = 100%. By flying with a higher CI, trajectory A→D→C, 15% more fuel is used, and EI is increased by the same amount. By flying with a lower cruising altitude, trajectory E→F→C, a shorter flight time will be obtained, at the expense of even greater energy use. By reducing the LF to 75% (shown in blue), the fuel used is lowered, primarily related to better SR in cruise since the descent is carried out with idle thrust, but the EI is significantly increased. Table 1 suggests that by only considering fuel consumption or CO2 emissions during the descent phase, i.e. from the ToD, this may provide unrealistic representations of the true energy efficiency. It is clearly identified in the example above, that it is more relevant to consider energy intensity in respect of Energy/RPK, since it shows the true energy efficiency of the given flight mission, taking all variables into account. Secondly, from a high level perspective, it could be used as a good indicator of efficiency in respect of airspace usage; this is especially true in congested European airspace, where capacity is an issue. If the LF could be increased on average, fewer flights could probably be flown to that destination airport, increasing the overall efficiency of the airspace system. By, for example, implementing legislation, obliging the airlines to fly an energy efficient approach, by using a low CI, the high level SESAR goals of 10% improvements for the latter part of the flight mission would most likely be obtained. This would of course increase the flight time of each flight mission slightly, but does not necessarily mean the DOC of the airline would be higher, since it is primarily the FH maintenance related costs that are affected7. This is normally related to aero engine costs, due to the fact that the aero engines are flown with a lower mechanical load and lower turbine temperatures for a
greater part of the flight14. Initiatives such as these are already in place, in Malaysia for instance, with secondary effects of obtaining a more consistent traffic arrival flow27. This would increase the average flight time, and should probably be introduced with shorter flight paths through implementation of PBN to gain maximum acceptance within the airline industry. Real flight trajectories
The overall efficiency of a flight mission is dependent upon both the geographical layout of the route (lateral efficiency) in addition to the vertical profile of the aircraft along the route (vertical efficiency). An analysis of flight efficiency must consider these components separately.
Lateral trajectory
The sole objective of a civilian flight mission is to carry payload from the departure airport to the destination airport, and that work needs to be linked with the productivity of that unique flight mission. Any tangible measure of aircraft flight efficiency must therefore account for the distance flown during a single mission. The shortest distance between any two points on a sphere is the Great Circle Distance (GCD); however, the lateral trajectory for the arrival phase of the flight mission will very seldom be the GCD from the start of the measuring until landing; this is typically ATM related. For example, the direction of the runway in use for landing can deviate from the inbound track, thus generating extra distance flown. In some cases this can be substantial due to surrounding terrain, noise sensitive areas, and airway structure. In general, the high level objective of all airline operations is to find the route that generates the shortest flight time, typically associated with lowest overall costs. The previously defined ASK and RPK concepts typically consider the whole flight mission. For example, in respect of aviation and its incorporation in the European Union (EU) Emission Trading Scheme (ETS) from 2012, the tonne kilometre reference equals traversed distance multiplied with payload where distance means the GCD between the aerodrome of departure and the aerodrome of arrival plus an additional fixed factor of 95 km28. Therefore, the concept does not account for variations between the distances associated with different arrival routes and procedures. For real flight missions it is of interest to include the lateral efficiency of the flight, as this accounts for the

6
track distance flown and is therefore useful for comparing the efficiency of arrival route design. For this study, we will introduce the concept of Productive ASK, P-ASK, which represent the number of seats available on board the aircraft multiplied with the Productive Distance, PD. The PD is defined as a GCD distance between two reference points. This concept is illustrated in Figure 3 with an example of a direct path between two points were GCD and PD are equal and a path were the traversed distance is larger.
GCD = PD = 100 NM
Total distance = 120 NM Figure 3. GCD and PD.
In addition, Productive RPK, P-RPK will be introduced, representing the actual number of seats occupied by PAX on board the aircraft multiplied with the PD. By introducing P-ASK and P-RPK, this provides a suitable metric to measure the true lateral efficiency close to the destination airport. It should also be mentioned that in the realization phase of the flight mission, when the LF can no longer be affected, there is an interest to measure energy efficiency in respect of fuel or CO2 emissions as well. This is especially true when implementing new operational procedures. As previously mentioned, the EI index provides a useful description of the flight energy efficiency, which takes into account both the fuel consumption and also the LF. However, the EI index does not distinguish between the vertical and lateral contributions to the overall energy efficiency. In order to assess the lateral energy efficiency of the flight, the actual track distance must be compared with the PD. Therefore, we propose the Productive EI index, or P- EI, which takes the PD into account. The P- EI can be defined as the Total Energy consumed divided by the P-RPK. Thus flights which are forced to fly longer, more inefficient arrival routes will have a higher P- EI.
Vertical Efficiency parameters
The vertical efficiency is highly dependent on whether the aircraft can fly at an optimal cruise altitude, followed by an unconstrained idle thrust descent from its ToD, at the speed corresponding to best R, prior to starting the approach. Any extra thrust above the minimum required in descent will generate lowered energy efficiency. This optimum vertical trajectory profile will seldom be flown; this is typically ATM and/or airline related. ATM related constraints can be altitude constraints, either in the en route or the STAR structure. The airline can have an operational philosophy that deviates significantly from the environmental optimum vertically trajectory, for example by using a high CI, and its flight crews can use different techniques, deeply influencing the energy efficiency.
CDO
There have been a lot of activities during the last 5-10 years with the implementation of Continuous Descent Operation (CDO)29 or Continuous Descent Approach (CDA)30. The concept is an aircraft technique aided by appropriate airspace and procedure design and appropriate ATC clearances which enable the execution of a flight profile to be optimized to the operating capability of the aircraft. The CDO concept has allowed improvements in both the lateral and vertical trajectories of aircraft. There have been different views of the CDO concept of operation, but the general perception according to ICAO and Eurocontrol is as follows29,30 regarding the vertical profile:
• The descent should be carried with low engine thrust and, where possible a low drag configuration, thereby reducing fuel burn and emissions. Thus the CDO concept should be associated with energy efficient flying in general.
• The optimum vertical profile takes the form of a continuously descending path, with a minimum of level flight segments only as needed to decelerate and configure the aircraft prior to landing.
• The CDO concept should start from highest possible altitude.
The lateral trajectory in conjunction with the CDO concept can be divided into closed path design or open path design as shown in Figure 4.

7
Figure 4. Open and Closed STARs.
The closed path design provides the flight crew with a predefined trajectory and gives the FMS the possibility to determine the optimal ToD. The length of the arrival route should be as short as possible. Conversely, the open path design gives no possibility at all for the flight crew and the FMS to determine the ToD. There will be a discontinuity in the FMS regarding the trajectory from the last point on the STAR until interception of the final approach segment. This will usually generate a situation with low altitude flying using partial thrust. The data in Table 2 representing a B737NG aircraft at low altitude clearly illustrates this31. Thrust KCAS Configuration
FUELm•
FUELm•
∆
Idle 250 Clean 581 N/A
Partial 210 Clean 2168 +273%
Partial 180 Flaps 5 2291 +294%
Partial 170 Flaps 10 2581 +344%
Partial 160 Flaps 15 3171 +446%
Table 2. Low altitude fuel flow of a B737NG.
It is clear from Table 2, that low level flying is significantly penalizing the fuel efficiency of the aircraft. To be able to conduct the most efficient descent, the following conditions must apply:
• The aircraft must know its lateral trajectory well before ToD.
• The aircraft should be allowed to fly without interference after leaving the optimum ToD, as any interference will generate a situation with increased fuel flow.
Proposed method to measure Energy Intensity
To accurately measure the P-EI, during the latter part of a flight mission, a 200 NM radius is placed around the destination airport (a radius of 200 NM was selected in order to include the final segment of the cruise phase as well as the descent for all foreseen descents). Energy intensity and fuel usage can then be measured from when the aircraft crosses this radius to any given point. However, it has been decided to exclude the final part of the approach due
to the large variations in fuel burn observed during this phase. This is because the final part of the approach is highly dependent on flight crew technique, meteorological conditions, type of aircraft, etc. In order to exclude this final flight segment, this proposed method calculates energy efficiency up to a given distance of 10 NM from the destination airport. Therefore, a total PD of 190 NM is considered. Reference flight mission
A reference flight mission has been selected to represent an optimal scenario in terms of fuel burn and energy expenditure. The reference flight mission is started in the en route phase, when the aircraft is crossing the 200 NM radius and ends at the inner circle at 10 NM, i.e. it is flown along the solid black line, as shown in Figure 5. This black line corresponds to the PD (i.e. the most efficient lateral trajectory possible). The aircraft is flown according to a FMS minimum fuel usage scenario with a LF = 100%, in ISA conditions, zero wind, non-icing conditions and without any aerodynamic or aero engine deterioration, i.e. a new aircraft. The cruising altitude is chosen to be the closest applicable optimum FL.
Figure 5. Reference flight mission.
This reference flight mission is a very rare flight mission, since an aircraft is seldom flying on an unrestricted long final from 200 NM towards the destination airport. But the purpose is to have a generic method, for efficiency measurement, and to be able to relatively measure different airspace structures, procedures and airline operation against each other.

8
The energy intensity parameter, P-EI, has been calculated for this optimal, reference mission and is used for comparison against all other flight missions.
Actual flight mission
The energy intensity parameter, P-EI, previously described has been applied to three real examples of approach procedures, which are used at a typical airport. The P-EI, metric provides a method to compare the efficiencies of the procedures. The procedures are described below:
• The red dashed trajectory (shown in Figure 5) is a typical open looped STAR, where the latter part of the red dashed trajectory is associated with tactical radar vectoring, performed by ATC. The nature of the radar vectoring is dependent on the traffic intensity and these routes don’t necessarily need to be extremely long. In the open looped STAR scenario, parts of the flight are conducted in level flight, prior to intercepting the ground based Instrument Landing System (ILS) approach.
• The blue solid line is a closed STAR, based on RNAV technology, followed by an ILS approach.
• The green trajectory is an unrestricted, state of the art, RNP AR approach, using satellite navigation, also known as a “curved approach”.
In order to analyse the lateral and vertical contributions to the overall P-EI, each of the flight missions described above were flown from a distance of 200 NM from the runway threshold to a distance of 10 NM from the threshold (i.e. the PD of 190 NM). This allowed the vertical component of the P-
EI, to be calculated because the lateral distance covered by the mission was identical to the reference case. In other words, any differences between the actual mission and the reference case could be attributed to vertical energy inefficiency. The lateral P-EI, is then the difference between the overall P-EI and the vertical P-EI. Table 3 shows the overall, vertical and lateral P-EI values for each of the three procedures, expressed as a percentage of the reference case P-EI (100%). A P-
EI value which is higher than 100% represents a case where the procedure is more inefficient than the reference case. All flights are flown with a 100% LF except the last flight mission.
Procedure Total Productive
Energy Intensity
(%)
∆ Vertical Productive
Energy Intensity
(%)
∆ Lateral Productive
Energy Intensity
(%)
Fuel used /CO2
emitted
Reference 100,0% 100,0% 100,0% 100,0%
RNP AR 108,4% 100,0% 108,4% 108,4%
RNAV 119,3% 100,6% 118,7% 119,3%
Open STAR
140,9% 109,9% 131,0% 140,9%
RNP AR LF 75%
141,1% 130,5% 110,6% 105,9%
Table 3. Comparison of Productive Energy Intensities of three
aircraft approach procedures compared with an ideal
reference case.
Overall Efficiency
Table 3 shows that, as expected, all three approach procedures have higher P-E I, values compared with the reference case, i.e. they are less energy efficient. The RNP AR procedure is observed to be the most energy efficient as it is only 8,4% less efficient than the reference case. The Open STAR scenario has the worst efficiency of all three procedures where the LF is 100%, which is to be expected as the aircraft must fly extra track distance and is also forced to fly a long segment in level flight at low altitude. Interestingly, although the RNP AR procedure with 100% LF is the most energy efficient scenario, when the LF is reduced to 75%, the overall energy efficiency reduces by 32,7%. The RNP AR procedure with a 75% LF is less energy efficient than the Open STAR procedure with 100% LF. This highlights the requirement for airlines to fill all available seats if they are to operate in the most energy efficient way.
Vertical Efficiency
Table 3 shows that the RNP AR has a P-E I, value of 100%, i.e. the same as the reference flight. This is because during RNP AR descents, the aircraft is not subject to any ATC constraints and can descend in the most energy efficient way. However, when the LF is reduced to 75%, the P-E I, increases by 30,5% and is the most energy inefficient of all the scenarios. The RNAV procedure also has a low P-E I,, which is close to 100%.
Lateral Efficiency
Table 3 also shows that the RNP AR procedure has the best lateral efficiency with a P-E I, value of 108,4%. This is because the aircraft can follow a shorter lateral route, and is guided by virtual waypoints programmed in the FMS, which allows it to take the most direct route possible to the airport. Conversely, the Open STAR is shown to be the most laterally inefficient because the aircraft is vectored along a non-direct route to the airport.
9
Variables
Since this proposed method is theoretical, it is of interest to further discuss how this proposed method should be used, when analysing real flights. To start, real flight data should be used, in the possession of the airline. This data will always be influenced by different meteorological conditions, aerodynamic deterioration, aero engine deterioration, etc., that will affect the true flight mission. This data has to be normalized with respect to a reference flight mission being influenced by the same variables, deviating from the baseline reference flight mission.
Conclusion
This study shows that there are very different ways of measuring energy efficiency in the latter part of a flight mission, which yield very different results, and carefulness has to be observed to measure the proper parameters. In the analysis a new parameter, Productive Energy Intensity, is proposed, which takes into account both the vertical and lateral inefficiencies of a flight mission. Three separate arrival procedures are analysed based on typical procedures in place at many European airports. The results show that it is of paramount importance to fly aircraft at best range speed along a well predefined trajectory with a high LF to obtain the best energy efficiency.
Acknowledgement
The authors wish to thank Professor Ulf Håll at Chalmers University, Richard Avellán at Volvo Aero and Bengt Moberg at Scandinavian Airlines System (SAS) for valuable support and technical help.
References
1. IPPC Special Reports On Climate Change, www.grida.no, cited in 2011.
2. A. H. Lefebvre, Gas Turbine Combustion, 2nd edition, Taylor & Francis Group, New York, 1999.
3. ICAO, Environmental Report 2007, www.icao.org, cited in 2011.
4. ACARE, European Aeronautics: A vision for
2020. January 2001. 5. Cleansky, www.cleansky.eu, cited in 2011. 6. SESAR, www.sesarju.eu, cited in 2011. 7. Ekstrand, H. et al., Minimizing Direct Operating
Costs (DOC) for a small European airline.
ISABE-2007-1105, 2007. 8. D. H. Rutherford, Options for assessing the CO2
intensity of commercial aircraft under an
airframe standard, International Council on Clean Transportation, 2009.
9. SESAR, Delivering green results-A summary of European AIRE projects results in 2009, www.sesarju.eu, 2010.
10. Boeing Flight Operations Engineering, Jet Fuel
Characteristics, May 2001. 11. Chevron, Alternative Jet Fuels,
www.chevronglobalaviation.com, 2006. 12. Air BP, Handbook of Product, www.bp.com,
2000. 13. Air Transport Action Group (ATAG), Fuel
consumption & alternative fuel, www.atag.org, cited in 2011.
14. Ekstrand, H. et al., Derated Climb Trajectories
for Subsonic Transport Aircraft and its Impact on
Aero Engine Maintenance Costs. ISABE-2009-1340, 2009.
15. Airbus, Eco-efficiency, www.airbus.com, cited in 2011.
16. Boeing, Commercial Airplanes and the Environment, www.boeing.com, cited in 2011. 17. LFV, Free Route Airspace Sweden (FRAS),
www.lfv.se, cited in 2011. 18. Nav Portugal, Free Route Airspace Within Lisbon
FIR/UIR (FRAL), www.nav.pt, cited in 2011. 19. Eurocontrol, Free Route Airspace Maastricht
(FRAM), www.eurocontrol.int, cited in 2011. 20. Transport Canada, Aircraft Fuel Reduction
Initiatives, Air Transat, www.tc.gc.ca, cited in 2011.
21. Novair, Corporate Responsibility, the
environment, www.novair.net, cited in 2011. 22. Association of European Airlines (AEA),
Research & Statistics, www.aea.be, citied in 2011.
23. European Low Fares Airline Association (ELFAA), Statistics, www.elfaa.com, cited in 2011.
24. J.J Lee, Can we accelerate the improvement of
energy efficiency in aircraft systems?, Energy Conversion and Management, Vol. 51, Page 189-196, 2010.
25. B Owen, Fuel Efficient Development and Prediction-Main Thematic Area: Climate Change, Manchester Metropolitan University, www.omega.mmu.ac.uk, 2008.
26. J.J Lee et al., Aircraft and Energy Use, Encyclopedia of Energy, Vol. 1, Page 29-38, 2004.
27. Department of Civil Aviation Malaysian, Aeronautical Information Circular (AIC) #10 2008, www.aip.dca.gov.my, 2008.
28. Directive 2008/101/EC of the European Parliament and of the Council of 19 November 2008 amending Directive 2003/87/EC so as to include aviation activities in the scheme for greenhouse gas emission allowance trading within

10
the Community, http://eur-lex.europa.eu, cited in April 2011.
29. ICAO, Continuous Descent Operations (CDO)
Manual, Document 9931, 2010. 30. Eurocontrol, Continuous Descent Approaches
Implementation Guidance Information, May 2008.
31. ICAO, Performance Based Navigation -
Introduction to PBN, www.paris.icao.int, presented at ATC Global, March 2010.

VINGA-Final Report Appendix 7

A CO2 versus noise trade-off study for the evaluation
of current air traffic departure procedures A case study at Gothenburg Landvetter Airport, Sweden
Deborah Mitchell
Department of Applied Mechanics
Chalmers University of Technology
Gothenburg, Sweden
Henrik Ekstrand
Flight Operations Department
Nova Airlines AB
Stockholm, Sweden
Abstract — This paper considers, for the first time, the
environmental effects of Air Traffic Management speed
constraints during the departure phase of flight. We present a
CO2 versus noise trade-off study that compares aircraft
departures subject to speed constraints with a Free Speed
scenario. A departure route at Gothenburg Landvetter Airport in
Sweden is used as a case study and the analysis is based on airline
flight recorded data extracted from the Airbus A321 aircraft.
Results suggest that CO2 emissions could be reduced by 180 kg
per flight for a high-density configuration A321 operating in the
upper region of the maximum operational take-off mass if
departure speed constraints were removed. This decrease in CO2
emissions is countered by an increase in the maximum
A-weighted noise exposure below 70 dB(A). The relevance of
these speed constraints is discussed and potential solutions for
removing them are presented.
Keywords-aviation; departures; environment; CO2; noise.
I. INTRODUCTION
The growing concern about CO2 emissions as a catalyst for
climate change has generated increased awareness about the
contribution from aviation. It is predicted that aviation is
responsible for 2-3% of all anthropogenic CO2 emissions [1].
The SESAR target for 2020 is to enable 10% fuel savings per
flight as a result of Air Traffic Management (ATM)
improvements alone, leading to a 10% reduction of CO2
emissions per flight [2].
The arrival and departure phases of flight have been
identified as key areas where substantial reductions in CO2
emissions could be enabled via improvements to existing ATM
procedures and regulations [3]. To date considerable effort has
been invested in designing more environmentally friendly
arrival procedures with the introduction of continuous descents
and Required Navigation Performance (RNP) curved
approaches [4]. For example, the SESAR VINGA project has
demonstrated up to 100 kg of fuel savings from improvements
to arrival procedures. In contrast, the departure phase has
received little attention.
The ATM procedures applied to aircraft during the
departure phase of flight are commonly based on
recommendations in the ICAO procedure design manual,
PANS-OPS, Document 8168 [5]. However, some of these
procedures are based on the performance characteristics of an
older generation of aircraft and may be penalising modern,
state-of-the-art aircraft, such as the Airbus A321. An example
of such a procedure is the turn-related speed constraint applied
to a Standard Instrument Departure route (SID) containing a
sharp turn in the low altitude region. The speed constraint is
recommended to ensure primary area containment within the
Controlled Airspace (CAS), as well as flyability of the nominal
track. The severity of the speed constraint is dependent upon
the track change of the turn, altitude, assumed meteorological
conditions, maximum allowed bank angle of the aircraft in the
design and flight technical tolerances. It is fair to say that the
total operational performance envelope of the aircraft is seldom
used, thus generating a situation where the full benefit of the
aircraft performance is not used.
The effect of applying speed constraints during the early
departure phase is to force the aircraft to climb in an unclean
aerodynamic configuration with flaps and slats extended instead
of accelerating to an optimum climb speed. This increases the
overall aerodynamic drag of the aircraft and thus the fuel
consumed and CO2 emitted during the departure phase. It is
thus desirable from an environmental perspective to minimise
the use of speed constraints.
Until recently, minimising the noise exposure to local
communities has been the primary environmental objective
when designing ATM departure procedures [6]. This has led to
the design of SIDs that create minimum noise disturbance, but
that are very fuel-inefficient.
An integral part of a paradigm shift in ATM must be to
assess the trade-off between anthropogenic CO2 emissions and
noise exposure for departure procedures. It is the aim of this
paper to evaluate these trade-offs and identify measures that are
able to reduce CO2 and other harmful emissions.
First SESAR Innovation Days, 29th November - 1st December 2011

This paper considers, for the first time, the effects of ATM
speed constraints on aircraft CO2 emissions during the
departure phase of flight. The analysis is based on real flight
data and uses the airframe manufacturer‟s software to compute
aircraft performance and noise emissions during the climb-out.
Five departure scenarios are considered based on real ATM
procedures, where different speed constraints are applied. The
trade-off between CO2 emissions and noise exposure associated
with each speed constraint is assessed. The TOPLA 1M SID
route at Gothenburg Landvetter Airport in Sweden has been
used as a case study.
II. DEPARTURE PROCEDURES AT GOTHENBURG
LANDVETTER AIRPORT
Gothenburg Landvetter (ICAO airport code ESGG) is a
medium size airport on the west coast of Sweden. It is the
second largest airport in Sweden (after Stockholm Arlanda) and
has an average of 220 movements per day. The airport has a
3300 m single runway, which may be operated as Runway 03
or 21 depending on the prevailing wind direction.
Several of the SIDs at ESGG have been designed with sharp
low-altitude turns either to avoid overflying noise-sensitive
areas or because the active runway direction is non-preferential
for the required route. These SIDs carry a speed constraint of
210 Knots Indicated Air Speed (KIAS), which is applied until
the aircraft has cleared the turn.
Figure 1. Published southern RNAV SIDs from Runway 03 at ESGG.
Copyright European Aeronautical Group (Navtech).
Fig. 1 shows the published southern SIDs for
Runway 03 [7] at ESGG for aircraft equipped with Area
Navigation (RNAV) capability. The TOPLA 1M SID shown is
an example of a SID carrying a turn-related speed constraint of
210 KIAS. The TOPLA 1M SID contains a straight segment for
2.1 NM followed by a sharp right turn of 87° and then a second
right turn past the waypoint GG403. A 210 KIAS speed
constraint applies until the aircraft has passed waypoint GG403
and is established on the 171° track; this is approximately
10 Nautical Miles (NM) from the start of take-off roll.
III. AIRCRAFT PERFORMANCE AND NOISE MODELLING
Aircraft flight data was provided by the Scandinavian
airline operator, Novair, for an Airbus A321-231 aircraft with
V2533-A5 engines that departed along the TOPLA 1M SID.
Data was extracted from the onboard Flight Data Recorder
(FDR). The flight data contained information about the
aircraft‟s position, altitude, speed, engine rotational speed, fuel
flow and flap settings, updated eight times per second for the
duration of the flight. In addition, Take-Off Data Calculation
(TODC) information was provided by the airline, which
contained information about the characteristic take-off
parameters and the meteorological conditions.
A sample flight was selected that departed on a typical
Scandinavian winter day with a mass in the upper region of the
Maximum Take-Off Mass (MTOM) for an A321. This flight is
considered to represent a worst case scenario with respect to
noise exposure for an A321 departing with TOGA thrust due to
the reduced climb rate achieved by a heavy-loaded aircraft.
The initial conditions for the sample flight are summarised in
Table I.
TABLE I. INITIAL CONDITIONS FOR SAMPLE NOVAIR A321 FLIGHT.
Take-off parameter Value
Take-off Mass 85 500 kg
Outside Air Temperature 0°C
Barometric Pressure
adjusted to sea level
pressure (QNH) 1008 mb
Aircraft rotate speed (VR) 168 KIAS
Aircraft initial safe climb
speed (V2) 175 KIAS
Thrust setting Take-Off Go-Around (TOGA)
Air conditioning Off
Engine Anti-Ice On
The Airbus Performance Engineer‟s Program (PEP) was
used for all aircraft simulations described in this study. The
PEP suite of software consists of several modules dedicated to
the computation of aircraft performance during different flight
phases. The performance calculations are based on Airbus
aircraft databases. The Operational Flight Path (OFP) tool
within PEP was used to simulate the flight described in
Table 1. OFP is designed to compute operational trajectories as
well as flight paths specifically designed for noise analysis. It
uses information about the aircraft take-off configuration (e.g.
2
First SESAR Innovation Days, 29th November - 1st December 2011

mass, flap and slat settings, thrust selected), environmental
conditions (wind, temperature, pressure and runway
conditions) and vertical climb profile as inputs. OFP also
allows the lateral path followed by the aircraft to be defined
(i.e. the SID layout), accounting for any turns in the track.
Fig. 2 shows the fit of the Airbus PEP model (blue line) to
the sample flight data (green line) for the entire climb phase.
The residuals plot beneath shows an average error of only
100 ft comparing the PEP model to the flight data. This
demonstrates the capability of the Airbus PEP software to
accurately replicate a real flight.
Figure 2. Airbus PEP model fit (blue line) to aircraft flight data (green line)
for sample Novair A321 climb profile.
Once a real flight has been modeled, it is possible to use the
PEP program to make deviations from the actual flight, for
example, change speed or altitude constraints applied and
assess the effect on the fuel consumption.
The Airbus Noise Level Calculation program (NLC) within
PEP was used to predict the noise exposure from the A321
aircraft for each departure procedure modelled. NLC was used
to calculate the aircraft noise emissions at specific points along
the departure trajectory and also calculate iso-level noise
contours.
The noise metric selected for the analysis was the
maximum instantaneous A-Weighted noise level, LAmax. This
is the noise in decibels weighted to the response of the human
ear. LAmax is the noise metric used by the Swedish
Environmental Agency as guidance for ATM procedure
development.
IV. SPEED CONSTRAINT SCENARIOS
The effect of varying and completely removing the
210 KIAS speed constraint along the TOPLA 1M SID was
investigated. The sample Novair A321 flight modeled with the
Airbus PEP program (described in Section III) was used as a
basis for the study.
Five scenarios were considered, each based on a real ATM
departure procedure where different levels of speed constraint
apply. Each scenario was applied to the PEP model of the
sample Novair A321 aircraft (Fig. 2). The five scenarios are
described below:
1. A speed constraint of 205 KIAS is applied to a
ground distance of 10 NM. The aircraft must
climb with flaps and slats extended until reaching
10 NM. This scenario simulates the speed
constraint used on the TROSA 4L SID at
Stockholm Arlanda Airport [8].
2. A speed constraint of 210 KIAS is applied to a
ground distance of 10 NM (speed constraint
applied on TOPLA 1M today). Due to the high
mass of the aircraft, it must climb with flaps and
slats extended until reaching 10 NM.
3. A speed constraint of 220 KIAS is applied to a
ground distance of 10 NM. The aircraft retracts
flaps at 210 KIAS, but must climb with slats
extended until reaching 10 NM. This scenario
simulates the speed constraint used on the
RESNA 4G SID at Stockholm Arlanda Airport
[9].
4. No turn-related speed constraint is applied. The
standard 250 KIAS speed constraint is applied
until the aircraft reaches Flight Level (FL) 100
(10,000 ft above Mean Sea Level). Due to the
mass of the aircraft, flaps and slats are retracted at
210 KIAS and 220 KIAS, respectively. This is the
standard departure procedure for a SID with no
additional turn-related speed constraints.
5. No speed constraints apply during the climb
phase, which simulates when a „Free Speed‟
instruction is granted by Air Traffic Control
(ATC). Free Speed removes the 250 KIAS speed
constraint below FL 100. Free Speed is regularly
granted by ATC at ESGG during quiet periods.
The aircraft accelerates to a climb speed of
304 KIAS, which is based on the selected Cost
Index of the mission, inserted in the aircraft Flight
Management Guidance System (FMGS).
3
First SESAR Innovation Days, 29th November - 1st December 2011
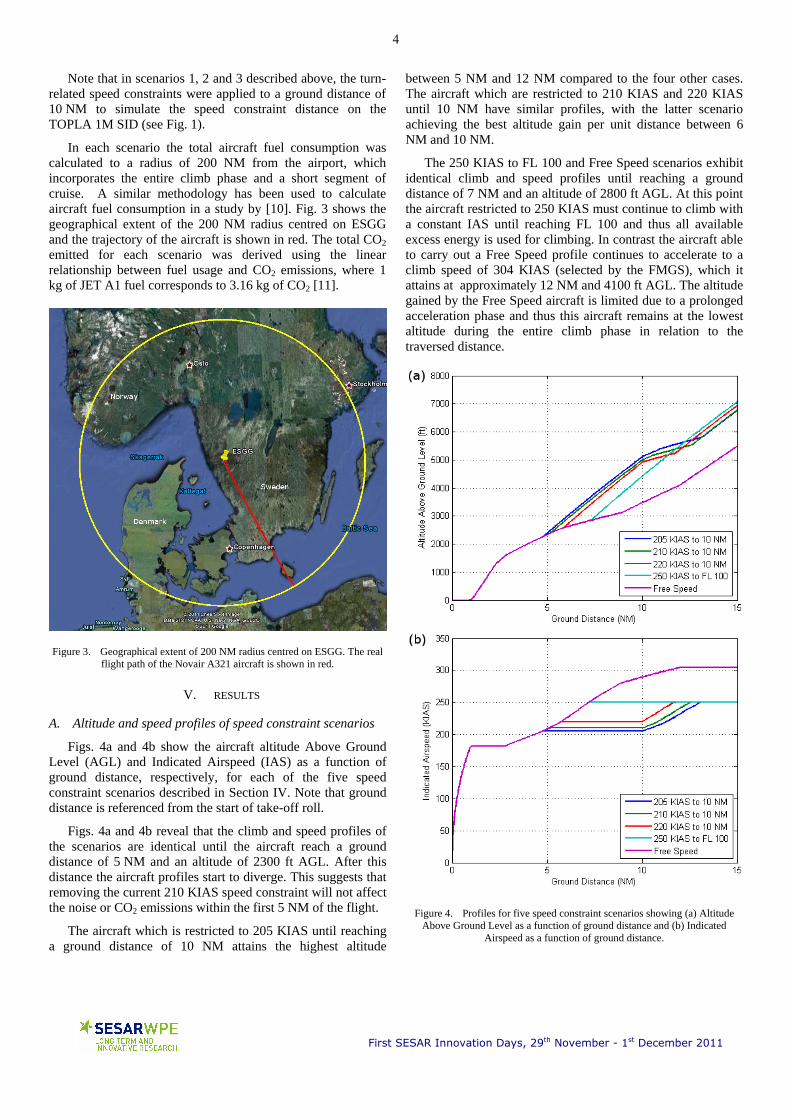
Note that in scenarios 1, 2 and 3 described above, the turn-
related speed constraints were applied to a ground distance of
10 NM to simulate the speed constraint distance on the
TOPLA 1M SID (see Fig. 1).
In each scenario the total aircraft fuel consumption was
calculated to a radius of 200 NM from the airport, which
incorporates the entire climb phase and a short segment of
cruise. A similar methodology has been used to calculate
aircraft fuel consumption in a study by [10]. Fig. 3 shows the
geographical extent of the 200 NM radius centred on ESGG
and the trajectory of the aircraft is shown in red. The total CO2
emitted for each scenario was derived using the linear
relationship between fuel usage and CO2 emissions, where 1
kg of JET A1 fuel corresponds to 3.16 kg of CO2 [11].
Figure 3. Geographical extent of 200 NM radius centred on ESGG. The real
flight path of the Novair A321 aircraft is shown in red.
V. RESULTS
A. Altitude and speed profiles of speed constraint scenarios
Figs. 4a and 4b show the aircraft altitude Above Ground
Level (AGL) and Indicated Airspeed (IAS) as a function of
ground distance, respectively, for each of the five speed
constraint scenarios described in Section IV. Note that ground
distance is referenced from the start of take-off roll.
Figs. 4a and 4b reveal that the climb and speed profiles of
the scenarios are identical until the aircraft reach a ground
distance of 5 NM and an altitude of 2300 ft AGL. After this
distance the aircraft profiles start to diverge. This suggests that
removing the current 210 KIAS speed constraint will not affect
the noise or CO2 emissions within the first 5 NM of the flight.
The aircraft which is restricted to 205 KIAS until reaching
a ground distance of 10 NM attains the highest altitude
between 5 NM and 12 NM compared to the four other cases.
The aircraft which are restricted to 210 KIAS and 220 KIAS
until 10 NM have similar profiles, with the latter scenario
achieving the best altitude gain per unit distance between 6
NM and 10 NM.
The 250 KIAS to FL 100 and Free Speed scenarios exhibit
identical climb and speed profiles until reaching a ground
distance of 7 NM and an altitude of 2800 ft AGL. At this point
the aircraft restricted to 250 KIAS must continue to climb with
a constant IAS until reaching FL 100 and thus all available
excess energy is used for climbing. In contrast the aircraft able
to carry out a Free Speed profile continues to accelerate to a
climb speed of 304 KIAS (selected by the FMGS), which it
attains at approximately 12 NM and 4100 ft AGL. The altitude
gained by the Free Speed aircraft is limited due to a prolonged
acceleration phase and thus this aircraft remains at the lowest
altitude during the entire climb phase in relation to the
traversed distance.
Figure 4. Profiles for five speed constraint scenarios showing (a) Altitude
Above Ground Level as a function of ground distance and (b) Indicated
Airspeed as a function of ground distance.
4
First SESAR Innovation Days, 29th November - 1st December 2011

B. Noise characteristics of speed constraint scenarios
Although the turn-related speed constraints described in
Section IV are not primarily used for noise abatement
purposes, the locations of the turns in the SIDs are typically
close to noise-sensitive areas. This means that any increase in
perceived noise from removing the speed constraints would
need to be well understood before departure procedures could
be changed.
Note that decibel scale is logarithmic, so that an increase of
3 dB(A) represents a doubling of sound intensity; however,
due to the human hearing response, an increase in sound
pressure level of 10 dB(A) will be perceived as a doubling of
„loudness‟. For reference, 60 dB(A) is the sound level of
conversational speech at a distance of 1 m and 70 dB(A) is the
sound level of traffic on a busy road at a distance of 25 m.
Fig. 5 shows the LAmax as a function of ground distance
for each of the five speed constraint scenarios described in
Section IV. The noise is calculated at a height of 1.2 m above
ground level directly under the track of the aircraft, in
accordance with ICAO international aircraft noise certification
standards [12].
Figure 5. Maximum A-Weighted Noise as a function of ground distance for
five speed constraint scenarios.
As expected from inspection of Figs. 4a and 4b, the noise
profiles for all five scenarios are identical until the aircraft
reach a ground distance of approximately 5 NM. Fig. 5 reveals
that, at ground distances greater than approximately 7 NM, the
aircraft following a Free Speed profile has the highest
associated LAmax. The higher LAmax values associated with
the Free Speed scenario can be explained by the climb profile
of the aircraft (Figure 4a); at ground distances greater than
9 NM, the aircraft is at least 1000 ft closer to the ground
compared with all other scenarios, thus producing the greatest
noise exposure.
The 205 KIAS and 210 KIAS to 10 NM speed constraint
scenarios exhibit very similar noise profiles with less than
1 dB(A) difference at any given distance. These scenarios have
the lowest associated LAmax directly under the flight path at
ground distances between 5 NM and 10 NM. The 250 KIAS to
FL 100 scenario has the lowest associated LAmax directly
under the flight path at ground distances between 11 NM and
15 NM.
Fig. 6 shows the LAmax directly under the flight path as a
function of altitude AGL for each speed constraint scenario. It
reveals that the noise curves for each speed constraint scenario
are almost identical. The aircraft noise produced is thus
directly dependent on altitude regardless of the speed profile of
the aircraft (if initial conditions are the same). For example, an
aircraft restricted to flying at 205 KIAS until a ground distance
of 10 NM produces approximately the same LAmax at 5000 ft
as an aircraft flying a Free Speed profile [~62 dB(A)].
Figure 6. Maximum A-Weighted Noise as a function of altitude for five
speed constraint scenarios.
Fig. 7 shows the LAmax noise contours along the
TOPLA 1M SID for the five speed constraint scenarios
described in Section IV. Contour levels are shown at 75 dB(A),
70 dB(A), 65 dB(A) and 60 dB(A). The SID centerline is
shown in red and the positions of the waypoints are marked.
Table II lists the surface area in km2 covered by the LAmax
noise contours for each speed constraint scenario.
TABLE II. SURFACE AREA CONTAINED BY LAMAX NOISE CONTOURS FOR
FIVE SPEED CONSTRAINT SCENARIOS.
Speed constraint
scenario
Surface area of LAmax noise contours (km2)
75 dB(A) 70 dB(A) 65 dB(A) 60 dB(A)
205 KIAS to 10 NM 7.09 14.86 31.90 74.93
210 KIAS to 10 NM 7.09 14.99 32.04 75.01
220 KIAS to 10 NM 7.09 15.36 34.16 74.27
250 KIAS to FL 100 7.09 15.09 35.49 73.08
Free Speed 7.09 15.08 42.47 93.31
5
First SESAR Innovation Days, 29th November - 1st December 2011

A comparison of the 75 dB(A) LAmax noise contours in
Fig. 7 and Table II reveals that the contour covers the same
surface area in each speed constraint scenario. Inspection of
Fig. 6 shows that the aircraft creates 75 dB(A) LAmax at
approximately 1800 ft AGL and Figure 4a reveals that this
altitude is reached before the climb profiles for the scenarios
diverge. Therefore, removing the existing 210 KIAS speed
constraint would not increase the geographical area subject to
an LAmax of 75 dB(A) if the rate of climb during the first
acceleration phase was in the order of 1000 ft per minute
(observed to be a typical climb rate from the airline data).
Changes to this rate of climb would of course change the
vertical climb profile and thus the noise distribution.
Comparison of the 70 dB(A) LAmax noise contours in
Fig. 7 reveal that they are very similar for each scenario and
Table II shows that there is only a 0.50 km2 difference in the
surface area.
Inspection of the 65 dB(A) LAmax noise contours in Fig. 7
and Table II reveals that the contour size increases for less
stringent speed constraints. Table II shows that there is a
10.57 km2 difference in the surface area between the Free
Speed and 205 KIAS to 10 NM scenarios at the 65 dB(A)
level. Fig. 5 shows that the aircraft generate 65 dB(A) LAmax
at approximately 4000 ft AGL; the aircraft restricted to
205 KIAS until 10 NM reaches this altitude at a ground
distance of 8 NM, whilst the aircraft following the Free Speed
profile does not reach 4000 ft AGL until 11 NM.
Comparison of the 60 dB(A) LAmax noise contours in
Fig. 7 reveals a different trend to that observed for the
65 dB(A) contour; the surface area covered by the noise
Figure 7. Geographical representation of the TOPLA 1M SID (shown in red with virtual waypoints indicated) with LAmax noise contours overlaid for five
speed constraint scenarios. Contours are at levels of 75 dB(A), 70 dB(A), 65 dB(A) and 60 dB(A).
6
First SESAR Innovation Days, 29th November - 1st December 2011
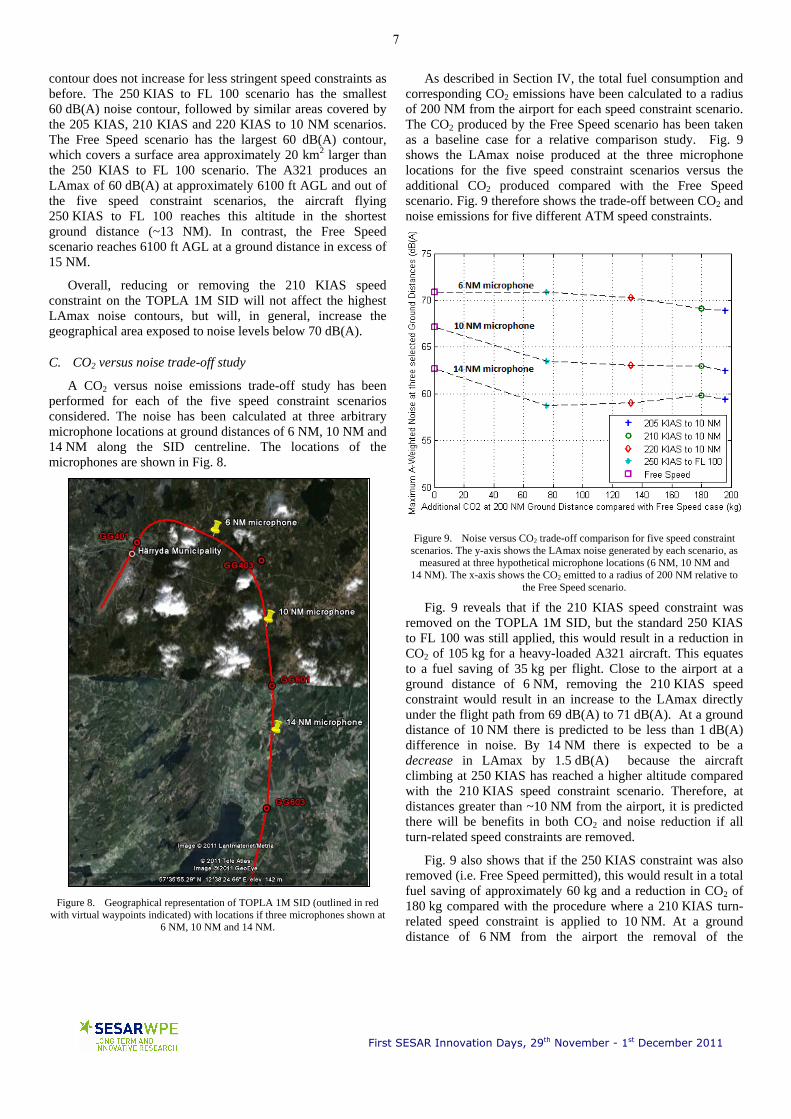
contour does not increase for less stringent speed constraints as
before. The 250 KIAS to FL 100 scenario has the smallest
60 dB(A) noise contour, followed by similar areas covered by
the 205 KIAS, 210 KIAS and 220 KIAS to 10 NM scenarios.
The Free Speed scenario has the largest 60 dB(A) contour,
which covers a surface area approximately 20 km2 larger than
the 250 KIAS to FL 100 scenario. The A321 produces an
LAmax of 60 dB(A) at approximately 6100 ft AGL and out of
the five speed constraint scenarios, the aircraft flying
250 KIAS to FL 100 reaches this altitude in the shortest
ground distance (~13 NM). In contrast, the Free Speed
scenario reaches 6100 ft AGL at a ground distance in excess of
15 NM.
Overall, reducing or removing the 210 KIAS speed
constraint on the TOPLA 1M SID will not affect the highest
LAmax noise contours, but will, in general, increase the
geographical area exposed to noise levels below 70 dB(A).
C. CO2 versus noise trade-off study
A CO2 versus noise emissions trade-off study has been
performed for each of the five speed constraint scenarios
considered. The noise has been calculated at three arbitrary
microphone locations at ground distances of 6 NM, 10 NM and
14 NM along the SID centreline. The locations of the
microphones are shown in Fig. 8.
Figure 8. Geographical representation of TOPLA 1M SID (outlined in red
with virtual waypoints indicated) with locations if three microphones shown at
6 NM, 10 NM and 14 NM.
As described in Section IV, the total fuel consumption and
corresponding CO2 emissions have been calculated to a radius
of 200 NM from the airport for each speed constraint scenario.
The CO2 produced by the Free Speed scenario has been taken
as a baseline case for a relative comparison study. Fig. 9
shows the LAmax noise produced at the three microphone
locations for the five speed constraint scenarios versus the
additional CO2 produced compared with the Free Speed
scenario. Fig. 9 therefore shows the trade-off between CO2 and
noise emissions for five different ATM speed constraints.
Figure 9. Noise versus CO2 trade-off comparison for five speed constraint
scenarios. The y-axis shows the LAmax noise generated by each scenario, as
measured at three hypothetical microphone locations (6 NM, 10 NM and
14 NM). The x-axis shows the CO2 emitted to a radius of 200 NM relative to
the Free Speed scenario.
Fig. 9 reveals that if the 210 KIAS speed constraint was
removed on the TOPLA 1M SID, but the standard 250 KIAS
to FL 100 was still applied, this would result in a reduction in
CO2 of 105 kg for a heavy-loaded A321 aircraft. This equates
to a fuel saving of 35 kg per flight. Close to the airport at a
ground distance of 6 NM, removing the 210 KIAS speed
constraint would result in an increase to the LAmax directly
under the flight path from 69 dB(A) to 71 dB(A). At a ground
distance of 10 NM there is predicted to be less than 1 dB(A)
difference in noise. By 14 NM there is expected to be a
decrease in LAmax by 1.5 dB(A) because the aircraft
climbing at 250 KIAS has reached a higher altitude compared
with the 210 KIAS speed constraint scenario. Therefore, at
distances greater than ~10 NM from the airport, it is predicted
there will be benefits in both CO2 and noise reduction if all
turn-related speed constraints are removed.
Fig. 9 also shows that if the 250 KIAS constraint was also
removed (i.e. Free Speed permitted), this would result in a total
fuel saving of approximately 60 kg and a reduction in CO2 of
180 kg compared with the procedure where a 210 KIAS turn-
related speed constraint is applied to 10 NM. At a ground
distance of 6 NM from the airport the removal of the
7
First SESAR Innovation Days, 29th November - 1st December 2011

250 KIAS speed constraint does not affect the LAmax noise;
however, at ground distances of 10 NM and 14 NM, an
increase in LAmax of approximately 4 dB(A) is predicted.
VI. POSSIBLE SOLUTIONS FOR THE REMOVAL OF DEPARTURE
SPEED CONSTRAINTS
The results presented in Section V clearly demonstrate the
potential environmental benefits of removing turn-related
speed constraints along SIDs. Using a heavy-loaded A321
departure along the TOPLA 1M SID at ESGG as a case study,
the results suggest that a 105 kg reduction in CO2 emissions
could be achieved if the 210 KIAS turn-related speed
constraint was removed from the SID. If we take a
conservative assumption that, on average, aircraft will reduce
CO2 emissions by 50% of that achieved by a heavy-loaded
A321 (i.e. ~50 kg per flight) then given that there are typically
3500 departures along the TOPLA 1M SID per year, this
would give a reduction in CO2 emissions by 175,000 kg per
year. Note that these benefits are in the order of those achieved
in the arrival phase when Constant Descent Operations are
being implemented
The environmental benefits are even greater from an air
pollution perspective if the 250 KIAS speed constraint applied
to FL 100 were to be removed; it is predicted that the amount
of CO2 emitted by a heavy-loaded A321 would be reduced by
180 kg per flight compared with the present day situation.
Naturally any discussion of removing existing speed
constraints must also consider the implications for noise
exposure on the ground and aircraft operational capabilities.
The results in Section V show that the reduction or removal of
speed constraints in the departure phase generally comes at a
cost of increased noise emissions below 70 dB(A). The
Swedish Environmental Agency uses an LAmax of 70 dB(A)
as a benchmark for classifying noise disturbance; aircraft are
legally required to remain within ±1 NM of a published SID
centreline until the LAmax perceived on the ground has
reduced below 70 dB(A). Therefore, it may be argued that
whilst the removal of speed constraints does increase noise
exposure, the increase is within an acceptable audible limit (i.e.
below 70 dB(A)).
The removal of turn-related speed constraints would
require either deviation from the current PANS-OPS guidance
based on a local safety validation case or an alternative
interpretation of the recommendations. Three different
solutions for how this might be achieved are stated below:
1. Use of statistical winds rather than worst-case tail
winds when designing the SID procedure. This
would not require any deviation from PANS-OPS;
2. Removal of turn-related speed constraints for
aircraft capable of banking at least 30° as PANS-
OPS guidance currently assumes a maximum bank
angle of 25°. The majority of modern commercial
aircraft can comfortably bank at 30°;
3. Demonstrate that modern aircraft equipped with
GNSS navigation can remain within the required
±1 NM from the SID centreline without the need
for turn-related speed constraints. This would be
facilitated by validation flights.
Although an additional substantial reduction in CO2 could
be achieved with the removal of the 250 KIAS speed limit to
FL 100, this would be more difficult to facilitate operationally
in high-density airspace as the speed limit is used by ATC for
aircraft separation purposes.
In conclusion, there are clearly significant environmental
benefits to be gained from the removal of SID speed
constraints, and this should be considered when developing
new environmentally friendly departure operations within the
framework of SESAR.
ACKNOWLEDGEMENTS
The authors would like to thank Airbus for comments and
use of their PEP program for this study, which allowed us to
undertake realistic aircraft performance simulations.
REFERENCES
[1] M. S. Ryerson and M. Hansen, “The potential of turboprops for reducing aviation fuel consumption”, Transport Research Part D: Transport and Environment, vol. 15, Issue 6, pp. 305 – 314, 2010.
[2] SESAR Joint Undertaking, 2010, “Environment & SESAR”, http://www.sesarju.eu/environment/sesar.
[3] Transportation Research Board, National Research Council, AC-RP 02-12, “Environmental optimization of aircraft departures: fuel Burn, emissions, and noise”, 2011.
[4] Y. Cao, T. Kotegawa, and J. Post, “Evaluation of continuous descent approach as a standard terminal airspace operation”, Ninth USA/Europe Air Traffic Management Research and Development Seminar (ATM2011), Berlin, Germany, 2011.
[5] ICAO PANS-OPS 8168, OPS/611, Procedures for air navigation services, Vol. I, Flight procedures, 2006.
[6] X. Prats, V. Puig, and J. Quevado, “A mult-objective optimization strategy for designing aircraft noise abatement procedures. Case study at Girona airport”, Transport Research Part D: Transport and Environment, vol. 16, pp. 31 – 41, 2011.
[7] Navtech EAG – esgg05daorg0, Sweden ESGG/GOT – SID RWY 03, RNAV DME/DME or GNSS, South, 30 – 5, 2009.
[8] LFV, Stockholm/Arlanda SID RWY 08 left turn, ESSA-4-47, Aeronautical Information Publications (AIP), 2011, http://www.lfv.se/AIP/AD/AD%202/ESSA/ES_AD_2_ESSA_4_47_en.pdf.
[9] LFV, Stockholm/Arlanda SID RWY 19R, ESSA-4-27, Aeronautical Information Publications (AIP), 2011, http://www.lfv.se/AIP/AD/AD%202/ESSA/ES_AD_2_ESSA_4_27_en.pdf.
[10] H. Ekstrand, U. Ziverts and D. Mitchell, “A new method for measuring energy intensity during commercial flight missions”, ISABE 2011, 20th ISABE Conference, ISABE-2011-1401, 2011.
[11] Air Transport Action Group (ATAG), “Fuel consumption & alternative fuel”, www.atag.org, 2011.
[12] ICAO, “Annex 16 to the convention on international civil aviation. Environmental protection”, Vol. 1, “Aircraft Noise”, Ed. 5, 2006.
8
First SESAR Innovation Days, 29th November - 1st December 2011

VINGA-Final Report Appendix 8

VINGA - a great step towards sustainable aviation


The VINGA project
We all want to fly, to have that freedom of mobility and efficiency we now take for granted. And we all, hopefully, want to avoid being part of the problem with environ-mental pollution. So, across the planet, intense initiatives are taking place within the aviation community, with one singular goal: to act responsibly and to reduce emis-sions and noise from air traffic.
The Vinga project is one of the most remarkable of these efforts. Centred on Göte-borg Landvetter Airport, east of Gothenburg, its aim is to optimize all phases of flight, on departing and arriving flights to the airport, and to explore new ways to conduct normal operation. The idea is that such new initiatives can significantly reduce emis-sions, noise pollution and fuel consumption and also shorten the time of the flight.
Vinga is a validation project, ending in the autumn of 2011.
Participating partners in Vinga are: Swedavia, Novair, Airbus, Quovadis and LFV. Vinga is powered by SESAR.
VINGA – A World’s First Green Tech Breakthrough
In the frame of Vinga, aircraft spend less time in the surface phase of the flight with the engines running. The Vinga flights take off, accelerate and climb with an optimum speed profile to its cruising altitude. After take off and before landing, the Vinga flights choose, in comparison with other flights, different trajectories to obtain flight path shortening and mitigate noise in congested areas. In the approach phase, the airplanes glide with minimum thrust the whole descent before landing. In order to do that, they need to follow specially designed, curved flight paths, were the planes are guided by a very precise satellite navigation system, RNP, compared to the other traffic that uses a ground based navigation system, ILS.
The ILS system is very suitable in low visibility conditions. In addi-tion, within the Vinga project, these two systems have been merged into one unique landing system – for the first time in the world. This is a major breakthrough, indicating that green flights can now be carried out independent of weather conditions.


SESAR is a research and development project launched by the European Com-mission and Eurocontrol, a trans-European organization aiming at making air traf-fic flow easier and more efficiently across the European sky. One of SESAR’s goals is to reduce environmental impact from air traffic.
SESAR is a strong force behind developing the Single European Sky, the objective is that all countries share a common airspace, thus allowing airplanes to fly along straighter routes to their destinations, which has an important environmental impact.
SESAR also drives several important projects around Europe, aiming at making each flight more environmentally friendly. Vinga is one of these projects. A main goal is to double the capacity of European airspace by 2020, reduce environmen-tal impact by 10 per cent and cut the costs for air navigation services by half. In measurable terms: by 2020 air traffic in Europe aims to save, compared with today, 8-14 minutes flight time, 300-500 kg of fuel and 948-1,575 kg of CO2, on average per flight.
SESAR – The Body Behind the Project


LFV is working actively and comprehensively on decreasing the ef-fects flights have on the environment. LFV embraces the concept of Green Flight comprising of three dimensions: green departures, direct routes and green approaches.
Green departure means aircraft have a shorter time on the taxiway with the engines on, awaiting the start phase. This is achieved through the
advanced time-management of flight operations. When the aircraft takes off, the ascent is conducted with the most ef-ficient speed, limiting noise pol-lution around the airport and quicker reaching cruising alti-tude where air resistance and fuel consumption are lower.
Direct flight routes were introduced in May 2010 in Swedish airspace for aircraft flying at an altitude above 8 500 metres. This affects approxi-mately 500 flights in every 24-hour period and, according to LFV’s cal-culations, will decrease carbon dioxide emissions by around 30 tonnes in that period within Swedish airspace.
Green approach involves an aircraft evenly gliding towards the airport from cruising altitude using minimum thrust. This decreases fuel con-sumption, emissions and noise.
Even if Green Flight is an established method for air navigation serv-ices in Sweden, LFV is continuing to decrease the effects on the envi-ronment. Project Vinga is one of these efforts.
LFV is a public enterprise with 1,350 employ-ees that operates air navigation services for civil and military customers at 35 locations in Sweden. We have sales surpassing SEK 2 bil-lion. LFV is one of Europe’s leading actors in air navigation services. Our solutions for even safer and more cost-effective air navigation are being noticed, and in the area of environment we are at the forefront to minimize environmen-tal impact..
LFV Group – Dedicated Promoter of Green Flights


In Swedavia’s overall environmental efforts in the continuing reduction of emissions of gases that affect the climate is a clear priority along with minimized use of energy and lean operations, cutting back emissions to soil and water. Swedavia handles chemicals responsibly and strives to replace chemicals harmful to the environment with less damaging.
In 2006, Swedavia was one of several Swedish enterprises that early on vowed to become climate neutral. A climate neutral business undertake to map its climate impacting emissions and implements measures re-
ducing them before compensating for the remaining emissions. Thus these companies carry out their operations without contributing to global climate changes. The UN is positive to the concept climate neutrality, providing it handles responsibly, meaning the companies reduces their own emissions before compensating.
Four of Swedavia’s airports are accredited and are climate-labeled according to the highest European standards. The Göteborg Land-vetter airport reached the highest level in 2010 since the airport is completely climate neutral regarding emissions from its own opera-tions. Remaining emissions are compensated for through economic contributions to projects in other countries, among others a wind power plant in China, tree planting in Costa Rica and bio-fuel based heating production in South Africa. This accreditation is backed by ACI Europe and the global analyst- and technology company WSP International.
Swedavia owns, operates and improves 11 airports in Sweden. Swedavia is a state-owned company with roughly 2,500 employees and revenue of SEK 4.5 billion. Since 2005, Swedavia has reduced its own net emissions of carbon dioxide with 37 percent and since 2003 with 60 percent. Being the first major Swedish company to have chosen to become climate-neutral, the goal is that emissions from Swedavia’s own operations will be zero by 2020, at the latest.
SWEDAVIA – Working Towards Climate Neutral Airports


For several years now, environmental issues have been a major focus for Novair, in accordance with Apollo and the other travel providers in Kuoni Scandinavia. Novair has a very modern aircraft fleet with state of the art engines from Airbus, a company dedicated to develop as environmentally friendly technology as possible. Novair makes green flights wherever possible. One single green landing can save up to 100 kg of fuel and reduce CO2-emissions with over 300 kg. Novair
is a pioneer in making green landings as part of their normal opera-tion. Green landings can be performed in a co-operation between the plane descending with engines on minimal thrust, the Air Navigation Service Provider and the airport, thus avoiding airplanes queuing be-fore landing.
In the Vinga project, Novair was the first airline in the world to land an aircraft using a unique combination of satellite and land based navi-gation technologies. This proves that there are no technical barriers to conduct green landings in a new way. Novair hopes that the learning’s from Vinga will contribute to a development of air traffic regulations so the EU as well as countries locally will support all advancements possible and make air traffic less detrimental to the environment. One example is co-ordinating regulations concerning the satellite and the land based navigation systems that now are separate and can only be aligned in validation activities, such as in the Vinga project.
Novair is a charter airline and a wholly owned subsidiary of the Swiss travel group Kuoni. The Scandinavian part of the group is called Kuoni Scandinavia and consists of Apollo in Sweden, Norway, Denmark and Finland and the airline Novair. The Swedish golf specialist Golf Plaisir, the luxury specialist Lime Travel and the Dan-ish tour operator Falk Lauritsen are also part of Kuoni Scandinavia.
NOVAIR – Pioneering Green Flights


ATM (Air Traffic Management) is of strategic importance to Airbus, both in our responsibility to best support our customers, and also to ensure the sustainable growth of the air transport business. Airbus is therefore at the forefront of the development in ATM. The collective challenges ahead in ATM are huge for the airlines, airports and the Air Navigation Service Providers (ANSPs). The deployment of new ATM technologies requires coordinated investments both on board the aircraft and also on the ground. As an aircraft ATM ”architect”, Airbus plays a key role in this coordinated process. In particular, Air-bus can leverage its ATM expertise to support ATM improvement and help its customers benefit from increased airspace capacity, greater operational efficiencies, and reduced aircraft emissions.
There is a recognised need for a regional and collaborative approach to ATM development. Major improvements need to be designed re-gionally, while local ATM know-how and infrastructure are harnessed
wherever possible for developing an optimised solution. In addition to planning 10 years ahead or more, Airbus already supports the up-take of known ”best practices”, as well as maximising the use of the available technologies -- in particular our on-board ATM capabilities, which bring immediate benefits for all our stakeholders.
Airbus is the leading aircraft manufacturer with the most modern and comprehensive family of airliners on the market, ranging in capacity from 100 to more than 500 seats. Airbus has sold over 10,000 aircraft and delivered over 6,600 since its first airliner entered service in 1974. Airbus aircraft share a unique cockpit and operational commonality, making opera-tions more efficient.
AIRBUS – At the Technological Forefront of ATM

Condensation trails in the air are increasing, which demands improved systems for air traffic control.

Quovadis offers the highest level of expertise in commercial aircraft operations and PBN. The staff at Quovadis comprises highly expe-rienced pilots, performance engineers, air traffic controllers, project managers and terrain analysts. Quovadis also has access to the best systems and simulators in the world to validate new procedures in any kind of aircraft.
Quovadis is a fully integrated Airbus subsidiary. This close and perma-nent relationship with the worldwide benchmark aircraft manufacturer ensures a full mastery of PBN solutions.
Prior to starting the validations flights, flyability analyses including simulator sessions have been organized by Quovadis with all relevant stakeholders at their headquarters in Toulouse.
Quovadis also supported Novair in their work with the Swedish regula-tor to obtain operational approval to fly the RNP-AR procedures in the frame of the Vinga project.
Taking advantages of the tight relationship between Quovadis and its parent company Airbus, acting as an ‘expert advisor’ to the VINGA project, it is ensured that all the relevant results from the trials will be injected into the SESAR development work especially where it con-cerns the “Work Package 9” (WP9) led by Airbus (specifically 9.01 Airbone initial 4D Trajectory Management, 9.09 RNP transition to xLS.)
Quovadis, is wholly owned by Airbus. It is a Flight Operations Services company, dedicated to Per-formance Based Navigation (PBN) consulting. Quovadis provides a full range of services to safely improve operations, efficiency, aircraft utilization optimization, environmental performance, access to challenging airports and airspace capacity. Airbus launched Quovadis as a natural step to support the PBN initiative customers whether they have Airbus aircraft or others.
QUOVADIS – Tests New Navigation Concepts in Vinga

VINGA - a collaboration between:
VINGA